Embed Size (px)
Citation preview
Feder al R eserve Bank of San Fr ancisco2 0 05 Annu a l Re por t – Gateway to Asia
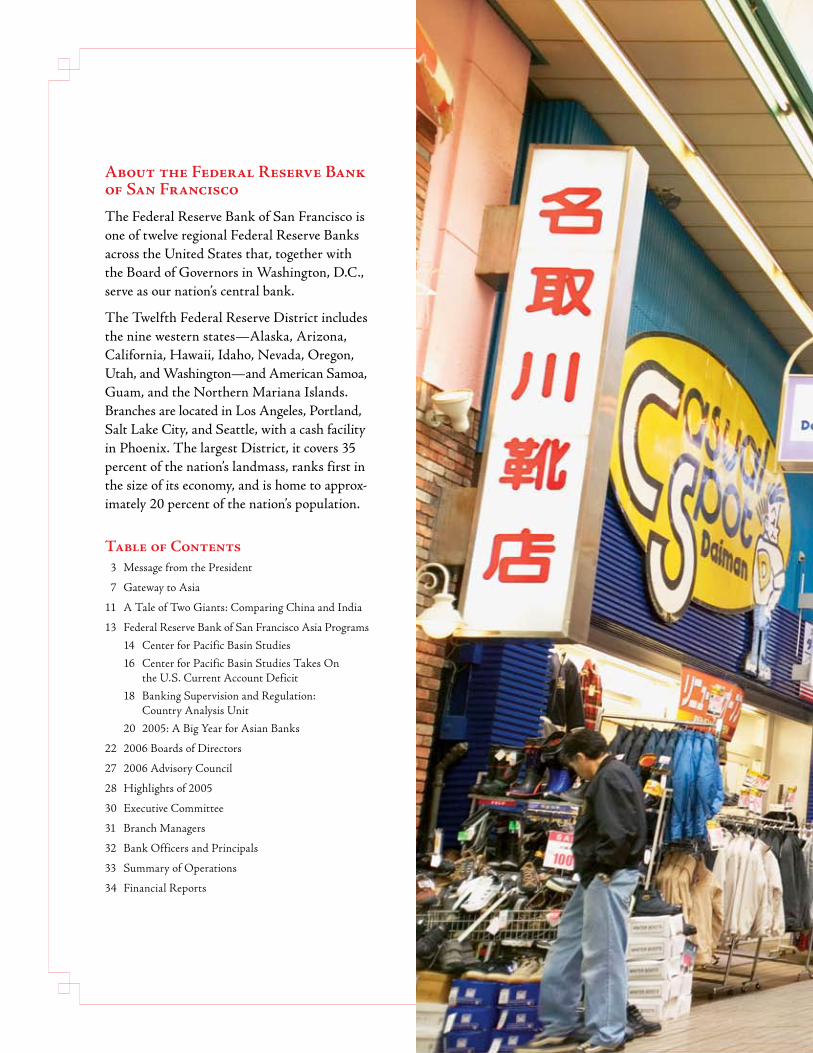
Table of Contents 3 Message from the President
7 Gateway to Asia
11 A Tale of Two Giants: Comparing China and India
13 Federal Reserve Bank of San Francisco Asia Programs
14 Center for Pacific Basin Studies
16 Center for Pacific Basin Studies Takes On the U.S. Current Account Deficit
18 Banking Supervision and Regulation: Country Analysis Unit
20 2005: A Big Year for Asian Banks
22 2006 Boards of Directors
27 2006 Advisory Council
28 Highlights of 2005
30 Executive Committee
31 Branch Managers
32 Bank Officers and Principals
33 Summary of Operations
34 Financial Reports
About the Federal Reserve Bank of San Francisco
The Federal Reserve Bank of San Francisco is one of twelve regional Federal Reserve Banks across the United States that, together with the Board of Governors in Washington, D.C., serve as our nation’s central bank.
The Twelfth Federal Reserve District includes the nine western states—Alaska, Arizona, California, Hawaii, Idaho, Nevada, Oregon, Utah, and Washington—and American Samoa, Guam, and the Northern Mariana Islands. Branches are located in Los Angeles, Portland, Salt Lake City, and Seattle, with a cash facility in Phoenix. The largest District, it covers 35 percent of the nation’s landmass, ranks first in the size of its economy, and is home to approx-imately 20 percent of the nation’s population.

Federal Reserve Bank of San Francisco
2
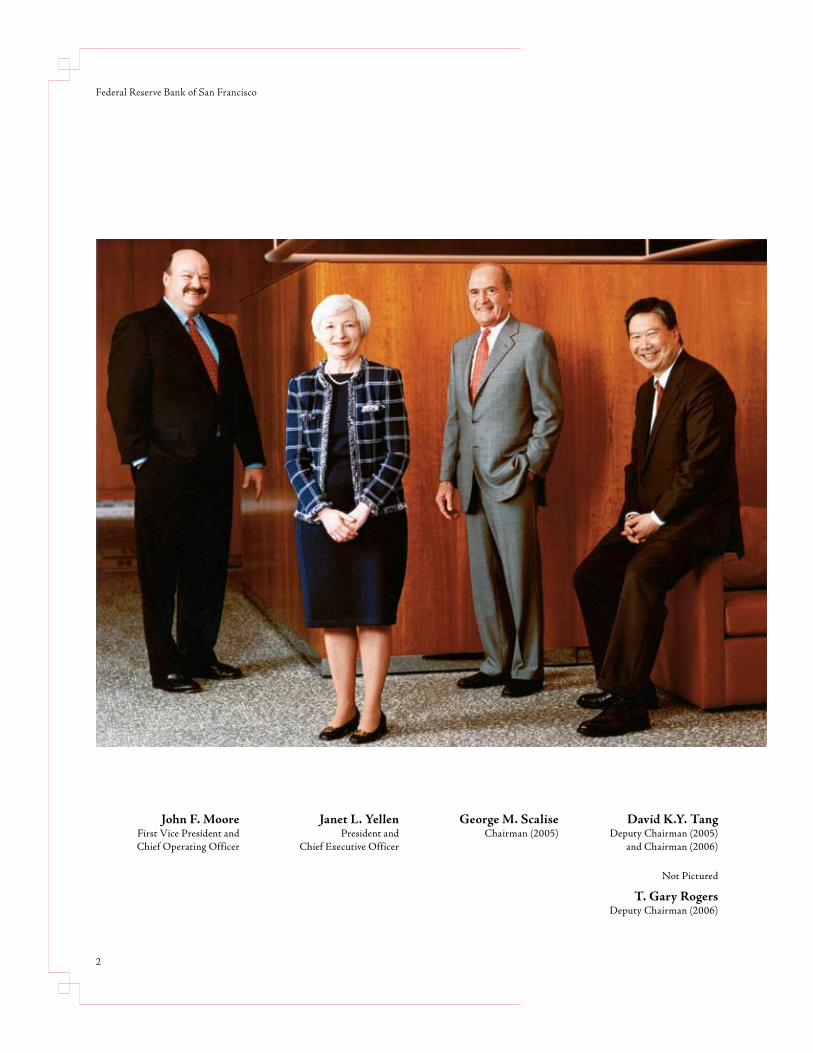
John F. MooreFirst Vice President and Chief Operating Officer
Janet L. YellenPresident and
Chief Executive Officer
George M. ScaliseChairman (2005)
David K.Y. TangDeputy Chairman (2005)
and Chairman (2006)
Not Pictured
T. Gary RogersDeputy Chairman (2006)
3
This year’s report looks at Asia and the special connection our District and Reserve Bank have with that part of the world. This is fitting on a number of levels. Most obviously, the global economy increasingly is being shaped by developments in Asia, especially by the rise of China and India, which has captured the world’s attention. Because of its location, the Twelfth District serves as America’s gateway to Asia, creating strong economic ties and giving us a broad perspective on the region. This important international arena has been a strategic focus for the San Francisco Reserve Bank for many years. Knowledge of the region is critical to understanding trends affecting the Twelfth District and the global economy, as well as the implications for monetary policy and our banking supervision responsibilities.
To advance our commitment to understanding issues, our Bank has two long-established programs devoted to Asia: the Center for Pacific Basin Studies in Economic Research and the Country Analysis Unit in the Banking Supervision area. This report features a series of essays authored by experts from these programs. The first essay provides an overview of current developments in Asia and examines the Twelfth District’s economic and banking ties with our Pacific Rim neighbors. The second essay compares the rise of China and India and the challenges they face. Subsequent essays delve into the strategic roles of our
own Asia programs and spotlight their areas of expertise with articles covering research related to a series of conferences on the U.S. current account deficit and Asian banking developments in 2005.
Following a long tradition, each year I make at least one trip to Asia. In 2005, I traveled with Federal Reserve Governor Donald Kohn to India, spending time in Mumbai, New Delhi, and Bangalore, which has been called India’s “Silicon Valley.” We met with senior government and central bank officials, bankers, representatives of U.S. and Indian businesses, academics, and experts from multilateral institutions. These yearly trips advance our broad objective to serve as a repository of expertise on Asia-related economic, banking, and financial issues.
Turning to the operations side of our organization, 2005 was a year of change, challenge, and achievement. The environment in which the Federal Reserve conducts its activities has changed significantly in recent years in response to evolutions in the financial services industry. In 2005, local and national initiatives continued to require workforce restructuring. After processing checks since opening almost 90 years ago, our Salt Lake City and Portland Branches consolidated their processing operations to Denver and Seattle, respectively. In other major transitions, Seattle-Portland check processing moved to leased space and cash operations at the Portland Branch relocated to the Seattle Branch.
In the midst of these transitions, we had numerous achievements. The Portland Branch was selected as one of the Federal Reserve’s five check adjustments sites, and our Cash Product Office coordinated the
Message from the President
Federal Reserve’s national response to Hurricane Katrina to restore cash services to impacted areas. These and other milestones are chronicled in the Highlights of 2005 section in this report.
I recognize that numerous transitions in 2005 had a significant personal toll for employees, especially for those who were displaced after many years of service. Despite the challenges, they worked with commitment and professionalism. I would like to take this opportunity to acknowledge their dedication and service, as well as the ongoing commitment and contributions of other employees to our organization.
I also would like to extend our thanks and appreciation to our Twelfth District directors for their invaluable counsel during 2005. The directors’ independent assessment of economic and financial conditions throughout our nine western states is critical to the formulation of monetary policy.
In particular, I want to acknowledge the many contributions to the Bank and to the Federal Reserve System of retiring Chairman of the Board George M. Scalise, president, Semiconductor Industry Association, San Jose, California. Mr. Scalise completed six years of service to this Reserve Bank, the last two and one-half years serving as its chairman, preceded by two and one-half years as its deputy chairman. In 2005, Mr. Scalise also served as the chairman of the Federal Reserve System’s Conference of Chairmen.
In addition, I would like to express my sincere thanks and appreciation to the other directors and advisory council members who concluded their terms of service during 2005:
• on the San Francisco Board: Richard C. Hartnack, who was vice chairman, Union Bank of California, N.A., Los Angeles, California, at the time of his service on our board;
• on the Los Angeles Branch Board: Sister Diane Donoghue, executive director, Esperanza Community Housing Corporation, Los Angeles, California;
• on the Portland Branch Board: Judi A. Johansen, president and chief executive officer, PacifiCorp, Portland, Oregon; and George J. Passadore, Oregon Region chairman, (retired), Wells Fargo Bank, Portland, Oregon;
• on the Salt Lake City Branch Board: H. Roger Boyer, chairman, The Boyer Company, Salt Lake City, Utah, who served as chairman of the Salt Lake City Branch Board the last five years;
• on the Seattle Branch Board: Mary E. Pugh, president, Pugh Capital Management, Inc., Seattle, Washington; and
• on the Twelfth District Advisory Council: Don M. “Duff ” Willey, president, Willey Automotive Group, Bountiful, Utah, who served as chairman of the council the last three years, preceded by three years as its vice chairman; Barbara Bry, chief operating officer, Blackbird Ventures, La Jolla, California; and Paul Ecke, III, president, Paul Ecke Ranch, Encinitas, California.
Janet L. YellenPresident and Chief Executive Officer
Federal Reserve Bank of San Francisco
4


05
10152025303540
0
5
10
15
20
25
30
35
40Share of World GDP at Purchasing Power ParityPercent
Source: International Monetary Fund, World Economic Outlook Database’86 ’87 ’88 ’89 ’90 ’91 ’92 ’93 ’94 ’95 ’96 ’97 ’98 ’99 ’00 ’01 ’02 ’03 ’04 ’05E ’06E
Total Asia
United States
China
Japan
India
Gateway to AsiaThe global economy is increasingly shaped
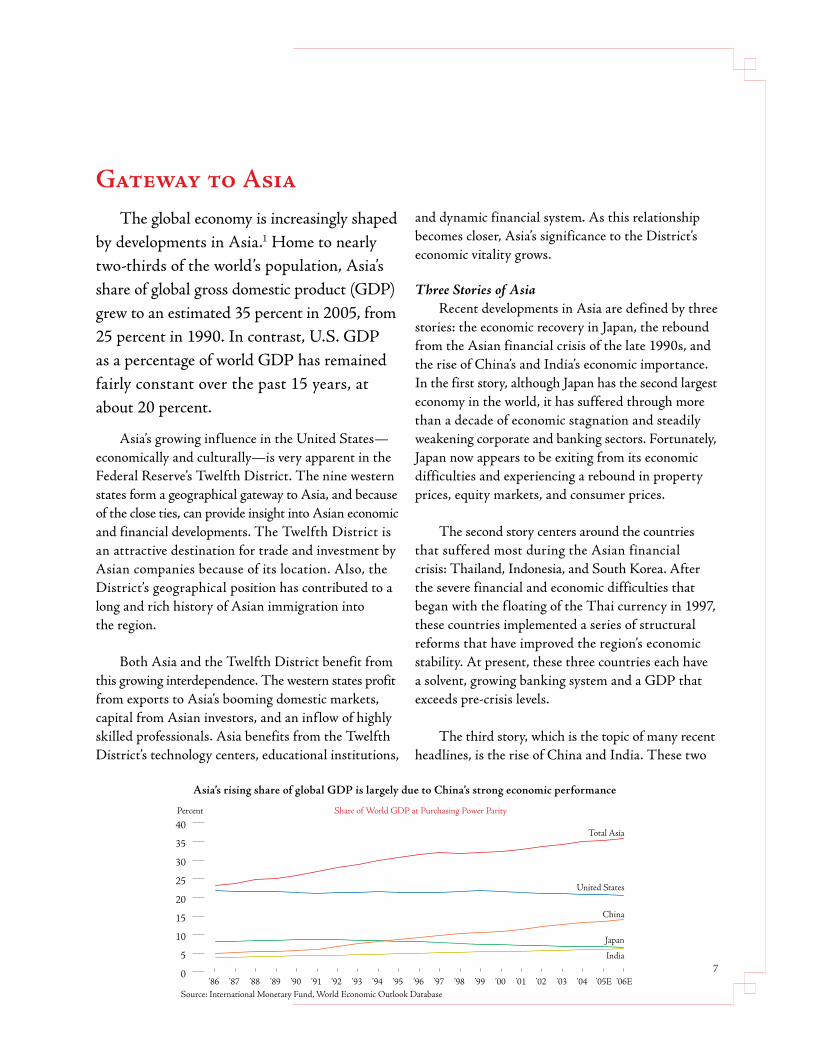
by developments in Asia.1 Home to nearly two-thirds of the world’s population, Asia’s share of global gross domestic product (GDP) grew to an estimated 35 percent in 2005, from 25 percent in 1990. In contrast, U.S. GDP as a percentage of world GDP has remained fairly constant over the past 15 years, at about 20 percent.
Asia’s growing influence in the United States—economically and culturally—is very apparent in the Federal Reserve’s Twelfth District. The nine western states form a geographical gateway to Asia, and because of the close ties, can provide insight into Asian economic and financial developments. The Twelfth District is an attractive destination for trade and investment by Asian companies because of its location. Also, the District’s geographical position has contributed to a long and rich history of Asian immigration into the region.
Both Asia and the Twelfth District benefit from this growing interdependence. The western states profit from exports to Asia’s booming domestic markets, capital from Asian investors, and an inflow of highly skilled professionals. Asia benefits from the Twelfth District’s technology centers, educational institutions,
and dynamic financial system. As this relationship becomes closer, Asia’s significance to the District’s economic vitality grows.
Three Stories of Asia Recent developments in Asia are defined by three
stories: the economic recovery in Japan, the rebound from the Asian financial crisis of the late 1990s, and the rise of China’s and India’s economic importance. In the first story, although Japan has the second largest economy in the world, it has suffered through more than a decade of economic stagnation and steadily weakening corporate and banking sectors. Fortunately, Japan now appears to be exiting from its economic difficulties and experiencing a rebound in property prices, equity markets, and consumer prices.
The second story centers around the countries that suffered most during the Asian financial crisis: Thailand, Indonesia, and South Korea. After the severe financial and economic difficulties that began with the f loating of the Thai currency in 1997, these countries implemented a series of structural reforms that have improved the region’s economic stability. At present, these three countries each have a solvent, growing banking system and a GDP that exceeds pre-crisis levels.
The third story, which is the topic of many recent headlines, is the rise of China and India. These two
7
Asia’s rising share of global GDP is largely due to China’s strong economic performance
Federal Reserve Bank of San Francisco
countries, with a combined population of 2.3 billion, have exhibited dramatic growth, mainly due to a well-educated, plentiful workforce and a low-cost wage structure. China and India have captured the world’s attention with their rapid economic growth rates, burgeoning populations, and significant impacts on global trade. Many analysts predict that, as these two economies continue to grow, they will eventually overtake the economies of Europe and the United States. One study projects that China’s economy will surpass the economies of Japan and the United States by the middle of the twenty-first century, while India will overtake the major European economies within the next 20 years.2 However, the dominance of China and India is by no means assured; both countries face significant socioeconomic hurdles that could derail their progress.
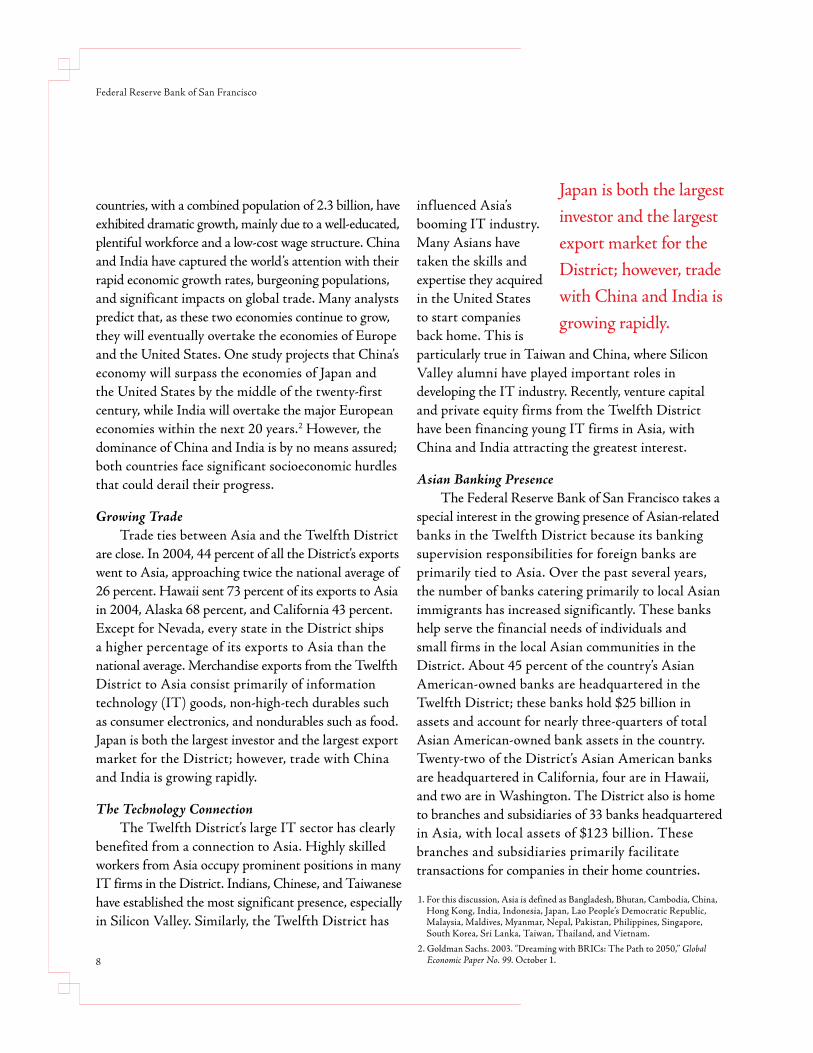
Growing TradeTrade ties between Asia and the Twelfth District
are close. In 2004, 44 percent of all the District’s exports went to Asia, approaching twice the national average of 26 percent. Hawaii sent 73 percent of its exports to Asia in 2004, Alaska 68 percent, and California 43 percent. Except for Nevada, every state in the District ships a higher percentage of its exports to Asia than the national average. Merchandise exports from the Twelfth District to Asia consist primarily of information technology (IT) goods, non-high-tech durables such as consumer electronics, and nondurables such as food. Japan is both the largest investor and the largest export market for the District; however, trade with China and India is growing rapidly.
The Technology ConnectionThe Twelfth District’s large IT sector has clearly
benefited from a connection to Asia. Highly skilled workers from Asia occupy prominent positions in many IT firms in the District. Indians, Chinese, and Taiwanese have established the most significant presence, especially in Silicon Valley. Similarly, the Twelfth District has
influenced Asia’s booming IT industry. Many Asians have taken the skills and expertise they acquired in the United States to start companies back home. This is particularly true in Taiwan and China, where Silicon Valley alumni have played important roles in developing the IT industry. Recently, venture capital and private equity firms from the Twelfth District have been financing young IT firms in Asia, with China and India attracting the greatest interest.
Asian Banking Presence The Federal Reserve Bank of San Francisco takes a
special interest in the growing presence of Asian-related banks in the Twelfth District because its banking supervision responsibilities for foreign banks are primarily tied to Asia. Over the past several years, the number of banks catering primarily to local Asian immigrants has increased significantly. These banks help serve the financial needs of individuals and small firms in the local Asian communities in the District. About 45 percent of the country’s Asian American-owned banks are headquartered in the Twelfth District; these banks hold $25 billion in assets and account for nearly three-quarters of total Asian American-owned bank assets in the country. Twenty-two of the District’s Asian American banks are headquartered in California, four are in Hawaii, and two are in Washington. The District also is home to branches and subsidiaries of 33 banks headquartered in Asia, with local assets of $123 billion. These branches and subsidiaries primarily facilitate transactions for companies in their home countries.
Japan is both the largest investor and the largest export market for the District; however, trade with China and India is growing rapidly.
8
1. For this discussion, Asia is defined as Bangladesh, Bhutan, Cambodia, China, Hong Kong, India, Indonesia, Japan, Lao People’s Democratic Republic, Malaysia, Maldives, Myanmar, Nepal, Pakistan, Philippines, Singapore, South Korea, Sri Lanka, Taiwan, Thailand, and Vietnam.
2. Goldman Sachs. 2003. “Dreaming with BRICs: The Path to 2050,” Global Economic Paper No. 99. October 1.
Gateway to Asia
9
44% 24% 23% 9% 36% 26% 23% 15%
2004 Merchandise Exports: Twelfth District
Sources: U.S. Department of Commerce: Tradestats Express; FRBSF
2004 Merchandise Exports: United States
Asia North America
Europe Other North America
Asia Europe Other
0 20 40 60 80 100 0 20 40 60 80 100
Merchandise exports from the Twelfth District to Asia approached twice the national average in 2004
1. Carl Dahlman and Anuja Utz. 2005. “India and the Knowledge Economy: Leveraging Strengths and Opportunities.” Knowledge for Development Program, World Bank Institute. April.
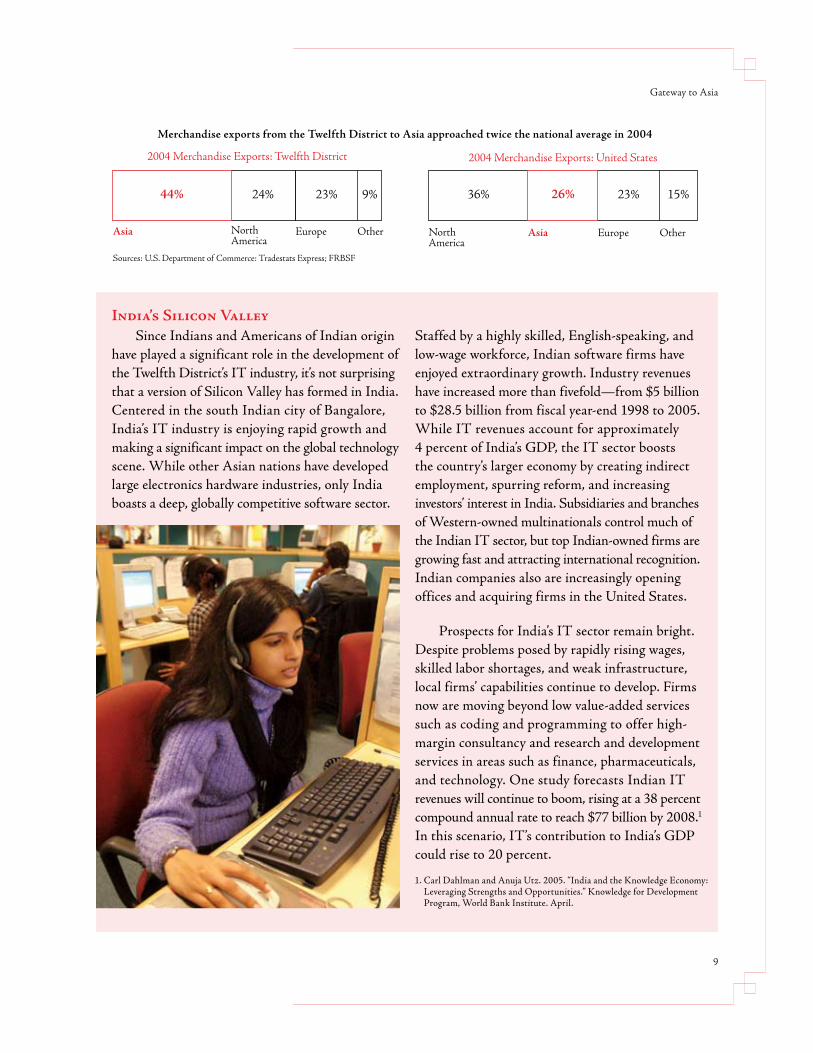
Since Indians and Americans of Indian origin have played a significant role in the development of the Twelfth District’s IT industry, it’s not surprising that a version of Silicon Valley has formed in India. Centered in the south Indian city of Bangalore, India’s IT industry is enjoying rapid growth and making a significant impact on the global technology scene. While other Asian nations have developed large electronics hardware industries, only India boasts a deep, globally competitive software sector.
Staffed by a highly skilled, English-speaking, and low-wage workforce, Indian software firms have enjoyed extraordinary growth. Industry revenues have increased more than fivefold—from $5 billion to $28.5 billion from fiscal year-end 1998 to 2005. While IT revenues account for approximately 4 percent of India’s GDP, the IT sector boosts the country’s larger economy by creating indirect employment, spurring reform, and increasing investors’ interest in India. Subsidiaries and branches of Western-owned multinationals control much of the Indian IT sector, but top Indian-owned firms are growing fast and attracting international recognition. Indian companies also are increasingly opening offices and acquiring firms in the United States.
Prospects for India’s IT sector remain bright. Despite problems posed by rapidly rising wages, skilled labor shortages, and weak infrastructure, local firms’ capabilities continue to develop. Firms now are moving beyond low value-added services such as coding and programming to offer high-margin consultancy and research and development services in areas such as finance, pharmaceuticals, and technology. One study forecasts Indian IT revenues will continue to boom, rising at a 38 percent compound annual rate to reach $77 billion by 2008.1 In this scenario, IT’s contribution to India’s GDP could rise to 20 percent.
India’s Silicon Valley
1. Carl Dahlman and Anuja Utz. 2005. “India and the Knowledge Economy: Leveraging Strengths and Opportunities.” Knowledge for Development Program, World Bank Institute. April.

A Tale of Two Giants: Comparing China and IndiaAccounting for 40 percent of the world’s
population and almost 20 percent of the world’s output, China and India are two of Asia’s—indeed, the world’s—economic giants. In addition to their size, these countries have other traits in common. Both are among the fastest-growing economies in the world, and both are transitioning from heavily state-controlled and regulated economies to more market-based economic systems.
Although both countries are experiencing rapid economic transformations, there are significant differences in the ascent of each region. China’s reforms started some 25 years ago in response to the failures of Maoist economic policies. Since then, its economy has recorded a phenomenal average annual growth rate of better than 9 percent. India’s reforms began in 1991, triggered by a fiscal budget and balance of payments crisis. Its average annual growth rate over that period has been closer to 6 percent. The sources of this difference in growth performance may be found in some key differences between the two countries. For example, China’s higher rate of saving has enabled domestic investment of 35 to 40 percent of its GDP, while India’s investment rate is about half that.
China and India have taken different paths to economic growth and development. China’s growth strategy, like that of its East Asian neighbors, has involved the expansion of labor-intensive manufacturing,
such as textiles and consumer goods, to take advantage of an abundant supply of labor. India’s emphasis on protecting workers and small-scale businesses has paradoxically limited the scale of growth of its manufacturing sector. Consequently, the relatively less-regulated service sector has been the growth engine of India’s economy. The service sector now accounts for over 50 percent of India’s output, much higher than the norm for developing economies. India’s most visible example of success is the information technology sector; it has burgeoned because of economic reforms and because of the country’s abundance of English-language speakers, strong technical education system, and professional talent with programming and managerial experience.
In terms of global trade, China is a much bigger player—its exports and imports of goods amount to about 50 percent of its GDP, compared to around 20 to 30 percent for India. China has experienced huge foreign direct investment inflows. Until recently, India has been much less interested in attracting foreign capital and therefore, less successful. China spends substantially more on infrastructure than India. China’s public finances are in better shape than India’s finances: India’s consolidated fiscal deficit is running at 8 to 9 percent of GDP, one of the highest among developing countries, against less than 3 percent in China. Compared to India, China’s labor market has been much more flexible. Labor can move easily from the agricultural sector to the industrial sector, which allows Chinese manufacturers to keep labor costs low. China’s overall education level is higher than that of India, with a much higher literacy rate
11
Federal Reserve Bank of San Francisco
and a larger percentage of children completing primary school. That said, India has a world-class university system that produces a core of well-educated professionals.
China doesn’t have the edge in everything. India has a more developed legal system, including
more protection of intellectual property rights. India’s financial system also is in better shape than China’s system.
Although both countries have been hampered by the involvement of state-owned banks in directed lending, nonperforming loans are a much smaller problem in India. India’s bond and equity markets also are much more efficient.
What challenges do China and India face? Each country is seeking to find the right balance of political and economic liberalization to fulfill long-run growth possibilities. Since 1979, China has followed a “full steam ahead” process of economic reform that has emphasized growth, even at the risk of major social upheavals. The country is simultaneously trying to manage the transition from a one-party state to a more popular and responsive political regime that many believe is necessary to deal with China’s increasingly sophisticated economy and society. Compared to China, India has followed a more cautious and gradual reform process. India’s current coalition government, led by the Indian National Congress Party, is attempting to perform a difficult balancing act of maintaining the progress of economic reform while keeping its promise to reduce the grinding poverty that still aff licts the majority of its population. To close the gap with China, India must address infrastructure problems and make its labor markets more flexible.
Each country is seeking to find the right balance of political and economic liberalization to fulfill long-run growth possibilities.
12
Federal Reserve Bank of San Francisco Asia Programs
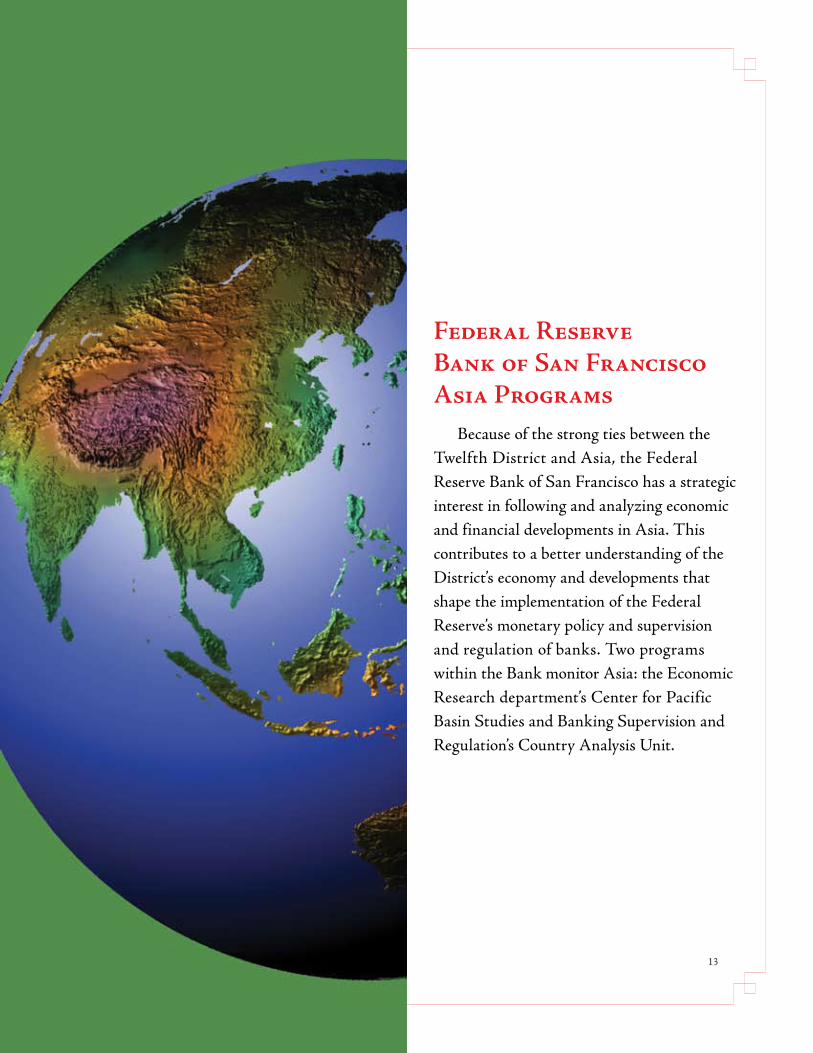
Because of the strong ties between the Twelfth District and Asia, the Federal Reserve Bank of San Francisco has a strategic interest in following and analyzing economic and financial developments in Asia. This contributes to a better understanding of the District’s economy and developments that shape the implementation of the Federal Reserve’s monetary policy and supervision and regulation of banks. Two programs within the Bank monitor Asia: the Economic Research department’s Center for Pacific Basin Studies and Banking Supervision and Regulation’s Country Analysis Unit.
13
Federal Reserve Bank of San Francisco
The Center for Pacific Basin Studies was established within the Federal Reserve Bank of San Francisco’s Economic Research department in 1990; it is the oldest such regional research center in the Federal Reserve System. Its origins date back to 1974, when the Bank initiated its Pacific Basin Program to concentrate on economic issues related to this important international region with close ties to the Twelfth District. The center’s mission is to promote cooperation among central banks in the region and enhance public understanding of major Pacific Basin monetary and economic policy issues. The center’s staff members conduct basic research and support the Bank’s president in the conduct of policy by providing briefings on international economic conditions.
In addition to providing policy support and conducting scholarly conferences in 2005, the center pursued a number of other activities. These included the annual Senior Policymaker Seminar, which the center organizes jointly with the World Bank for leading policymakers from emerging nations in the Pacific Basin and beyond. The center also maintained an extensive visiting scholar program, bringing in economists from the San Francisco Bay Area and other regions to work on Pacific Basin policy issues. In 2006, the center will inaugurate an “Asian visiting scholar” program, aimed at bringing in top visiting scholars from Asia to conduct Pacific Basin research at the Federal Reserve Bank of San Francisco. Information about the center and its research can be found at www.frbsf.org/economics/pbc/index.html.
Center for Pacific Basin Studies
14
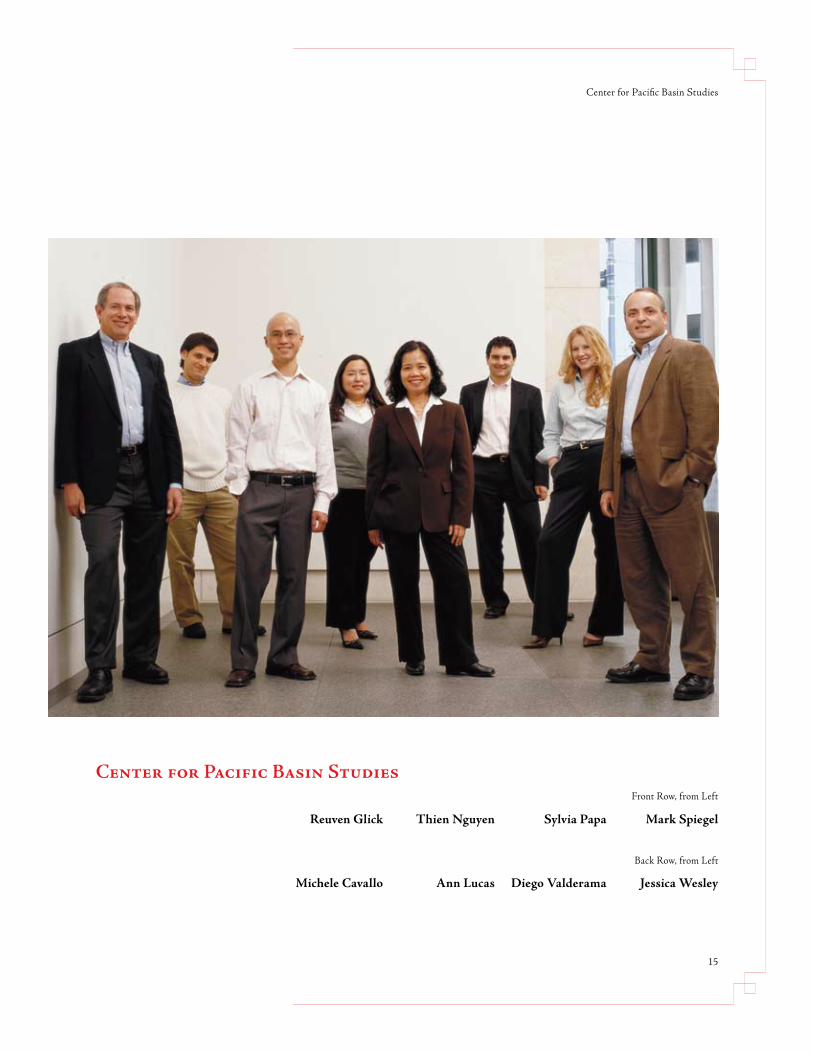
Center for Pacific Basin Studies
Center for Pacific Basin Studies
Reuven Glick
Michele Cavallo
Thien Nguyen
Ann Lucas
Sylvia Papa
Diego Valderama
Mark Spiegel
Jessica Wesley
15
Front Row, from Left
Back Row, from Left
The U.S. current account balance, which reflects its balance on trade in goods and services, investment income, and unilateral transfers, has deteriorated significantly over the last 15 years. In 1991, it was in surplus. Since then, the current account balance has swelled to a deficit that in 2005 equaled more than 6 percent of GDP, the highest such ratio in at least 40 years. In 2005, the Center for Pacific Basin Studies took on the controversial issue of the large and growing U.S. current account deficit in two scholarly conferences. Exploring this topic was of particular interest both because of its implications for the U.S. economy and because of the important role Asia plays in it, as the United States has traditionally run a large bilateral current account deficit with countries in that region. For example, the bilateral trade deficit with Asia in 2004 accounted for roughly 44 percent of the overall U.S. trade deficit.
In the past, other countries faced worsening borrowing terms, in the form of either reduced borrowing opportunities or increased interest charges, when their current account deficit reached around 5 percent of GDP. By that standard, some would argue that the United States is overdue for such adjustments, which may be accompanied by a fall in the value of the dollar.
This position has been contested by a group of economists who argue that the current pattern is caused by unique conditions, and that continued large U.S. trade deficits need not necessarily lead to a large dollar devaluation. Instead, they envision an environment where the large U.S. current account deficit can continue to be financed by an accumulation of dollar reserves by foreign governments, particularly those in Asia, where a number of national governments have accumulated large stocks of U.S. Treasuries. These economists assert
Center for Pacific Basin Studies Takes On the U.S. Current Account Deficit
Federal Reserve Bank of San Francisco
16
that Asian nations will be willing to accumulate ever-increasing stocks of U.S. assets to maintain export growth in an informal arrangement that mirrors the Bretton Woods system of fixed exchange rates that prevailed internationally in the mid-twentieth century.
Two of the leading proponents of this argument, Michael Dooley of U.C. Santa Cruz and Peter Garber of Deutsche Bank, presented their viewpoints at a symposium sponsored by the Center for Pacific Basin Studies and U.C. Berkeley’s Clausen Center for International Business and Policy entitled, “Revived Bretton Woods System: A New Paradigm for Asian Development?” in February 2005. The symposium provided an opportunity for Dooley and Garber to discuss these issues with other experts in the field, a number of whom contended that the U.S. current account deficit is unsustainable for an extended period.1
The question of the U.S. current account deficit was revisited in the Center for Pacific Basin Studies annual conference, “External Imbalances and Adjustment in the Pacific Basin,” held in September 2005. The conference included a number of scholarly papers examining the U.S. current account deficit and its implications for the U.S. economy going forward, with special attention placed on the prominent role of Asian nations in both the trade and financial issues associated with the large U.S. external imbalances. In one paper, Maurice Obstfeld of U.C. Berkeley and Kenneth Rogoff of Harvard University argued that a major devaluation of the dollar would be required to bring the U.S. current account into balance. In another, Hélène Rey of Princeton University and Pierre-Olivier
Gourinchas of U.C. Berkeley argued that the United States would accumulate capital gains in its net international investment position as a result of dollar devaluation, which would mitigate the magnitude of devaluation necessary to achieve current account balance. Other papers also considered issues raised by the continued U.S. current account deficits.2
Going forward, the Center for Pacific Basin Studies will continue to serve as an international resource for research on issues relevant to the Pacific Basin, even potentially controversial topics, such as the role of Asian nations in the U.S. current account deficit. Such topics are crucial to the center’s long-standing mission of promoting the understanding of major monetary and economic policy issues in the region.
These economists assert that Asian nations will be willing to accumulate ever-increasing stocks of U.S. assets to maintain export growth in an informal arrangement that mirrors the Bretton Woods system of fixed exchange rates that prevailed internationally in the mid-twentieth century.
U.S. Current Account Deficit
17
1. For the symposium agenda and copies of papers presented, see www.frbsf.org/economics/conferences/0502/index.html.
2. For the conference agenda and copies of papers presented, see www.frbsf.org/economics/conferences/0509/agenda.pdf.
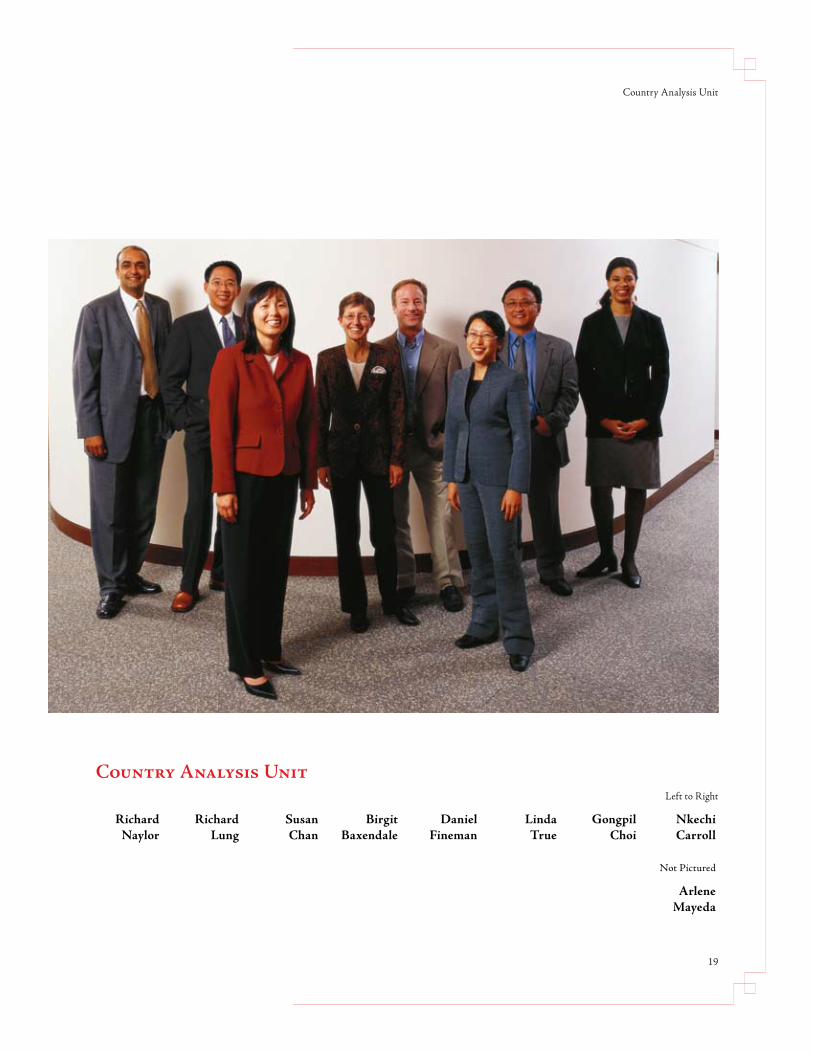
The Banking Supervision and Regulation department’s Country Analysis Unit closely analyzes Asian financial sector developments to support the Reserve Bank’s oversight of the U.S. branches and subsidiaries of 22 Asian banks. Because conditions in home markets can affect these banks’ abilities to support their U.S. operations, Reserve Bank staff monitor not only the financial strength of Asian parent banks, but also the quality of Asian bank regulatory systems and the potential impact of broader economic, political, and social trends.
Although much of this research is used internally for supervisory purposes, the unit conducts some activities to benefit the public, in recognition of the
tremendous interest in Asian economic and financial developments. The unit’s staff deliver presentations to local conferences, and the unit sponsors a speaker series—“The Asia Financial Forum”—that allows local bankers, businesspeople, and regulators to meet specialists outside of the Federal Reserve who focus on Asia. In addition, the unit’s Asia Focus publication offers concise analyses of selected issues of importance to Asian banks. In 2005, Asia Focus examined consumer finance in Japan, foreign investment in Chinese banks, bank reforms in India, and China’s housing market. Past and current issues of Asia Focus can be found at www.frbsf.org/publications/banking.
Banking Supervision and Regulation: Country Analysis Unit
Federal Reserve Bank of San Francisco
18
Country Analysis Unit
19
Country Analysis Unit
Richard Naylor
Richard Lung
Susan Chan
Birgit Baxendale
Daniel Fineman
Linda True
Gongpil Choi
Nkechi Carroll
Not Pictured
Arlene Mayeda
Left to Right
This past year saw momentous changes in Asia’s banking sector. In China, there was an unprecedented number of investments in local banks by foreign firms. In India, the state-dominated financial sector recognized the potential of the country’s vast middle class and sparked a consumer credit expansion. In Japan, seven years of contracting credit ended as bank loans finally started expanding. Across the region, 2005 also will be remembered for the enthusiasm of the consumer, with retail banking driving growth broadly across many Asian banking sectors.
China Gold RushChina’s banking sector saw the most dramatic
developments in the region. Before last year, Chinese banks attracted relatively little international attention. The government had been trying to find foreign buyers for minority stakes in the so-called Big Four state-owned commercial banks,1 but global banks showed little interest given the high risk of purchasing noncontrolling shares in highly troubled lenders.
In 2005, foreign banks began to acquire sizeable stakes in large Chinese banks as a more favorable regulatory environment took hold and investors increasingly recognized the potential of the Chinese banking market. In June, Bank of America agreed to pay $3 billion for 9 percent of the third-largest lender, China Construction Bank, and in August, Royal Bank of Scotland struck a deal to buy 10 percent of second-ranked Bank of China for $3 billion. Over the summer, Goldman Sachs and other investors began negotiations to take a 10 percent stake in top lender Industrial and Commercial Bank of China. The consortium eventually agreed to pay $3.8 billion.
Encouraged by the successful sale of large strategic stakes, two of the top five mainland banks successfully listed in Hong Kong. In June, China’s
fifth-largest bank, the Bank of Communications, launched a $2 billion initial public offering (IPO) on the Hong Kong stock market, and in October, China Construction Bank conducted one of the ten largest IPOs in world history for over $9 billion. By then, foreigners had struck deals worth $16.5 billion for buying stakes in Chinese banks, or close to 95 percent of the market value of all five mainland banks listed at the end of 2004.
The share sales are of great importance for both the buyers and the sellers. On the Chinese side, the capital injections are shoring up weak balance sheets and providing the funds for future growth. More importantly, buyers are expected to provide the technical expertise to improve lending practices, risk management, and corporate governance. For foreign banks, the acquisitions provide access to the fast-growing Chinese banking market and with it, Chinese consumers. Residential mortgage lending to individual households has grown by over 30 percent in each of the past two years, but represented a relatively low 12 percent of China’s GDP as of year-end 2004. There is potential for further growth in this area as per capita income in China rises.
India’s EmergenceA rapid increase in bank lending has paralleled
India’s emergence as a regional economic power. Traditionally, Indian banks have kept 40 percent or more of their total assets in low-risk government bonds and lent relatively little, largely to well-connected corporate borrowers. Over the past year, some Indian banks began shifting their preferences for both bonds and corporate lending. India’s large middle class is experiencing rapid income growth as the economy expands, and banks are looking to tap that underserved market. Total credit growth reached 33 percent by the middle of 2005, with consumer lending growing
2005: A Big Year for Asian Banks
Federal Reserve Bank of San Francisco
20
especially rapidly. Outstanding credit card receivables increased an estimated 49 percent in the fiscal year to March 2005, and mortgages, car lending, and personal loans grew as well. Although the pace of lending has raised asset quality concerns, India’s consumer lending market looks set for continued strong growth.
Japan’s RevivalAs Japan’s economy rebounded from recession in
2005, its banks also recovered from a decade of poor performance. After several years of writing off bad loans from the real estate and stock market bubbles of the 1980s, a number of banks finally started lending again. In August 2005, the banking system achieved positive year-on-year lending growth for the first month since early 1999. In the late 1990s, the government provided banks tens of billions of dollars in capital injections. Bolstered by stronger balance sheets and rising profitability, the banks now are repaying those public funds. If the trends of the past year continue, banks could reemerge as an engine of economic growth and help Japan’s revival deepen and mature.
The Rise of Retail BankingThroughout Asia, banks in 2005 increased their
focus on consumer lending and retail banking. In part, the trend arose from a reaction to the years preceding the financial crisis when banks lent excessively to corporate customers and neglected individual consumers. But the shift also highlights the growing maturity and sophistication of the region’s financial institutions. Asian banks face challenges in realigning lending practices and risk management systems with the new retail emphasis, but the best growth opportunities clearly lie with the Asian consumer, and increased consumer lending should help lead to more sustainable and better balanced economic growth.
Big Year for Asian Banks
21
1. China’s Big Four banks are the Agricultural Bank of China, the Bank of China, China Construction Bank, and the Industrial and Commercial Bank of China, which together held 53 percent of total Chinese banking assets as of December 2005.

Karla S. Chambers Vice President and Co-OwnerStahlbush Island Farms, Inc.Corvallis, Oregon
Richard W. Decker, Jr. Chairman and Co-FounderBelvedere Capital Partners LLCSan Francisco, California
Jack McNallyPrincipalJKM ConsultingSacramento, California
Charles H. Smith President and Chief Executive Officer AT&T WestSan Ramon, California
Candace H. Wiest PresidentInland Empire National BankRiverside, California
Kenneth P. Wilcox President and Chief Executive Officer Silicon Valley BankSanta Clara, California
Barbara L. Wilson Consultant and Regional Vice President (Retired) Qwest CorporationBoise, Idaho
Richard M. KovacevichChairman, President, and Chief Executive OfficerWells Fargo & CompanySan Francisco, California
David K.Y. Tang PartnerPreston Gates & Ellis LLPSeattle, Washington
T. Gary Rogers Chairman and Chief Executive Officer Dreyer’s Grand Ice Cream Holdings, Inc.Oakland, California
Board of DirectorsSan Francisco Headquarters (as of January 1, 2006)
Boards of directors of the Reserve Banks and Branches provide the Federal Reserve System with a wealth of information on economic conditions in every corner of the nation. This information, along with other sources, is used by the Federal Open Market Committee and the Board of Governors when reaching decisions about monetary policy.
Federal Reserve Bank of San Francisco
22
Chairman of the Board and Federal Reserve Agent Deputy Chairman
Federal Advisory Council Member

Board of DirectorsLos Angeles Branch (as of January 1, 2006)
2006 Board of Directors
23
James L. Sanford Corporate Vice President and TreasurerNorthrop Grumman CorporationLos Angeles, California
Karen B. Caplan President and Chief Executive OfficerFrieda’s, Inc.Los Alamitos, California
Dominic Ng Chairman, President, and Chief Executive OfficerEast West BankSan Marino, California
Anita Santiago PresidentAnita Santiago AdvertisingLos Angeles, California
Ann E. Sewill Vice President and California DirectorEnterprise Community PartnersLos Angeles, California
Peter M. Thomas Managing DirectorThomas & Mack Co.Las Vegas, Nevada
D. Linn Wiley President and Chief Executive OfficerCitizens Business BankOntario, California
Chairman of the Board

Federal Reserve Bank of San Francisco
24
Board of DirectorsPortland Branch (as of January 1, 2006)
Chairman of the Board
James H. RuddChief Executive Officer and PrincipalFerguson Wellman Capital Management, Inc.Portland, Oregon
David Y. Chen PartnerOVP Venture PartnersPortland, Oregon
Alan V. Johnson Regional PresidentWells Fargo BankPortland, Oregon
Peter O. Kohler PresidentOregon Health and Science UniversityPortland, Oregon
George J. Puentes PresidentDon Pancho Authentic Mexican Foods, Inc.Salem, Oregon
Robert D. Sznewajs President and Chief Executive OfficerWest Coast BancorpLake Oswego, Oregon
William D. Thorndike, Jr. PresidentMedford FabricationMedford, Oregon

2006 Board of Directors
25
Board of DirectorsSalt Lake City Branch (as of January 1, 2006)
William C. Glynn PresidentIntermountain Industries, Inc.Boise, Idaho
A. Scott Anderson President and Chief Executive OfficerZions First National BankSalt Lake City, Utah
Gary L. Crocker Chairman of the BoardMerrimack PharmaceuticalsSalt Lake City, Utah
Annette K. Herman Vice President, Strategic Initiatives Uniprise UnitedHealth GroupSalt Lake City, Utah
Clark D. Ivory Chief Executive OfficerIvory Homes, Ltd.Salt Lake City, Utah
Michael M. Mooney President and Chief Executive OfficerFarmers & Merchants State BankBoise, Idaho
Deborah B. Nielsen President and Chief Executive OfficerUnited Way of Salt LakeSalt Lake City, Utah
Chairman of the Board

Federal Reserve Bank of San Francisco
26
Board of DirectorsSeattle Branch (as of January 1, 2006)
Chairman of the Board
Mic R. Dinsmore Chief Executive OfficerPort of SeattleSeattle, Washington
James R. Gill PresidentPacific Northwest Title Holding CompanySeattle, Washington
Kenneth M. Kirkpatrick President, Washington StateU.S. BankSeattle, Washington
Blake W. Nordstrom PresidentNordstrom, Inc.Seattle, Washington
H. Stewart Parker President and Chief Executive OfficerTargeted Genetics CorporationSeattle, Washington
Helvi K. Sandvik PresidentNANA Development Corp.Anchorage, Alaska
David W. Wyckoff Chairman and Chief Executive OfficerWyckoff Farms, Inc.Grandview, Washington

(as of January 1, 2006)
2006 Board of Directors
27
Thomas E. ClevelandChairman and Chief Executive OfficerAccess Business FinanceBellevue, Washington
Stephen M. BrophyPresidentPage Land & Cattle CompanyPhoenix, Arizona
Roberto E. BarraganPresidentValley Economic Development Center, Inc.Van Nuys, California
Grace Evans CherashorePresident and Chief Executive OfficerEvans HotelsSan Diego, California
Manuel Cunha, Jr.PresidentNisei Farmers LeagueFresno, California
Jack Gleason ComPlan Advisors LLCScottsdale, Arizona
Cathy LukePresidentLoyalty Enterprises, Ltd.Honolulu, Hawaii
Roderick C. WendtPresident and Chief Executive OfficerJELD-WEN, inc.Klamath Falls, Oregon
Chairman Vice Chairman
Twelfth District Advisory Council
First Quarter
• Board of Governors approves proposal to expedite consolidation of Portland Branch Cash Services to the Seattle Branch at year-end 2005.
• Economic Research holds annual “Fiscal and Monetary Policy” macro conference.
Federal Reserve Bank of San Francisco
28
Highlights of 2005
Second Quarter
• As part of the Federal Reserve’s Check Restructuring Initiative, Salt Lake City Branch Check Processing consolidates to the Denver Branch—after processing checks at the Branch since 1918.
• Cash Product Office announces phase one cash infrastructure changes to continue cash processing at the Salt Lake City Branch and to convert to contracted cash depots in Portland, Oregon, Birmingham, Alabama, and Oklahoma City, Oklahoma.
Third Quarter
• Seattle Branch Check Processing moves to leased facility to maximize cost savings and workflow efficiencies related to the fourth quarter consolidation of Portland Branch Check Processing to the Seattle Branch.
• Portland Branch selected as one of the Federal Reserve’s five national Regional Check Adjustments sites.
2005 Highlights
Fourth Quarter
• Seattle Branch holds groundbreaking ceremony at the site of the new Seattle Branch building, slated to open in the fourth quarter 2007 in Renton, Washington.
• Cash Product Office coordinates Federal Reserve’s national response to Hurricane Katrina to reestablish cash services to the hurricane-affected areas.
• Public Information releases the video-based curriculum, Open & Operating: The Federal Reserve Responds to September 11, to high schools nationwide.
Third Quarter (continued)
29
• Portland Branch Check Processing consolidates to the Seattle Branch check processing facility, after processing checks at the Branch since 1917.
• The Center for the Study of Innovation and Productivity in Economic Research holds “Productivity Growth: Causes and Consequences” conference.
• New cash depot facility opens in Portland with the consolidation of Portland Cash Services to the Seattle Branch.
• Twelfth District Check Processing is first in productivity ranking among all Federal Reserve check processing offices in 2005.
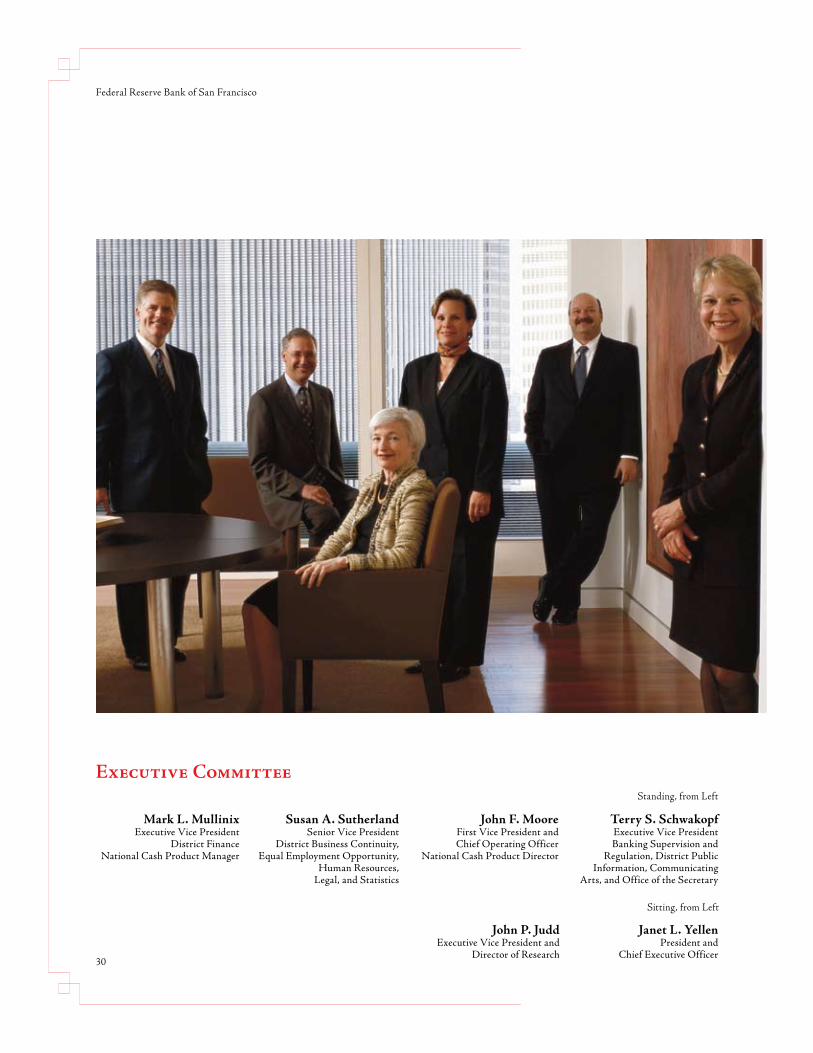
Executive Committee
Mark L. MullinixExecutive Vice President
District FinanceNational Cash Product Manager
Susan A. SutherlandSenior Vice President
District Business Continuity, Equal Employment Opportunity,
Human Resources, Legal, and Statistics
John F. MooreFirst Vice President and Chief Operating Officer
National Cash Product Director
Terry S. SchwakopfExecutive Vice President Banking Supervision and
Regulation, District Public Information, Communicating
Arts, and Office of the Secretary
30
Federal Reserve Bank of San Francisco
Standing, from Left
John P. JuddExecutive Vice President and
Director of Research
Janet L. YellenPresident and
Chief Executive Officer
Sitting, from Left
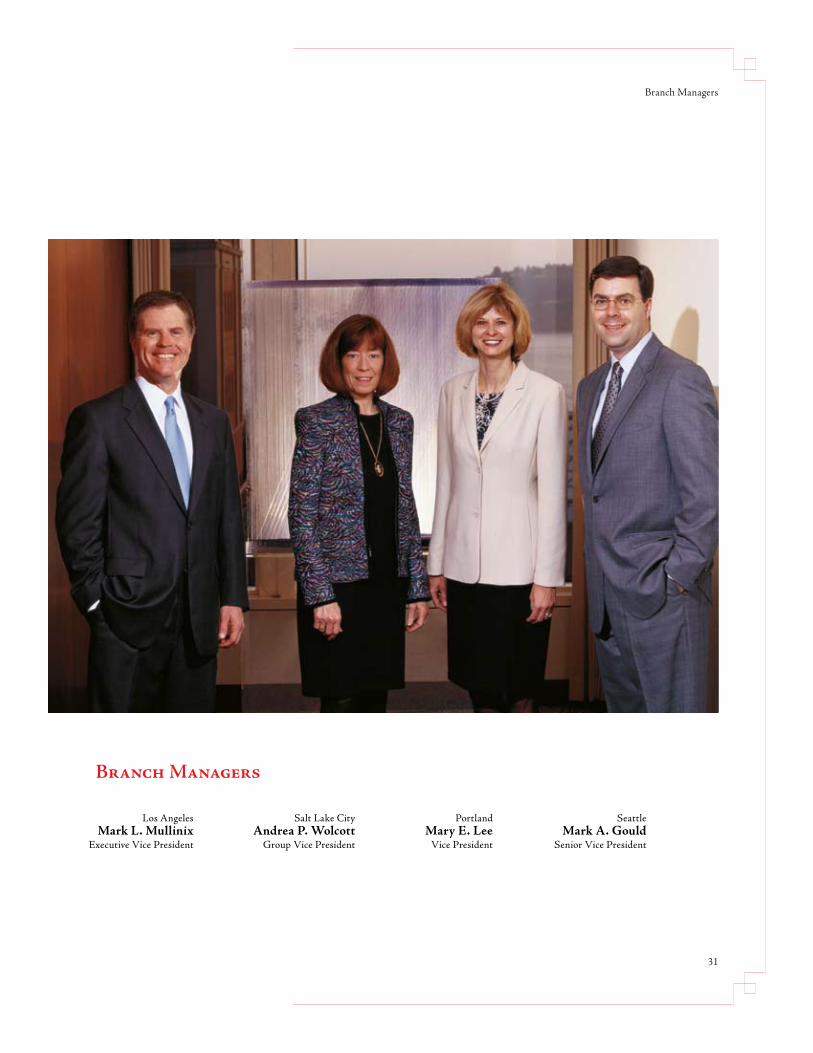
Branch Managers
31
Los Angeles Mark L. Mullinix
Executive Vice President
Salt Lake CityAndrea P. Wolcott
Group Vice President
Portland Mary E. Lee
Vice President
SeattleMark A. Gould
Senior Vice President
Branch Managers
Federal Reserve Bank of San Francisco
32
Janet L. YellenPresident and Chief Executive Officer
John F. MooreFirst Vice President and Chief Operating Officer
John P. JuddExecutive Vice President
Terry S. SchwakopfExecutive Vice President
John S. HsiaoSenior Vice President and Chief Information Officer
Glenn D. RudebuschSenior Vice President
Susan A. SutherlandSenior Vice President
John C. WilliamsSenior Vice President
Teresa M. CurranGroup Vice President and Deputy
Lee C. DwyerGroup Vice President and General Auditor
Fred T. FurlongGroup Vice President
Reuven GlickGroup Vice President
Todd A. GlissmanGroup Vice President
Richard B. HornsbyGroup Vice President
Donald R. LiebGroup Vice President and Chief Financial Officer
Sharon RuthGroup Vice President and General Counsel
Deborah S. SmythGroup Vice President
David W. WalkerGroup Vice President and Deputy
Patricia A. WelchGroup Vice President
Randy BalducciVice President
Barbara A. BennettVice President
Clifford N. CroxallVice President
Mary C. DalyVice President
John G. FernaldVice President
Beverley-Ann HawkinsVice President
Joy K. HoffmannVice President
Michael E. JohnsonVice President and Managing Director
Ann Marie KohlligianVice President and Managing Director
Gopa KumarVice President
Simon H. KwanVice President
Mark M. SpiegelVice President
Kevin C. AleccaDirector
Philip A. AquilinoDirector
Thomas A. BallantyneDirector
Tracy BasingerDirector
Kenneth R. BinningDirector
Richard K. CabralDirector
James J. CallahanDirector
Jackie C. HicksDirector
Rick A. MillerDirector
Frederic P. MinardiDirector
Richard A. Naylor, IIDirector
Darren S. PostDirector
David E. ReiserDirector
Jack RichardsDirector
Philip M. RyanDirector
Carl M. SegallDirector
David G. TresmontanDirector
Roxana R. TsougarakisDirector
Paulette M. WallaceDirector
Mary E. WujekDirector
Kevin ZerbeDirector
Judith R. W. GoffResearch Publications Advisor
Eric T. SwansonResearch Advisor
Bharat TrehanResearch Advisor
Robert G. VallettaResearch Advisor
Nancy S. EmersonPrincipal
Gerald T. IsedaPrincipal
Bonita G. JonesPrincipal
Maureen E. O’ByrnePrincipal
Mildred J. PowellEqual Employment Opportunity Officer
Erik Z. RevaiAssociate General Counsel
Peggy L. SpeckSecretary of the Board
Shirley N. ThompsonAssociate General Counsel
Bank Officers & Principals (as of December 31, 2005)
San Francisco Headquarters
Phoenix Processing CenterRobert E. Kellar, Jr.Director
Mary E. LeeVice President
Steven H. WalkerDirector
Andrea P. WolcottGroup Vice President
Mark A. GouldSenior Vice President
Michael J. StanSenior Vice President
Pamela R. AndersonDirector
Lynn M. JorgensenDirector
Portland Branch Salt Lake City Branch
Seattle Branch
Mark L. MullinixExecutive Vice President
Roger W. ReplogleSenior Vice President
Deborah AwaiGroup Vice President
Marla E. BorowskiVice President
Warren HowardVice President
Rita G. AguilarDirector
Jose AlonsoDirector
Anthony P. DazzoDirector
Robert C. JohnsonDirector
Steven E. JungDirector
Howard NgDirector
Robin A. RockwoodDirector
Joel K. Van ZeeDirector
Dale L. VaughanDirector
Dana R. GreenPrincipal
Los Angeles BranchRichard J. ShershenovichPrincipal
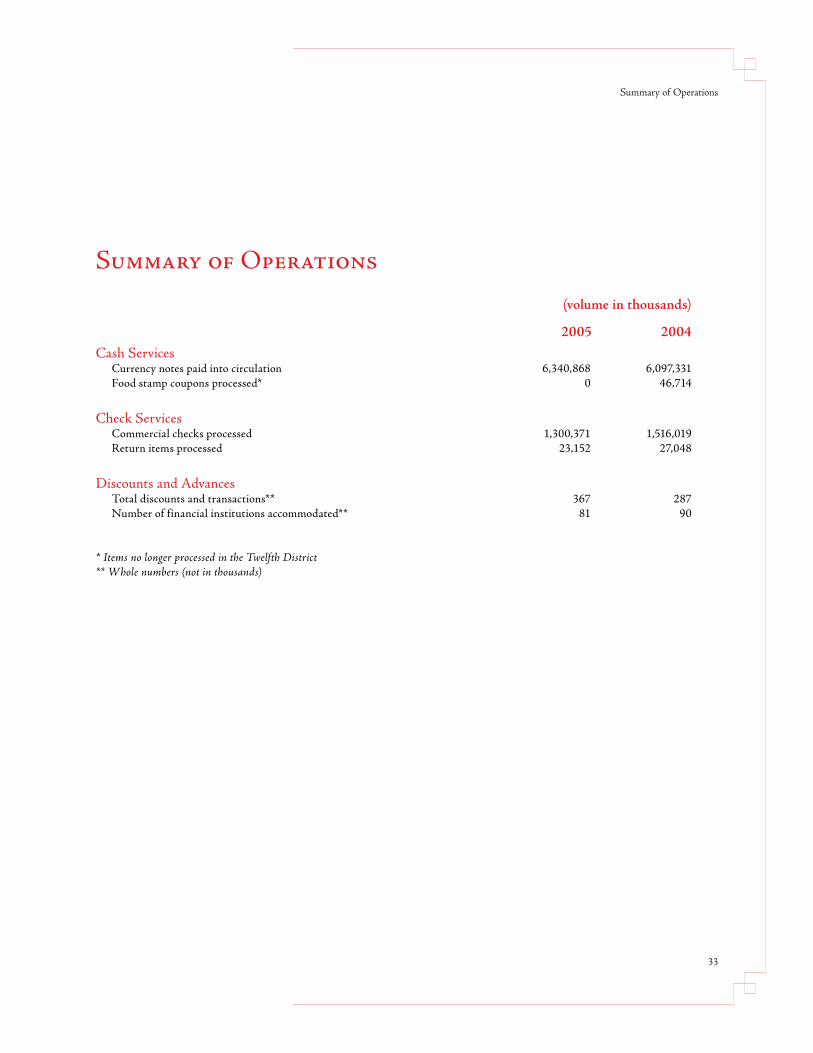
Summary of Operations
33
Summary of Operations
(volume in thousands)
2005 2004Cash Services
Currency notes paid into circulation 6,340,868 6,097,331Food stamp coupons processed* 0 46,714
Check Services Commercial checks processed 1,300,371 1,516,019Return items processed 23,152 27,048
Discounts and AdvancesTotal discounts and transactions** 367 287Number of financial institutions accommodated** 81 90
* Items no longer processed in the Twelfth District** Whole numbers (not in thousands)
Auditor Independence
The firm engaged by the Board of Governors for the audits of the individual and combined financial statements of the Reserve Banks for 2005 was PricewaterhouseCoopers LLP (PwC). Fees for these services totaled $4.6 million. To ensure auditor independence, the Board of Governors requires that PwC be independent in all matters relating to the audit. Specifically, PwC may not perform services for the Reserve Banks or others that would place it in a position of auditing its own work, making management decisions on behalf of the Reserve Banks, or in any other way impairing its audit independence. In 2005, the Bank did not engage PwC for non-audit services.
The Federal Reserve Bank of San Francisco
34
2005 Financial Reports
The management of the Federal Reserve Bank of San Francisco (“FRBSF”) is responsible for the preparation and fair presentation of the Statement of Financial Condition, Statement of Income, and Statement of Changes in Capital as of December 31, 2005 (the “Financial Statements”). The Financial Statements have been prepared in conformity with the accounting principles, policies, and practices established by the Board of Governors of the Federal Reserve System and as set forth in the Financial Accounting Manual for the Federal Reserve Banks (“Manual”), and as such, include amounts, some of which are based on judgments and estimates of management. To our knowledge, the Financial Statements are, in all material respects, fairly presented in conformity with the accounting principles, policies and practices documented in the Manual and include all disclosures necessary for such fair presentation.
The management of the FRBSF is responsible for maintaining an effective process of internal controls over financial reporting including the safeguarding of assets as they relate to the Financial Statements. Such internal controls are designed to provide reasonable assurance to management and to the Board of Directors regarding the preparation of reliable Financial Statements. This process of internal controls contains self-monitoring mechanisms, including, but not limited to, divisions of responsibility and a code of conduct. Once identified, any material deficiencies in the process of internal controls are reported to management, and appropriate corrective measures are implemented.
Even an effective process of internal controls, no matter how well designed, has inherent limitations, including the possibility of human error, and therefore can provide only reasonable assurance with respect to the preparation of reliable financial statements.
The management of the FRBSF assessed its process of internal controls over financial reporting including the safeguarding of assets reflected in the Financial Statements, based upon the criteria established in the Internal Control – Integrated Framework issued by the Committee of Sponsoring Organizations of the Treadway Commission (COSO). Based on this assessment, we believe that the FRBSF maintained an effective process of internal controls over financial reporting including the safeguarding of assets as they relate to the Financial Statements.
Federal Reserve Bank of San Francisco
Management’s Assertion
35
Federal Reserve Bank of San Francisco101 Market Street, San Francisco, CA 94105
March 2, 2006
To the Board of Directors:
by Janet L. YellenPresident
by John F. MooreFirst Vice President
by Donald R. Lieb Chief Financial Officer
Report of Independent Auditors
To the Board of Directors of the Federal Reserve Bank of San Francisco
We have examined management’s assertion, included in the accompanying Management Assertion that the Federal Reserve Bank of San Francisco (“FRBSF”) maintained effective internal control over financial reporting and the safeguarding of assets as of December 31, 2005, based on criteria established in Internal Control – Integrated Framework issued by the Committee of Sponsoring Organizations of the Treadway Commission. FRBSF's management is responsible for maintaining effective internal control over financial reporting and safeguarding of assets. Our responsibility is to express an opinion on management’s assertion based on our examination.
Our examination was conducted in accordance with attestation standards established by the American Institute of Certified Public Accountants and, accordingly, included obtaining an understanding of internal control over financial reporting, testing and evaluating the design and operating effectiveness of internal control, and performing such other procedures as we considered necessary in the circumstances. We believe that our examination provides a reasonable basis for our opinion.
Because of inherent limitations in any internal control, misstatements due to error or fraud may occur and not be detected. Also, projections of any evaluation of internal control over financial reporting to future periods are subject to the risk that the internal control may become inadequate because of changes in conditions, or that the degree of compliance with the policies or procedures may deteriorate.
In our opinion, management’s assertion that FRBSF maintained effective internal control over financial reporting and over the safeguarding of assets as of December 31, 2005 is fairly stated, in all material respects, based on criteria established in Internal Control – Integrated Framework issued by the Committee of Sponsoring Organizations of the Treadway Commission.
This report is intended solely for the information and use of management and the Board of Directors and Audit Committee of FRBSF, and any organization with legally defined oversight responsibilities and is not intended to be and should not be used by anyone other than these specified parties.
March 8, 2006
San Francisco, California
The Federal Reserve Bank of San Francisco
36
PricewaterhouseCoopers LLP333 Market Street, San Francisco CA 94105-2119Telephone (415) 498 5000Facsimile (415) 498 7100
Report of Independent Auditors
To the Board of Governors of the Federal Reserve Systemand the Board of Directors of the Federal Reserve Bank of San Francisco
We have audited the accompanying statements of condition of the Federal Reserve Bank of San Francisco (the “Bank”) as of December 31, 2005 and 2004, and the related statements of income and changes in capital for the years then ended, which have been prepared in conformity with the accounting principles, policies, and practices established by the Board of Governors of the Federal Reserve System. These financial statements are the responsibility of the Bank’s management. Our responsibility is to express an opinion on these financial statements based on our audits.
We conducted our audits in accordance with auditing standards generally accepted in the United States of America. Those standards require that we plan and perform the audit to obtain reasonable assurance about whether the financial statements are free of material misstatement. An audit includes examining, on a test basis, evidence supporting the amounts and disclosures in the financial statements. An audit also includes assessing the accounting principles used and significant estimates made by management, as well as evaluating the overall financial statement presentation. We believe that our audits provide a reasonable basis for our opinion.
As described in Note 3, these financial statements were prepared in conformity with the accounting principles, policies, and practices established by the Board of Governors of the Federal Reserve System. These principles, policies, and practices, which were designed to meet the specialized accounting and reporting needs of the Federal Reserve System, are set forth in the Financial Accounting Manual for Federal Reserve Banks and constitute a comprehensive basis of accounting other than accounting principles generally accepted in the United States of America.
In our opinion, the financial statements referred to above present fairly, in all material respects, the financial position of the Bank as of December 31, 2005 and 2004, and results of its operations for the years then ended, on the basis of accounting described in Note 3.
March 8, 2006
San Francisco, California
37
Report of Independent Auditors
PricewaterhouseCoopers LLP333 Market Street, San Francisco CA 94105-2119Telephone (415) 498 5000Facsimile (415) 498 7100
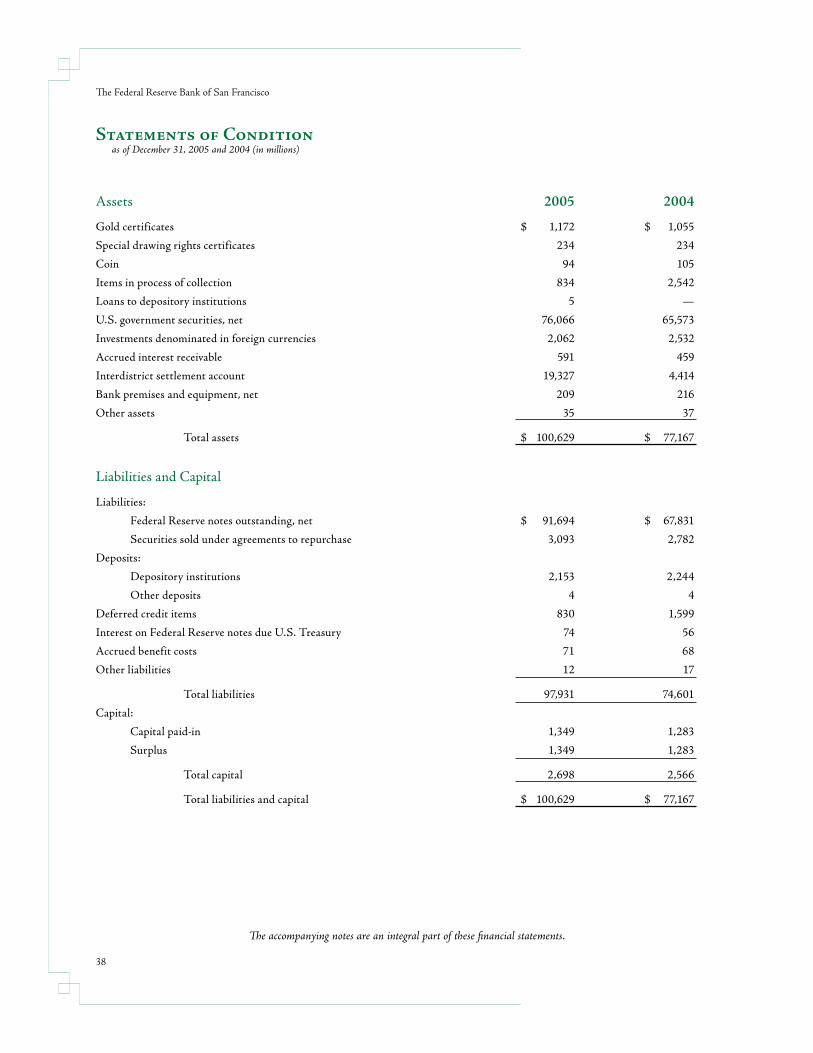
Statements of Conditionas of December 31, 2005 and 2004 (in millions)
38
The accompanying notes are an integral part of these financial statements.
The Federal Reserve Bank of San Francisco
Assets 2005 2004
Gold certificates $ 1,172 $ 1,055
Special drawing rights certificates 234 234
Coin 94 105
Items in process of collection 834 2,542
Loans to depository institutions 5 —
U.S. government securities, net 76,066 65,573
Investments denominated in foreign currencies 2,062 2,532
Accrued interest receivable 591 459
Interdistrict settlement account 19,327 4,414
Bank premises and equipment, net 209 216
Other assets 35 37
Total assets $ 100,629 $ 77,167
Liabilities and Capital
Liabilities:
Federal Reserve notes outstanding, net $ 91,694 $ 67,831
Securities sold under agreements to repurchase 3,093 2,782
Deposits:
Depository institutions 2,153 2,244
Other deposits 4 4
Deferred credit items 830 1,599
Interest on Federal Reserve notes due U.S. Treasury 74 56
Accrued benefit costs 71 68
Other liabilities 12 17
Total liabilities 97,931 74,601
Capital:
Capital paid-in 1,349 1,283
Surplus 1,349 1,283
Total capital 2,698 2,566
Total liabilities and capital $ 100,629 $ 77,167
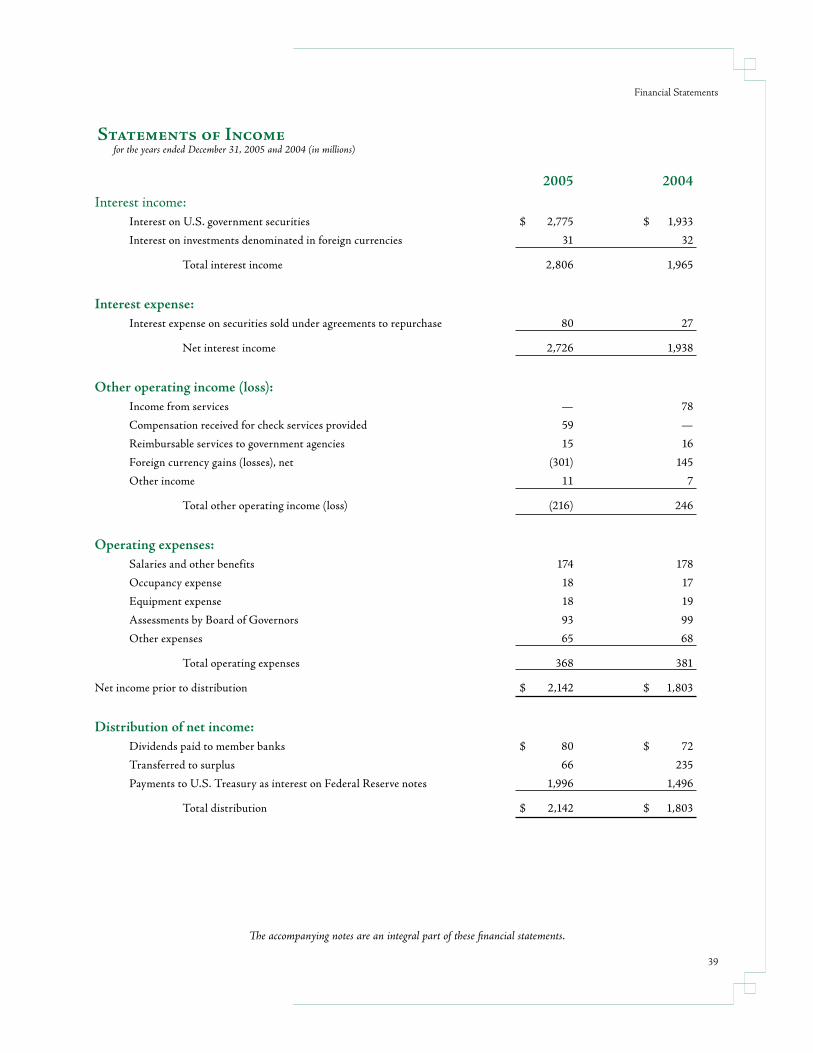
Statements of Incomefor the years ended December 31, 2005 and 2004 (in millions)
39
The accompanying notes are an integral part of these financial statements.
2005 2004
Interest income: Interest on U.S. government securities $ 2,775 $ 1,933
Interest on investments denominated in foreign currencies 31 32
Total interest income 2,806 1,965
Interest expense: Interest expense on securities sold under agreements to repurchase 80 27
Net interest income 2,726 1,938
Other operating income (loss): Income from services — 78
Compensation received for check services provided 59 —
Reimbursable services to government agencies 15 16
Foreign currency gains (losses), net (301) 145
Other income 11 7
Total other operating income (loss) (216) 246
Operating expenses: Salaries and other benefits 174 178
Occupancy expense 18 17
Equipment expense 18 19
Assessments by Board of Governors 93 99
Other expenses 65 68
Total operating expenses 368 381
Net income prior to distribution $ 2,142 $ 1,803
Distribution of net income: Dividends paid to member banks $ 80 $ 72
Transferred to surplus 66 235
Payments to U.S. Treasury as interest on Federal Reserve notes 1,996 1,496
Total distribution $ 2,142 $ 1,803
Financial Statements
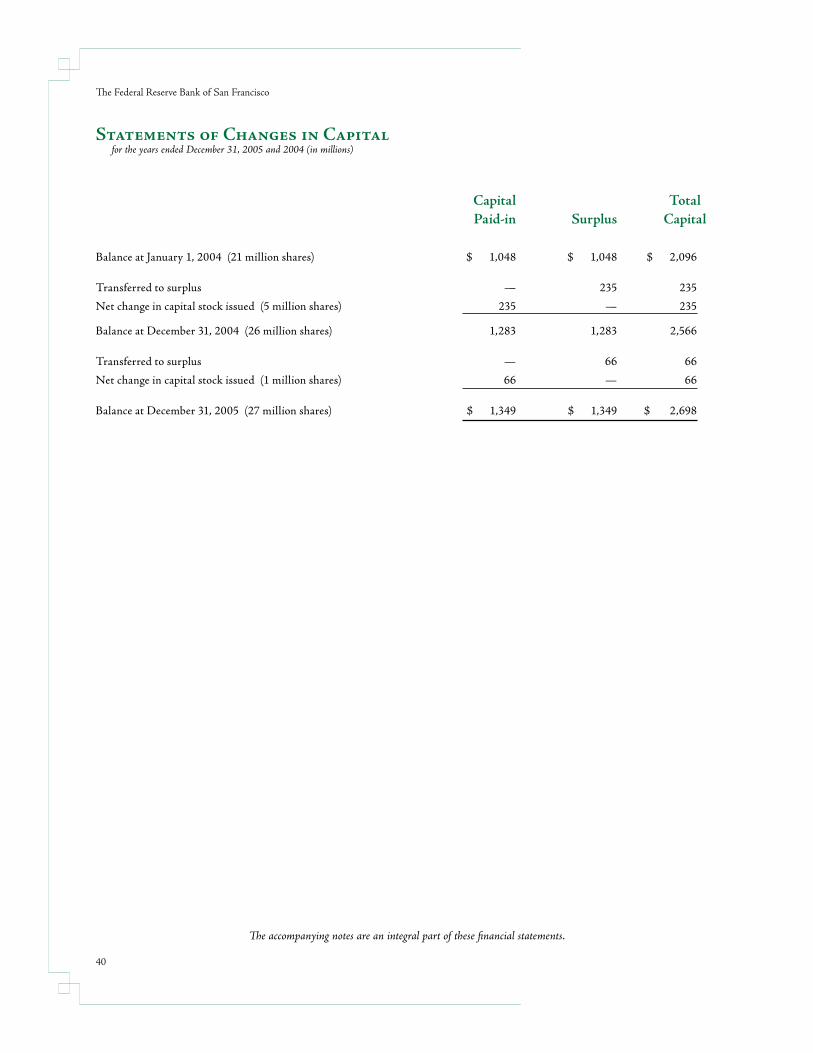
Capital Total Paid-in Surplus Capital
Balance at January 1, 2004 (21 million shares) $ 1,048 $ 1,048 $ 2,096
Transferred to surplus — 235 235
Net change in capital stock issued (5 million shares) 235 — 235
Balance at December 31, 2004 (26 million shares) 1,283 1,283 2,566
Transferred to surplus — 66 66
Net change in capital stock issued (1 million shares) 66 — 66
Balance at December 31, 2005 (27 million shares) $ 1,349 $ 1,349 $ 2,698
Statements of Changes in Capital for the years ended December 31, 2005 and 2004 (in millions)
40
The Federal Reserve Bank of San Francisco
The accompanying notes are an integral part of these financial statements.
1. Structure
The Federal Reserve Bank of San Francisco (“Bank”) is part of the Federal Reserve System (“System”) and one of the twelve Reserve Banks (“Reserve Banks”) created by Congress under the Federal Reserve Act of 1913 (“Federal Reserve Act”), which established the central bank of the United States. The Reserve Banks are chartered by the federal government and possess a unique set of governmental, corporate, and central bank characteristics. The Bank and its Branches in Los Angeles, California, Portland, Oregon, Salt Lake City, Utah, and Seattle, Washington serve the Twelfth Federal Reserve District, which includes Alaska, Arizona, California, Hawaii, Idaho, Nevada, Oregon, Utah, Washington, and the commonwealths or territories of American Samoa, Guam, and the Northern Mariana Islands.
In accordance with the Federal Reserve Act, supervision and control of the Bank are exercised by a Board of Directors. The Federal Reserve Act specifies the composition of the Board of Directors for each of the Reserve Banks. Each board is composed of nine members serving three-year terms: three directors, including those designated as Chairman and Deputy Chairman, are appointed by the Board of Governors, and six directors are elected by member banks. Banks that are members of the System include all national banks and any state-chartered banks that apply and are approved for membership in the System. Member banks are divided into three classes according to size. Member banks in each class elect one director representing member banks and one representing the public. In any election of directors, each member bank receives one vote, regardless of the number of shares of Reserve Bank stock it holds.
The System also consists, in part, of the Board of Governors of the Federal Reserve System (“Board of Governors”) and the Federal Open Market Committee (“FOMC”). The Board of Governors, an independent federal agency, is charged by the Federal Reserve Act with a number of specific duties, including general supervision over the Reserve Banks. The FOMC is composed of members of the Board of Governors, the president of the Federal Reserve Bank of New York (“FRBNY”), and on a rotating basis, four other Reserve Bank presidents.
2. Operations and Services
The System performs a variety of services and operations. Functions include formulating and conducting monetary policy; participating actively in the payments system including large-dollar transfers of funds, automated clearinghouse (“ACH”) operations, and check processing; distributing coin and currency; performing fiscal agency functions for the U.S. Treasury and certain federal agencies; serving as the federal government’s bank; providing short-term loans to depository institutions; serving the consumer and the community by providing educational materials and information regarding consumer laws; supervising bank holding companies, state member banks, and U.S. offices of foreign banking organizations; and administering other regulations of the Board of Governors. The System also provides certain services to foreign central banks, governments, and international official institutions.
The FOMC, in the conduct of monetary policy, establishes policy regarding domestic open market operations, oversees these operations, and annually issues authorizations and directives to the FRBNY for its execution of transactions. FRBNY is authorized to conduct operations in domestic markets, including direct purchase and sale of U. S. government securities, the purchase of securities under agreements to resell, the sale of securities under agreements to repurchase, and the lending of U.S. government securities. FRBNY executes these open market transactions and holds the resulting securities, with the exception of securities purchased under agreements to resell, in the portfolio known as the System Open Market Account (“SOMA”).
In addition to authorizing and directing operations in the domestic securities market, the FOMC authorizes and directs FRBNY to execute operations in foreign markets for major currencies in order to counter disorderly conditions in exchange markets or to meet other needs specified by the FOMC in carrying out the System’s central bank
41
Notes to Financial Statements Notes to Financial Statements
responsibilities. The FRBNY is authorized by the FOMC to hold balances of, and to execute spot and forward foreign exchange (“F/X”) and securities contracts for nine foreign currencies and to invest such foreign currency holdings ensuring adequate liquidity is maintained. In addition, FRBNY is authorized to maintain reciprocal currency arrangements (“F/X swaps”) with two central banks, and “warehouse” foreign currencies for the U.S. Treasury and Exchange Stabilization Fund (“ESF”) through the Reserve Banks. In connection with its foreign currency activities, FRBNY may enter into contracts that contain varying degrees of off-balance-sheet market risk, because they represent contractual commitments involving future settlement and counter-party credit risk. The FRBNY controls credit risk by obtaining credit approvals, establishing transaction limits, and performing daily monitoring procedures.
Although Reserve Banks are separate legal entities, in the interests of greater efficiency and effectiveness, they collaborate in the delivery of certain operations and services. The collaboration takes the form of centralized competency centers, operations sites, and product or service offices that have responsibility for the delivery of certain services on behalf of the Reserve Banks. Various operational and management models are used and are supported by service agreements between the Reserve Bank providing the service and the other eleven Reserve Banks. In some cases, costs incurred by a Reserve Bank for services provided to other Reserve Banks are not shared; in other cases, Reserve Banks are billed for services provided to them by another Reserve Bank.
Major services provided on behalf of the System by the Bank, for which the costs were not redistributed to the other Reserve Banks, include: Statistics and Reserves and Central Business Application Function, Check Adjustment National Management, Enterprise-wide Adjustments, Check User Research Environment, National Incident Response Team, Cash Services Office, Check Automation Services, Standard Cash Automation and Central Business Application Function, and Internet Technologies-Cash.
Beginning in 2005, the Reserve Banks adopted a new management model for providing check services to depository institutions. Under this new model, the Federal Reserve Bank of Atlanta (“FRBA”) has the overall responsibility for managing the Reserve Banks’ provision of check services and recognizes total System check revenue on its Statements of Income. FRBA compensates the other eleven Banks for the costs incurred to provide check services. This compensation is reported as Compensation received for check services provided in the Statements of Income. If the management model had been in place in 2004, the Bank would have reported $72 million as compensation received for check services provided and $78 million in check revenue would have been reported by FRB Atlanta rather than the Bank.
3. Significant Accounting Policies
Accounting principles for entities with the unique powers and responsibilities of the nation’s central bank have not been formulated by the various accounting standard-setting bodies. The Board of Governors has developed specialized accounting principles and practices that it believes are appropriate for the significantly different nature and function of a central bank as compared with the private sector. These accounting principles and practices are documented in the Financial Accounting Manual for Federal Reserve Banks (“Financial Accounting Manual”), which is issued by the Board of Governors. All Reserve Banks are required to adopt and apply accounting policies and practices that are consistent with the Financial Accounting Manual and the financial statements have been prepared in accordance with the Financial Accounting Manual.
Differences exist between the accounting principles and practices in the Financial Accounting Manual and those generally accepted in the United States (“GAAP”) primarily due to the unique nature of the Bank’s powers and responsibilities as part of the nation’s central bank. The primary difference is the presentation of all security holdings at amortized cost, rather than using the fair value presentation requirements in accordance with GAAP. Amortized cost more appropriately
42
The Federal Reserve Bank of San Francisco
reflects the Bank’s security holdings given its unique responsibility to conduct monetary policy. While the application of current market prices to the securities holdings may result in values substantially above or below their carrying values, these unrealized changes in value would have no direct affect on the quantity of reserves available to the banking system or on the prospects for future Bank earnings or capital. Both the domestic and foreign components of the SOMA portfolio may involve transactions that result in gains or losses when holdings are sold prior to maturity. Decisions regarding security and foreign currency transactions, including their purchase and sale, are motivated by monetary policy objectives rather than profit. Accordingly, market values, earnings, and any gains or losses resulting from the sale of such securities and currencies are incidental to the open market operations and do not motivate its activities or policy decisions.
In addition, the Bank has elected not to present a Statement of Cash Flows because the liquidity and cash position of the Bank are not a primary concern given the Bank’s unique powers and responsibilities. A Statement of Cash Flows, therefore, would not provide any additional meaningful information. Other information regarding the Bank’s activities is provided in, or may be derived from, the Statements of Condition, Income, and Changes in Capital. There are no other significant differences between the policies outlined in the Financial Accounting Manual and GAAP.
The preparation of the financial statements in conformity with the Financial Accounting Manual requires management to make certain estimates and assumptions that affect the reported amounts of assets and liabilities, disclosure of contingent assets and liabilities at the date of the financial statements, and the reported amounts of income and expenses during the reporting period. Actual results could differ from those estimates. Certain amounts relating to the prior year have been reclassified to conform to the current-year presentation. Unique accounts and significant accounting policies are explained below.
Gold and Special Drawing Rights Certificates
The Secretary of the U.S. Treasury is authorized to issue gold and special drawing rights (“SDR”) certificates to the Reserve Banks.
Payment for the gold certificates by the Reserve Banks is made by crediting equivalent amounts in dollars into the account established for the U.S. Treasury. These gold certificates held by the Reserve Banks are required to be backed by the gold of the U.S. Treasury. The U.S. Treasury may reacquire the gold certificates at any time and the Reserve Banks must deliver them to the U.S. Treasury. At such time, the U.S. Treasury’s account is charged, and the Reserve Banks’ gold certificate accounts are lowered. The value of gold for purposes of backing the gold certificates is set by law at $42 2/9 a fine troy ounce. The Board of Governors allocates the gold certificates among Reserve Banks once a year based on the average Federal Reserve notes outstanding in each Reserve Bank.
Special drawing rights (“SDRs”) are issued by the International Monetary Fund (“Fund”) to its members in proportion to each member’s quota in the Fund at the time of issuance. SDRs serve as a supplement to international monetary reserves and may be transferred from one national monetary authority to another. Under the law providing for United States participation in the SDR system, the Secretary of the U.S. Treasury is authorized to issue SDR certificates, somewhat like gold certificates, to the Reserve Banks. At such time, equivalent amounts in dollars are credited to the account established for the U.S. Treasury, and the Reserve Banks’ SDR certificate accounts are increased. The Reserve Banks are required to purchase SDR certificates, at the direction of the U.S. Treasury, for the purpose of financing SDR acquisitions or for financing exchange stabilization operations. At the time SDR transactions occur, the Board of Governors allocates SDR certificate transactions among Reserve Banks based upon Federal Reserve notes outstanding in each District at the end of the preceding year. There were no SDR transactions in 2005 or 2004.
43
Notes to Financial Statements
Loans to Depository Institutions
All depository institutions that maintain reservable transaction accounts or nonpersonal time deposits, as defined in regulations issued by the Board of Governors, have borrowing privileges at the discretion of the Reserve Bank. Borrowers execute certain lending agreements and deposit sufficient collateral before credit is extended. Loans are evaluated for collectibility, and currently all are considered collectible and fully collateralized. If loans were ever deemed to be uncollectible, an appropriate reserve would be established. Interest is accrued using the applicable discount rate established at least every fourteen days by the Board of Directors of the Reserve Bank, subject to review by the Board of Governors.
U.S. Government Securities and Investments Denominated in Foreign Currencies
U.S. government securities and investments denominated in foreign currencies comprising the SOMA are recorded at cost, on a settlement-date basis, and adjusted for amortization of premiums or accretion of discounts on a straight-line basis. Interest income is accrued on a straight-line basis. Gains and losses resulting from sales of securities are determined by specific issues based on average cost. Foreign-currency-denominated assets are revalued daily at current foreign currency market exchange rates in order to report these assets in U.S. dollars. Realized and unrealized gains and losses on investments denominated in foreign currencies are reported as “Foreign currency gains (losses), net.”
Activity related to U.S. government securities, including the related premiums, discounts, and realized and unrealized gains and losses, is allocated to each Reserve Bank on a percentage basis derived from an annual settlement of interdistrict clearings that occurs in April of each year. The settlement equalizes Reserve Bank gold certificate holdings to Federal Reserve notes outstanding in each District. Activity related to investments in foreign-currency-denominated assets is allocated to each Reserve Bank based on the ratio of each Reserve Bank’s capital and surplus to aggregate capital and surplus at the preceding December 31.
U.S. Government Securities Sold Under Agreements to Repurchase and Securities Lending
Securities sold under agreements to repurchase are accounted for as financing transactions and the associated interest expense is recognized over the life of the transaction. These transactions are carried in the Statements of Condition at their contractual amounts and the related accrued interest is reported as a component of “Other liabilities.”
U.S. government securities held in the SOMA are lent to U.S. government securities dealers and to banks participating in U.S. government securities clearing arrangements in order to facilitate the effective functioning of the domestic securities market. Securities-lending transactions are fully collateralized by other U.S. government securities and the collateral taken is in excess of the market value of the securities loaned. The FRBNY charges the dealer or bank a fee for borrowing securities and the fees are reported as a component of “Other Income” in the Statements of Income.
Activity related to U.S. government securities sold under agreements to repurchase and securities lending is allocated to each Reserve Bank on a percentage basis derived from the annual settlement of interdistrict clearings. Securities purchased under agreements to resell are allocated to FRBNY and not to the other Banks.
44
The Federal Reserve Bank of San Francisco
Foreign Currency Swaps and Warehousing
F/X swap arrangements are contractual agreements between two parties to exchange specified currencies, at a specified price, on a specified date. The parties agree to exchange their currencies up to a pre-arranged maximum amount and for an agreed-upon period of time (up to twelve months), at an agreed-upon interest rate. These arrangements give the FOMC temporary access to the foreign currencies it may need to intervene to support the dollar and give the counterparty temporary access to dollars it may need to support its own currency. Drawings under the F/X swap arrangements can be initiated by either FRBNY or the counterparty (the drawer) and must be agreed to by the drawee. The F/X swaps are structured so that the party initiating the transaction bears the exchange rate risk upon maturity. FRBNY will generally invest the foreign currency received under an F/X swap in interest-bearing instruments.
Warehousing is an arrangement under which the FOMC agrees to exchange, at the request of the U.S. Treasury, U.S. dollars for foreign currencies held by the U.S. Treasury or ESF over a limited period of time. The purpose of the warehousing facility is to supplement the U.S. dollar resources of the U.S. Treasury and ESF for financing purchases of foreign currencies and related international operations.
Foreign currency swaps and warehousing agreements are revalued daily at current market exchange rates. Activity related to these agreements, with the exception of the unrealized gains and losses resulting from the daily revaluation, is allocated to each Reserve Bank based on the ratio of each Reserve Bank’s capital and surplus to aggregate capital and surplus at the preceding December 31. Unrealized gains and losses resulting from the daily revaluation are allocated to FRBNY and not to the other Reserve Banks.
Bank Premises, Equipment, and Software
Bank premises and equipment are stated at cost less accumulated depreciation. Depreciation is calculated on a straight-line basis over estimated useful lives of assets ranging from three to fifty years. Major alterations, renovations, and improvements are capitalized at cost as additions to the asset accounts and are amortized over the remaining useful life of the asset. Maintenance, repairs, and minor replacements are charged to operating expense in the year incurred. Capitalized assets including software, land, building, leasehold improvements, furniture, and equipment are impaired when it is determined that the net realizable value is significantly less than book value and is not recoverable.
Costs incurred for software, either developed internally or acquired for internal use, during the application development stage are capitalized based on the cost of direct services and materials associated with designing, coding, installing, or testing software. Capitalized software costs are amortized on a straight-line basis over the estimated useful lives of the software applications, which range from three to five years.
Interdistrict Settlement Account
At the close of business each day, each Reserve Bank assembles the payments due to or from other Reserve Banks as a result of the day’s transactions that involve depository institution accounts held by other Districts. Such transactions may include funds settlement, check clearing, and ACH operations. The cumulative net amount due to or from the other Reserve Banks is reflected in the “Interdistrict settlement account” in the Statements of Condition.
45
Notes to Financial Statements
Federal Reserve Notes
Federal Reserve notes are the circulating currency of the United States. These notes are issued through the various Federal Reserve agents (the Chairman of the Board of Directors of each Reserve Bank) to the Reserve Banks upon deposit with such agents of certain classes of collateral security, typically U.S. government securities. These notes are identified as issued to a specific Reserve Bank. The Federal Reserve Act provides that the collateral security tendered by the Reserve Bank to the Federal Reserve agent must be equal to the sum of the notes applied for by such Reserve Bank.
Assets eligible to be pledged as collateral security include all Bank assets. The collateral value is equal to the book value of the collateral tendered, with the exception of securities, whose collateral value is equal to the par value of the securities tendered. The par value of securities pledged for securities sold under agreements to repurchase is deducted.
The Board of Governors may, at any time, call upon a Reserve Bank for additional security to adequately collateralize the Federal Reserve notes. To satisfy the obligation to provide sufficient collateral for outstanding Federal Reserve notes, the Reserve Banks have entered into an agreement that provides for certain assets of the Reserve Banks to be jointly pledged as collateral for the Federal Reserve notes of all Reserve Banks. In the event that this collateral is insufficient, the Federal Reserve Act provides that Federal Reserve notes become a first and paramount lien on all the assets of the Reserve Banks. Finally, as obligations of the United States, Federal Reserve notes are backed by the full faith and credit of the United States government.
The “Federal Reserve notes outstanding, net” account represents the Bank’s Federal Reserve notes outstanding, reduced by the currency issued to the Bank but not in circulation, of $19,391 million, and $20,570 million at December 31, 2005 and 2004, respectively.
Items in Process of Collection and Deferred Credit Items
The balance in the “Items in process of collection” line in the Statements of Condition primarily represents amounts attributable to checks that have been deposited for collection by the payee depository institution and, as of the balance sheet date, have not yet been collected from the payor depository institution. Deferred credit items are the counterpart liability to items in process of collection, and the amounts in this account arise from deferring credit for deposited items until the amounts are collected. The balances in both accounts can fluctuate and vary significantly from day to day.
Capital Paid-in
The Federal Reserve Act requires that each member bank subscribe to the capital stock of the Reserve Bank in an amount equal to 6 percent of the capital and surplus of the member bank. These shares are nonvoting with a par value of $100 and may not be transferred or hypothecated. As a member bank’s capital and surplus changes, its holdings of Reserve Bank stock must be adjusted. Currently, only one-half of the subscription is paid-in and the remainder is subject to call. By law, each Bank is required to pay each member bank an annual dividend of 6 percent on the paid-in capital stock. This cumulative dividend is paid semiannually. A member bank is liable for Reserve Bank liabilities up to twice the par value of stock subscribed by it.
46
The Federal Reserve Bank of San Francisco
Surplus
The Board of Governors requires Reserve Banks to maintain a surplus equal to the amount of capital paid-in as of December 31. This amount is intended to provide additional capital and reduce the possibility that the Reserve Banks would be required to call on member banks for additional capital. Pursuant to Section 16 of the Federal Reserve Act, Reserve Banks are required by the Board of Governors to transfer to the U.S. Treasury as interest on Federal Reserve notes excess earnings, after providing for the costs of operations, payment of dividends, and reservation of an amount necessary to equate surplus with capital paid-in.
In the event of losses or an increase in capital paid-in at a Reserve Bank, payments to the U.S. Treasury are suspended and earnings are retained until the surplus is equal to the capital paid-in. Weekly payments to the U.S. Treasury may vary significantly.
In the event of a decrease in capital paid-in, the excess surplus, after equating capital paid-in and surplus at December 31, is distributed to U.S. Treasury in the following year. This amount is reported as a component of “Payments to U.S. Treasury as interest on Federal Reserve notes.”
Income and Costs related to U.S. Treasury Services
The Bank is required by the Federal Reserve Act to serve as fiscal agent and depository of the United States. By statute, the Department of the Treasury is permitted, but not required, to pay for these services.
Assessments by the Board of Governors
The Board of Governors assesses the Reserve Banks to fund its operations based on each Reserve Bank’s capital and surplus balances. The Board of Governors also assesses each Reserve Bank for the expenses incurred for the U.S. Treasury to issue and retire Federal Reserve notes based on each Reserve Bank’s share of the number of notes comprising the System’s net liability for Federal Reserve notes on December 31 of the previous year.
Taxes
The Reserve Banks are exempt from federal, state, and local taxes, except for taxes on real property. The Bank’s real property taxes were $3 million for each of the years ended December 31, 2005 and 2004, respectively, and are reported as a component of “Occupancy expense.”
Restructuring Charges
In 2003, the System began the restructuring of several operations, primarily check, cash, and U.S. Treasury services. The restructuring included streamlining the management and support structures, reducing staff, decreasing the number of processing locations, and increasing processing capacity in the remaining locations. These restructuring activities continued in 2004 and 2005.
Footnote 10 describes the restructuring and provides information about the Bank’s costs and liabilities associated with employee separations and contract terminations. The costs associated with the write-down of certain Bank assets are discussed in footnote 6. Costs and liabilities associated with enhanced pension benefits in connection with the restructuring activities for all Reserve Banks are recorded on the books of the FRBNY and those associated with enhanced post-retirement benefits are discussed in footnote 9.
47
Notes to Financial Statements
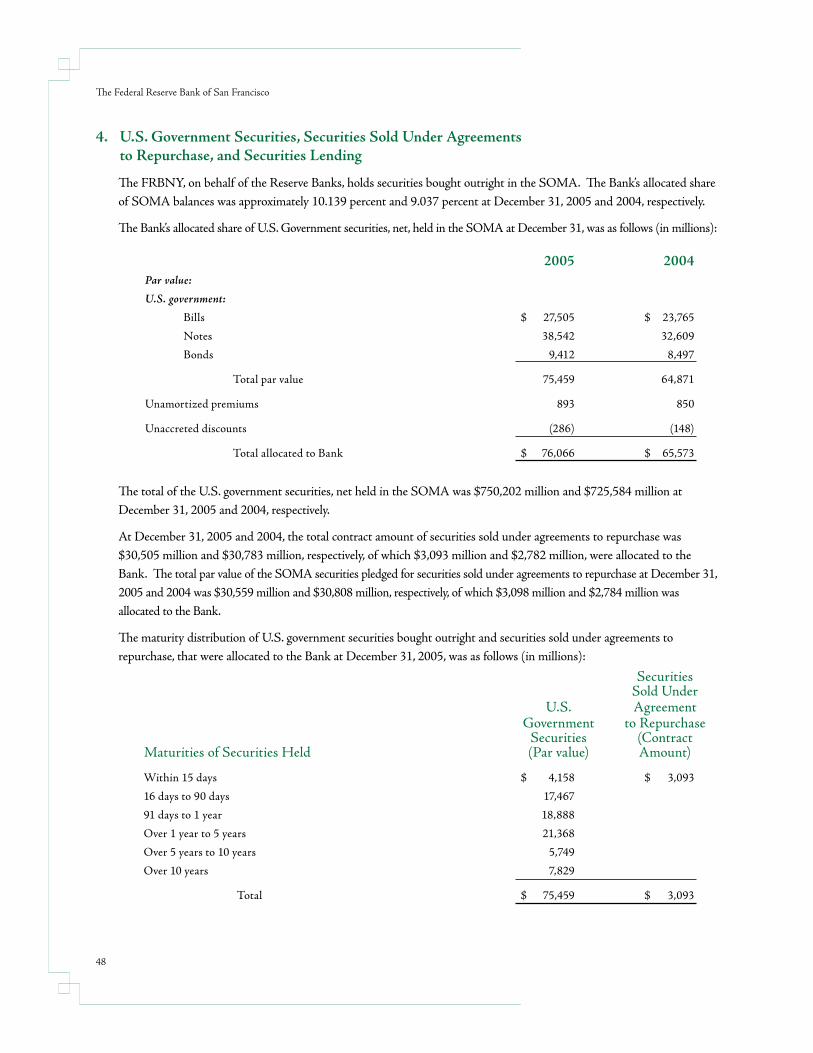
4. U.S. Government Securities, Securities Sold Under Agreements to Repurchase, and Securities Lending
The FRBNY, on behalf of the Reserve Banks, holds securities bought outright in the SOMA. The Bank’s allocated share of SOMA balances was approximately 10.139 percent and 9.037 percent at December 31, 2005 and 2004, respectively.
The Bank’s allocated share of U.S. Government securities, net, held in the SOMA at December 31, was as follows (in millions):
2005 2004
Par value: U.S. government: Bills $ 27,505 $ 23,765
Notes 38,542 32,609
Bonds 9,412 8,497
Total par value 75,459 64,871
Unamortized premiums 893 850
Unaccreted discounts (286) (148)
Total allocated to Bank $ 76,066 $ 65,573
The total of the U.S. government securities, net held in the SOMA was $750,202 million and $725,584 million at December 31, 2005 and 2004, respectively.
At December 31, 2005 and 2004, the total contract amount of securities sold under agreements to repurchase was $30,505 million and $30,783 million, respectively, of which $3,093 million and $2,782 million, were allocated to the Bank. The total par value of the SOMA securities pledged for securities sold under agreements to repurchase at December 31, 2005 and 2004 was $30,559 million and $30,808 million, respectively, of which $3,098 million and $2,784 million was allocated to the Bank.
The maturity distribution of U.S. government securities bought outright and securities sold under agreements to repurchase, that were allocated to the Bank at December 31, 2005, was as follows (in millions):
Securities Sold Under U.S. Agreement Government to Repurchase Securities (Contract Maturities of Securities Held (Par value) Amount)
Within 15 days $ 4,158 $ 3,093
16 days to 90 days 17,467
91 days to 1 year 18,888
Over 1 year to 5 years 21,368
Over 5 years to 10 years 5,749
Over 10 years 7,829
Total $ 75,459 $ 3,093
48
The Federal Reserve Bank of San Francisco
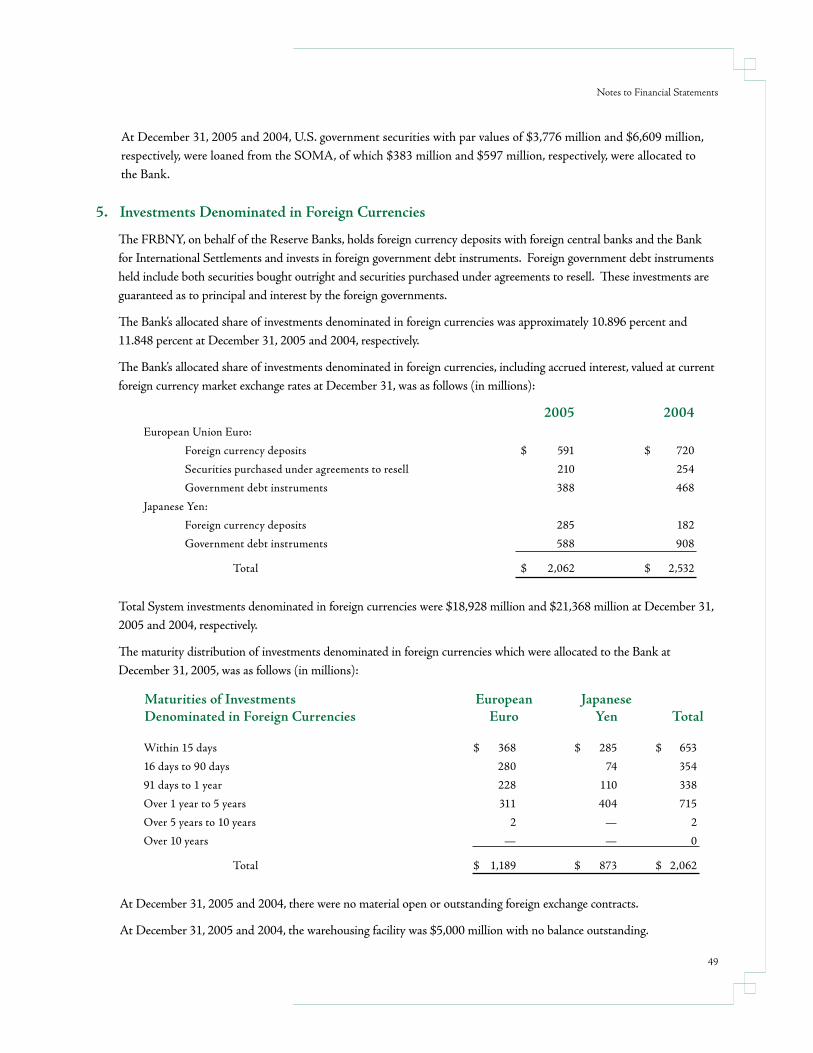
At December 31, 2005 and 2004, U.S. government securities with par values of $3,776 million and $6,609 million, respectively, were loaned from the SOMA, of which $383 million and $597 million, respectively, were allocated to the Bank.
5. Investments Denominated in Foreign Currencies
The FRBNY, on behalf of the Reserve Banks, holds foreign currency deposits with foreign central banks and the Bank for International Settlements and invests in foreign government debt instruments. Foreign government debt instruments held include both securities bought outright and securities purchased under agreements to resell. These investments are guaranteed as to principal and interest by the foreign governments.
The Bank’s allocated share of investments denominated in foreign currencies was approximately 10.896 percent and 11.848 percent at December 31, 2005 and 2004, respectively.
The Bank’s allocated share of investments denominated in foreign currencies, including accrued interest, valued at current foreign currency market exchange rates at December 31, was as follows (in millions):
2005 2004European Union Euro:
Foreign currency deposits $ 591 $ 720
Securities purchased under agreements to resell 210 254
Government debt instruments 388 468
Japanese Yen:
Foreign currency deposits 285 182
Government debt instruments 588 908
Total $ 2,062 $ 2,532
Total System investments denominated in foreign currencies were $18,928 million and $21,368 million at December 31, 2005 and 2004, respectively.
The maturity distribution of investments denominated in foreign currencies which were allocated to the Bank at December 31, 2005, was as follows (in millions):
Maturities of Investments European Japanese Denominated in Foreign Currencies Euro Yen Total
Within 15 days $ 368 $ 285 $ 653
16 days to 90 days 280 74 354
91 days to 1 year 228 110 338
Over 1 year to 5 years 311 404 715
Over 5 years to 10 years 2 — 2
Over 10 years — — 0
Total $ 1,189 $ 873 $ 2,062
At December 31, 2005 and 2004, there were no material open or outstanding foreign exchange contracts.
At December 31, 2005 and 2004, the warehousing facility was $5,000 million with no balance outstanding.
49
Notes to Financial Statements
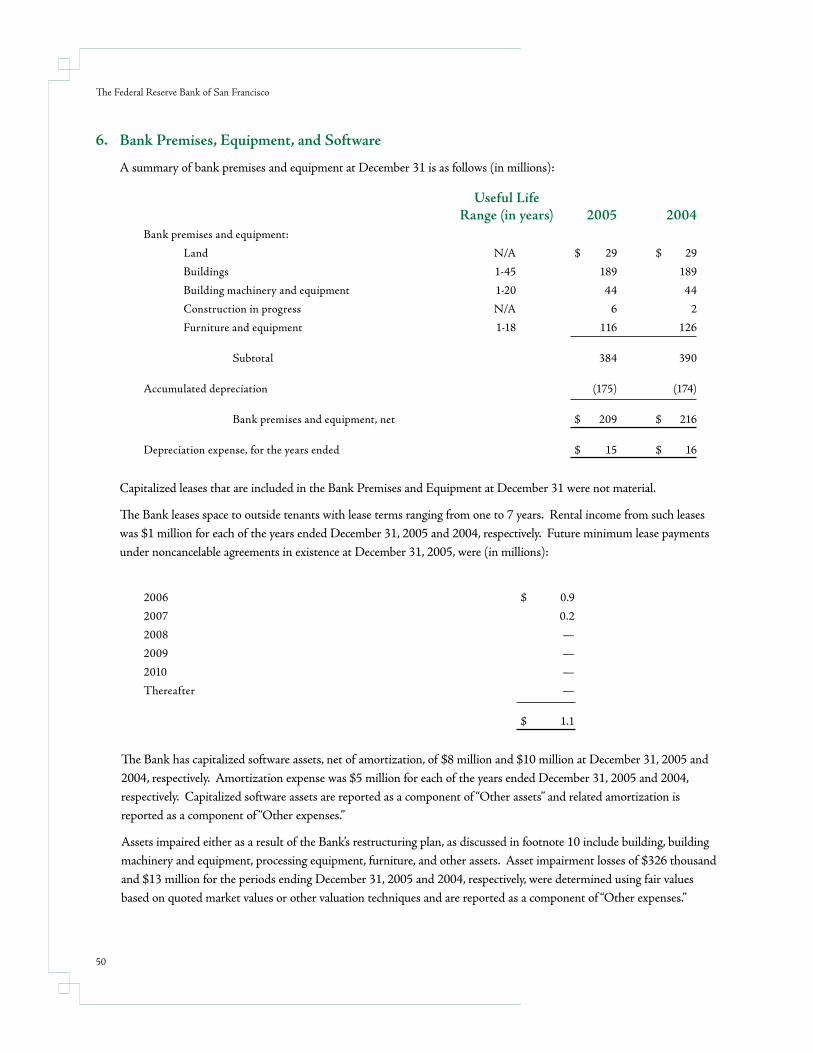
6. Bank Premises, Equipment, and Software
A summary of bank premises and equipment at December 31 is as follows (in millions):
Useful Life Range (in years) 2005 2004
Bank premises and equipment:
Land N/A $ 29 $ 29
Buildings 1-45 189 189
Building machinery and equipment 1-20 44 44
Construction in progress N/A 6 2
Furniture and equipment 1-18 116 126
Subtotal 384 390
Accumulated depreciation (175) (174)
Bank premises and equipment, net $ 209 $ 216
Depreciation expense, for the years ended $ 15 $ 16
Capitalized leases that are included in the Bank Premises and Equipment at December 31 were not material.
The Bank leases space to outside tenants with lease terms ranging from one to 7 years. Rental income from such leases was $1 million for each of the years ended December 31, 2005 and 2004, respectively. Future minimum lease payments under noncancelable agreements in existence at December 31, 2005, were (in millions):
2006 $ 0.9
2007 0.2
2008 —
2009 —
2010 —
Thereafter —
$ 1.1
The Bank has capitalized software assets, net of amortization, of $8 million and $10 million at December 31, 2005 and 2004, respectively. Amortization expense was $5 million for each of the years ended December 31, 2005 and 2004, respectively. Capitalized software assets are reported as a component of “Other assets” and related amortization is reported as a component of “Other expenses.”
Assets impaired either as a result of the Bank’s restructuring plan, as discussed in footnote 10 include building, building machinery and equipment, processing equipment, furniture, and other assets. Asset impairment losses of $326 thousand and $13 million for the periods ending December 31, 2005 and 2004, respectively, were determined using fair values based on quoted market values or other valuation techniques and are reported as a component of “Other expenses.”
50
The Federal Reserve Bank of San Francisco
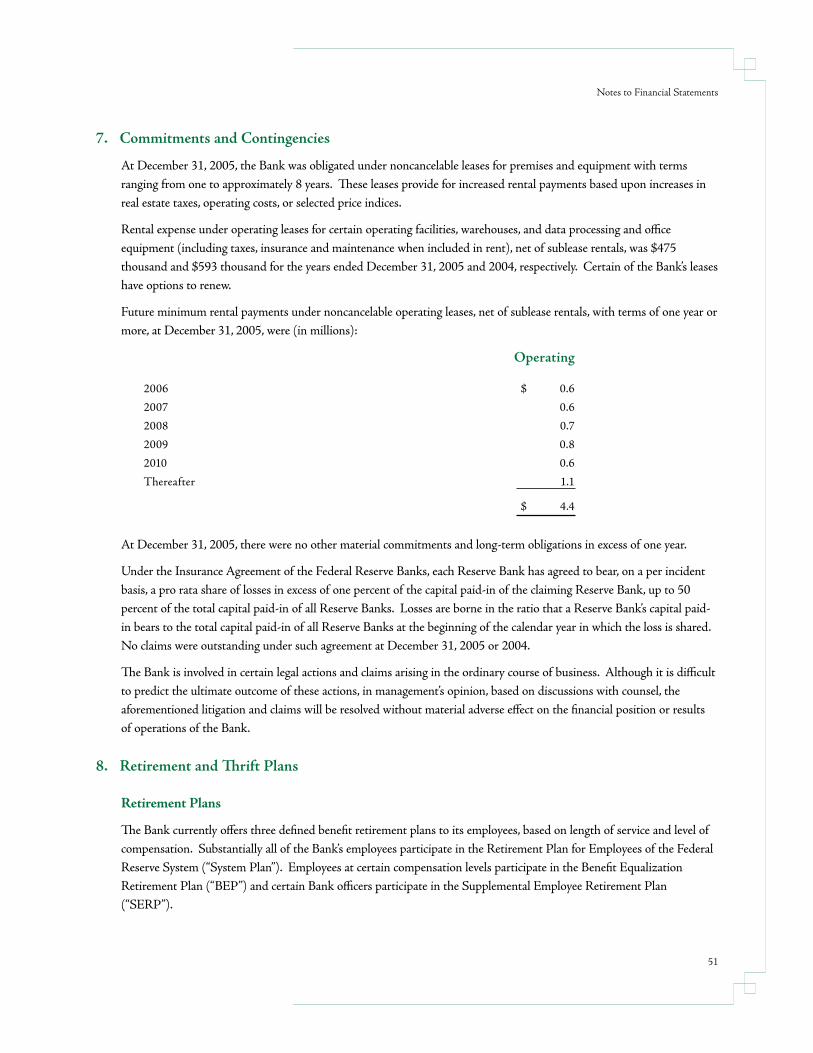
7. Commitments and Contingencies
At December 31, 2005, the Bank was obligated under noncancelable leases for premises and equipment with terms ranging from one to approximately 8 years. These leases provide for increased rental payments based upon increases in real estate taxes, operating costs, or selected price indices.
Rental expense under operating leases for certain operating facilities, warehouses, and data processing and office equipment (including taxes, insurance and maintenance when included in rent), net of sublease rentals, was $475 thousand and $593 thousand for the years ended December 31, 2005 and 2004, respectively. Certain of the Bank’s leases have options to renew.
Future minimum rental payments under noncancelable operating leases, net of sublease rentals, with terms of one year or more, at December 31, 2005, were (in millions):
Operating
2006 $ 0.6
2007 0.6
2008 0.7
2009 0.8
2010 0.6
Thereafter 1.1
$ 4.4
At December 31, 2005, there were no other material commitments and long-term obligations in excess of one year.
Under the Insurance Agreement of the Federal Reserve Banks, each Reserve Bank has agreed to bear, on a per incident basis, a pro rata share of losses in excess of one percent of the capital paid-in of the claiming Reserve Bank, up to 50 percent of the total capital paid-in of all Reserve Banks. Losses are borne in the ratio that a Reserve Bank’s capital paid-in bears to the total capital paid-in of all Reserve Banks at the beginning of the calendar year in which the loss is shared. No claims were outstanding under such agreement at December 31, 2005 or 2004.
The Bank is involved in certain legal actions and claims arising in the ordinary course of business. Although it is difficult to predict the ultimate outcome of these actions, in management’s opinion, based on discussions with counsel, the aforementioned litigation and claims will be resolved without material adverse effect on the financial position or results of operations of the Bank.
8. Retirement and Thrift Plans
Retirement Plans
The Bank currently offers three defined benefit retirement plans to its employees, based on length of service and level of compensation. Substantially all of the Bank’s employees participate in the Retirement Plan for Employees of the Federal Reserve System (“System Plan”). Employees at certain compensation levels participate in the Benefit Equalization Retirement Plan (“BEP”) and certain Bank officers participate in the Supplemental Employee Retirement Plan (“SERP”).
51
Notes to Financial Statements
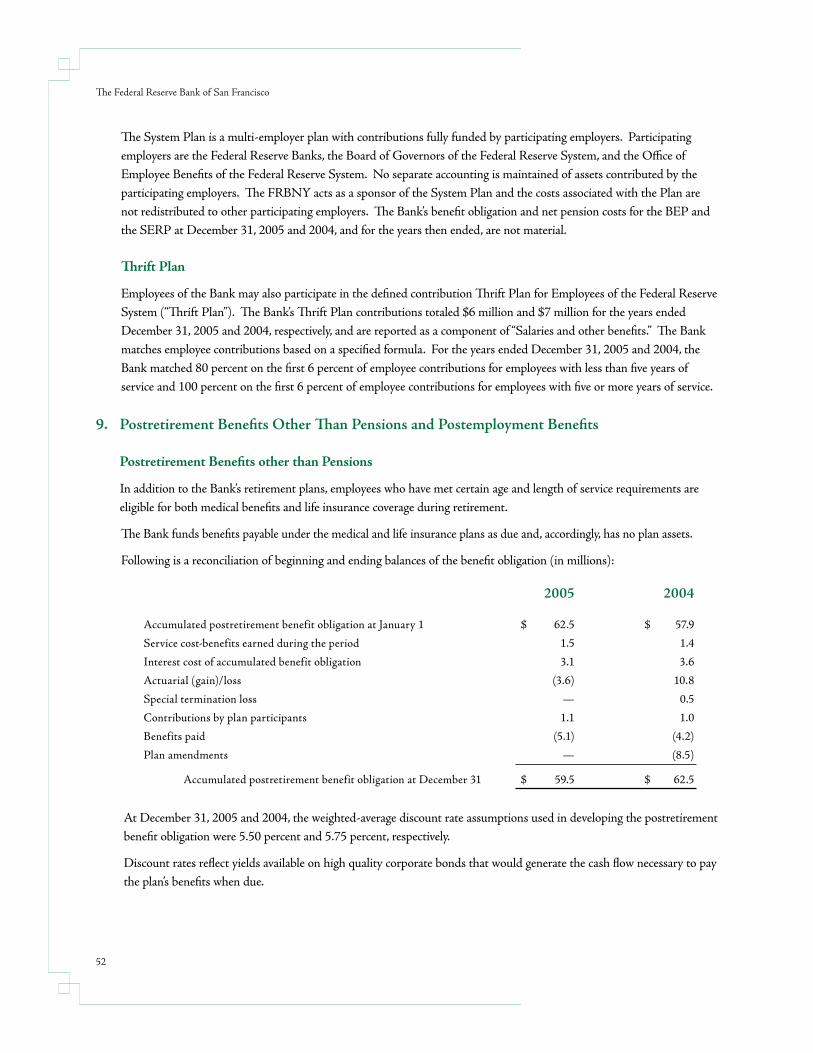
The System Plan is a multi-employer plan with contributions fully funded by participating employers. Participating employers are the Federal Reserve Banks, the Board of Governors of the Federal Reserve System, and the Office of Employee Benefits of the Federal Reserve System. No separate accounting is maintained of assets contributed by the participating employers. The FRBNY acts as a sponsor of the System Plan and the costs associated with the Plan are not redistributed to other participating employers. The Bank’s benefit obligation and net pension costs for the BEP and the SERP at December 31, 2005 and 2004, and for the years then ended, are not material.
Thrift Plan
Employees of the Bank may also participate in the defined contribution Thrift Plan for Employees of the Federal Reserve System (“Thrift Plan”). The Bank’s Thrift Plan contributions totaled $6 million and $7 million for the years ended December 31, 2005 and 2004, respectively, and are reported as a component of “Salaries and other benefits.” The Bank matches employee contributions based on a specified formula. For the years ended December 31, 2005 and 2004, the Bank matched 80 percent on the first 6 percent of employee contributions for employees with less than five years of service and 100 percent on the first 6 percent of employee contributions for employees with five or more years of service.
9. Postretirement Benefits Other Than Pensions and Postemployment Benefits
Postretirement Benefits other than Pensions
In addition to the Bank’s retirement plans, employees who have met certain age and length of service requirements are eligible for both medical benefits and life insurance coverage during retirement.
The Bank funds benefits payable under the medical and life insurance plans as due and, accordingly, has no plan assets.
Following is a reconciliation of beginning and ending balances of the benefit obligation (in millions):
2005 2004
Accumulated postretirement benefit obligation at January 1 $ 62.5 $ 57.9
Service cost-benefits earned during the period 1.5 1.4
Interest cost of accumulated benefit obligation 3.1 3.6
Actuarial (gain)/loss (3.6) 10.8
Special termination loss — 0.5
Contributions by plan participants 1.1 1.0
Benefits paid (5.1) (4.2)
Plan amendments — (8.5)
Accumulated postretirement benefit obligation at December 31 $ 59.5 $ 62.5
At December 31, 2005 and 2004, the weighted-average discount rate assumptions used in developing the postretirement benefit obligation were 5.50 percent and 5.75 percent, respectively.
Discount rates reflect yields available on high quality corporate bonds that would generate the cash flow necessary to pay the plan’s benefits when due.
52
The Federal Reserve Bank of San Francisco
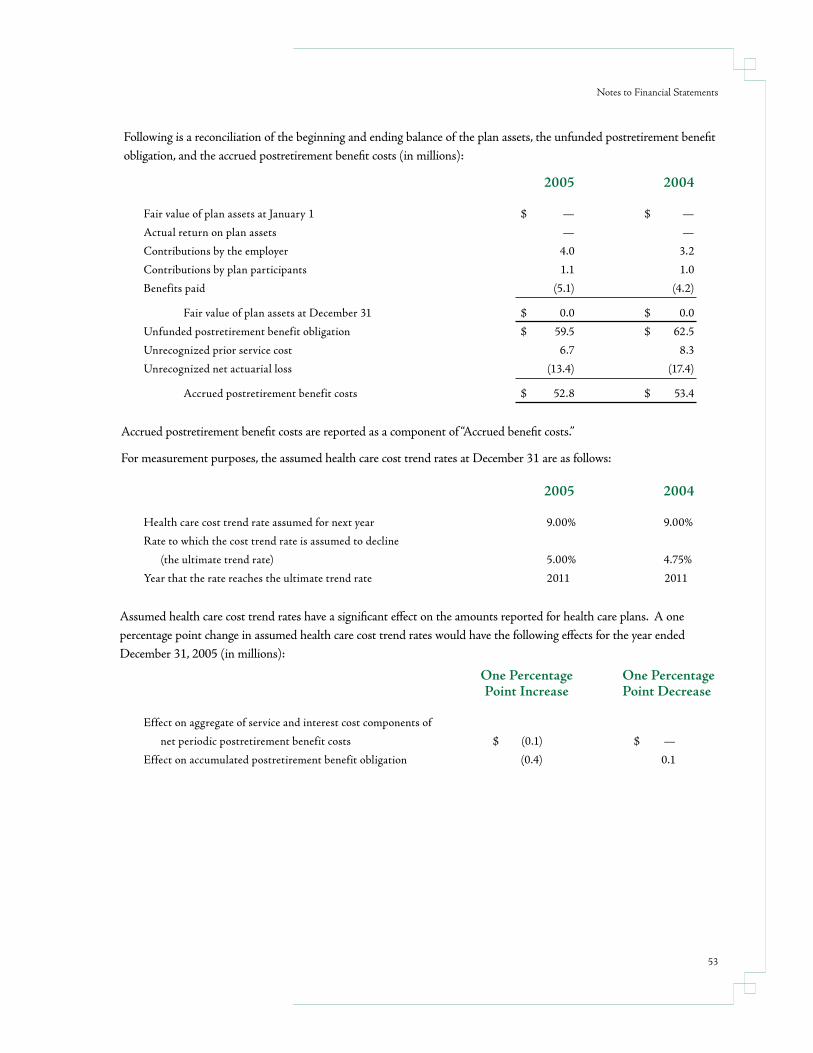
Following is a reconciliation of the beginning and ending balance of the plan assets, the unfunded postretirement benefit obligation, and the accrued postretirement benefit costs (in millions):
2005 2004
Fair value of plan assets at January 1 $ — $ —
Actual return on plan assets — —
Contributions by the employer 4.0 3.2
Contributions by plan participants 1.1 1.0
Benefits paid (5.1) (4.2)
Fair value of plan assets at December 31 $ 0.0 $ 0.0
Unfunded postretirement benefit obligation $ 59.5 $ 62.5
Unrecognized prior service cost 6.7 8.3
Unrecognized net actuarial loss (13.4) (17.4)
Accrued postretirement benefit costs $ 52.8 $ 53.4
Accrued postretirement benefit costs are reported as a component of “Accrued benefit costs.”
For measurement purposes, the assumed health care cost trend rates at December 31 are as follows:
2005 2004
Health care cost trend rate assumed for next year 9.00% 9.00%
Rate to which the cost trend rate is assumed to decline
(the ultimate trend rate) 5.00% 4.75%
Year that the rate reaches the ultimate trend rate 2011 2011
Assumed health care cost trend rates have a significant effect on the amounts reported for health care plans. A one percentage point change in assumed health care cost trend rates would have the following effects for the year ended December 31, 2005 (in millions):
One Percentage One Percentage Point Increase Point Decrease
Effect on aggregate of service and interest cost components of
net periodic postretirement benefit costs $ (0.1) $ —
Effect on accumulated postretirement benefit obligation (0.4) 0.1
53
Notes to Financial Statements
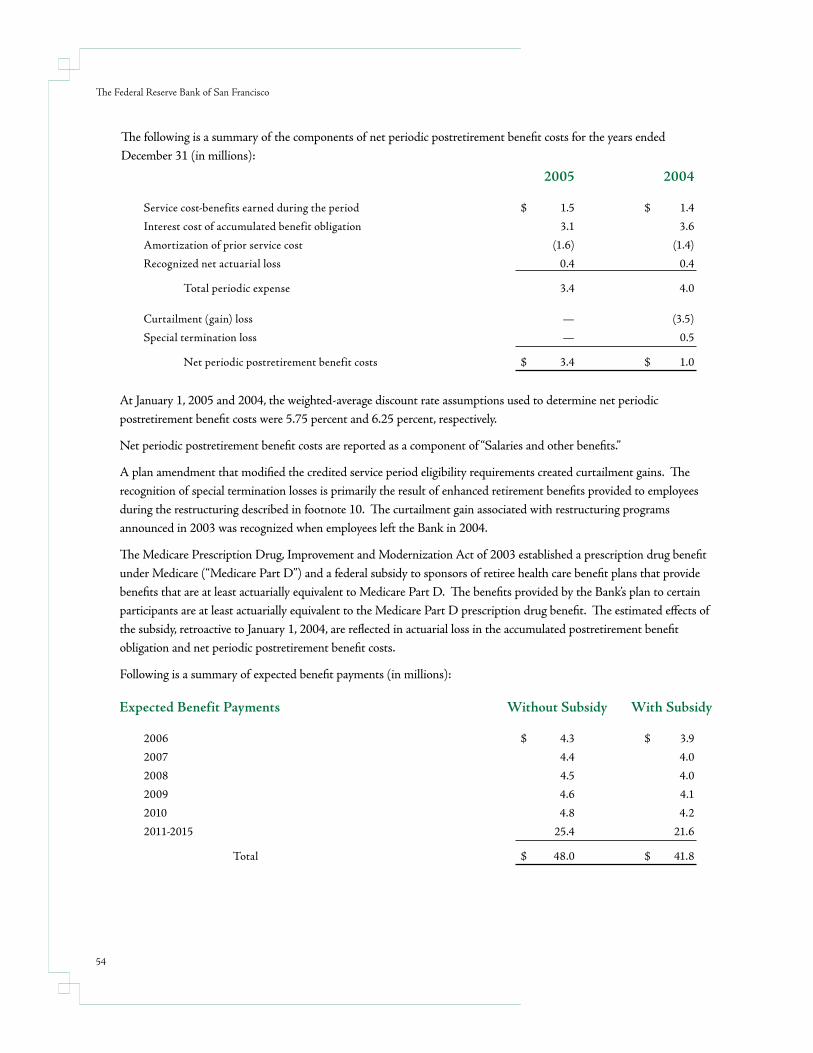
The following is a summary of the components of net periodic postretirement benefit costs for the years ended December 31 (in millions):
2005 2004
Service cost-benefits earned during the period $ 1.5 $ 1.4
Interest cost of accumulated benefit obligation 3.1 3.6
Amortization of prior service cost (1.6) (1.4)
Recognized net actuarial loss 0.4 0.4
Total periodic expense 3.4 4.0
Curtailment (gain) loss — (3.5)
Special termination loss — 0.5
Net periodic postretirement benefit costs $ 3.4 $ 1.0
At January 1, 2005 and 2004, the weighted-average discount rate assumptions used to determine net periodic postretirement benefit costs were 5.75 percent and 6.25 percent, respectively.
Net periodic postretirement benefit costs are reported as a component of “Salaries and other benefits.”
A plan amendment that modified the credited service period eligibility requirements created curtailment gains. The recognition of special termination losses is primarily the result of enhanced retirement benefits provided to employees during the restructuring described in footnote 10. The curtailment gain associated with restructuring programs announced in 2003 was recognized when employees left the Bank in 2004.
The Medicare Prescription Drug, Improvement and Modernization Act of 2003 established a prescription drug benefit under Medicare (“Medicare Part D”) and a federal subsidy to sponsors of retiree health care benefit plans that provide benefits that are at least actuarially equivalent to Medicare Part D. The benefits provided by the Bank’s plan to certain participants are at least actuarially equivalent to the Medicare Part D prescription drug benefit. The estimated effects of the subsidy, retroactive to January 1, 2004, are reflected in actuarial loss in the accumulated postretirement benefit obligation and net periodic postretirement benefit costs.
Following is a summary of expected benefit payments (in millions):
Expected Benefit Payments Without Subsidy With Subsidy
2006 $ 4.3 $ 3.9
2007 4.4 4.0
2008 4.5 4.0
2009 4.6 4.1
2010 4.8 4.2
2011-2015 25.4 21.6
Total $ 48.0 $ 41.8
54
The Federal Reserve Bank of San Francisco
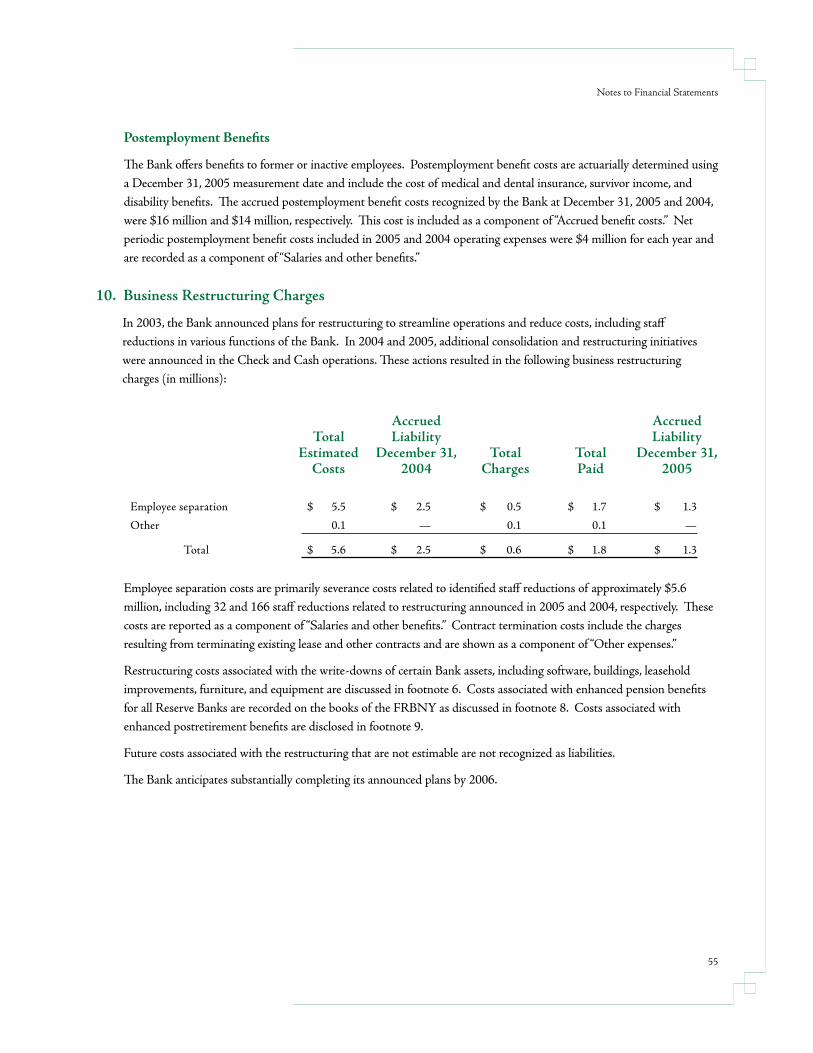
Postemployment Benefits
The Bank offers benefits to former or inactive employees. Postemployment benefit costs are actuarially determined using a December 31, 2005 measurement date and include the cost of medical and dental insurance, survivor income, and disability benefits. The accrued postemployment benefit costs recognized by the Bank at December 31, 2005 and 2004, were $16 million and $14 million, respectively. This cost is included as a component of “Accrued benefit costs.” Net periodic postemployment benefit costs included in 2005 and 2004 operating expenses were $4 million for each year and are recorded as a component of “Salaries and other benefits.”
10. Business Restructuring Charges
In 2003, the Bank announced plans for restructuring to streamline operations and reduce costs, including staff reductions in various functions of the Bank. In 2004 and 2005, additional consolidation and restructuring initiatives were announced in the Check and Cash operations. These actions resulted in the following business restructuring charges (in millions):
Accrued Accrued Total Liability Liability Estimated December 31, Total Total December 31, Costs 2004 Charges Paid 2005
Employee separation $ 5.5 $ 2.5 $ 0.5 $ 1.7 $ 1.3
Other 0.1 — 0.1 0.1 —
Total $ 5.6 $ 2.5 $ 0.6 $ 1.8 $ 1.3
Employee separation costs are primarily severance costs related to identified staff reductions of approximately $5.6 million, including 32 and 166 staff reductions related to restructuring announced in 2005 and 2004, respectively. These costs are reported as a component of “Salaries and other benefits.” Contract termination costs include the charges resulting from terminating existing lease and other contracts and are shown as a component of “Other expenses.”
Restructuring costs associated with the write-downs of certain Bank assets, including software, buildings, leasehold improvements, furniture, and equipment are discussed in footnote 6. Costs associated with enhanced pension benefits for all Reserve Banks are recorded on the books of the FRBNY as discussed in footnote 8. Costs associated with enhanced postretirement benefits are disclosed in footnote 9.
Future costs associated with the restructuring that are not estimable are not recognized as liabilities.
The Bank anticipates substantially completing its announced plans by 2006.
55
Notes to Financial Statements
AcknowledgementsWritersSusan Chan, Daniel Fineman, Reuven Glick, Mark Spiegel
Managing EditorLyndi Beale
Production CoordinatorEd Espiritu
DesignCurran & Connors, Inc./www.curran-connors.com
PhotographyKathryn MacDonald Photography/www.macdonaldphoto.com (pages 2, 15, 19, 30, 31)
Cover PhotoSteve Baxter
Thank you to the following people for their contributions to the production of the 2005 annual report: Javier Jerez, Kathy Laird, Richard Lung, Richard Naylor, Maureen O’Byrne, Luis Pacas, Peggy Speck, Anita Todd, Edwina Wong, Allen Young.
View and order this report online at www.frbsf.org/publications/federalreserve/annual/index.html.
Learn more about the Federal Reserve Bank of San Francisco and the Federal Reserve System at www.frbsf.org. Among the many resources, you’ll find information about the regional and national economies, financial literacy, economic education, consumer banking, and community development.
www.frbsf.org
Federal Reserve Bank of San Francisco 2005 Annual ReportGateway to Asia
San Francisco Headquarters101 Market StreetSan Francisco, California 94105(415) 974-2000
Los Angeles Branch950 South Grand AvenueLos Angeles, California 90015(213) 683-2300
Portland Branch1500 SW First Avenue, Suite 100Portland, Oregon 97201(503) 276-3000
Salt Lake City Branch120 South State StreetSalt Lake City, Utah 84111(801) 322-7900
Seattle Branch1015 Second AvenueSeattle, Washington 98104(206) 343-3600
Phoenix Processing Center1550 North 47th AvenuePhoenix, Arizona 85043(602) 477-7700