Embed Size (px)
Citation preview
DPG-AIDS Welcome
Michelle Roland, LeadOn behalf of DPG-AIDS
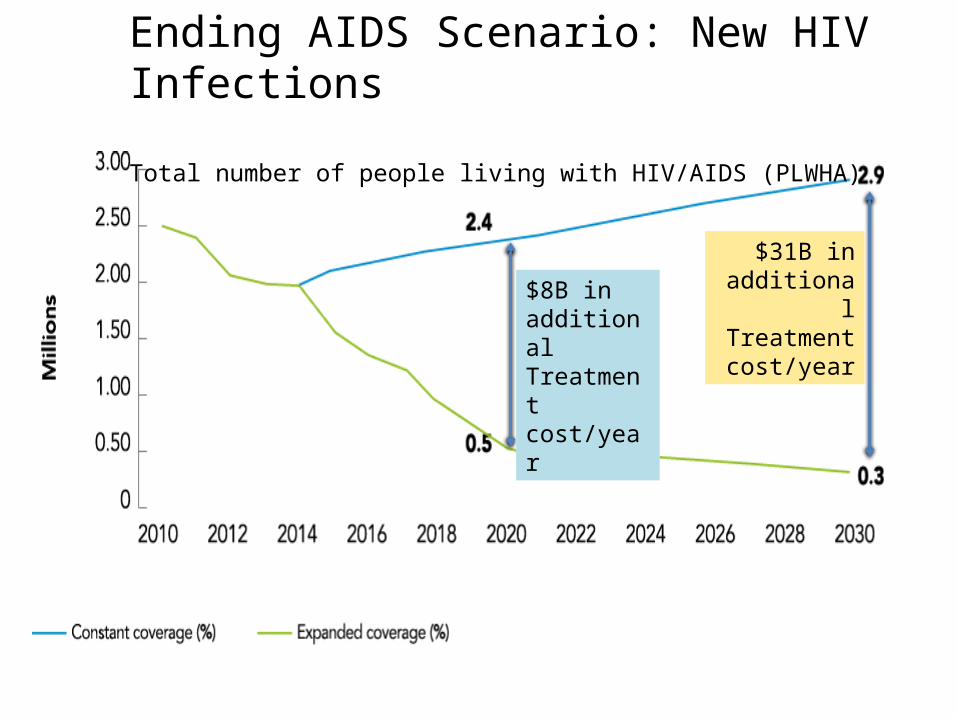
Ending AIDS Scenario: New HIV Infections
Total number of people living with HIV/AIDS (PLWHA)
$8B in additional Treatment cost/year
$31B in additional Treatment cost/year
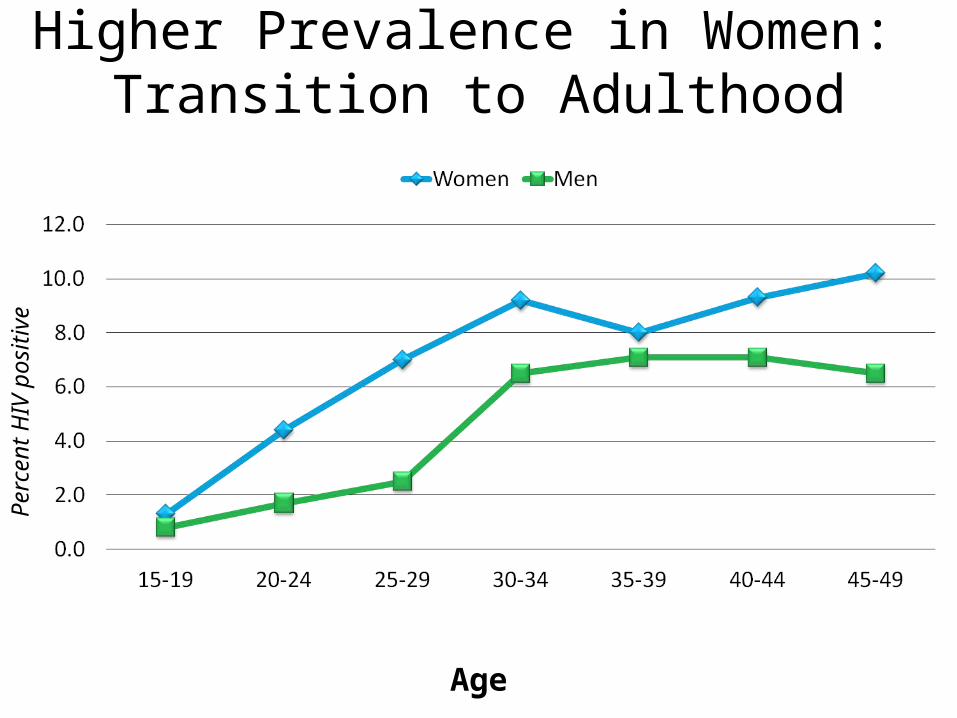
Higher Prevalence in Women: Transition to Adulthood
Age
Perc
ent H
IV p
ositi
ve
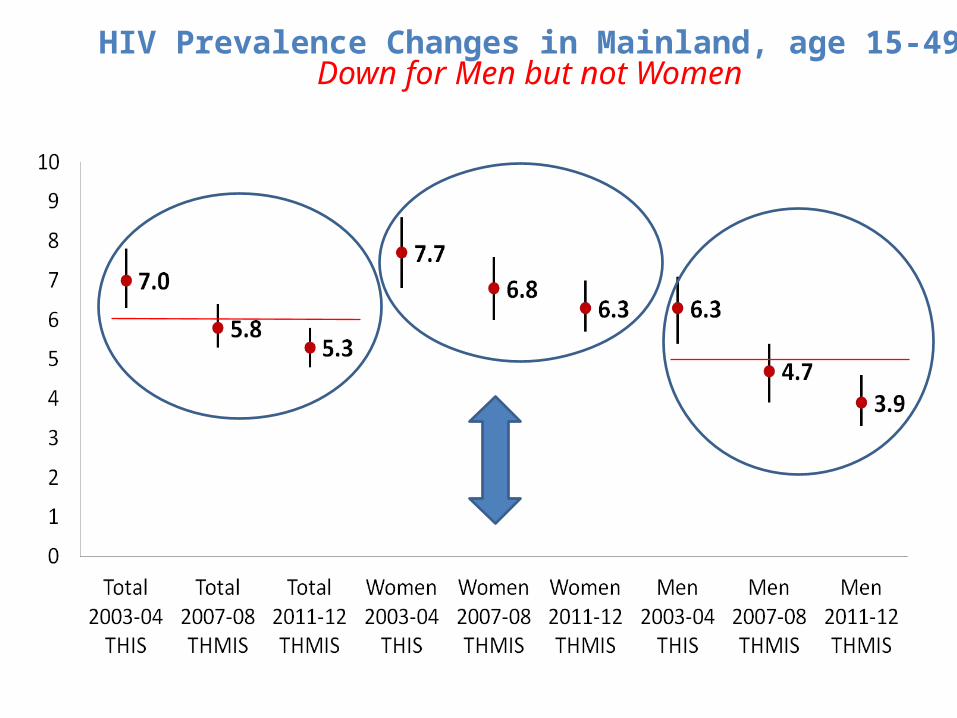
HIV Prevalence Changes in Mainland, age 15-49Down for Men but not Women
Bots
wan
a
Nam
ibia
Swaz
iland
Zam
bia
Zim
babw
e
Sout
h Af
rica
Keny
a
Mal
awi
Ugan
da
Untd
. Rep
. of T
a...
Ethi
opia
Buru
ndi
Ghan
a
Leso
tho
Côte
d'Iv
oire
Cam
eroo
n
Moz
ambi
que
Ango
la
Chad
Dem
. Rep
. of t
h...
Nige
ria
21 p
riorit
y co
unt..
.
0%
1000%
2000%
3000%
4000%
5000%
6000%
7000%
8000%
9000%
10000%
All ages
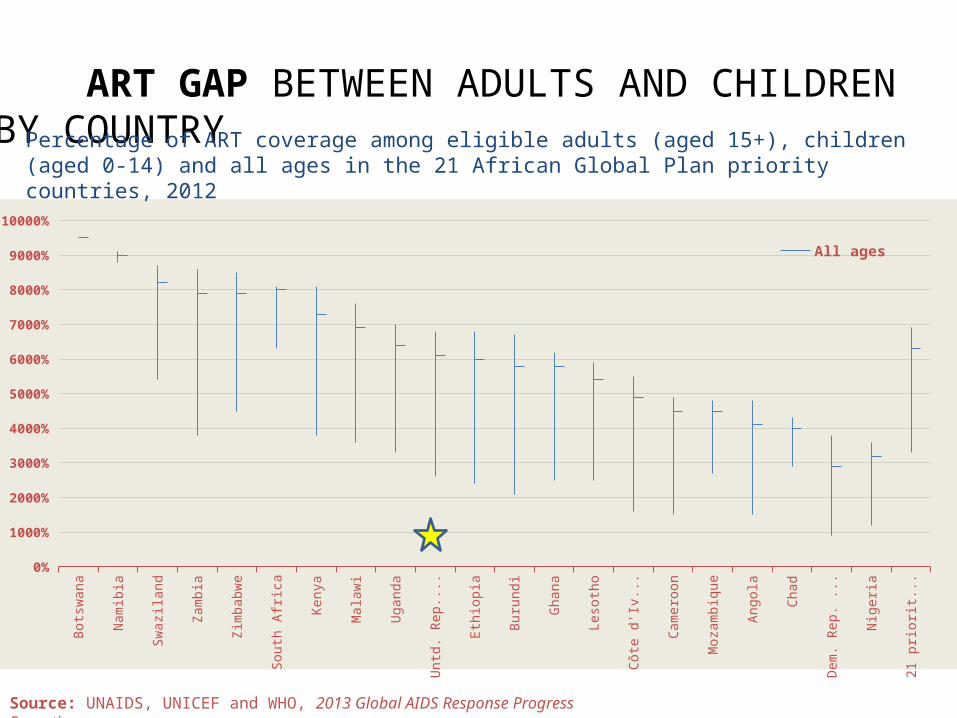
Source: UNAIDS, UNICEF and WHO, 2013 Global AIDS Response Progress Reporting.
ART GAP BETWEEN ADULTS AND CHILDREN BY COUNTRYPercentage of ART coverage among eligible adults (aged 15+), children (aged 0-14) and all ages in the 21 African Global Plan priority countries, 2012
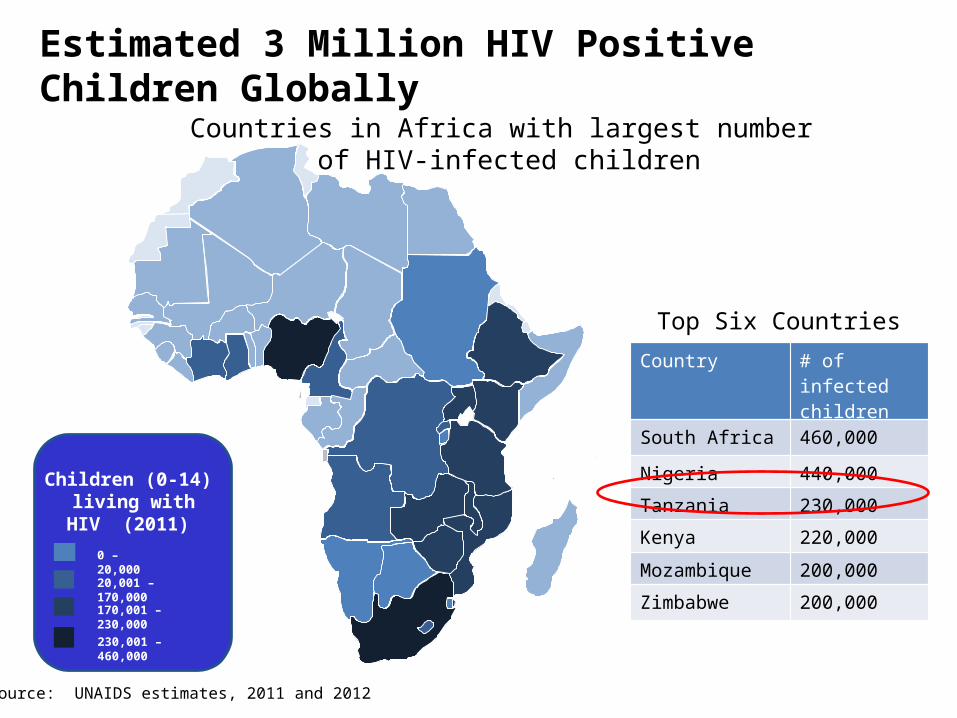
Children (0-14) living with HIV
(2011)
0 – 20,000
230,001 – 460,000
20,001 – 170,000
170,001 – 230,000
Countries in Africa with largest number of HIV-infected children
Country # of infected children
South Africa 460,000
Nigeria 440,000
Tanzania 230,000
Kenya 220,000
Mozambique 200,000
Zimbabwe 200,000
Top Six Countries
Source: UNAIDS estimates, 2011 and 2012
Estimated 3 Million HIV Positive Children Globally
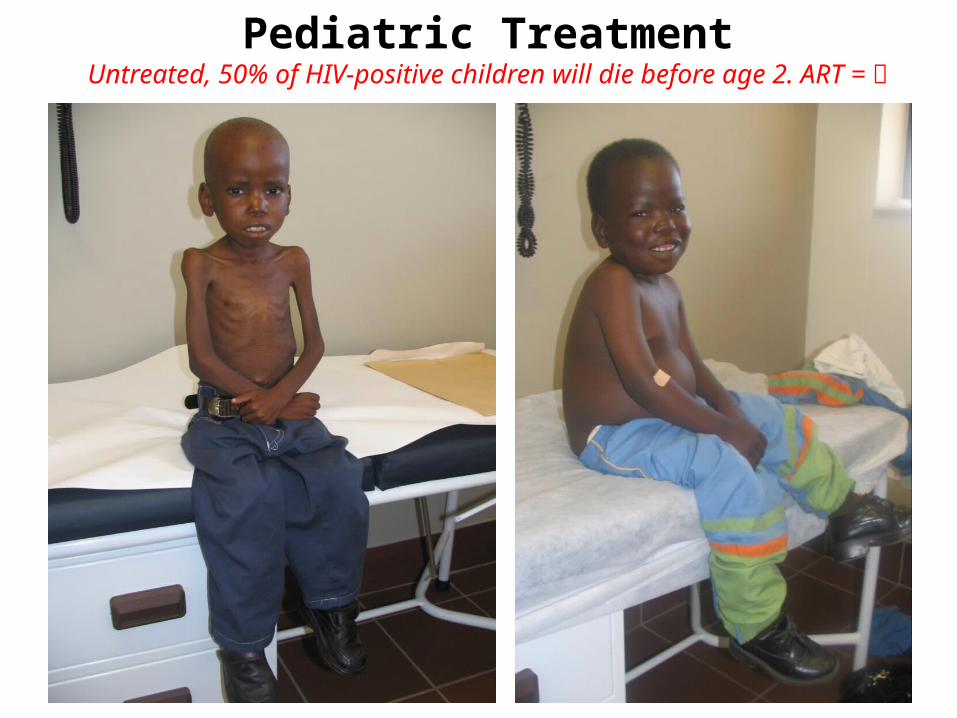
Pediatric TreatmentUntreated, 50% of HIV-positive children will die before age 2. ART =
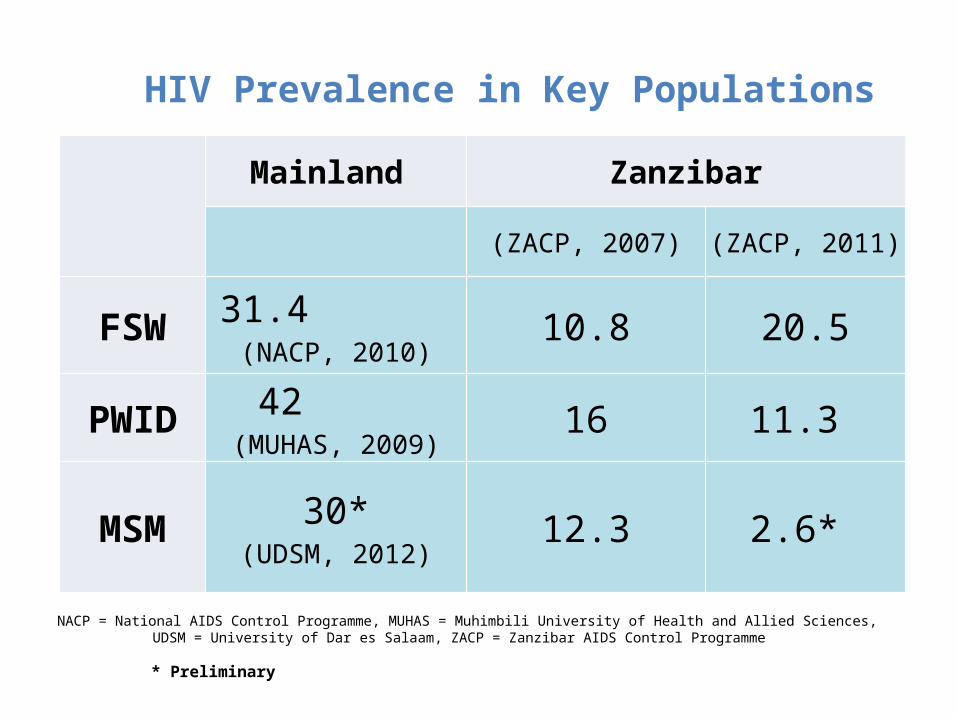
HIV Prevalence in Key Populations
Mainland Zanzibar
(ZACP, 2007) (ZACP, 2011)
FSW 31.4 (NACP, 2010)
10.8 20.5
PWID 42 (MUHAS, 2009)
16 11.3
MSM 30*(UDSM, 2012)
12.3 2.6*
NACP = National AIDS Control Programme, MUHAS = Muhimbili University of Health and Allied Sciences, UDSM = University of Dar es Salaam, ZACP = Zanzibar AIDS Control Programme
* Preliminary
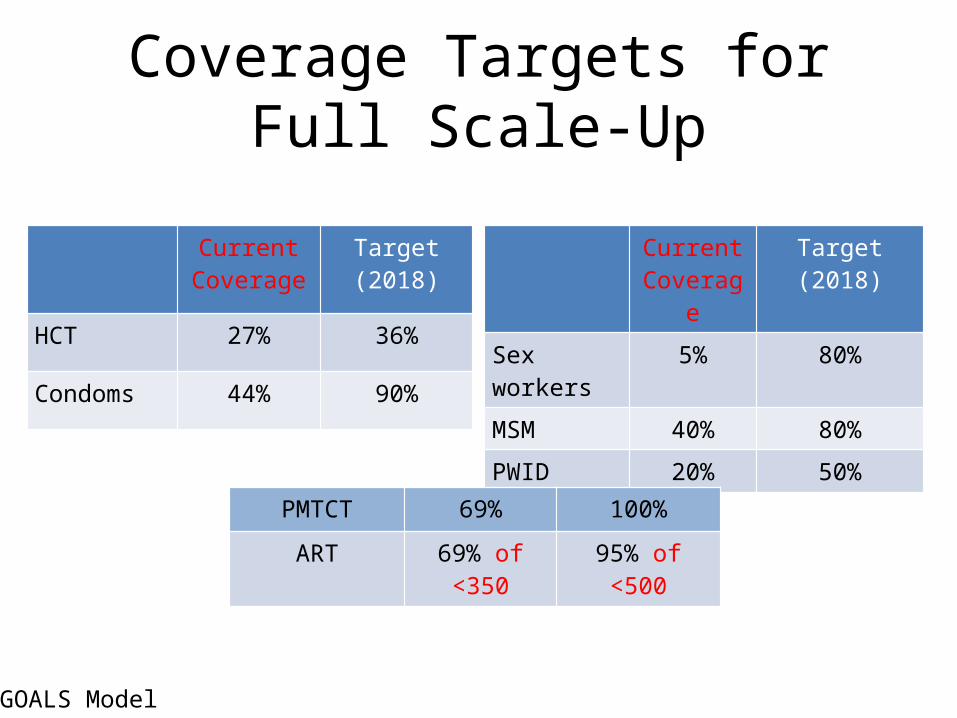
Coverage Targets for Full Scale-Up
Current Coverage
Target (2018)
HCT 27% 36%
Condoms 44% 90%
Current Coverage
Target (2018)
Sex workers 5% 80%
MSM 40% 80%
PWID 20% 50%
PMTCT 69% 100%
ART 69% of <350 95% of <500
GOALS Model
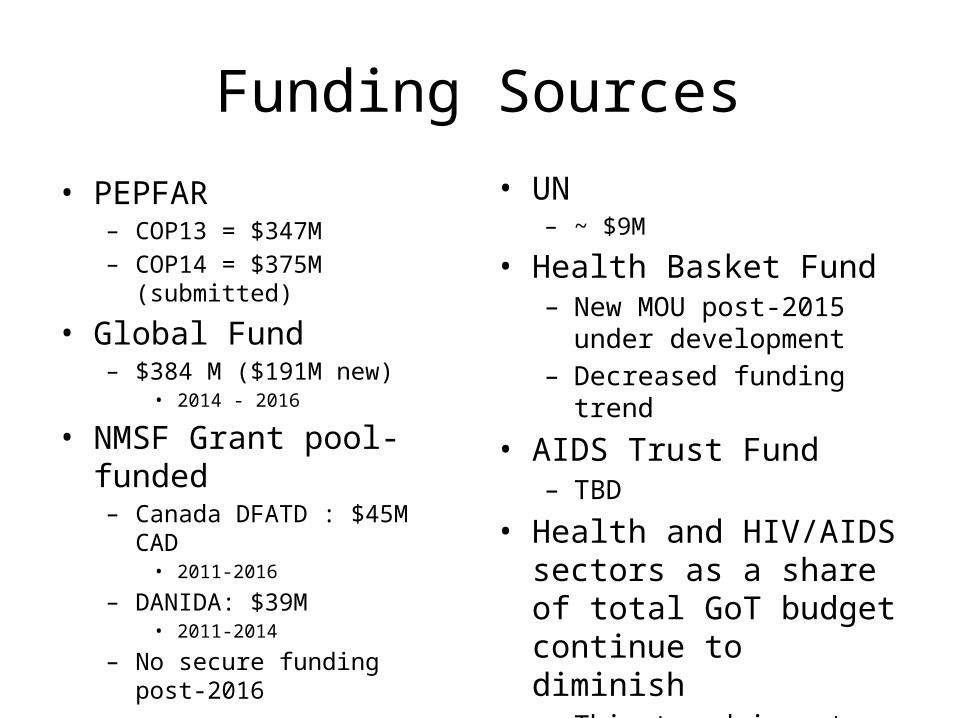
Funding Sources
• PEPFAR– COP13 = $347M– COP14 = $375M (submitted)
• Global Fund– $384 M ($191M new)
• 2014 - 2016
• NMSF Grant pool-funded– Canada DFATD : $45M CAD
• 2011-2016
– DANIDA: $39M• 2011-2014
– No secure funding post-2016
• UN – ~ $9M
• Health Basket Fund– New MOU post-2015 under
development– Decreased funding trend
• AIDS Trust Fund– TBD
• Health and HIV/AIDS sectors as a share of total GoT budget continue to diminish – This trend is not sustainable
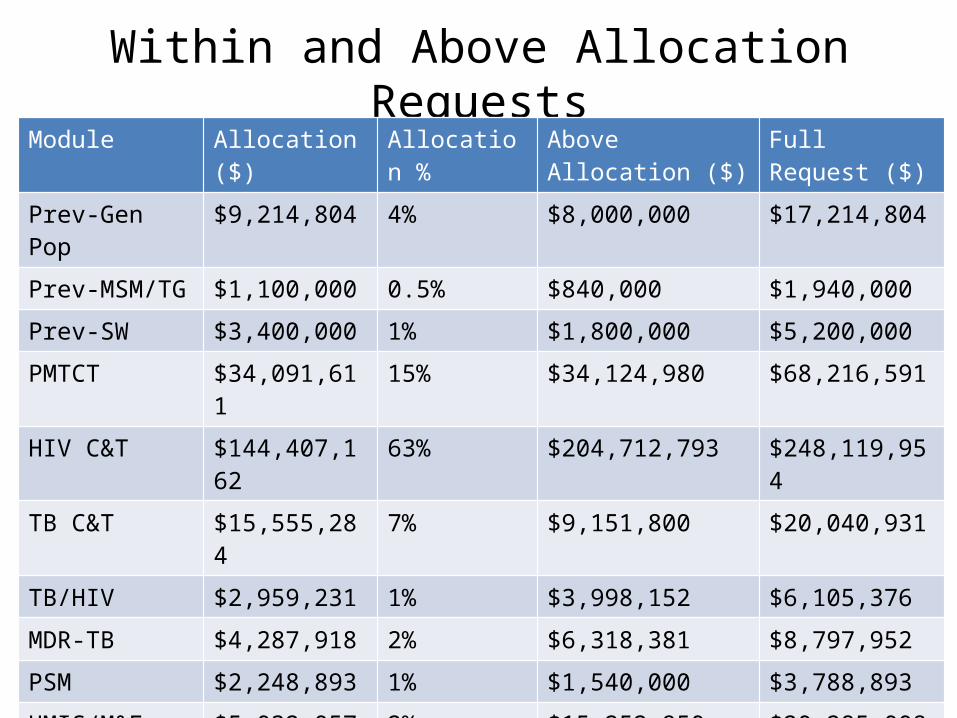
Within and Above Allocation RequestsModule Allocation ($) Allocation % Above Allocation ($) Full Request ($)
Prev-Gen Pop $9,214,804 4% $8,000,000 $17,214,804
Prev-MSM/TG $1,100,000 0.5% $840,000 $1,940,000
Prev-SW $3,400,000 1% $1,800,000 $5,200,000
PMTCT $34,091,611 15% $34,124,980 $68,216,591
HIV C&T $144,407,162 63% $204,712,793 $248,119,954
TB C&T $15,555,284 7% $9,151,800 $20,040,931
TB/HIV $2,959,231 1% $3,998,152 $6,105,376
MDR-TB $4,287,918 2% $6,318,381 $8,797,952
PSM $2,248,893 1% $1,540,000 $3,788,893
HMIS/M&E $5,032,057 2% $15,252,950 $20,285,008
CSS $1,900,000 1% $1,554,000 $3,454,000
Program Mgmt $5,351,553 2% $0 $5,351,553
Total $229,548,513 $287,293,056 (> 50%)
$516,841,568
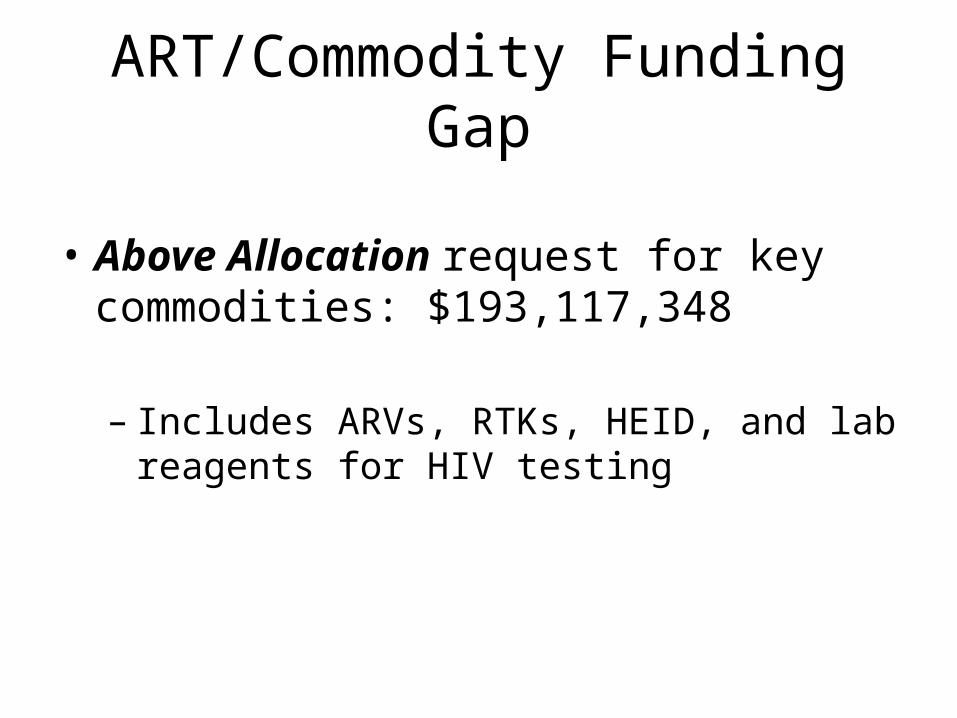
ART/Commodity Funding Gap
• Above Allocation request for key commodities: $193,117,348
– Includes ARVs, RTKs, HEID, and lab reagents for HIV testing

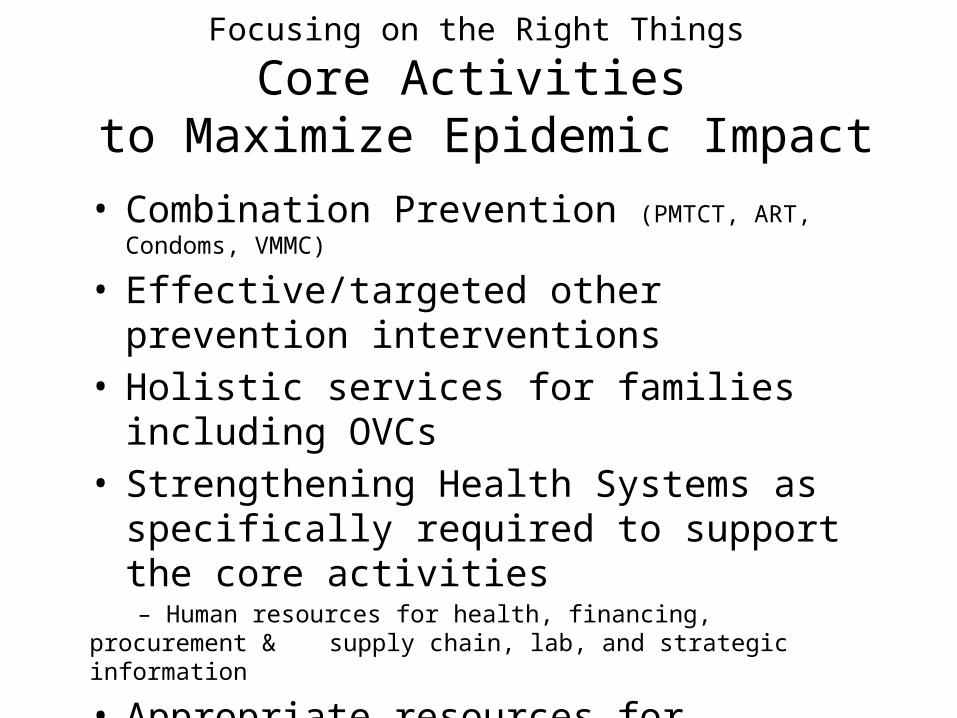
Focusing on the Right Things
Core Activities to Maximize Epidemic Impact
• Combination Prevention (PMTCT, ART, Condoms, VMMC)
• Effective/targeted other prevention interventions• Holistic services for families including OVCs• Strengthening Health Systems as specifically
required to support the core activities – Human resources for health, financing, procurement &
supply chain, lab, and strategic information
• Appropriate resources for disproportionately effected, neglected & hard to reach populations
– Young women and children– Key populations – MSM, FSW, PWID
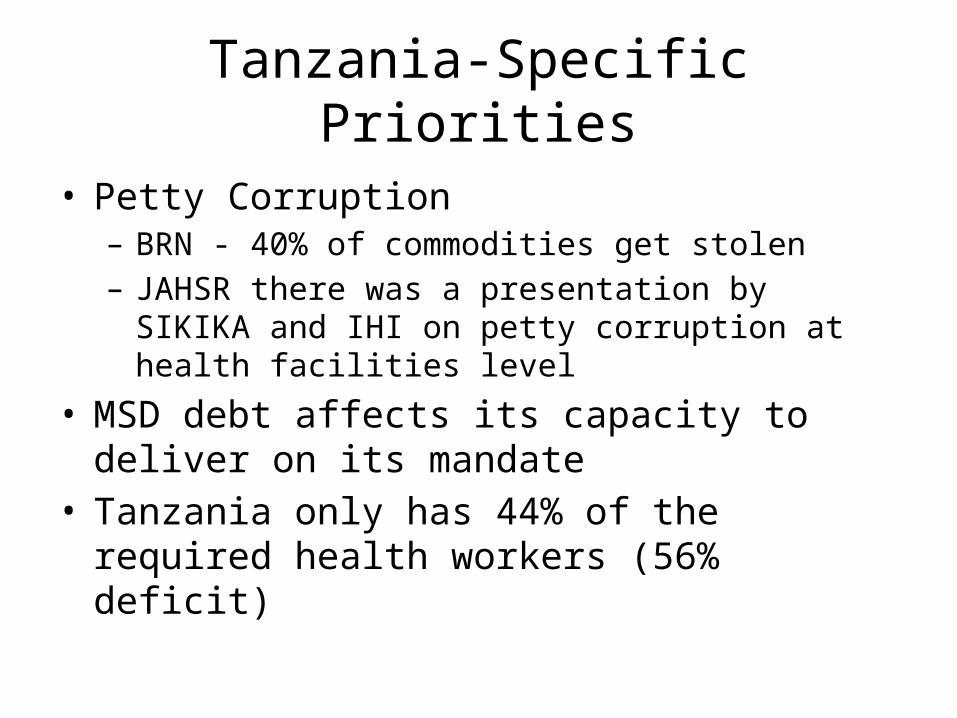
Tanzania-Specific Priorities
• Petty Corruption– BRN - 40% of commodities get stolen – JAHSR there was a presentation by SIKIKA and IHI on petty
corruption at health facilities level
• MSD debt affects its capacity to deliver on its mandate
• Tanzania only has 44% of the required health workers (56% deficit)
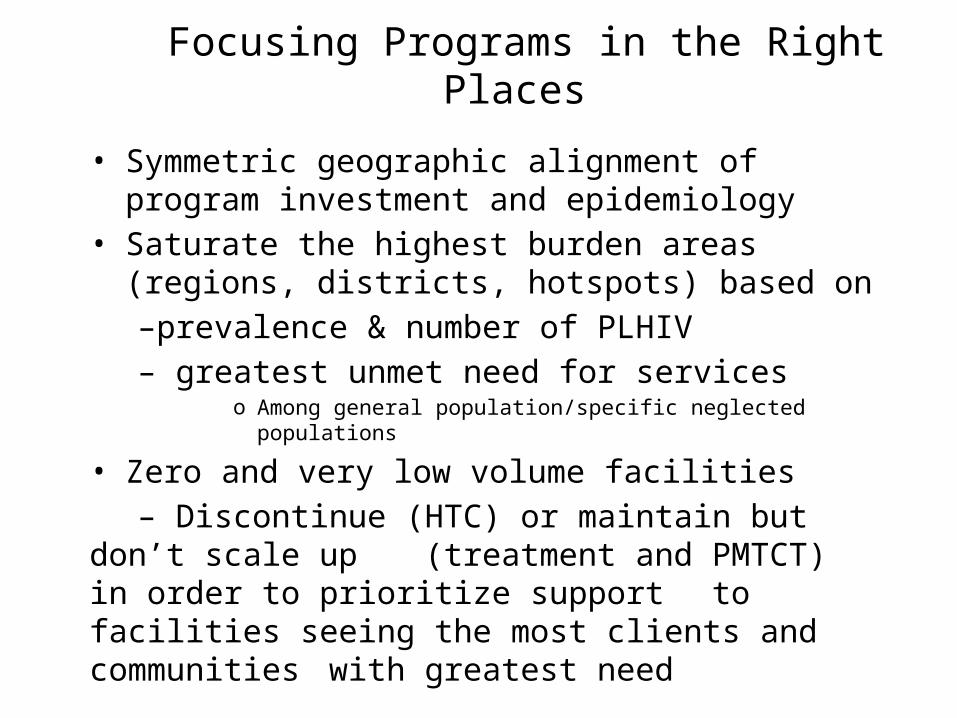
Focusing Programs in the Right Places
• Symmetric geographic alignment of program investment and epidemiology
• Saturate the highest burden areas (regions, districts, hotspots) based on
–prevalence & number of PLHIV – greatest unmet need for services
o Among general population/specific neglected populations
• Zero and very low volume facilities – Discontinue (HTC) or maintain but don’t scale up
(treatment and PMTCT) in order to prioritize support to facilities seeing the most clients and communities with greatest need
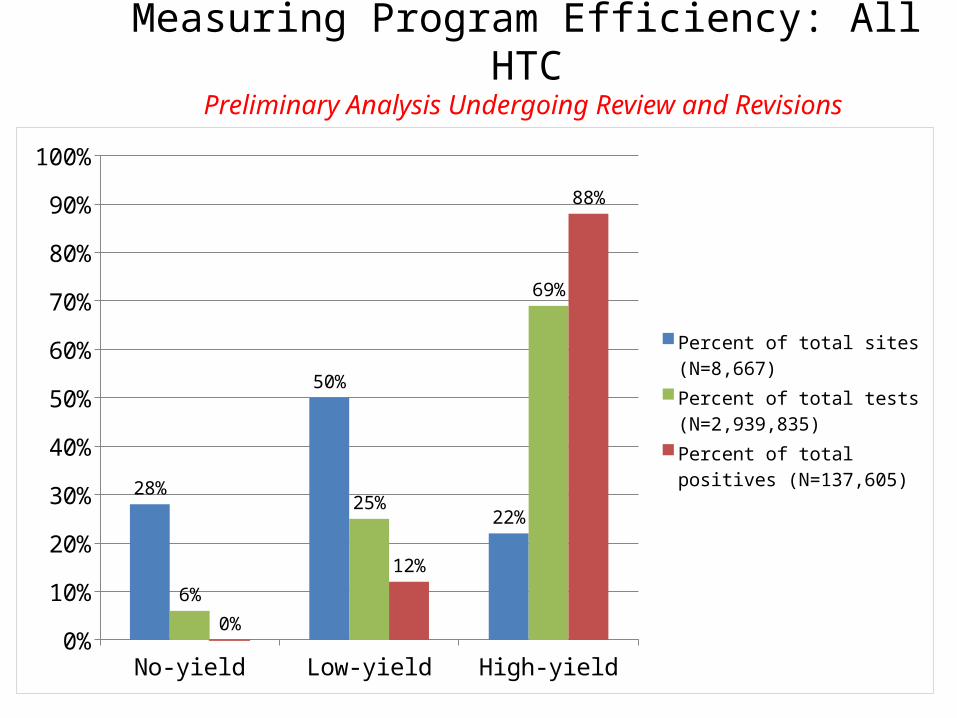
Measuring Program Efficiency: All HTCPreliminary Analysis Undergoing Review and Revisions
No-yield Low-yield High-yield0%
10%
20%
30%
40%
50%
60%
70%
80%
90%
100%
28%
50%
22%
6%
25%
69%
0%
12%
88%
Percent of total sites (N=8,667)Percent of total tests (N=2,939,835)Percent of total positives (N=137,605)

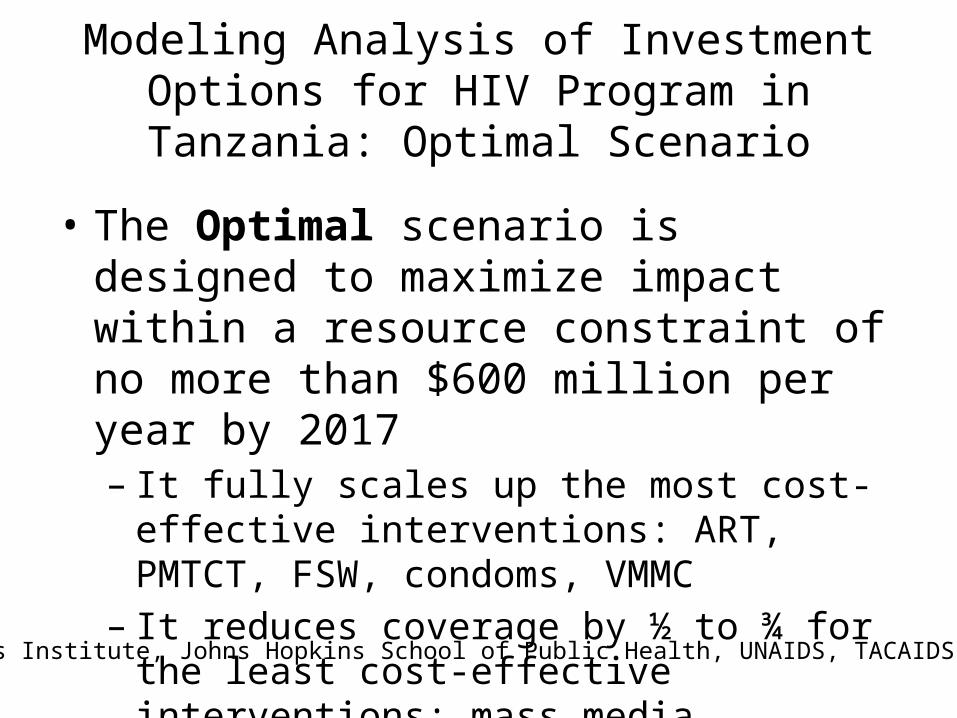
Modeling Analysis of Investment Options for HIV Program in Tanzania: Optimal Scenario
• The Optimal scenario is designed to maximize impact within a resource constraint of no more than $600 million per year by 2017– It fully scales up the most cost-effective
interventions: ART, PMTCT, FSW, condoms, VMMC– It reduces coverage by ½ to ¾ for the least cost-
effective interventions: mass media, workplace, community mobilization
Futures Institute, Johns Hopkins School of Public Health, UNAIDS, TACAIDS
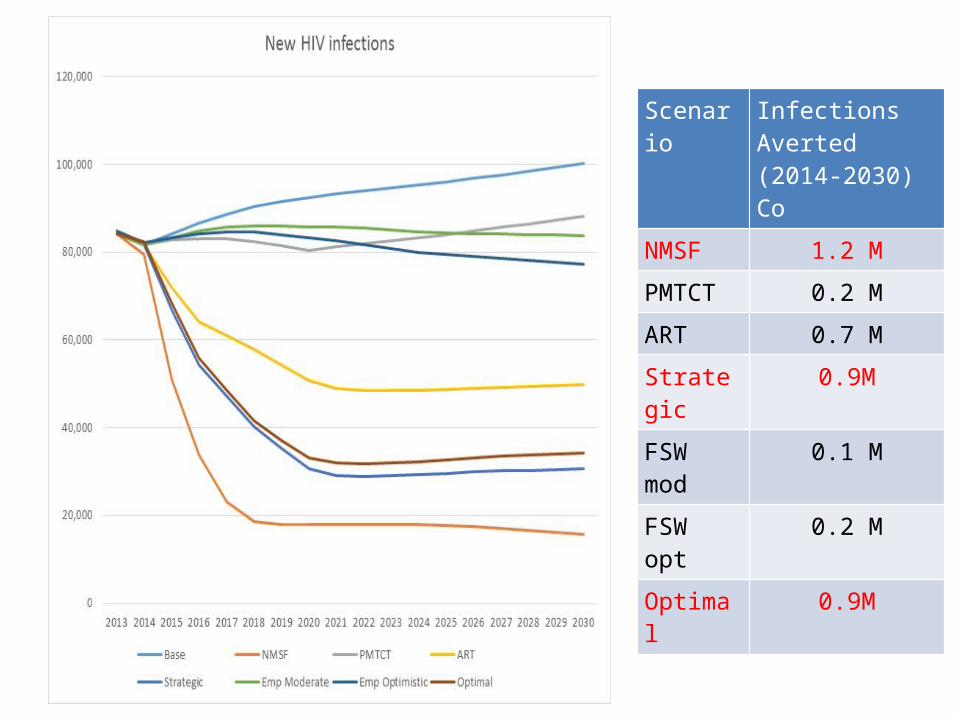
Scenario Infections Averted(2014-2030)Co
NMSF 1.2 M
PMTCT 0.2 M
ART 0.7 M
Strategic 0.9M
FSW mod 0.1 M
FSW opt 0.2 M
Optimal 0.9M
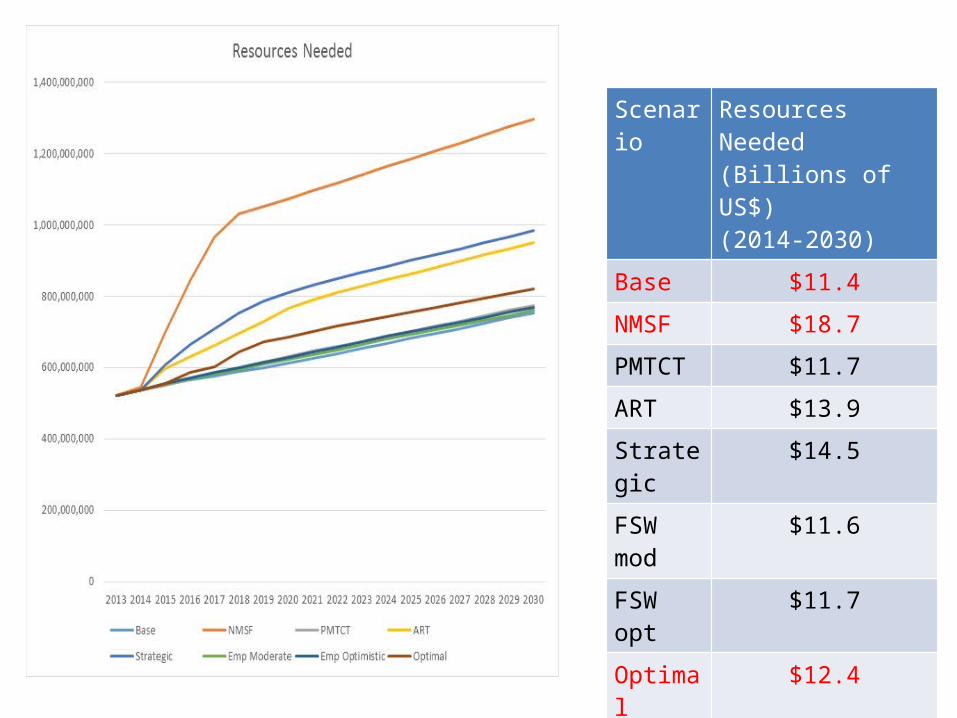
Scenario Resources Needed (Billions of US$)(2014-2030)
Base $11.4
NMSF $18.7
PMTCT $11.7
ART $13.9
Strategic $14.5
FSW mod
$11.6
FSW opt $11.7
Optimal $12.4
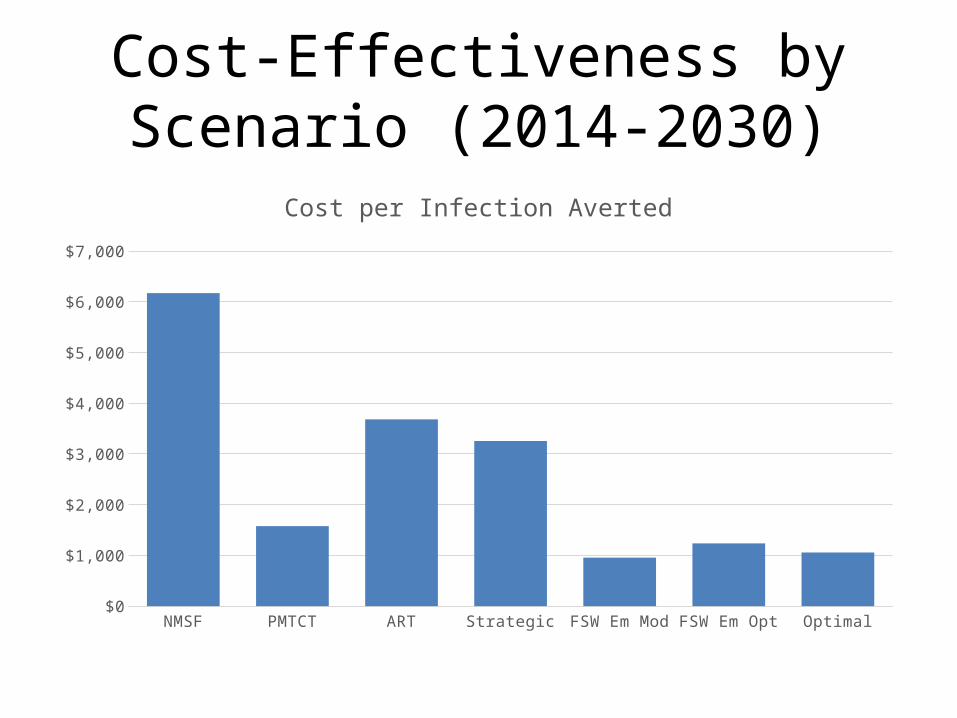
Cost-Effectiveness by Scenario (2014-2030)
NMSF PMTCT ART Strategic FSW Em Mod FSW Em Opt Optimal$0
$1,000
$2,000
$3,000
$4,000
$5,000
$6,000
$7,000
Cost per Infection Averted
Summary
• Resource needs for full scale up would be 150% higher by 2030.
• A focus on the most cost-effective interventions could achieve 80% of the impact with 75% of the resources
• If resources are constrained to increase at about 4% per year– achieve nearly 80% of the impact – only with re-allocating resources away from less cost-
effective intervention to the most cost-effective ones
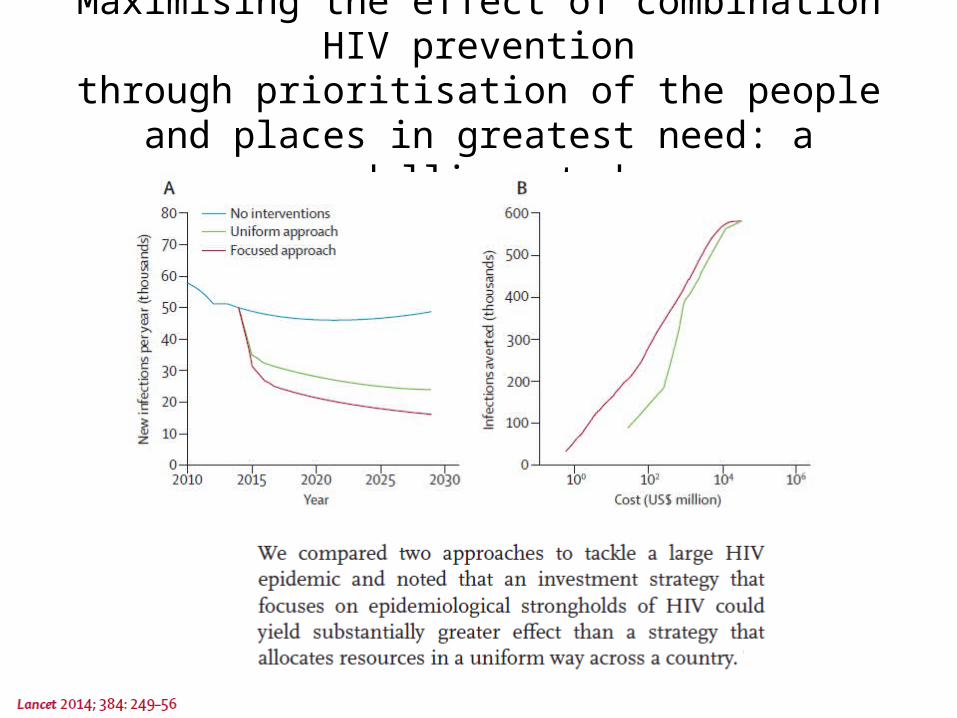
Maximising the effect of combination HIV preventionthrough prioritisation of the people and places in
greatest need: a modelling study
TOGETHER, STRATEGICALLY, WE CAN CONTROL THIS EPIDEMIC
Thank you!


![ICES REPORT 16-01 The DPG methodology applied to different … · 2016. 1. 29. · DPG. The optimal stability DPG methodology [16,18], referred here simply as “DPG”, was originally](https://img.pdfslide.net/doc/110x75/60c9ac6187230b2a2d2cdffd/ices-report-16-01-the-dpg-methodology-applied-to-different-2016-1-29-dpg-the.jpg)