Embed Size (px)
Citation preview
DR. KALLIWODA│RESEARCH
22th February 2007 COMPANY ANALYSIS
EVENT: FIRST RATING
Rating: BUY Risk: low
Sector: Technology Fair Value: € 10.62 Last Price: € 7.55
Payment Systems/Telematics
init: current business situation & perspectives● init is one of the leading enterprises in telematics and
electronic fare collection systems for public transport● init has recently won several public contracts
Source: Deutsche Börse AG
● Good key values support management’s plans for expansion
SWOT COMPANY DESCRIPTION HISTORY & ESTIMATES
+ Long-term sector experience + Strategy of internationalisation + Strong order intake - Price settings through bidding
processes - Dependent from public
budgetary situation
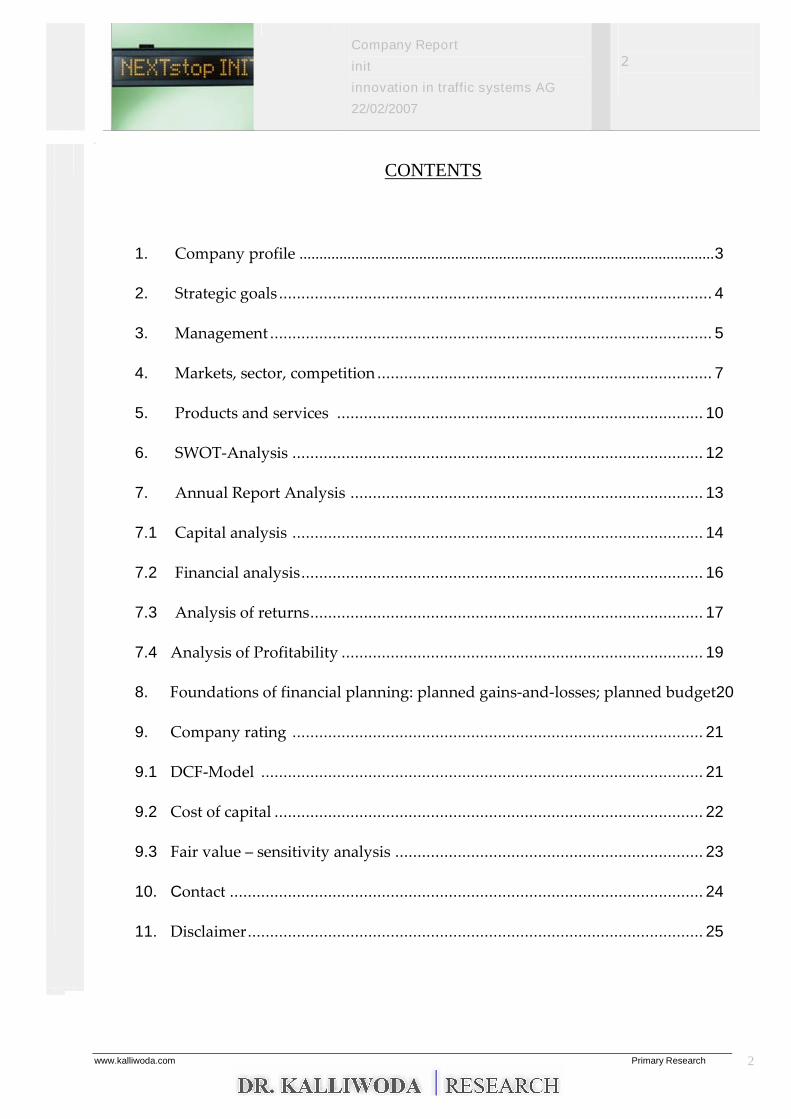
The company’s business is development, production as well as maintenance andsale of computerized transport, traffic andguidance systems. The company isseated in Karlsruhe and currentlyemploys some 205 personnel. init hasbeen in the business since 1983.
Sales- andEBIT-Development
-3,000
-2,000
-1,000
0
1,000
2,000
3,000
4,000
5,000
6,000
Q1
-20
01
Q2
-20
01
Q3
-20
01
Q4
-20
01
Q1
-20
02
Q2
-20
02
Q3
-20
02
Q4
-20
02
Q1
-20
03
Q2
-20
03
Q3
-20
03
Q4
-20
03
Q1
-20
04
Q2
-20
04
Q3
-200
4
Q4
-20
04
Q1
-20
05
Q2
-20
05
Q3
-20
05
Q4
-20
05
Q1
-20
06
Q2
-20
06
Q3
-20
06
Quarters
Sales revenues
EBIT
ANALYST
Dr. Norbert Kalliwoda; CEFADVFA-Analyst Dipl.-Kfm.+49 (69) [email protected]
See alsoKalliwoda Recommendationson Terminal: Bloomberg
ReutersThomson FinancialsJCF Factset
Copyright ® 2007 DR. KALLIWODA | RESEARCH
Figures in EUR 2000 2001 2002 2003 2004 2005 2006e 2007e 2008e 2009e
EPS Dr. Kalliw oda* 0.10 0.20 0.13 0.04 -0.07 0.26 0.32 0.38 0.43 0.46
Revenues 22,889 31,117 31,533 30,012 32,511 33,406 36,589 42,077 45,864 50,909
EBIT 2,003 4,003 1,753 460 -1,494 3,992 4,517 5,885 6,957 7,997
KGV* 55.43 194.00 -110.86 29.85 24.14 20.19 17.96 16.69 17.47 16.24
EBIT-Margin 8.75 12.86 5.56 1.53 -4.60 11.95 12.35 13.99 15.17 15.71
Price (curr) 7.55 Shares out (mln) 10.04
52W high 8.73 First Trading: 24.07.2001
52w low 5.53 Free Float (in %) 48.0 %
Market Cap (mln) 75.8 Weight in GEX 0.1890 %
Last Dividend 0 Level Prime Standard
No. Employees 205 Kürzel IXX
Web Page www.initag.de WKN 575980
*Pro-Forma EPS DATA 00-05 Source: DR.KALLIWODA | RESEARCH
_________________________________________________________________________________________________________
Company Report
init
innovation in traffic systems AG
22/02/2007
2
dd
www.kalliwoda.com Primary Research 2
CONTENTS
1. Company profile ........................................................................................................3
2. Strategic goals ................................................................................................. 4
3. Management ................................................................................................... 5
4. Markets, sector, competition ........................................................................... 7
5. Products and services .................................................................................. 10
6. SWOT-Analysis ............................................................................................ 12
7. Annual Report Analysis ............................................................................... 13
7.1 Capital analysis ............................................................................................ 14
7.2 Financial analysis.......................................................................................... 16
7.3 Analysis of returns........................................................................................ 17
7.4 Analysis of Profitability ................................................................................. 19
8. Foundations of financial planning: planned gains-and-losses; planned budget20
9. Company rating ............................................................................................ 21
9.1 DCF-Model ................................................................................................... 21
9.2 Cost of capital ................................................................................................ 22
9.3 Fair value–sensitivity analysis ..................................................................... 23
10. Contact .......................................................................................................... 24
11. Disclaimer...................................................................................................... 25
Company Report
init
innovation in traffic systems AG
22/02/2007
3
dd
www.kalliwoda.com Primary Research 3
1 Company profile
init Innovation in Traffic Systems AG –respectively INIT GmbH –has been active in the market for
telematics and electronic fare collection systems for public transport since 1983. The company was
founded as an AG in 2000 and the shares of the GmbH were merged into the AG in 2001.
The enterprise is headquartered in Karlsruhe. It first went public in 2001 at the Neue Markt and is
now listed in the Prime Standard after the Neue Markt closed. In the meanwhile the company’s
regional focus has shifted to the international market. The holding has now international presence
with its subsidiaries and offices abroad in the USA, Canada, Great Britain, Spain, Finland and
Sweden.
Founder and chairman of the board of directors, Dr. Gottfried Greschner leads the company. Dr.
Gottfried Greschner at the same time is biggest single shareholder owning 35.6% of the company’s
stock.
init AG functions as a management holding and is responsible for the holding’s controlling and
reporting, strategic planning and investor relations. init holding has some 205 employees.
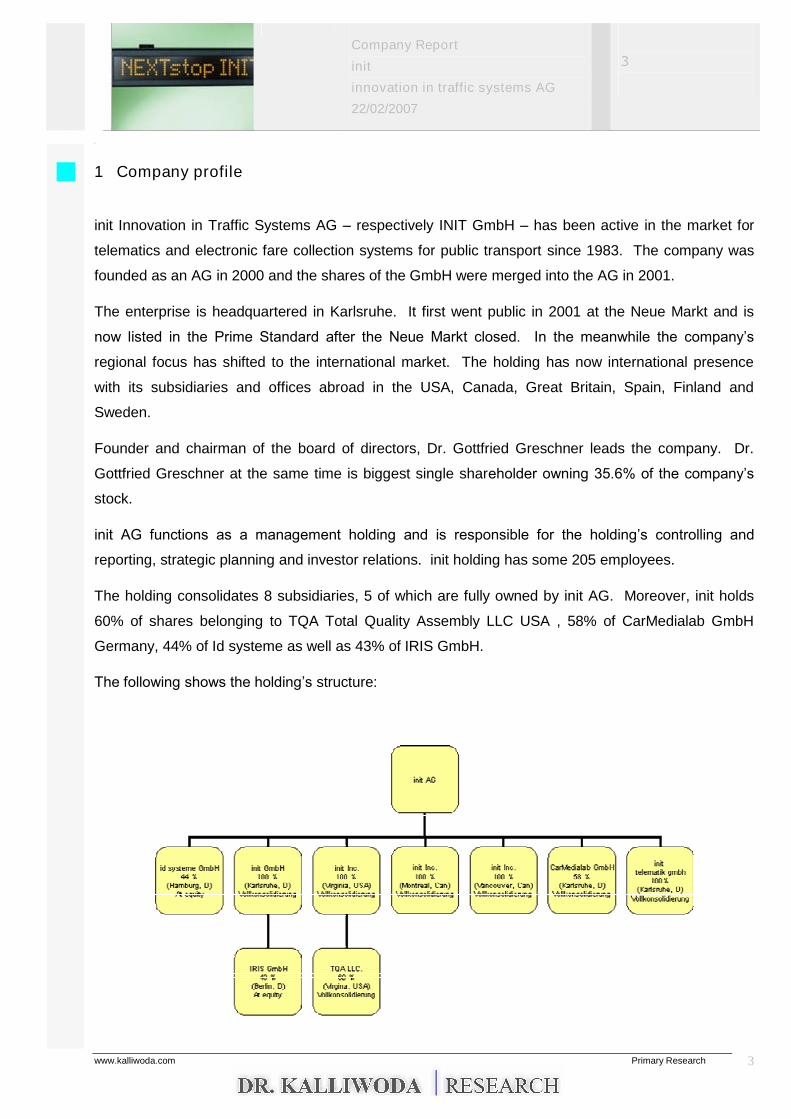
The holding consolidates 8 subsidiaries, 5 of which are fully owned by init AG. Moreover, init holds
60% of shares belonging to TQA Total Quality Assembly LLC USA , 58% of CarMedialab GmbH
Germany, 44% of Id systeme as well as 43% of IRIS GmbH.
The following shows the holding’s structure:
Company Report
init
innovation in traffic systems AG
22/02/2007
4
dd
www.kalliwoda.com Primary Research 4
The company has to offer telematics software and services as well as mobile telematics- and
payment systems. Telematics software and services includes software and hardware for traffic
centers and mobile telematics- and payment systems concerns software and hardware for vehicles.
2 Strategic goals
init aimed for 36mn Euro of sales returns in 2006 and an EBIT of 4.5mn Euro in the same year.
The company further plans to gain more foreign market share with existing and new products and to
speed up international expansion.
init’s point-of-service strategy and close customer ties require opening shop for new offices.
Additionally, management has plans to apply its know-how to similar market segments in telematics
systems. In order to foster expansion into the segment auto and trucks with telematics systems, the
company acquired a 58% stake in camedialab.
The company has a good track record of adjusting to changes in the market and to compensate for
local weaknesses in sales.
According to some init is one of the few companies that offer integrated solutions for all required
services of ÖPNV with one point-of-service and has become the leading provider for innovative
telematics systems and payment systems. The building block structure of the systems offered by init,
allows for customer-fit solutions (platform strategy).
Application and introduction of additional innovative technologies for public transport is another vision
pursued by the company.
Company Report
init
innovation in traffic systems AG
22/02/2007
5
dd
www.kalliwoda.com Primary Research 5
3 Management
The company’s board of directors has the following members:
Dr.-Ing. Gottfried Greschner (born 1946)
init AG is being lead by its founder and Ph.Sc. in eclectronics, Dr. Gottfried Greschner, who is the
chairman of the board of directors. Dr. Greschner first was scientific researcher at University of
Karlsruhe where he worked on computerized operating systems focused on buses and there gained
much of his experience. As chairman, Dr. Greschner is responsible for strategy, supplies and
materials, personnel, contracting and legal.
Dipl.-Inf. Joachim Becker (born 1956)
Joachim Becker is responsible for telematics software and services for init AG as well as operations in
guidance systems for INIT GmbH. Mr. Becker has been with init AG since 1983 and specialized in
traffic during his education in computer technology.
Dipl.-Ing. (FH) Wolfgang Degen (born 1958)
After finishing his degree in communications technology at Politechnics University of Karlsruhe, yet
before joining the INIT GmbH, Mr. Degen worked for quality control and development in medium sized
companies. Mr. Degen has been with the company since 1990 and was named director of init AG in
2001. His responsibilities include mobile telematics and payment systems for traffic centers and
vehicles. Additionally, Mr. Degen has oversight of payment systems, auto systems, testing and
services at INIT GmbH.
Dipl.-Kfm. Bernhard Smolka (born 1961)
Mr. Smolka was named CFO in 2001 and has plenty of years experience in accounting, reporting and
controlling. Before joining the company Mr. Smolka was project manager for a corporate consulting
firm. As CFO, Mr. Smolka has oversight of investor relations, finance, operations and controlling.
Dr. Jürgen Greschner
Dr. Greschner was voted head of sales in 2004. Between 1999 and 2004 he successfully expanded
the North-American business.
In order to limit some liabilities risk the company took out a directors and officers insurance (D&O).
The insurance requires no participatory risk coverage from the members of the board, despite
recommendations of the commission on Corporate Governance Codex.
No restrictions on outside business activities by members of the board have been made contractual.
Company Report
init
innovation in traffic systems AG
22/02/2007
6
dd
www.kalliwoda.com Primary Research 6
In order to permit for shareholders to gain insight into appropriate pay scales for individual members
of the board, the commission on Corporate Governance Codex recommends disclosure of
recompense (German Corporate Governance Codex, 12th June, 2006).
A separate report or individual disclosure of payments to the members of the board in an appendix to
the company’s annual report has not been furnished at this time. Since enactment of the disclosure
laws that provide for the disclosure of recompense on an individual basis as an appendix to the
annual report, the shareholder meeting has the option for easement from this obligation.
The shareholders voted for easement at the last meeting so that there is no disclosure required for
the next five years (opting-out-rule).
Possible conflicts of interest could arise if members of the board hold shares for both the AG and the
GmbH.
Company Report
init
innovation in traffic systems AG
22/02/2007
7
dd
www.kalliwoda.com Primary Research 7
4 Markets, segment, competition
There has been a good 20 years of history in the area of telematics in Germany. Nevertheless, the
segment is still in its early phase of development according to Seppelfricke. Apparently, the segment
has plenty of potential for further growth. Apart from the introduction of traffic guidance systems in
more than 20 cities and metro areas in Germany, intelligent transportation systems have become an
important issue for the segment bus, railway, air traffic and cargo transport. The German Ministry for
traffic, construction and urban development believes there will be an increase in transportation traffic
of about 20% until 2015 and an increase of cargo transportation traffic of about 60%. Considering the
integration of transportation providers within the existing traffic infrastructure, telematics systems play
a key role.
Restructuring of public transport and privatization of some transportation providers characterized
numerous programs in the field of traffic telematics. Some examples are Science program on urban
traffic, development of Delfi (continuous electronic public transportation information –as well as
DEFAS in Bavaria), Regio-Info, RBL-air-to-road, and project RUDY.
The German Ministry for traffic has made a priority to standardize systems Europe-wide. So-called
CEN standards will contribute to make components and centers compatible. Resulting advantage will
be mass production. At the same time providers will have a harder time using monopoly powers to
use own single standards in the market.
Comprising market share in a Europe-wide public contracting competition will be a challenge since
such contracting competitions are slow and expensive. There is an additional risk that a contract will
be limited to manufacture and providing only single components and not integrated systems.
The range of applications for telematics systems includes traffic guidance for highways and cities,
providing public transportation schedules for railway, bus, shipping and air traffic, as well as guidance
of cargo traffic.
Company Report
init
innovation in traffic systems AG
22/02/2007
8
dd
www.kalliwoda.com Primary Research 8
Domestic providers are small and medium sized companies that mostly specialized on some building
block technologies or large companies. One of the large holdings that provide telematics technology
and services is Siemens VDO (former Siemens Switzerland), Deutsche Bahn Systems GmbH and
Vossloh, that are all companies that focus on large projects some for rail and are thus only marginally
considered competitors of init AG.
Development and operations of traffic telematics systems requires a grand amount of know how.
New potential competitors are held back by large investments necessary to enter the market. Another
entry barrier is high client loyalty among the users of the technology. Systems technology needs to
be kept up with the latest components and transmissions systems while at the same time newly
added vehicles need to be equipped. Changing providers is thus costly.
This accounts for high entry and exit barriers that put init AG in a position to maintain in control of
competition.
Each year 15,000 busses are being manufactured for the German market. Assuming 10,000 of these
are used for public transport, and half of these used for public transport require new equipment, an
investment of 30mn Euro is made each year in this segment. A total of 170,000 buses carry the
roads of Germany according to the Bundesverband Deutscher Omnibusunternehmer e.V. Combined
with an average investment for vehicle equipment of 6,000 Euro the total potential of this market is
some 30mn Euro a year. Further investment is required by routing that makes for the largest share of
all expense. In lack of statistics for bus stops in Germany, estimates are rather lump sum. Expenses
for investment per year amount to 30mn Euro in a conservative estimate. As far as cost for software
for fleet, personnel and depot management and traffic center control are to be included the potential
of the market for traffic telemetric systems for buses is about 60mn Euro. Put in context with the
company’s sales init AG’s market share in Germany is at 20%.
Especially in the German market there is some risk that competitors that have been specialized in
passenger traffic and railway transportation will enter the core sector of init AG. Special needs of
transfer management of rail to bus can only be met with complex systems that will probably
overwhelm a medium sized company. In consequence, init is now focusing more on transportation
routes without transfer problems in domestic and international markets.
Company Report
init
innovation in traffic systems AG
22/02/2007
9
dd
www.kalliwoda.com Primary Research 9
The company’s expenditures permit init to remain flexible. The expense ratio for materials exceeds
the expense ratio for personnel. According to the company’s own information init is not dependent on
single suppliers and may at any time change suppliers. Its EBIT margin reached an impressive 12%
in 2005 and will probably repeat the same margin in 2006.
The sector has not seen significant merger activity.
The clients on the other hand are frequently consolidating, mostly large urban, regional and inter-state
transportation providers. Market share of communal transportation providers makes for about 90%.
Future competition in public transportation is going to be shaped by the entry of large international
transportation providers. Among them are Stage Coach, First Group, Arriva+MTL, National Express
and Go Ahead. Therefore, clients will diversify and/or the market focus will shift to large private
transportation providers.
New or other transmissions standards abroad will pose no halt to the implementation of transmissions
and communications systems because there is no one structure being settled as the way to install
these systems.
Company Report
init
innovation in traffic systems AG
22/02/2007
10
dd
www.kalliwoda.com Primary Research 10
5 Products and services
There are two main elements to the portfolio of products and services at init, that are telematic
software and services and mobile telematics and payment systems.
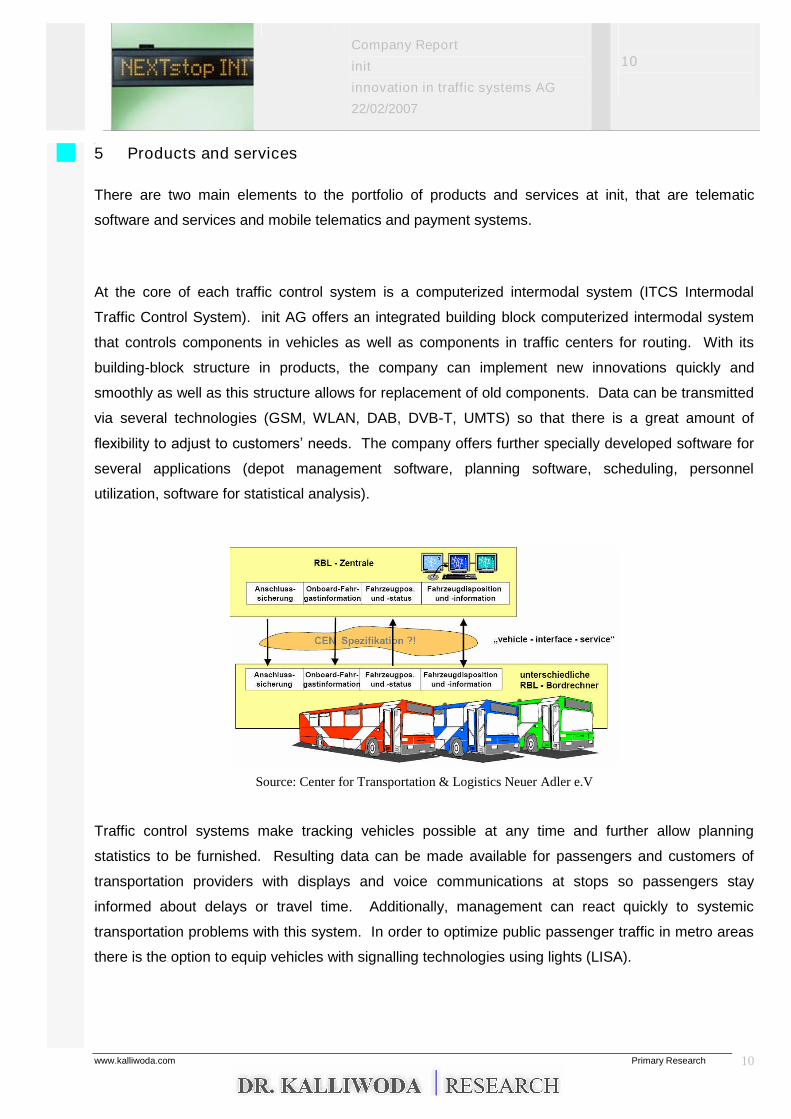
At the core of each traffic control system is a computerized intermodal system (ITCS Intermodal
Traffic Control System). init AG offers an integrated building block computerized intermodal system
that controls components in vehicles as well as components in traffic centers for routing. With its
building-block structure in products, the company can implement new innovations quickly and
smoothly as well as this structure allows for replacement of old components. Data can be transmitted
via several technologies (GSM, WLAN, DAB, DVB-T, UMTS) so that there is a great amount of
flexibility to adjust to customers’ needs.The company offers further specially developed software for
several applications (depot management software, planning software, scheduling, personnel
utilization, software for statistical analysis).
Source: Center for Transportation & Logistics Neuer Adler e.V
Traffic control systems make tracking vehicles possible at any time and further allow planning
statistics to be furnished. Resulting data can be made available for passengers and customers of
transportation providers with displays and voice communications at stops so passengers stay
informed about delays or travel time. Additionally, management can react quickly to systemic
transportation problems with this system. In order to optimize public passenger traffic in metro areas
there is the option to equip vehicles with signalling technologies using lights (LISA).
Company Report
init
innovation in traffic systems AG
22/02/2007
11
dd
www.kalliwoda.com Primary Research 11
Another application of the technology is payment systems for ticketing and fare collection systems.
Fare collection management comes at great expense for transportation providers so that this
application is a cost saver. Swift payment is an absolute must for meeting schedules and high rates
of turn-around. Apart form that, it is important for transportation providers to have a secure and
unproblematic organization. init AG provides several payment systems. Core piece is cash-free
payments and automated ticketing.
For a check on frequencies of traffic at stops and stations init AG offers a passenger tracking system
called MOBILE-APC that enables optimization of routes and comes with transmissions technology
and a software bundle. The system is a help for clients when deciding how to route their
transportation.
Passenger tracking has become a leading issue for public transportation in recent years. Passenger
information is currently being offered before travel, on board and at arrival. For the most part, the
yard-sticks for passenger information are how up-to-date the information is, dependability, how
complete it is and ease-of-use. Passenger information can be communicated via voice recordings or
on displays. init AG offers dynamic passenger information components for less frequented stops as
well as LED passenger information display boards that transmit real-time passenger information on
the application MOBILE-STOPinfo.
Company Report
init
innovation in traffic systems AG
22/02/2007
12
dd
www.kalliwoda.com Primary Research 12
6 SWOT-Analyse
Strengths
The company has several years segment experience. Management adjusted brilliantly to
weak sales in the domestic market in strengthening foreign business
There is a large amount of independence from suppliers
Building-block technology of init systems allows for flexible adaptation of new components or
removal of old components
A solid capital structure permits the company to attain additional capital means for expansion
of business
Numerous new products (PIDvisio, TOUCHbill, GSMvoice, EVENDsmart)
Weaknesses
Dependence on subsidies from clients in the public transportation sector
The company depends more on its exports where currency risks could reduce returns
Cost ratio of sales and distribution has risen continuously in the past five years due to the
opening of additional offices
Potential
Demand for traffic control system using telemetric technology is increasing with more
privatization (in particular development of complex transfer management systems for various
network links of busses, railways and air traffic)
Modern fleet management will also use traffic controlling systems
Transportation providers will be required to adjust even more to passenger needs
Implementation of modern traffic infrastructure systems is not restricted to rural areas
Risks
init’s clients are fairly strong negotiators
init’s concept largely depends on the budgets of public transportation providers
Several large enterprises continue enter the segment traffic control telematics technology.
Company Report
init
innovation in traffic systems AG
22/02/2007
13
dd
www.kalliwoda.com Primary Research 13
7 Annual Report Analysis
A standard return analysis according to a split-return approach is of hardly any use when examining a
holding’s divisional results since most business activity are in the consolidated result. Central aspect
of analysis is thus the group consolidated report that is furnished according to IFRS since 2005.
Gains and losses are being reported for the divisions overall, whereas the consolidated reported sales
in light of its international business.
The report’s analysis applies principles of congruency and accordingly neutralizes transactions
between the corporation and its shareholders (clean surplus accounting). Clean surpluses and the
company’s reserves are eliminated from the analysis.
Political impact of accounting methods for the company’s report as well as capital, finance and returns
is being examined in an impairment test considering the company’s value and the company’s
businesses value. In relation to the company’s capital the company’s value is measured in 10% and
only in approx. 5.2% of the overall capital. In sum this is a positive index for the company.
Estimates and choices for adjustments that were made in connection with latent taxes or changes of
parameters, which may have consequences in increased reserves for pensions, were not neutralized
for analytical purposes.
We consider sceptically that cost of development or the cost of company’s own software is active
positions in the report. However, due to the past practice of including extraordinary decreases of
value we approve for now of the remaining positive potential from activating these costs in the
consolidated report.
We comment positively that amortization costs of R&D exceed (R&D-)capitalization.
Company Report
init
innovation in traffic systems AG
22/02/2007
14
dd
www.kalliwoda.com Primary Research 14
7.1 Analysis of capital
Subject of our examination is the capital structure, capital gains and leverage and liquid means.
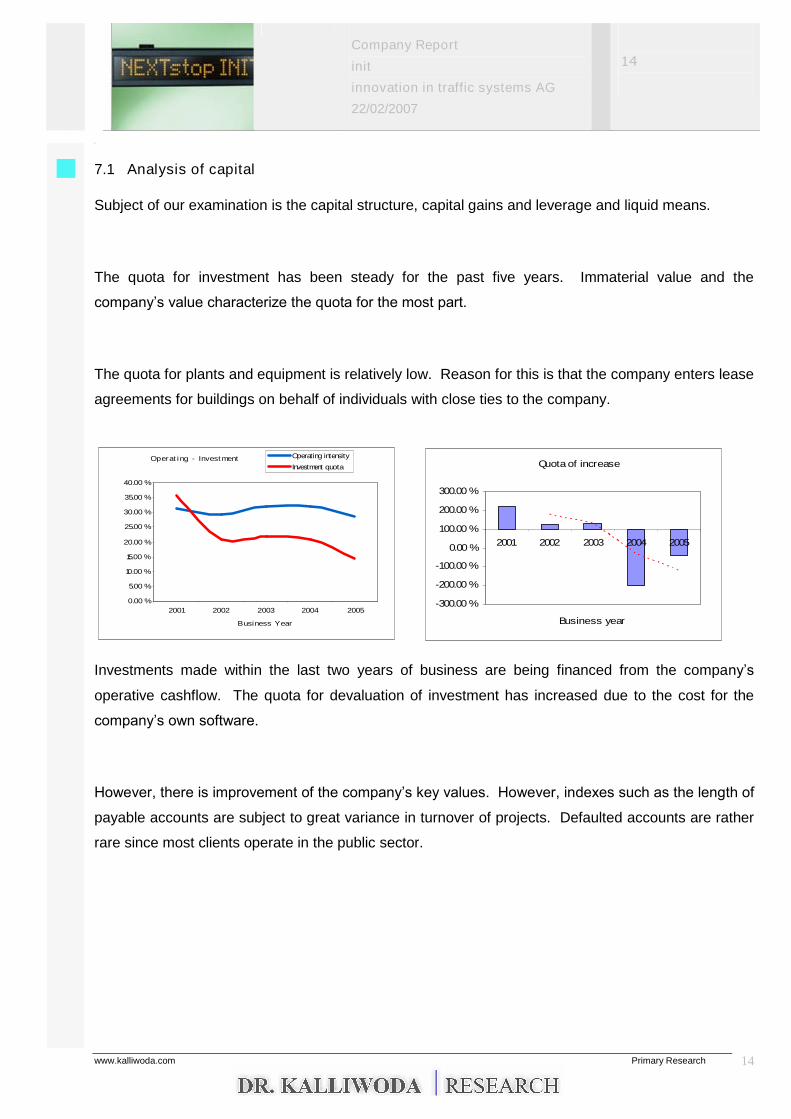
The quota for investment has been steady for the past five years. Immaterial value and the
company’s value characterize the quota for the most part.
The quota for plants and equipment is relatively low. Reason for this is that the company enters lease
agreements for buildings on behalf of individuals with close ties to the company.
Operating - Investment
0.00 %
5.00 %
10.00 %
15.00 %
20.00 %
25.00 %
30.00 %
35.00 %
40.00 %
2001 2002 2003 2004 2005
Business Year
Operating intensity
Investment quota Quota of increase
-300.00 %
-200.00 %
-100.00 %
0.00 %
100.00 %
200.00 %
300.00 %
2001 2002 2003 2004 2005
Business year
Investments made within the last two years of business are being financed from the company’s
operative cashflow. The quota for devaluation of investment has increased due to the cost for the
company’s own software.
However, there is improvement of the company’s key values. However, indexes such as the length of
payable accounts are subject to great variance in turnover of projects. Defaulted accounts are rather
rare since most clients operate in the public sector.
Company Report
init
innovation in traffic systems AG
22/02/2007
15
dd
www.kalliwoda.com Primary Research 15
Net investment capitalization
0.00
0.20
0.40
0.60
0.80
1.00
1.20
1.40
1.60
1.80
2.00
2001 2002 2003 2004 2005
Business year
Key reserves
0
50
100
150
200
2001 2002 2003 2004 2005
Business year
Turn-around reserves
Turn-around accountspayable
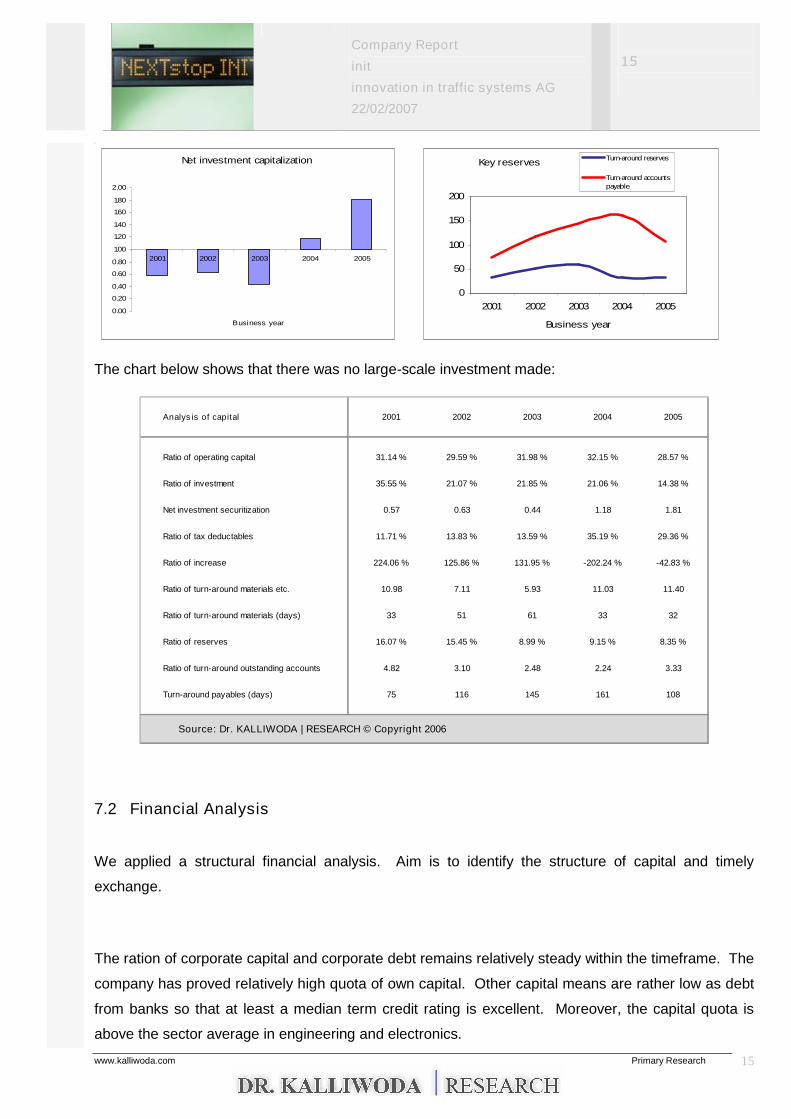
The chart below shows that there was no large-scale investment made:
Analysis of capital 2001 2002 2003 2004 2005
Ratio of operating capital 31.14 % 29.59 % 31.98 % 32.15 % 28.57 %
Ratio of investment 35.55 % 21.07 % 21.85 % 21.06 % 14.38 %
Net investment securitization 0.57 0.63 0.44 1.18 1.81
Ratio of tax deductables 11.71 % 13.83 % 13.59 % 35.19 % 29.36 %
Ratio of increase 224.06 % 125.86 % 131.95 % -202.24 % -42.83 %
Ratio of turn-around materials etc. 10.98 7.11 5.93 11.03 11.40
Ratio of turn-around materials (days) 33 51 61 33 32
Ratio of reserves 16.07 % 15.45 % 8.99 % 9.15 % 8.35 %
Ratio of turn-around outstanding accounts 4.82 3.10 2.48 2.24 3.33
Turn-around payables (days) 75 116 145 161 108
Source: Dr. KALLIWODA | RESEARCH © Copyright 2006
7.2 Financial Analysis
We applied a structural financial analysis. Aim is to identify the structure of capital and timely
exchange.
The ration of corporate capital and corporate debt remains relatively steady within the timeframe. The
company has proved relatively high quota of own capital. Other capital means are rather low as debt
from banks so that at least a median term credit rating is excellent. Moreover, the capital quota is
above the sector average in engineering and electronics.
Company Report
init
innovation in traffic systems AG
22/02/2007
16
dd
www.kalliwoda.com Primary Research 16
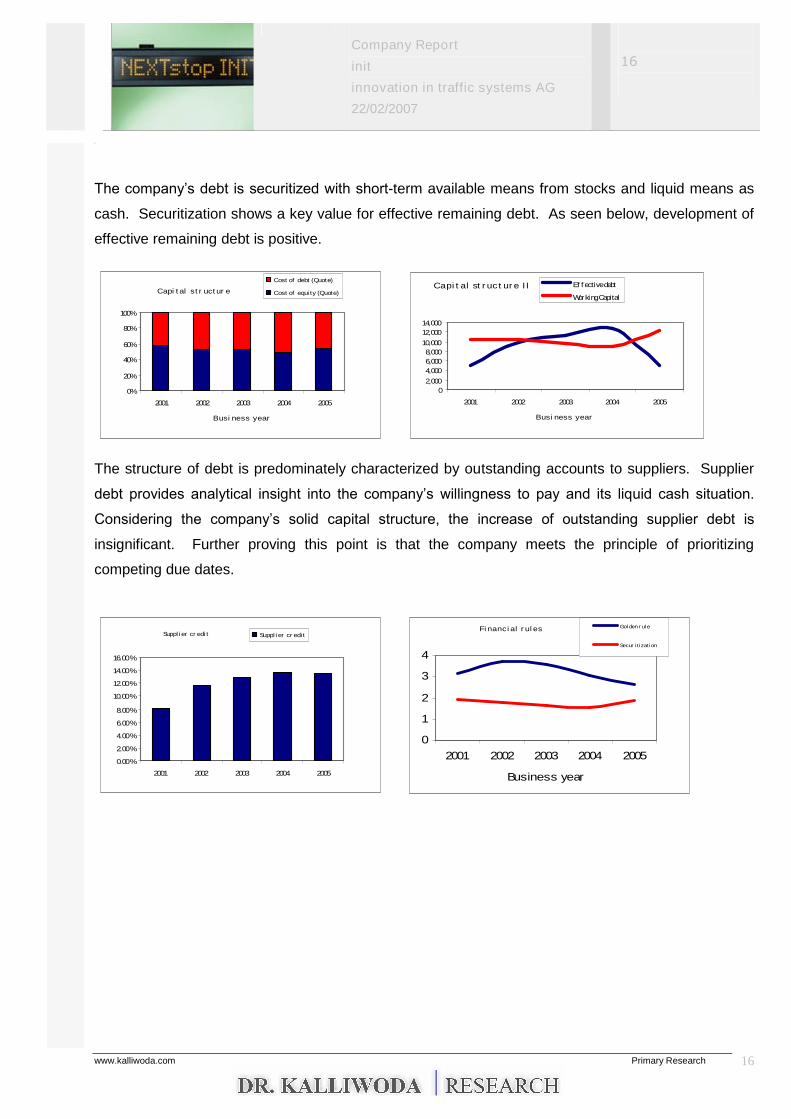
The company’s debt is securitized with short-term available means from stocks and liquid means as
cash. Securitization shows a key value for effective remaining debt. As seen below, development of
effective remaining debt is positive.
Capi tal str uctur e
0%
20%
40%
60%
80%
100%
2001 2002 2003 2004 2005
Busi ness year
Cost of debt (Quote)
Cost of equi ty (Quote)Capit al st ruct ure II
02,0004,0006,0008,000
10,00012,00014,000
2001 2002 2003 2004 2005
Busi ness year
Ef f ectivedebt
WorkingCapital
The structure of debt is predominately characterized by outstanding accounts to suppliers. Supplier
debt provides analytical insight into the company’s willingness to pay and its liquid cash situation.
Considering the company’s solid capital structure, the increase of outstanding supplier debt is
insignificant. Further proving this point is that the company meets the principle of prioritizing
competing due dates.
Suppl ier cr edi t
0.00%
2.00%
4.00%
6.00%
8.00%
10.00%
12.00%
14.00%
16.00%
2001 2002 2003 2004 2005
Suppl i er cr edi tFinancial rules
0
1
2
3
4
2001 2002 2003 2004 2005
Business year
Gol den r ul e
Secur i t i zati on
Company Report
init
innovation in traffic systems AG
22/02/2007
17
dd
www.kalliwoda.com Primary Research 17
Financial Analysis 2001 2002 2003 2004 2005
Capital ratio 58.51 % 52.98 % 52.47 % 49.54 % 53.67 %
debt factor 41.49 % 47.02 % 47.53 % 50.46 % 46.33 %
Effectiv debt 5,007 9,971 11,341 12,806 4,955
Dynamic debt factor 2.5 3.2 4.6 5.4 1.1
Finance capital 0.13 % -0.97 % -2.16 % -3.39 % -2.69 %
Capital reserves 18.33 % 15.88 % 12.84 % 11.30 % 9.09 %
Overall result 162 173 171 158 182
Supply credit 8.02 % 11.63 % 13.01 % 13.60 % 13.54 %
Golden financial (short-term) 2.18 1.80 1.76 1.70 2.01
Golden financial (long-term) 3.16 3.71 3.60 3.07 2.65
Golden report rules 2.24 2.06 1.92 1.87 2.26
Securitization 1.92 1.79 1.64 1.54 1.88
Liquidity 3rd level 2.18 1.80 1.76 1.70 2.01
Working Capital 10,403 10,264 9,633 8,926 12,235
Source: DR. KALLIWODA | RESEARCH © Copyright 2007
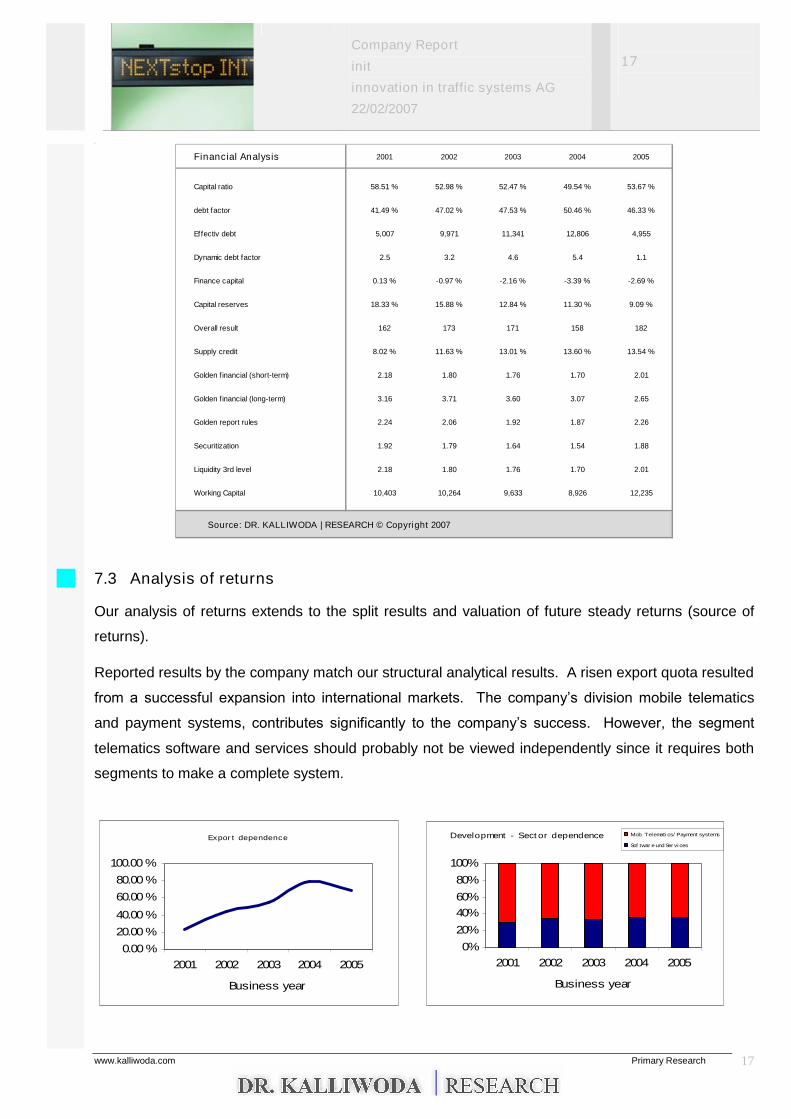
7.3 Analysis of returns
Our analysis of returns extends to the split results and valuation of future steady returns (source of
returns).
Reported results by the company match our structural analytical results. A risen export quota resulted
from a successful expansion into international markets. The company’s division mobile telematics
and payment systems, contributes significantly to the company’s success. However, the segment
telematics software and services should probably not be viewed independently since it requires both
segments to make a complete system.
Export dependence
0.00 %
20.00 %
40.00 %
60.00 %
80.00 %
100.00 %
2001 2002 2003 2004 2005
Business year
Development - Sector dependence
0%
20%
40%60%
80%
100%
2001 2002 2003 2004 2005
Business year
Mob. Telemati cs/ Payment systems
Sof twar eundSer vi ces
Company Report
init
innovation in traffic systems AG
22/02/2007
18
dd
www.kalliwoda.com Primary Research 18
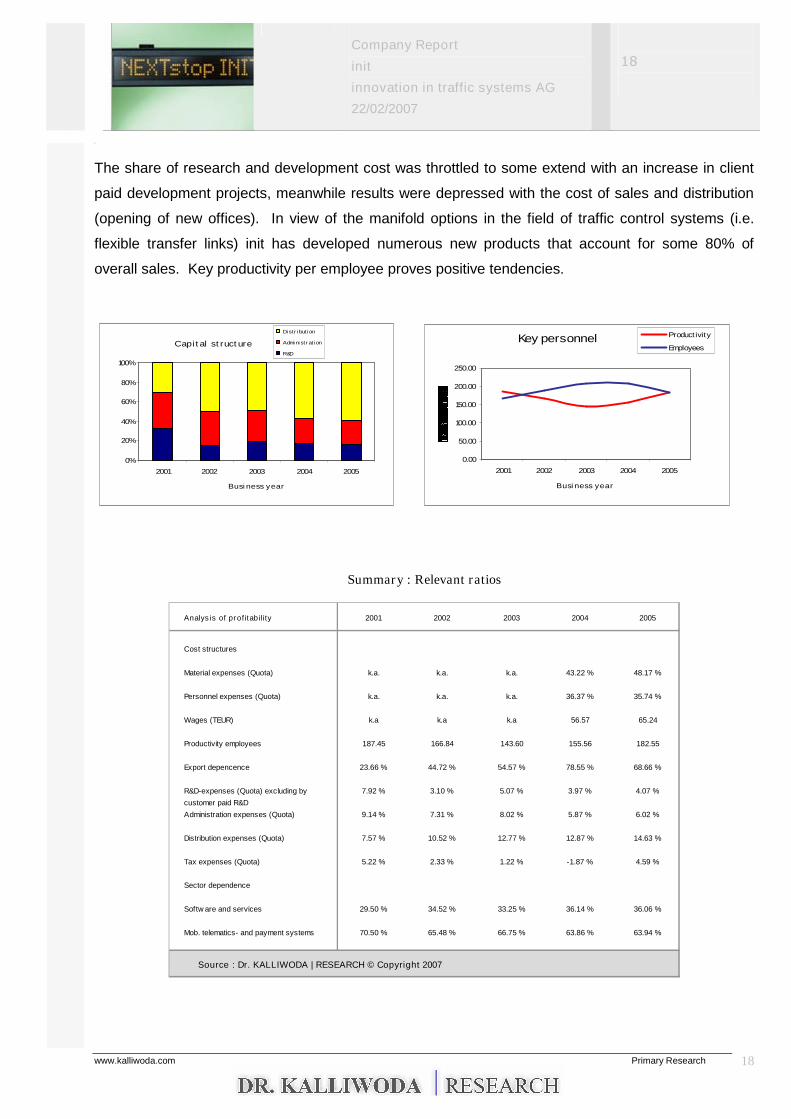
The share of research and development cost was throttled to some extend with an increase in client
paid development projects, meanwhile results were depressed with the cost of sales and distribution
(opening of new offices). In view of the manifold options in the field of traffic control systems (i.e.
flexible transfer links) init has developed numerous new products that account for some 80% of
overall sales. Key productivity per employee proves positive tendencies.
Capital structure
0%
20%
40%
60%
80%
100%
2001 2002 2003 2004 2005
Business year
Distr ibution
Admi ni str ati on
R&D
Key personnel
0.00
50.00
100.00
150.00
200.00
250.00
2001 2002 2003 2004 2005
Business year
Product ivity
Employees
Summary : Relevant ratios
Analysis of profitability 2001 2002 2003 2004 2005
Cost structures
Material expenses (Quota) k.a. k.a. k.a. 43.22 % 48.17 %
Personnel expenses (Quota) k.a. k.a. k.a. 36.37 % 35.74 %
Wages (TEUR) k.a k.a k.a 56.57 65.24
Productivity employees 187.45 166.84 143.60 155.56 182.55
Export depencence 23.66 % 44.72 % 54.57 % 78.55 % 68.66 %
R&D-expenses (Quota) excluding by 7.92 % 3.10 % 5.07 % 3.97 % 4.07 %
customer paid R&D
Administration expenses (Quota) 9.14 % 7.31 % 8.02 % 5.87 % 6.02 %
Distribution expenses (Quota) 7.57 % 10.52 % 12.77 % 12.87 % 14.63 %
Tax expenses (Quota) 5.22 % 2.33 % 1.22 % -1.87 % 4.59 %
Sector dependence
Softw are and services 29.50 % 34.52 % 33.25 % 36.14 % 36.06 %
Mob. telematics- and payment systems 70.50 % 65.48 % 66.75 % 63.86 % 63.94 %
Source : Dr. KALLIWODA | RESEARCH © Copyright 2007
Company Report
init
innovation in traffic systems AG
22/02/2007
19
dd
www.kalliwoda.com Primary Research 19
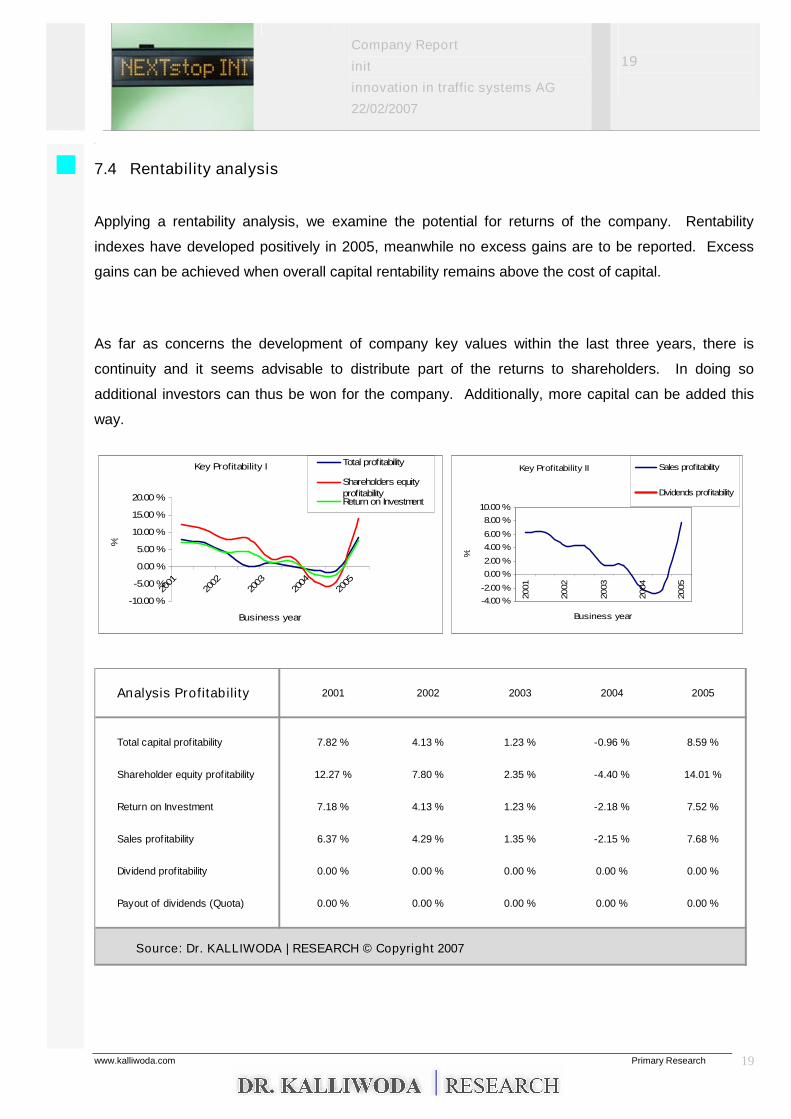
7.4 Rentability analysis
Applying a rentability analysis, we examine the potential for returns of the company. Rentability
indexes have developed positively in 2005, meanwhile no excess gains are to be reported. Excess
gains can be achieved when overall capital rentability remains above the cost of capital.
As far as concerns the development of company key values within the last three years, there is
continuity and it seems advisable to distribute part of the returns to shareholders. In doing so
additional investors can thus be won for the company. Additionally, more capital can be added this
way.
Key Profitability I
-10.00 %
-5.00 %
0.00 %
5.00 %
10.00 %
15.00 %
20.00 %
2001
2002
2003
2004
2005
Business year
%
Total profitability
Shareholders equityprofitabilityReturn on Investment
Key Profitability II
-4.00 %
-2.00 %
0.00 %
2.00 %
4.00 %
6.00 %
8.00 %
10.00 %
2001
2002
2003
2004
2005
Business year
%Sales profitability
Dividends profitability
Analysis Profitability 2001 2002 2003 2004 2005
Total capital prof itability 7.82 % 4.13 % 1.23 % -0.96 % 8.59 %
Shareholder equity prof itability 12.27 % 7.80 % 2.35 % -4.40 % 14.01 %
Return on Investment 7.18 % 4.13 % 1.23 % -2.18 % 7.52 %
Sales prof itability 6.37 % 4.29 % 1.35 % -2.15 % 7.68 %
Dividend profitability 0.00 % 0.00 % 0.00 % 0.00 % 0.00 %
Payout of dividends (Quota) 0.00 % 0.00 % 0.00 % 0.00 % 0.00 %
Source: Dr. KALLIWODA | RESEARCH © Copyright 2007
Company Report
init
innovation in traffic systems AG
22/02/2007
20
dd
www.kalliwoda.com Primary Research 20
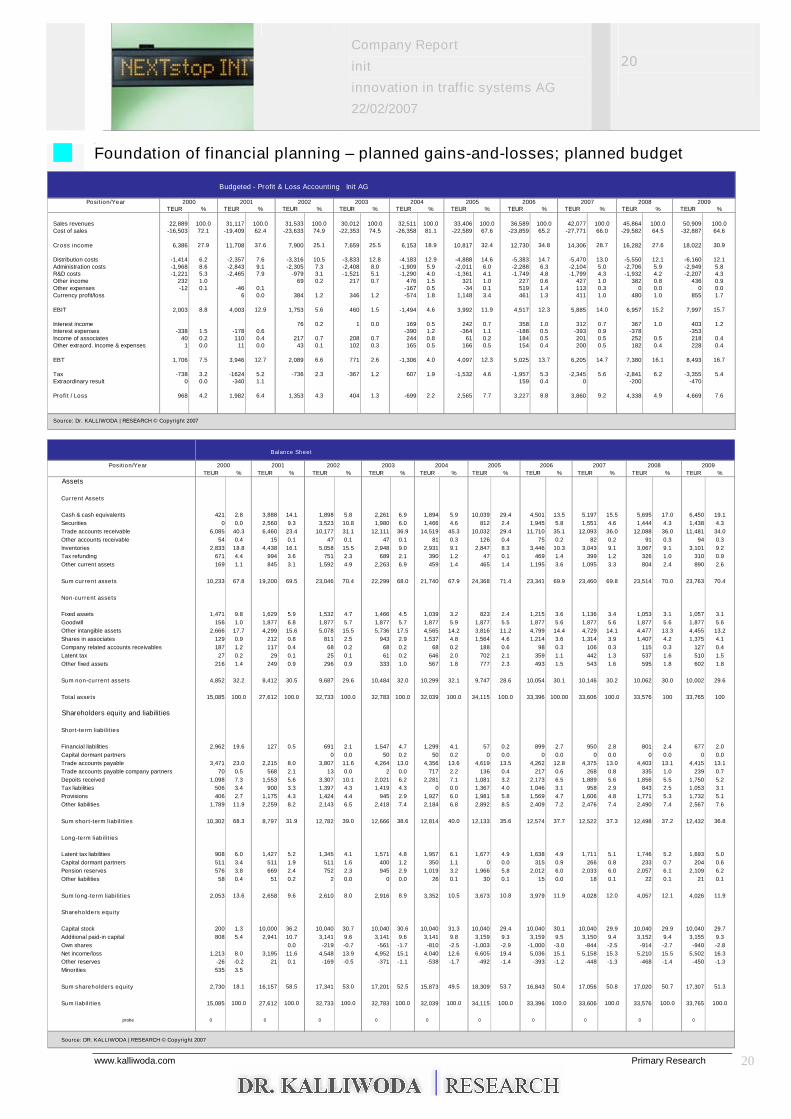
Foundation of financial planning –planned gains-and-losses; planned budget
Budgeted - Profit & Loss Accounting Init AG
Position/YearTEUR % TEUR % TEUR % TEUR % TEUR % TEUR % TEUR % TEUR % TEUR % TEUR %
Sales revenues 22,889 100.0 31,117 100.0 31,533 100.0 30,012 100.0 32,511 100.0 33,406 100.0 36,589 100.0 42,077 100.0 45,864 100.0 50,909 100.0Cost of sales -16,503 72.1 -19,409 62.4 -23,633 74.9 -22,353 74.5 -26,358 81.1 -22,589 67.6 -23,859 65.2 -27,771 66.0 -29,582 64.5 -32,887 64.6
Cross income 6,386 27.9 11,708 37.6 7,900 25.1 7,659 25.5 6,153 18.9 10,817 32.4 12,730 34.8 14,306 28.7 16,282 27.6 18,022 30.9
Distribution costs -1,414 6.2 -2,357 7.6 -3,316 10.5 -3,833 12.8 -4,183 12.9 -4,888 14.6 -5,383 14.7 -5,470 13.0 -5,550 12.1 -6,160 12.1Administration costs -1,968 8.6 -2,843 9.1 -2,305 7.3 -2,408 8.0 -1,909 5.9 -2,011 6.0 -2,288 6.3 -2,104 5.0 -2,706 5.9 -2,949 5.8R&D costs -1,221 5.3 -2,465 7.9 -979 3.1 -1,521 5.1 -1,290 4.0 -1,361 4.1 -1,749 4.8 -1,799 4.3 -1,932 4.2 -2,207 4.3Other income 232 1.0 69 0.2 217 0.7 476 1.5 321 1.0 227 0.6 427 1.0 382 0.8 436 0.9Other expenses -12 0.1 -46 0.1 -167 0.5 -34 0.1 519 1.4 113 0.3 0 0.0 0 0.0Currency profit/loss 6 0.0 384 1.2 346 1.2 -574 1.8 1,148 3.4 461 1.3 411 1.0 480 1.0 855 1.7
EBIT 2,003 8.8 4,003 12.9 1,753 5.6 460 1.5 -1,494 4.6 3,992 11.9 4,517 12.3 5,885 14.0 6,957 15.2 7,997 15.7
Interest income 76 0.2 1 0.0 169 0.5 242 0.7 358 1.0 312 0.7 367 1.0 403 1.2Interest expenses -338 1.5 -178 0.6 -390 1.2 -364 1.1 -188 0.5 -393 0.9 -378 -353Income of associates 40 0.2 110 0.4 217 0.7 208 0.7 244 0.8 61 0.2 184 0.5 201 0.5 252 0.5 218 0.4Other extraord. Income & expenses 1 0.0 11 0.0 43 0.1 102 0.3 165 0.5 166 0.5 154 0.4 200 0.5 182 0.4 228 0.4
EBT 1,706 7.5 3,946 12.7 2,089 6.6 771 2.6 -1,306 4.0 4,097 12.3 5,025 13.7 6,205 14.7 7,380 16.1 8,493 16.7
Tax -738 3.2 -1624 5.2 -736 2.3 -367 1.2 607 1.9 -1,532 4.6 -1,957 5.3 -2,345 5.6 -2,841 6.2 -3,355 5.4Extraordinary result 0 0.0 -340 1.1 159 0.4 0 -200 -470
Profit / Loss 968 4.2 1,982 6.4 1,353 4.3 404 1.3 -699 2.2 2,565 7.7 3,227 8.8 3,860 9.2 4,338 4.9 4,669 7.6
Source: Dr. KALLIWODA | RESEARCH © Copyright 2007
2000 2001 2002 2003 2009200620052004 2007 2008
Balance Sheet
Position/YearTEUR % TEUR % TEUR % TEUR % TEUR % TEUR % TEUR % TEUR % TEUR % TEUR %
Assets
Current Assets
Cash & cash equivalents 421 2.8 3,888 14.1 1,898 5.8 2,261 6.9 1,894 5.9 10,039 29.4 4,501 13.5 5,197 15.5 5,695 17.0 6,450 19.1Securities 0 0.0 2,560 9.3 3,523 10.8 1,980 6.0 1,466 4.6 812 2.4 1,945 5.8 1,551 4.6 1,444 4.3 1,438 4.3Trade accounts receivable 6,085 40.3 6,460 23.4 10,177 31.1 12,111 36.9 14,519 45.3 10,032 29.4 11,710 35.1 12,093 36.0 12,088 36.0 11,481 34.0Other accounts receivable 54 0.4 15 0.1 47 0.1 47 0.1 81 0.3 126 0.4 75 0.2 82 0.2 91 0.3 94 0.3Inventories 2,833 18.8 4,438 16.1 5,058 15.5 2,948 9.0 2,931 9.1 2,847 8.3 3,446 10.3 3,043 9.1 3,067 9.1 3,101 9.2Tax refunding 671 4.4 994 3.6 751 2.3 689 2.1 390 1.2 47 0.1 469 1.4 399 1.2 326 1.0 310 0.9Other current assets 169 1.1 845 3.1 1,592 4.9 2,263 6.9 459 1.4 465 1.4 1,195 3.6 1,095 3.3 804 2.4 890 2.6
Sum current assets 10,233 67.8 19,200 69.5 23,046 70.4 22,299 68.0 21,740 67.9 24,368 71.4 23,341 69.9 23,460 69.8 23,514 70.0 23,763 70.4
Non-current assets
Fixed assets 1,471 9.8 1,629 5.9 1,532 4.7 1,466 4.5 1,039 3.2 823 2.4 1,215 3.6 1,136 3.4 1,053 3.1 1,057 3.1Goodwill 156 1.0 1,877 6.8 1,877 5.7 1,877 5.7 1,877 5.9 1,877 5.5 1,877 5.6 1,877 5.6 1,877 5.6 1,877 5.6Other intangible assets 2,666 17.7 4,299 15.6 5,078 15.5 5,736 17.5 4,565 14.2 3,816 11.2 4,799 14.4 4,729 14.1 4,477 13.3 4,455 13.2Shares in associates 129 0.9 212 0.8 811 2.5 943 2.9 1,537 4.8 1,564 4.6 1,214 3.6 1,314 3.9 1,407 4.2 1,375 4.1Company related accounts receivables 187 1.2 117 0.4 68 0.2 68 0.2 68 0.2 188 0.6 98 0.3 106 0.3 115 0.3 127 0.4Latent tax 27 0.2 29 0.1 25 0.1 61 0.2 646 2.0 702 2.1 359 1.1 442 1.3 537 1.6 510 1.5Other fixed assets 216 1.4 249 0.9 296 0.9 333 1.0 567 1.8 777 2.3 493 1.5 543 1.6 595 1.8 602 1.8
Sum non-current assets 4,852 32.2 8,412 30.5 9,687 29.6 10,484 32.0 10,299 32.1 9,747 28.6 10,054 30.1 10,146 30.2 10,062 30.0 10,002 29.6
Total assets 15,085 100.0 27,612 100.0 32,733 100.0 32,783 100.0 32,039 100.0 34,115 100.0 33,396 100.00 33,606 100.0 33,576 100 33,765 100
Shareholders equity and liabilities
Short-term liabilities
Financial liabilities 2,962 19.6 127 0.5 691 2.1 1,547 4.7 1,299 4.1 57 0.2 899 2.7 950 2.8 801 2.4 677 2.0Capital dormant partners 0 0.0 50 0.2 50 0.2 0 0.0 0 0.0 0 0.0 0 0.0 0 0.0Trade accounts payable 3,471 23.0 2,215 8.0 3,807 11.6 4,264 13.0 4,356 13.6 4,619 13.5 4,262 12.8 4,375 13.0 4,403 13.1 4,415 13.1Trade accounts payable company partners 70 0.5 568 2.1 13 0.0 2 0.0 717 2.2 136 0.4 217 0.6 268 0.8 335 1.0 239 0.7Depoits received 1,098 7.3 1,553 5.6 3,307 10.1 2,021 6.2 2,281 7.1 1,081 3.2 2,173 6.5 1,889 5.6 1,856 5.5 1,750 5.2Tax liabilities 506 3.4 900 3.3 1,397 4.3 1,419 4.3 0 0.0 1,367 4.0 1,046 3.1 958 2.9 843 2.5 1,053 3.1Provisions 406 2.7 1,175 4.3 1,424 4.4 945 2.9 1,927 6.0 1,981 5.8 1,569 4.7 1,606 4.8 1,771 5.3 1,732 5.1Other liabilities 1,789 11.9 2,259 8.2 2,143 6.5 2,418 7.4 2,184 6.8 2,892 8.5 2,409 7.2 2,476 7.4 2,490 7.4 2,567 7.6
Sum short-term liabilities 10,302 68.3 8,797 31.9 12,782 39.0 12,666 38.6 12,814 40.0 12,133 35.6 12,574 37.7 12,522 37.3 12,498 37.2 12,432 36.8
Long-term liabilities
Latent tax liabilities 908 6.0 1,427 5.2 1,345 4.1 1,571 4.8 1,957 6.1 1,677 4.9 1,638 4.9 1,711 5.1 1,746 5.2 1,693 5.0Capital dormant partners 511 3.4 511 1.9 511 1.6 400 1.2 350 1.1 0 0.0 315 0.9 266 0.8 233 0.7 204 0.6Pension reserves 576 3.8 669 2.4 752 2.3 945 2.9 1,019 3.2 1,966 5.8 2,012 6.0 2,033 6.0 2,057 6.1 2,109 6.2Other liabilities 58 0.4 51 0.2 2 0.0 0 0.0 26 0.1 30 0.1 15 0.0 18 0.1 22 0.1 21 0.1
Sum long-term liabilities 2,053 13.6 2,658 9.6 2,610 8.0 2,916 8.9 3,352 10.5 3,673 10.8 3,979 11.9 4,028 12.0 4,057 12.1 4,026 11.9
Shareholders equity
Capital stock 200 1.3 10,000 36.2 10,040 30.7 10,040 30.6 10,040 31.3 10,040 29.4 10,040 30.1 10,040 29.9 10,040 29.9 10,040 29.7Additional paid-in capital 808 5.4 2,941 10.7 3,141 9.6 3,141 9.6 3,141 9.8 3,159 9.3 3,159 9.5 3,150 9.4 3,152 9.4 3,155 9.3Own shares 0.0 -219 -0.7 -561 -1.7 -810 -2.5 -1,003 -2.9 -1,000 -3.0 -844 -2.5 -914 -2.7 -940 -2.8Net income/loss 1,213 8.0 3,195 11.6 4,548 13.9 4,952 15.1 4,040 12.6 6,605 19.4 5,036 15.1 5,158 15.3 5,210 15.5 5,502 16.3Other reserves -26 -0.2 21 0.1 -169 -0.5 -371 -1.1 -538 -1.7 -492 -1.4 -393 -1.2 -448 -1.3 -468 -1.4 -450 -1.3Minorities 535 3.5
Sum shareholders equity 2,730 18.1 16,157 58.5 17,341 53.0 17,201 52.5 15,873 49.5 18,309 53.7 16,843 50.4 17,056 50.8 17,020 50.7 17,307 51.3
Sum liabilities 15,085 100.0 27,612 100.0 32,733 100.0 32,783 100.0 32,039 100.0 34,115 100.0 33,396 100.0 33,606 100.0 33,576 100.0 33,765 100.0
probe 0 0 0 0 0 0 0 0 0 0
Source: DR. KALLIWODA | RESEARCH © Copyright 2007
2000 2001 2002 2008 20092003 2004 2006 20072005
Company Report
init
innovation in traffic systems AG
22/02/2007
21
dd
www.kalliwoda.com Primary Research 21
9 Rating
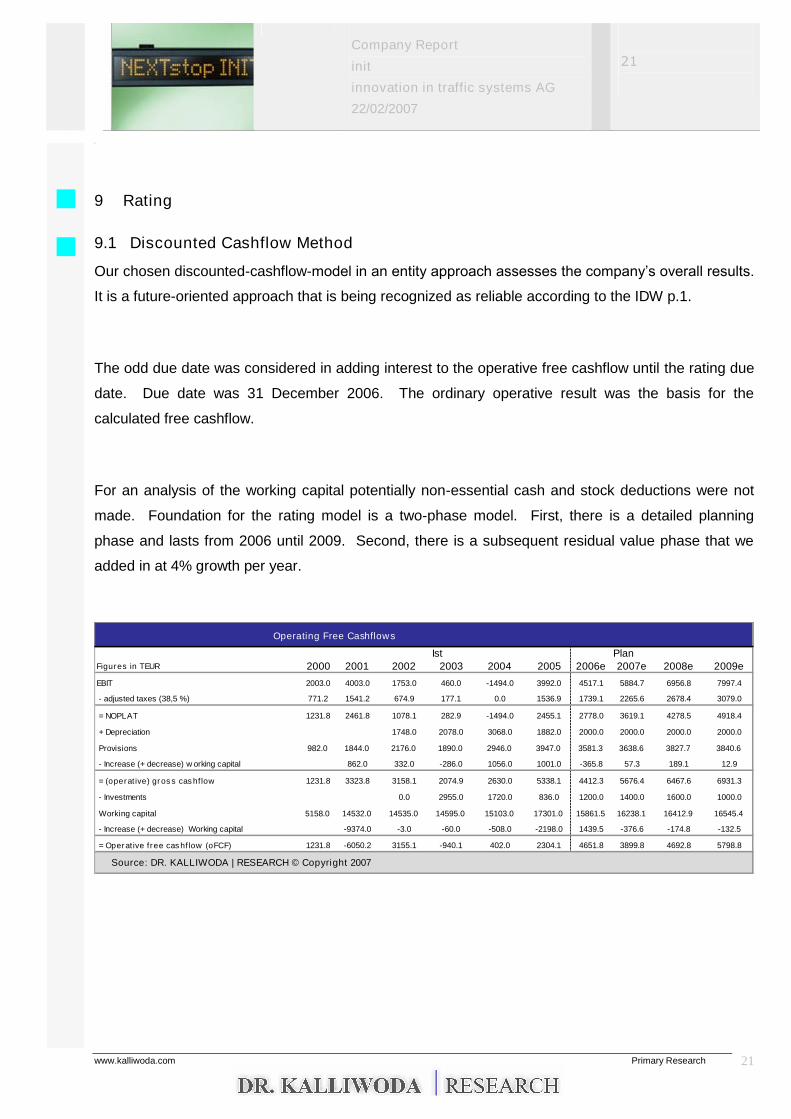
9.1 Discounted Cashflow Method
Our chosen discounted-cashflow-model in an entity approach assesses the company’s overall results.
It is a future-oriented approach that is being recognized as reliable according to the IDW p.1.
The odd due date was considered in adding interest to the operative free cashflow until the rating due
date. Due date was 31 December 2006. The ordinary operative result was the basis for the
calculated free cashflow.
For an analysis of the working capital potentially non-essential cash and stock deductions were not
made. Foundation for the rating model is a two-phase model. First, there is a detailed planning
phase and lasts from 2006 until 2009. Second, there is a subsequent residual value phase that we
added in at 4% growth per year.
Operating Free Cashflows
Ist PlanFigures in TEUR 2000 2001 2002 2003 2004 2005 2006e 2007e 2008e 2009e
EBIT 2003.0 4003.0 1753.0 460.0 -1494.0 3992.0 4517.1 5884.7 6956.8 7997.4
- adjusted taxes (38,5 %) 771.2 1541.2 674.9 177.1 0.0 1536.9 1739.1 2265.6 2678.4 3079.0
= NOPLAT 1231.8 2461.8 1078.1 282.9 -1494.0 2455.1 2778.0 3619.1 4278.5 4918.4
+ Depreciation 1748.0 2078.0 3068.0 1882.0 2000.0 2000.0 2000.0 2000.0
Provisions 982.0 1844.0 2176.0 1890.0 2946.0 3947.0 3581.3 3638.6 3827.7 3840.6
- Increase (+ decrease) w orking capital 862.0 332.0 -286.0 1056.0 1001.0 -365.8 57.3 189.1 12.9
= (operative) gross cashflow 1231.8 3323.8 3158.1 2074.9 2630.0 5338.1 4412.3 5676.4 6467.6 6931.3
- Investments 0.0 2955.0 1720.0 836.0 1200.0 1400.0 1600.0 1000.0
Working capital 5158.0 14532.0 14535.0 14595.0 15103.0 17301.0 15861.5 16238.1 16412.9 16545.4
- Increase (+ decrease) Working capital -9374.0 -3.0 -60.0 -508.0 -2198.0 1439.5 -376.6 -174.8 -132.5
= Operative free cashflow (oFCF) 1231.8 -6050.2 3155.1 -940.1 402.0 2304.1 4651.8 3899.8 4692.8 5798.8
Source: DR. KALLIWODA | RESEARCH © Copyright 2007
Company Report
init
innovation in traffic systems AG
22/02/2007
22
dd
www.kalliwoda.com Primary Research 22
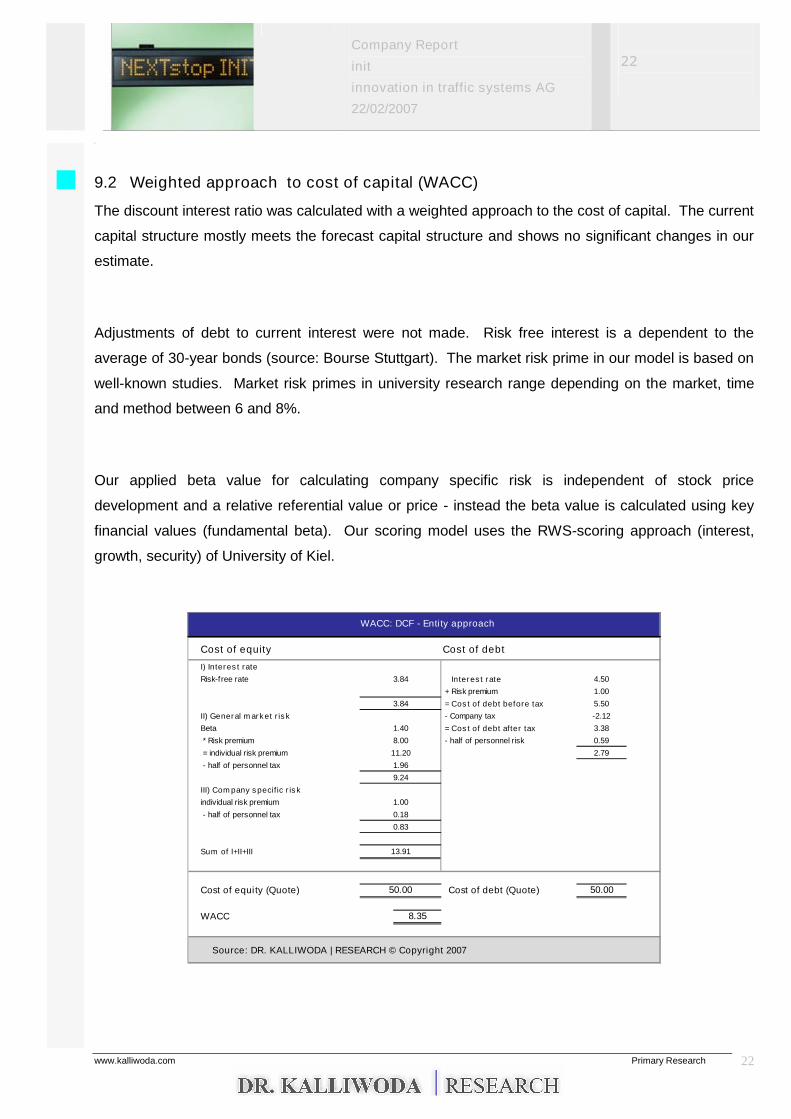
9.2 Weighted approach to cost of capital (WACC)
The discount interest ratio was calculated with a weighted approach to the cost of capital. The current
capital structure mostly meets the forecast capital structure and shows no significant changes in our
estimate.
Adjustments of debt to current interest were not made. Risk free interest is a dependent to the
average of 30-year bonds (source: Bourse Stuttgart). The market risk prime in our model is based on
well-known studies. Market risk primes in university research range depending on the market, time
and method between 6 and 8%.
Our applied beta value for calculating company specific risk is independent of stock price
development and a relative referential value or price - instead the beta value is calculated using key
financial values (fundamental beta). Our scoring model uses the RWS-scoring approach (interest,
growth, security) of University of Kiel.
WACC: DCF - Entity approach
Cost of equity Cost of debt
I) Interest rate
Risk-f ree rate Interest rate
+ Risk premium
= Cost of debt before tax
II) General market risk - Company tax
Beta = Cost of debt after tax
* Risk premium - half of personnel risk
= individual risk premium
- half of personnel tax
III) Company specific risk
individual risk premium
- half of personnel tax
Sum of I+II+III
Cost of equity (Quote) Cost of debt (Quote)
WACC 8.35
Source: DR. KALLIWODA | RESEARCH © Copyright 2007
3.84 4.50
1.00
3.84 5.50
-2.12
1.40 3.38
8.00 0.59
11.20 2.79
1.96
9.24
1.00
0.18
0.83
13.91
50.00 50.00
Company Report
init
innovation in traffic systems AG
22/02/2007
23
dd
www.kalliwoda.com Primary Research 23
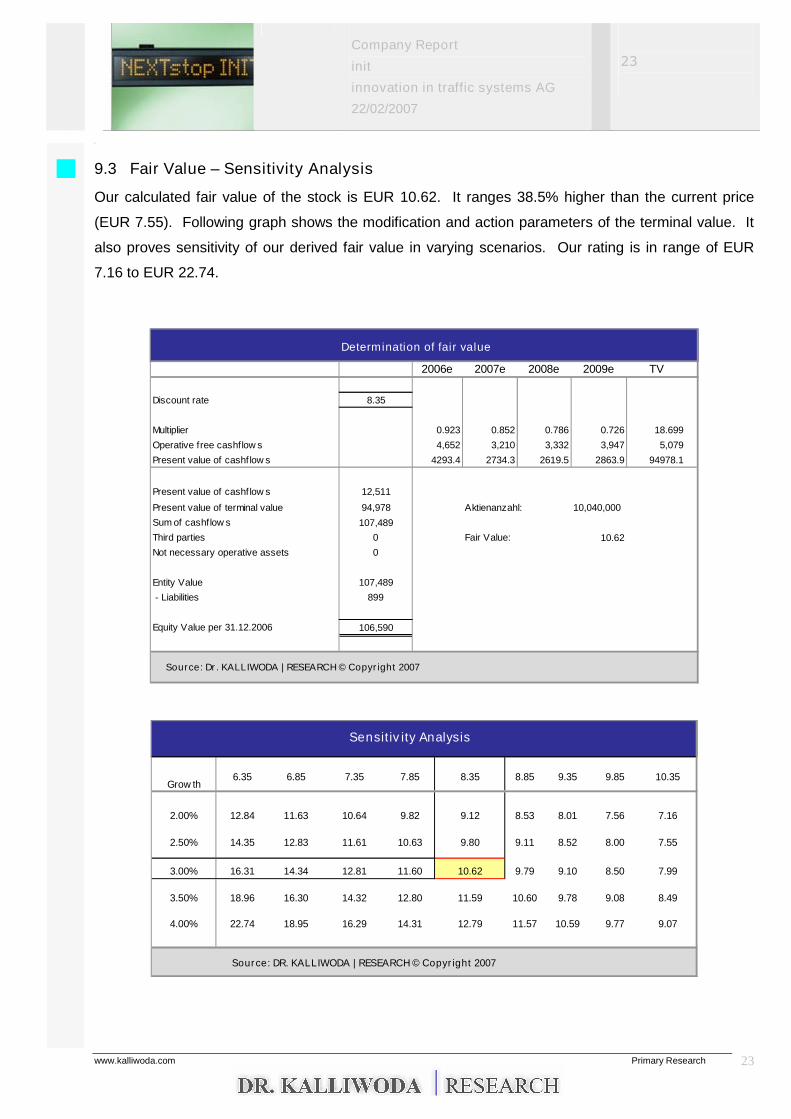
9.3 Fair Value –Sensitivity Analysis
Our calculated fair value of the stock is EUR 10.62. It ranges 38.5% higher than the current price
(EUR 7.55). Following graph shows the modification and action parameters of the terminal value. It
also proves sensitivity of our derived fair value in varying scenarios. Our rating is in range of EUR
7.16 to EUR 22.74.
Determination of fair value
2006e 2007e 2008e 2009e TV
Discount rate 8.35
Multiplier 0.923 0.852 0.786 0.726 18.699
Operative free cashflow s 4,652 3,210 3,332 3,947 5,079
Present value of cashf low s 4293.4 2734.3 2619.5 2863.9 94978.1
Present value of cashf low s 12,511
Present value of terminal value 94,978 Aktienanzahl:
Sum of cashflow s 107,489
Third parties 0 Fair Value: 10.62
Not necessary operative assets 0
Entity Value 107,489
- Liabilities 899
Equity Value per 31.12.2006 106,590
Source: Dr. KALLIWODA | RESEARCH © Copyright 2007
10,040,000
Sensitivity Analysis
6.35 6.85 7.35 7.85 8.35 8.85 9.35 9.85 10.35
2.00% 12.84 11.63 10.64 9.82 9.12 8.53 8.01 7.56 7.16
2.50% 14.35 12.83 11.61 10.63 9.80 9.11 8.52 8.00 7.55
3.00% 16.31 14.34 12.81 11.60 10.62 9.79 9.10 8.50 7.99
3.50% 18.96 16.30 14.32 12.80 11.59 10.60 9.78 9.08 8.49
4.00% 22.74 18.95 16.29 14.31 12.79 11.57 10.59 9.77 9.07
Source: DR. KALLIWODA | RESEARCH © Copyright 2007
Grow th
Company Report
init
innovation in traffic systems AG
22/02/2007
24
dd
www.kalliwoda.com Primary Research 24
10. KONTAKT
initinnovation in traffic systems AG
Käppelestraße 6D-76131 Karlsruhe
Telefon: + 49 721 –6 10 00 - 102Telefax: + 49 721 –6 10 00 - 399Investor Relations:Alexandra Weiß[email protected]
Primary Research│Fair Value Analysis│International Roadshows
Unterlindau 2260323 FrankfurtTel.: 069-97 20 58 53Fax.: 069-13 30 38 52 26 2www.kalliwoda.com
Head:Dr. Norbert KalliwodaE-Mail: [email protected]
CEFA-Analyst; University ofFrankfurt Economics; Dipl.-Kfm.
Sectors: IT, Software, Electricals &Electronics, MechanicalEngineering,Logistics, Laser, Technology, RawMaterials
Dr. Thomas KrassmannE-Mail: [email protected]
Dipl.-Geologist, M.Sc.;Universityof Göttingen & RhodesUniversity, South Africa;
Sectors: Raw Materials, Mining,Precious Metals, Gem stones.
Dr. Christoph PiechaczekE-Mail: [email protected]
Dipl.-Biologist; TechnicalUniversity Darmstadt; Univ.Witten-Herdecke
Sectors: Biotech & Healthcare;Medical Technology Pharmaceutical
Dr. Erik SchneiderE-Mail: [email protected]
Dipl.-Biologist; TechnicalUniversity Darmstadt; Univ.Hamburg
Sectors: Biotech & Healthcare;Medical Technology Pharmaceutical
David SchreindorferE-Mail: [email protected]
MBA, Economic InvestmentManagement (Candidate 2006);Univ. Frankfurt/ Univ. Iowa (US).
Sectors: IT/Logistics; QuantitativeModelling
Hellmut Schaarschmidt;E-Mail: [email protected]
Dipl.-Geophysicists; University ofFrankfurt.
Sectors: Oil, Regenerative Energies,Specialities Chemicals, Utilities
Nele RaveE-Mail: [email protected]
Lawyer; Native Speaker, GermanSchool London
Translations English
Also view Sales and Earnings Estimates: Analyst of this research: Dr.Norbert Kalliwoda, CEFADR. KALLIWODA│ RESEARCH on Terminals of
BloombergReutersThomson FinancialJCF Factset
Company Report
init
innovation in traffic systems AG
22/02/2007
25
dd
www.kalliwoda.com Primary Research 25
11. DISCLAIMER
BUY On a basis of our prognoses the stock should have aperformance of at least 20% in the following 12 months.
ACCUMULATE On a basis of our prognoses the stock should have aperformance of between 10% and 20% in the following 12months.
HOLD On a basis of our prognoses the stock should have aperformance of between minus 10% and plus 10% in thefollowing 12 months.
REDUCE On a basis of our prognoses the stock should have anunderperformance of between minus 10% and minus 20%.
SELL On a basis of our prognoses the stock should have anunderperformance of at least minus 20%
Additional Disclosure
DR. KALLIWODA | RESEARCH prepared this analysis on the basis of broadly accessible sources, which are regarded asreliable. We work as precisely as possible. We cannot however guarantee for the balance, precision, correctness andwholeness of the information and opinions.This study does not replace personal advice. This study is not regarded as invitation to the purchase or sale of theinstallation-instruments discussed in this study. Therefore, DR. KALLIWODA | RESEARCH advises to turn to your bank-advisor or trustees before an investment-disposition.
In the United Kingdom this document is only intended for distribution to persons described in Section 11(3) of theFinancial Services Act 1986 (Investments Advertisements) (Exemptions) Order 1996 (in the latest amended version), andmay not be passed on either directly nor indirectly to another group of persons. Neither this document nor a copy thereofmay be sent or taken to or distributed in the United States of America, Canada or Japan or their territories or possessionsnor may it be distributed to a US person as defined by the terms of the US Securities Act 1933 or to persons resident inCanada or Japan. Distribution of this document in other jurisdictations may be limited by law and persons in possession ofthis document should inform themselves of any restrictions and comply with these. Any failure to comply with theserestrictions may represent a breach of a current securities act.
DR. KALLIWODA | RESEARCH as well as co-workers may hold positions in any securities mentioned in this study or inconnected investments and may increase or sell their holdings in these securities or connected investments.
Possible conflicts of interest
Neither DR. KALLIWODA | RESEARCH nor any affiliated companya) hold an interest of 1 percent or more of the equity capital of the company being covered in this report;b) were involved in an emission of investments that is object of this study;c) hold a net-sale position of the shares of the analyzed business of at least 1 percent of the share capital;d) have serviced the analyzed investments based on any contract with the emitter on the
stock exchange or in the market.There is a contractual relationship only with the business of init AG withDR. KALLIWODA |RESEARCH for the preparation of research studies.
Through the assumption of this document, the reader / recipient accepts the obligations in these disclaimers.
Company Report
init
innovation in traffic systems AG
22/02/2007
26
dd
www.kalliwoda.com Primary Research 26
DISCLAIMER
The information and opinions in this analysis were prepared by DR. KALLIWODA |RESEARCH. The information herein is believed by DR. KALLIWODA | RESEARCH to bereliable and has been obtained from public sources believed to be reliable. With theexception of information about DR. KALLIWODA | RESEARCH, DR. KALLIWODA |RESEARCH makes no representation as to the accuracy or completeness of suchinformation.Opinions, estimates and projections in this report constitute the current judgement of theauthor as of the date of this analysis. They do not necessarily reflect the opinions, projection,forecast or estimate set forth herein, changes or subsequently becomes inaccurate, except ifresearch on the subject company is withdrawn. Prices and availability of financial instrumentsalso are subject to change without notice. This report is provided for informational purposesonly. It is not to be construed as an offer to buy or sell or a solicitation of an offer to buy orsell any financial instruments or to participate in any particular trading strategy in anyjurisdiction. The financial instruments discussed in this report may not be suitable for allinvestors and investors must make their own investment decision using their ownindependent advisors as they believe necessary and based upon their specific financialsituations and investment objectives. If a financial instrument is denominated in a currencyother than an investor´s currency, a change in exchange rates may adversely affect the priceor value of, or the income derived from, the financial instrument, and such investor effectivelyassumes currency risk. In addition, income from an investment may fluctuate and the price orvalue of financial instruments described in this report, either directly or indirectly , may rise orfall. Furthermore, past performance is not necessarily indicative or future results.This report may not be reproduced, distributed or published by any person for any purposewithout DR. KALLIWODA | RESEARCH´s prior written consent. Please cite source whenquoting.


![Finale 98d - [Kalliwoda - Nocturne #1.MUS]...Finale 98d - [Kalliwoda - Nocturne #1.MUS] Author Marten Created Date 6/25/2019 9:14:15 AM](https://img.pdfslide.net/doc/110x75/60d3bd2b2e02b316917b8e1f/finale-98d-kalliwoda-nocturne-1mus-finale-98d-kalliwoda-nocturne.jpg)

![9. Telematics and IVI [호환 모드] - Yonsei Universityweb.yonsei.ac.kr/hgjung/Lectures/DME427/9. Telematics and IVI.pdf · Telematics Telematics typically is any integrated use](https://img.pdfslide.net/doc/110x75/5bddac8609d3f27f5d8b6335/9-telematics-and-ivi-yonsei-telematics-and-ivipdf-telematics.jpg)