Embed Size (px)
Citation preview
Draft
Identification of quantitative trait loci for seedling root
traits from Tibetan semi-wild wheat (Triticum aestivum ssp. tibetanum)
Journal: Genome
Manuscript ID gen-2017-0097.R1
Manuscript Type: Article
Date Submitted by the Author: 02-Jul-2017
Complete List of Authors: Ma, Jian; Sichuan Agricultural University, Triticeae Research Institute
Luo, Wei; Sichuan Agricultural University, Triticeae Research Institute Zhang, Han; Sichuan Agricultural University, Triticeae Research Institute Zhou, Xiao-Hong; Sichuan Agricultural University, Triticeae Research Institute Qin, Na-Na; Sichuan Agricultural University, Triticeae Research Institute Wei, Yu-Ming; Sichuan Agricultural University, Triticeae Research Institute Liu, Yaxi; Sichuan Agricultural University, Triticeae Research Institute Jiang, Qian-Tao; Sichuan Agricultural University, Triticeae Research Institute Chen, Guo-Yue; Sichuan Agricultural University, Triticeae Research Institute Zheng, You-Liang; Sichuan Agricultural University, Triticeae Research
Institute Lan, Xiu-Jin; Sichuan Agricultural University, Triticeae Research Institute
Is the invited manuscript for consideration in a Special
Issue? : This submission is not invited
Keyword: Tibetan semi-wild wheat, recombinant inbred line, root trait, quantitative trait locus, correlation
https://mc06.manuscriptcentral.com/genome-pubs
Genome
Draft
1
Identification of quantitative trait loci for seedling root traits from 1
Tibetan semi-wild wheat (Triticum aestivum ssp. tibetanum) 2
Jian Ma#, Wei Luo
#, Han Zhang
#, Xiao-Hong Zhou, Na-Na Qin, Yu-Ming Wei, Ya-Xi 3
Liu, Qian-Tao Jiang, Guo-Yue Chen, You-Liang Zheng, Xiu-Jin Lan* 4
5
Triticeae Research Institute, Sichuan Agricultural University, 211 Huimin Road, 6
Wenjiang, Chengdu, Sichuan, 611130, China. 7
8
# Contributed equally to this work. 9
*Corresponding author 10
Xiu-Jin Lan: [email protected]. Tel: +86 28 82650350. Fax: +86 28 82650350. 11
The e-mail addresses of the other co-authors: [email protected] (Jian Ma), 12
[email protected] (Wei Luo), [email protected] (Han Zhang), 13
[email protected] (Xiao-Hong Zhou), [email protected] (Na-Na Qin), 14
[email protected] (Yu-Ming Wei), [email protected] (Ya-Xi Liu), 15
[email protected] (Qian-Tao Jiang ), [email protected] (Guo-Yue 16
Chen), [email protected] (You-Liang Zheng). 17
18
Page 1 of 20
https://mc06.manuscriptcentral.com/genome-pubs
Genome
Draft
2
19
Abstract 20
As a primitive hexaploid wheat resource distributed only in Tibet, Tibetan semi-wild 21
wheat (Triticum aestivum ssp. tibetanum Shao) possesses unique characteristics that 22
could be exploited in wheat breeding program. A good root system could offer a stable 23
platform for the above-ground components. Aiming at detecting possible excellent 24
locus for root traits from Tibetan semi-wild wheat, we here identified QTLs for root 25
traits using a recombinant inbred line population derived from a cross between 26
Tibetan semi-wild wheat Q1028 and Zhengmai 9023. A total of 15 QTLs on 8 27
chromosomes were detected, including four major QTLs, QMrl.sau-7B, QTrl.sau-4B, 28
QAd.sau-7A and QSa.sau-4B. The phenotypic variation explained by each of these 29
QTLs ranges from 5.67 to 16.68 %. Positive alleles of 6 QTLs were derived from 30
Q1028. Several novel QTLs for root traits were identified. In addition, significant 31
correlations were detected amongst root traits and agronomic traits. Taken together, 32
the results suggested that Tibetan semi-wild wheat and the newly identified novel 33
QTLs could be useful in future breeding programs. 34
Keywords Tibetan semi-wild wheat, recombinant inbred line, root trait, quantitative 35
trait locus, correlation 36
37
Page 2 of 20
https://mc06.manuscriptcentral.com/genome-pubs
Genome
Draft
3
Introduction 38
Common wheat (Triticum aestivum L., 2n=6x=42, AABBDD) is one of the most 39
important food crops in the world. With the increase of population, improving yield of 40
wheat has become an important target of breeding work. However, the current annual 41
rate of increase in wheat productivity is considerably lower than the demanded by 42
global wheat consumption (Reynolds et al. 2012). 43
As an important organ to absorb water and minerals, a root system plays a major role 44
in the growth and development and even yield in crops (Moudal and Kour 2004; 45
Partha et al. 2004; Rogers and Benfey 2015).Compared with root traits, the 46
above-ground components including plant height and harvest index have always been 47
focused on in wheat improvement programs, mainly due to the difficulties related to 48
root recovery and evaluating root traits in situ. Another two limitations, i.e. broad 49
phenotypic plasticity of root traits in response to changes in soil conditions and lack 50
of high-throughput and cost-effective screening techniques, make root studies highly 51
challenging as well (Fitter 2002; Manschadi et al. 2008; Poorter and Nagel 2000). 52
Despite of these restricted conditions, some appreciable progress has been made to 53
date on identification of QTLs for important root traits (Bai et al. 2013; Ehdaie et al. 54
2016; Kabir et al. 2015; Liu et al. 2013; Ren et al. 2012). For instance, Maccaferri et 55
al. (2016) detected several QTLs for root length, root number and root growth angle 56
in the whole genome of tetraploid wheat except 4A and 5B, Ayalew et al. (2017) 57
located some QTLs for root length on 1A, 1B, 2D, 3A, 5A, 6A and 7B in hexaploid 58
wheat. Furthermore, quite a few of QTLs for root diameter, surface area and root 59
volume have been reported by Petrarulo et al. (2015) and Shang et al. (2016). 60
Tibetan semi-wild wheat (T. aestivum ssp. tibetanum) is a hexaploid wheat found only 61
in Tibet (Shao et al. 1980), with unique and primitive characteristics such as hulled 62
glumes and brittle rachis (Jiang et al. 2014). It is characterized by numerous desirable 63
characteristics, such as tolerance to nutrition deficiency and strong seed dormancy 64
which can be introduced by crossing with common wheat breeding (Jiang et al. 2015; 65
Sun et al. 1998). Thus, identification and the utilization of desirable genes from 66
Tibetan semi-wild wheat could be important to develop modern wheat cultivars. 67
Most recently, we identified QTLs controlling seed dormancy (Jiang et al. 2015), 68
brittle rachis and threshing ability (Jiang et al. 2014), and important agronomic traits 69
(Luo et al. 2016) of T. aestivum ssp. tibetanum accession Q1028 collected in our 70
institute. In addition, a recent study reported a few QTLs controlling root traits using 71
RILs derived from common wheat and Tibetan semi-wild wheat (Kabir et al. 2015), 72
broadening our knowledge on Tibetan semi-wild wheat for breeding as well. It is 73
documented that more than 140 accessions of Tibetan semi-wild wheat with high 74
genetic diversity were collected (Liu 2010). As part of our systematic work to exploit 75
breeding potentialities of Tibetan semi-wild wheat in cultivar development, we, here, 76
report on QTLs controlling root traits of Tibetan semi-wild wheat accession Q1028 77
Page 3 of 20
https://mc06.manuscriptcentral.com/genome-pubs
Genome
Draft
4
different from that used in Kabir et al. (2015). 78
Materials and methods 79
Plant material 80
In this study, a total of 186 RILs derived from a cross between Tibetan semi-wild 81
wheat accession Q1028 (female parent) and a wheat cultivar Zhengmai 9023 (male 82
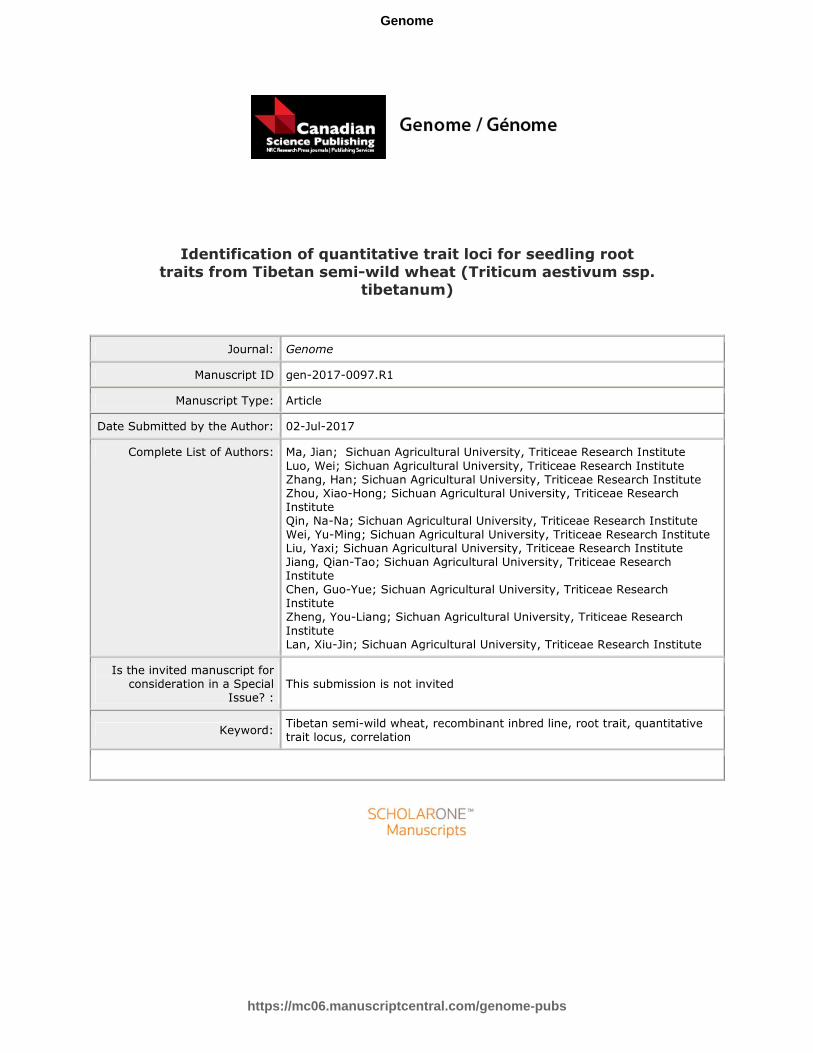
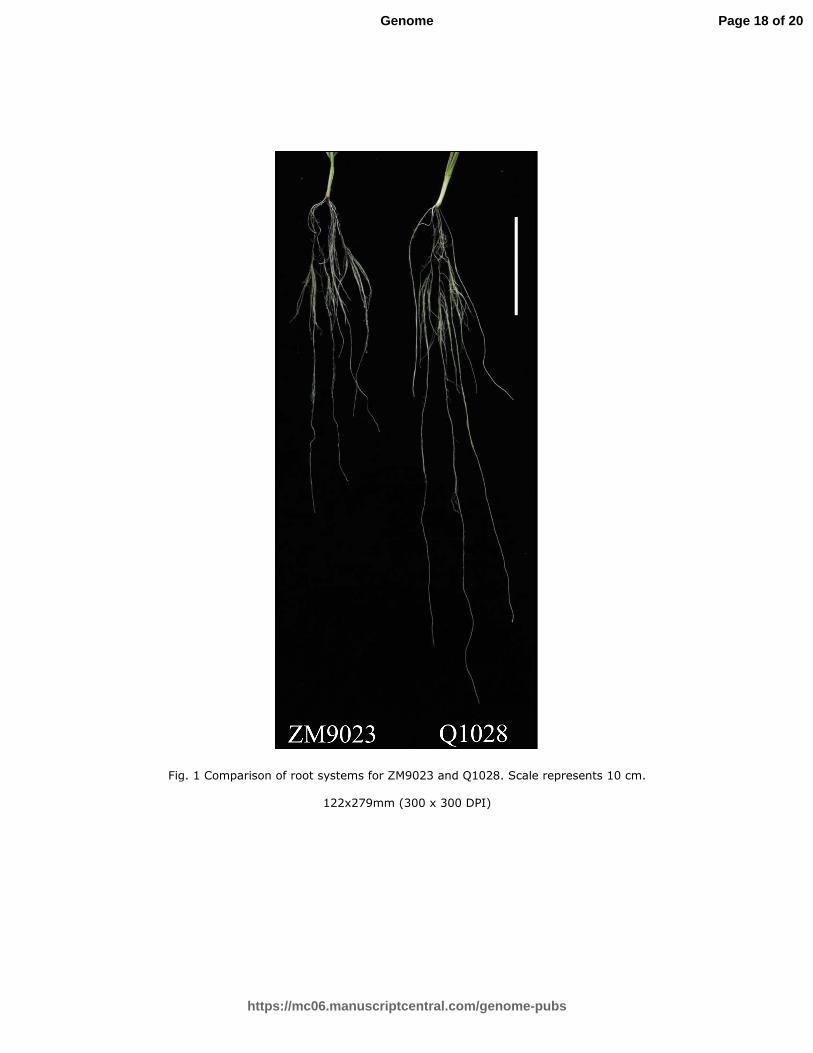
parent, ZM9023) were used to investigate root traits. Q1028 shows a longer root 83
system than ZM9023 (Fig. 1). Furthermore, Q1028 has longer flowering date, taller 84
plant height, higher spikelet number per spike and larger tiller number than ZM9023. 85
While ZM9023 has higher thousand-grain weight than Q1028 (Luo et al. 2016). 86
Hydroponic culture 87
The commonly used hydroponic culture system (Kabir et al. 2015; Ren et al. 2012) 88
was employed to study the root morphological parameters of wheat seedlings in the 89
present study. The experiments were conducted in greenhouse of the Triticeae 90
Research Institute of Sichuan Agricultural University. The settings for the greenhouse 91
were: 20 (±4) °C day/night temperature and 65/85 % day/night relative humidity, and 92
a 16-h photoperiod. 93
The experiment was repeated for three times to increase the credibility of root trait 94
measurements. Each replicated experiment was performed in a completely 95
randomized design. For each replicated experiment, twenty uniformly sized seeds 96
from each line were surface-sterilized by soaking in 10 % sodium hypochlorite for 5 97
min and then, rinsed three times with deionized water. Seeds were then germinated on 98
three layers of filter paper saturated with water in petri dishes at room temperature for 99
a week. After removing residual endosperm materials, four equal sized germinated 100
seeds of each line having shoots of about 1 cm were transferred to plastic tray. The 101
plastic trays (50 cm × 40 cm × 30 cm) contain Hoagland nutrient solution to supply 102
mineral nutrition and air pump to supply oxygen (An et al. 2006). The nutrient 103
solution was replaced twice in a week. 104
Phenotypic data 105
Root and shoot tissues were collected separately four weeks after transplanting for 106
measuring root traits. Maximum root length (MRL, the length between the roots base 107
and the tip of the longest root, cm/plant) was measured using a ruler. The collected 108
roots were scanned by Epson Expression 10000 XL. The output root imagines were 109
analyzed by Win-RHIZO developed by Regent Instruments Canada Inc. (Ottawa, ON, 110
Canada) for the following traits: total root length (TRL, the sum of the length for all 111
the roots including primary and lateral roots from a single measured plant, cm/plant), 112
root surface area (SA, the area of all the roots from a single measured plant, 113
Page 4 of 20
https://mc06.manuscriptcentral.com/genome-pubs
Genome
Draft
5
cm2/plant ), root average diameter (AD, the average diameter of all the roots from a 114
single measured plant, cm/plant), root volume (RV, the total size for all the roots from 115
a single measured plant, cm3/plant) and number of root tips (RTN, the total tips of all 116
the roots from a single measured plant, n/plant). Root dry weight (RDW, g/plant)) and 117
shoot dry weight (SDW, g/plant) were measured by electronic scale after the fresh 118
roots and shoot had been dried to a constant weight at 100 °C. The root/shoot ratio 119
(RSR, RDW/SDW) was calculated. Five agronomic traits investigated in our previous 120
study (Luo et al. 2016) were employed for correlation analysis, including flowering 121
date (FD), plant height (PH), tiller number (TN), spikelet number per spike (SNS) and 122
1000 grains weight (TGW). The best linear predictors (BLUPs) were calculated for 123
the measured root traits (from three repeated experiments) and agronomic traits (from 124
different growth seasons) and were further used for the following analysis. Frequency 125
distribution and the correlation between traits were calculated using SPSS version 126
20.0 for Windows (SPSS Inc., Chicago, IL). The estimated broad-sense heritability of 127
the investigated traits was calculated as follows: h2
= σ2
G/(σ2
G + σ2
e /r), where σ2
G is the 128
genetic variance, σ2
e is the residual variance, and r is the number of replicates per 129
genotype. Student’s t-test (P < 0.05) calculated by SPSS was used to evaluate the 130
differences of the investigated traits between the parents. 131
QTL mapping 132
The BLUPs of 12 seedlings of each RIL from three replicates was used to detect root 133
QTLs. A whole-genome genetic map constructed previously (Jiang et al. 2014) was 134
adopted for QTL mapping. The genetic map was constructed using a population of 135
186 RILs with 564 DArT makers and 117 SSR markers. These markers were 136
distributed in 22 linkage groups and covered a total genetic distance of 2, 727 cM 137
(Jiang et al. 2014). The relative positions of contiguous markers were tested through 138
Kosambi mapping function. QTL analysis was initially conducted using QTL 139
IciMapping version 3.2 which was followed by inclusive composite interval mapping 140
(ICIM) (Wang et al. 2012). Thereafter, single marker analysis (SMA) was applied to 141
ascertain the QTLs’ authenticity. LOD ≥ 2.5 was used to determine the presence of a 142
QTL (Lin et al. 1996). QTLs were named according to the rules of International Rules 143
of Genetic Nomenclature (http://wheat.pw.usda.gov/ggpages/wgc/98/Intro.htm). 144
Results 145
Phenotypic analysis 146
The phenotypes values for each trait varied among different lines (Table 1; Fig. 1). 147
Significant differences between parents were detected for MRL, TRL, SA, AD, RV, 148
MRL and RTN (Table 1). For example ZM9023 exhibits higher values of TRL, RSA, 149
RV and RTN than Q1028. However, Q1028 shows longer MRL and larger AD than 150
ZM9023 (Table 1). 151
Page 5 of 20
https://mc06.manuscriptcentral.com/genome-pubs
Genome
Draft
6
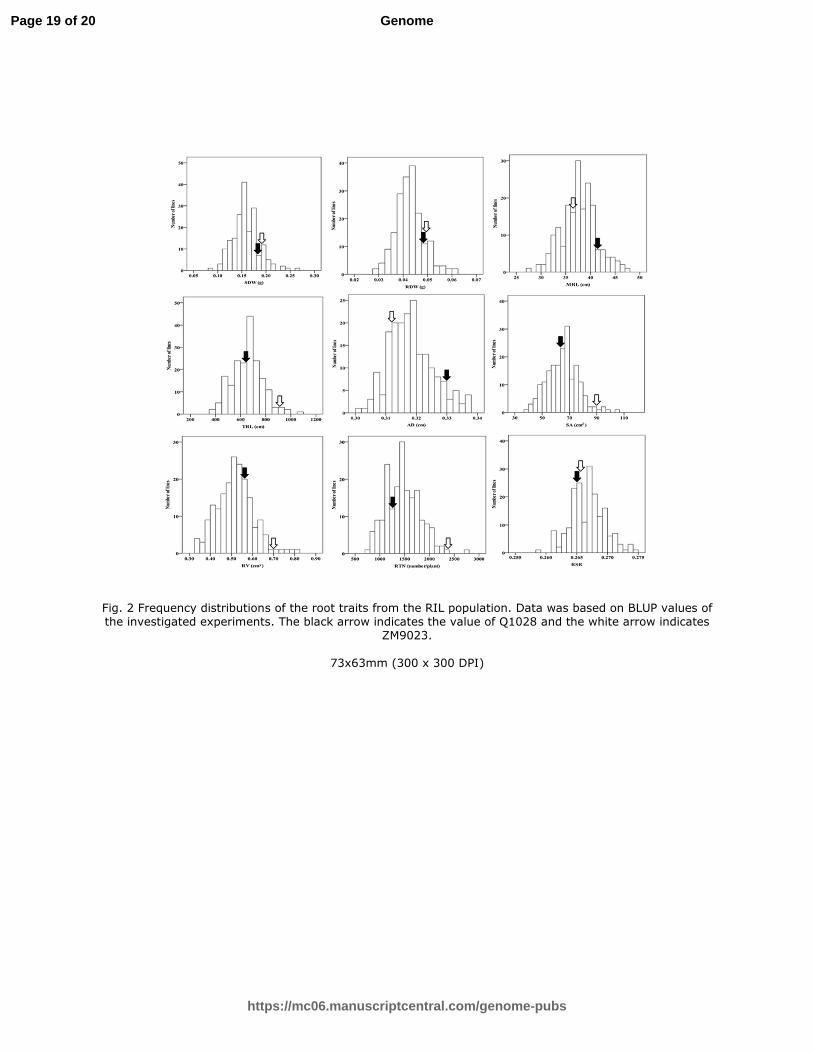
The transgressive segregation in the RIL population were observed for all traits (Fig. 152
2). The frequency distributions of the investigated traits showed continuous variation 153
with approximately normal distributions indicating that the traits are quantitative in 154
nature and are suitable for QTL analysis. The heritability value of RSR was the lowest 155
in this study (only 5%) (Table 1). Furthermore, a concentrated heritability values 156
ranged from 62 % to 85 % indicating that the other 8 traits are stable and mainly 157
controlled by genetic factors (Table 1). 158
Correlation between root and agronomic traits 159
The phenotypic correlations among the investigated root and agronomic traits are 160
shown in Table 2. Significant correlations were detected amongst most of the traits. 161
The correlation coefficients ranged from 0.008 to 0.988 (Table 2). FD was 162
significantly correlated with SDW and MRL as well as all other agronomic traits with 163
correlation coefficients ranging from 0.144 to 0.689 (P < 0.05). Significant positive 164
correlations were also detected between PH and 6 seeding traits including RDW, SDW, 165
TRL, SA, RV and RTN with the coefficients ranging from 0.255 to 0.329 (P < 0.01). 166
TN was significantly negatively correlated with TGW and AD (P < 0.01) but 167
positively correlated with SNS, MRL and RTN (P < 0.05 or 0.01). SNS showed 168
significantly negative correlation with TGW and significantly positive correlation 169
with RDW, SDW and MTL. TGW was significantly correlated with MRL, TRL, SA 170
and RV (P < 0.01). 171
Significant correlations were also detected among seeding traits (Table 2). 172
Significantly positive correlations were detected between RDW and all of the other 173
seeding traits except AD, and the coefficients ranged from 0.297 to 0.852 (P < 0.01). 174
Unsurprisingly, SDW was significantly negatively related to RSR (r = -0.186), but it 175
was significantly positively correlated with several seeding traits including RDW, 176
MRL, TRL, SA, RV and RTN (0.295 ≤ r ≤ 0.847). MRL was significantly correlated 177
with TRL, SA, RV and RTN (P < 0.01). TRL showed highly significant correlations 178
with PH, TGW and all the seeding traits except RSR (P < 0.01). AD was significantly 179
negatively correlated with TN, TRL and RTN (P < 0.01). SA was significantly 180
correlated with PH, TGW and all of the seeding traits (0.230 ≤ r ≤ 0.988, P < 0.01) 181
except AD and RSR. RV was significantly correlated with all of the seeding traits 182
(0.204 ≤ r ≤ 0.948) except RSR. RTN was significantly correlated with PH, TN and 183
all the seeding traits except RSR (Table 2). 184
QTL detection 185
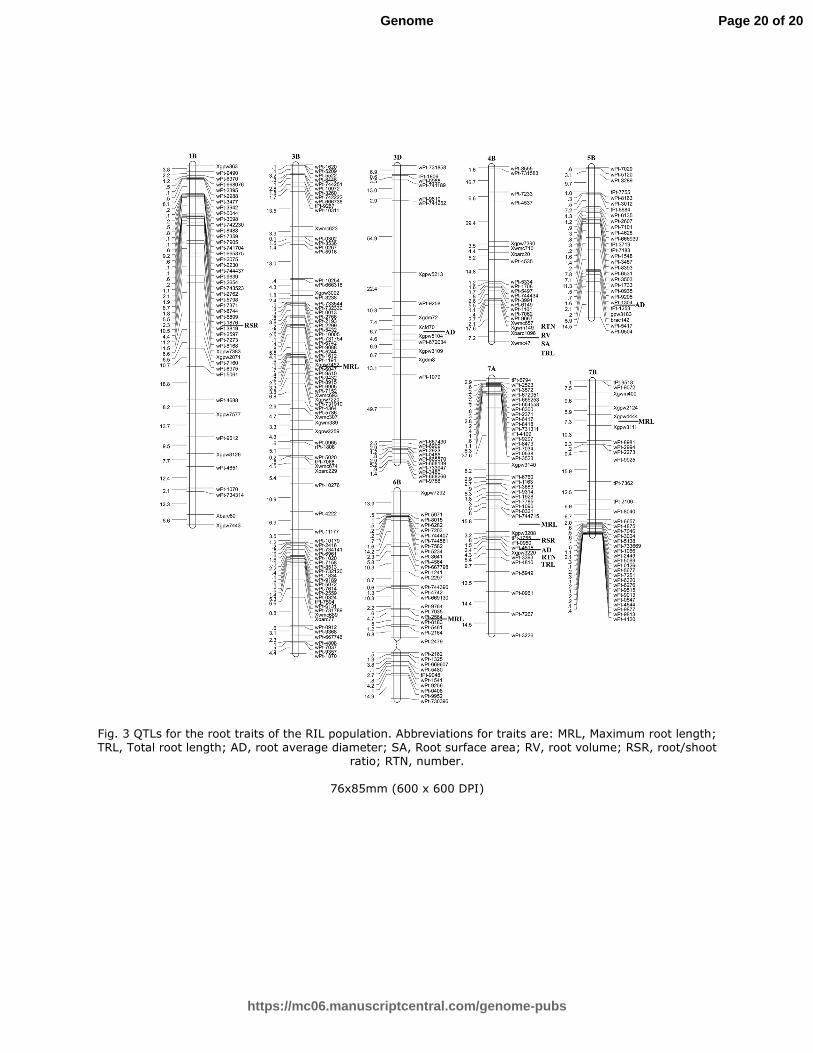
In the present study, a total of 15 QTLs for seven root traits were identified with a 186
single QTL explaining 5.67–16.68 % of phenotypic variation observed (Table 3, Fig. 187
3). The LOD values ranged from 2.54 to 7.75 (Table 3). The 15 QTLs were 188
distributed on 8 chromosomes and they were 1B, 3B, 3D, 4B (4 QTLs), 5B, 6B, 7A (5 189
QTLs) and 7B. The additive effects of 6 QTLs were positive with Q1028 increasing 190
Page 6 of 20
https://mc06.manuscriptcentral.com/genome-pubs
Genome
Draft
7
the effects of these QTLs, while the remaining 9 were negative with ZM9023 191
increasing the effects. 192
Four QTLs for MRL were detected and they were mapped on chromosomes 3B, 6B, 193
7A, and 7B (Fig. 3). The phenotypic variation explained by these QTLs ranged from 194
6.18 to 16.68 % (Table 3). The positive allele of QMrl.sau-7B was contributed by 195
ZM9023 and those of the remaining QTLs were contributed by Q1028. The QTL, 196
QMrl.sau-7B, was a major QTL which explained 16.68 % of variation. 197
Two QTLs for TRL, QTrl.sau-4B and QTrl.sau-7A, were detected explaining 12.56 % 198
and 5.67 % of the phenotypic variation, respectively. The positive alleles of these two 199
QTLs were contributed by ZM9023. 200
For AD, a major (QAd.sau-7A) and two minor QTLs (QAd.sau-3D and QAd.sau-5B) 201
with 12.18 %, 8.74 %, and 5.83% phenotypic variation explained were identified on 202
7A, 3D, and 5B, respectively (Fig. 3, Table 3). The positive alleles of QAd.sau-3D 203
and QAd.sau-7A were contributed by Q1028 and that of QAd.sau-5B was contributed 204
by ZM9023. 205
One QTL only for RV was detected and it was mapped on chromosome 4B (Fig. 3). It 206
explained 8.79 % of the phenotypic variation and the positive allele was from 207
ZM9023 (Table 3). 208
A major QTL for SA was also detected on 4B (Fig. 3). It explained 10.61 % of the 209
phenotypic variation and the positive allele was from ZM9023 (Table 3). 210
Two QTLs for RTN were detected on 4B and 7A (Fig. 3). QRtn.sau-4B and 211
QRtn.sau-7A explained 8.00 % and 8.61 % of the phenotypic variation, respectively. 212
The positive alleles of these QTLs were all from ZM9023 (Table 3). 213
Two QTLs for RSR were located on 1B and 7A. QRsr.sau-1B explained 6.80 % of the 214
phenotypic variation and QRsr.sau-7A explained 5.73 % of that (Table 3). 215
Furthermore, the positive alleles of the two QTLs were from ZM9023 and Q1028, 216
respectively. 217
Discussion 218
A good root system could offer a stable platform for the above-ground components. 219
To explore desirable genes for root traits of wheat, we investigated several root traits 220
of a RIL population derived from the Tibetan semi-wild wheat Q1028 and a wheat 221
cultivar ZM9023. ZM9023 showed clear advantages in six out of the eleven assessed 222
seeding traits, indicating its breeding potential as a national wheat cultivar. A total of 223
15 QTLs on 8 chromosomes were detected. The phenotypic variation explained (PVE) 224
by each of these QTLs ranged from 5.67 to 16.68 % and 4 were considered as major 225
Page 7 of 20
https://mc06.manuscriptcentral.com/genome-pubs
Genome
Draft
8
QTLs with a higher than 10 % of PVE. Positive alleles of 6 QTLs were derived from 226
Q1028. Significant correlations were detected amongst most of root traits and several 227
agronomic traits. As the expression of QTL is easily affected by environment factors, 228
the BLUP model was adopted to correct the environmental effects aiming at 229
increasing the reliability and facticity of the detected QTLs (Doligez et al. 2013). 230
Possible potential of Tibetan semi-wild wheat in breeding program 231
The values of MRL and AD for Tibet semi-wild wheat Q1028 were significantly 232
higher than those for ZM9023. Reportedly, a deep root system could facilitate the 233
plant to extract water stored in deep soil layers to avoid drought stress (Boyer 1996; 234
Ludlow and Muchow 1990). It is also reported that increased root diameter was 235
related to drought tolerance in rice (Oryza sativa L.) because thicker roots are 236
characterized by large xylem vessels with improved axial conductance and are more 237
efficient in penetrating deep soil layers to extract water (Clark et al. 2008; Fukai and 238
Cooper 1995). Given that Tibetan semi-wild wheat was found only in Tibet, a 239
relatively dry growth environment (Shao et al. 1980), it is thus understandable that 240
Tibetan semi-wild wheat has adapted by increasing rooting depth and root diameter to 241
capture water and nutrition from the deeper layers of soil to avoid drought stress. 242
Therefore, Tibetan semi-wild wheat could be utilized as an excellent genetic resource 243
in breeding program aiming at improving tolerance to drought. 244
It was documented that more than 140 accessions of Tibetan semi-wild wheat with 245
high genetic diversity were collected (Liu 2010). Exploring various genotypes of 246
Tibetan semi-wild wheat with desirable genes could facilitate ongoing of wheat 247
improvement. For example, an accession of Tibetan semi-wild wheat (i.e. Zang 1817) 248
had been used to construct a RIL population and detected QTLs controlling root traits 249
(Kabir et al. 2015). Aiming at identifying more desirable genes from different 250
genotypes of Tibetan semi-wild wheat, we created a RIL population derived from 251
Tibetan semi-wild wheat Q1028 and a cultivar ZM9023 for detecting QTLs 252
responsible for root traits. Genotypes of Tibetan semi-wild wheat (Q1028 and Zang 253
1817) are different in phenotypes including plant height (Q1028:139.0cm; Zang 1817: 254
96.7cm), spike length (Q1028:12.7cm; Zang 1817: 11.2cm), thousand grain weight 255
(Q1028:21.3g; Zang 1817: 26.7g) (Liu et al. 2014; Luo et al. 2016). For the traits 256
determined in both study, i.e. MRL, TRL, (R)SA, AD (RVOL), RTN (TIP), some 257
novel QTLs were detected in the present study, such as QTLs for MRL, TRL and AD 258
on 7A. Of these newly identified QTLs, positive alleles of QMrl.sau-7A and 259
QAd.sau-7A are derived from Q1028. In addition, it was notable that transgressive 260
segregation was detected in all of the nine traits, and some lines showed better 261
phenotype than their parents (Fig. 2). The lines which expressed transgressive 262
segregation in multiple traits were also propitious to be applied in breeding 263
programs. Taken together, the results reported here combined with those from Kabir et 264
al. (2015) suggested that Tibetan semi-wild wheat can be used as a valuable gene 265
resource in breeding wheat. 266
Page 8 of 20
https://mc06.manuscriptcentral.com/genome-pubs
Genome
Draft
9
Comparison of QTLs detected in this study with those reported previously 267
Numerous QTLs for root traits have been detected by using various populations 268
(Ayalew et al. 2017; Bai et al. 2013; Ibrahim et al. 2012; Kabir et al. 2015; Liu et al. 269
2013; Maccaferri et al. 2016; Ren et al. 2012). Both the present study and that 270
reported by Kabir et al. (2015) detected QTLs for MRL on 3B and 7B. Ibrahim et al. 271
(2012) detected QTLs for TRL on 7A as this study. As the markers used for QTL 272
mapping were different, the detailed comparison of the markers flanking a given QTL 273
is not realistic. In this study, we also detected several QTLs that have not been 274
detected previously to our knowledge. For example, QMrl.sau-7A and the QTLs for 275
AD on 3D and 5B were newly identified in the present study. The fact that the QTLs 276
for MRL, TRL, AD, RTN and RSR were identified in 7A suggests that chromosome 277
7A could play a major role in growth and development of root and its function 278
performances. 279
Co-mapped and closely linked QTLs controlling different root traits 280
QTL clusters have been reported in previous studies (Kabir et al. 2015; Luo et al. 281
2016). The co-located QTLs for different traits were detected in specific chromosomal 282
intervals in the present study. Two QTL clusters distributed on chromosomes 4B and 283
7A were identified (Fig. 3). Co-localization of QTLs indicates the close association of 284
the traits. The loci for TRL, SA, RV and RTN on 4B are most likely controlled by a 285
same gene, given that the positive alleles of these loci came from the same parent 286
ZM9023. The cluster on 7A consisting of three QTLs for AD, RTN, and TRL mapped 287
between wPt-4515 and Xgpw3220 was identified. The positive alleles for 288
QTrl.sau-7A and QRtn.sau-7A were contributed by male parent ZM9023 and the 289
positive allele of QAd.sau-7A was contributed by female parent Q1028. The 290
resolution of the genetic map constructed in this study should be further improved to 291
determine whether these traits are controlled by the two different alleles of the same 292
locus. 293
The relationships among root and agronomic traits 294
In this study, SA showed significantly positive correlation with PH, TGW, SDW and 295
other root traits except AD and RSR (Table 2). Water and nutrient absorption from the 296
soil is directly proportional to contact areas between soil and roots (Caassen and 297
Barber 1976; Yoshida and Hasegawa 1982). It was reported that the absorptive 298
capacity of wheat roots increases with SA (Narayanan et al. 2014). The increased 299
intakes through increased SA might help plant to improve the above-ground biomass 300
production including SDW and TGW. As TRL, RV and RTN were significantly 301
positively correlated with SA (r ≥ 0.805, P < 0.01), it is thus understandable that these 302
three root traits were also significantly positively correlated with SDW. 303
A positive correlation between SDW and RDW (r = 0.833, P < 0.01; Table 2) was 304
Page 9 of 20
https://mc06.manuscriptcentral.com/genome-pubs
Genome
Draft
10
detected in the present study, being consistent with previous studies in wheat 305
(Narayanan et al. 2014), pea (McPhee 2005) and chickpea (Serraj et al. 2004). As 306
discussed above, the raised nutrients absorbed through increased root surface might 307
help to improve the biomass of SDW. In turn, the surplus photosynthate of the 308
increased shoot growth might be transported to roots and thus increase RDW 309
(Narayanan et al. 2014). And the mutual-promotion pattern might explain the 310
significant correlations between root traits and agronomic traits including PH, TN, 311
SNS and TGW. 312
Our previous study detected a QTL for TN on 6B where the MRL QTL QMrl.sau-6B 313
was located (Luo et al. 2016). In the present study, TN showed significant correlation 314
with MRL and RTN. Furthermore, significant correlations between PH and RDW, 315
TRL, SA, RV and RTN (P < 0.01) were also detected. We thus suggest that some root 316
and yield-related traits could be controlled by a single gene. For example, it was 317
reported that there were genes or QTLs likely controlling both plant height and root 318
traits (Bai et al. 2013; Ehdaie et al. 2016; Kabir et al. 2015). This might be another 319
reason that root traits were significantly related to agronomic traits (such as SNS and 320
TGW). 321
FD showed significant correlation with MRL. It is known that a plant with longer 322
growth period need to absorb more water and nutrients from deeper soil layers to 323
complete the period from vegetative to reproductive stage (Salvador R and Pearce R 324
1995). Therefore, longer roots could undoubtedly benefit the absorption and 325
utilization of the water and nutrients and thus help the growth and development of a 326
plant. The fact that Q1028 showed a longer growth stage (Luo et al. 2016) and root 327
length than ZM9023 may further explain the significant correlation between root traits 328
and FD in this study. 329
330
Acknowledgements 331
This work was supported by the projects from the National Natural Science 332
Foundation of China (31570335 and 31601292), the Applied Basic Research 333
(2016JY0010) and International Science and Technology Cooperation and Exchanges 334
(2017HH0076) Programs of Science and Technology Department of Sichuan 335
Province. 336
References 337
An, D., Su, J., Liu, Q., Zhu, Y., Tong, Y., Li, J., et al. 2006. Mapping QTLs for 338
nitrogen uptake in relation to the early growth of wheat (Triticum aestivum L.). Plant 339
Soil 284(1): 73-84. doi:10.1007/s11104-006-0030-3. 340
Ayalew, H., Liu, H., and Yan, G. 2017. Identification and validation of root length 341
Page 10 of 20
https://mc06.manuscriptcentral.com/genome-pubs
Genome
Draft
11
QTLs for water stress resistance in hexaploid wheat (Titicum aestivum L.). Euphytica 342
213(6): 126. doi:10.1007/s10681-017-1914-4. 343
Bai, C., Liang, Y., and Hawkesford, M.J. 2013. Identification of QTLs associated with 344
seedling root traits and their correlation with plant height in wheat. J. Exp. Bot. 64(6): 345
1745–1753. doi:10.1093/jxb/ert041. 346
Boyer, J.S. 1996. Advances in drought tolerance in plants. Adv. Agron. 56(08): 347
187-218. 348
Caassen, N., and Barber, S. 1976. Simulation model for nutrient uptake from soil by a 349
growing plant root system. Agron. J. 68(6): 961-964. 350
doi:10.2134/agronj1976.00021962006800060030x. 351
Clark, L.J., Price, A.H., Steele, K.A., and Whalley, W.R. 2008. Evidence from 352
near-isogenic lines that root penetration increases with root diameter and bending 353
stiffness in rice. Funct Plant Biol. 35(11): 1163-1171. doi:10.1071/FP08132. 354
Doligez, A., Bertrand, Y., Farnos, M., Grolier, M., Romieu, C., Esnault, F., et al. 2013. 355
New stable QTLs for berry weight do not colocalize with QTLs for seed traits in 356
cultivated grapevine (Vitis vinifera L.). BMC Plant Biology 13(1): 217. 357
doi:10.1186/1471-2229-13-217. 358
Ehdaie, B., Mohammadi, S.A., and Nouraein, M. 2016. QTLs for root traits at 359
mid-tillering and for root and shoot traits at maturity in a RIL population of spring 360
bread wheat grown under well-watered conditions. Euphytica 211(1): 17-38. 361
doi:10.1007/s10681-016-1670-x. 362
Fitter, A. 2002. Characteristics and functions of root systems. In: Waisel Y, Eshel A, 363
Kafkafi U, editors. Plant roots: the hidden half. Marcel Dekker, New York, USA.: 364
249-259. 365
Fukai, S., and Cooper, M. 1995. Development of drought-resistant cultivars using 366
physiomorphological traits in rice. Field Crops Res. 40(2): 67-86. 367
doi:10.1016/0378-4290(94)00096-U. 368
Ibrahim, S.E., Schubert, A., Pillen, K., and Léon, J. 2012. QTL analysis of drought 369
tolerance for seedling root morphological traits in an advanced backcross population 370
of spring wheat. Int. J. Agrisci. 2(7): 619-629. 371
Jiang, Y.F., Lan, X.J., Luo, W., Kong, X.C., Qi, P.F., Wang, J.R., et al. 2014. 372
Genome-wide quantitative trait locus mapping identifies multiple major loci for brittle 373
rachis and threshability in Tibetan semi-wild wheat (Triticum aestivum ssp. tibetanum 374
Shao). Plos One 9(12): e114066-e114066. doi:10.1371/journal.pone.0114066. 375
Jiang, Y.F., Wang, J.R., Luo, W., Wei, Y.M., Qi, P.F., Liu, Y.X., et al. 2015. 376
Quantitative trait locus mapping for seed dormancy in different post-ripening stages in 377
a Tibetan semi-wild wheat ( Triticum aestivum ssp . tibetanum Shao). Euphytica 378
203(3): 557-567. doi:10.1007/s10681-014-1266-2. 379
Kabir, M.R., Liu, G., Guan, P., Wang, F., Khan, A.A., Ni, Z., et al . 2015. Mapping 380
QTLs associated with root traits using two different populations in wheat (Triticum 381
aestivum L.). Euphytica 206(1): 175-190. doi: 10.1007/s10681-015-1495-z. 382
Lin, H., Qian, H., Zhuang, J., Lu, J., Min, S., Xiong, Z., et al. 1996. RFLP mapping of 383
QTLs for yield and related characters in rice (Oryza sativa L.). Theor. Appl. Genet. 384
Page 11 of 20
https://mc06.manuscriptcentral.com/genome-pubs
Genome
Draft
12
92(8): 920-927. doi: 10.1007/BF00224031. 385
Liu, G., Jia, L., Lu, L., Qin, D., Zhang, J., Guan, P.,et al. 2014. Mapping QTLs of 386
yield-related traits using RIL population derived from common wheat and Tibetan 387
semi-wild wheat. Theor. Appl. Gene. 127(11): 2415-2432. doi: 388
10.1007/s00122-014-2387-7. 389
Liu, S. 2010. Genetic diversity analysis of Triticum aestivum ssp. tibetanum Shao. 390
M.S. Thesis. Northwest Agriculture and Forestry Univ., Yangling, China. 391
Liu, X., Li, R., Chang, X., and Jing, R. 2013. Mapping QTLs for seedling root traits in 392
a doubled haploid wheat population under different water regimes. Euphytica 189(1): 393
51-66. doi: 10.1007/s10681-012-0690-4. 394
Ludlow, M.M., and Muchow, R.C. 1990. A Critical Evaluation of Traits for Improving 395
Crop Yields in Water-Limited Environments 1. Adv. Agron. 43: 107-153. doi: 396
10.1016/S0065-2113(08)60477-0. 397
Luo, W., Ma, J., Zhou, X.-H., Sun, M., Kong, X.-C., Wei, Y.-M.,et al. 2016. 398
Identification of Quantitative Trait Loci Controlling Agronomic Traits Indicates 399
Breeding Potential of Tibetan Semiwild Wheat (ssp.). Crop Sci. 56(5): 2410-2420. 400
doi:10.2135/cropsci2015.11.0700. 401
Maccaferri, M., El-Feki, W., Nazemi, G., Salvi, S., Canè, M.A., Colalongo, M.C., et al. 402
2016. Prioritizing quantitative trait loci for root system architecture in tetraploid 403
wheat. J. Exp. Bot. 67(4): 1161-1178. doi: 10.1093/jxb/erw039. 404
Manschadi, A.M., Hammer, G.L., Christopher, J.T., and Devoil, P. 2008. Genotypic 405
variation in seedling root architectural traits and implications for drought adaptation in 406
wheat (Triticum aestivum L.). Plant Soil 303(1-2): 115-129. doi: 407
10.1007/s11104-007-9492-1. 408
McPhee, K. 2005. Variation for seedling root architecture in the core collection of pea 409
germplasm. Crop Sci. 45(5): 1758-1763. doi:10.2135/cropsci2004.0544. 410
Moudal, S., and Kour, K. 2004. Genetic variability and correlation coefficients of 411
some root characteristics and yield components in bread wheat (Triticum aestivum L.) 412
under rainfed condition. Environ. Ecol. 22: 646-648. 413
Narayanan, S., Mohan, A., Gill, K.S., and Prasad, P.V.V. 2014. Variability of Root 414
Traits in Spring Wheat Germplasm. Plos One 9(6): e100317. 415
doi:10.1371/journal.pone.0100317. 416
Partha, D., Ali, M., and Sarkar, H. 2004. Genetical studies on roots in bread wheat. J 417
Interacademicia 8(2): 166-168. 418
Petrarulo, M., Marone, D., Ferragonio, P., Cattivelli, L., Rubiales, D., De Vita, et al. 419
Genetic analysis of root morphological traits in wheat. Mol. Genet. Genomics 290(3): 420
785-806. doi:10.1007/s0043. 421
Poorter, H., and Nagel, O. 2000. The role of biomass allocation in the growth 422
response of plants to different levels of light, CO2, nutrients and water: a quantitative 423
review. Funct. Plant Biol. 27(6): 1191-1191. doi:10.1071/PP99173_CO. 424
Ren, Y., He, X., Liu, D., Li, J., Zhao, X., Li, B., et al. 2012. Major quantitative trait 425
loci for seminal root morphology of wheat seedlings. Mol. Breed. 30(1): 139-148. 426
doi:10.1007/s11032-011-9605-7. 427
Page 12 of 20
https://mc06.manuscriptcentral.com/genome-pubs
Genome
Draft
13
Reynolds, M., Foulkes, J., Furbank, R., Griffiths, S., King, J., Murchie, E., et al. 2012. 428
Achieving yield gains in wheat. Plant, Cell Environ. 35(10): 1799-1823. 429
doi:10.1111/j.1365-3040.2012.02588.x. 430
Rogers, E.D., and Benfey, P.N. 2015. Regulation of plant root system architecture: 431
implications for crop advancement. Curr. Opin. Biotechnol. 32: 93-98. doi: 432
10.1016/j.copbio.2014.11.015. 433
Salvador R, J., and Pearce R, B. 1995. Proposed standard system of nomenclature for 434
maize grain filling events and concepts. Maydica 40(2): 141-146. 435
Serraj, R., Krishnamurthy, L., Kashiwagi, J., Kumar, J., Chandra, S., and Crouch, J. 436
2004. Variation in root traits of chickpea (Cicer arietinum L.) grown under terminal 437
drought. Field Crops Res. 88(2): 115-127. doi:10.1016/j.fcr.2003.12.001. 438
Shang, L., Cai, S., Ma, L., Wang, Y., Abduweli, A., Wang, M., et al. 2016. Seedling 439
root QTLs analysis on dynamic development and upon nitrogen deficiency stress in 440
Upland cotton. Euphytica 207(3): 645-663. doi: 10.1007/s10681-015-1564-3. 441
Shao, Q.Q., Li, C.S., and Basang, C.R. 1980. Semiwild wheat from Tibet. Acta Genet. 442
Sinica 7: 149-156. 443
Sun, Q., Ni, Z., Liu, Z., Gao, J., and Huang, T. 1998. Genetic relationships and 444
diversity among Tibetan wheat, common wheat and European spelt wheat revealed by 445
RAPD markers. Euphytica 99(3): 205-211. doi: 10.1023/A:1018316129246. 446
Wang, J., Li, H., Zhang, L., and Meng, L. 2012. QTL IciMapping version 3.2. 447
Quantitative Genetics Group Inst. of Crop Science, Chinese Academy of Agricultural 448
Sciences, Beijing. 449
Yoshida, S., and Hasegawa, S. 1982. The rice root system: its development and 450
function. IRRI, Los Bafios, Philippines. pp. 97-114. 451
452
453
Page 13 of 20
https://mc06.manuscriptcentral.com/genome-pubs
Genome
Draft
14
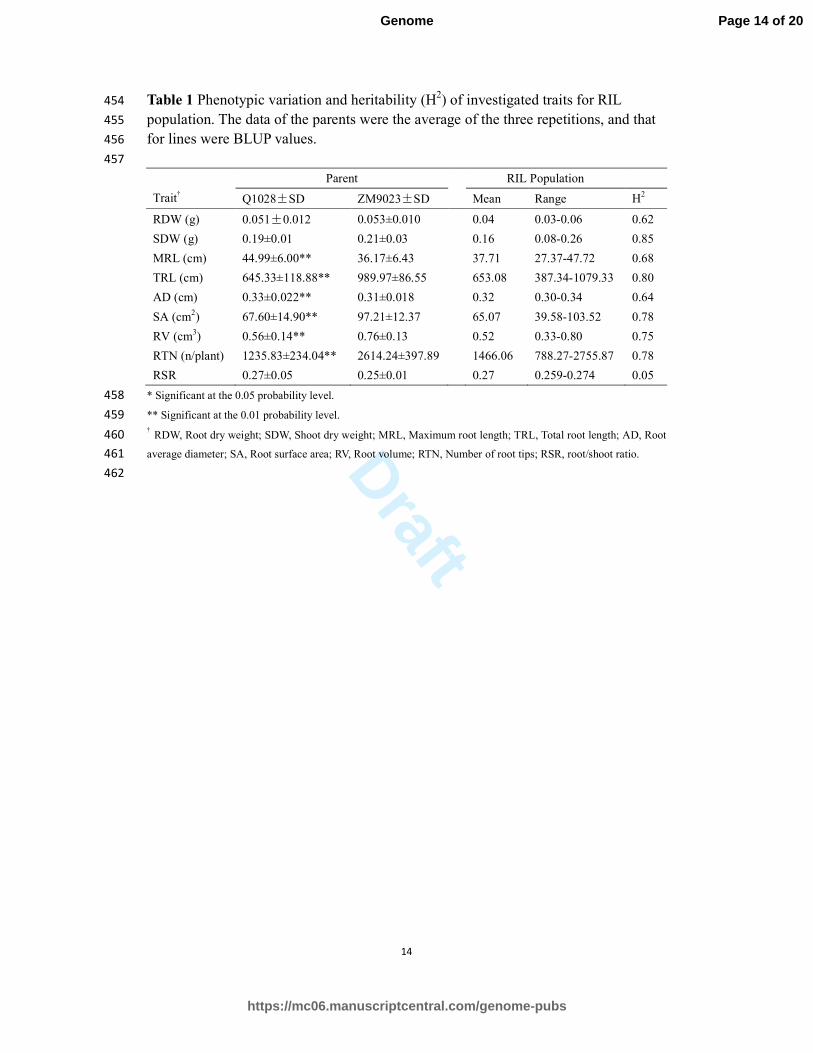
Table 1 Phenotypic variation and heritability (H2) of investigated traits for RIL 454
population. The data of the parents were the average of the three repetitions, and that 455
for lines were BLUP values. 456
457
Trait†
Parent RIL Population
Q1028±SD ZM9023±SD Mean Range H2
RDW (g) 0.051±0.012 0.053±0.010 0.04 0.03-0.06 0.62
SDW (g) 0.19±0.01 0.21±0.03 0.16 0.08-0.26 0.85
MRL (cm) 44.99±6.00** 36.17±6.43 37.71 27.37-47.72 0.68
TRL (cm) 645.33±118.88** 989.97±86.55 653.08 387.34-1079.33 0.80
AD (cm) 0.33±0.022** 0.31±0.018 0.32 0.30-0.34 0.64
SA (cm2) 67.60±14.90** 97.21±12.37 65.07 39.58-103.52 0.78
RV (cm3) 0.56±0.14** 0.76±0.13 0.52 0.33-0.80 0.75
RTN (n/plant) 1235.83±234.04** 2614.24±397.89 1466.06 788.27-2755.87 0.78
RSR 0.27±0.05 0.25±0.01 0.27 0.259-0.274 0.05
* Significant at the 0.05 probability level. 458
** Significant at the 0.01 probability level. 459
† RDW, Root dry weight; SDW, Shoot dry weight; MRL, Maximum root length; TRL, Total root length; AD, Root 460
average diameter; SA, Root surface area; RV, Root volume; RTN, Number of root tips; RSR, root/shoot ratio. 461
462
Page 14 of 20
https://mc06.manuscriptcentral.com/genome-pubs
Genome
Draft
15
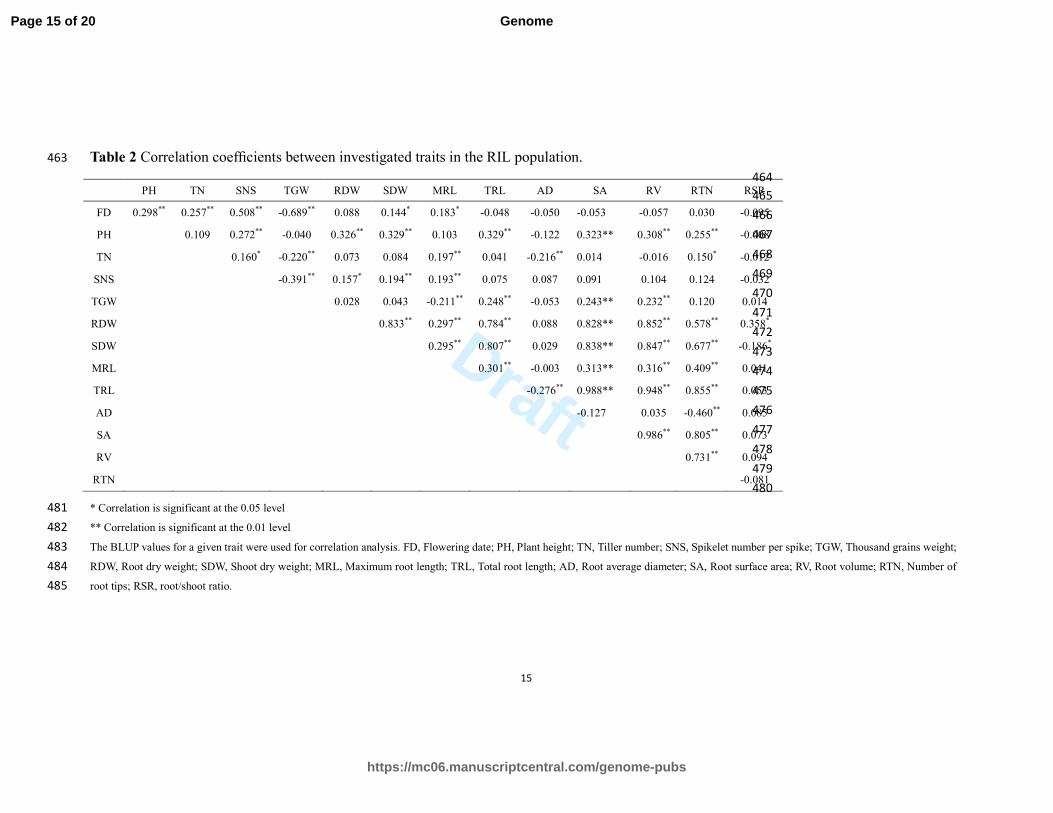
Table 2 Correlation coefficients between investigated traits in the RIL population. 463
464
465
466
467
468
469
470
471
472
473
474
475
476
477
478
479
480
* Correlation is significant at the 0.05 level 481
** Correlation is significant at the 0.01 level 482
The BLUP values for a given trait were used for correlation analysis. FD, Flowering date; PH, Plant height; TN, Tiller number; SNS, Spikelet number per spike; TGW, Thousand grains weight; 483
RDW, Root dry weight; SDW, Shoot dry weight; MRL, Maximum root length; TRL, Total root length; AD, Root average diameter; SA, Root surface area; RV, Root volume; RTN, Number of 484
root tips; RSR, root/shoot ratio. 485
PH TN SNS TGW RDW SDW MRL TRL AD SA RV RTN RSR
FD 0.298** 0.257** 0.508** -0.689** 0.088 0.144* 0.183* -0.048 -0.050 -0.053 -0.057 0.030 -0.095
PH 0.109 0.272** -0.040 0.326** 0.329** 0.103 0.329** -0.122 0.323** 0.308** 0.255** -0.008
TN 0.160* -0.220** 0.073 0.084 0.197** 0.041 -0.216** 0.014 -0.016 0.150* -0.012
SNS -0.391** 0.157* 0.194** 0.193** 0.075 0.087 0.091 0.104 0.124 -0.032
TGW 0.028 0.043 -0.211** 0.248** -0.053 0.243** 0.232** 0.120 0.014
RDW 0.833** 0.297** 0.784** 0.088 0.828** 0.852** 0.578** 0.358*
SDW 0.295** 0.807** 0.029 0.838** 0.847** 0.677** -0.186*
MRL 0.301** -0.003 0.313** 0.316** 0.409** 0.041
TRL -0.276** 0.988** 0.948** 0.855** 0.053
AD -0.127 0.035 -0.460** 0.085
SA 0.986** 0.805** 0.073
RV 0.731** 0.094
RTN -0.081
Page 15 of 20
https://mc06.manuscriptcentral.com/genome-pubs
Genome
Draft
16
486
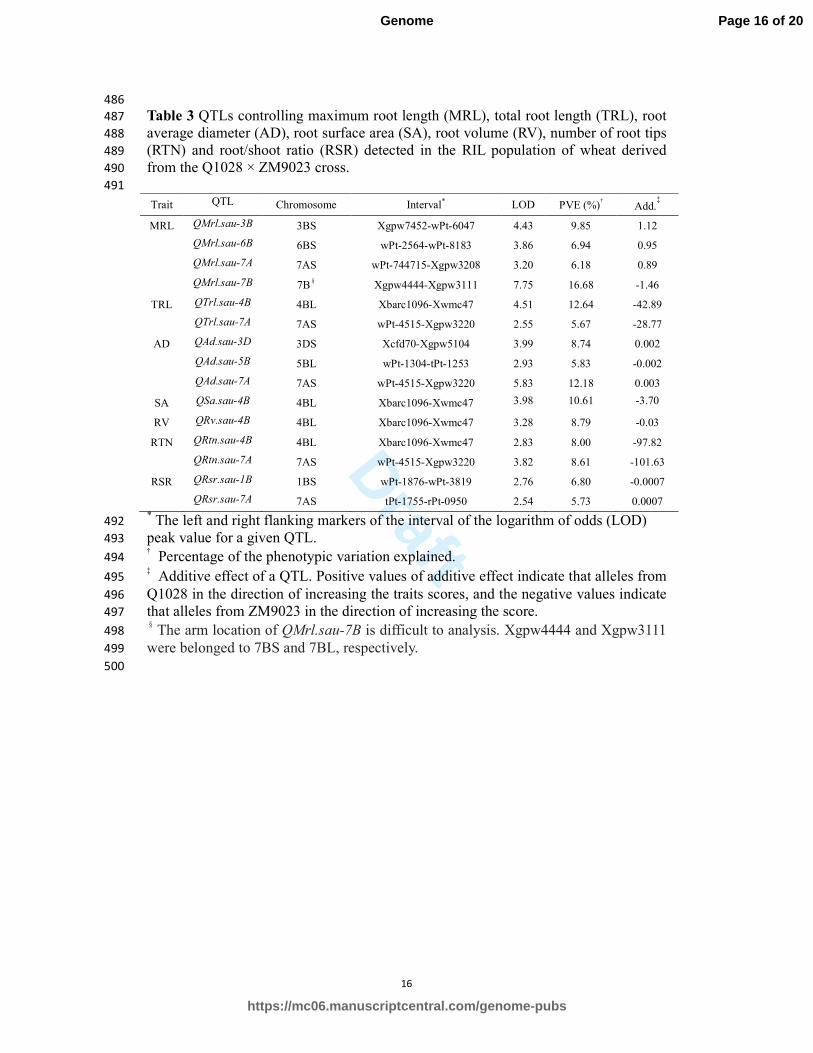
Table 3 QTLs controlling maximum root length (MRL), total root length (TRL), root 487
average diameter (AD), root surface area (SA), root volume (RV), number of root tips 488
(RTN) and root/shoot ratio (RSR) detected in the RIL population of wheat derived 489
from the Q1028 × ZM9023 cross. 490
491
Trait QTL Chromosome Interval* LOD PVE (%)† Add.
‡
MRL QMrl.sau-3B 3BS Xgpw7452-wPt-6047 4.43 9.85 1.12
QMrl.sau-6B 6BS wPt-2564-wPt-8183 3.86 6.94 0.95
QMrl.sau-7A 7AS wPt-744715-Xgpw3208 3.20 6.18 0.89
QMrl.sau-7B 7B§ Xgpw4444-Xgpw3111 7.75 16.68 -1.46
TRL QTrl.sau-4B 4BL Xbarc1096-Xwmc47 4.51 12.64 -42.89
QTrl.sau-7A 7AS wPt-4515-Xgpw3220 2.55 5.67 -28.77
AD QAd.sau-3D 3DS Xcfd70-Xgpw5104 3.99 8.74 0.002
QAd.sau-5B 5BL wPt-1304-tPt-1253 2.93 5.83 -0.002
QAd.sau-7A 7AS wPt-4515-Xgpw3220 5.83 12.18 0.003
SA QSa.sau-4B 4BL Xbarc1096-Xwmc47 3.98 10.61 -3.70
RV QRv.sau-4B 4BL Xbarc1096-Xwmc47 3.28 8.79 -0.03
RTN QRtn.sau-4B 4BL Xbarc1096-Xwmc47 2.83 8.00 -97.82
QRtn.sau-7A 7AS wPt-4515-Xgpw3220 3.82 8.61 -101.63
RSR QRsr.sau-1B 1BS wPt-1876-wPt-3819 2.76 6.80 -0.0007
QRsr.sau-7A 7AS tPt-1755-rPt-0950 2.54 5.73 0.0007
* The left and right flanking markers of the interval of the logarithm of odds (LOD) 492
peak value for a given QTL. 493
† Percentage of the phenotypic variation explained. 494
‡ Additive effect of a QTL. Positive values of additive effect indicate that alleles from 495
Q1028 in the direction of increasing the traits scores, and the negative values indicate 496
that alleles from ZM9023 in the direction of increasing the score. 497
§ The arm location of QMrl.sau-7B is difficult to analysis. Xgpw4444 and Xgpw3111 498
were belonged to 7BS and 7BL, respectively. 499
500
Page 16 of 20
https://mc06.manuscriptcentral.com/genome-pubs
Genome
Draft
17
Figure legends 501
Fig. 1 Comparison of root systems for ZM9023 and Q1028. Scale represents 10 cm. 502
Fig. 2 Frequency distributions of the root traits from the RIL population. Data was 503
based on BLUP values of the investigated experiments. The black arrow indicates the 504
value of Q1028 and the white arrow indicates ZM9023. 505
Fig. 3 QTLs for the root traits of the RIL population. Abbreviations for traits are: 506
MRL, Maximum root length; TRL, Total root length; AD, root average diameter; SA, 507
Root surface area; RV, root volume; RSR, root/shoot ratio; RTN, number. 508
Page 17 of 20
https://mc06.manuscriptcentral.com/genome-pubs
Genome
Draft
Fig. 1 Comparison of root systems for ZM9023 and Q1028. Scale represents 10 cm.
122x279mm (300 x 300 DPI)
Page 18 of 20
https://mc06.manuscriptcentral.com/genome-pubs
Genome
Draft
Fig. 2 Frequency distributions of the root traits from the RIL population. Data was based on BLUP values of the investigated experiments. The black arrow indicates the value of Q1028 and the white arrow indicates
ZM9023.
73x63mm (300 x 300 DPI)
Page 19 of 20
https://mc06.manuscriptcentral.com/genome-pubs
Genome
Draft
Fig. 3 QTLs for the root traits of the RIL population. Abbreviations for traits are: MRL, Maximum root length; TRL, Total root length; AD, root average diameter; SA, Root surface area; RV, root volume; RSR, root/shoot
ratio; RTN, number.
76x85mm (600 x 600 DPI)
Page 20 of 20
https://mc06.manuscriptcentral.com/genome-pubs
Genome


![Welcome! [exploriumbrew.com] · 7/20/2020 · 32oz Crowler To-Go 10 Guava Wheat Wheat Beer - Other / 5.3% ABV / 20 IBU 4oz Draft 2 12oz Draft 6 32oz Crowler To-Go 12 Sligo Sunset](https://img.pdfslide.net/doc/110x75/5fdb4f97b6504f72e1468cb6/welcome-7202020-32oz-crowler-to-go-10-guava-wheat-wheat-beer-other-.jpg)