Embed Size (px)
Citation preview
www.elsevier.com/locate/geomorph
Geomorphology 55 (2003) 25–43
Drainage, sediment transport, and denudation rates on the
Nanga Parbat Himalaya, Pakistan
Kevin Cornwella,*, Doug Norsbyb, Richard Marstonc
aDepartment of Geology, California State University-Sacramento, Sacramento, CA 95819-6043, USAbDepartment of Public Works, Watershed Division, Topeka, KS 66215, USAcSchool of Geology, Oklahoma State University, Stillwater, OK 74078, USA
Received 10 February 2002; received in revised form 30 August 2002; accepted 10 March 2003
Abstract
The Nanga Parbat Himalaya presents some of the greatest relief on Earth, yet sediment production and denudation rates have
only been sporadically addressed. We utilized field measurements and computer models to estimate bank full discharge,
sediment transport, and denudation rates for the Raikot and Buldar drainage basins (north slope of Nanga Parbat) and the upper
reach of the Rupal drainage basin (south slope).
The overall tasks of determining stream flow conditions in such a dynamic geomorphic setting is challenging. No gage data
exist for these drainage basins, and the overall character of the drainage basins (high relief, steep flow gradients, and turbulent
flow conditions) does not lend itself to either ready access or complete profiling.
Cross-sectional profiles were surveyed through selected reaches of these drainage basins. These data were then incorporated
into software (WinXSPRO) that aids in the characterization (stage, discharge, velocity, and shear stress) of high altitude, steep
mountain stream conditions.
Complete field measurements of channel depths were rarely possible (except at several bridges where the middle of the
channel could actually be straddled and probed) and, when coupled with velocity measurements, provided discrete points of
field-measured discharge calculations. These points were then used to calibrate WinXSPRO results for the same reach and
provided a confidence level for computer-generated results.
Flow calculations suggest that under near bank full conditions, the upper Raikot drainage basin produces discharges of
f 61 cm and moves about 11,000 tons day� 1 (9980 tons day� 1) of sediment through its channel. Bank full conditions on
the upper portion of the Rupal drainage basin generate discharges of f 84 cm and moves only about 3800 tons day� 1 (3450
tons day� 1) of sediment. Although the upper Rupal drainage basin moves more water, the lower slope of the drainage basin
(0.03) generates a much smaller shear stress (461 Pa) than does the higher slope (0.12) of the upper Raikot drainage basin
(1925 Pa).
Dissolved and suspended sediment loads were measured from water/sediment samples collected throughout the day and
night over a period of 10 days at the height of the summer melt season but proved to be a minor variable in transport flux.
Channel bed loads were measured using a pebble count method of bank material and then used to generate ratings curves of bed
loads relative to discharge volumes. When coupled with discharge data and basin area, mean annual sediment yield and
denudation rates for Nanga Parbat are produced. Denudation rates calculated in this fashion range from 0.2 mm year� 1 in the
0169-555X/03/$ - see front matter D 2003 Elsevier B.V. All rights reserved.
doi:10.1016/S0169-555X(03)00130-2
* Corresponding author. Tel.: +1-916-278-6667; fax: +1-916-278-4650.
E-mail address: [email protected] (K. Cornwell).
K. Cornwell et al. / Geomorphology 55 (2003) 25–4326
slower, more sluggish Rupal drainage basin to almost 6 mm year� 1 in the steeper, faster flowing Raikot and Buldar drainage
basins.
D 2003 Elsevier B.V. All rights reserved.
Keywords: Sediment transport; Pakistan; Mountain denudation
1. Introduction basin area. Burbank et al. (1996), using exposure ages
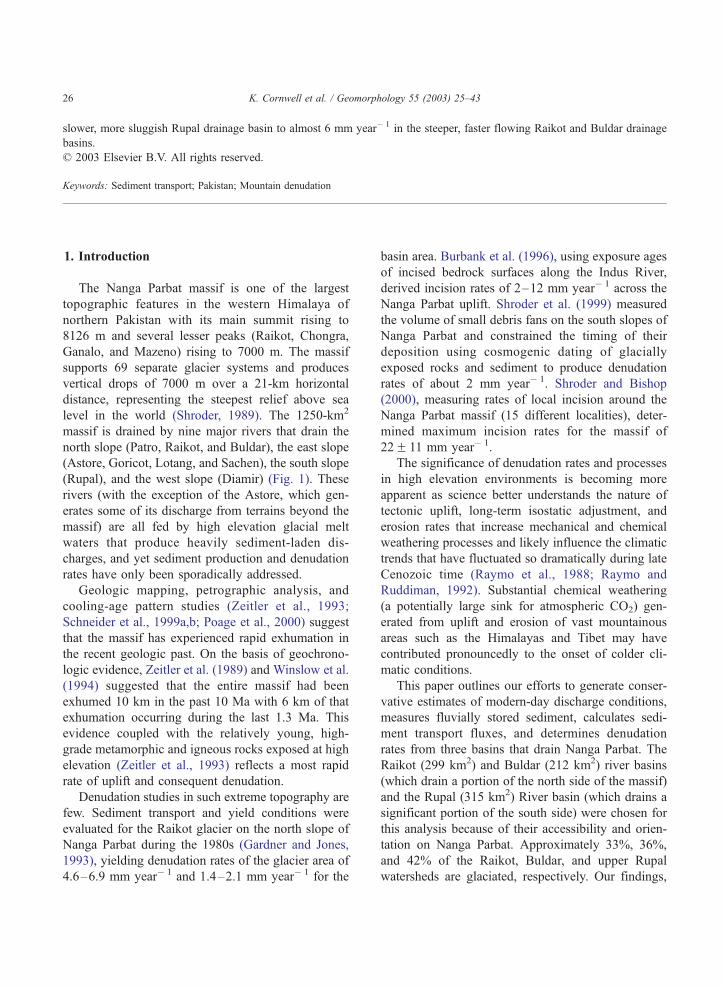
The Nanga Parbat massif is one of the largest
topographic features in the western Himalaya of
northern Pakistan with its main summit rising to
8126 m and several lesser peaks (Raikot, Chongra,
Ganalo, and Mazeno) rising to 7000 m. The massif
supports 69 separate glacier systems and produces
vertical drops of 7000 m over a 21-km horizontal
distance, representing the steepest relief above sea
level in the world (Shroder, 1989). The 1250-km2
massif is drained by nine major rivers that drain the
north slope (Patro, Raikot, and Buldar), the east slope
(Astore, Goricot, Lotang, and Sachen), the south slope
(Rupal), and the west slope (Diamir) (Fig. 1). These
rivers (with the exception of the Astore, which gen-
erates some of its discharge from terrains beyond the
massif) are all fed by high elevation glacial melt
waters that produce heavily sediment-laden dis-
charges, and yet sediment production and denudation
rates have only been sporadically addressed.
Geologic mapping, petrographic analysis, and
cooling-age pattern studies (Zeitler et al., 1993;
Schneider et al., 1999a,b; Poage et al., 2000) suggest
that the massif has experienced rapid exhumation in
the recent geologic past. On the basis of geochrono-
logic evidence, Zeitler et al. (1989) and Winslow et al.
(1994) suggested that the entire massif had been
exhumed 10 km in the past 10 Ma with 6 km of that
exhumation occurring during the last 1.3 Ma. This
evidence coupled with the relatively young, high-
grade metamorphic and igneous rocks exposed at high
elevation (Zeitler et al., 1993) reflects a most rapid
rate of uplift and consequent denudation.
Denudation studies in such extreme topography are
few. Sediment transport and yield conditions were
evaluated for the Raikot glacier on the north slope of
Nanga Parbat during the 1980s (Gardner and Jones,
1993), yielding denudation rates of the glacier area of
4.6–6.9 mm year� 1 and 1.4–2.1 mm year� 1 for the
of incised bedrock surfaces along the Indus River,
derived incision rates of 2–12 mm year� 1 across the
Nanga Parbat uplift. Shroder et al. (1999) measured
the volume of small debris fans on the south slopes of
Nanga Parbat and constrained the timing of their
deposition using cosmogenic dating of glacially
exposed rocks and sediment to produce denudation
rates of about 2 mm year� 1. Shroder and Bishop
(2000), measuring rates of local incision around the
Nanga Parbat massif (15 different localities), deter-
mined maximum incision rates for the massif of
22F 11 mm year� 1.
The significance of denudation rates and processes
in high elevation environments is becoming more
apparent as science better understands the nature of
tectonic uplift, long-term isostatic adjustment, and
erosion rates that increase mechanical and chemical
weathering processes and likely influence the climatic
trends that have fluctuated so dramatically during late
Cenozoic time (Raymo et al., 1988; Raymo and
Ruddiman, 1992). Substantial chemical weathering
(a potentially large sink for atmospheric CO2) gen-
erated from uplift and erosion of vast mountainous
areas such as the Himalayas and Tibet may have
contributed pronouncedly to the onset of colder cli-
matic conditions.
This paper outlines our efforts to generate conser-
vative estimates of modern-day discharge conditions,
measures fluvially stored sediment, calculates sedi-
ment transport fluxes, and determines denudation
rates from three basins that drain Nanga Parbat. The
Raikot (299 km2) and Buldar (212 km2) river basins
(which drain a portion of the north side of the massif)
and the Rupal (315 km2) River basin (which drains a
significant portion of the south side) were chosen for
this analysis because of their accessibility and orien-
tation on Nanga Parbat. Approximately 33%, 36%,
and 42% of the Raikot, Buldar, and upper Rupal
watersheds are glaciated, respectively. Our findings,
Fig. 1. Location map of Nanga Parbat illustrating the distribution of glacial and drainage networks on the massif.
K. Cornwell et al. / Geomorphology 55 (2003) 25–43 27
K. Cornwell et al. / Geomorphology 55 (2003) 25–4328
when combined with comparable glacial and mass
wasting estimates, would be expected to illuminate
denudation conditions/rates occurring on the Nanga
Parbat massif under modern-day climatic conditions
and further our growing understanding of denudation
rates in such high elevation environments.
2. Fluvial characteristics
Discharges emanating from the high elevation
basins included in this study are the result of seasonal
monsoon precipitation events and glacial and snow-
melt. The annual monsoon storms that impact Nanga
Parbat from the south from July through September
are the most dominant source of precipitation to the
massif. A secondary source of precipitation comes
from westerly depressions that are the major source of
precipitation during non-monsoonal times (generally
the winter months). Young and Hewitt (1990) sug-
gested that the monsoonal influence produces heavy
precipitation in basins of Nanga Parbat primarily
because of the massif’s geographic location in the
southern part of the Himalaya Range and its oro-
graphic influence on storms tracking to the north.
Coupled with the westerly depressions that also pro-
duce potentially heavy precipitation in the Himalaya
range, the Nanga Parbat massif receives an average of
over 1000 mm of precipitation annually (Ali, 1995).
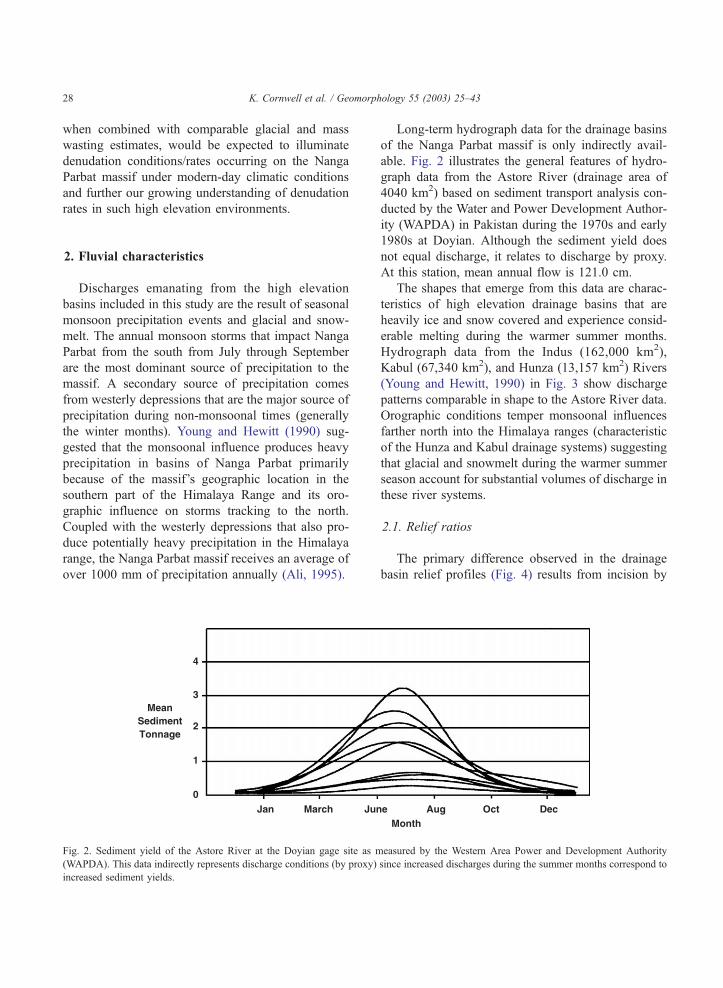
Fig. 2. Sediment yield of the Astore River at the Doyian gage site as m
(WAPDA). This data indirectly represents discharge conditions (by proxy)
increased sediment yields.
Long-term hydrograph data for the drainage basins
of the Nanga Parbat massif is only indirectly avail-
able. Fig. 2 illustrates the general features of hydro-
graph data from the Astore River (drainage area of
4040 km2) based on sediment transport analysis con-
ducted by the Water and Power Development Author-
ity (WAPDA) in Pakistan during the 1970s and early
1980s at Doyian. Although the sediment yield does
not equal discharge, it relates to discharge by proxy.
At this station, mean annual flow is 121.0 cm.
The shapes that emerge from this data are charac-
teristics of high elevation drainage basins that are
heavily ice and snow covered and experience consid-
erable melting during the warmer summer months.
Hydrograph data from the Indus (162,000 km2),
Kabul (67,340 km2), and Hunza (13,157 km2) Rivers
(Young and Hewitt, 1990) in Fig. 3 show discharge
patterns comparable in shape to the Astore River data.
Orographic conditions temper monsoonal influences
farther north into the Himalaya ranges (characteristic
of the Hunza and Kabul drainage systems) suggesting
that glacial and snowmelt during the warmer summer
season account for substantial volumes of discharge in
these river systems.
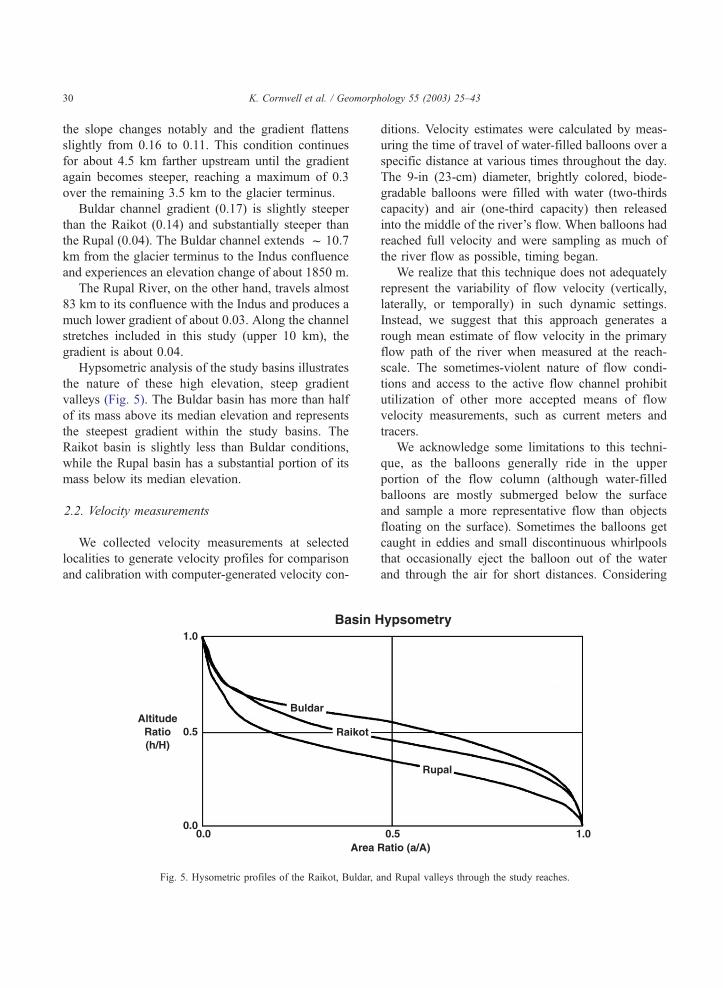
2.1. Relief ratios
The primary difference observed in the drainage
basin relief profiles (Fig. 4) results from incision by
easured by the Western Area Power and Development Authority
since increased discharges during the summer months correspond to
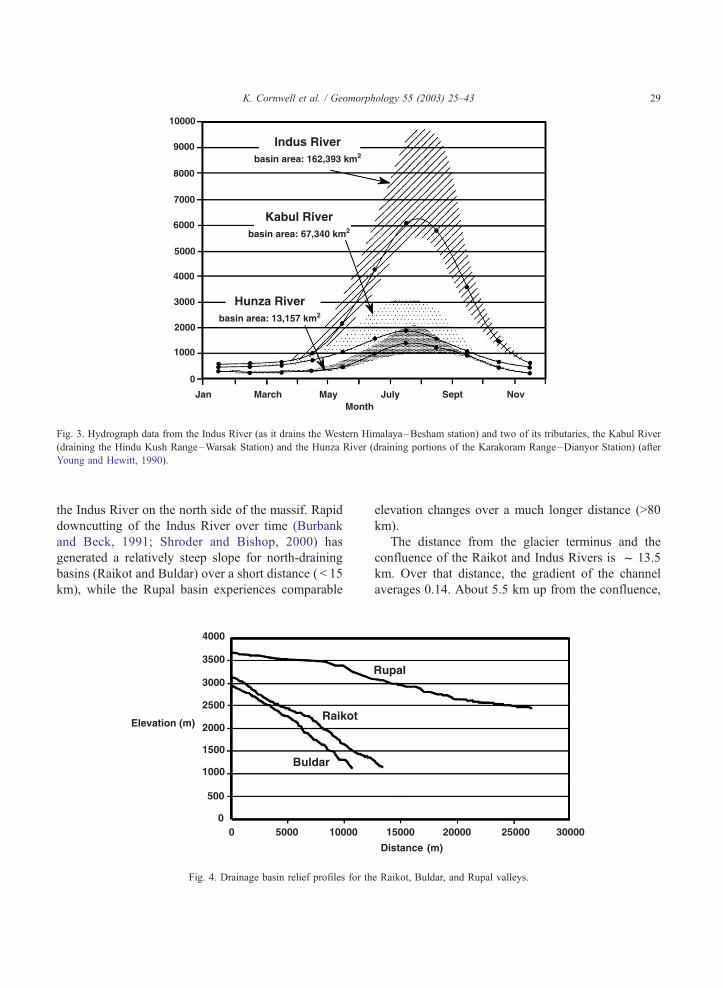
Fig. 3. Hydrograph data from the Indus River (as it drains the Western Himalaya–Besham station) and two of its tributaries, the Kabul River
(draining the Hindu Kush Range–Warsak Station) and the Hunza River (draining portions of the Karakoram Range–Dianyor Station) (after
Young and Hewitt, 1990).
K. Cornwell et al. / Geomorphology 55 (2003) 25–43 29
the Indus River on the north side of the massif. Rapid
downcutting of the Indus River over time (Burbank
and Beck, 1991; Shroder and Bishop, 2000) has
generated a relatively steep slope for north-draining
basins (Raikot and Buldar) over a short distance ( < 15
km), while the Rupal basin experiences comparable
Fig. 4. Drainage basin relief profiles for th
elevation changes over a much longer distance (>80
km).
The distance from the glacier terminus and the
confluence of the Raikot and Indus Rivers is f 13.5
km. Over that distance, the gradient of the channel
averages 0.14. About 5.5 km up from the confluence,
e Raikot, Buldar, and Rupal valleys.
K. Cornwell et al. / Geomorphology 55 (2003) 25–4330
the slope changes notably and the gradient flattens
slightly from 0.16 to 0.11. This condition continues
for about 4.5 km farther upstream until the gradient
again becomes steeper, reaching a maximum of 0.3
over the remaining 3.5 km to the glacier terminus.
Buldar channel gradient (0.17) is slightly steeper
than the Raikot (0.14) and substantially steeper than
the Rupal (0.04). The Buldar channel extends f 10.7
km from the glacier terminus to the Indus confluence
and experiences an elevation change of about 1850 m.
The Rupal River, on the other hand, travels almost
83 km to its confluence with the Indus and produces a
much lower gradient of about 0.03. Along the channel
stretches included in this study (upper 10 km), the
gradient is about 0.04.
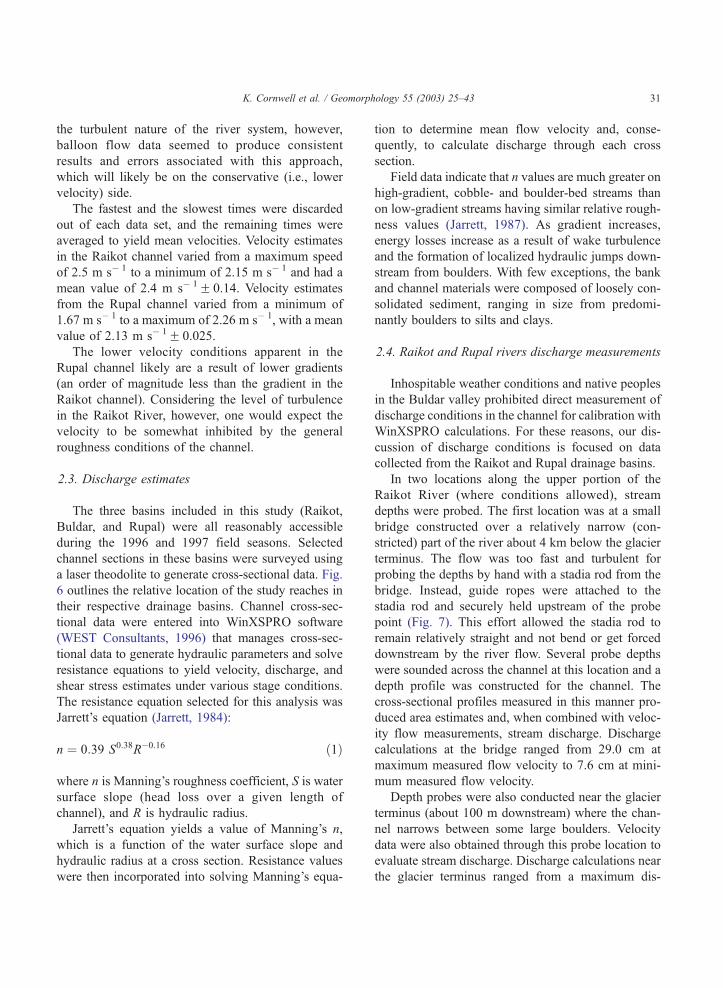
Hypsometric analysis of the study basins illustrates
the nature of these high elevation, steep gradient
valleys (Fig. 5). The Buldar basin has more than half
of its mass above its median elevation and represents
the steepest gradient within the study basins. The
Raikot basin is slightly less than Buldar conditions,
while the Rupal basin has a substantial portion of its
mass below its median elevation.
2.2. Velocity measurements
We collected velocity measurements at selected
localities to generate velocity profiles for comparison
and calibration with computer-generated velocity con-
Fig. 5. Hysometric profiles of the Raikot, Buldar, a
ditions. Velocity estimates were calculated by meas-
uring the time of travel of water-filled balloons over a
specific distance at various times throughout the day.
The 9-in (23-cm) diameter, brightly colored, biode-
gradable balloons were filled with water (two-thirds
capacity) and air (one-third capacity) then released
into the middle of the river’s flow. When balloons had
reached full velocity and were sampling as much of
the river flow as possible, timing began.
We realize that this technique does not adequately
represent the variability of flow velocity (vertically,
laterally, or temporally) in such dynamic settings.
Instead, we suggest that this approach generates a
rough mean estimate of flow velocity in the primary
flow path of the river when measured at the reach-
scale. The sometimes-violent nature of flow condi-
tions and access to the active flow channel prohibit
utilization of other more accepted means of flow
velocity measurements, such as current meters and
tracers.
We acknowledge some limitations to this techni-
que, as the balloons generally ride in the upper
portion of the flow column (although water-filled
balloons are mostly submerged below the surface
and sample a more representative flow than objects
floating on the surface). Sometimes the balloons get
caught in eddies and small discontinuous whirlpools
that occasionally eject the balloon out of the water
and through the air for short distances. Considering
nd Rupal valleys through the study reaches.
K. Cornwell et al. / Geomorphology 55 (2003) 25–43 31
the turbulent nature of the river system, however,
balloon flow data seemed to produce consistent
results and errors associated with this approach,
which will likely be on the conservative (i.e., lower
velocity) side.
The fastest and the slowest times were discarded
out of each data set, and the remaining times were
averaged to yield mean velocities. Velocity estimates
in the Raikot channel varied from a maximum speed
of 2.5 m s� 1 to a minimum of 2.15 m s� 1 and had a
mean value of 2.4 m s� 1F 0.14. Velocity estimates
from the Rupal channel varied from a minimum of
1.67 m s� 1 to a maximum of 2.26 m s� 1, with a mean
value of 2.13 m s� 1F 0.025.
The lower velocity conditions apparent in the
Rupal channel likely are a result of lower gradients
(an order of magnitude less than the gradient in the
Raikot channel). Considering the level of turbulence
in the Raikot River, however, one would expect the
velocity to be somewhat inhibited by the general
roughness conditions of the channel.
2.3. Discharge estimates
The three basins included in this study (Raikot,
Buldar, and Rupal) were all reasonably accessible
during the 1996 and 1997 field seasons. Selected
channel sections in these basins were surveyed using
a laser theodolite to generate cross-sectional data. Fig.
6 outlines the relative location of the study reaches in
their respective drainage basins. Channel cross-sec-
tional data were entered into WinXSPRO software
(WEST Consultants, 1996) that manages cross-sec-
tional data to generate hydraulic parameters and solve
resistance equations to yield velocity, discharge, and
shear stress estimates under various stage conditions.
The resistance equation selected for this analysis was
Jarrett’s equation (Jarrett, 1984):
n ¼ 0:39 S0:38R�0:16 ð1Þ
where n is Manning’s roughness coefficient, S is water
surface slope (head loss over a given length of
channel), and R is hydraulic radius.
Jarrett’s equation yields a value of Manning’s n,
which is a function of the water surface slope and
hydraulic radius at a cross section. Resistance values
were then incorporated into solving Manning’s equa-
tion to determine mean flow velocity and, conse-
quently, to calculate discharge through each cross
section.
Field data indicate that n values are much greater on
high-gradient, cobble- and boulder-bed streams than
on low-gradient streams having similar relative rough-
ness values (Jarrett, 1987). As gradient increases,
energy losses increase as a result of wake turbulence
and the formation of localized hydraulic jumps down-
stream from boulders. With few exceptions, the bank
and channel materials were composed of loosely con-
solidated sediment, ranging in size from predomi-
nantly boulders to silts and clays.
2.4. Raikot and Rupal rivers discharge measurements
Inhospitable weather conditions and native peoples
in the Buldar valley prohibited direct measurement of
discharge conditions in the channel for calibration with
WinXSPRO calculations. For these reasons, our dis-
cussion of discharge conditions is focused on data
collected from the Raikot and Rupal drainage basins.
In two locations along the upper portion of the
Raikot River (where conditions allowed), stream
depths were probed. The first location was at a small
bridge constructed over a relatively narrow (con-
stricted) part of the river about 4 km below the glacier
terminus. The flow was too fast and turbulent for
probing the depths by hand with a stadia rod from the
bridge. Instead, guide ropes were attached to the
stadia rod and securely held upstream of the probe
point (Fig. 7). This effort allowed the stadia rod to
remain relatively straight and not bend or get forced
downstream by the river flow. Several probe depths
were sounded across the channel at this location and a
depth profile was constructed for the channel. The
cross-sectional profiles measured in this manner pro-
duced area estimates and, when combined with veloc-
ity flow measurements, stream discharge. Discharge
calculations at the bridge ranged from 29.0 cm at
maximum measured flow velocity to 7.6 cm at mini-
mum measured flow velocity.
Depth probes were also conducted near the glacier
terminus (about 100 m downstream) where the chan-
nel narrows between some large boulders. Velocity
data were also obtained through this probe location to
evaluate stream discharge. Discharge calculations near
the glacier terminus ranged from a maximum dis-
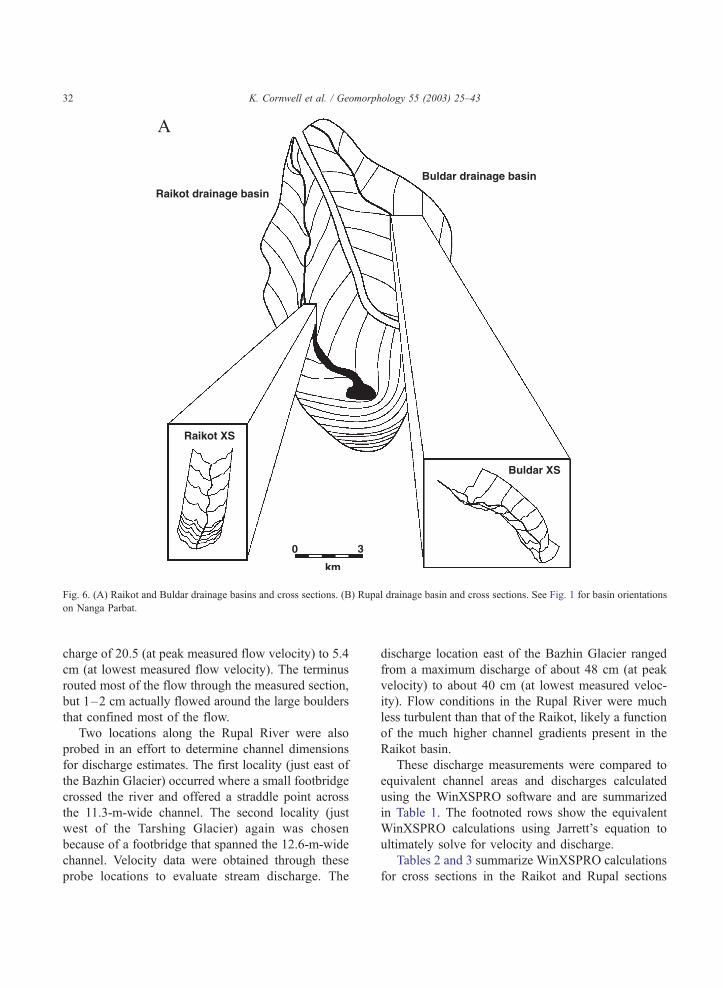
Fig. 6. (A) Raikot and Buldar drainage basins and cross sections. (B) Rupal drainage basin and cross sections. See Fig. 1 for basin orientations
on Nanga Parbat.
K. Cornwell et al. / Geomorphology 55 (2003) 25–4332
charge of 20.5 (at peak measured flow velocity) to 5.4
cm (at lowest measured flow velocity). The terminus
routed most of the flow through the measured section,
but 1–2 cm actually flowed around the large boulders
that confined most of the flow.
Two locations along the Rupal River were also
probed in an effort to determine channel dimensions
for discharge estimates. The first locality (just east of
the Bazhin Glacier) occurred where a small footbridge
crossed the river and offered a straddle point across
the 11.3-m-wide channel. The second locality (just
west of the Tarshing Glacier) again was chosen
because of a footbridge that spanned the 12.6-m-wide
channel. Velocity data were obtained through these
probe locations to evaluate stream discharge. The
discharge location east of the Bazhin Glacier ranged
from a maximum discharge of about 48 cm (at peak
velocity) to about 40 cm (at lowest measured veloc-
ity). Flow conditions in the Rupal River were much
less turbulent than that of the Raikot, likely a function
of the much higher channel gradients present in the
Raikot basin.
These discharge measurements were compared to
equivalent channel areas and discharges calculated
using the WinXSPRO software and are summarized
in Table 1. The footnoted rows show the equivalent
WinXSPRO calculations using Jarrett’s equation to
ultimately solve for velocity and discharge.
Tables 2 and 3 summarize WinXSPRO calculations
for cross sections in the Raikot and Rupal sections
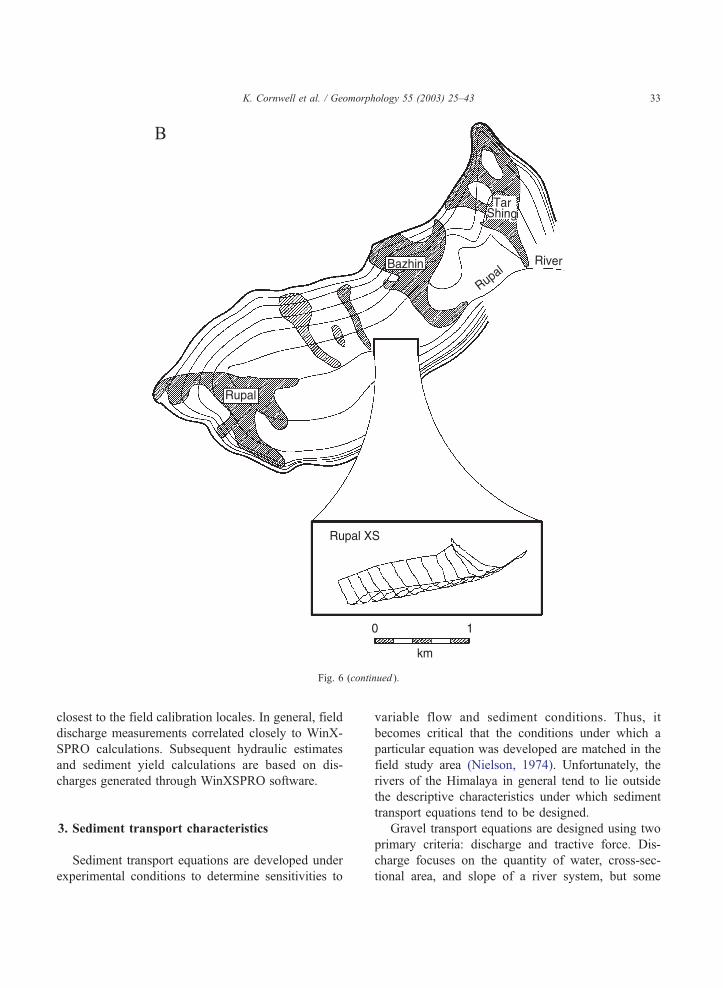
Fig. 6 (continued ).
K. Cornwell et al. / Geomorphology 55 (2003) 25–43 33
closest to the field calibration locales. In general, field
discharge measurements correlated closely to WinX-
SPRO calculations. Subsequent hydraulic estimates
and sediment yield calculations are based on dis-
charges generated through WinXSPRO software.
3. Sediment transport characteristics
Sediment transport equations are developed under
experimental conditions to determine sensitivities to
variable flow and sediment conditions. Thus, it
becomes critical that the conditions under which a
particular equation was developed are matched in the
field study area (Nielson, 1974). Unfortunately, the
rivers of the Himalaya in general tend to lie outside
the descriptive characteristics under which sediment
transport equations tend to be designed.
Gravel transport equations are designed using two
primary criteria: discharge and tractive force. Dis-
charge focuses on the quantity of water, cross-sec-
tional area, and slope of a river system, but some
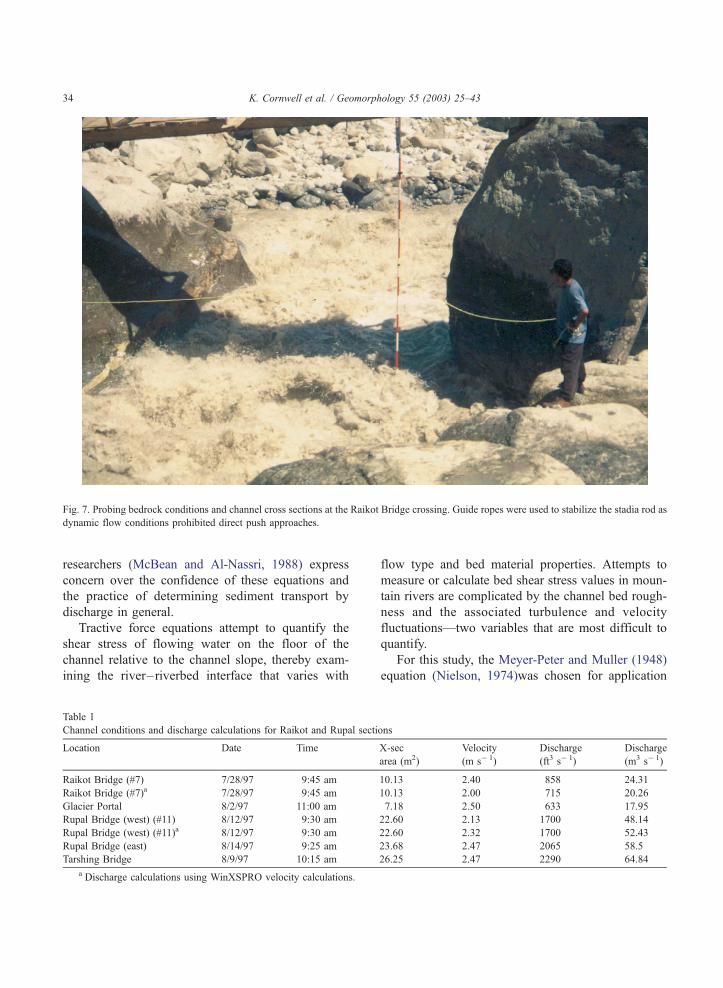
Fig. 7. Probing bedrock conditions and channel cross sections at the Raikot Bridge crossing. Guide ropes were used to stabilize the stadia rod as
dynamic flow conditions prohibited direct push approaches.
K. Cornwell et al. / Geomorphology 55 (2003) 25–4334
researchers (McBean and Al-Nassri, 1988) express
concern over the confidence of these equations and
the practice of determining sediment transport by
discharge in general.
Tractive force equations attempt to quantify the
shear stress of flowing water on the floor of the
channel relative to the channel slope, thereby exam-
ining the river–riverbed interface that varies with
Table 1
Channel conditions and discharge calculations for Raikot and Rupal secti
Location Date Time
Raikot Bridge (#7) 7/28/97 9:45 am
Raikot Bridge (#7)a 7/28/97 9:45 am
Glacier Portal 8/2/97 11:00 am
Rupal Bridge (west) (#11) 8/12/97 9:30 am
Rupal Bridge (west) (#11)a 8/12/97 9:30 am
Rupal Bridge (east) 8/14/97 9:25 am
Tarshing Bridge 8/9/97 10:15 am
a Discharge calculations using WinXSPRO velocity calculations.
flow type and bed material properties. Attempts to
measure or calculate bed shear stress values in moun-
tain rivers are complicated by the channel bed rough-
ness and the associated turbulence and velocity
fluctuations—two variables that are most difficult to
quantify.
For this study, the Meyer-Peter and Muller (1948)
equation (Nielson, 1974)was chosen for application
ons
X-sec
area (m2)
Velocity
(m s� 1)
Discharge
(ft3 s� 1)
Discharge
(m3 s� 1)
10.13 2.40 858 24.31
10.13 2.00 715 20.26
7.18 2.50 633 17.95
22.60 2.13 1700 48.14
22.60 2.32 1700 52.43
23.68 2.47 2065 58.5
26.25 2.47 2290 64.84
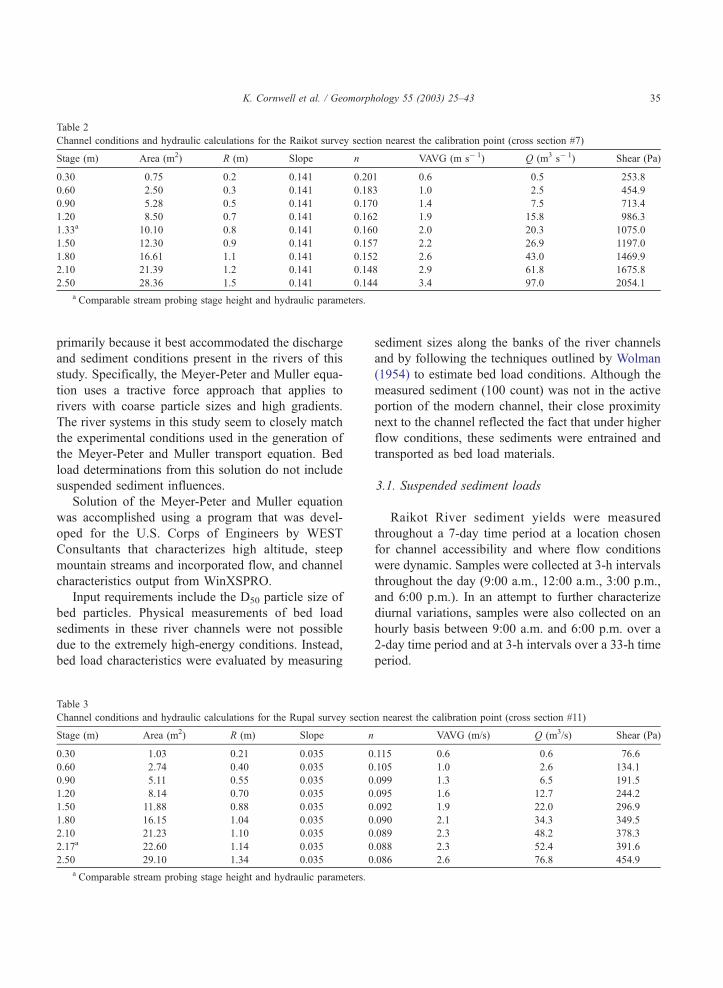
Table 2
Channel conditions and hydraulic calculations for the Raikot survey section nearest the calibration point (cross section #7)
Stage (m) Area (m2) R (m) Slope n VAVG (m s� 1) Q (m3 s� 1) Shear (Pa)
0.30 0.75 0.2 0.141 0.201 0.6 0.5 253.8
0.60 2.50 0.3 0.141 0.183 1.0 2.5 454.9
0.90 5.28 0.5 0.141 0.170 1.4 7.5 713.4
1.20 8.50 0.7 0.141 0.162 1.9 15.8 986.3
1.33a 10.10 0.8 0.141 0.160 2.0 20.3 1075.0
1.50 12.30 0.9 0.141 0.157 2.2 26.9 1197.0
1.80 16.61 1.1 0.141 0.152 2.6 43.0 1469.9
2.10 21.39 1.2 0.141 0.148 2.9 61.8 1675.8
2.50 28.36 1.5 0.141 0.144 3.4 97.0 2054.1
a Comparable stream probing stage height and hydraulic parameters.
K. Cornwell et al. / Geomorphology 55 (2003) 25–43 35
primarily because it best accommodated the discharge
and sediment conditions present in the rivers of this
study. Specifically, the Meyer-Peter and Muller equa-
tion uses a tractive force approach that applies to
rivers with coarse particle sizes and high gradients.
The river systems in this study seem to closely match
the experimental conditions used in the generation of
the Meyer-Peter and Muller transport equation. Bed
load determinations from this solution do not include
suspended sediment influences.
Solution of the Meyer-Peter and Muller equation
was accomplished using a program that was devel-
oped for the U.S. Corps of Engineers by WEST
Consultants that characterizes high altitude, steep
mountain streams and incorporated flow, and channel
characteristics output from WinXSPRO.
Input requirements include the D50 particle size of
bed particles. Physical measurements of bed load
sediments in these river channels were not possible
due to the extremely high-energy conditions. Instead,
bed load characteristics were evaluated by measuring
Table 3
Channel conditions and hydraulic calculations for the Rupal survey sectio
Stage (m) Area (m2) R (m) Slope n
0.30 1.03 0.21 0.035 0
0.60 2.74 0.40 0.035 0
0.90 5.11 0.55 0.035 0
1.20 8.14 0.70 0.035 0
1.50 11.88 0.88 0.035 0
1.80 16.15 1.04 0.035 0
2.10 21.23 1.10 0.035 0
2.17a 22.60 1.14 0.035 0
2.50 29.10 1.34 0.035 0
a Comparable stream probing stage height and hydraulic parameters.
sediment sizes along the banks of the river channels
and by following the techniques outlined by Wolman
(1954) to estimate bed load conditions. Although the
measured sediment (100 count) was not in the active
portion of the modern channel, their close proximity
next to the channel reflected the fact that under higher
flow conditions, these sediments were entrained and
transported as bed load materials.
3.1. Suspended sediment loads
Raikot River sediment yields were measured
throughout a 7-day time period at a location chosen
for channel accessibility and where flow conditions
were dynamic. Samples were collected at 3-h intervals
throughout the day (9:00 a.m., 12:00 a.m., 3:00 p.m.,
and 6:00 p.m.). In an attempt to further characterize
diurnal variations, samples were also collected on an
hourly basis between 9:00 a.m. and 6:00 p.m. over a
2-day time period and at 3-h intervals over a 33-h time
period.
n nearest the calibration point (cross section #11)
VAVG (m/s) Q (m3/s) Shear (Pa)
.115 0.6 0.6 76.6
.105 1.0 2.6 134.1
.099 1.3 6.5 191.5
.095 1.6 12.7 244.2
.092 1.9 22.0 296.9
.090 2.1 34.3 349.5
.089 2.3 48.2 378.3
.088 2.3 52.4 391.6
.086 2.6 76.8 454.9
K. Cornwell et al. / Geomorphology 55 (2003) 25–4336
Suspended sediment concentrations were deter-
mined using National Water Well Association Method
2540 D (Clesceri et al., 1989). Specifically, a sample
50–100 ml was collected from an active flow portion
of the river channel. The sample volume was precisely
measured in a graduated cylinder and then slowly
pulled by vacuum through a preweighed 45-Am filter.
The sediment-laden filter was then dried at f 100–
105 jF (23.6–26.3 jC) and placed in a desiccator
until cooled. The cooled samples were weighed to the
nearest 0.001 g and sediment concentrations calcu-
lated in units of mg l� 1.
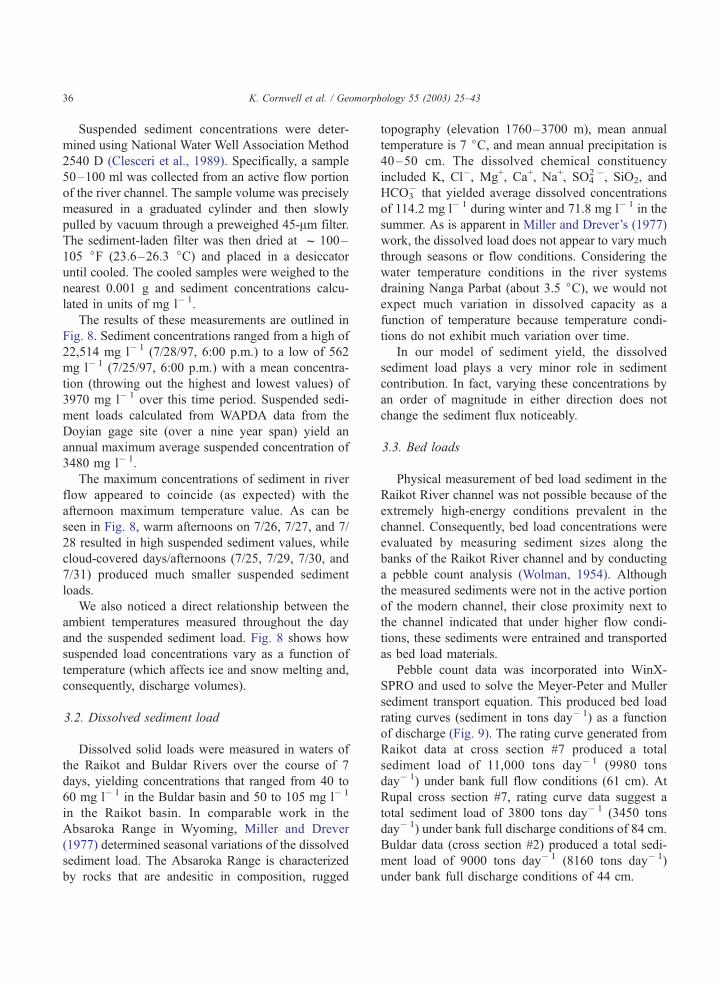
The results of these measurements are outlined in
Fig. 8. Sediment concentrations ranged from a high of
22,514 mg l� 1 (7/28/97, 6:00 p.m.) to a low of 562
mg l� 1 (7/25/97, 6:00 p.m.) with a mean concentra-
tion (throwing out the highest and lowest values) of
3970 mg l� 1 over this time period. Suspended sedi-
ment loads calculated from WAPDA data from the
Doyian gage site (over a nine year span) yield an
annual maximum average suspended concentration of
3480 mg l� 1.
The maximum concentrations of sediment in river
flow appeared to coincide (as expected) with the
afternoon maximum temperature value. As can be
seen in Fig. 8, warm afternoons on 7/26, 7/27, and 7/
28 resulted in high suspended sediment values, while
cloud-covered days/afternoons (7/25, 7/29, 7/30, and
7/31) produced much smaller suspended sediment
loads.
We also noticed a direct relationship between the
ambient temperatures measured throughout the day
and the suspended sediment load. Fig. 8 shows how
suspended load concentrations vary as a function of
temperature (which affects ice and snow melting and,
consequently, discharge volumes).
3.2. Dissolved sediment load
Dissolved solid loads were measured in waters of
the Raikot and Buldar Rivers over the course of 7
days, yielding concentrations that ranged from 40 to
60 mg l� 1 in the Buldar basin and 50 to 105 mg l� 1
in the Raikot basin. In comparable work in the
Absaroka Range in Wyoming, Miller and Drever
(1977) determined seasonal variations of the dissolved
sediment load. The Absaroka Range is characterized
by rocks that are andesitic in composition, rugged
topography (elevation 1760–3700 m), mean annual
temperature is 7 jC, and mean annual precipitation is
40–50 cm. The dissolved chemical constituency
included K, Cl�, Mg+, Ca+, Na+, SO42�, SiO2, and
HCO3� that yielded average dissolved concentrations
of 114.2 mg l� 1 during winter and 71.8 mg l� 1 in the
summer. As is apparent in Miller and Drever’s (1977)
work, the dissolved load does not appear to vary much
through seasons or flow conditions. Considering the
water temperature conditions in the river systems
draining Nanga Parbat (about 3.5 jC), we would not
expect much variation in dissolved capacity as a
function of temperature because temperature condi-
tions do not exhibit much variation over time.
In our model of sediment yield, the dissolved
sediment load plays a very minor role in sediment
contribution. In fact, varying these concentrations by
an order of magnitude in either direction does not
change the sediment flux noticeably.
3.3. Bed loads
Physical measurement of bed load sediment in the
Raikot River channel was not possible because of the
extremely high-energy conditions prevalent in the
channel. Consequently, bed load concentrations were
evaluated by measuring sediment sizes along the
banks of the Raikot River channel and by conducting
a pebble count analysis (Wolman, 1954). Although
the measured sediments were not in the active portion
of the modern channel, their close proximity next to
the channel indicated that under higher flow condi-
tions, these sediments were entrained and transported
as bed load materials.
Pebble count data was incorporated into WinX-
SPRO and used to solve the Meyer-Peter and Muller
sediment transport equation. This produced bed load
rating curves (sediment in tons day� 1) as a function
of discharge (Fig. 9). The rating curve generated from
Raikot data at cross section #7 produced a total
sediment load of 11,000 tons day� 1 (9980 tons
day� 1) under bank full flow conditions (61 cm). At
Rupal cross section #7, rating curve data suggest a
total sediment load of 3800 tons day� 1 (3450 tons
day� 1) under bank full discharge conditions of 84 cm.
Buldar data (cross section #2) produced a total sedi-
ment load of 9000 tons day� 1 (8160 tons day� 1)
under bank full discharge conditions of 44 cm.
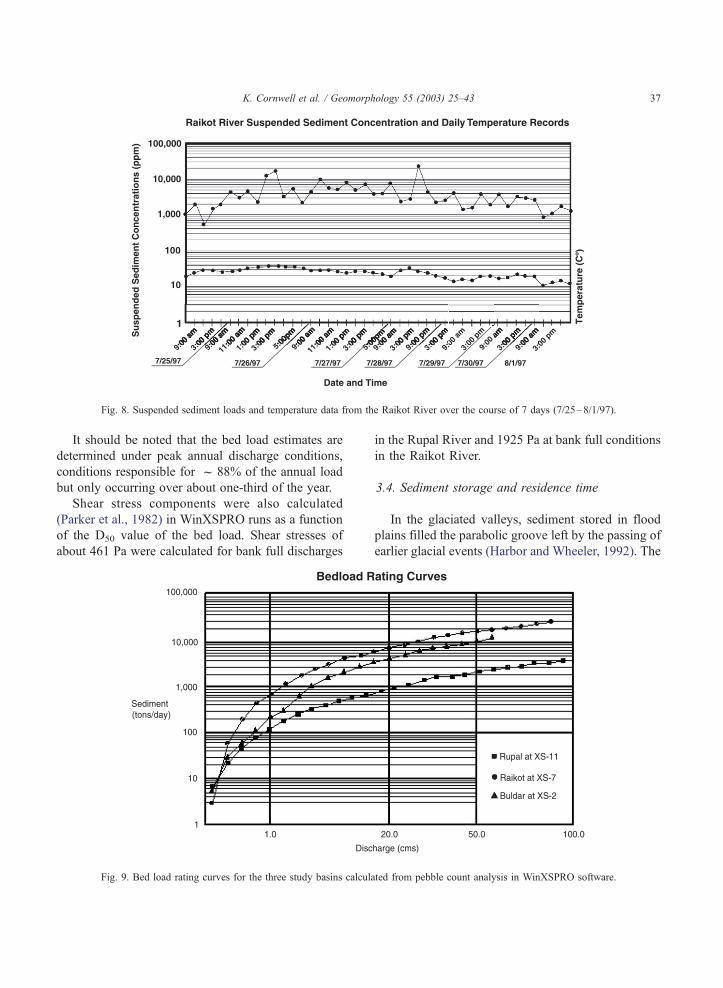
Fig. 8. Suspended sediment loads and temperature data from the Raikot River over the course of 7 days (7/25–8/1/97).
K. Cornwell et al. / Geomorphology 55 (2003) 25–43 37
It should be noted that the bed load estimates are
determined under peak annual discharge conditions,
conditions responsible for f 88% of the annual load
but only occurring over about one-third of the year.
Shear stress components were also calculated
(Parker et al., 1982) in WinXSPRO runs as a function
of the D50 value of the bed load. Shear stresses of
about 461 Pa were calculated for bank full discharges
Fig. 9. Bed load rating curves for the three study basins calcula
in the Rupal River and 1925 Pa at bank full conditions
in the Raikot River.
3.4. Sediment storage and residence time
In the glaciated valleys, sediment stored in flood
plains filled the parabolic groove left by the passing of
earlier glacial events (Harbor and Wheeler, 1992). The
ted from pebble count analysis in WinXSPRO software.
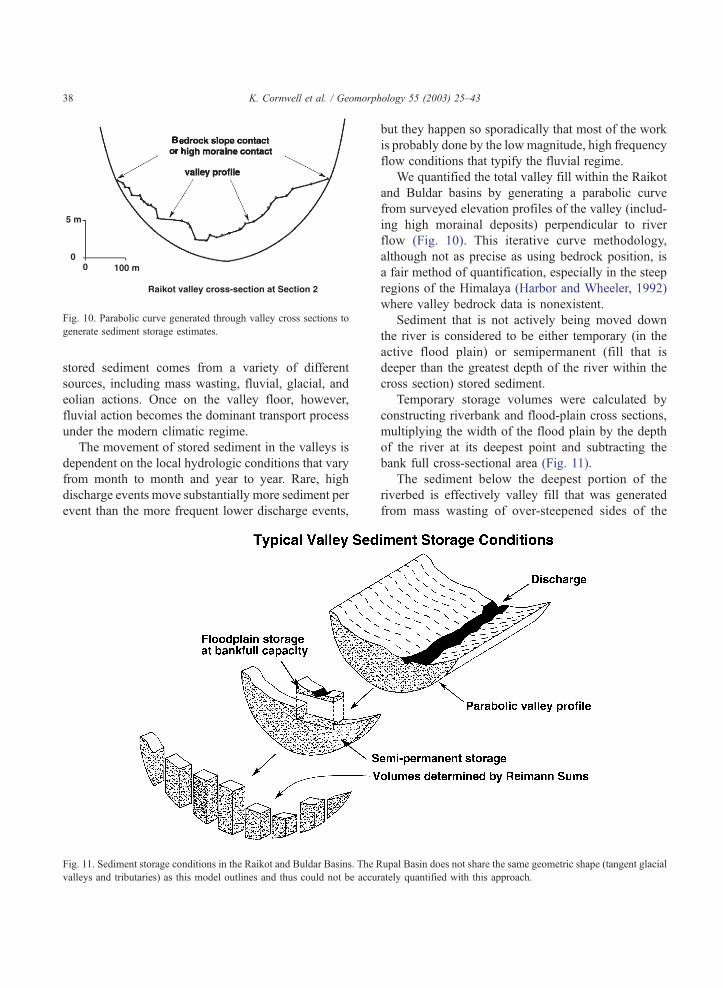
Fig. 10. Parabolic curve generated through valley cross sections to
generate sediment storage estimates.
K. Cornwell et al. / Geomorphology 55 (2003) 25–4338
stored sediment comes from a variety of different
sources, including mass wasting, fluvial, glacial, and
eolian actions. Once on the valley floor, however,
fluvial action becomes the dominant transport process
under the modern climatic regime.
The movement of stored sediment in the valleys is
dependent on the local hydrologic conditions that vary
from month to month and year to year. Rare, high
discharge events move substantially more sediment per
event than the more frequent lower discharge events,
Fig. 11. Sediment storage conditions in the Raikot and Buldar Basins. The R
valleys and tributaries) as this model outlines and thus could not be accu
but they happen so sporadically that most of the work
is probably done by the low magnitude, high frequency
flow conditions that typify the fluvial regime.
We quantified the total valley fill within the Raikot
and Buldar basins by generating a parabolic curve
from surveyed elevation profiles of the valley (includ-
ing high morainal deposits) perpendicular to river
flow (Fig. 10). This iterative curve methodology,
although not as precise as using bedrock position, is
a fair method of quantification, especially in the steep
regions of the Himalaya (Harbor and Wheeler, 1992)
where valley bedrock data is nonexistent.
Sediment that is not actively being moved down
the river is considered to be either temporary (in the
active flood plain) or semipermanent (fill that is
deeper than the greatest depth of the river within the
cross section) stored sediment.
Temporary storage volumes were calculated by
constructing riverbank and flood-plain cross sections,
multiplying the width of the flood plain by the depth
of the river at its deepest point and subtracting the
bank full cross-sectional area (Fig. 11).
The sediment below the deepest portion of the
riverbed is effectively valley fill that was generated
from mass wasting of over-steepened sides of the
upal Basin does not share the same geometric shape (tangent glacial
rately quantified with this approach.
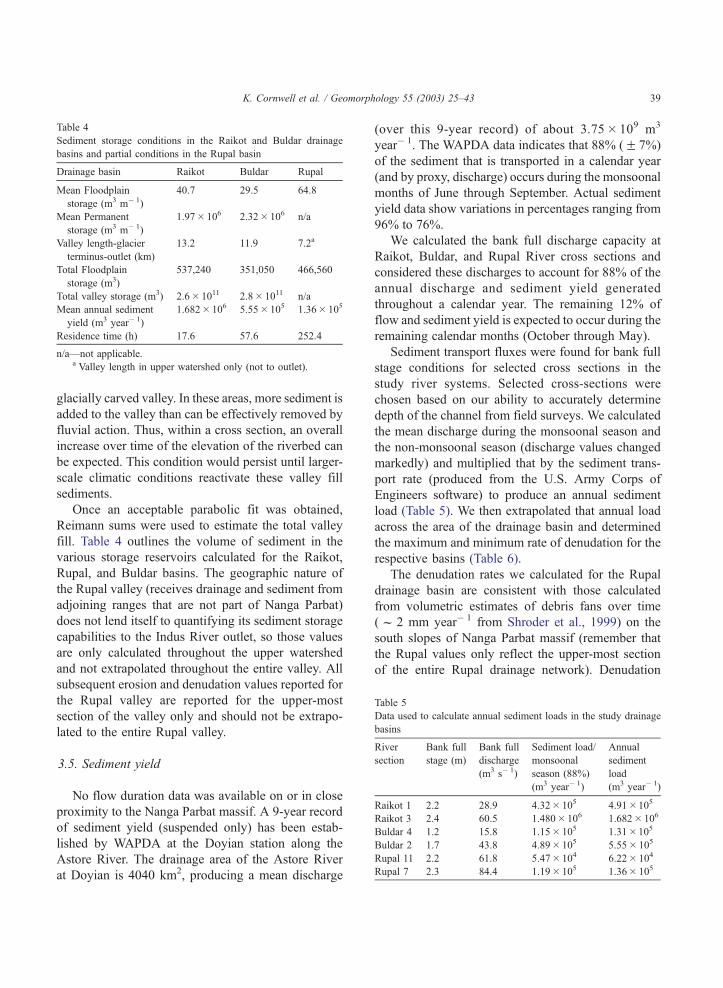
Table 4
Sediment storage conditions in the Raikot and Buldar drainage
basins and partial conditions in the Rupal basin
Drainage basin Raikot Buldar Rupal
Mean Floodplain
storage (m3 m� 1)
40.7 29.5 64.8
Mean Permanent
storage (m3 m� 1)
1.97� 106 2.32� 106 n/a
Valley length-glacier
terminus-outlet (km)
13.2 11.9 7.2a
Total Floodplain
storage (m3)
537,240 351,050 466,560
Total valley storage (m3) 2.6� 1011 2.8� 1011 n/a
Mean annual sediment
yield (m3 year� 1)
1.682� 106 5.55� 105 1.36� 105
Residence time (h) 17.6 57.6 252.4
n/a—not applicable.a Valley length in upper watershed only (not to outlet).
Table 5
Data used to calculate annual sediment loads in the study drainage
basins
River
section
Bank full
stage (m)
Bank full
discharge
(m3 s� 1)
Sediment load/
monsoonal
season (88%)
(m3 year� 1)
Annual
sediment
load
(m3 year� 1)
Raikot 1 2.2 28.9 4.32� 105 4.91�105
Raikot 3 2.4 60.5 1.480� 106 1.682� 106
Buldar 4 1.2 15.8 1.15� 105 1.31�105
Buldar 2 1.7 43.8 4.89� 105 5.55� 105
Rupal 11 2.2 61.8 5.47� 104 6.22� 104
Rupal 7 2.3 84.4 1.19� 105 1.36� 105
K. Cornwell et al. / Geomorphology 55 (2003) 25–43 39
glacially carved valley. In these areas, more sediment is
added to the valley than can be effectively removed by
fluvial action. Thus, within a cross section, an overall
increase over time of the elevation of the riverbed can
be expected. This condition would persist until larger-
scale climatic conditions reactivate these valley fill
sediments.
Once an acceptable parabolic fit was obtained,
Reimann sums were used to estimate the total valley
fill. Table 4 outlines the volume of sediment in the
various storage reservoirs calculated for the Raikot,
Rupal, and Buldar basins. The geographic nature of
the Rupal valley (receives drainage and sediment from
adjoining ranges that are not part of Nanga Parbat)
does not lend itself to quantifying its sediment storage
capabilities to the Indus River outlet, so those values
are only calculated throughout the upper watershed
and not extrapolated throughout the entire valley. All
subsequent erosion and denudation values reported for
the Rupal valley are reported for the upper-most
section of the valley only and should not be extrapo-
lated to the entire Rupal valley.
3.5. Sediment yield
No flow duration data was available on or in close
proximity to the Nanga Parbat massif. A 9-year record
of sediment yield (suspended only) has been estab-
lished by WAPDA at the Doyian station along the
Astore River. The drainage area of the Astore River
at Doyian is 4040 km2, producing a mean discharge
(over this 9-year record) of about 3.75� 109 m3
year� 1. The WAPDA data indicates that 88% (F 7%)
of the sediment that is transported in a calendar year
(and by proxy, discharge) occurs during the monsoonal
months of June through September. Actual sediment
yield data show variations in percentages ranging from
96% to 76%.
We calculated the bank full discharge capacity at
Raikot, Buldar, and Rupal River cross sections and
considered these discharges to account for 88% of the
annual discharge and sediment yield generated
throughout a calendar year. The remaining 12% of
flow and sediment yield is expected to occur during the
remaining calendar months (October through May).
Sediment transport fluxes were found for bank full
stage conditions for selected cross sections in the
study river systems. Selected cross-sections were
chosen based on our ability to accurately determine
depth of the channel from field surveys. We calculated
the mean discharge during the monsoonal season and
the non-monsoonal season (discharge values changed
markedly) and multiplied that by the sediment trans-
port rate (produced from the U.S. Army Corps of
Engineers software) to produce an annual sediment
load (Table 5). We then extrapolated that annual load
across the area of the drainage basin and determined
the maximum and minimum rate of denudation for the
respective basins (Table 6).
The denudation rates we calculated for the Rupal
drainage basin are consistent with those calculated
from volumetric estimates of debris fans over time
(f 2 mm year� 1 from Shroder et al., 1999) on the
south slopes of Nanga Parbat massif (remember that
the Rupal values only reflect the upper-most section
of the entire Rupal drainage network). Denudation
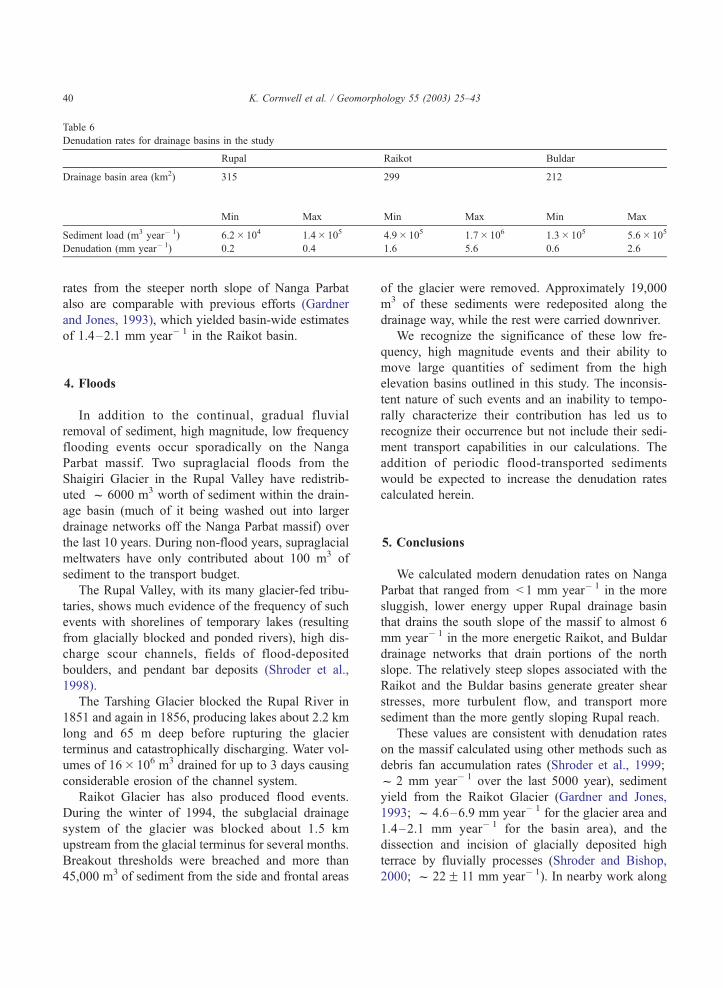
Table 6
Denudation rates for drainage basins in the study
Rupal Raikot Buldar
Drainage basin area (km2) 315 299 212
Min Max Min Max Min Max
Sediment load (m3 year� 1) 6.2� 104 1.4� 105 4.9� 105 1.7� 106 1.3� 105 5.6� 105
Denudation (mm year� 1) 0.2 0.4 1.6 5.6 0.6 2.6
K. Cornwell et al. / Geomorphology 55 (2003) 25–4340
rates from the steeper north slope of Nanga Parbat
also are comparable with previous efforts (Gardner
and Jones, 1993), which yielded basin-wide estimates
of 1.4–2.1 mm year� 1 in the Raikot basin.
4. Floods
In addition to the continual, gradual fluvial
removal of sediment, high magnitude, low frequency
flooding events occur sporadically on the Nanga
Parbat massif. Two supraglacial floods from the
Shaigiri Glacier in the Rupal Valley have redistrib-
uted f 6000 m3 worth of sediment within the drain-
age basin (much of it being washed out into larger
drainage networks off the Nanga Parbat massif) over
the last 10 years. During non-flood years, supraglacial
meltwaters have only contributed about 100 m3 of
sediment to the transport budget.
The Rupal Valley, with its many glacier-fed tribu-
taries, shows much evidence of the frequency of such
events with shorelines of temporary lakes (resulting
from glacially blocked and ponded rivers), high dis-
charge scour channels, fields of flood-deposited
boulders, and pendant bar deposits (Shroder et al.,
1998).
The Tarshing Glacier blocked the Rupal River in
1851 and again in 1856, producing lakes about 2.2 km
long and 65 m deep before rupturing the glacier
terminus and catastrophically discharging. Water vol-
umes of 16� 106 m3 drained for up to 3 days causing
considerable erosion of the channel system.
Raikot Glacier has also produced flood events.
During the winter of 1994, the subglacial drainage
system of the glacier was blocked about 1.5 km
upstream from the glacial terminus for several months.
Breakout thresholds were breached and more than
45,000 m3 of sediment from the side and frontal areas
of the glacier were removed. Approximately 19,000
m3 of these sediments were redeposited along the
drainage way, while the rest were carried downriver.
We recognize the significance of these low fre-
quency, high magnitude events and their ability to
move large quantities of sediment from the high
elevation basins outlined in this study. The inconsis-
tent nature of such events and an inability to tempo-
rally characterize their contribution has led us to
recognize their occurrence but not include their sedi-
ment transport capabilities in our calculations. The
addition of periodic flood-transported sediments
would be expected to increase the denudation rates
calculated herein.
5. Conclusions
We calculated modern denudation rates on Nanga
Parbat that ranged from < 1 mm year� 1 in the more
sluggish, lower energy upper Rupal drainage basin
that drains the south slope of the massif to almost 6
mm year� 1 in the more energetic Raikot, and Buldar
drainage networks that drain portions of the north
slope. The relatively steep slopes associated with the
Raikot and the Buldar basins generate greater shear
stresses, more turbulent flow, and transport more
sediment than the more gently sloping Rupal reach.
These values are consistent with denudation rates
on the massif calculated using other methods such as
debris fan accumulation rates (Shroder et al., 1999;
f 2 mm year� 1 over the last 5000 year), sediment
yield from the Raikot Glacier (Gardner and Jones,
1993; f 4.6–6.9 mm year� 1 for the glacier area and
1.4–2.1 mm year� 1 for the basin area), and the
dissection and incision of glacially deposited high
terrace by fluvially processes (Shroder and Bishop,
2000; f 22F 11 mm year� 1). In nearby work along
K. Cornwell et al. / Geomorphology 55 (2003) 25–43 41
the Indus, Burbank et al. (1996) determined bedrock
incision rates to vary from 2 to 12 mm year� 1. More
regionally based studies (Hewitt, 1972; Ferguson,
1984; Hallet et al., 1996) suggested that denudation
rates of more than 1 mm year� 1 are not unusual in
such dynamic settings.
On a broader scale, summary work by Hallet et al.
(1996) showed much higher denudation rates (termed
effective erosion rates) of 20.31 mm year� 1 (un-
weighted average) occurring in glaciated drainage
basins in SE Alaska where long-term (>10 year in
length) records exist. In general, these glacial systems
are fast moving and often much larger in area (many
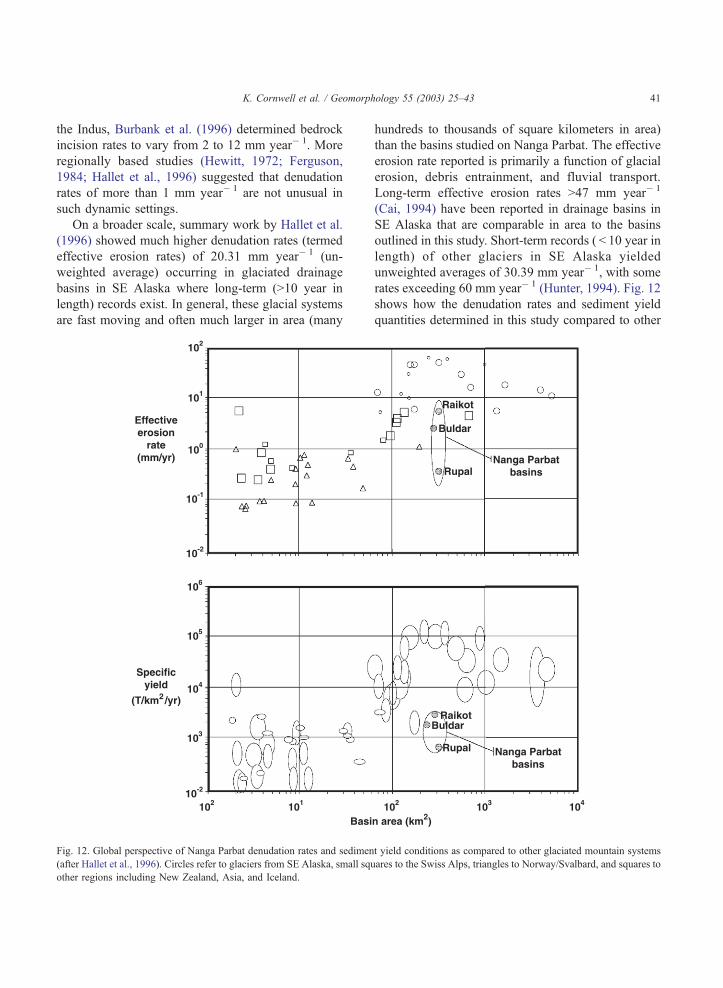
Fig. 12. Global perspective of Nanga Parbat denudation rates and sedimen
(after Hallet et al., 1996). Circles refer to glaciers from SE Alaska, small squ
other regions including New Zealand, Asia, and Iceland.
hundreds to thousands of square kilometers in area)
than the basins studied on Nanga Parbat. The effective
erosion rate reported is primarily a function of glacial
erosion, debris entrainment, and fluvial transport.
Long-term effective erosion rates >47 mm year� 1
(Cai, 1994) have been reported in drainage basins in
SE Alaska that are comparable in area to the basins
outlined in this study. Short-term records ( < 10 year in
length) of other glaciers in SE Alaska yielded
unweighted averages of 30.39 mm year� 1, with some
rates exceeding 60 mm year� 1 (Hunter, 1994). Fig. 12
shows how the denudation rates and sediment yield
quantities determined in this study compared to other
t yield conditions as compared to other glaciated mountain systems
ares to the Swiss Alps, triangles to Norway/Svalbard, and squares to
K. Cornwell et al. / Geomorphology 55 (2003) 25–4342
glacial drainage basins compiled in Hallet et al.
(1996). Specific yield conditions and denudation rates
(reported as effective erosion rate by Hallet et al.,
1996) calculated for the basins on Nanga Parbat rank
within the general trend of central Asian glaciers
included in Hallet et al.’s (1996) compilation. Most
of the yield data from comparable basin areas in Fig.
12 come from drainage basins in SE Alaska that
receive significantly more precipitation (building
larger glaciers) and consequently does more erosional
work (both producing and transporting sediment) than
the drainage basins on Nanga Parbat, perhaps ac-
counting for the more prolific yield conditions and
erosion rates.
The denudation rates derived herein fall on the low
side of our initial calculations. Considering the steep
relief and the energetic glacial systems on NP, we
anticipated higher denudation rates. Several reasons
may account for the discrepancy, all of which are
related to the difficulty of collecting accurate, precise,
and reliable flow and sediment data at Nanga Parbat.
First, our field data represent conditions during a short
time frame during low flow conditions. Collecting
sediment load data over an entire melt season would
generate a more complete picture of the fluxes inher-
ent in such a dynamic system and would allow for
more comprehensive modeling of erosion rates. Lon-
ger sampling intervals would offer even more com-
prehensive insights. Second, we have not attempted to
model extreme events such as subglacial outburst
floods and heavy melt/high precipitation events that
would generate substantial discharge and sediment
yields. Third, bed load probably accounts for a greater
proportion of the total sediment load in extraordinary
steep mountain stream than in other environments, but
an independent source of bed load data does not exist
against which we could evaluate our estimates.
Clearly, one of the challenges to developing quan-
titative understandings of high-elevation fluvial sys-
tems and subsequent denudation rates is the general
paucity of discharge data available from such sites.
Consequently, indirect methods are commonly em-
ployed to estimate discharge conditions. These meth-
ods, however, often assume steady, uniform flow
conditions (conditions that are rare in such dynamic
systems), leading often to inaccurate discharge deter-
minations (Jarrett, 1987). Coupled with this limitation
with the overall dynamic and variable nature of
surficial processes over time, the task seems over-
whelmingly complex indeed. This complexity has
been most ably described by Shroder and Bishop
(2000) who state that ‘‘the overall denudation of the
Nanga Parbat massif is a spatially and temporally
complex mosaic of topography produced by tectonics
overprinted with the surficial processes of mass move-
ment, glaciers, rivers and catastrophic floods, all
operating at different rates, through time’’.
Acknowledgements
This work was supported in part by the National
Science Foundation (grants EAR-9418839 and EPS-
9720643), the Central Missouri State University
Collaborative Research Grant, and the sweat and toil
of the Nanga Parbat Geomorphology Research Group
over the summers of 1996 and 1997. Special thanks to
Michael Bishop for his help with our morphometric
data needs and interpretations.
References
Ali, M., 1995. The Northern Area of Pakistan, Physical and Human
Geography. Survey of Pakistan, Pakistan.
Burbank, D.W., Beck, R.A., 1991. Models of aggradation versus
progradation in the Himalayan foreland. Geologische Run-
dschau 80 (3), 623–638.
Burbank, D.W., Leland, J., Fielding, E., Anderson, R.S., Brozovic,
N., Reid, M.R., Duncan, C., 1996. Bedrock incision, rock uplift
and threshold hillslopes in the northwestern Himalayas. Nature
379, 505–510.
Cai, J., 1994. Sediment yields, lithofacies architecture and mudrock
characteristics in glaciomarine environments. PhD dissertation,
Northern Illinois University, Dekalb.
Clesceri, L.S., Greenberg, A.E., Trussell, R.R. (Eds.), 1989. Stand-
ard Methods for the Examination of Water and Wastewater, 17th
ed. National Water Well Association Method 2540 D. National
Water Well Association. American Public Health Association,
pp. 2-71 to 2-77.
Ferguson, R.I., 1984. Sediment load of the Hunza River. In: Miller,
K.J. (Ed.), The International Karakoram Project, vol. 2. Cam-
bridge Univ. Press, Cambridge, UK, pp. 581–598.
Gardner, J.S., Jones, N.K., 1993. Sediment transport and yield
at the Raikot Glacier, Nanga Parbat, Punjab Himalaya. In:
Shroder Jr., J.F., (Ed.), Himalaya to the Sea. Geology, Geo-
morphology, and the Quaternary. Routledge, London, Eng-
land, pp. 184–197.
Hallet, B., Hunter, L., Bogen, J., 1996. Rates of erosion and sedi-
ment evacuation by glaciers: a review of field data and their
implications. Global and Planetary Change 12, 213–235.
Harbor, J.M., Wheeler, D.A., 1992. On the mathematical descrip-
K. Cornwell et al. / Geomorphology 55 (2003) 25–43 43
tion of glaciated valley cross-sections. Earth Surface Processes
and Landforms 17, 477–485.
Hewitt, K., 1972. The mountain environment and geomorphic pro-
cesses. In: Slaymaker, H.O., McPherson, H.J. (Eds.), Mountain
Geomorphology: Geomorphological Processes in the Canadian
Cordillera. Tantalus Research, Vancouver, British Columbia,
No. 14, 17–34.
Hunter, L.E., 1994. Ground-line systems of modern temperate
glaciers and their effects on glacier stability. PhD dissertation,
Department of Geology, Northern Illinois University, Dekalb,
467 pp.
Jarrett, R.D., 1984. Hydraulics of high-gradient streams. American
Society of Civil Engineers, Journal of Hydraulics Division 110
(HY11), 1519–1539.
Jarrett, R.D., 1987. Errors in slope-area computations of peak dis-
charges in mountain streams. Journal of Hydrology 96, 53–67.
McBean, E.A., Al-Nassri, S., 1988. Uncertainty in suspended sedi-
ment transport curves. Journal of Hydraulic Engineering 114
(1), 257–264.
Meyer-Peter, E., Muller, R., 1948. Formulas for bed load trans-
port. In: Report on Second Meeting of the International As-
sociation of Hydraulic Structures Research, Stockholm,
Sweden, pp. 373–410.
Miller, W.R., Drever, J.I., 1977. Chemical weathering and related
controls on surface water chemistry in the Absaroka Mountains,
Wyoming. Geochimica et cosmochimica acta 41, 1693–1702.
Nielson, D.R., 1974. Sediment transport through high mountain
streams of the Idaho Batholith. MS thesis, University of Idaho,
Moscow, pp. 6–12.
Parker, G., Klingeman, P., McLean, D., 1982. Bedload and size
distribution in paved gravel-bed streams. Journal of the Hy-
draulics Division 108(HY4) (198204), 544–571.
Poage, M.A., Chamberlain, C.P., Craw, D., 2000. Massif-wide
metamorphism and fluid evolution at Nanga Parbat, northwest-
ern Pakistan. American Journal of Science 300, 463–482.
Raymo, M.E., Ruddiman, W.F., 1992. Tectonic forcing of late Cen-
ozoic climate. Nature 359, 117–122.
Raymo, M.E., Ruddiman, W.F., Froelich, P.N., 1988. Influence of
late Cenozoic mountain building on ocean geochemical cycles.
Geology 16, 649–653.
Schneider, D.A., Edwards, M.A., Kidd, W.S.F., Khan, M.A.,
Seeber, L., Zeitler, P.K., 1999a. Tectonics of Nanga Parbat,
western Himalaya: synkinematic plutonism within the doubly
vergent shear zones of a crustal-scale pop-up structure. Geol-
ogy 27, 999–1002.
Schneider, D.A., Edwards, M.A., Kidd, W.S.F., Zeitler, P.K., Coath,
C., 1999b. Early Miocene anatexis identified in the western
syntaxis, Pakistan Himalaya. Earth and Planetary Science Let-
ters 167, 121–129.
Shroder, J.F., 1989. Hazards of the Himalayas. American Scientist
77, 564–573.
Shroder Jr., J.F., Bishop, M.P., 2000. Unroofing of the Nanga Parbat
Himalaya. In: Khan, M.A., Treloar, P.J., Searle, M.P., Jan, M.Q.
(Eds.), Tectonics of the Nanga Parbat Syntaxis, the Western
Himalaya. Geological Society of London Special Publication,
vol. 170, pp. 163–179. London.
Shroder Jr., J.F., Bishop, M.P., Scheppy, R. 1998. Catastrophic
flood flushing of sediment, western Himalaya, Pakistan. In:
Kalvoda, J., Rosenfeld, C.L. (Eds.), Geomorphological Hazards
in High Mountain Areas. Kluwer Acad. Pub., pp. 27–48.
Shroder Jr., J.F., Scheppy, R.A., Bishop, M.P.,Denudation of small
alpine basins, Nanga Parbat Himalaya, Pakistan. Arctic, Antarc-
tic, and Alpine Research 31, 121–127.
WEST Consultants, 1996. WinXSPRO: A Channel Cross-Section
Analyzer. WEST Consultants, Carlsbad, CA.
Winslow, D.M., Zeitler, P.K., Chamberlain, C.P., Hollister, L.S.,
1994. Direct evidence for a steep geotherm under conditions
of rapid denudation, Western Himalaya, Pakistan. Geology 22,
1075–1078.
Wolman, M.G., 1954. A method of sampling coarse river-bed
material. American Geophysical Union Transactions 35 (6),
951–956.
Young, G.J., Hewitt, K., 1990. Hydrology research in the upper
Indus basin, Karakorum Himalaya, Pakistan. In: Molnar, L.
(Ed.), Hydrology of Mountainous Areas. IAHS Publ., vol. 190.
Wallingford, UK, pp. 139–152.
Zeitler, P.K., Sutter, J.F., Williams, I.S., Zartman, R., Tahirkheli,
R.A.K., 1989. Geochronology and temperature history of the
Nanga Parbat-Haramosh massif, Pakistan. In: Malinconico,
L.L., Lillie, R.J. (Eds.), Tectonics of the Western Himalaya.
Geological Society of America Special Paper, vol. 232. Boulder,
CO, pp. 1–22.
Zeitler, P.K., Chamberlain, C.P., Smith, H.A., 1993. Synchronous
anatexis, metamorphism, and rapid denudation at Nanga Parbat,
Pakistan Himalaya. Geology 21, 347–350.