Embed Size (px)
Citation preview
Drivers of gross margins in UK retail electricity
Daniel Milione
Dan Törnqvist
Master’s Thesis LIU-IEI-TEK-A—07/00149--SE
Department of Management and Engineering
Industrial Marketing
Drivers of gross margins in UK retail electricity
Daniel Milione
Dan Törnqvist
Master’s Thesis LIU-IEI-TEK-A—07/00149--SE
Department of Management and Engineering
Industrial Marketing
Supervisor at Linköping University: Roland Sjöström
Supervisor at Vattenfall: Kurosh Beradari

”You may ask ‘Is this legal?’, and the answer is yes.”
Gena Norris

i
Preface
Little did we know about how interesting this journey would be when we received our assignment in September 2006. Over time, our project has developed from a desktop study, comparing retail electricity markets, to actually going to the UK and study the subject up close. As we have become increasingly involved, we have been able to answer many of the questions we hoped to explain and at the same time given rise to new questions we hope to see the answers to in the future.
There are a number of people we would like to thank for making all this possible: First of all, all the people at Vattenfall, who we have much to thank for in the formulation of the decision problem and for background information to this study. Our tutor Kurosh Beradari requires special thanks for having put extra time to guide us, spending hours of reading through drafts of the background problem, as well as the analysis, to suggest improvements. Additional thanks to Hans Lundgren, Charlotte Loid, Jens Storm, Bo Wahrgren, Tomas Sandberg and Åsa Lilljekvist-Cramer. Without the help of Eva Eneteg in solving the liquidity problems of Dan’s credit card and the booking of Daniel’s emergency retreat, we would probably have been sleeping with Daniel’s back broken under a tree in Newcastle.
We also want to express our gratitude to all the respondents for their participation and are especially grateful for the substantial contributions of Professor Michael Waterson, who made our field study at all possible. We thank our tutor, Roland Sjöström, whose guidance has improved the report in so many ways that we could not even begin to count them. We are thankful for the time our opponents, Erik Bergelin and Martin Wastesson, have spent reading and commenting our study, even though they at times must have wondered if they would ever come to see any of our work.
Finally we must not forget those who brought sunshine even in the midst of dark winter days. Delicato, Chuck, Bolo, Dolph and, last but certainly not least, Steven, better known as the Mojo Priest. Without you, we would never have succeeded in navigating through the waters of empirics.
Thank you very much.
Stockholm, May 2007
Daniel Milione Dan Törnqvist

ii
iii
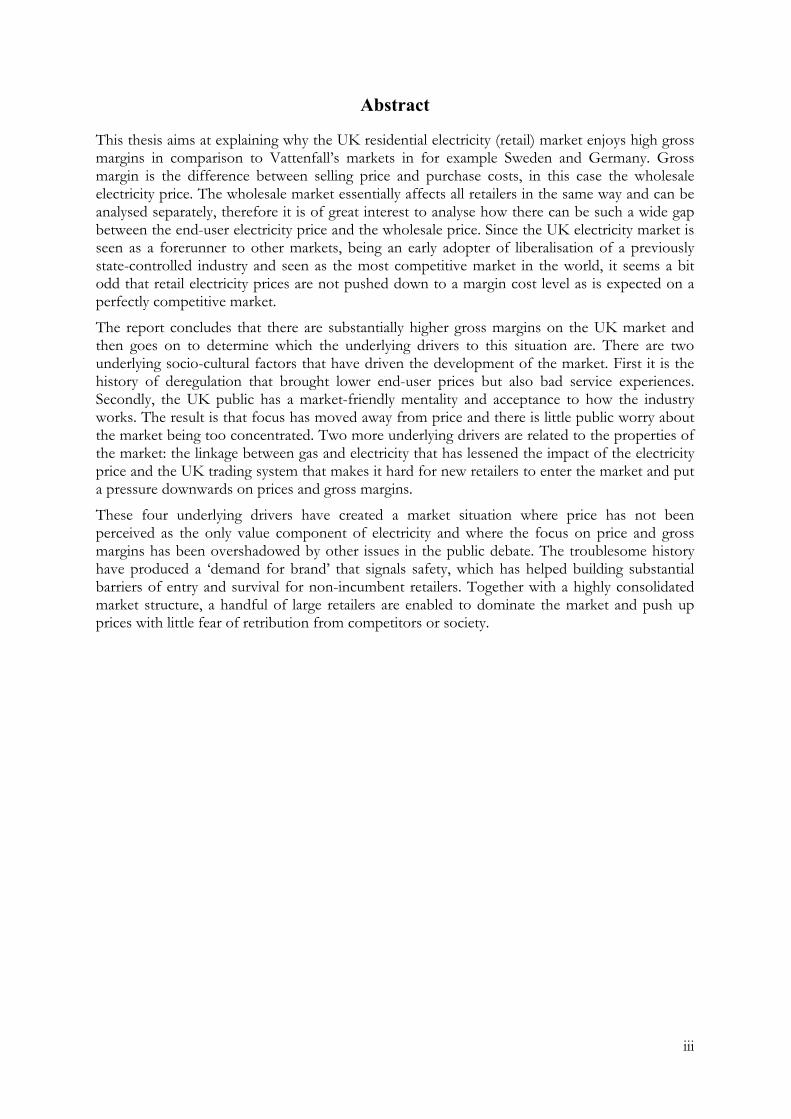
Abstract
This thesis aims at explaining why the UK residential electricity (retail) market enjoys high gross margins in comparison to Vattenfall’s markets in for example Sweden and Germany. Gross margin is the difference between selling price and purchase costs, in this case the wholesale electricity price. The wholesale market essentially affects all retailers in the same way and can be analysed separately, therefore it is of great interest to analyse how there can be such a wide gap between the end-user electricity price and the wholesale price. Since the UK electricity market is seen as a forerunner to other markets, being an early adopter of liberalisation of a previously state-controlled industry and seen as the most competitive market in the world, it seems a bit odd that retail electricity prices are not pushed down to a margin cost level as is expected on a perfectly competitive market.
The report concludes that there are substantially higher gross margins on the UK market and then goes on to determine which the underlying drivers to this situation are. There are two underlying socio-cultural factors that have driven the development of the market. First it is the history of deregulation that brought lower end-user prices but also bad service experiences. Secondly, the UK public has a market-friendly mentality and acceptance to how the industry works. The result is that focus has moved away from price and there is little public worry about the market being too concentrated. Two more underlying drivers are related to the properties of the market: the linkage between gas and electricity that has lessened the impact of the electricity price and the UK trading system that makes it hard for new retailers to enter the market and put a pressure downwards on prices and gross margins.
These four underlying drivers have created a market situation where price has not been perceived as the only value component of electricity and where the focus on price and gross margins has been overshadowed by other issues in the public debate. The troublesome history have produced a ‘demand for brand’ that signals safety, which has helped building substantial barriers of entry and survival for non-incumbent retailers. Together with a highly consolidated market structure, a handful of large retailers are enabled to dominate the market and push up prices with little fear of retribution from competitors or society.

iv
v
1 BACKGROUND................................................................................................................ 1 1.1 PRESENTATION OF THE PROBLEM .......................................................................................... 2 1.2 OUTLINE OF THE THESIS .......................................................................................................... 3 1.3 THE POWER INDUSTRY.............................................................................................................. 4
1.3.1 The electricity market ................................................................................................................. 4 1.3.2 Market architecture.................................................................................................................... 6 1.3.3 European markets are under development ................................................................................... 7 1.3.4 Supplying to the retail segment .................................................................................................... 7
1.4 PRE-STUDY FINDINGS................................................................................................................ 8 1.4.1 Market structure........................................................................................................................ 9 1.4.2 The market players .................................................................................................................. 11 1.4.3 Entry barriers.......................................................................................................................... 12 1.4.4 UK retail prices sunk after deregulation.................................................................................... 12 1.4.5 Purchase costs are wholesale prices............................................................................................. 14 1.4.6 Gross margins.......................................................................................................................... 15 1.4.7 Characteristics of UK electricity consumption............................................................................. 16 1.4.8 Comparing UK to the Swedish retail market ............................................................................ 16 1.4.9 Current trends on the UK electricity market.............................................................................. 17
1.5 EXISTING HYPOTHESES........................................................................................................... 18 1.6 PURPOSE.................................................................................................................................... 19
1.6.1 Definitions of concepts .............................................................................................................. 19 1.7 APPROACHING THE PROBLEM................................................................................................ 19
1.7.1 Defining the term factors .......................................................................................................... 19 1.7.2 Embryo analysis model ............................................................................................................ 20
2 DESCRIBING THE FACTORS..................................................................................... 23 2.1 DEMAND SIDE - THE LINKAGE BETWEEN PRICE AND VALUE ........................................... 24
2.1.1 Customer value is driven by a number of criteria ....................................................................... 26 2.1.2 Customer value is created along several dimensions .................................................................... 27
2.2 MARKET LEVEL – DIFFERENTIATION AND CONSOLIDATION ........................................... 29 2.2.1 The value of being unique ......................................................................................................... 29 2.2.2 Segmentation can be combined with other strategies.................................................................... 32 2.2.3 Few competitors leads to higher prices........................................................................................ 32 2.2.4 The impact of an oligopoly situation .......................................................................................... 33
2.3 INDUSTRY LEVEL ..................................................................................................................... 33 2.3.1 The components of the industry ................................................................................................. 34 2.3.2 Rivalry between retailers ........................................................................................................... 36 2.3.3 Suppliers.................................................................................................................................. 37 2.3.4 Customers are weak ................................................................................................................. 37 2.3.5 No substitutes.......................................................................................................................... 38 2.3.6 Complementors as service providers ........................................................................................... 38 2.3.7 Entry barriers limit market competition.................................................................................... 38 2.3.8 Two strategic groups on the UK market.................................................................................... 39
2.4 MACRO ENVIRONMENT........................................................................................................... 41 2.4.1 Economic Forces ...................................................................................................................... 41 2.4.2 Environmental Forces .............................................................................................................. 42 2.4.3 Political Forces......................................................................................................................... 42
vi
2.4.4 Social/Cultural Forces............................................................................................................. 42 2.4.5 Industry impact on the macro environment ................................................................................ 43
2.5 SUMMARY OF THE CHAPTER ................................................................................................... 43 3 THE ANALYSIS MODEL.............................................................................................. 47
3.1 FOCUSED RESEARCH QUESTIONS........................................................................................... 49 4 METHODOLOGY.......................................................................................................... 51
4.1 METHODOLOGICAL APPROACH............................................................................................. 52 4.1.1 This thesis is a system analysis ................................................................................................. 52
4.2 APPROACH OF THE STUDY...................................................................................................... 53 4.2.1 This study aims to explain a phenomenon................................................................................. 53 4.2.2 Research methods ..................................................................................................................... 53 4.2.3 Chosen research method ............................................................................................................ 53 4.2.4 Case selections.......................................................................................................................... 54
4.3 RESEARCH DESIGN AND SEQUENCE OF WORK.................................................................. 55 4.3.1 Research design ........................................................................................................................ 55 4.3.2 Background and decision problem ............................................................................................. 56 4.3.3 Theory and focused research questions ....................................................................................... 57 4.3.4 Data collection ......................................................................................................................... 57 4.3.5 Analysis and conclusions .......................................................................................................... 58
4.4 QUALITY OF THE STUDY ......................................................................................................... 59 4.4.1 Reliability ................................................................................................................................ 59 4.4.2 Triangulation improves quality and reliability ........................................................................... 60 4.4.3 The interviews .......................................................................................................................... 60 4.4.4 Validity .................................................................................................................................. 62 4.4.5 Quality of the case.................................................................................................................... 63 4.4.6 Generalization ......................................................................................................................... 64
5 EMPIRICS....................................................................................................................... 65 5.1 THE RESPONDENTS ................................................................................................................. 66 5.2 SUMMARY OF THE EMPIRICS ................................................................................................... 67 5.3 INDUSTRY LEVEL – COMPETITIVE BUT HARD TO ENTER ................................................... 68
5.3.1 Customers................................................................................................................................ 68 5.3.2 Intensity of rivalry .................................................................................................................... 72 5.3.3 New entrants ........................................................................................................................... 76 5.3.4 Supply ..................................................................................................................................... 78 5.3.5 (Substitutes and) complementors ............................................................................................... 79
5.4 MACRO ENVIRONMENT........................................................................................................... 80 5.4.1 Economic................................................................................................................................. 80 5.4.2 Environmental......................................................................................................................... 80 5.4.3 Political ................................................................................................................................... 81 5.4.4 Public opinion.......................................................................................................................... 83
5.5 OFGEM’S REPORT OFFER NEW INSIGHTS.............................................................................. 84 5.6 PRICING BEHAVIOUR – REPORT BY PROFESSOR WATERSON ............................................ 84
6 ANALYSIS ....................................................................................................................... 87 6.1 PERCEIVED CUSTOMER VALUE – MORE THAN JUST PRICE ................................................. 88
vii
6.1.1 Price sensitivity has been low..................................................................................................... 88 6.1.2 Customers’ switching behaviour is reactive ................................................................................. 89 6.1.3 Use criteria in addition to price................................................................................................. 89 6.1.4 Signalling criteria ..................................................................................................................... 90 6.1.5 Strategies - differentiating the same offering ............................................................................... 91
6.2 DEGREE OF COMPETITION IS HIGH IF BASED ON CHURN RATE........................................ 92 6.3 INDUSTRY LEVEL – HARD TO CHANGE THE GAME ............................................................. 93
6.3.1 Rivalry – preserving the status quo ........................................................................................... 94 6.3.2 Supply – financial stability is required...................................................................................... 94 6.3.3 Entry and survival barriers a plenty ......................................................................................... 95 6.3.4 Substitutes & Complementors.................................................................................................. 96
6.4 MACRO ENVIRONMENT........................................................................................................... 98 6.5 THE ANALYSIS MODEL REVISITED....................................................................................... 100
7 CONCLUSIONS ............................................................................................................103 7.1 FOUR UNDERLYING DRIVERS ............................................................................................... 104 7.2 THE UNDERLYING DRIVERS MAPPED OUT ......................................................................... 105
8 FUTURE RESEARCH ..................................................................................................107 8.1 THE UK MARKET................................................................................................................... 108 8.2 FURTHER SUBJECTS FOR ACADEMIC RESEARCH................................................................. 108
9 REFLECTIONS.............................................................................................................109 APPENDIX A – HISTORICAL PRICES UK APPENDIX B – BUSINESS CHARACTERISTICS AND GROSS MARGINS APPENDIX C – ANNUAL DOMESTIC ENERGY BILLS APPENDIX D – LIST OF RESPONDENTS APPENDIX E – QUESTIONNAIRE_ ALL QUESTIONS FIGURE 1.1: STRUCTURE OF THE ELECTRICITY INDUSTRY IN THE UK IN 2005. .......................... 5 FIGUR 1.2: ELECTRICITY DEMAND BY SECTOR IN THE UK 2005. ............................................... 8 FIGURE 1.3: THE 14 REGIONS OF ELECTRICITY DISTRIBUTION AND THEIR RESPECTIVE
SUPPLIERS. ....................................................................................................................... 10 FIGURE 1.4: REGIONAL ELECTRICITY MARKET SHARES............................................................ 11 FIGURE 1.5: AVERAGE WEIGHTED ANNUAL ELECTRICITY PRICE UK 1990-2006 INCLUDING
VAT, FEES AND NETWORK COSTS. ................................................................................... 13 FIGURE 1.6: SUPPLIERS’ WHOLESALE COSTS CONVERGE OVER TIME........................................ 14 FIGURE 1.7: RETAIL AND WHOLESALE PRICES AND GROSS MARGIN 2002-2006. ...................... 16 FIGURE 1.8: RETAIL GROSS MARGINS (P/KWH) IN UK AND SWEDEN....................................... 17 FIGURE 1.9: THE PRELIMINARY ANALYSIS MODEL ................................................................... 21 FIGURE 2.1: OUTLINE OF THE FRAME OF REFERENCES ............................................................ 24 FIGURE 2.2: PRICE AS A SUBSET OF CUSTOMER VALUE ............................................................ 25 FIGURE 2.3: CUSTOMER VALUE IN EXCHANGE. ........................................................................ 26 FIGURE 2.4: CUSTOMER VALUE BUILD-UP................................................................................ 28 FIGURE 2.5: INDUSTRY DYNAMICS AND COMPETITIVE ADVANTAGE......................................... 30 FIGURE 2.6: THE INDUSTRY ACTORS. ....................................................................................... 35 FIGURE 2.7: THE SIX COMPONENTS ON THE INDUSTRY LEVEL. ................................................. 36 FIGURE 2.8: MAP OF STRATEGIC GROUPS ALONG KEY STRATEGIC DIMENSIONS IN THE UK
viii
RETAIL ELECTRICITY INDUSTRY. ...................................................................................... 40 FIGURE 3.1: THE DIFFERENT GROUPS OF FACTORS, THEIR INTERDEPENDENCIES AND INFLUENCE
ON THE TWO DIMENSIONS OF PRICE. ................................................................................. 48 FIGURE 4.1: THE LINKS IN THE CHAIN OF RESEARCH................................................................ 56 FIGURE 6.1: THE FINAL ANALYSIS MODEL. ............................................................................ 101 FIGURE 7.1: THE UNDERLYING DRIVERS OF THE UK ELECTRICITY RETAIL MARKET. ............. 104 FIGURE 7.2: THE CHAIN OF CAUSES AND EFFECT.................................................................... 105 FIGUR 9.1: FURTHER RESEARCH MAY PROVIDE DEEPER UNDERSTANDING OF UNDERLYING
DRIVERS. ........................................................................................................................ 110 TABLE 1-1: RETAIL SUPPLY COMPETITION IN THE UK AND NORDIC ELECTRICITY MARKETS... 11 TABLE 1-2: COST COMPONENTS OF THE AVERAGE DOMESTIC ELECTRICITY BILL 2005
(STANDARD CREDIT). ....................................................................................................... 15 TABLE 2-1: BUYER PURCHASE CRITERIA THAT DRIVE THE CUSTOMER PERCEIVED VALUE. ...... 25 TABLE 2-2: KEY FACTORS OF THE STRATEGY CONCEPTS AND THE DEGREE OF COMPETITION. . 29 TABLE 2-3: THE RELATIONSHIP BETWEEN USE CRITERIA AND BUYER VALUE........................... 30 TABLE 2-4: CHARACTERISTICS OF THE THREE CATEGORIES OF COMPETITIVE STRATEGIES. ..... 31 TABLE 2-5: FACTORS IDENTIFIED WITHIN THE UK RETAIL ELECTRICITY INDUSTRY. ............... 34 TABLE 2-6: FACTORS REGARDING STRATEGIC GROUPS............................................................ 40 TABLE 2-7: FACTORS IN THE MACRO ENVIRONMENT ............................................................... 41 TABLE 2-8: IDENTIFIED FACTORS IN CHAPTER 2, DESCRIBING THE FACTORS. ......................... 44 TABLE 4-1: MAP OF INTERVIEW SUBJECTS AND RESPONDENTS. ............................................... 55 TABLE 4-2: RESEARCH DESIGN. ............................................................................................... 56 TABLE 5-1: THE VALUE OF AN ELECTRICITY CUSTOMER. ......................................................... 70

Background
1
1 BACKGROUND
The first chapter of this report gives the background for the decision problem and leads on to the purpose of thesis and how to attack the problem. The necessary facts on the field of study is given in a summary of the pre-study, that shows that gross margins in UK retail electricity are high in comparison to Sweden.
Background
2
This report will explore and explain why gross margins in retail electricity are higher in the UK than in other European countries. Is it because the consolidated market structure, entry barriers to the market or does it have anything to do with the UK consumers and their attitude towards prices?
Prices on energy in general and on electricity in particular continue to be under great debate whether their magnitude is justified or not. It is true that power companies earn sometimes great profits on generation and network distribution of electricity, but the retail electricity business for the private sector is a separate entity that differs in terms of both business activities and profits. Despite public and political complaints of high prices on retail electricity in Sweden, the suppliers do not see any immediate benefits from this. The margin between the price to customer (from supplier to end-user) and the wholesale price (the price on generated electricity set by the producers’ market) is very low. Some suppliers even make a net loss from time to time when selling retail electricity to private customers.1
Looking at the corresponding market in the UK, the gross margins are said to be high in comparison to Sweden and other European markets. Under a number of years the suppliers of electricity to UK households are said to have sustained remarkably high prices in comparison to their purchase costs, which means that they have added a substantial mark-up factor to their prices. The field of study is therefore to determine whether this is indeed the case and if so, how come they have been able to do that?
1.1 PRESENTATION OF THE PROBLEM As a consequence of the deregulation of previously state-monopolised power markets and in order to make visible the bearers of costs and value-creating activities throughout the value chain, Vattenfall has unbundled its previously vertically integrated company structure, where each and every division now must be profitable in its own right. This unbundling also accommodates to the EU directive demanding that the European markets in electricity should be equally and totally liberalized.2 In Vattenfall’s case the generation business is more profitable than the sales unit. This is even more evident in the retail segment, which is something that has been proven to be a rule rather than an exception throughout the entire industry in all of Vattenfall’s markets.3
One market that seems to go towards this trend is the UK, where gross margins in the retail divisions according to independent reports have been way higher in the years 2001-2005 than in for example Sweden or Germany in the same period of time.4 This is something of a mystery since England is seen as a truly competitive market, where sustained high gross margins should not be possible to sustain according to basic economic theory. In order to understand the course of events on the UK market Vattenfall is now asking why this might be. It is primarily a wish to expand the knowledge of Europe’s retail markets, which is always of interest for a company who wants to grow. However, public transparency in the UK is not as good as in for example Sweden, which makes it difficult to be certain about the indications of the various reports. The UK’s history of power deregulation is quite unique and so is their market structure, with only six dominant suppliers of residential electricity. Hence, what we need to do first is to get a figure on gross margins in the retail business to verify that it would be interesting and relevant to understand what influences them. After that comes the main task which is to do the actual investigation of the drivers of gross margins on the market.
1 Vattenfall 2 Vattenfall 3 Vattenfall, internal report 4 Vattenfall, internal report
Background
3
Why not then investigate net margins and profitability, as these numbers are what really matter in the end? Because internal and underlying cost structures are so different from market to market, it is not useful to directly compare one country’s net margins next to another. It is more convenient to compare gross margins than net margins, as the latter must always be put in context, which requires an in-depth analysis. To gain access to internal cost data is also virtually impossible for an outsider, while comparing purchase costs and end-prices is feasible.
While this report is not intended to lay bare differences between, or compare various electricity markets, the case of the Scandinavian market, provided by Vattenfall, will be used as a guideline for making assumptions about what is special about the UK market. The primary focus of interest in this report will be on the time period 2001-2005, since the market architecture in the UK went through a change of character in 2001 and that data available at the start of this project only went so far as up until 2005, although there will be references to other periods in time as well.
1.2 OUTLINE OF THE THESIS Reading guide
Even though the researchers believe that the whole of this report is meant to be read, it can be quite cumbersome for the reader with a non-academic perspective and interest. The Background serves as an overview of the problem area for the unaccustomed reader, although 1.7 can be skipped. The next three chapters are primarily aimed at the reader with an academic interest in the research; however the analysis model chapter can be a good way of understanding the approach of the problem, which is how the research is formulated. The casual reader can jump to the summary of the Analysis and then to the Conclusions, which are the chapters of obvious interest to most readers.
1 Background
We begin the report with an introduction to the problem and the issues surrounding it. The reader should understand the reason behind this thesis and the overall current situation at hand. The reader should also grasp the approach of how this problem will be studied and analysed.
2 Describing the factors
In this frame of references we will use our methodology presented in the first chapter in order to make the connections between the empirical findings in the pre-study with existing theories on the subject. By this method we can distinguish and extract which relevant factors to study. The model of analysis that is presented in the next chapter is herein constructed step-by-step.
3 The analysis model
Here we bring theories from the previous chapter into one model of analysis that explains our view of describing the area of investigation and how to approach the problem. The line of reasoning should be evident for those who have read the preceding frame of references, Describing the factors.
4 Methodology
The methodology used in the thesis is presented and argued for. Reflections and critique of source material will also be discussed here. The reader should be able to acknowledge what precautions are necessary when conducting an empirical study, and how to avoid sources of error.
5 Empirics
The collected data material from our field study in the UK is presented here in accordance with
Background
4
our analysis model to facilitate the reading experience and the analysis of the data.
6 Analysis
The previous chapter is here analysed, with reference to Describing the factors, in order to come to a conclusion regarding our purpose. The objective is to finalize the factors and define the patterns of interrelationship between them. Following the principles laid out in the frame of references, the line of reasoning should be evident.
7 Conclusions
As a natural part of the previous chapter of analysis, the conclusions to be made should be evident to the reader. We will also reflect upon our findings and what to make of the results, as in terms of recommendations for what Vattenfall can do to increase their retail gross margins.
8 Future research
As we are bound to come up with interesting questions during our research that cannot be answered within scope of this study, these topics for further research are discussed in this chapter.
9 Reflections
In the finishing chapter we reflect upon our findings and what could have been done differently in the research. Future developments and implementations of the results that cannot be confirmed through our data are also discussed here.
1.3 THE POWER INDUSTRY For the reader to grasp the field of study we must begin by laying out the basic foundations of the electricity industry. What are its specificities, what does the infrastructure look like and what is the concept of retail electricity? When we discuss electricity in a physical sense in this paper, we are referring to the energy –the amount of electric power per time unit (usually kilowatts per hour, kWh) - and not power as it self, although it is obviously an integral part of the subject.
1.3.1 THE ELECTRICITY MARKET In this section we will explain the functions and properties of the electricity (power) market and describe what characterizes it. One needs to understand the layout of the power infrastructure and the way trading is performed on the electricity market, in order to follow the line of reasoning in this report.
As with any commodity, in order to distribute electrical energy from source to usage there needs to be an infrastructure and a market to balance supply and demand. The electricity market is a unique business, with peculiar specificities, such as natural monopolies, simultaneous production and consumption, and the inability to determine where a unit of power comes from. The power plants generate electricity, which is sold to market price on the wholesale market, from which suppliers buy their share of electricity and resell it to their respective end customers. The electricity market is also characterized by dividing the market in terms of the time aspect of trading with electricity delivery. Companies trade in either real-time on the spot market, or with contracts, such as forwards or futures.
The spot market is the real time market,where commodities such as electricity aresold to market price for immediatedelivery.
Futures are highly standardized contractsfor buying or selling a determined amountof power at a certain date to a pre-determined price. These contracts aretraded on a futures exchange. Forwards areless standardized and are usually signedcontracts between two parties.
Background
5
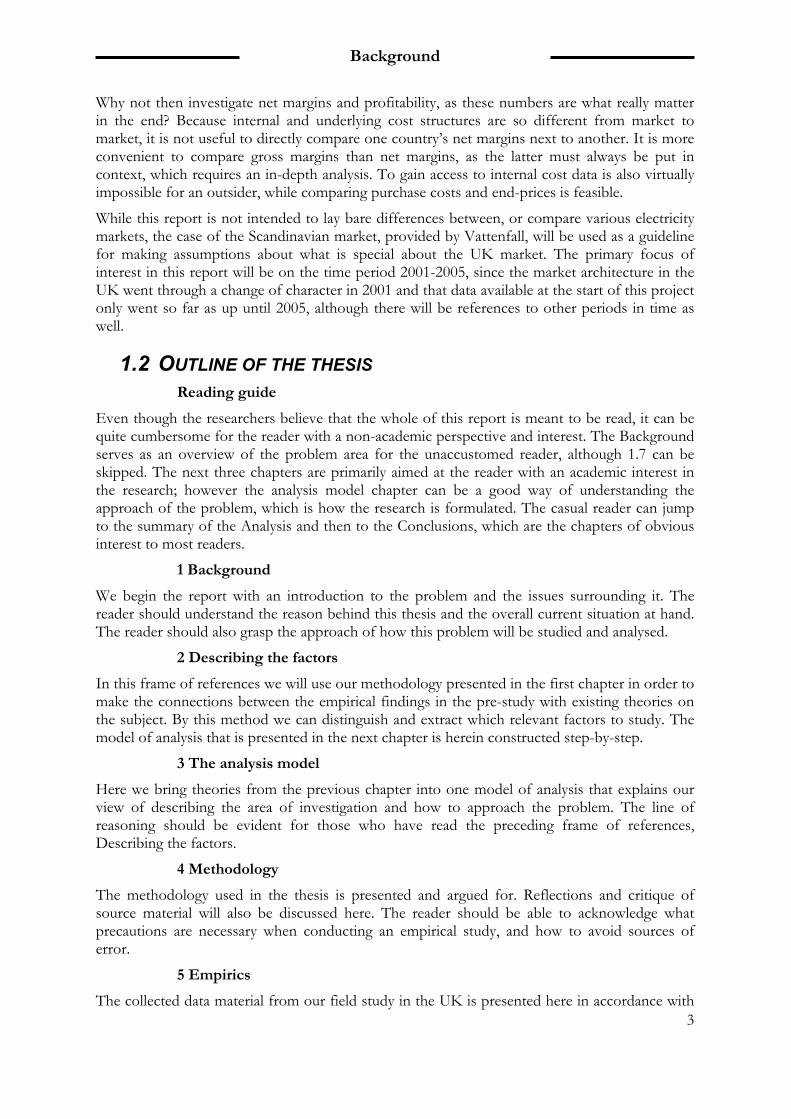
Traditionally, electricity companies deal with both these two parts.5 Figure 1.1: Structure of the electricity industry in the UK in 2005.
Source: DTI 2006
As is seen in Figure 1.1, the infrastructure and the links between actors and processes can be described as a cluster of different activities.
Generation
Electricity is produced from a source of raw energy and is transmitted onto a national, or in some cases, trans-national power grid. In the UK, the main forms of generation are coal and gas fired combustion plants, with a fair amount of nuclear power as well. ‘Renewables’ are on the way forward, primarily in the form of wind power. A campaign called ‘dash for gas’ has propelled the fuel in replacing the dirtier coal.6
Transmission
The electric energy is first distributed on a high-voltage grid operated by a Transmission System Operator (TSO). Due to obvious reasons this is a natural monopoly, since it would not be efficient to have several competing grids in the same place. National Grid Transco (NGT) owns the UK network. NGT:s primary task is to manage the balancing of supply and demand in the system, they buy a few percent of the total electricity generation in order to be able to security of supply in real time.7
Distribution
The high-voltage current is transformed and locally distributed to end-users through a less
5 Vattenfall 6 Vattenfall, internal report 7 Electrica Services Limited, Electricity Industry Review 10 (Surrey, 2006), pp. 7-9.
Background
6
intense power grid. This business is also regulated due to its monopolistic nature. The 14 regional networks in the UK are owned and operated by seven Distribution Network Operators (DNOs).8
Suppliers
A supplier is not a retailer in the sense that it buys from many different wholesale suppliers and can offer a variety of products. The reason for having suppliers is that its functions are completely different from those of a power generator; the supply side buys electricity from the market and takes responsibility that electricity is provided to the end-user. The main activity of the suppliers is to handle the different contracts involved. As we shall later on study, there are six major UK suppliers, or retailers, mostly made up by former monopoly Regional Electricity Companies (RECs). Some of these companies are also DNOs for their respective areas.
Customers
Although large industries may have their power supplied by a high-voltage power grid through dedicated contracts with the power plant, most customers are small-scale end-users, at the end of the electricity value chain.9
1.3.2 MARKET ARCHITECTURE Liberalized market architectures differ from country to country, but basically there are two main trading designs that they all adhere to: either through a common mediated market (exchange) or through direct bilateral agreements between seller and buyer.
Exchange
A power exchange is a centralized market place where the generators and suppliers make bids for selling and buying electricity, which works pretty much like an auction. The exchange is also a clearinghouse that acts as a mediating creditor, which provides security for the involved parties, and also separates the two sides. This means that all contracts are anonymous and there is no counterparty risk.
An exchange is inflexible in its nature but also very fast and transparent with published prices, and therefore works well for spot trading (on the real time market) with high volumes and many actors at the same time.13 The Nordic power exchange NordPool, where Vattenfall sell all their generated power and buy most of their physical supply, is a market of this type. Currently, 40 % of all consumed power in the Nordic markets is traded on this voluntary exchange.10 This should be put in perspective with the UK public exchange APX Power UK, where only 4 % of the total consumption is traded.11
Bilateral market
On a bilateral market, which has been the main form of trading in the UK since 2001, buyers and sellers trade directly with each other without the intermediating function of a common exchange. Some kind of broker or dealer is mostly needed, though. The key differences are that the opponent in the contract is always known and that prices are being opaque since they are not published in the same way as on an exchange. Bilateral agreements are a very flexible trade form, 8 Vattenfall, internal report 9 DTI 2006, Ofgem 2006 10 Toft, S., Power System Economics, First edition. (New Jersey, 2002) & Nordpool 2006 11 www.apxgroup.com 2007, own calculations
A clearing house acts as the contractualcounterparty on a futures exchange andprovides services for settlement ofcontracts. Its role is partly to relieve theparties involved of all risk regardinginsecurities about their counterparty.
Background
7
as all actors can specify the contracts to exactly match their needs from time to time. This flexibility comes at price though; negotiating is expensive and complex, and demands a high degree of expertise. The paper work and legal framework are immense in the UK, not the least.12 There is no transparent market price, which would make the market slow if it was not for the brokers involved. It also takes a long time to write the contracts and to check the credit worthiness of the buyer; these are circumstances that are hard for an inexperienced actor to grasp and manage. Bilateral markets are also inefficient when it comes to handling the balancing process and transmission security; since the price transparency is low, the coordinating forces of the market cannot function as efficient as possible.13 The balancing process is very tough for smaller, less financially secure suppliers in the UK.14
1.3.3 EUROPEAN MARKETS ARE UNDER DEVELOPMENT The electricity markets in Europe are in their present incarnation rather young, with a history of radical changes from governmental monopolies to competition and to having intents on becoming more and more international. Still, it is essential to notice that most countries’ electricity markets differ, both in terms of architecture and to the degree to which they are deregulated.15
During the past 20 years, a wave of deregulation and liberalizations of energy markets has spread across Europe. Traditionally, the electricity market was during the 20th century seen as an infrastructure that should be handled by the state, much like any other public business. In the 1990’s though, many governments concluded that competition and a market-driven system would increase efficiency and reduce prices, thus they deregulated the power markets to various degrees. Since the infrastructure in distribution is inherently a monopoly and because of the national importance of the business, many aspects of the market are still regulated, and one can say that the architecture and function of the European power market is still under development.
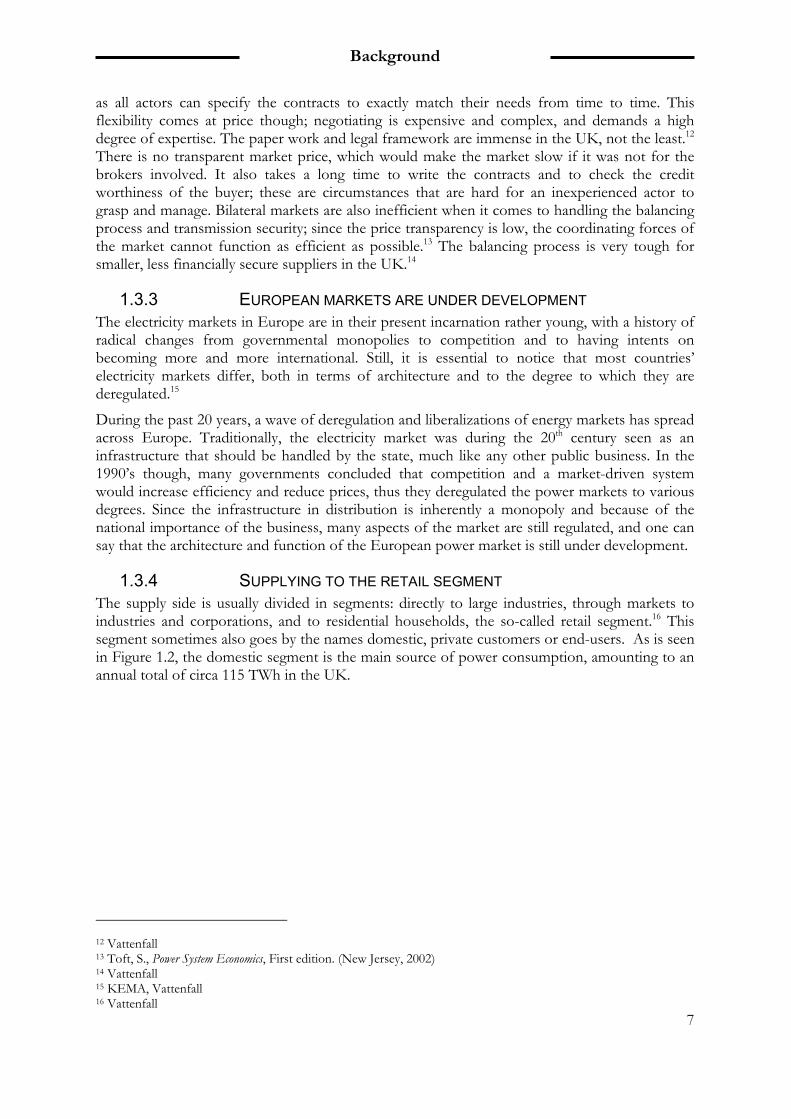
1.3.4 SUPPLYING TO THE RETAIL SEGMENT The supply side is usually divided in segments: directly to large industries, through markets to industries and corporations, and to residential households, the so-called retail segment.16 This segment sometimes also goes by the names domestic, private customers or end-users. As is seen in Figure 1.2, the domestic segment is the main source of power consumption, amounting to an annual total of circa 115 TWh in the UK.
12 Vattenfall 13 Toft, S., Power System Economics, First edition. (New Jersey, 2002) 14 Vattenfall 15 KEMA, Vattenfall 16 Vattenfall
Background
8
Figure 1.2: Electricity demand by sector in the UK 2005.
Source: DTI 2006
The suppliers’ primary reason for being is to facilitate the buying process for the end-users. It would be unnecessarily strenuous for a person to invest time and money in order to negotiate and close deals with generators. The offering from the retail suppliers can be defined as the service of handling the contracts involved. Since electricity is not a tangible product and is essentially supplied by the generators and distributors, one cannot talk of the suppliers as selling a product. The customer does not buy a package of electricity but the process and opportunity for consumption. Marketing, billing and customer service are the core functions of the retailer; other actors can serve the rest.17
Although market structures vary, there are some common functions that an electricity retailer has to be able to perform, or enter into a contract for, in order to compete effectively.18
o Meter reading o Meter rental o Billing o Credit control o Customer management via an efficient call centre o Distribution use-of-system contract o Reconciliation agreement
The retail segment is characterized by standardized agreements and higher prices than for industrial customers, due to the small amounts of consumption per buyer. Retail electricity is usually more expensive per unit of power for low-usage customers. For retail customers pricing is done in terms of price per usage, not per effect.
1.4 PRE-STUDY FINDINGS In order to define the essential formulation of the problem and to construct a framework for analysing it, we have conducted a pre-study to establish a good knowledge about the subject of
17 Vattenfall 18 http://en.wikipedia.org/wiki/Electricity_market
Background
9
our research. As the goal of our study is to explain what drives the gross margins on the UK market, we determine that they are indeed significant in comparison to the Swedish market. We present the most piquant results from the pre-study that become the basis for our further research.
1.4.1 MARKET STRUCTURE When the UK’s power industry went from state monopoly to a (partly) competitive market, England and Wales was divided into twelve regional Electricity Boards, wherein each Area Board, one Regional Electricity Company (REC) distributed and supplied electricity to end-users within their respective region. In Scotland two vertically integrated companies were responsible for generation and supply of electricity to discrete areas. Distribution and supply were split into separate legal entities, and the huge generators were divided into smaller companies.19 During the 1990’s, mergers and acquisitions were a common feature of the UK retail electricity market. The number of generators grew from two to 35 companies, while the residential suppliers consolidated their market into ‘the Big Six’ of today.
An important feature of the UK retail electricity market is the concept of Tier1 and Tier2. Tier1 customers are those who have not yet switched from their regional incumbent supplier, while Tier2 customers have done so, one or several times. The main difference is that Tier1 customers is subject to substantially higher tariffs than Tier2, thus rendering them a great source for profit while new entrants on the retail market have the opportunity to out-price the incumbents. Over a transition period for a few years after the deregulation in 1998, existing suppliers were not even allowed to reduce prices in their own areas as a means for facilitating entry for new suppliers.20 It is highly desirable for the former RECs to keep as many of their original Tier1 customers as possible, as it is impossible to acquire new ones. Switching is one of the main concerns for the regulatory instances in the UK, since it is supposed to be a good sign of a healthy, competitive market. Residential customers were not able to change their original regional supplier up until 1998, but since then about two thirds of the residential customers have switched supplier at least once, benefiting from lower prices. About 50 % are not with their original incumbent and this is a quite high number by EU standards.21
19 Tovey, K., “Developments in the Electricity Markets in the UK: the move towards BETTA”, University of East Anglia (Norwich, 2005) 20 Tovey, K., “The Changing Face of the Electricity Market in the UK”, University of East Anglia (Norwich, 2006) 21 Electrica Services Limited, Electricity Industry Review 10 (Surrey, 2006) & Ofgem, “Domestic Retail Market Report - March 2006”, (2006)
Tier1 refers to the customers of theprevious incumbent in an Area Board, whohave not yet switched. Tier2 customers arethus those not longer with their originalsupplier.
Background
10
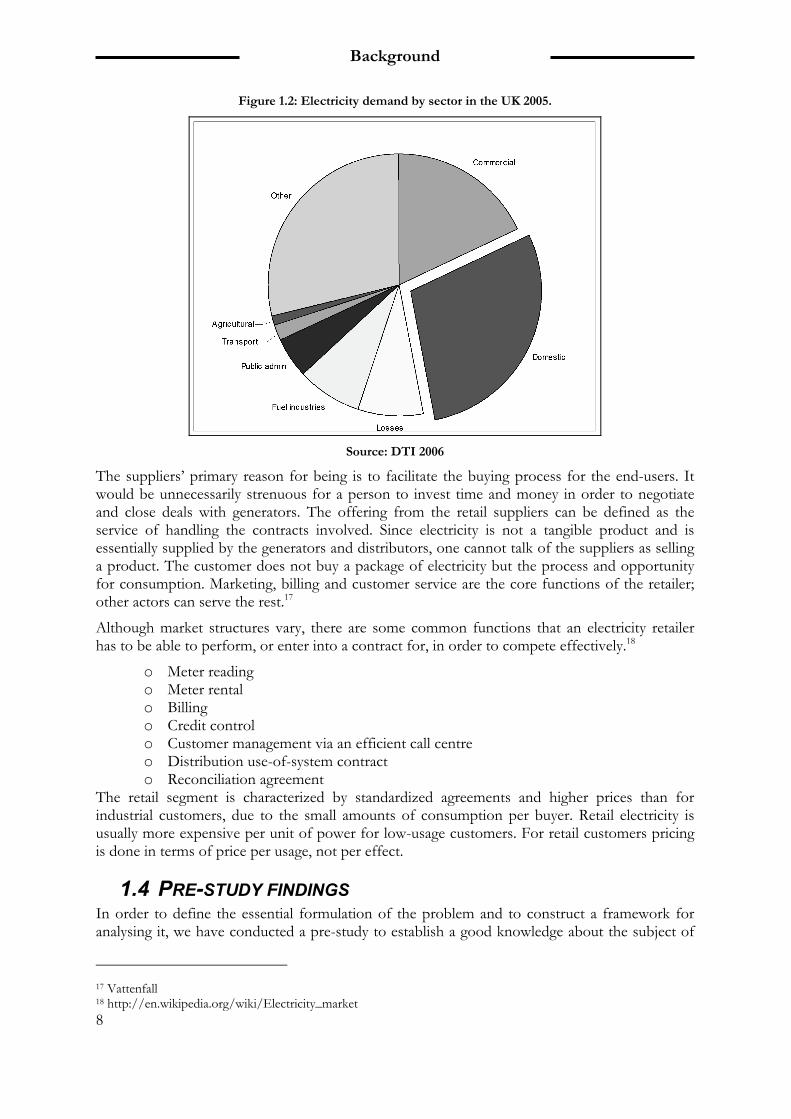
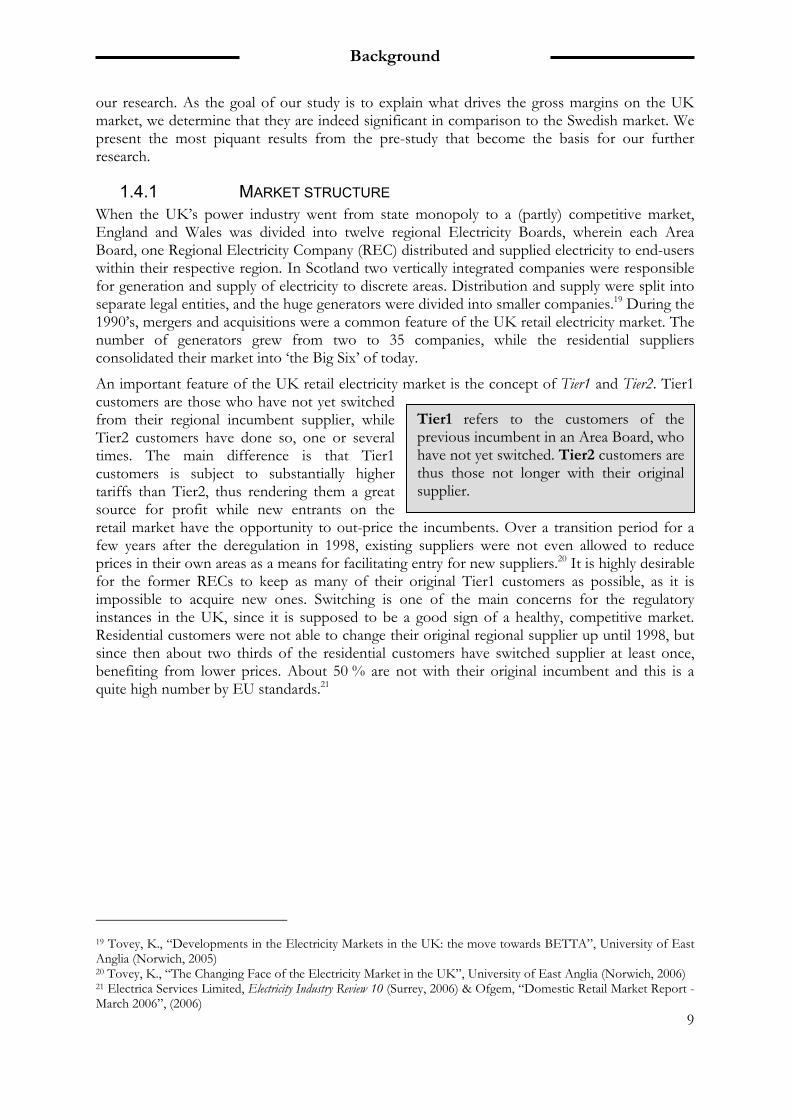
Figure 1.3: The 14 regions of electricity distribution and their respective suppliers.
Source: Ofgem 2006
As seen in Figure 1.3, the distribution of former Area Boards between the major suppliers is fairly equal. Although Centrica are the largest supplier, they are not a regional incumbent. Being the former national gas monopoly, they are on the other hand the only incumbent for residential gas in the whole of the UK, which meant that they had an enormous advantage when offering dual-fuel to their gas customers. All the other electricity suppliers later emulated this successful formula, but Centrica still resides over 50 % of the residential gas market, and 40 % of the dual-fuel segment. The distribution of Tier1 and Tier2 accounts is not the same in all regions as seen in Figure 1.4; some areas are clearly keener on staying with their incumbent than others.22
22 Electrica Services Limited, Electricity Industry Review 10 (Surrey, 2006) & Ofgem, “Domestic Retail Market Report - March 2006”, (Surrey, 2006)
To have a dual-fuel account isto receive both gas and electricityfrom the same supplier and onthe same bill, and was introducedby Centrica in 2001.
Background
11
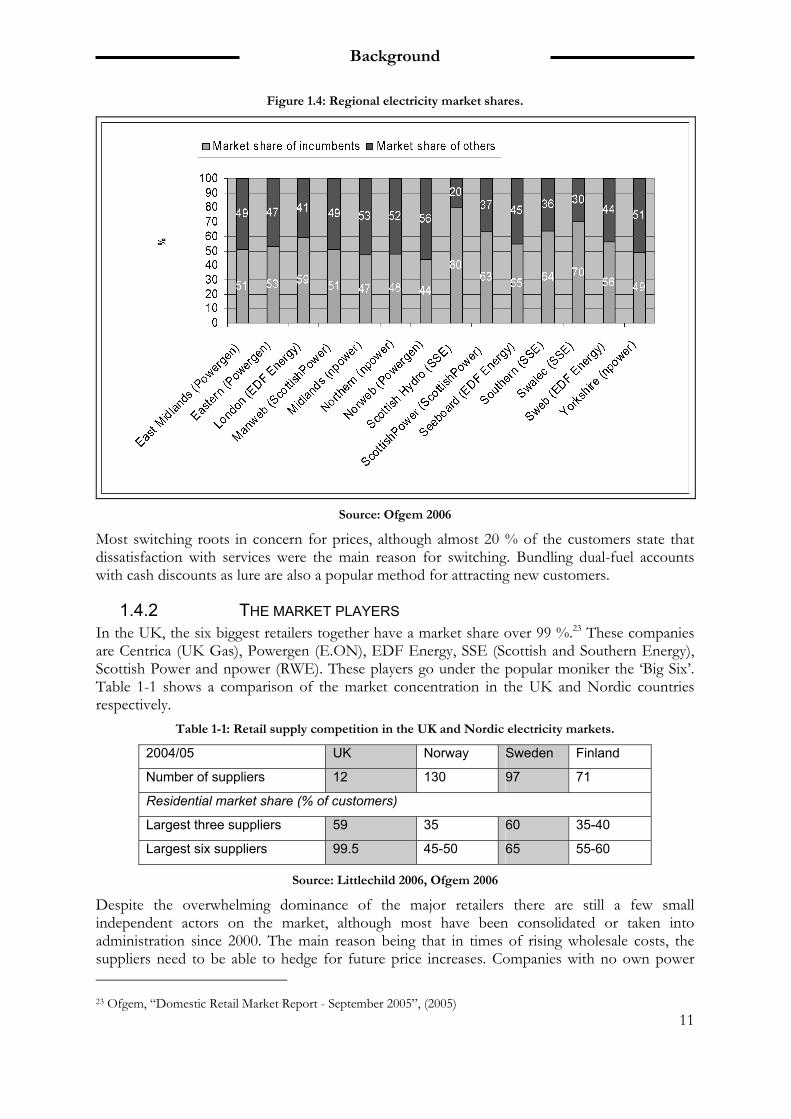
Figure 1.4: Regional electricity market shares.
Source: Ofgem 2006
Most switching roots in concern for prices, although almost 20 % of the customers state that dissatisfaction with services were the main reason for switching. Bundling dual-fuel accounts with cash discounts as lure are also a popular method for attracting new customers.
1.4.2 THE MARKET PLAYERS In the UK, the six biggest retailers together have a market share over 99 %.23 These companies are Centrica (UK Gas), Powergen (E.ON), EDF Energy, SSE (Scottish and Southern Energy), Scottish Power and npower (RWE). These players go under the popular moniker the ‘Big Six’. Table 1-1 shows a comparison of the market concentration in the UK and Nordic countries respectively.
Table 1-1: Retail supply competition in the UK and Nordic electricity markets.
2004/05 UK Norway Sweden Finland
Number of suppliers 12 130 97 71
Residential market share (% of customers)
Largest three suppliers 59 35 60 35-40
Largest six suppliers 99.5 45-50 65 55-60
Source: Littlechild 2006, Ofgem 2006
Despite the overwhelming dominance of the major retailers there are still a few small independent actors on the market, although most have been consolidated or taken into administration since 2000. The main reason being that in times of rising wholesale costs, the suppliers need to be able to hedge for future price increases. Companies with no own power 23 Ofgem, “Domestic Retail Market Report - September 2005”, (2005)
Background
12
generation or vast amounts of capital assets seem to stand little chance in the competition. In recent years Zest4 Electricity, Utility Link, Eledor, Reepham and the Team Group of Companies was forced into administration as they could not afford wholesale gas prices which continued to rise. When a supplier ceases to operate, its customers are automatically transferred to a new supplier (usually one of the Big Six) without being able to choose and often facing higher charges. 24
After setting fixed prices to their customers and then being faced with soaring wholesale prices the companies collapsed. Their customers who were expecting guaranteed lower bills will now be facing energy bill increases as Ofgem's policy automatically switches them over to a new supplier - usually one of the six major suppliers.25
The smaller retail suppliers are niche players, targeting customers by the aid of a very local branding or with green energy (renewables) as their key selling point. To this date, none of the smaller suppliers has more than a few hundred thousand accounts.
All major players in the market own generation to various extents and also network grids, thus they can be characterized as being vertically integrated. It seems to be common to consider the results of the entire value chain rather than splitting it up in separate business units with respective goals and measures.
1.4.3 ENTRY BARRIERS UK retailers are outside-in minded; the customer focus is clearly prominent in the way they are developing new concepts for marketing and bundling of services. The corporation is not seen as chain of discrete processes, but the main purpose is to make a profit within the entire value chain, where this profit emerges is not as important.26
The fact that there are just a handful of big suppliers in the UK makes the issue of entry barriers prominent in the debate on competition. In Sweden, for instance, a supplier would only need a starting capital base of a few hundred thousand pounds in security before being able to trade with NordPool and sell electricity. This amount increases with the volume the supplier wish to trade. Since trading in the UK is done through bilateral contracts directly between generators and suppliers, in practice no producer will trade with a retailer unless they have about £50 000 000 in assets. Very few market players have the ability to come up with these amounts of money, and along with low market liquidity on the public exchange (APX Power UK), this is why vertical integration is so important for securing the supply. The processes of writing contracts are immense; there is much legal expertise needed to be able to secure your supply.27
1.4.4 UK RETAIL PRICES SUNK AFTER DEREGULATION Immediately after the deregulation of the domestic market in 1998, prices sunk remarkably as seen in Figure 1.5, and has since not yet risen above the early 1990’s price levels in real terms. The UK residential price on electricity is the second lowest in the EU, if weighted according to the purchase power index.28
24 Electricity Guide, “New Electricity Companies can't Cope with Price Rises”, (Hampshire, 2007) 25 http://www.electricity-guide.org.uk/blog-new-electricty-companies-cant-cope-with-price-rises-20.html 26 Vattenfall 27 Vattenfall 28 Eurostat 2006
Background
13
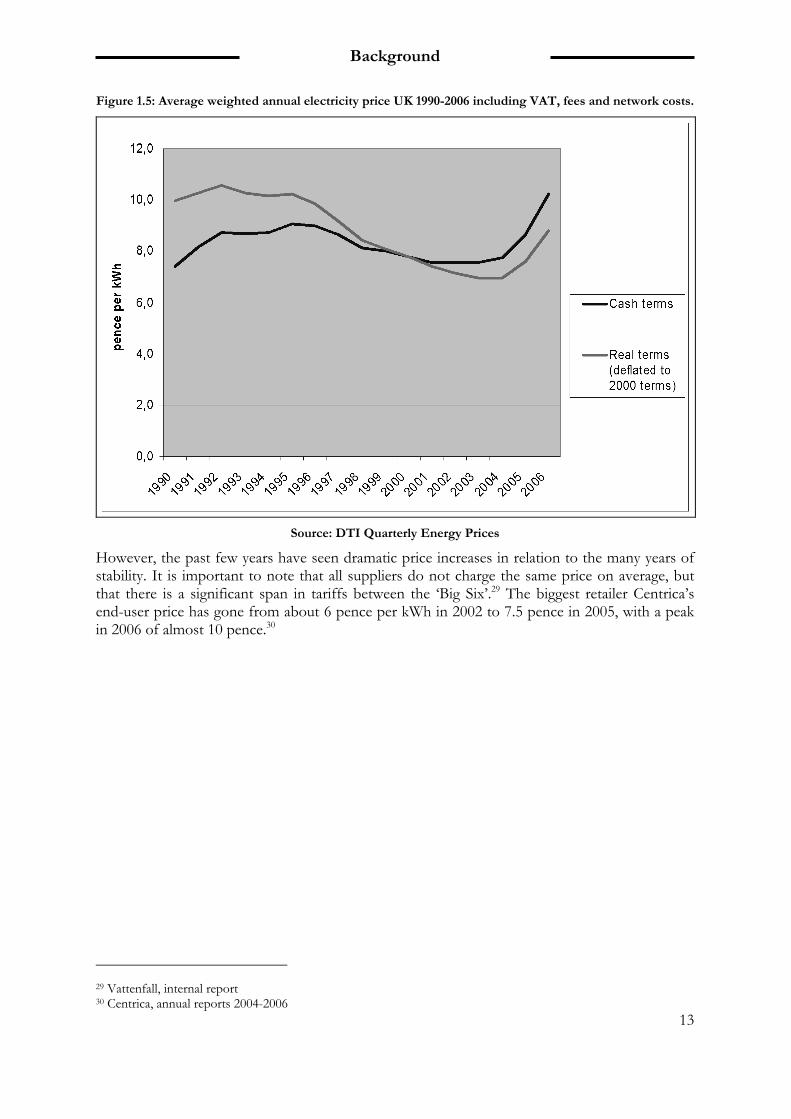
Figure 1.5: Average weighted annual electricity price UK 1990-2006 including VAT, fees and network costs.
Source: DTI Quarterly Energy Prices
However, the past few years have seen dramatic price increases in relation to the many years of stability. It is important to note that all suppliers do not charge the same price on average, but that there is a significant span in tariffs between the ‘Big Six’.29 The biggest retailer Centrica’s end-user price has gone from about 6 pence per kWh in 2002 to 7.5 pence in 2005, with a peak in 2006 of almost 10 pence.30
29 Vattenfall, internal report 30 Centrica, annual reports 2004-2006
Background
14
1.4.5 PURCHASE COSTS ARE WHOLESALE PRICES What largely determines the retailers’ gross margins and also the retail prices are the purchase costs, which is the price on wholesale electricity in the market. This price is essentially the same for all retailers, although their procurement strategies may differ and result in different wholesale costs. The trend since 2003 has been that relatively stable wholesale prices of about £20 per MWh have soared, peaking in 2006 with spot prices of £50-60 per MWh (Appendix A). This incurred heavy losses for those retailers who had not secured their supply at previous, lower levels. However, in late 2006 the trend turned and wholesale prices began to fall considerably. There is a direct correlation between the wholesale prices for electricity and gas, naturally due to that the latter is also a fuel for producing power and that the UK’s gas sources are no longer self-sufficient. The wholesale electricity is also closely correlated to the global oil price.
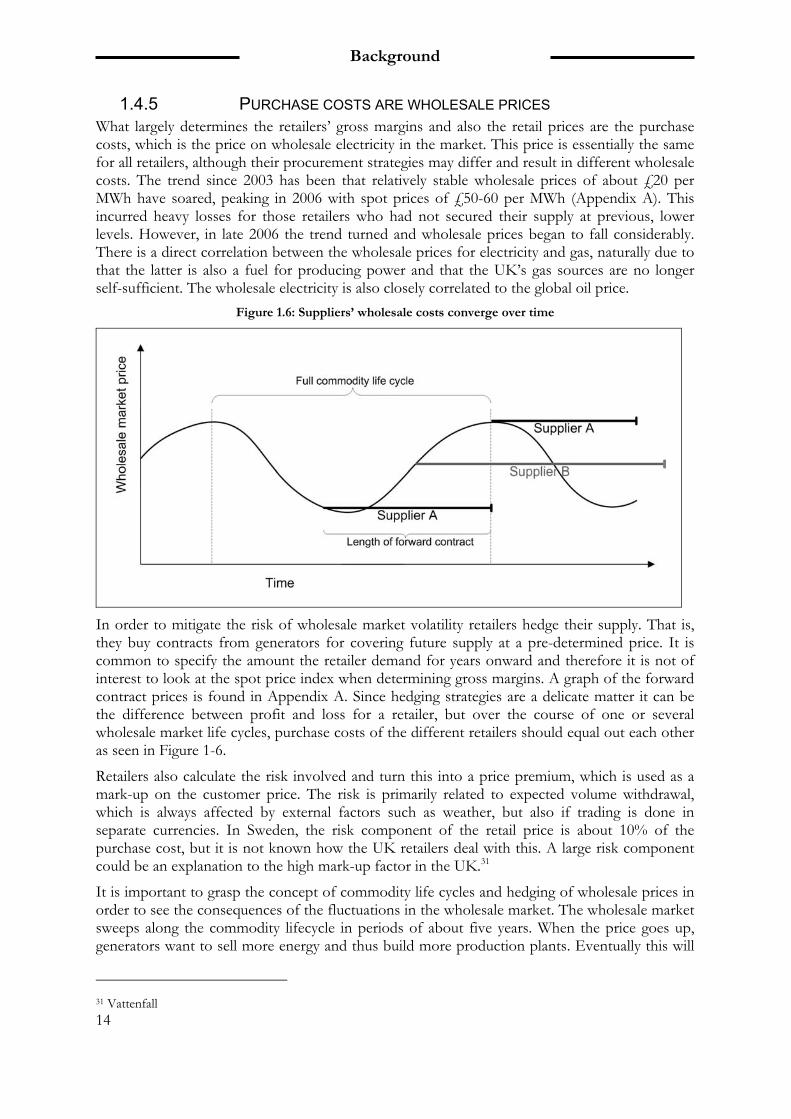
Figure 1.6: Suppliers’ wholesale costs converge over time
In order to mitigate the risk of wholesale market volatility retailers hedge their supply. That is, they buy contracts from generators for covering future supply at a pre-determined price. It is common to specify the amount the retailer demand for years onward and therefore it is not of interest to look at the spot price index when determining gross margins. A graph of the forward contract prices is found in Appendix A. Since hedging strategies are a delicate matter it can be the difference between profit and loss for a retailer, but over the course of one or several wholesale market life cycles, purchase costs of the different retailers should equal out each other as seen in Figure 1-6.
Retailers also calculate the risk involved and turn this into a price premium, which is used as a mark-up on the customer price. The risk is primarily related to expected volume withdrawal, which is always affected by external factors such as weather, but also if trading is done in separate currencies. In Sweden, the risk component of the retail price is about 10% of the purchase cost, but it is not known how the UK retailers deal with this. A large risk component could be an explanation to the high mark-up factor in the UK.31
It is important to grasp the concept of commodity life cycles and hedging of wholesale prices in order to see the consequences of the fluctuations in the wholesale market. The wholesale market sweeps along the commodity lifecycle in periods of about five years. When the price goes up, generators want to sell more energy and thus build more production plants. Eventually this will
31 Vattenfall
Background
15
lead to a surplus of supply and prices will fall and generators will consider closing down plants until there is yet more demand than supply on the market.32
When prices are on the downfall, it puts suppliers with no own generation in a favourable position, the market enabling them to secure and sell electricity cheaply, thus gaining market shares with healthy margins. Experience shows that when the price curve turns upwards, asset-light retailers are hit hard, facing harsh competition from the major players with structural hedges covering their supply. Since there is a time lag between the increases in wholesale price and consumer price, this is enough to put independent retailers in administration if the upward trends last for several years. Centrica’s losses in customer numbers during the last few years can be directly linked to their passing on of wholesale costs to the customers. The other incumbent players were able to adjust their prices to just under Centrica’s level.33
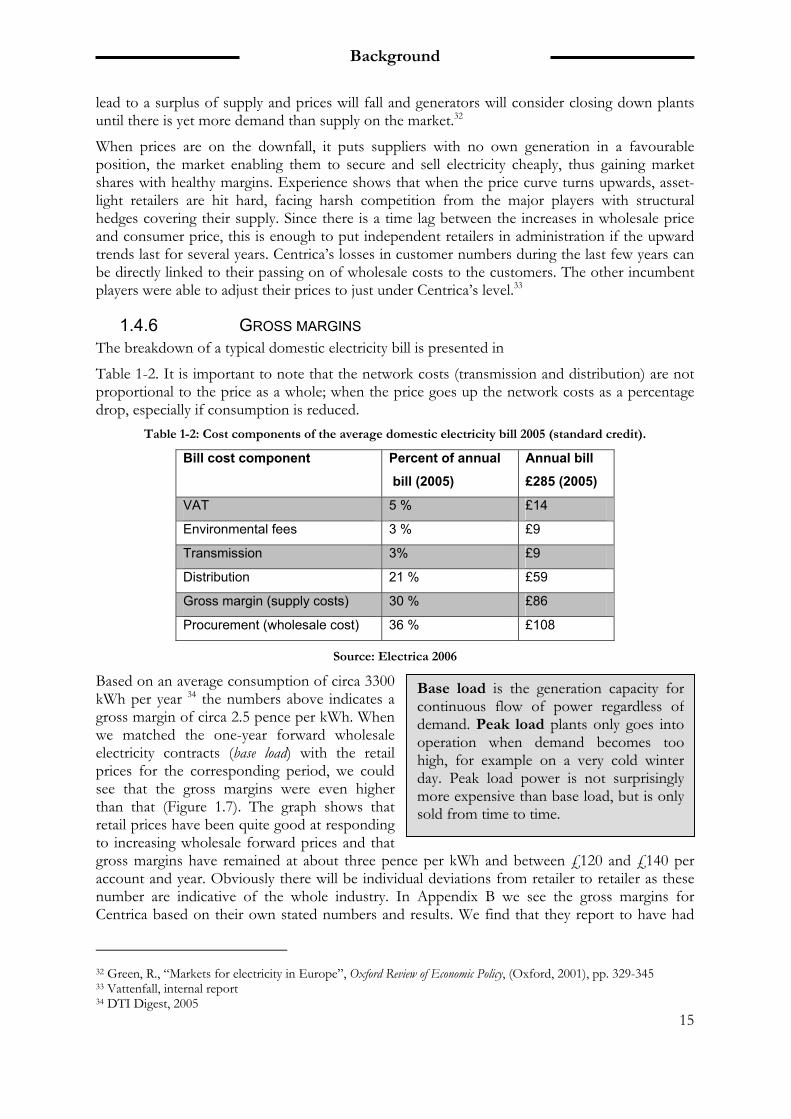
1.4.6 GROSS MARGINS The breakdown of a typical domestic electricity bill is presented in
Table 1-2. It is important to note that the network costs (transmission and distribution) are not proportional to the price as a whole; when the price goes up the network costs as a percentage drop, especially if consumption is reduced.
Table 1-2: Cost components of the average domestic electricity bill 2005 (standard credit).
Bill cost component Percent of annual
bill (2005)
Annual bill
£285 (2005)
VAT 5 % £14
Environmental fees 3 % £9
Transmission 3% £9
Distribution 21 % £59
Gross margin (supply costs) 30 % £86
Procurement (wholesale cost) 36 % £108
Source: Electrica 2006
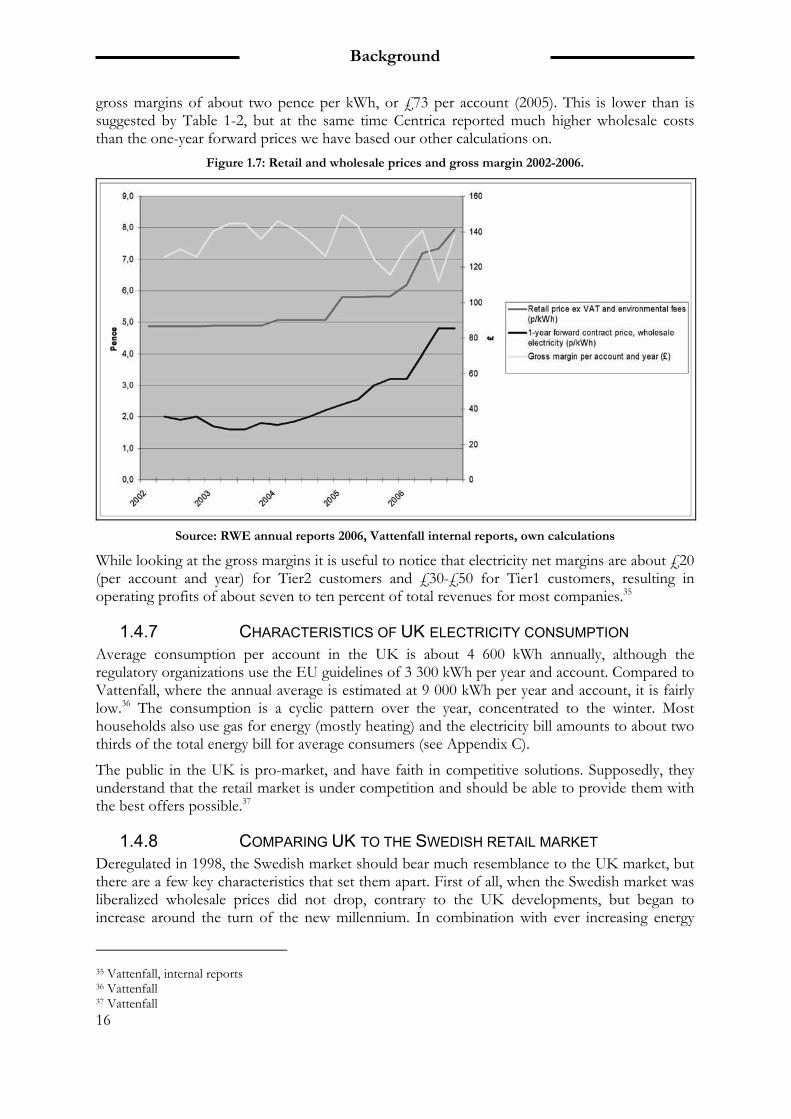
Based on an average consumption of circa 3300 kWh per year 34 the numbers above indicates a gross margin of circa 2.5 pence per kWh. When we matched the one-year forward wholesale electricity contracts (base load) with the retail prices for the corresponding period, we could see that the gross margins were even higher than that (Figure 1.7). The graph shows that retail prices have been quite good at responding to increasing wholesale forward prices and that gross margins have remained at about three pence per kWh and between £120 and £140 per account and year. Obviously there will be individual deviations from retailer to retailer as these number are indicative of the whole industry. In Appendix B we see the gross margins for Centrica based on their own stated numbers and results. We find that they report to have had
32 Green, R., “Markets for electricity in Europe”, Oxford Review of Economic Policy, (Oxford, 2001), pp. 329-345 33 Vattenfall, internal report 34 DTI Digest, 2005
Base load is the generation capacity forcontinuous flow of power regardless ofdemand. Peak load plants only goes intooperation when demand becomes toohigh, for example on a very cold winterday. Peak load power is not surprisinglymore expensive than base load, but is onlysold from time to time.
Background
16
gross margins of about two pence per kWh, or £73 per account (2005). This is lower than is suggested by Table 1-2, but at the same time Centrica reported much higher wholesale costs than the one-year forward prices we have based our other calculations on.
Figure 1.7: Retail and wholesale prices and gross margin 2002-2006.
Source: RWE annual reports 2006, Vattenfall internal reports, own calculations
While looking at the gross margins it is useful to notice that electricity net margins are about £20 (per account and year) for Tier2 customers and £30-£50 for Tier1 customers, resulting in operating profits of about seven to ten percent of total revenues for most companies.35
1.4.7 CHARACTERISTICS OF UK ELECTRICITY CONSUMPTION Average consumption per account in the UK is about 4 600 kWh annually, although the regulatory organizations use the EU guidelines of 3 300 kWh per year and account. Compared to Vattenfall, where the annual average is estimated at 9 000 kWh per year and account, it is fairly low.36 The consumption is a cyclic pattern over the year, concentrated to the winter. Most households also use gas for energy (mostly heating) and the electricity bill amounts to about two thirds of the total energy bill for average consumers (see Appendix C).
The public in the UK is pro-market, and have faith in competitive solutions. Supposedly, they understand that the retail market is under competition and should be able to provide them with the best offers possible.37
1.4.8 COMPARING UK TO THE SWEDISH RETAIL MARKET Deregulated in 1998, the Swedish market should bear much resemblance to the UK market, but there are a few key characteristics that set them apart. First of all, when the Swedish market was liberalized wholesale prices did not drop, contrary to the UK developments, but began to increase around the turn of the new millennium. In combination with ever increasing energy
35 Vattenfall, internal reports 36 Vattenfall 37 Vattenfall
Background
17
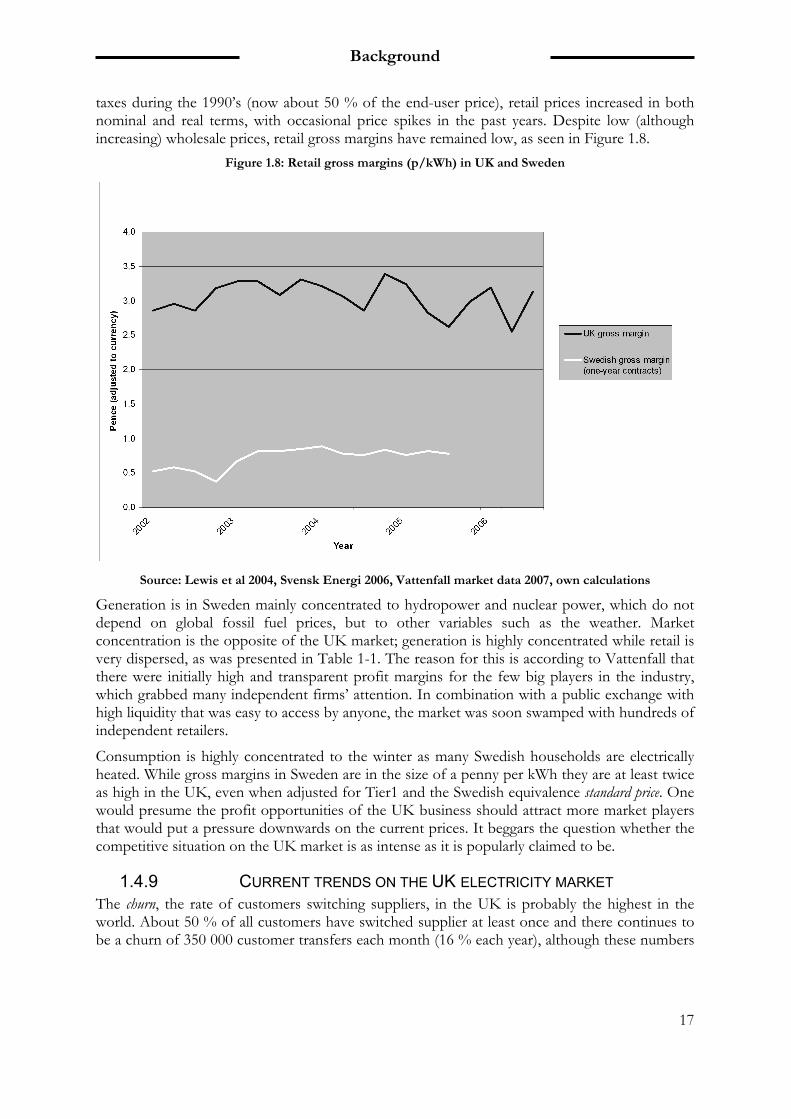
taxes during the 1990’s (now about 50 % of the end-user price), retail prices increased in both nominal and real terms, with occasional price spikes in the past years. Despite low (although increasing) wholesale prices, retail gross margins have remained low, as seen in Figure 1.8.
Figure 1.8: Retail gross margins (p/kWh) in UK and Sweden
Source: Lewis et al 2004, Svensk Energi 2006, Vattenfall market data 2007, own calculations
Generation is in Sweden mainly concentrated to hydropower and nuclear power, which do not depend on global fossil fuel prices, but to other variables such as the weather. Market concentration is the opposite of the UK market; generation is highly concentrated while retail is very dispersed, as was presented in Table 1-1. The reason for this is according to Vattenfall that there were initially high and transparent profit margins for the few big players in the industry, which grabbed many independent firms’ attention. In combination with a public exchange with high liquidity that was easy to access by anyone, the market was soon swamped with hundreds of independent retailers.
Consumption is highly concentrated to the winter as many Swedish households are electrically heated. While gross margins in Sweden are in the size of a penny per kWh they are at least twice as high in the UK, even when adjusted for Tier1 and the Swedish equivalence standard price. One would presume the profit opportunities of the UK business should attract more market players that would put a pressure downwards on the current prices. It beggars the question whether the competitive situation on the UK market is as intense as it is popularly claimed to be.
1.4.9 CURRENT TRENDS ON THE UK ELECTRICITY MARKET The churn, the rate of customers switching suppliers, in the UK is probably the highest in the world. About 50 % of all customers have switched supplier at least once and there continues to be a churn of 350 000 customer transfers each month (16 % each year), although these numbers
Background
18
increased in 2006 due to remarkable retail price increases.38
In late 2006 the wholesale market peaked and prices began to fall, which have led to announcements of retail price cuts from all suppliers in early 2007. Some independent retailers have in the past seemingly had a strategy of going into the market in advantageous times and then sold the company and the customers to a big retailer when the wholesale market went up. There are expectations that this pattern will be able to repeat itself in the near future. In early 2007, the new supplier Electricity 4 Business, who targets the small business segment, announced an agreement with banks Morgan Stanley and Belgium’s KBC Bank to provide trading and collateral services as well as a strong capital base.39
A window of opportunity exists while incumbent players have little ability to react. This presents a
potential opportunity for asset-light retailers, i.e. those without any wholesale and/or generation
assets, to enter the market by undercutting incumbents.40
The concept of billing several services at a time, rather than just electricity, is on the rise, primarily dual-fuel. This might be an indication that gas and electricity will be even more connected in the future, even though one should keep in mind that offerings with added telephone services have not kicked off right yet.
Consolidation among the big players has seemingly come to a halt, but small suppliers are often acquired quickly, keeping the total number of suppliers low.
1.5 EXISTING HYPOTHESES There are several hypotheses on why this situation has arisen. Some hypotheses were initially presented to us as a part of the problem; some hypotheses have been brought up during our pre-study phase, while interviewing co-workers at Vattenfall to understand the UK market.
The market is consolidated to six large retailers
According to classic national economics, a highly consolidated market or an oligopoly puts an upward pressure on market prices. This is due to the fact that there are severe entry barriers for new competitors, that otherwise might enter the arena and try to cut prices in order to gain market shares. The UK power industry has gone from a power exchange to bilateral markets, which makes it even harder for new entrants.
UK customers are lazy
With regards to the common outrage in Sweden and many other countries because of the high price on electricity, one would think that the UK consumers also would demand lower prices and lower gross margins for the suppliers. Even though the UK is seen as a precursor in deregulation and competition, UK end-users doesn’t seem to take full advantage of this. It could be that the electricity price is so much lower than for gas that it diminishes in comparison, that choice of supplier is based more on tradition than on price and that the public trust in market-oriented competition is very high.
UK retailers provide high value to customers
UK retailers seem to have a view of the market and the customer which is very much customer
38 Ofgem, 2006 39 Energy Business Review, “Opportunities for asset-light energy retailers may soon come around”, (London, 2006) 40http://www.energy-business-review.com/article_feature_print.asp?guid=C191EC67-F223-4469-9FDD-48022079FB6B, 2006
Background
19
driven – which could result in successful segmentation and differentiation as a basis for higher prices.
Vertical integration lessens impact of the wholesale market
The UK power companies manage the whole portfolio of businesses; they do not view their operations as separate entities but focus on the total result of the whole corporation. Internal subsidies between generator and supplier could provide for more competitive wholesale prices and also shut new competitors with no own generation out of the market.
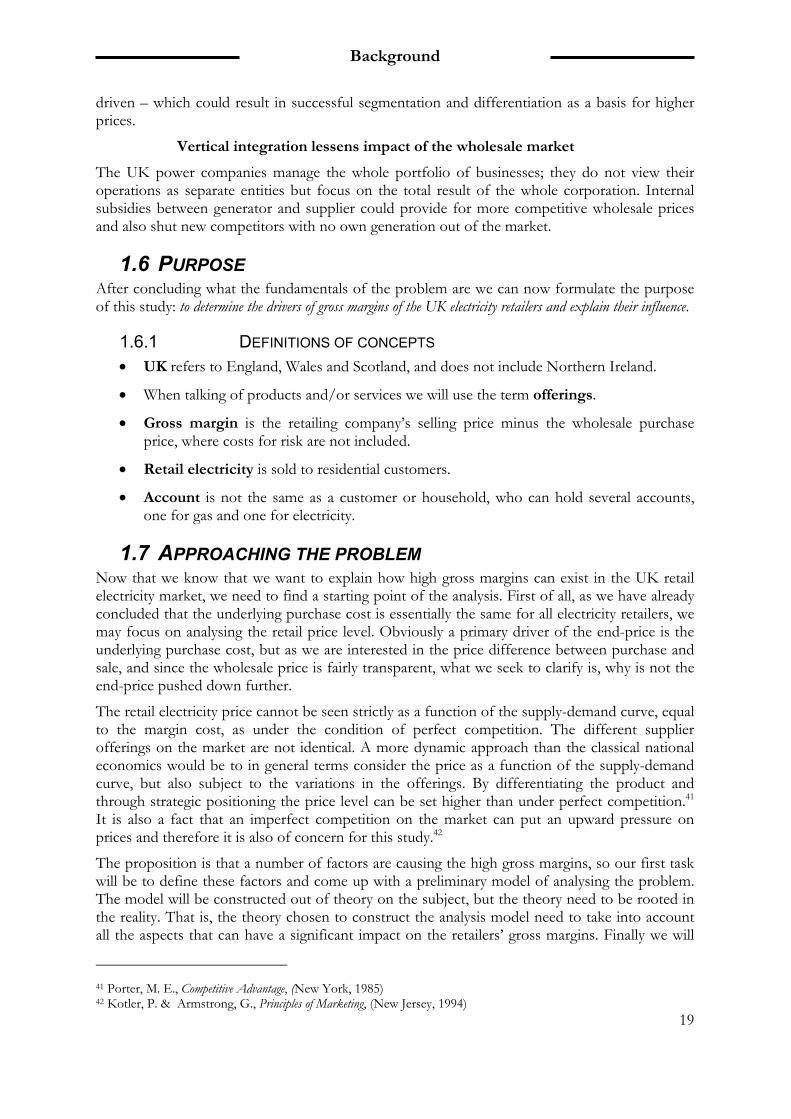
1.6 PURPOSE After concluding what the fundamentals of the problem are we can now formulate the purpose of this study: to determine the drivers of gross margins of the UK electricity retailers and explain their influence.
1.6.1 DEFINITIONS OF CONCEPTS • UK refers to England, Wales and Scotland, and does not include Northern Ireland.
• When talking of products and/or services we will use the term offerings.
• Gross margin is the retailing company’s selling price minus the wholesale purchase price, where costs for risk are not included.
• Retail electricity is sold to residential customers.
• Account is not the same as a customer or household, who can hold several accounts, one for gas and one for electricity.
1.7 APPROACHING THE PROBLEM Now that we know that we want to explain how high gross margins can exist in the UK retail electricity market, we need to find a starting point of the analysis. First of all, as we have already concluded that the underlying purchase cost is essentially the same for all electricity retailers, we may focus on analysing the retail price level. Obviously a primary driver of the end-price is the underlying purchase cost, but as we are interested in the price difference between purchase and sale, and since the wholesale price is fairly transparent, what we seek to clarify is, why is not the end-price pushed down further.
The retail electricity price cannot be seen strictly as a function of the supply-demand curve, equal to the margin cost, as under the condition of perfect competition. The different supplier offerings on the market are not identical. A more dynamic approach than the classical national economics would be to in general terms consider the price as a function of the supply-demand curve, but also subject to the variations in the offerings. By differentiating the product and through strategic positioning the price level can be set higher than under perfect competition.41 It is also a fact that an imperfect competition on the market can put an upward pressure on prices and therefore it is also of concern for this study.42
The proposition is that a number of factors are causing the high gross margins, so our first task will be to define these factors and come up with a preliminary model of analysing the problem. The model will be constructed out of theory on the subject, but the theory need to be rooted in the reality. That is, the theory chosen to construct the analysis model need to take into account all the aspects that can have a significant impact on the retailers’ gross margins. Finally we will
41 Porter, M. E., Competitive Advantage, (New York, 1985) 42 Kotler, P. & Armstrong, G., Principles of Marketing, (New Jersey, 1994)
Background
20
use knowledge gained from both the existing theory and our own findings during the pre-study to construct the analysis model. The hypotheses from the pre-study will be explained in theory, investigated by doing interviews and analysed in order to be able to make conclusions. In the analysis we will focus on affirming or rejecting the factors under study, and also identify new ones that have come to our attention during our field study.
1.7.1 DEFINING THE TERM FACTORS The following part is a synthesis of the theories of Ohmae (1982, pp. 50-56, 91-98), De Wit & Meyer (2004, pp. 421-428), Porter (1985, pp. 1-11), Hollensen (2001, pp. 75-86) and McGee et al. (2005, pp. 58-61, 85-92) that explain the factors that affect the financial performance of the UK electricity retailers.
There are four main categories of factors that will have an impact on the gross margins. These are the demand side of the market, the market itself, the industry in which the market resides and finally the macro environment in which the industry operates in. The demand side of the market tells us how the customers directly perceive value and why they are willing to pay for this.i These demand side factors are something that the competing firms have to adjust to in relation to the other competing firms on the market, and the analysis of the market result in two different kinds of market factors.ii The first category of market factors is the competing firms’ competitive strategies to adjust to the customers in relation to the competition.iii The second category market factors are market rivalry. The market rivalry tells us how the market is structured and what effects it has on the price.iv The UK electricity industry context, or the industry factors, affects the market in the sense that they lay out the rules that the competing retailers have to adapt to. An example of this is that the suppliers seem to demand a high financial credibility and liquidity of the retailer before entering into bilateral contracts. This leads to higher market entrance barriers, which lead to weaker competition and higher prices. The industry factors can in turn be affected by the market factors. For example, if the retailers by some reason should decide to only buy electricity generated by a particular production method (for example wind power), this would have a brutal impact on the producers that do not use those production methods. The macro environment will also affect the industry since macro environmental factors can affect the rules of the industry. For example, the public opinion as well as political decisions can affect how the industry evolves.v On the other hand, the industry itself can affect the macro environment. To give an example of this, the legislative arrangements of the licensing regime on the UK electricity market are constructed so that the more market power an incumbent has; the more it can stall political initiatives for changes of the licensing regime.43 The macro environmental factors can also have a direct impact on retail prices, for example through tax changes.
1.7.2 EMBRYO ANALYSIS MODEL From the discussion in section above, we define an embryo to our analysis model, which will be the starting point in the frame of reference. The drivers of prices and gross margins are of four main categories, namely demand side factors, market factors, industry factors and macro environmental factors. The four categories of factors have an impact on the price, which can be direct as well as indirect. If the impact is indirect it means that the factor in question will affect another category of drivers, which in turn directly have an impact on the price. This means that the four categories of drivers are interconnected with each other. A visualization of the embryo analysis model is presented below in Figure 1.9.
43 Electrica Services Limited, “Electricity Industry Review 10”, (Surrey, 2006), pp. 24-25
Background
21
Figure 1.9: The preliminary analysis model

Background
22

Describing the factors
23
2 DESCRIBING THE FACTORS
This chapter will present the factors we should be studying, based on a theoretical foundation connected to the evidence from the pre-study findings. The structure of the chapter is built upon the analysis model embryo; how is price determined on the UK retail electricity market and how do forces within the industry and the macro environment influence it? After reading this chapter the reader should know which factors ought to be studied and how to build a model for analysing the UK retail electricity prices.
Describing the factors
24
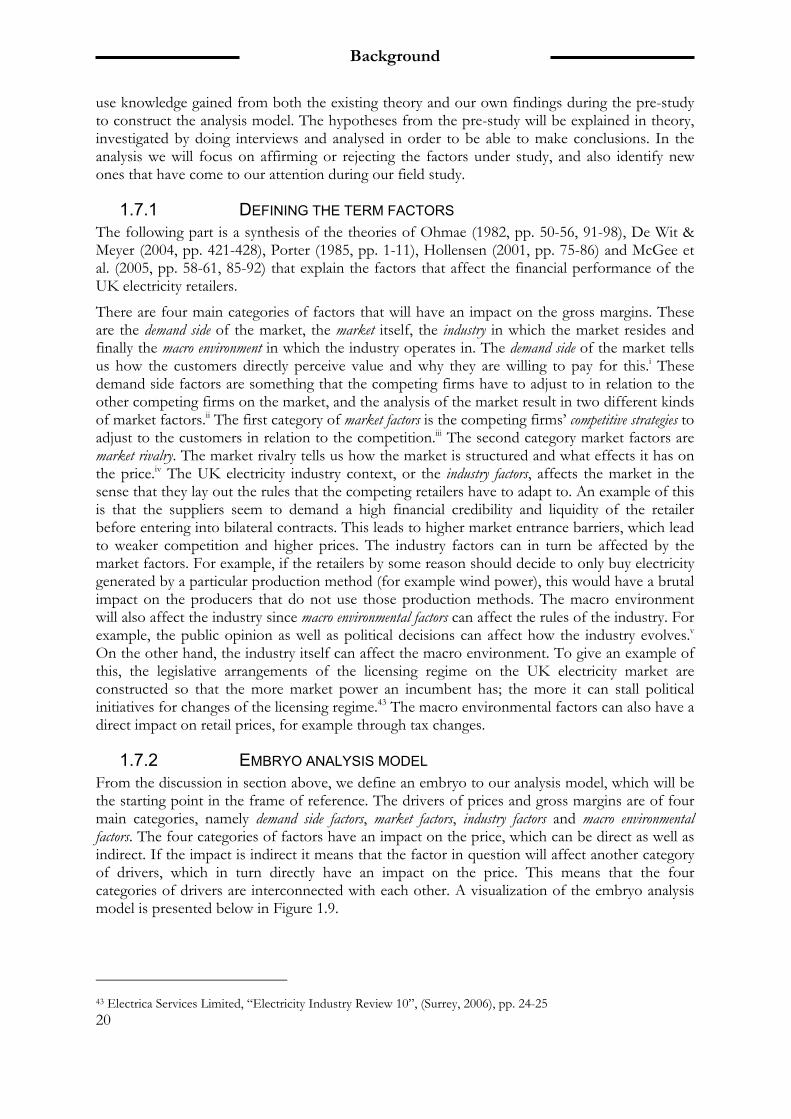
In this chapter we synthesize theories, which we relate to the present situation in the UK retail electricity market in order to build a model of analysis, a tool that will aid us in answering that question. We will build the frame of reference according to the preliminary analysis model (Figure 1.9) presented in chapter 1.7.2. We conclude in this chapter that the price is ultimately a product of the retailers’ strategies for competing on the market and the degree of actual competition. Therefore it is necessary to understand what is delivered and perceived as value by the customer, and how it is related to the retailers’ activities. When we make the connection between the situation on the market and the conditions in its environment, we may conclude what the underlying factors of the retail electricity price are.
Figure 2.1: Outline of the Frame of References
Four levels appropriate for separate analysis to describe the influences, from micro- to macro environment, on price, have been decided upon in the analysis model embryo: demand side, market level, industry level and macro environment.
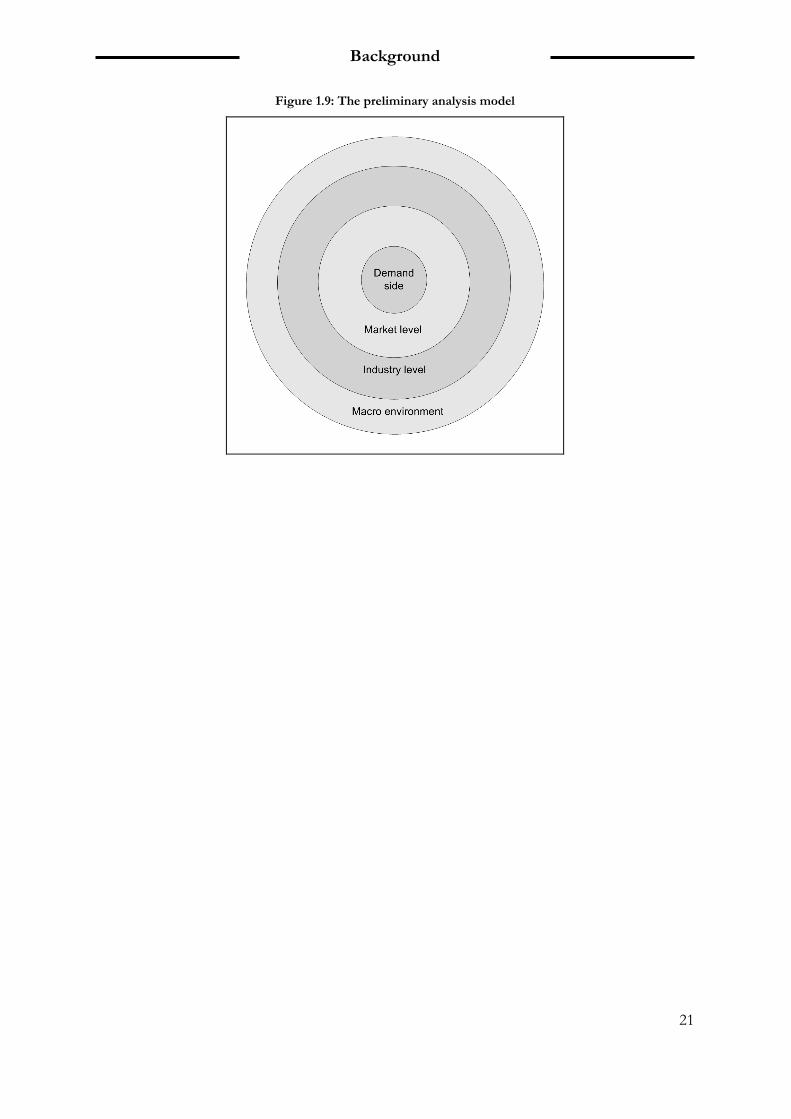
2.1 DEMAND SIDE - THE LINKAGE BETWEEN PRICE AND VALUE
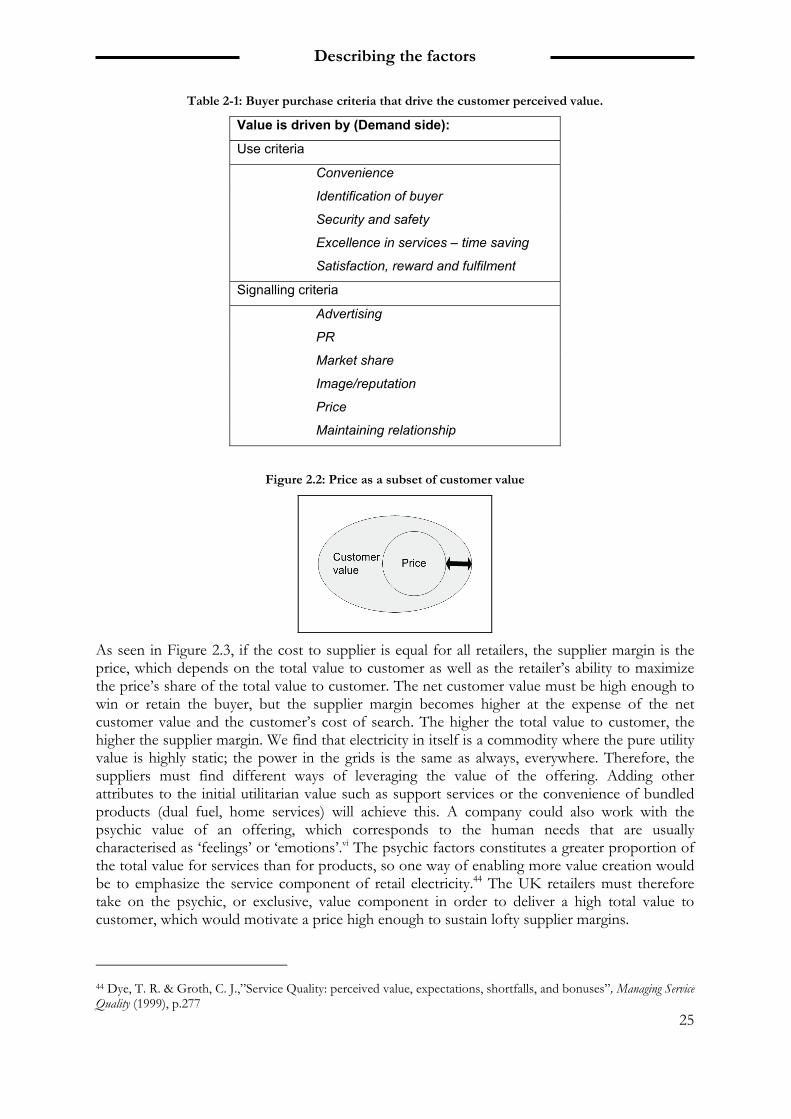
The following piece is a synthesis of the theories of Kahlifa (2004 pp. 655-656), Groth (1994, pp. 8-10), Hollensen (2002, pp. 87-89), Porter (1985, pp. 138-141) and Ravald & Grönroos (1996, pp. 20-22) to show that we may analyse what the drivers of customer perceived value are in order to understand the price mechanisms of retail electricity. The hypothesis is that a number of factors drive customer value, and the more value the customer perceives, the higher can the price be set. The factors that are identified and further discussed in this chapter are presented below in Table 2-1.
Describing the factors
25
Table 2-1: Buyer purchase criteria that drive the customer perceived value.
Value is driven by (Demand side):
Use criteria
Convenience
Identification of buyer
Security and safety
Excellence in services – time saving
Satisfaction, reward and fulfilment
Signalling criteria
Advertising
PR
Market share
Image/reputation
Price
Maintaining relationship
Figure 2.2: Price as a subset of customer value
As seen in Figure 2.3, if the cost to supplier is equal for all retailers, the supplier margin is the price, which depends on the total value to customer as well as the retailer’s ability to maximize the price’s share of the total value to customer. The net customer value must be high enough to win or retain the buyer, but the supplier margin becomes higher at the expense of the net customer value and the customer’s cost of search. The higher the total value to customer, the higher the supplier margin. We find that electricity in itself is a commodity where the pure utility value is highly static; the power in the grids is the same as always, everywhere. Therefore, the suppliers must find different ways of leveraging the value of the offering. Adding other attributes to the initial utilitarian value such as support services or the convenience of bundled products (dual fuel, home services) will achieve this. A company could also work with the psychic value of an offering, which corresponds to the human needs that are usually characterised as ‘feelings’ or ‘emotions’.vi The psychic factors constitutes a greater proportion of the total value for services than for products, so one way of enabling more value creation would be to emphasize the service component of retail electricity.44 The UK retailers must therefore take on the psychic, or exclusive, value component in order to deliver a high total value to customer, which would motivate a price high enough to sustain lofty supplier margins.
44 Dye, T. R. & Groth, C. J.,”Service Quality: perceived value, expectations, shortfalls, and bonuses”, Managing Service Quality (1999), p.277
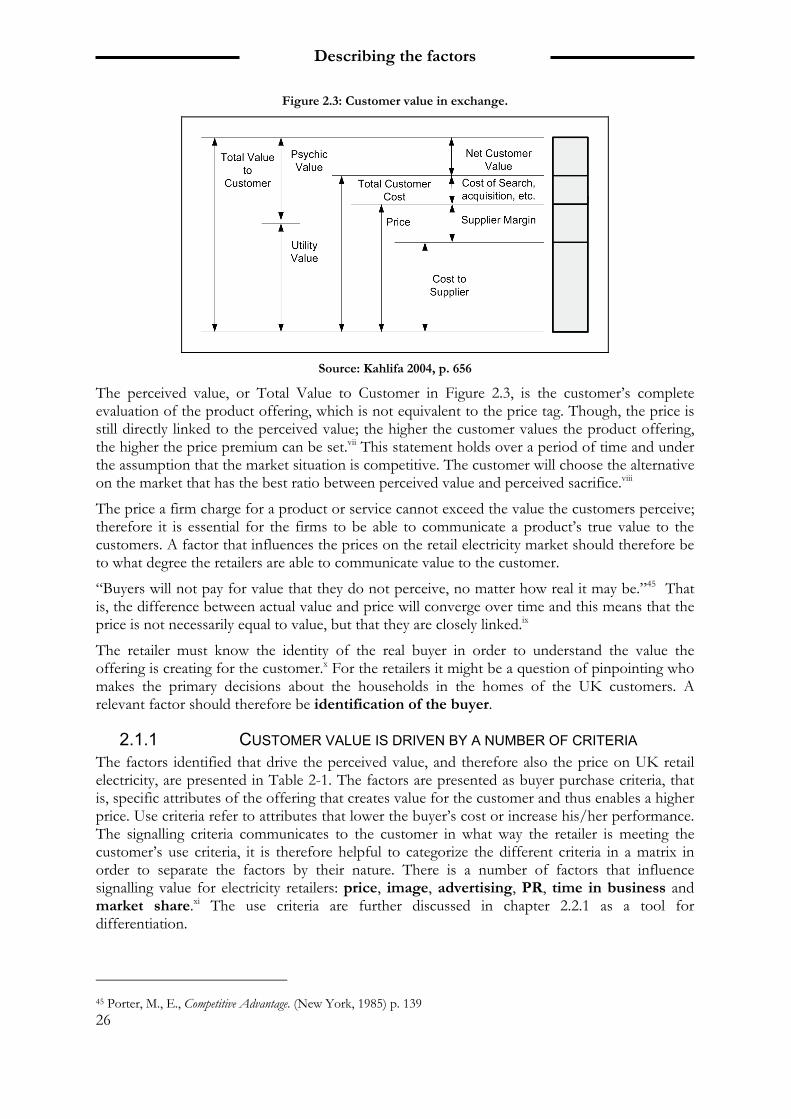
Describing the factors
26
Figure 2.3: Customer value in exchange.
Source: Kahlifa 2004, p. 656
The perceived value, or Total Value to Customer in Figure 2.3, is the customer’s complete evaluation of the product offering, which is not equivalent to the price tag. Though, the price is still directly linked to the perceived value; the higher the customer values the product offering, the higher the price premium can be set.vii This statement holds over a period of time and under the assumption that the market situation is competitive. The customer will choose the alternative on the market that has the best ratio between perceived value and perceived sacrifice.viii
The price a firm charge for a product or service cannot exceed the value the customers perceive; therefore it is essential for the firms to be able to communicate a product’s true value to the customers. A factor that influences the prices on the retail electricity market should therefore be to what degree the retailers are able to communicate value to the customer.
“Buyers will not pay for value that they do not perceive, no matter how real it may be.”45 That is, the difference between actual value and price will converge over time and this means that the price is not necessarily equal to value, but that they are closely linked.ix
The retailer must know the identity of the real buyer in order to understand the value the offering is creating for the customer.x For the retailers it might be a question of pinpointing who makes the primary decisions about the households in the homes of the UK customers. A relevant factor should therefore be identification of the buyer.
2.1.1 CUSTOMER VALUE IS DRIVEN BY A NUMBER OF CRITERIA The factors identified that drive the perceived value, and therefore also the price on UK retail electricity, are presented in Table 2-1. The factors are presented as buyer purchase criteria, that is, specific attributes of the offering that creates value for the customer and thus enables a higher price. Use criteria refer to attributes that lower the buyer’s cost or increase his/her performance. The signalling criteria communicates to the customer in what way the retailer is meeting the customer’s use criteria, it is therefore helpful to categorize the different criteria in a matrix in order to separate the factors by their nature. There is a number of factors that influence signalling value for electricity retailers: price, image, advertising, PR, time in business and market share.xi The use criteria are further discussed in chapter 2.2.1 as a tool for differentiation.
45 Porter, M., E., Competitive Advantage. (New York, 1985) p. 139
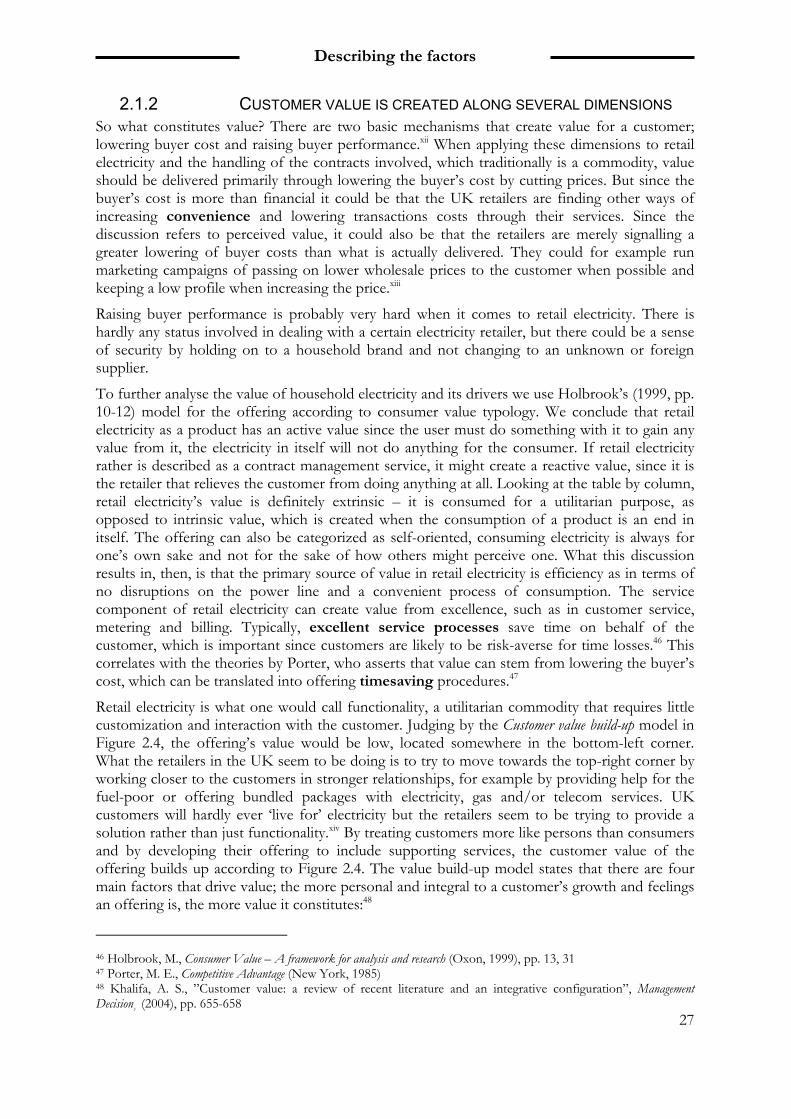
Describing the factors
27
2.1.2 CUSTOMER VALUE IS CREATED ALONG SEVERAL DIMENSIONS So what constitutes value? There are two basic mechanisms that create value for a customer; lowering buyer cost and raising buyer performance.xii When applying these dimensions to retail electricity and the handling of the contracts involved, which traditionally is a commodity, value should be delivered primarily through lowering the buyer’s cost by cutting prices. But since the buyer’s cost is more than financial it could be that the UK retailers are finding other ways of increasing convenience and lowering transactions costs through their services. Since the discussion refers to perceived value, it could also be that the retailers are merely signalling a greater lowering of buyer costs than what is actually delivered. They could for example run marketing campaigns of passing on lower wholesale prices to the customer when possible and keeping a low profile when increasing the price.xiii
Raising buyer performance is probably very hard when it comes to retail electricity. There is hardly any status involved in dealing with a certain electricity retailer, but there could be a sense of security by holding on to a household brand and not changing to an unknown or foreign supplier.
To further analyse the value of household electricity and its drivers we use Holbrook’s (1999, pp. 10-12) model for the offering according to consumer value typology. We conclude that retail electricity as a product has an active value since the user must do something with it to gain any value from it, the electricity in itself will not do anything for the consumer. If retail electricity rather is described as a contract management service, it might create a reactive value, since it is the retailer that relieves the customer from doing anything at all. Looking at the table by column, retail electricity’s value is definitely extrinsic – it is consumed for a utilitarian purpose, as opposed to intrinsic value, which is created when the consumption of a product is an end in itself. The offering can also be categorized as self-oriented, consuming electricity is always for one’s own sake and not for the sake of how others might perceive one. What this discussion results in, then, is that the primary source of value in retail electricity is efficiency as in terms of no disruptions on the power line and a convenient process of consumption. The service component of retail electricity can create value from excellence, such as in customer service, metering and billing. Typically, excellent service processes save time on behalf of the customer, which is important since customers are likely to be risk-averse for time losses.46 This correlates with the theories by Porter, who asserts that value can stem from lowering the buyer’s cost, which can be translated into offering timesaving procedures.47
Retail electricity is what one would call functionality, a utilitarian commodity that requires little customization and interaction with the customer. Judging by the Customer value build-up model in Figure 2.4, the offering’s value would be low, located somewhere in the bottom-left corner. What the retailers in the UK seem to be doing is to try to move towards the top-right corner by working closer to the customers in stronger relationships, for example by providing help for the fuel-poor or offering bundled packages with electricity, gas and/or telecom services. UK customers will hardly ever ‘live for’ electricity but the retailers seem to be trying to provide a solution rather than just functionality.xiv By treating customers more like persons than consumers and by developing their offering to include supporting services, the customer value of the offering builds up according to Figure 2.4. The value build-up model states that there are four main factors that drive value; the more personal and integral to a customer’s growth and feelings an offering is, the more value it constitutes:48
46 Holbrook, M., Consumer Value – A framework for analysis and research (Oxon, 1999), pp. 13, 31 47 Porter, M. E., Competitive Advantage (New York, 1985) 48 Khalifa, A. S., ”Customer value: a review of recent literature and an integrative configuration”, Management Decision¸ (2004), pp. 655-658
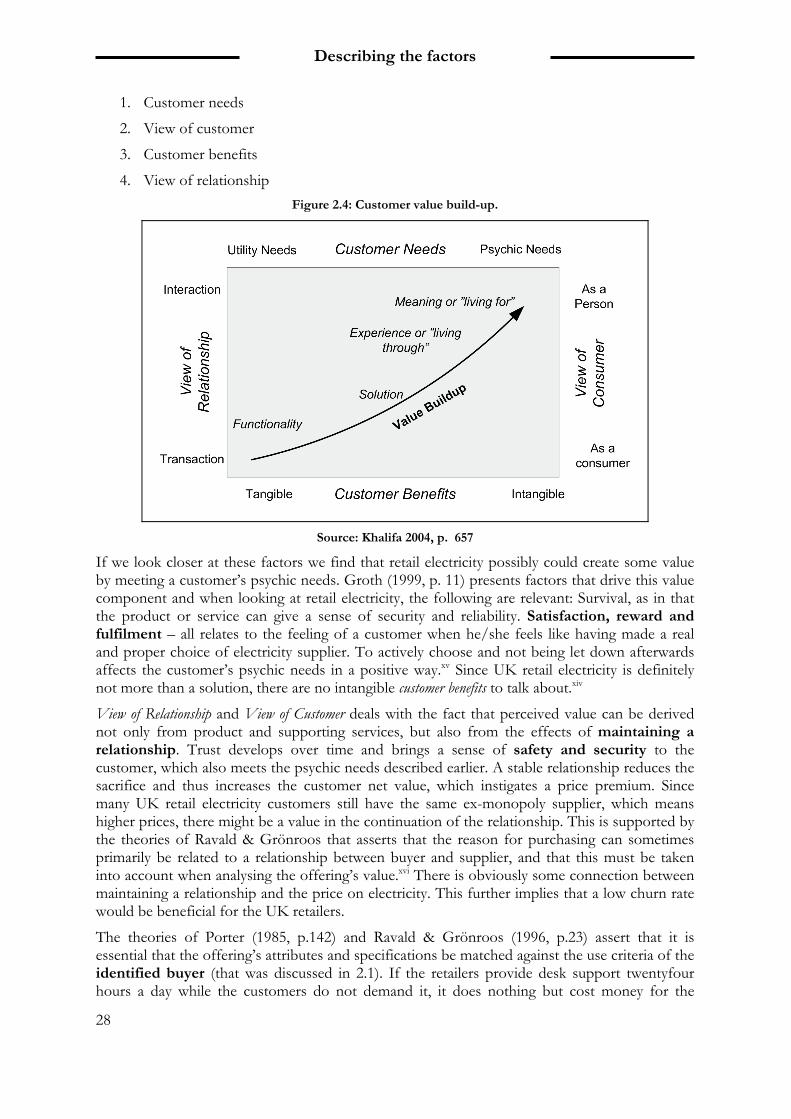
Describing the factors
28
1. Customer needs
2. View of customer
3. Customer benefits
4. View of relationship Figure 2.4: Customer value build-up.
Source: Khalifa 2004, p. 657
If we look closer at these factors we find that retail electricity possibly could create some value by meeting a customer’s psychic needs. Groth (1999, p. 11) presents factors that drive this value component and when looking at retail electricity, the following are relevant: Survival, as in that the product or service can give a sense of security and reliability. Satisfaction, reward and fulfilment – all relates to the feeling of a customer when he/she feels like having made a real and proper choice of electricity supplier. To actively choose and not being let down afterwards affects the customer’s psychic needs in a positive way.xv Since UK retail electricity is definitely not more than a solution, there are no intangible customer benefits to talk about.xiv
View of Relationship and View of Customer deals with the fact that perceived value can be derived not only from product and supporting services, but also from the effects of maintaining a relationship. Trust develops over time and brings a sense of safety and security to the customer, which also meets the psychic needs described earlier. A stable relationship reduces the sacrifice and thus increases the customer net value, which instigates a price premium. Since many UK retail electricity customers still have the same ex-monopoly supplier, which means higher prices, there might be a value in the continuation of the relationship. This is supported by the theories of Ravald & Grönroos that asserts that the reason for purchasing can sometimes primarily be related to a relationship between buyer and supplier, and that this must be taken into account when analysing the offering’s value.xvi There is obviously some connection between maintaining a relationship and the price on electricity. This further implies that a low churn rate would be beneficial for the UK retailers.
The theories of Porter (1985, p.142) and Ravald & Grönroos (1996, p.23) assert that it is essential that the offering’s attributes and specifications be matched against the use criteria of the identified buyer (that was discussed in 2.1). If the retailers provide desk support twentyfour hours a day while the customers do not demand it, it does nothing but cost money for the
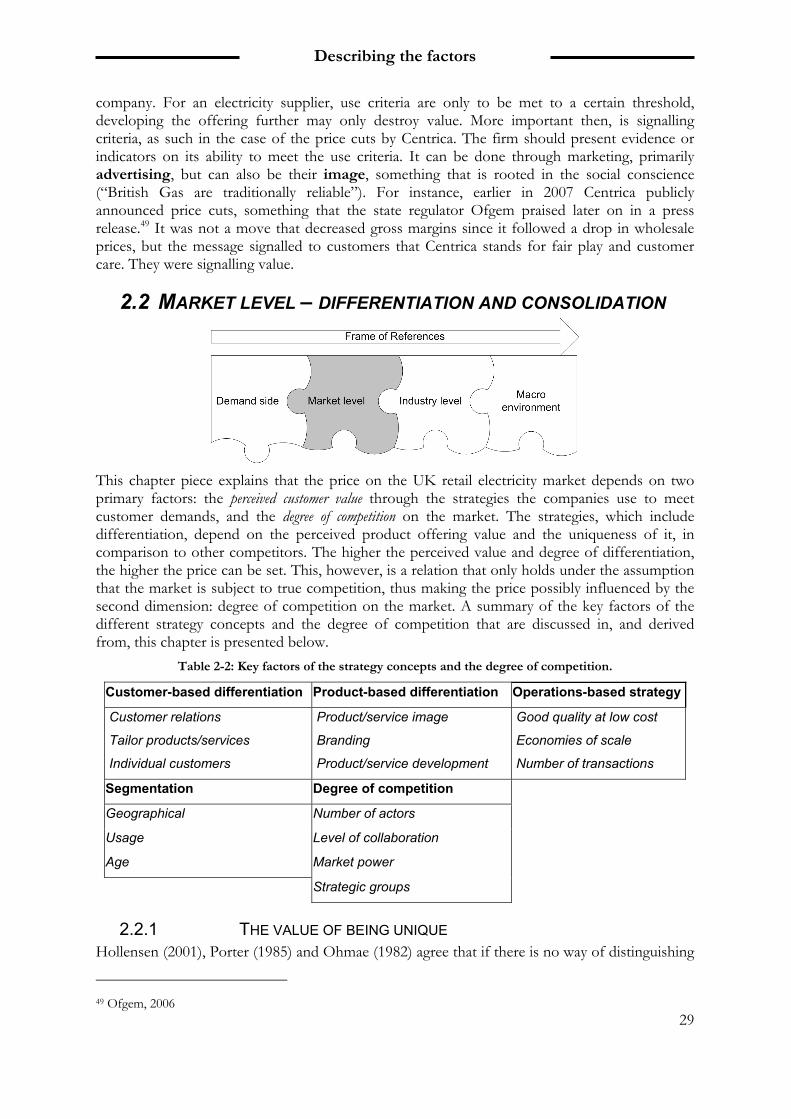
Describing the factors
29
company. For an electricity supplier, use criteria are only to be met to a certain threshold, developing the offering further may only destroy value. More important then, is signalling criteria, as such in the case of the price cuts by Centrica. The firm should present evidence or indicators on its ability to meet the use criteria. It can be done through marketing, primarily advertising, but can also be their image, something that is rooted in the social conscience (“British Gas are traditionally reliable”). For instance, earlier in 2007 Centrica publicly announced price cuts, something that the state regulator Ofgem praised later on in a press release.49 It was not a move that decreased gross margins since it followed a drop in wholesale prices, but the message signalled to customers that Centrica stands for fair play and customer care. They were signalling value.
2.2 MARKET LEVEL – DIFFERENTIATION AND CONSOLIDATION
This chapter piece explains that the price on the UK retail electricity market depends on two primary factors: the perceived customer value through the strategies the companies use to meet customer demands, and the degree of competition on the market. The strategies, which include differentiation, depend on the perceived product offering value and the uniqueness of it, in comparison to other competitors. The higher the perceived value and degree of differentiation, the higher the price can be set. This, however, is a relation that only holds under the assumption that the market is subject to true competition, thus making the price possibly influenced by the second dimension: degree of competition on the market. A summary of the key factors of the different strategy concepts and the degree of competition that are discussed in, and derived from, this chapter is presented below.
Table 2-2: Key factors of the strategy concepts and the degree of competition.
Customer-based differentiation Product-based differentiation Operations-based strategy
Customer relations
Tailor products/services
Individual customers
Product/service image
Branding
Product/service development
Good quality at low cost
Economies of scale
Number of transactions
Segmentation Degree of competition
Geographical Number of actors
Usage Level of collaboration
Age Market power
Strategic groups
2.2.1 THE VALUE OF BEING UNIQUE Hollensen (2001), Porter (1985) and Ohmae (1982) agree that if there is no way of distinguishing
49 Ofgem, 2006
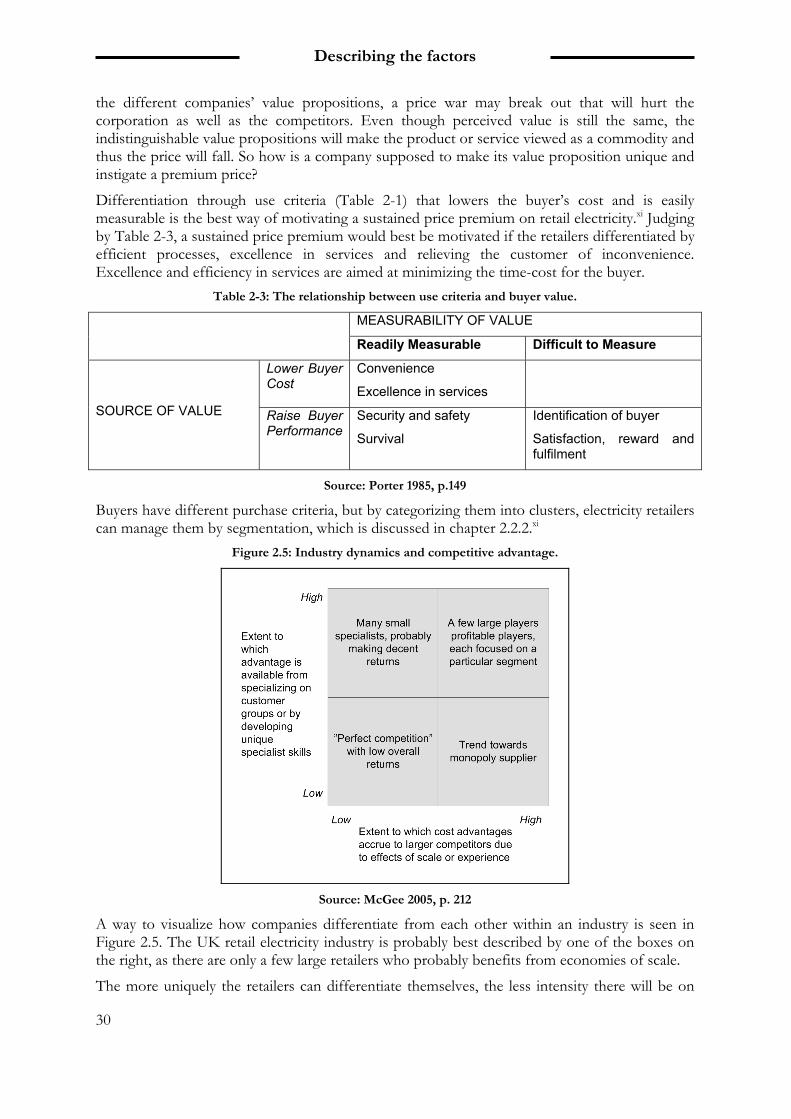
Describing the factors
30
the different companies’ value propositions, a price war may break out that will hurt the corporation as well as the competitors. Even though perceived value is still the same, the indistinguishable value propositions will make the product or service viewed as a commodity and thus the price will fall. So how is a company supposed to make its value proposition unique and instigate a premium price?
Differentiation through use criteria (Table 2-1) that lowers the buyer’s cost and is easily measurable is the best way of motivating a sustained price premium on retail electricity.xi Judging by Table 2-3, a sustained price premium would best be motivated if the retailers differentiated by efficient processes, excellence in services and relieving the customer of inconvenience. Excellence and efficiency in services are aimed at minimizing the time-cost for the buyer.
Table 2-3: The relationship between use criteria and buyer value.
MEASURABILITY OF VALUE
Readily Measurable Difficult to Measure
Lower Buyer Cost
Convenience
Excellence in services
SOURCE OF VALUE Raise Buyer Performance
Security and safety
Survival
Identification of buyer
Satisfaction, reward and fulfilment
Source: Porter 1985, p.149
Buyers have different purchase criteria, but by categorizing them into clusters, electricity retailers can manage them by segmentation, which is discussed in chapter 2.2.2.xi
Figure 2.5: Industry dynamics and competitive advantage.
Source: McGee 2005, p. 212
A way to visualize how companies differentiate from each other within an industry is seen in Figure 2.5. The UK retail electricity industry is probably best described by one of the boxes on the right, as there are only a few large retailers who probably benefits from economies of scale.
The more uniquely the retailers can differentiate themselves, the less intensity there will be on
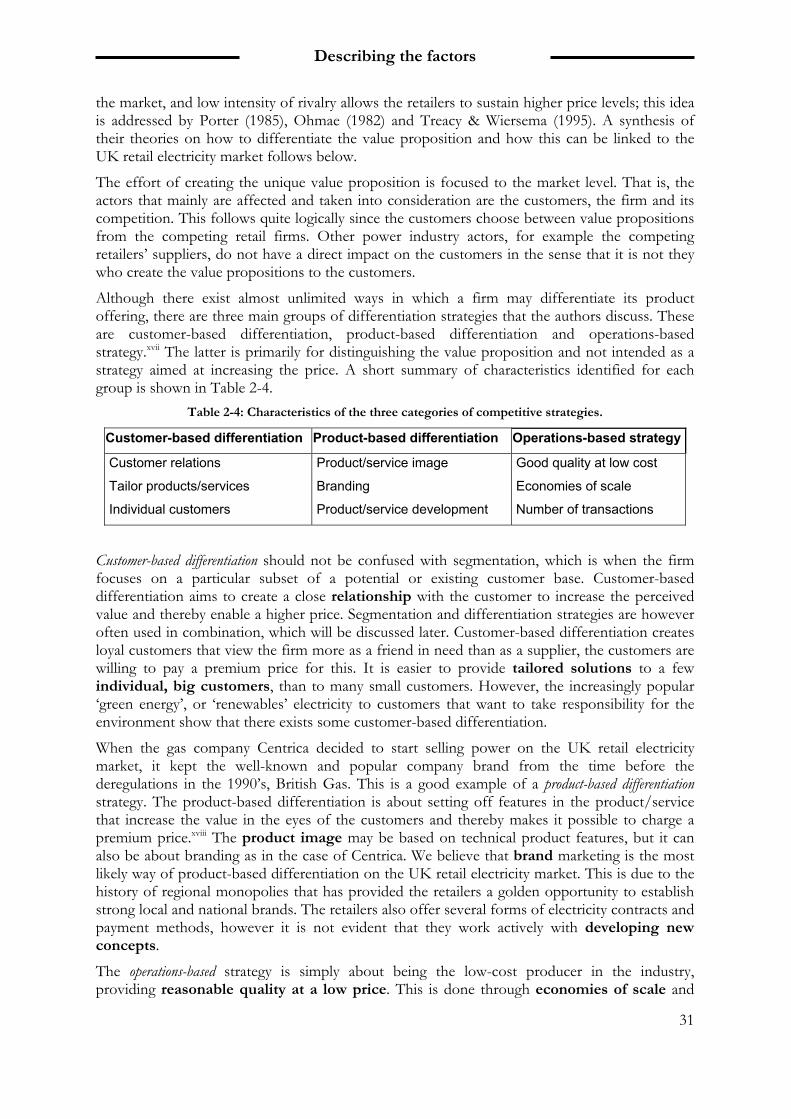
Describing the factors
31
the market, and low intensity of rivalry allows the retailers to sustain higher price levels; this idea is addressed by Porter (1985), Ohmae (1982) and Treacy & Wiersema (1995). A synthesis of their theories on how to differentiate the value proposition and how this can be linked to the UK retail electricity market follows below.
The effort of creating the unique value proposition is focused to the market level. That is, the actors that mainly are affected and taken into consideration are the customers, the firm and its competition. This follows quite logically since the customers choose between value propositions from the competing retail firms. Other power industry actors, for example the competing retailers’ suppliers, do not have a direct impact on the customers in the sense that it is not they who create the value propositions to the customers.
Although there exist almost unlimited ways in which a firm may differentiate its product offering, there are three main groups of differentiation strategies that the authors discuss. These are customer-based differentiation, product-based differentiation and operations-based strategy.xvii The latter is primarily for distinguishing the value proposition and not intended as a strategy aimed at increasing the price. A short summary of characteristics identified for each group is shown in Table 2-4.
Table 2-4: Characteristics of the three categories of competitive strategies.
Customer-based differentiation Product-based differentiation Operations-based strategy
Customer relations
Tailor products/services
Individual customers
Product/service image
Branding
Product/service development
Good quality at low cost
Economies of scale
Number of transactions
Customer-based differentiation should not be confused with segmentation, which is when the firm focuses on a particular subset of a potential or existing customer base. Customer-based differentiation aims to create a close relationship with the customer to increase the perceived value and thereby enable a higher price. Segmentation and differentiation strategies are however often used in combination, which will be discussed later. Customer-based differentiation creates loyal customers that view the firm more as a friend in need than as a supplier, the customers are willing to pay a premium price for this. It is easier to provide tailored solutions to a few individual, big customers, than to many small customers. However, the increasingly popular ‘green energy’, or ‘renewables’ electricity to customers that want to take responsibility for the environment show that there exists some customer-based differentiation.
When the gas company Centrica decided to start selling power on the UK retail electricity market, it kept the well-known and popular company brand from the time before the deregulations in the 1990’s, British Gas. This is a good example of a product-based differentiation strategy. The product-based differentiation is about setting off features in the product/service that increase the value in the eyes of the customers and thereby makes it possible to charge a premium price.xviii The product image may be based on technical product features, but it can also be about branding as in the case of Centrica. We believe that brand marketing is the most likely way of product-based differentiation on the UK retail electricity market. This is due to the history of regional monopolies that has provided the retailers a golden opportunity to establish strong local and national brands. The retailers also offer several forms of electricity contracts and payment methods, however it is not evident that they work actively with developing new concepts.
The operations-based strategy is simply about being the low-cost producer in the industry, providing reasonable quality at a low price. This is done through economies of scale and
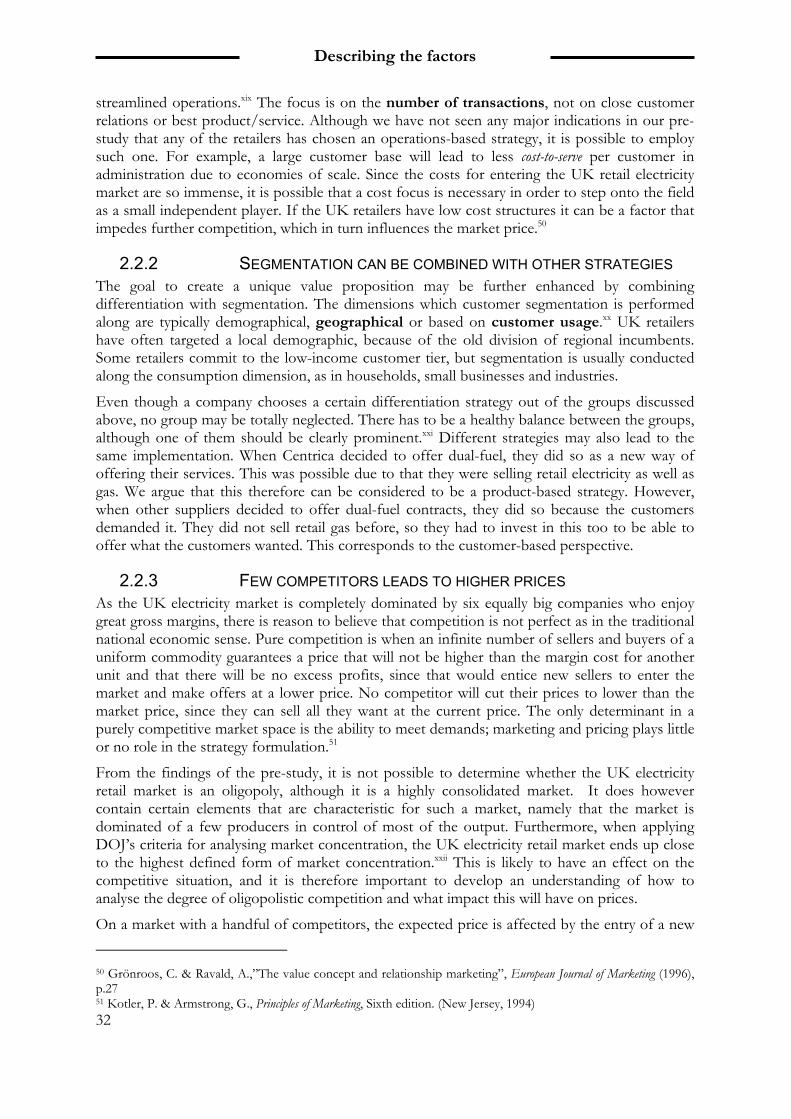
Describing the factors
32
streamlined operations.xix The focus is on the number of transactions, not on close customer relations or best product/service. Although we have not seen any major indications in our pre-study that any of the retailers has chosen an operations-based strategy, it is possible to employ such one. For example, a large customer base will lead to less cost-to-serve per customer in administration due to economies of scale. Since the costs for entering the UK retail electricity market are so immense, it is possible that a cost focus is necessary in order to step onto the field as a small independent player. If the UK retailers have low cost structures it can be a factor that impedes further competition, which in turn influences the market price.50
2.2.2 SEGMENTATION CAN BE COMBINED WITH OTHER STRATEGIES The goal to create a unique value proposition may be further enhanced by combining differentiation with segmentation. The dimensions which customer segmentation is performed along are typically demographical, geographical or based on customer usage.xx UK retailers have often targeted a local demographic, because of the old division of regional incumbents. Some retailers commit to the low-income customer tier, but segmentation is usually conducted along the consumption dimension, as in households, small businesses and industries.
Even though a company chooses a certain differentiation strategy out of the groups discussed above, no group may be totally neglected. There has to be a healthy balance between the groups, although one of them should be clearly prominent.xxi Different strategies may also lead to the same implementation. When Centrica decided to offer dual-fuel, they did so as a new way of offering their services. This was possible due to that they were selling retail electricity as well as gas. We argue that this therefore can be considered to be a product-based strategy. However, when other suppliers decided to offer dual-fuel contracts, they did so because the customers demanded it. They did not sell retail gas before, so they had to invest in this too to be able to offer what the customers wanted. This corresponds to the customer-based perspective.
2.2.3 FEW COMPETITORS LEADS TO HIGHER PRICES As the UK electricity market is completely dominated by six equally big companies who enjoy great gross margins, there is reason to believe that competition is not perfect as in the traditional national economic sense. Pure competition is when an infinite number of sellers and buyers of a uniform commodity guarantees a price that will not be higher than the margin cost for another unit and that there will be no excess profits, since that would entice new sellers to enter the market and make offers at a lower price. No competitor will cut their prices to lower than the market price, since they can sell all they want at the current price. The only determinant in a purely competitive market space is the ability to meet demands; marketing and pricing plays little or no role in the strategy formulation.51
From the findings of the pre-study, it is not possible to determine whether the UK electricity retail market is an oligopoly, although it is a highly consolidated market. It does however contain certain elements that are characteristic for such a market, namely that the market is dominated of a few producers in control of most of the output. Furthermore, when applying DOJ’s criteria for analysing market concentration, the UK electricity retail market ends up close to the highest defined form of market concentration.xxii This is likely to have an effect on the competitive situation, and it is therefore important to develop an understanding of how to analyse the degree of oligopolistic competition and what impact this will have on prices.
On a market with a handful of competitors, the expected price is affected by the entry of a new 50 Grönroos, C. & Ravald, A.,”The value concept and relationship marketing”, European Journal of Marketing (1996), p.27 51 Kotler, P. & Armstrong, G., Principles of Marketing, Sixth edition. (New Jersey, 1994)
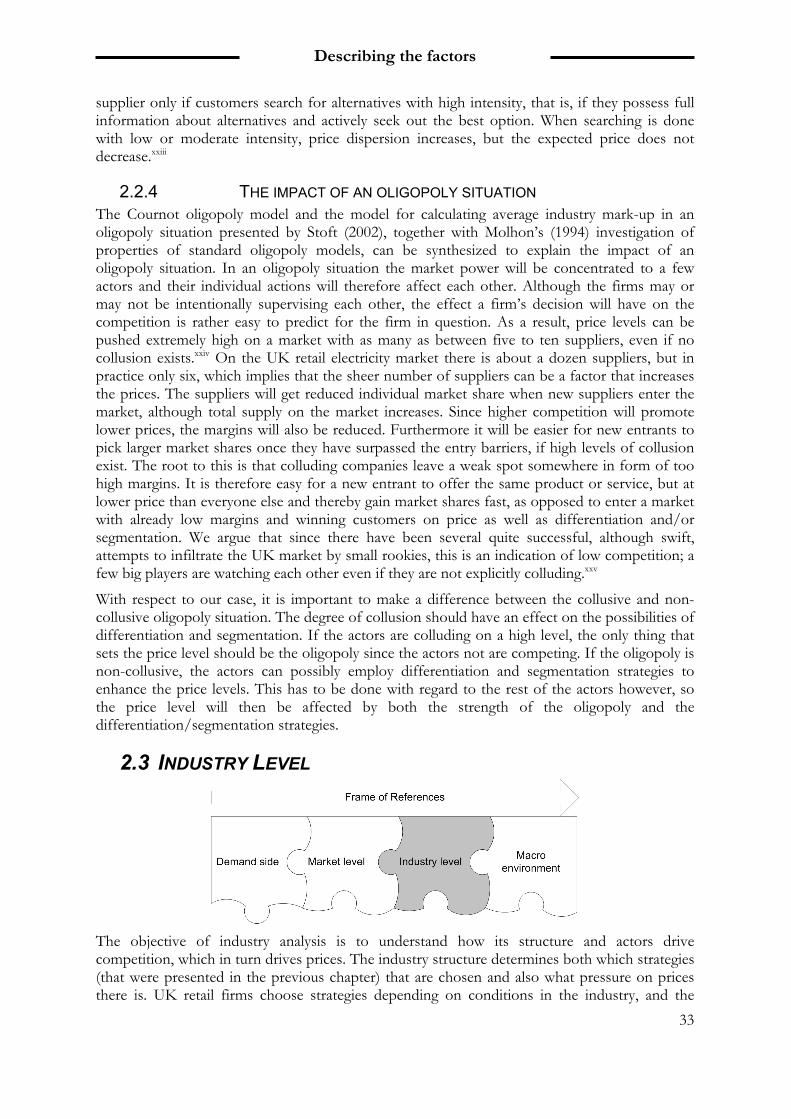
Describing the factors
33
supplier only if customers search for alternatives with high intensity, that is, if they possess full information about alternatives and actively seek out the best option. When searching is done with low or moderate intensity, price dispersion increases, but the expected price does not decrease.xxiii
2.2.4 THE IMPACT OF AN OLIGOPOLY SITUATION The Cournot oligopoly model and the model for calculating average industry mark-up in an oligopoly situation presented by Stoft (2002), together with Molhon’s (1994) investigation of properties of standard oligopoly models, can be synthesized to explain the impact of an oligopoly situation. In an oligopoly situation the market power will be concentrated to a few actors and their individual actions will therefore affect each other. Although the firms may or may not be intentionally supervising each other, the effect a firm’s decision will have on the competition is rather easy to predict for the firm in question. As a result, price levels can be pushed extremely high on a market with as many as between five to ten suppliers, even if no collusion exists.xxiv On the UK retail electricity market there is about a dozen suppliers, but in practice only six, which implies that the sheer number of suppliers can be a factor that increases the prices. The suppliers will get reduced individual market share when new suppliers enter the market, although total supply on the market increases. Since higher competition will promote lower prices, the margins will also be reduced. Furthermore it will be easier for new entrants to pick larger market shares once they have surpassed the entry barriers, if high levels of collusion exist. The root to this is that colluding companies leave a weak spot somewhere in form of too high margins. It is therefore easy for a new entrant to offer the same product or service, but at lower price than everyone else and thereby gain market shares fast, as opposed to enter a market with already low margins and winning customers on price as well as differentiation and/or segmentation. We argue that since there have been several quite successful, although swift, attempts to infiltrate the UK market by small rookies, this is an indication of low competition; a few big players are watching each other even if they are not explicitly colluding.xxv
With respect to our case, it is important to make a difference between the collusive and non-collusive oligopoly situation. The degree of collusion should have an effect on the possibilities of differentiation and segmentation. If the actors are colluding on a high level, the only thing that sets the price level should be the oligopoly since the actors not are competing. If the oligopoly is non-collusive, the actors can possibly employ differentiation and segmentation strategies to enhance the price levels. This has to be done with regard to the rest of the actors however, so the price level will then be affected by both the strength of the oligopoly and the differentiation/segmentation strategies.
2.3 INDUSTRY LEVEL
The objective of industry analysis is to understand how its structure and actors drive competition, which in turn drives prices. The industry structure determines both which strategies (that were presented in the previous chapter) that are chosen and also what pressure on prices there is. UK retail firms choose strategies depending on conditions in the industry, and the
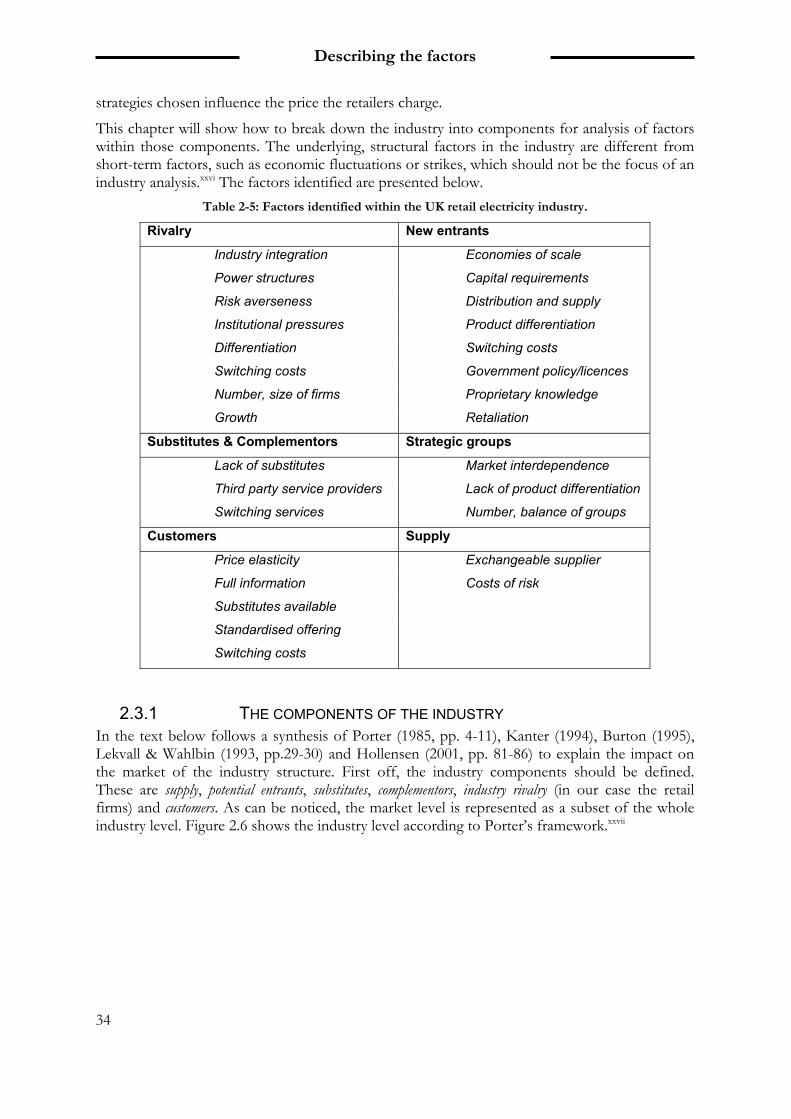
Describing the factors
34
strategies chosen influence the price the retailers charge.
This chapter will show how to break down the industry into components for analysis of factors within those components. The underlying, structural factors in the industry are different from short-term factors, such as economic fluctuations or strikes, which should not be the focus of an industry analysis.xxvi The factors identified are presented below.
Table 2-5: Factors identified within the UK retail electricity industry.
Rivalry New entrants
Industry integration Economies of scale
Power structures Capital requirements
Risk averseness Distribution and supply
Institutional pressures Product differentiation
Differentiation Switching costs
Switching costs Government policy/licences
Number, size of firms Proprietary knowledge
Growth Retaliation
Substitutes & Complementors Strategic groups
Lack of substitutes Market interdependence
Third party service providers Lack of product differentiation
Switching services Number, balance of groups
Customers Supply
Price elasticity Exchangeable supplier
Full information Costs of risk
Substitutes available
Standardised offering
Switching costs
2.3.1 THE COMPONENTS OF THE INDUSTRY In the text below follows a synthesis of Porter (1985, pp. 4-11), Kanter (1994), Burton (1995), Lekvall & Wahlbin (1993, pp.29-30) and Hollensen (2001, pp. 81-86) to explain the impact on the market of the industry structure. First off, the industry components should be defined. These are supply, potential entrants, substitutes, complementors, industry rivalry (in our case the retail firms) and customers. As can be noticed, the market level is represented as a subset of the whole industry level. Figure 2.6 shows the industry level according to Porter’s framework.xxvii
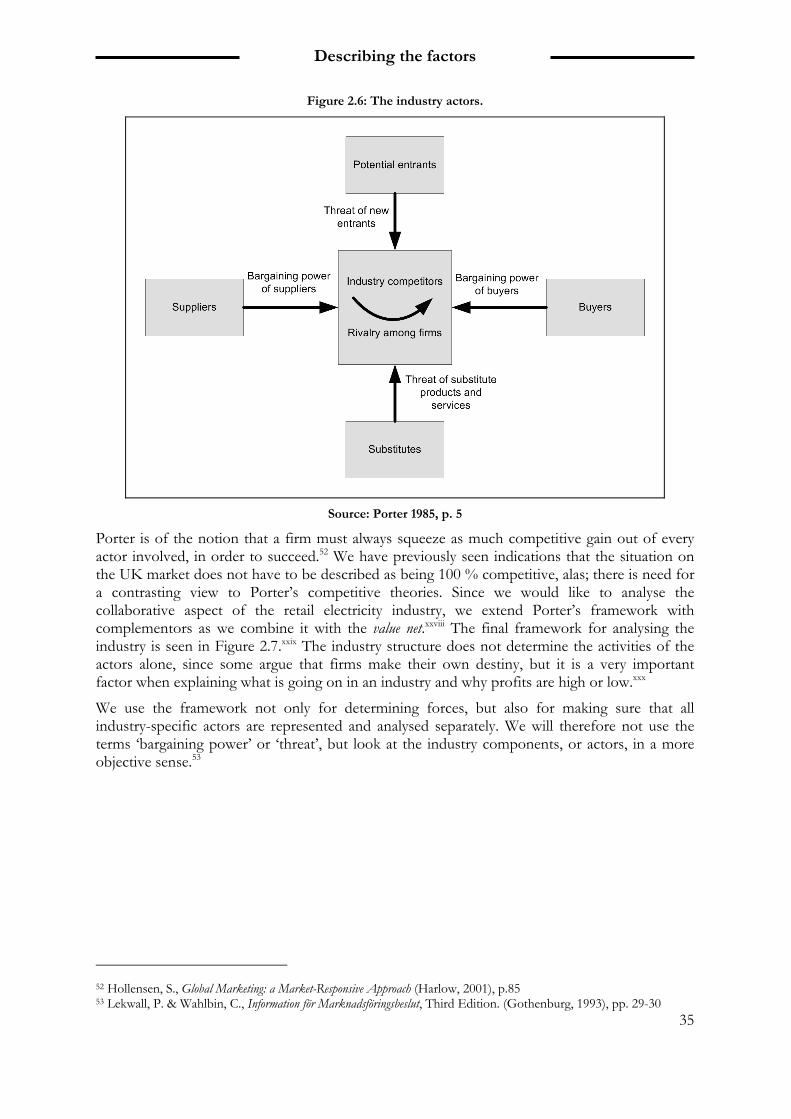
Describing the factors
35
Figure 2.6: The industry actors.
Source: Porter 1985, p. 5
Porter is of the notion that a firm must always squeeze as much competitive gain out of every actor involved, in order to succeed.52 We have previously seen indications that the situation on the UK market does not have to be described as being 100 % competitive, alas; there is need for a contrasting view to Porter’s competitive theories. Since we would like to analyse the collaborative aspect of the retail electricity industry, we extend Porter’s framework with complementors as we combine it with the value net.xxviii The final framework for analysing the industry is seen in Figure 2.7.xxix The industry structure does not determine the activities of the actors alone, since some argue that firms make their own destiny, but it is a very important factor when explaining what is going on in an industry and why profits are high or low.xxx
We use the framework not only for determining forces, but also for making sure that all industry-specific actors are represented and analysed separately. We will therefore not use the terms ‘bargaining power’ or ‘threat’, but look at the industry components, or actors, in a more objective sense.53
52 Hollensen, S., Global Marketing: a Market-Responsive Approach (Harlow, 2001), p.85 53 Lekwall, P. & Wahlbin, C., Information för Marknadsföringsbeslut, Third Edition. (Gothenburg, 1993), pp. 29-30
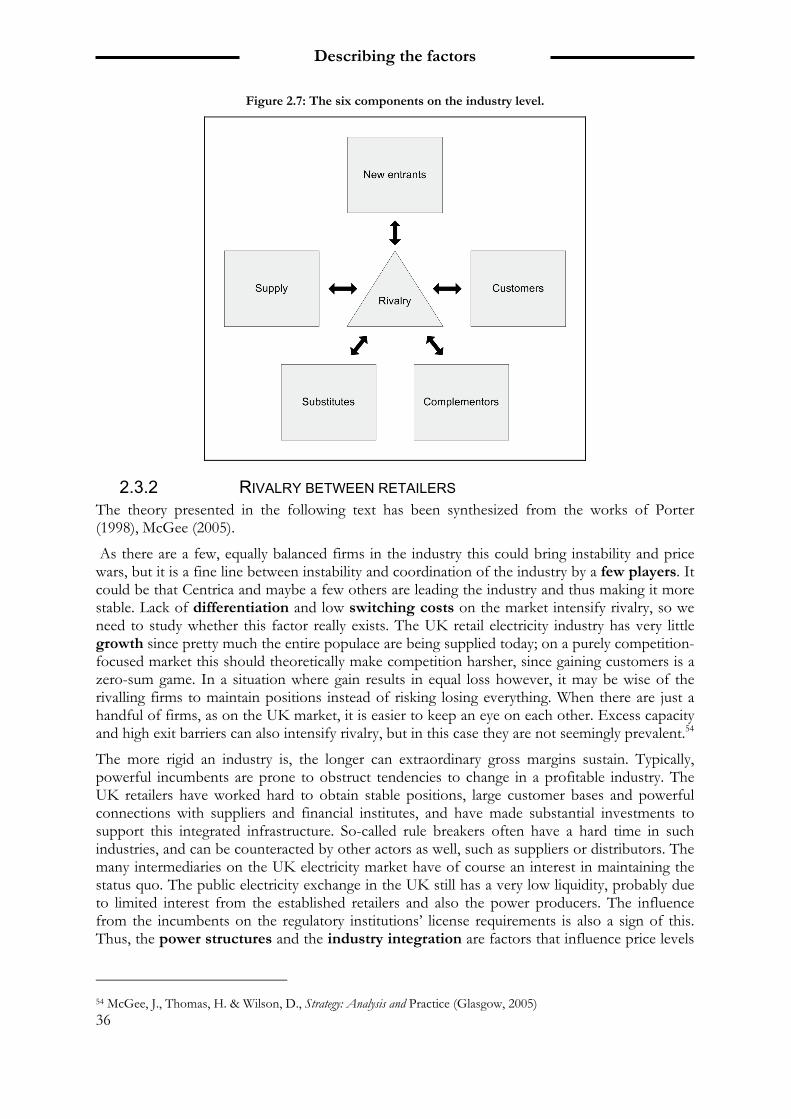
Describing the factors
36
Figure 2.7: The six components on the industry level.
2.3.2 RIVALRY BETWEEN RETAILERS The theory presented in the following text has been synthesized from the works of Porter (1998), McGee (2005).
As there are a few, equally balanced firms in the industry this could bring instability and price wars, but it is a fine line between instability and coordination of the industry by a few players. It could be that Centrica and maybe a few others are leading the industry and thus making it more stable. Lack of differentiation and low switching costs on the market intensify rivalry, so we need to study whether this factor really exists. The UK retail electricity industry has very little growth since pretty much the entire populace are being supplied today; on a purely competition-focused market this should theoretically make competition harsher, since gaining customers is a zero-sum game. In a situation where gain results in equal loss however, it may be wise of the rivalling firms to maintain positions instead of risking losing everything. When there are just a handful of firms, as on the UK market, it is easier to keep an eye on each other. Excess capacity and high exit barriers can also intensify rivalry, but in this case they are not seemingly prevalent.54
The more rigid an industry is, the longer can extraordinary gross margins sustain. Typically, powerful incumbents are prone to obstruct tendencies to change in a profitable industry. The UK retailers have worked hard to obtain stable positions, large customer bases and powerful connections with suppliers and financial institutes, and have made substantial investments to support this integrated infrastructure. So-called rule breakers often have a hard time in such industries, and can be counteracted by other actors as well, such as suppliers or distributors. The many intermediaries on the UK electricity market have of course an interest in maintaining the status quo. The public electricity exchange in the UK still has a very low liquidity, probably due to limited interest from the established retailers and also the power producers. The influence from the incumbents on the regulatory institutions’ license requirements is also a sign of this. Thus, the power structures and the industry integration are factors that influence price levels
54 McGee, J., Thomas, H. & Wilson, D., Strategy: Analysis and Practice (Glasgow, 2005)
Describing the factors
37
on the UK retail electricity market.55 Industry integration also refers to how tightly knit different types actors are with each other. For example, if the brokers and retailers would work very close to each other, that part of the industry would be seen as highly integrated.
The UK is a nation of conservatism, which may impede the emergence of new actors and ideas on the retail electricity market. The end-users do not seem to mind new offerings, but there seem to be reluctance from brokers and generators to do business with non-established suppliers, due to financial insecurities. Risk averseness and traditions are therefore factors that solidify the industry structure.56
The main regulatory instances in the UK welcome new entrants and different ways of competing on the retail market, so the institutional pressures are working for less rigidity in the industry. However, their presence gives the incumbents legitimacy and may lead to a public acceptance of higher prices as well.57
2.3.3 SUPPLIERS Supplier and buyer power are the biggest threats to margins (McGee, pp. 150-152). A factor that empowers the firm is if the supplier is exchangeable, as is the situation in the UK retail electricity industry. The fact that the public power exchange is low on liquidity does not work in favour of retailers without generation ownership, thus decreasing competition and give room for high prices.
Another issue that is important to study is the impact of the supply side’s prices and volatility (spot price and contracts) on retail prices. Purchase costs may be known and the same for all retailers, but their internal risk calculations add a mark-up to the end-user price, which is not covered by the gross margin. Handling and pricing of risk costs is therefore a factor to include.
2.3.4 CUSTOMERS ARE WEAK We make no distinction between the terms buyer and customer in this report; what we are interested in studying is the consumer-end of the industry value chain. If the customer-side’s bargaining power is weak, the market competitors will have more degrees of freedom in choosing strategy and in the end setting the prices. Thus, a demanding and powerful customer base puts a lid on prices, pushing down to competitive levels.xxxi
A factor that might influence the customers’ power over the UK retailers are which weight electricity has as a fraction of household income; a high price might not seem too bad if the consumption is at a level where differences are not as noticeable. The cost ratio between residential gas and electricity may give that gas is so dominant (at least for some customers) that the price on electricity becomes secondary. We name this factor relative importance of electricity.58 This factor is related to the price elasticity of the customers; a high elasticity means that a difference in prices between suppliers will make customers flee the more expensive one. It is also a question of whether a firm’s offering is easy for the customers to substitute for another market player’s offering, a parameter that is closely connected to whether the offering is standardized or differentiated.59 Since retail electricity is by default a commodity that is essentially the same for all suppliers this should work to the customers’ advantage, although we have pondered the idea that retailers are differentiating themselves as service providers. Few
55 De Wit B. & Meyer R., Strategy – Process, Content, Context, Third edition (London, 2004), pp. 427-428 56 De Wit B. & Meyer R., Strategy – Process, Content, Context, Third edition (London, 2004), p. 428 57 Aldrich, E., H. & Fiol, M., C.”Fools Rush In? The Institutional Context of Industry Creation”, Academy of Management Review (1994), pp. 659-661 58 Porter, M. E., Competitive Strategy (New York, 1998), pp. 26-27 59 Ibid
Describing the factors
38
alternative suppliers and high degree of differentiation thus pushes prices upwards. This is somewhat related to the degree of full information on the market and the switching costs, as perceived by the customers. Complete information about the market will in theory render over-pricing impossible, if the customers are acting rationally. Perceived switching costs must be lower than the possible profit from a switch from one supplier to another, or else the customer will not carry it out.60 There is definitely sufficient information available to the UK customers, but the question is rather if they are aware of this, or at all interested in searching for it on the Internet. A study suggests that seemingly customers perceive low switching costs as much higher, a finding that implies that retailers may be working pro-actively in asserting this attitude.61
2.3.5 NO SUBSTITUTES The pressure from substitute offerings puts a cap on prices in an industry, since customers will switch to alternative products or services when the original becomes too expensive.62 The lack of substitutes will work to the UK retailers’ advantage since there is no such real pressure. Gas and oil could be substitutes if there was electrical heating in the UK, as is the case in for Sweden for example, since households would turn to other forms of thermal power when electricity becomes pricey. Since this is not the case in the UK one cannot talk of a threat from substitutes to the electricity retailers.
2.3.6 COMPLEMENTORS AS SERVICE PROVIDERS The value net takes complementors into account, where the definition of a complementor is of a player that enhances the customer’s value of your offering, when it is available to the customer.63 In the UK retail electricity industry this would correspond to third party service providers, independent entrepreneurs that are handling metering and other installation services for the retailers. A good extension of the retailers’ offering in this way could increase the perceived value and thus the price. There are on the other hand other players that in a way are the opposite of complementors; the extensive presence of websites for switching services should counteract high prices, as they offer household customers a simple solution for saving money on electricity bills. For new entrants though, trying to reap market shares through low-cost strategies and price-cutting, these switching services could serve as powerful complementors to their offerings.
2.3.7 ENTRY BARRIERS LIMIT MARKET COMPETITION The advantageous situation on the UK retail electricity market should in theory draw a lot of attention to itself from outsiders, keen on profiting from the healthy gross margins in the business. However, this is not the case; the market is extremely consolidated and independent retailers are few, small in stature and not very long-lived. As was described in chapter 2.2.4, the prospect of new entrants on a market leads to excess capacity and lower prices, and thus lower gross margins. The ability of incumbents to keep out new entrants through high entry barriers is therefore probably a major driver of prices on the UK retail electricity market.64 The question is what factors help building walls towards outsiders?
In the following text the factors that have an impact on the size of potential entry barriers on the UK retail electricity market, are presented. They are determined with the aid of the combined theories of Porter (1998), McGee (2005) Almgren (2005) and Pass et al (1994), and are supposed
60 Ibid 61 Giulietti, M., Price, W. C. & Waterson, M., ”Consumer Choice and Competition Policy: A study of UK energy markets”, The Economic Journal, 115: October (2005), pp. 949-968 62 Porter, M. E., Competitive Strategy (New York, 1998), p. 23 63 Nalebuff B. & Brandenburger A., Co-opetition (New York, 1996), pp. 26-28 64 Porter, M. E., Competitive Strategy (New York, 1998), p. 7
Describing the factors
39
to be guidelines for which areas to study.
In an industry there is a so-called entry-deterring price, which is the price level where it is not deemed profitable to enter a market. If there is sufficient competition among the incumbents, this should be low enough to not make it worth entering. Since there have been successful attempts from newcomers, solely based on low prices, there is reason to believe that the current price levels are higher than the hypothetical entry-deterring price.
One of the main barriers to entry on a market is the significance of economies of scale, which is loosely connected to capital and investment requirements. It could be that there is a strict need for electricity suppliers to reach a Minimum Efficient Scale (MES) of operation before it is possible to make a profit at the current price levels.xxxii The price today could be a reflection of the prices that a new retailer must charge in order to break even, when the number of accounts is low. Retailers serving millions of accounts will of course not under-cut those prices, but will instead provide a sufficiently competitive offer and enjoy high margins. In an industry where the stakes are high or the thresholds for business operations are vast, a newcomer must be wealthy and financially stable right from the start in order to grab a position on the market. In the UK with its trading system of bilateral contracts, the retailers need huge amounts of capital and liquidity to secure their trading and future selling contracts. All the major retailers are parts of complete value chains of generation and supply, which means that they have better access to secure supply than players who must trade with third-party dealers or a not yet fully developed public exchange. The largest player, Centrica, has previously managed by buying power from other companies, but has succumbed to acquire generation plants as well.
If a market is characterized by customer loyalties and strong brand identifications, there are barriers due to product differentiation. Hefty start-up costs are to be expected when trying to overcome the existing paradigm of loyalties and household brands. Heavy advertising and previous collected goodwill enforce the differentiation. As stated earlier, the UK retail electricity market seems to be regionally strong and Centrica’s brand strategy was instrumental in their success. Altogether it is a matter of how hard it is to endure the initial stance. It can be further enforced if there are substantial switching costs for the customers; this should not be a barrier of entry in the UK though, due to the extensive switching services available.
Denial of access to distribution and supply can pitfall a new entrant completely. In the UK, there seem to be severe hindrances for small retailers to trade for electricity and on the distribution side some network owners will not even serve retailers without financial security. There are definitely barriers due to government policy and proprietary knowledge on the UK retail electricity market; the procedures and processes of receiving a supply license and balancing management are immense and are very hard to grasp for a newcomer. Whether third-party actors are available to help on this matter is probably crucial. The incumbents on a market may show predatory behaviour and retaliate against new entrants, for example through acquisitions of successful small retailers. On the other hand, it seems that this is what some of the minor retailers had intended in the first place.
2.3.8 TWO STRATEGIC GROUPS ON THE UK MARKET The theory presented in the following piece is a review of Porter (1998, pp. 129-155).
The ‘Big Six’ constitutes one strategic group, while the small niche players probably make up a second one. The reason for this is that the major retailers have roughly the same market share, the same strategies (seemingly) and the same offerings.xxxiii Four factors decide the intensity of rivalry between strategic groups and thus the pressure on prices:
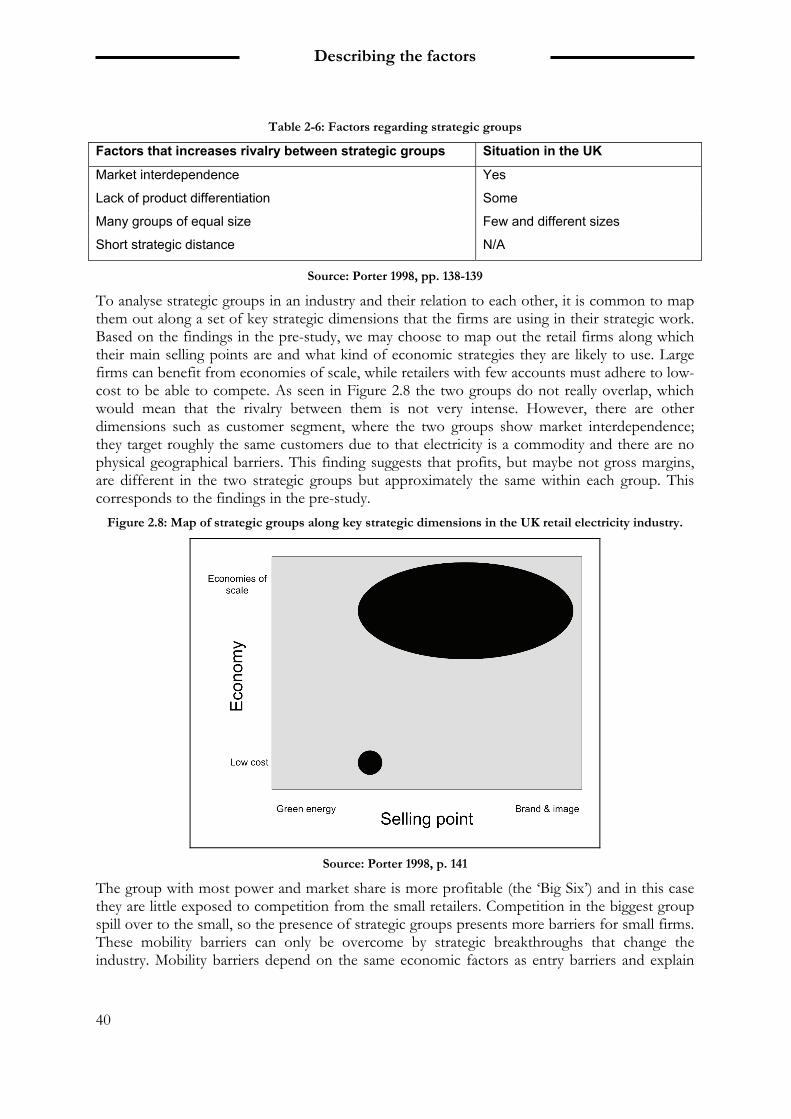
Describing the factors
40
Table 2-6: Factors regarding strategic groups
Factors that increases rivalry between strategic groups Situation in the UK
Market interdependence Yes
Lack of product differentiation Some
Many groups of equal size Few and different sizes
Short strategic distance N/A
Source: Porter 1998, pp. 138-139
To analyse strategic groups in an industry and their relation to each other, it is common to map them out along a set of key strategic dimensions that the firms are using in their strategic work. Based on the findings in the pre-study, we may choose to map out the retail firms along which their main selling points are and what kind of economic strategies they are likely to use. Large firms can benefit from economies of scale, while retailers with few accounts must adhere to low-cost to be able to compete. As seen in Figure 2.8 the two groups do not really overlap, which would mean that the rivalry between them is not very intense. However, there are other dimensions such as customer segment, where the two groups show market interdependence; they target roughly the same customers due to that electricity is a commodity and there are no physical geographical barriers. This finding suggests that profits, but maybe not gross margins, are different in the two strategic groups but approximately the same within each group. This corresponds to the findings in the pre-study.
Figure 2.8: Map of strategic groups along key strategic dimensions in the UK retail electricity industry.
Source: Porter 1998, p. 141
The group with most power and market share is more profitable (the ‘Big Six’) and in this case they are little exposed to competition from the small retailers. Competition in the biggest group spill over to the small, so the presence of strategic groups presents more barriers for small firms. These mobility barriers can only be overcome by strategic breakthroughs that change the industry. Mobility barriers depend on the same economic factors as entry barriers and explain
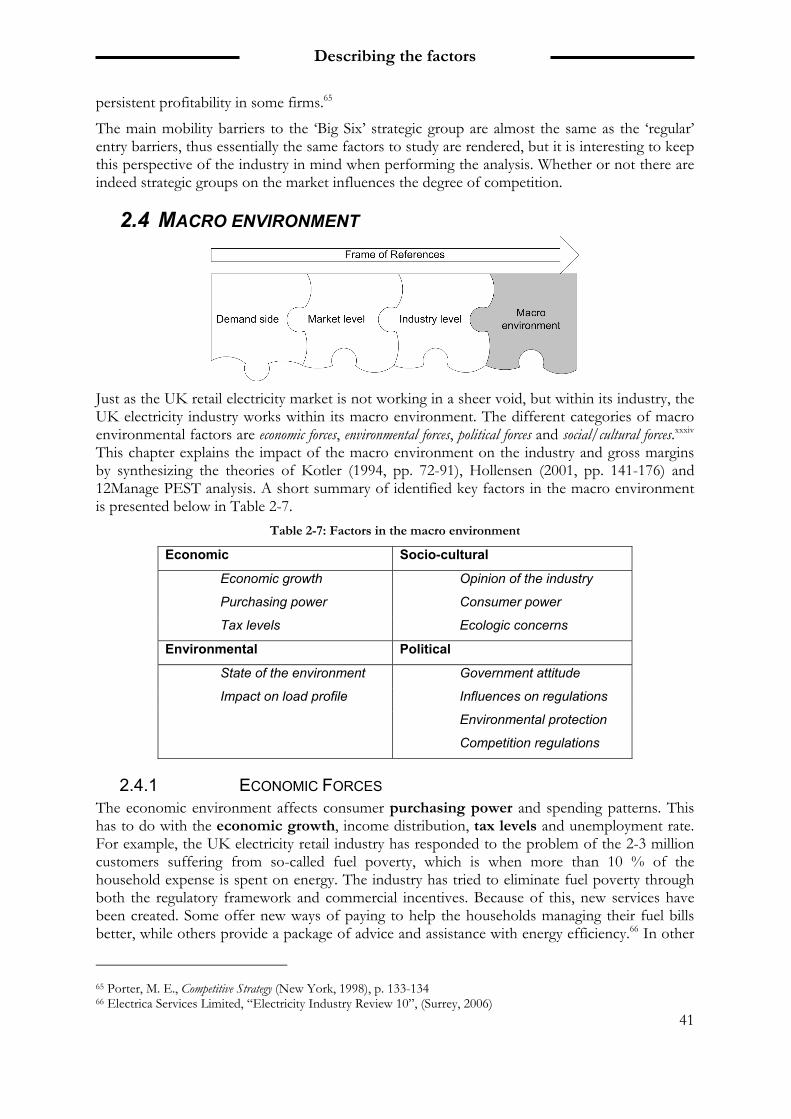
Describing the factors
41
persistent profitability in some firms.65
The main mobility barriers to the ‘Big Six’ strategic group are almost the same as the ‘regular’ entry barriers, thus essentially the same factors to study are rendered, but it is interesting to keep this perspective of the industry in mind when performing the analysis. Whether or not there are indeed strategic groups on the market influences the degree of competition.
2.4 MACRO ENVIRONMENT
Just as the UK retail electricity market is not working in a sheer void, but within its industry, the UK electricity industry works within its macro environment. The different categories of macro environmental factors are economic forces, environmental forces, political forces and social/cultural forces.xxxiv This chapter explains the impact of the macro environment on the industry and gross margins by synthesizing the theories of Kotler (1994, pp. 72-91), Hollensen (2001, pp. 141-176) and 12Manage PEST analysis. A short summary of identified key factors in the macro environment is presented below in Table 2-7.
Table 2-7: Factors in the macro environment
Economic Socio-cultural
Economic growth Opinion of the industry
Purchasing power Consumer power
Tax levels Ecologic concerns
Environmental Political
State of the environment Government attitude
Impact on load profile Influences on regulations
Environmental protection
Competition regulations
2.4.1 ECONOMIC FORCES The economic environment affects consumer purchasing power and spending patterns. This has to do with the economic growth, income distribution, tax levels and unemployment rate. For example, the UK electricity retail industry has responded to the problem of the 2-3 million customers suffering from so-called fuel poverty, which is when more than 10 % of the household expense is spent on energy. The industry has tried to eliminate fuel poverty through both the regulatory framework and commercial incentives. Because of this, new services have been created. Some offer new ways of paying to help the households managing their fuel bills better, while others provide a package of advice and assistance with energy efficiency.66 In other
65 Porter, M. E., Competitive Strategy (New York, 1998), p. 133-134 66 Electrica Services Limited, “Electricity Industry Review 10”, (Surrey, 2006)
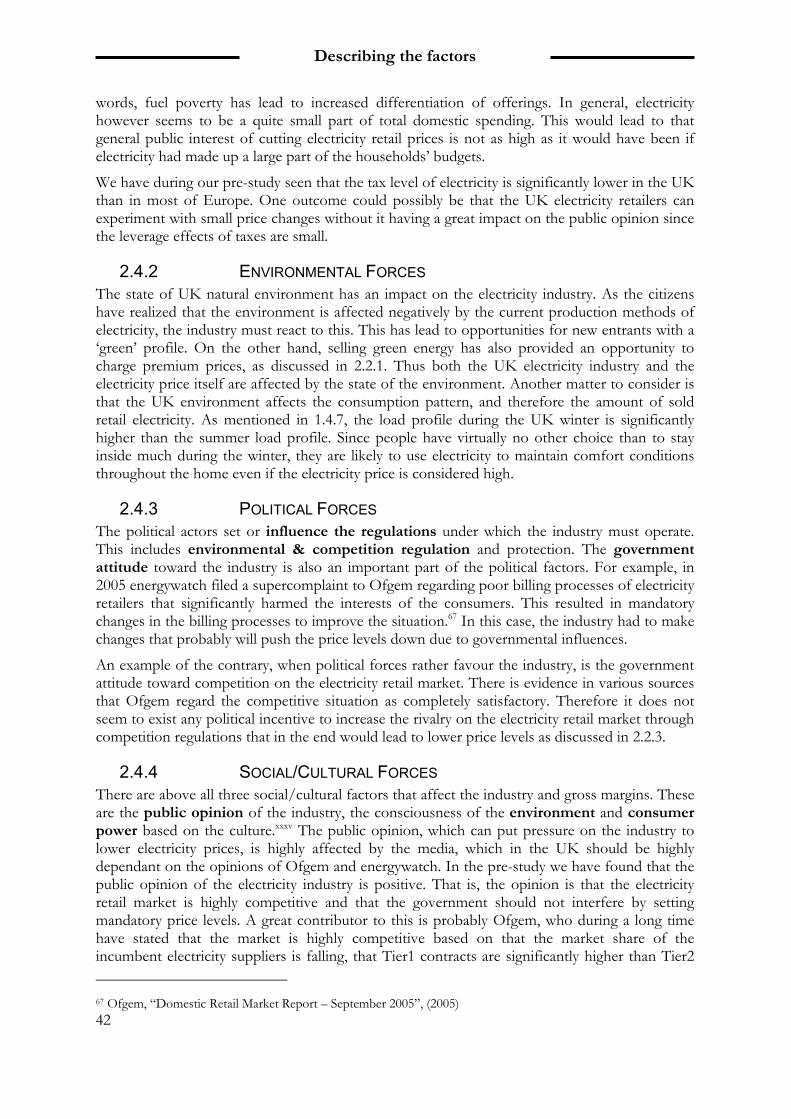
Describing the factors
42
words, fuel poverty has lead to increased differentiation of offerings. In general, electricity however seems to be a quite small part of total domestic spending. This would lead to that general public interest of cutting electricity retail prices is not as high as it would have been if electricity had made up a large part of the households’ budgets.
We have during our pre-study seen that the tax level of electricity is significantly lower in the UK than in most of Europe. One outcome could possibly be that the UK electricity retailers can experiment with small price changes without it having a great impact on the public opinion since the leverage effects of taxes are small.
2.4.2 ENVIRONMENTAL FORCES The state of UK natural environment has an impact on the electricity industry. As the citizens have realized that the environment is affected negatively by the current production methods of electricity, the industry must react to this. This has lead to opportunities for new entrants with a ‘green’ profile. On the other hand, selling green energy has also provided an opportunity to charge premium prices, as discussed in 2.2.1. Thus both the UK electricity industry and the electricity price itself are affected by the state of the environment. Another matter to consider is that the UK environment affects the consumption pattern, and therefore the amount of sold retail electricity. As mentioned in 1.4.7, the load profile during the UK winter is significantly higher than the summer load profile. Since people have virtually no other choice than to stay inside much during the winter, they are likely to use electricity to maintain comfort conditions throughout the home even if the electricity price is considered high.
2.4.3 POLITICAL FORCES The political actors set or influence the regulations under which the industry must operate. This includes environmental & competition regulation and protection. The government attitude toward the industry is also an important part of the political factors. For example, in 2005 energywatch filed a supercomplaint to Ofgem regarding poor billing processes of electricity retailers that significantly harmed the interests of the consumers. This resulted in mandatory changes in the billing processes to improve the situation.67 In this case, the industry had to make changes that probably will push the price levels down due to governmental influences.
An example of the contrary, when political forces rather favour the industry, is the government attitude toward competition on the electricity retail market. There is evidence in various sources that Ofgem regard the competitive situation as completely satisfactory. Therefore it does not seem to exist any political incentive to increase the rivalry on the electricity retail market through competition regulations that in the end would lead to lower price levels as discussed in 2.2.3.
2.4.4 SOCIAL/CULTURAL FORCES There are above all three social/cultural factors that affect the industry and gross margins. These are the public opinion of the industry, the consciousness of the environment and consumer power based on the culture.xxxv The public opinion, which can put pressure on the industry to lower electricity prices, is highly affected by the media, which in the UK should be highly dependant on the opinions of Ofgem and energywatch. In the pre-study we have found that the public opinion of the electricity industry is positive. That is, the opinion is that the electricity retail market is highly competitive and that the government should not interfere by setting mandatory price levels. A great contributor to this is probably Ofgem, who during a long time have stated that the market is highly competitive based on that the market share of the incumbent electricity suppliers is falling, that Tier1 contracts are significantly higher than Tier2 67 Ofgem, “Domestic Retail Market Report – September 2005”, (2005)
Describing the factors
43
contracts and that the switching rate is high.68
The consciousness of the environment and the electricity industry’s impact on it also affect the industry. As we have discussed before, the increased consciousness of the negative effects the electricity industry has on the environment has lead to that the public demand new and environmentally friendly ways of producing electricity. In the end, this has lead to increased differentiation of offerings, and therefore to higher prices. At the same time, the public opinion the preservation of the environment has influenced political forces, which has resulted in intensified environmental regulations, and in the end, higher retail electricity prices due to additional fees.
According to our pre-study, the consumer power based on the UK culture is high. In the UK there is a tradition of listening to the customer and its needs. This affects the UK electricity industry since it needs to be keen on developing services that matches customer needs. This company culture of a customer-based approach, and a market-friendly public attitude, will lead to content and loyal customers that are willing to pay a higher price, as discussed in 2.1.2.
2.4.5 INDUSTRY IMPACT ON THE MACRO ENVIRONMENT It is not only the macro environment that affects the industry. It is a two-way relationship, which means that the industry itself also can have an impact on the macro environment. Hiring lobbyists to influence either the public opinion or legislation affecting the industry can among many other things do this.69 However, in the UK it may possibly be as important to preserve the current state as affecting the macro environment in order to achieve a change, since the legislative arrangements of the licensing regime allows incumbents with much market power to stall political initiatives to changes of the whole licensing regime.xxxvi Understanding how the industry works to affect the macro environment is therefore vital.
2.5 SUMMARY OF THE CHAPTER In Table 2-8, the factors are presented along the different levels (for example Industry level or Demand side) and categories of factors (for example Rivalry in the Industry level) that have been discussed throughout this chapter. The layers are not disconnected from each other, but there is an interaction between them. As can be seen, the same factor can appear in multiple categories. Let us take switching costs for example. It affects customers in the sense that they will be more reluctant to change retailer if the switching costs are high. Therefore it also affects the rivalry, since the companies will have to take fewer precautions to prevent losing customers when switching costs increases. The competition will also be damped with high switching costs since it creates entry barriers, meaning it will be harder for new entrants to gain customers from incumbents. In this sense, one single factor (or several in combination) can give rise to ripple effects across the whole industry. From this structural mapping of factors we can now build our analysis model.
68 Ofgem, “Domestic Retail Market Report – September 2005”, (2005) 69 Kotler, P. & Armstrong, G., Principles of Marketing, Sixth Ed (New Jersey, 1994), p. 90
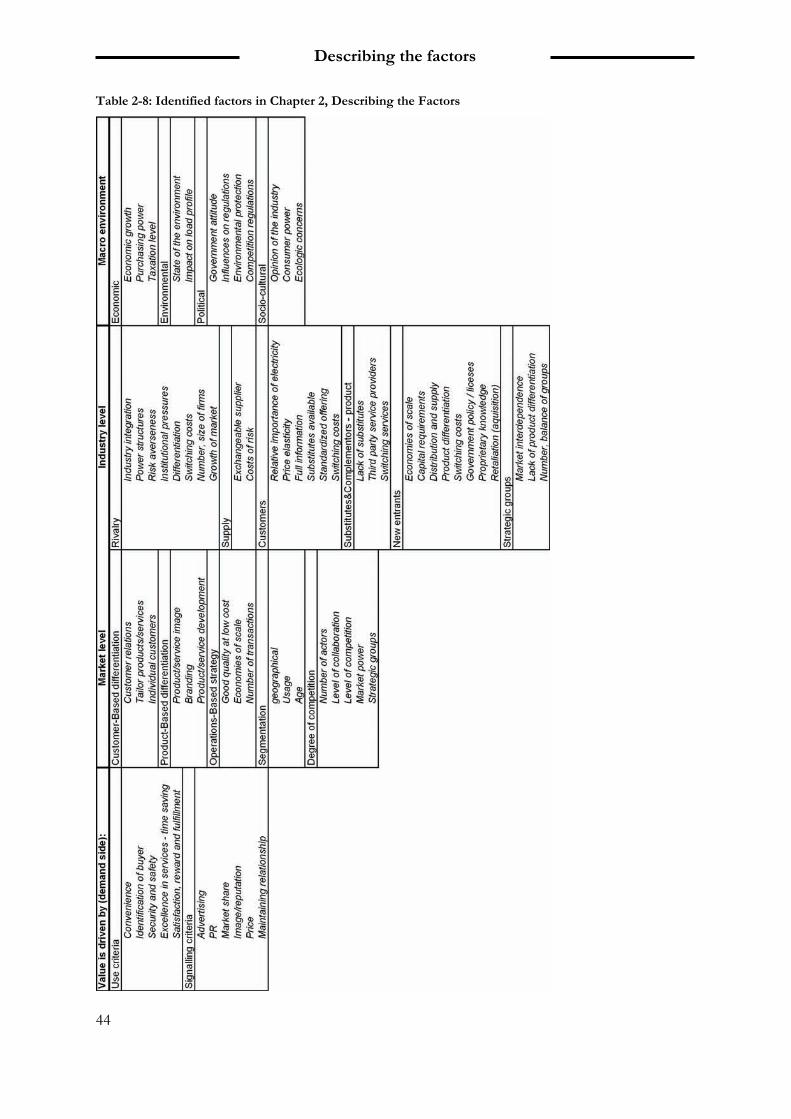
Describing the factors
44
Table 2-8: Identified factors in Chapter 2, Describing the Factors

Describing the factors
45
From this chapter it can be concluded that the price on the UK retail electricity market is determined by the interaction between the demand side, the retail firms’ competitive strategies and the intensity of the competition. The perceived customer value is driven by how the retail firm’s match their competitive strategies to both use and signal criteria. Lack of competition enables firms to charge a higher price that otherwise only would be able to achieve through differentiation and added value.

Describing the factors
46

The analysis model
47
3 THE ANALYSIS MODEL
In this chapter we build a model of analysis to describe what the electricity price is driven by, based upon the frame of references in the previous chapter and pose the focused research questions.
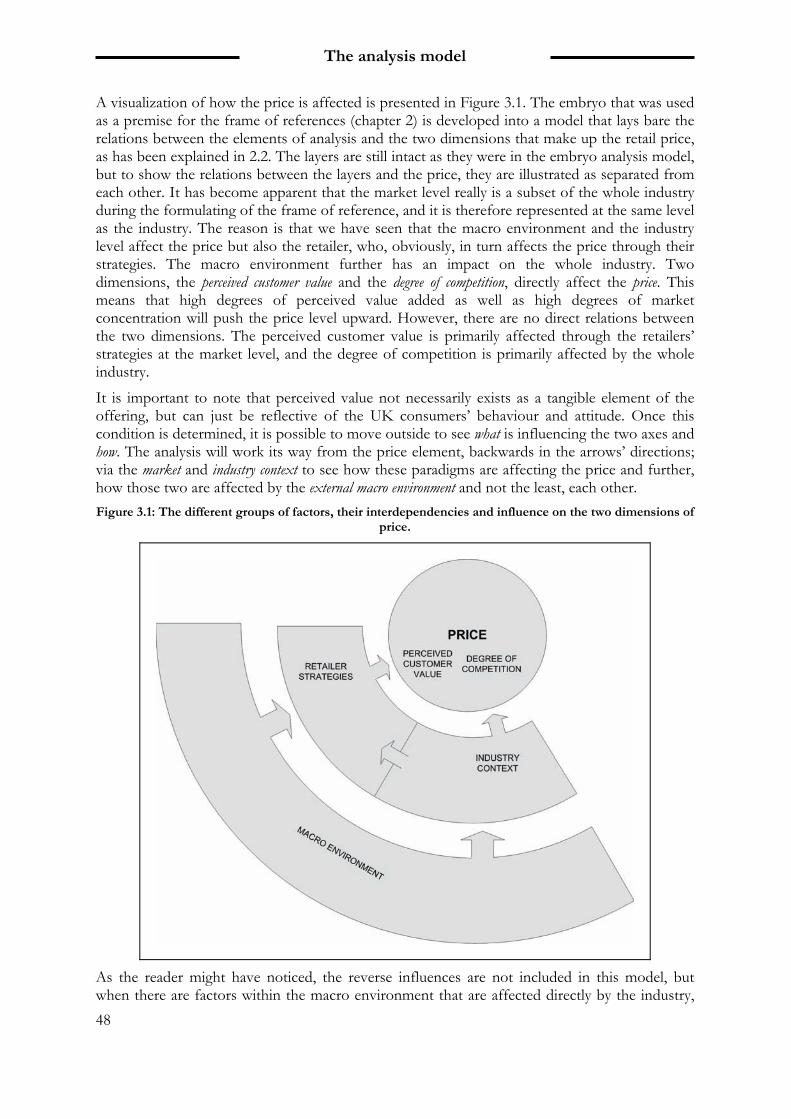
The analysis model
48
A visualization of how the price is affected is presented in Figure 3.1. The embryo that was used as a premise for the frame of references (chapter 2) is developed into a model that lays bare the relations between the elements of analysis and the two dimensions that make up the retail price, as has been explained in 2.2. The layers are still intact as they were in the embryo analysis model, but to show the relations between the layers and the price, they are illustrated as separated from each other. It has become apparent that the market level really is a subset of the whole industry during the formulating of the frame of reference, and it is therefore represented at the same level as the industry. The reason is that we have seen that the macro environment and the industry level affect the price but also the retailer, who, obviously, in turn affects the price through their strategies. The macro environment further has an impact on the whole industry. Two dimensions, the perceived customer value and the degree of competition, directly affect the price. This means that high degrees of perceived value added as well as high degrees of market concentration will push the price level upward. However, there are no direct relations between the two dimensions. The perceived customer value is primarily affected through the retailers’ strategies at the market level, and the degree of competition is primarily affected by the whole industry.
It is important to note that perceived value not necessarily exists as a tangible element of the offering, but can just be reflective of the UK consumers’ behaviour and attitude. Once this condition is determined, it is possible to move outside to see what is influencing the two axes and how. The analysis will work its way from the price element, backwards in the arrows’ directions; via the market and industry context to see how these paradigms are affecting the price and further, how those two are affected by the external macro environment and not the least, each other. Figure 3.1: The different groups of factors, their interdependencies and influence on the two dimensions of
price.
As the reader might have noticed, the reverse influences are not included in this model, but when there are factors within the macro environment that are affected directly by the industry,
The analysis model
49
then it will be illuminated in the analysis. The choice to not explicitly illustrate all reverse influences but only the main influences was that the graphical model otherwise would be too comprehensive and lose explanation value.
3.1 FOCUSED RESEARCH QUESTIONS Following the frame of references and the resulting analysis model, we can formulate the focused research questions, which are derived primarily from the four different levels in Table 2-8.
Questions regarding directly impacting factors:
• How is the retail electricity price built up and affected by customers and competition?
o How does the state of the competition impact on the price?
o How is value and price perceived?
Questions regarding indirectly impacting factors:
• How is the state of the competition explained by factors in the system?
o How do the structure and relations within the industry context form the competition?
o How do relations between the external macro environment and industry context form the competition?
• How is the perception of value and price explained by factors in the system?
o How do the retailers’ strategies influence the price?
o How do the structure and relations between the market, the industry context and the external macro environment affect the retailers’ strategies?

The analysis model
50

Methodology
51
4 METHODOLOGY
This chapter aims at describing and explaining the research approach and processes. We choose to perform our research as a case study based on qualitative data. We then proceed to discuss how we designed and executed the study through five observed phases: decision analysis & purpose, focused research questions, method, data collection, analysis and conclusions. The quality of the study, potential source of errors and the measures we took to prevent these errors is finally discussed in this chapter.
Methodology
52
If objectivity is defined as inter-subjective agreement, then the absence of an inter-subjective mutual understanding shows that objectivity is a rather subjective concept. Since there are so many diverse notions on the concept of objectivity the qualitative interview can, objectively, be characterized as neither an objective nor a subjective method70
4.1 METHODOLOGICAL APPROACH This study is a systems’ analysis, since we regard the world as more than a summation of all of its parts.
4.1.1 THIS THESIS IS A SYSTEM ANALYSIS Arbnor & Bjerke (1994, pp. 42-60) discuss six different paradigms of how the world can be viewed, which are intimately connected to the methodological approaches of a study.
We argue that our way of observing the reality aligns to the third paradigm, reality as interdependent fields of information. As we explained in 1.7, the factors that have an impact in the UK retail electricity gross margins will be interdependent and cannot be analysed out of their context. Any changes will create ripple effects throughout the industry.
The third paradigm represents reality as interdependent fields of information. The world is viewed as in constant change in its shape and activities due to the transmission of information. Some relations are viewed as more stable than others but these relations are usually probabilistic and relative rather than determined. This leads to that if one variable changes, it will create ripple effects throughout the whole system. The organization and environment are considered to co-develop, and all information must be regarded from its contextual dependency.
Theory says that there are three different methodological approaches in business economy, which also are connected to the discussed paradigms above.71 It is the analytical approach, the systems’ approach and the actors’ approach. The three approaches are mapped out along the six paradigms and overlap each other to a certain extent.
Both the analytical and the systems’ approach could be appropriate, depending on how we view the world. From the reasoning in 1.7, the conclusion is that the interdependencies between the system’s elements will create positive or negative synergies for the whole system depending on the properties of the elements. That means that the whole is more than the summation of all the parts, and suggests that the systems’ approach would be appropriate. Instead of looking for causalities, we will focus on explaining the finalities of the factors that have an impact on the UK retail electricity price.
The systems’ approach assumes that the reality diverge from the summation of the components that makes up the reality. It is therefore important to focus on the relations between the components since they will result in positive or negative synergies for the whole system. The objective is to map out finalities, which differ from causalities. While causalities means that an event must lead to- or with a certain probability will lead to another event, finalities are not explained by previously or simultaneously occurring events, but by the bigger context for which the event has a meaning. This means that finalities only are meaningful in the human world, where goals can be reached through conscious actions. This approach utilizes existing theory although not in the general way, as in the analytical approach. Since reality is assumed to always differ from the summation of its parts, existing theory on systems’ analysis must be synthesised to suit separate studies.
70 Kvale, S., Den kvalitativa forskningsintervjun (Lund, 1997), p. 64 71 Arbnor,I. & Bjerke, B., Företagsekonomisk metodlära, Second ed. (Lund, 1994), pp. 65-95
Methodology
53
4.2 APPROACH OF THE STUDY The approach of our study will be a qualitative case study. The choice of the approach is made on the basis of that we want to explain the causality between the UK retail electricity price and the workings of the UK electricity industry, and that we only have access to a handful of persons with the desired knowledge on this subject.
4.2.1 THIS STUDY AIMS TO EXPLAIN A PHENOMENON Whereas our background and pre-study are of explorative and descriptive nature, with the purpose of mapping out the problem area in order to better define the main task, our study assumes the characteristic of being explanatory as it aims to explain a phenomena on the basis of a range of existing theory. That said, the report will be explanatory, but it will at the same time contain the parts that explores and describes the field of study and the decision problem. The last step to take in a study is the predictive approach, where the research aims at making a prognosis of the future development in the problem area, but that level of study is not within the scope of this report.xxxvii
4.2.2 RESEARCH METHODS Lekvall & Wahlbin concludes that there are three main groups of studies that one can perform.72 These are case studies, cross sectional studies and time series studies. Case studies are when one analyses separate cases at a deep scope while cross sectional studies analyse several cases at a broad scope. Time series studies are performed when the interest is of the development over time. The three main groups can furthermore be of a qualitative or quantitative nature, which depends on the characteristics of the data.xxxviii Quantitative studies are performed when the data is supposed to be analysed and presented in terms of figures and numbers, while qualitative studies are used when the data not can be quantified in a meaningful way.
4.2.3 CHOSEN RESEARCH METHOD Our preferred method of choice is a qualitative case study. First of all, we define whether our study is appropriate to be qualitative or quantitative. As we earlier concluded, we are performing a system’s analysis. That means that we are trying to explain the whole picture, which is different from a summation of all its parts. We will not be able to analyse and present the data in terms of numbers since:
1. There are not enough respondents available on the market in question
2. We are trying to describe a phenomenon at a higher abstraction level. In such cases, qualitative approaches are better suited.
When it is time to determine if it is appropriate to conduct a case- or a cross sectional study, we must understand what kind of questions we want to answer, and how. Yin says that the difference between cross sectional studies and case studies is that cross sectional studies can answer questions like “who”, “what”, “where”, “how many” and “how much”, while case studies is better for answering questions like “how” and “why”.73 On the other hand, Lekvall & Wahlbin shows that cross sectional studies very well might answer “how” and “why” questions.74 This presents us a delicate problem since we want to explain which factors that have an impact on the retail electricity price, but also how they affect the price. Although both these questions of the study might be answered by making either a case study or a cross sectional
72 Lekwall, P. & Wahlbin, C., Information för Marknadsföringsbeslut, Third Edition (Gothenburg, 1993), pp. 139-141 73 Yin, R., Case study research: Design and Methods (London, 1994), pp. 4-11 74 Lekwall, P. & Wahlbin, C., Information för Marknadsföringsbeslut, Third Edition (Gothenburg, 1993)
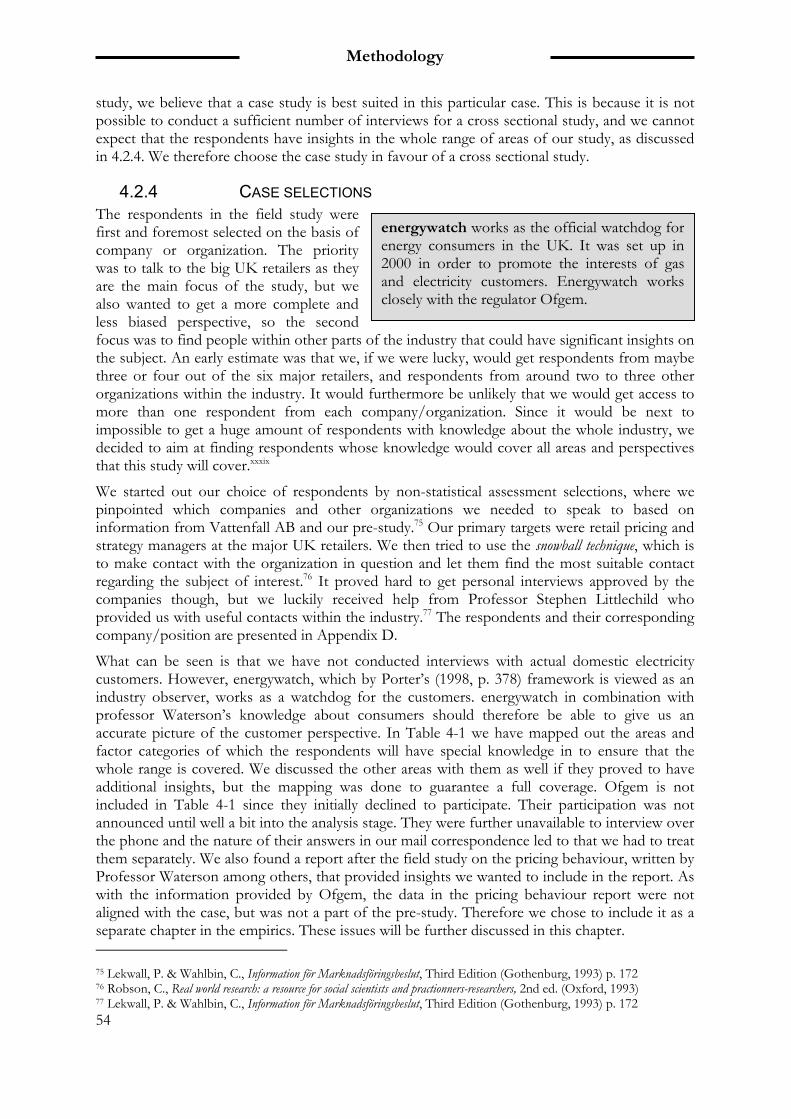
Methodology
54
study, we believe that a case study is best suited in this particular case. This is because it is not possible to conduct a sufficient number of interviews for a cross sectional study, and we cannot expect that the respondents have insights in the whole range of areas of our study, as discussed in 4.2.4. We therefore choose the case study in favour of a cross sectional study.
4.2.4 CASE SELECTIONS The respondents in the field study were first and foremost selected on the basis of company or organization. The priority was to talk to the big UK retailers as they are the main focus of the study, but we also wanted to get a more complete and less biased perspective, so the second focus was to find people within other parts of the industry that could have significant insights on the subject. An early estimate was that we, if we were lucky, would get respondents from maybe three or four out of the six major retailers, and respondents from around two to three other organizations within the industry. It would furthermore be unlikely that we would get access to more than one respondent from each company/organization. Since it would be next to impossible to get a huge amount of respondents with knowledge about the whole industry, we decided to aim at finding respondents whose knowledge would cover all areas and perspectives that this study will cover.xxxix
We started out our choice of respondents by non-statistical assessment selections, where we pinpointed which companies and other organizations we needed to speak to based on information from Vattenfall AB and our pre-study.75 Our primary targets were retail pricing and strategy managers at the major UK retailers. We then tried to use the snowball technique, which is to make contact with the organization in question and let them find the most suitable contact regarding the subject of interest.76 It proved hard to get personal interviews approved by the companies though, but we luckily received help from Professor Stephen Littlechild who provided us with useful contacts within the industry.77 The respondents and their corresponding company/position are presented in Appendix D.
What can be seen is that we have not conducted interviews with actual domestic electricity customers. However, energywatch, which by Porter’s (1998, p. 378) framework is viewed as an industry observer, works as a watchdog for the customers. energywatch in combination with professor Waterson’s knowledge about consumers should therefore be able to give us an accurate picture of the customer perspective. In Table 4-1 we have mapped out the areas and factor categories of which the respondents will have special knowledge in to ensure that the whole range is covered. We discussed the other areas with them as well if they proved to have additional insights, but the mapping was done to guarantee a full coverage. Ofgem is not included in Table 4-1 since they initially declined to participate. Their participation was not announced until well a bit into the analysis stage. They were further unavailable to interview over the phone and the nature of their answers in our mail correspondence led to that we had to treat them separately. We also found a report after the field study on the pricing behaviour, written by Professor Waterson among others, that provided insights we wanted to include in the report. As with the information provided by Ofgem, the data in the pricing behaviour report were not aligned with the case, but was not a part of the pre-study. Therefore we chose to include it as a separate chapter in the empirics. These issues will be further discussed in this chapter. 75 Lekwall, P. & Wahlbin, C., Information för Marknadsföringsbeslut, Third Edition (Gothenburg, 1993) p. 172 76 Robson, C., Real world research: a resource for social scientists and practionners-researchers, 2nd ed. (Oxford, 1993) 77 Lekwall, P. & Wahlbin, C., Information för Marknadsföringsbeslut, Third Edition (Gothenburg, 1993) p. 172
energywatch works as the official watchdog forenergy consumers in the UK. It was set up in2000 in order to promote the interests of gasand electricity customers. Energywatch worksclosely with the regulator Ofgem.
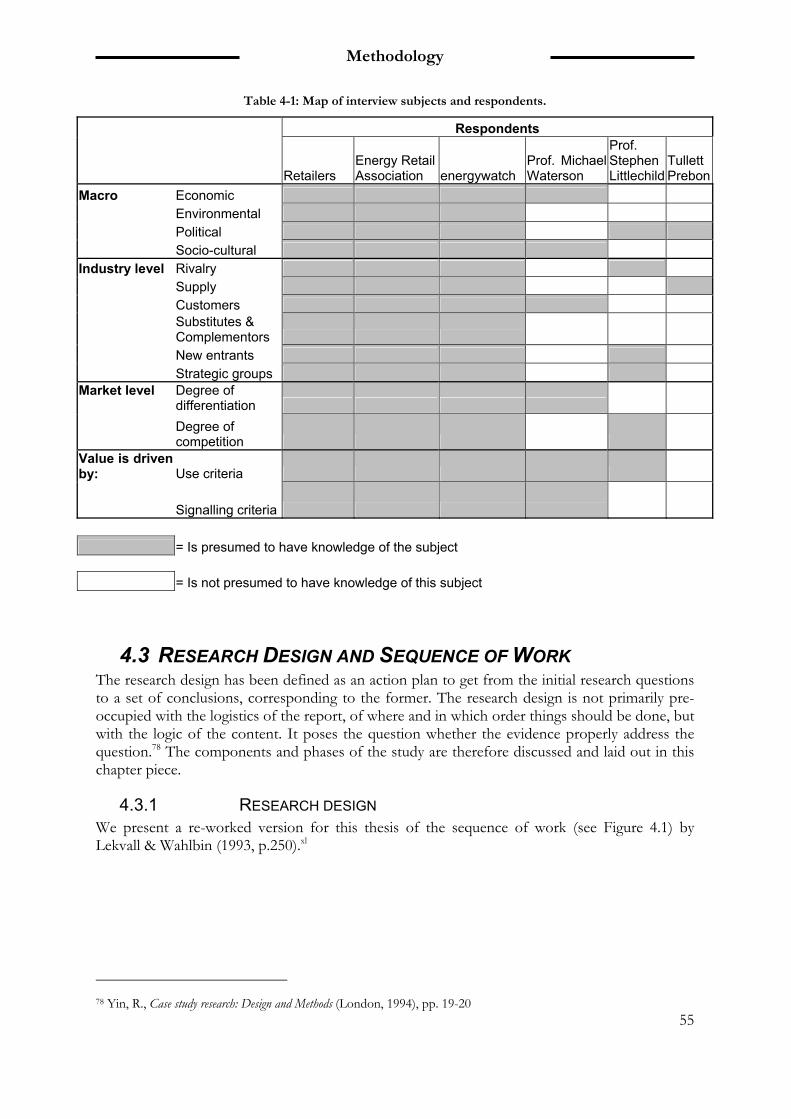
Methodology
55
Table 4-1: Map of interview subjects and respondents.
Respondents
Retailers Energy Retail Association energywatch
Prof. Michael Waterson
Prof. Stephen Littlechild
Tullett Prebon
Macro Economic Environmental Political Socio-cultural Industry level Rivalry Supply Customers
Substitutes & Complementors
New entrants Strategic groups Market level Degree of
differentiation
Degree of competition
Value is driven by: Use criteria
Signalling criteria = Is presumed to have knowledge of the subject = Is not presumed to have knowledge of this subject
4.3 RESEARCH DESIGN AND SEQUENCE OF WORK The research design has been defined as an action plan to get from the initial research questions to a set of conclusions, corresponding to the former. The research design is not primarily pre-occupied with the logistics of the report, of where and in which order things should be done, but with the logic of the content. It poses the question whether the evidence properly address the question.78 The components and phases of the study are therefore discussed and laid out in this chapter piece.
4.3.1 RESEARCH DESIGN We present a re-worked version for this thesis of the sequence of work (see Figure 4.1) by Lekvall & Wahlbin (1993, p.250).xl
78 Yin, R., Case study research: Design and Methods (London, 1994), pp. 19-20
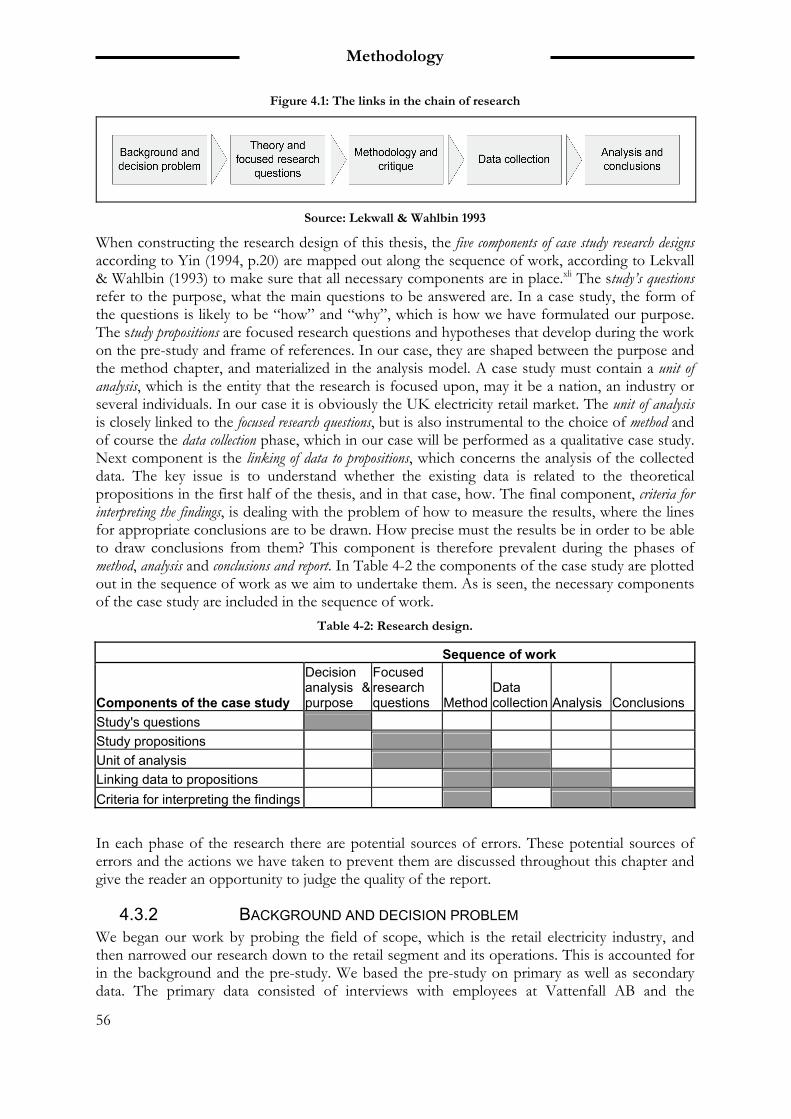
Methodology
56
Figure 4.1: The links in the chain of research
Source: Lekwall & Wahlbin 1993
When constructing the research design of this thesis, the five components of case study research designs according to Yin (1994, p.20) are mapped out along the sequence of work, according to Lekvall & Wahlbin (1993) to make sure that all necessary components are in place.xli The study’s questions refer to the purpose, what the main questions to be answered are. In a case study, the form of the questions is likely to be “how” and “why”, which is how we have formulated our purpose. The study propositions are focused research questions and hypotheses that develop during the work on the pre-study and frame of references. In our case, they are shaped between the purpose and the method chapter, and materialized in the analysis model. A case study must contain a unit of analysis, which is the entity that the research is focused upon, may it be a nation, an industry or several individuals. In our case it is obviously the UK electricity retail market. The unit of analysis is closely linked to the focused research questions, but is also instrumental to the choice of method and of course the data collection phase, which in our case will be performed as a qualitative case study. Next component is the linking of data to propositions, which concerns the analysis of the collected data. The key issue is to understand whether the existing data is related to the theoretical propositions in the first half of the thesis, and in that case, how. The final component, criteria for interpreting the findings, is dealing with the problem of how to measure the results, where the lines for appropriate conclusions are to be drawn. How precise must the results be in order to be able to draw conclusions from them? This component is therefore prevalent during the phases of method, analysis and conclusions and report. In Table 4-2 the components of the case study are plotted out in the sequence of work as we aim to undertake them. As is seen, the necessary components of the case study are included in the sequence of work.
Table 4-2: Research design.
Sequence of work
Components of the case study
Decision analysis & purpose
Focused research questions Method
Data collection Analysis Conclusions
Study's questions Study propositions Unit of analysis Linking data to propositions Criteria for interpreting the findings
In each phase of the research there are potential sources of errors. These potential sources of errors and the actions we have taken to prevent them are discussed throughout this chapter and give the reader an opportunity to judge the quality of the report.
4.3.2 BACKGROUND AND DECISION PROBLEM We began our work by probing the field of scope, which is the retail electricity industry, and then narrowed our research down to the retail segment and its operations. This is accounted for in the background and the pre-study. We based the pre-study on primary as well as secondary data. The primary data consisted of interviews with employees at Vattenfall AB and the
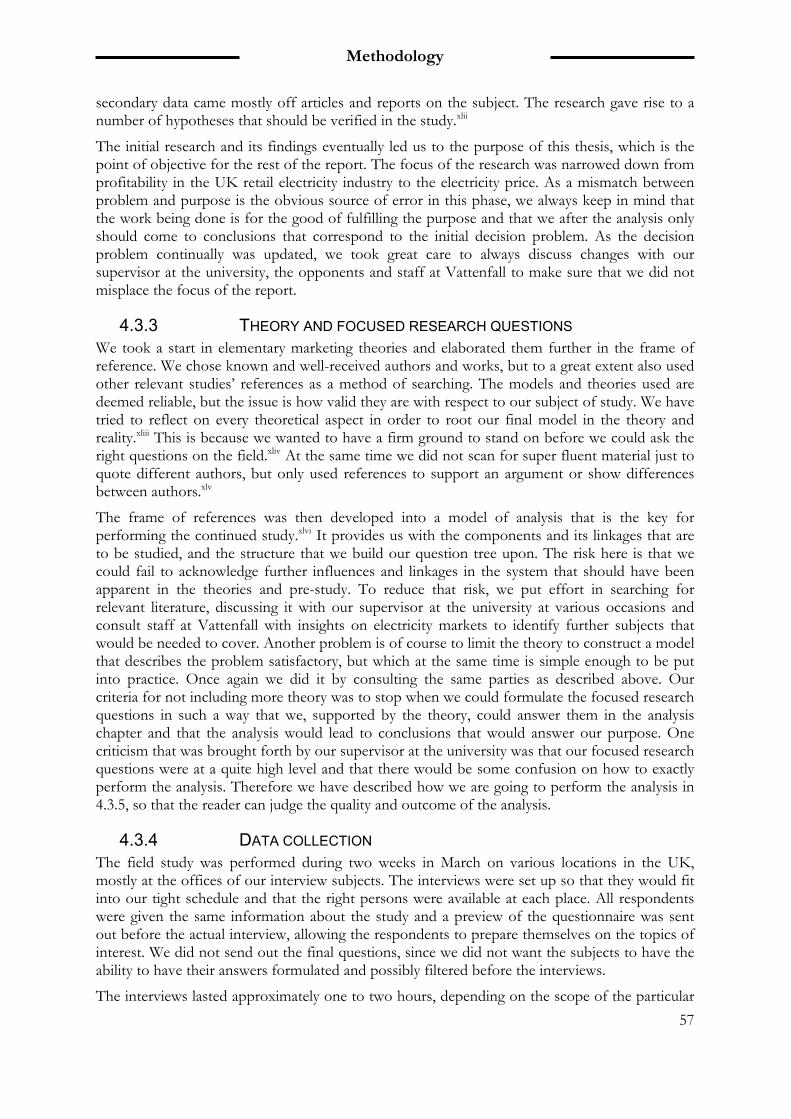
Methodology
57
secondary data came mostly off articles and reports on the subject. The research gave rise to a number of hypotheses that should be verified in the study.xlii
The initial research and its findings eventually led us to the purpose of this thesis, which is the point of objective for the rest of the report. The focus of the research was narrowed down from profitability in the UK retail electricity industry to the electricity price. As a mismatch between problem and purpose is the obvious source of error in this phase, we always keep in mind that the work being done is for the good of fulfilling the purpose and that we after the analysis only should come to conclusions that correspond to the initial decision problem. As the decision problem continually was updated, we took great care to always discuss changes with our supervisor at the university, the opponents and staff at Vattenfall to make sure that we did not misplace the focus of the report.
4.3.3 THEORY AND FOCUSED RESEARCH QUESTIONS We took a start in elementary marketing theories and elaborated them further in the frame of reference. We chose known and well-received authors and works, but to a great extent also used other relevant studies’ references as a method of searching. The models and theories used are deemed reliable, but the issue is how valid they are with respect to our subject of study. We have tried to reflect on every theoretical aspect in order to root our final model in the theory and reality.xliii This is because we wanted to have a firm ground to stand on before we could ask the right questions on the field.xliv At the same time we did not scan for super fluent material just to quote different authors, but only used references to support an argument or show differences between authors.xlv
The frame of references was then developed into a model of analysis that is the key for performing the continued study.xlvi It provides us with the components and its linkages that are to be studied, and the structure that we build our question tree upon. The risk here is that we could fail to acknowledge further influences and linkages in the system that should have been apparent in the theories and pre-study. To reduce that risk, we put effort in searching for relevant literature, discussing it with our supervisor at the university at various occasions and consult staff at Vattenfall with insights on electricity markets to identify further subjects that would be needed to cover. Another problem is of course to limit the theory to construct a model that describes the problem satisfactory, but which at the same time is simple enough to be put into practice. Once again we did it by consulting the same parties as described above. Our criteria for not including more theory was to stop when we could formulate the focused research questions in such a way that we, supported by the theory, could answer them in the analysis chapter and that the analysis would lead to conclusions that would answer our purpose. One criticism that was brought forth by our supervisor at the university was that our focused research questions were at a quite high level and that there would be some confusion on how to exactly perform the analysis. Therefore we have described how we are going to perform the analysis in 4.3.5, so that the reader can judge the quality and outcome of the analysis.
4.3.4 DATA COLLECTION The field study was performed during two weeks in March on various locations in the UK, mostly at the offices of our interview subjects. The interviews were set up so that they would fit into our tight schedule and that the right persons were available at each place. All respondents were given the same information about the study and a preview of the questionnaire was sent out before the actual interview, allowing the respondents to prepare themselves on the topics of interest. We did not send out the final questions, since we did not want the subjects to have the ability to have their answers formulated and possibly filtered before the interviews.
The interviews lasted approximately one to two hours, depending on the scope of the particular
Methodology
58
interview and the availability of the subjects. We had to consider that many respondents could not, or did not want to, discuss certain topics regarding facts, figures and strategies, due to their competitive nature. Since our aim was not to get exact numbers, but to understand the workings of the industry, an alternative was to present some of the facts we had come up to during the pre-study and let the respondents comment it. The gross margins were for example such a subject where we discussed them with the retailers through pre-calculated numbers, which we had done through public statistics during our pre-study. This let us get an understanding of the gross margins and their magnitude without pressing the retailers to discuss any company sensitive data, in line with Porter’s suggestions.79 The quality of the interviews and possible sources of errors are further discussed in 4.4.3.
The questionnaire
We used the sheet of factors in Table 2-8 to map out which respondents may answer what questions. We then made sure that all areas were covered by at least one interviewee.80 Specific questionnaires were prepared for each respondent so that no time was wasted on issues they could not deal with and that consideration was taken to their respective angles and knowledge on the subject. The order of the questions is set up both to be logic for the respondent and also adjusted to various interview techniques, such as warming up the respondent with less intricate and sensitive questions.xlvii This sequence of order also helps us to step in to the role as interviewers. There must obviously be a balance between presenting a logical sequence of questions and to take on the most important questions first. We did miss out on a question or two on at least one occasion, but thanks to the ‘interview guide’ we kept the lost questions to a minimum.81
After a few interviews we noticed that we could benefit from re-arranging the order of the topics, since no respondents were particularly sensitive towards any issues. Thereby we quickly came to the more interesting questions in the interviews, but the fact that we did not ask the same questions in exact order could of course be a source of error. However, due to the length and depth of the interviews, we did not at any point feel that not each and every topic was satisfactory covered and thus concludes that it is not a major concern.
All questionnaires were discussed with and examined by our supervisor Kurosh Beradari at Vattenfall, who gave us useful tips on which further questions to ask.
4.3.5 ANALYSIS AND CONCLUSIONS To ensure that the results from the analysis are not based on random reflections, a strategy of analysis has been followed. The point of departure of the analysis was the price, which was the kernel of the problem. From the case, we began to analyse the price by determining the state of the UK electricity retail market in terms of the two price determining dimensions, the perceived customer value and the degree of competition. When that was done, the work of explaining the underlying factors was conducted by forking our way through the different layers, from the centre and out. This was done by analysing the connections within and between the layers according to the reasoning further down in this chapter. The findings in the analysis then formed the basis upon which the conclusions were drawn. An alternative to this strategy would be to start in the macro environment and analyse all chains of connections from there. The chains of connections that do not reach either of the two price determining dimensions are not considered to be affecting the price or the gross margins. This strategy would, apart from the intended goal, reveal chains of connections that might provide interesting insights that do not 79 Porter, M. E., Competitive Strategy (New York, 1998), p. 382 80 Yin, R., Case study research: Design and Methods (London, 1994), p. 69 81 McCracken, G., The Long Interview (USA, 1988), pp. 24-25
Methodology
59
have anything to do with the price or gross margins. The downside is that the analysis would be hard to follow for the reader, and that important reasoning could get lost in the amounts of text. We chose to perform the analysis from inside out to facilitate for the reader and make the analysis possible to take in.
The analysis of the connections was done with the factor sheet in Table 2-8 as guidance. The case, which to a large extent is presented according to the structure in the factor sheet, was first broken down and classified according to the groups in the factor sheet. We then made pair wise analysis of these factor groups to see if there existed any connections between them. If we could motivate any connections, they were accounted for in the report and if not, the issue was dropped. On the occasions when we were uncertain of either how a connection worked or if it existed, we accounted for it in the report. An example of how we would analyse the connections is if we would find that there are high barriers of entrance to the market due to extensive regulations and also that there virtually are no new entrants on the market. Then we would draw the conclusion that there is a relation between the low frequency of new entrants and the comprehensive regulation. Another example could be that if we found that the perceived customer value is very high, we could not say that there is a direct relation between that and that there only are six dominant players on the market since neither the empirics, nor the theory says so. However, if we then found that the companies can offer highly differentiated offerings thanks to that there are only a few players on the market (not so many to take into account when differentiating one’s offering), then we could say that there is a connection linking together consolidation and perceived value.
The main source of error in this part of the research is that we do not interpret the empirics correctly or forget to take in all perspectives when analysing a factor and its implications. We have to be aware of that there are cultural differences to overcome; factors that are evident to us may be seen in a whole other light in UK. Therefore it is necessary to take this into the equation when analysing the data and interviews. The real challenge essentially lies ahead of the analysis, by encapsulating it and the data collection correctly through the pre-study and theory development.82 Jensen (1995) suggests an investigation of the exceptions and extremes from the qualitative data collection, as they do not necessarily overthrow the results of the study, if they are explained to arise from other circumstances than the “normal” answers. For instance, a consumer watchdog would probably not have the same view on competition as a market player might have.
We continually discussed our analysis and the conclusions with Kurosh Beradari and Charlotte Loid at Vattenfall, who both are well literate on the subject. To get opinions on the analysis, our conclusions and if we were covering all the important aspects gave us an opportunity to review the issues that were addressed. The goals of doing this were to increase and secure the quality of the analysis and the conclusions.xlviii
4.4 QUALITY OF THE STUDY This piece will go through the issues of quality, reliability and validity of the research, and how to prevent errors from influencing the final results.
4.4.1 RELIABILITY Reliability deals with the consistency of the research results, that is, whether they can be repeated under similar circumstances.83 The reader of this report must be allowed to follow the derivation
82 Jensen, M. K., Kvalitativa metoder (Lund, 1995), p. 124 83 Kvale, S., Den kvalitativa forskningsintervjun (Lund, 1997), p. 213
Methodology
60
of any evidence from research questions to conclusions, from the beginning to the end as well as the other way around.xlix Focus is on removing as many errors and partisan data as possible, as they distort the results. Increased reliability can lessen the impact of arbitrary subjectivity, however too much emphasis on this may counteract creativity and the ability to adapt to a situation.84 Hence, we did keep in mind that different respondents may have biases and interests in certain issues, but we did not pressure anyone to stay objective.
There are according to Lekvall & Wahlbin (1993) a number of tests that can be performed in order to enhance reliability, such as testing the measurement instrument on an individual several times or by splitting the instrument in two and compare their results. We did this when we measured the value component by first investigating how the value was perceived, and then moved on to study how the companies met the perception of the value. However, we did not have the opportunity to perform several test interviews and we chose not to engage in complex methods of instrument development. The best method for good reliability is by all means a consistent and standardised measurement process, which we believe we have achieved through the use of the factor sheet presented in Table 2-8 as an interview guide. Hence we could secure that all areas were covered, and by triangulation (see 4.4.2) more angles were covered. Most of the issues concerning reliability are related to the data collection. This subject is dealt with below in chapter piece 4.3.4. The reliability of the whole case is discussed in 4.4.5.
4.4.2 TRIANGULATION IMPROVES QUALITY AND RELIABILITY To improve the quality and reliability of the results we use data triangulation, which is basically the method of using multiple sources of information for the data collection. The key is to find sources with different angles to the problem, something we achieve by interviewing industry participants as well as outside experts and industry organizations.l As we showed in Table 4-1, we have ensured that there at least is more than one source that should be able to answer questions on the different interview subjects. This is done to be able to merge the knowledge into one case on the UK electricity market with high reliability that can be analysed as one entity.li
Jensen (1995, pp. 101-103) writes that when respondents’ answers are divided, one has to develop these results and not just choose among them. For instance, discrepancies in the answers from different lobby organizations, with different interests, are likely to be substantial. In that case the differences must be analysed and not reduced. We have therefore put substantial efforts into reproducing the various views by describing the different opinions of the subjects in the case as accurately as possible. To establish the quality of the case study, validity and reliability of the empirics should be certified. Yin (1994) suggests four tests that are outlined in the pieces below.
4.4.3 THE INTERVIEWS The quality of the interview is the basis for the quality of the analysis. It was fairly easy to get rich and long answers to our short questions, which is a sign of quality. We made sure that our prepared questions would not have to be clarified for the respondents, and the outcome suggests that we succeeded in this. We could probably have followed up more on certain questions and specified the meaning of the answer, but with the help of the recordings we could at least assure that we had understood the context. There was also always the possibility of asking follow-up questions in subsequent correspondence. We actively listened for contradictory answers and were ready to question the logic in the answers during the interview, but as far as we could tell,
84 Kvale, S., Den kvalitativa forskningsintervjun (Lund, 1997), p. 213
Methodology
61
no such situation was apparent.85
Only the interviews in person were sound recorded, and the respondents gave their approval of this. All the respondents agreed to be named in the final report, which will be sent out to all participants. Scottish & Southern Energy was the only one slightly reluctant towards sound recording, but there is no reason to believe that any essential information was left out because of that. The respondents were all pleased to be part of the study and were answering our questions to the best of their knowledge, and with respect to their companies’ confidentiality. Most respondents recognized our situation, which somewhat helped us crossing over to them.
To make the interview process as efficient as possible, one person was in charge of the actual interview while the other person took the notes and made sure that no issues were left out and came with follow-up questions. The idea was to use the same set-up for all interviews so that the results of the interview would not depend on who was asking the questions.86 The formula was unfortunately broken when Daniel had to leave for Sweden because of back problems. This left Dan to conduct three interviews alone. Both listened afterwards to the recordings to assure that no anomalies occurred in these interviews.
Lekvall & Wahlbin (1993) present a number of possible situational factors related to the measurement method that can influence the results:
The properties of the respondent in terms of stress, fatigue et cetera can have an impact on the answers, however did we not encounter this.
Some interviews were conducted in public spaces and were subject to more external distractions than others. It is unfortunate, but there was little we could do to prevent this.
We asked open questions and made sure that the respondents told their own story, so that we did not engage in so-called active listening. At times it was necessary to give an example in order to elaborate a question, and this could be an issue of leading questions. We kept a low-key and consistent body language and made sure that we did not emphasize certain words or sentences.87 As mentioned, we used our questionnaires for bringing structure to the interview, with clear and quick questions.88 We made sure that the atmosphere was friendly and open for the interviewees’ perspective, as it is essential to not let the respondent feel intimidated or reduced. Still, it is important to remain the leader of the conversation so that no subject is left out of the interview. We began all interviews by asking how much time we had to our disposal, and could thus tighten or loosen the length of the answers accordingly.89
Obviously, it was not possible to literally write everything the respondents said during the interview. It was rather a question of capturing the essence of the response, which of course is subjective. To reduce the risk of errors due to this we read through the notes taken as soon as possible after the interview. Both of us had to agree on what was written, and on the occasions when we disagreed, we simply listened through that part of the recording once again. If we did not have recordings or still were confused after having listened them through, we asked the respondents to clarify the issue along with our follow-up questions. We did not refrain from writing down answers we perceived as unimportant during the interview, but aimed to reduce the amount of information when writing the case. On the occasions when the person responsible for taking notes did not manage to write down an answer, we used the recordings to complement the document after the interview. This could be a potential source of error for the 85 Kvale, S., Den kvalitativa forskningsintervjun (Lund, 1997), pp. 134-146 86 Lekwall, P. & Wahlbin, C., Information för Marknadsföringsbeslut, Third Edition. (Gothenburg, 1993) 87 McCracken, G., The Long Interview. USA, 1988 88 Kvale, S., Den kvalitativa forskningsintervjun (Lund, 1997), pp. 134-146 89 McCracken, G., The Long Interview. USA, 1988, pp. 37-38
Methodology
62
interviews that were conducted via telephone and did not get recorded. We compensated for this problem by letting the person responsible for asking the questions check on the one responsible for taking notes to make sure that he had finished writing before moving on to next question.
When communicating with people from another country, potential errors may arise due to either cultural differences or language problems. The psychological distance between Sweden and England is relatively small though, which makes it fairly easy to communicate without any special knowledge about codes of conduct. As Dan has lived in England and is in agreement with the UK society, potential problems with cultural differences should be reduced to a minimum. Problems due to language should also be a very small factor, since the interviews were conducted in English, which is the mother tongue of the respondents. On the few occasions when we did not understand an answer, we simply asked the respondent to either clarify or rephrase it.
4.4.4 VALIDITY There are several forms of validity, which all have in common that they deal with whether or not the chosen measurement method actually measures the intended features.90 Construct validity is a question of choosing the right things to measure. For instance, an increase in reported crime does not necessarily mean an increase in crime. To counter this, we use multiple sources of evidence as well as multiple perspectives, as already discussed in 4.4.2.91
Internal validity is concerned with whether a causal relationship actually exists. Does the researcher know that there is not an unknown factor z that is causing y? We make up for this by letting the opponents and supervisor inspect that the theory proposed is established by the data (pattern matching).92 This is essentially the same as concept validity, which is the matching of a theory with the investigational results. If theory claims that entry barriers causes less competition and the field study shows that there are entry barriers and little competition, it suggests validity.93 There is also external validity that deals with the problem of generalization of the results from a study. Since case studies rely on analytical generalization, the results from this thesis will not apply on another market, but the model of analysis will.94 However, as the different layers of the model of analysis have been specifically adjusted to the UK electricity retail market, the same adjustments must be done before applying it to other markets.
We assured some instant experienced validity by going through the questions with our supervisor Kurosh Beradari at Vattenfall AB, who is well literate on the subject.95 Preferably, we should have had the questions and models scrutinized by opponents and supervisor at the university, but there simply was no time for doing that, as we had to leave within two days if we were to meet with all necessary people in the field study. We therefore encourage the reader to read through the compiled questionnaire in Appendix E.
Lekvall & Wahlbin (1993) proposes two other forms of validity to take in to consideration. First, there is predictive validity, which is the assertion on hypotheses. We do not have one explicit hypothesis, but if some results are expected, it is a sign of predictive validity. Of course, one must make sure not to mistake prediction with anticipation, which could otherwise be a source of error. Lastly, we have contents validity, which is similar to instant experienced validity. The aim is to
90 Lekwall, P. & Wahlbin, C., Information för Marknadsföringsbeslut, Third Edition. (Gothenburg, 1993), p. 211 91 Yin, R., Case study research: Design and Methods (London, 1994), p. 34 92 Yin, R., Case study research: Design and Methods (London, 1994), pp. 106-110 93 Lekwall, P. & Wahlbin, C., Information för Marknadsföringsbeslut, Third Edition. (Gothenburg, 1993), p.212 94 Yin, R., Case study research: Design and Methods (London, 1994), p. 36 95 Bell, J., Introduktion till forskningsmetodik, Second edition. (Lund, 1995) p. 90 & Lekwall, P. & Wahlbin, C., Information för Marknadsföringsbeslut, Third Edition. (Gothenburg, 1993) p. 211
Methodology
63
make sure that the battery of questions really covers all possible parameters and dimensions of the problem. By formulating our frame of references as a sheet of factors, through which we constructed our questionnaires, we believe that this validity is achieved.
4.4.5 QUALITY OF THE CASE When the interviews were merged into the case of the UK retail electricity market, we wanted to take measures to ensure that it was reliable. As we have written before, we have to use the knowledge of several sources to be able to construct the whole case, but the question is if these persons recognises the case as representative. Although the respondents cannot be experts in every aspect, they still may provide important opinions and corrections that would increase the reliability of the case. The first version of the case was therefore sent out to the respondents, where we asked them to read it through and comment on how they perceived it, and offered them the chance to comment on particular issues they felt the need to address. In this way the reliability of the case was not only increased, but we also got a chance to detect parts of the case where we ourselves unintentionally might have stated an opinion that was ours and not the respondents. That allowed us to make a conscious decision whether we should motivate our opinion’s place in the case, or simply change it according to the respondent’s view. We received opinions from the professors, the ERA, Tullett Prebon and two retailers. Although we had made minor misinterpretations of some facts, which we easily could reassess, they thought that the case as a whole gave an accurate picture of the situation.
As we earlier mentioned, the participation of Ofgem was not secured until very late in the work. Further, we were refused to perform a telephone interview and Ofgem’s answers in our mail correspondence were largely based on references to their published reports and surveys.96 This has resulted in a few problems. First of all, the nature of their answers were not aligned to the case we had written, which led to that we could not include that information in the actual case. Instead we chose to present it. Since the references they gave us often were to reports that only discussed the subject of the questions we wanted answers on, but not our particular question, we did not get our questions properly answered. That actually left us with more questions than answers, particularly whether the consumers value anything but price or not. The problem is that their domestic retail market report from June 2005 includes a customer survey, which states that price is the key factor in switching supplier. They have given us the results of their questionnaire, and an interview guide but we are confused on how their questions have been put and the statistics of the underlying questions are not always presented in a way that is meaningful to us. It is most unfortunate that Ofgem have not answered our follow up questions in words, but only referred to the reports and surveys, because it is not possible to ask the other participants on those statistics either, since they neither know anything of the underlying data nor how it should be interpreted. This is the major and unanswered issue that we have chosen to present and discuss separate from the case. This has led to that we put less emphasis on security and safety as factors directly influencing the price in the analysis and conclusions, which we initially did. Instead we turn the focus of the security element and connect it with entry barriers, which would be valid no matter if Ofgem’s claim is valid or not. This is further elaborated on in the empirics and analysis. Our point is that security and safety have been important factors contributing to the high price, but as we have not been able to verify or reject the information provided by Ofgem we cannot be entirely sure on whether they primarily are directly linked to the price or through barriers of entry.
96 Customer Survey, Domestic Retail Market Report - September 2005, Energy Billing and Metering
Methodology
64
4.4.6 GENERALIZATION The purpose of generalization is three-fold; to determine the norm and the regularities, to know what might be in the future and lastly also to know what could exist, that is, to look at specific energy markets to see what drivers there are.97 We will only fulfil the first of these purposes. The results of our study cannot be projected onto another market, they are only intended to illuminate and explain the situation on the field of study. Since the questionnaire was designed from the background information of the market in question, it should not be viewed as a tool for just any energy market. However, the analysis model should be possible to make use of when describing any competitive energy markets or other markets with the same characteristics.
As was suggested in 4.4.4, the type of generalization used in this report will be a form of analytical generalization, which is defined as a well-discussed judgement whether the results from an investigation can bring answers to the questions about another situation.98 Such an analysis though, is based on the comparison of a different situation, and we will not do that in this report.
97 Kvale, S., Den kvalitativa forskningsintervjun (Lund, 1997), p.212 98 Kvale, S., Den kvalitativa forskningsintervjun (Lund, 1997), p.210

Empirics
65
5 EMPIRICS
In this chapter we present our data collected in our field study, which was primarily conducted during a two-week trip to the UK. We begin with a brief presentation of the participants and then present a short summary of the case in 5.2, which can be skipped if the reader intends to read the whole case. We then move on to lay out the empirics according to the factor sheet from chapter 2.5.
Empirics
66
We try to tell a story along the nature of the questions by compiling insights from all the respondents, and will thus not present each and every respondent’s interviews in text. The full questionnaire is found in Appendix E.
5.1 THE RESPONDENTS We start out the chapter with a brief presentation of the people, companies and organizations that participated in this study, for the reader to get a grasp of their position and situation. We will also try to point out the respondents’ respective fields of knowledge, as was described in chapter 4.
Centrica – Andrew Reaney
Centrica is the largest player on the market in both gas and electricity under the name British Gas. Their success is primarily due to their previous monopoly position as the national gas provider; when they began to offer electricity to their huge gas customer base (ten million accounts), they immediately became the largest electricity supplier as well, with almost six million customers. Their corporate structure also differs from other retailers in that they did not use to have any own generation plants, but have now acquired several facilities to change this. The lack of own generation leads them to be more exposed to volatility on the wholesale market. Andrew Reaney is head of Innovation and is developing energy services. He will become responsible for customer marketing and retention and has in the past also been head of Customer Experience.
E.ON Powergen – Graham Kirby
The German energy company E.ON is one of the largest players in Europe and E.ON UK is the largest integrated energy company in the UK. Powergen is the company’s retail brand, which has acquired several strong retailers in the last five years. Powergen is the second largest player in both gas and electricity, and has a very strong brand. Graham Kirby is Retail Regulation Manager, which means he is the face towards the government.
Scottish Power – Craig Taylor
Scottish Power has a strong brand in Scotland but is at the same the smallest in retail of the ‘Big Six’. Scottish Power was in 2005 bid on by E.ON UK, but rejected the offer. Craig Taylor is the head of Retail Pricing and is thus responsible for domestic and small business pricing. He is also responsible for product development and the residential website.
Scottish & Southern Energy – Rob McDonald
Scottish & Southern Energy was formed in 1998 from the merger of Scottish Hydro Electric and Southern Electric. It has roughly 4.5 million electricity accounts out of 7.7 million energy accounts. SSE has been the cheapest supplier for some time and is currently the fastest growing, with very strong regional brands. It also owns transmission business in Scotland and has significant involvement in telecom with about 50 000 telephony customers. Rob McDonald is the head of Deregulation and looks after DTI (the Department of Trade and Industry), EU regulators and environmental organizations.
RWE npower – Laurence Poel, Mark Montgomery
RWE npower is part of the German-based RWE Group and serves almost seven million energy customers in the UK. npower is a widely known retail brand in the whole of UK, hence the corporate name change from Innogy to npower in 2004. Laurence Poel is head of Retail Regulation and deals with Ofgem and energy watch. Mark Montgomery is the Energy Products manager and works with sales & marketing and phone services.
Empirics
67
Bizz Energy – Pricing staff
Bizz Energy is the largest independent supplier to businesses in the UK and did recently file an application for a supply license to enter the residential market later on in 2007. They do not own any generation plants. We spoke with tariff and pricing system staff at Bizz Energy that works in the portfolio department and with terms and conditions for pricing.
Energy Retail Association – Russell Hamblin-Boone
The Energy Retail Association, or ERA, was formed in 2003 to become a spokesperson and forum for the leading gas and electricity domestic retailers (the ‘Big Six’) in the UK. They are involved in the regulative debate and in developing industry standards. Russell Hamblin-Boone is head of Corporate Affairs.
energywatch – Carole Pitkeathley
energywatch works as a consumer watchdog for residential energy end users in the UK. Their role is to alert regulators and media of improper activities and behaviour in the market, and to drive the regulative agenda on behalf of the customers. Carole Pitkeathley concern herself with customer service, quality standards as well as prices.
Tullett Prebon – Ian Barber, Andrew Polydor
Tullett Prebon is a broker and thus works as an intermediary in the trading activities of their clients. For example, when a generator suffers a loss in production on a day and need instant (one day) compensation for balancing their supply, they turn to Tullett Prebon and ask them to buy a certain amount of power from any of their accepted counterparties. However, Tullett Prebon does not deal with the retail sector.
Professor Michael Waterson – University of Warwick
Michael Waterson is a professor at the University of Warwick and teaches in Industrial Economics with his research interests being primarily related to competition in regulated industries. Was a co-author to the report “Consumer Choice and Competition Policy”.
Professor Stephen Littlechild – University of Birmingham
Stephen Littlechild is one of the leading experts on energy markets in the UK. He was the first UK director general of electricity supply and head of the Office of Electricity Regulation (OFFER) from 1989-98. Has previously been, among other things, professor of applied economics and of commerce. He is currently an emeritus professor at the University of Birmingham, senior research associate at the Judge Business School, University of Cambridge and consultant on regulation, competition and privatisation.
5.2 SUMMARY OF THE EMPIRICS The most important factor when choosing electricity supplier is price, but it is not the only determinant; service and brand is also of significance. Nearly all switchers choose the dual fuel option, which is necessary for a retailer to offer. There are customers who look for the best choice, primarily via online switching services, which 25 % of switchers use, but most customers respond to active selling from the retailers. UK consumers are now very well aware of alternatives to their supplier, 90 % can name most of the ‘Big Six’. Customers want to be confident in their supplier and are therefore unlikely to deal with a supplier without a well-known brand. People claim to be price-sensitive, and sensitivity did rise along with prices in the last couple of years. Energy and electricity have been relatively cheap and electricity consumption is also rather low, due to the prevalence of gas as the source for heating.
The first years after the deregulation were filled with bad selling practices and hassle when
Empirics
68
changing supplier, although it has improved a lot lately, but it is something that is stuck on the public’s mindset. However, the public still has an inherent belief in the competitive process.
Bundling of products is becoming more common and makes electricity prices more opaque. There is little demand for environmental products and if a niche would grow then big retailers would go in and grab that market. Competition is measured on switching and churn rates, which are high in international comparison, but retailers can still rely on a fair amount of reluctance to switch. Incumbent prices are still very ‘sticky’, which enables Tier2 tariffs to be set at not entirely competitive levels. The Tier1 concept is likely to disappear within 10-15 years, when the new generation of consumers are here.
The market is perceived as to function well and be competitive, and this is also the view of politicians and regulators, who are proud of the UK model. There are substantial entry barriers to the market in the form of brand, capital, sales and service infrastructure. The process to become a supplier is not a barrier in particular, however. Securing supply is always possible even for small retailers but may require a lot of financial assets. The parties involved must go through a long legal process to trade electricity. Traditional household names have strong competitive advantage against independent players. Vertical integration is considered to be necessary for long-term survival, through several commodity cycles. The market could possibly consolidate to four or five suppliers, but would then be on the brink to non-competitive. The ‘Big Six’ seem to follow each other, but everyone tries to compete with Centrica, as they are the dominant player, which also leads price changes. Retailers’ sales strategy is primarily ‘push’ and they mainly compete on price, although they try do differentiate.
Small taxes would just be passed on to consumers. There is a lack of pressure on prices from regulators and politicians, who let the market solve that issue, and their and energywatch’s primary concern is customer service. The industry is not very popular with the public, but has grown to become not as hated as it used to be.
5.3 INDUSTRY LEVEL – COMPETITIVE BUT HARD TO ENTER
5.3.1 CUSTOMERS Price, but also brand, are the most important drivers when choosing supplier
As we interpret the interview material, the respondents say that for the UK electricity customers, price has been the single most important factor when they are choosing alternative. However, according to most of the respondents, price is not the only determinant.99 Centrica states that in 2006 when the price was at its peak, price was most important, but now service, energy efficiency and brand probably are more important. Powergen says that there exist two types of customers, ‘look’ and ‘respond’. The first of the two segments look for better prices, perhaps 99 ERA is the only respondent that says that there really is no other determinant than price, this according to them since the customers do not have a good notion on what to expect from a good supplier except for the prices. ERA mean that in the end, it always comes down to competing on prices.
Empirics
69
due to bad customer experience. They will always choose based on a combination of price and brand, the well-known brand gives them a feeling of security. Brand loyalty and service levels are two important factors that several respondents name.100 Powergen tell us that 25 % of the customers say that service is an important factor, but their own notion is that the real number is probably higher than that. Without a well-known brand, the customer is unlikely to deal with a supplier. Most customers want to be confident in what they are getting according to Powergen, and a brand delivers that. This could have to do with the troublesome history in the early days after the deregulation. According to energywatch, the first years after the deregulation were filled with high levels of disconnections, bad doorstep selling practices and a lot of hassle when changing supplier. They tell us that the situation has improved immensely nowadays, but this seems to have been etched onto the UK society’s mind. As one professor says, people tend to focus on the problematic stories.
When it comes to changing supplier, the respondents talk about two main types of customers that Powergen described as “look” and “respond”. According to npower, most of the switching is of the reactive type and not of a pro-active nature. One of the professors, as many of the respondents, agrees and says that the customers tend to choose the one that approaches them. A contributor to this behaviour could be that the public has an inherent belief in the competitive process, which one professor has observed. People think that they do not have to switch, but their supplier will try to give them the best offer anyway. Centrica say that customers like to be acknowledged. If one has five products with Centrica, one wants to be seen and benefited from that. Energywatch mean that a fair price with a fair service level will keep the customer satisfied and not trigger switching behaviour. npower support this view and think that as long as the customers get a reasonable deal they will not run around looking for alternatives. They mean that it can be shown by that the largest dual-fuel supplier (Centrica) is the most expensive one. SSE, as well as npower, support energywatch’s view on service levels and point out that service is important, but in a negative context. Good service is not a basis for customers to switch, but bad service can trigger it. One of the professors means that apart from the element of convenience, the decision not to switch is also based on not having to change supplier, which is still seen as a hassle. The other professor also addresses this issue. His hypothesis for low switching rates is that people tend to shop around more for products that instigates a re-occurring decision point, which is not the case for electricity (except for the fixed contracts).
Switching in numbers
The respondents point out that there are roughly 50-60 % of the customers that have switched supplier at least once, which one of the professors believes is to the highest degree in the world. The switching from incumbents has gone down a bit. According to him, it seems to have been remarkably constant churn, about 1 % per month since the beginning, but more in 2006. This is a view shared by Powergen, who say that annual industry churn-rates is about 15 % nowadays. The differences in price between Tier1 and Tier2 customers reflect that Tier1 customers pay more than Tier2 customers, and that Tier2 customers are more prone to switch supplier than Tier1 customers. Powergen says that one can get away with higher margins on customers that have not switched, but in ten years that will probably be gone when most customers have switched at least once.
100 Professor Waterson for example tell us that brand loyalty is indicated by that there are some unknown companies that have not succeeded on the market. He further says that there is an element of confusion around the service levels. The customers do not understand the real difference between the supplier and the distributor and blame the retailer for network failures. There has been some particular concern about poor metering and billing, and wrong behaviour by sales representatives.
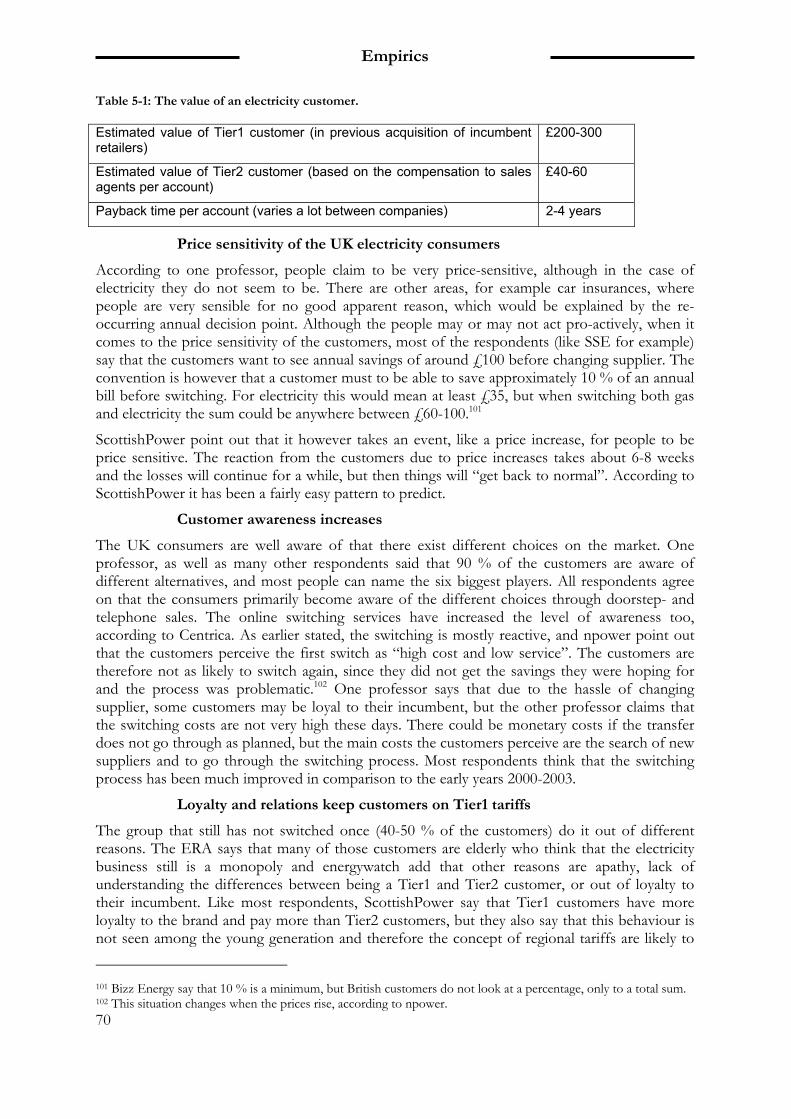
Empirics
70
Table 5-1: The value of an electricity customer.
Estimated value of Tier1 customer (in previous acquisition of incumbent retailers)
£200-300
Estimated value of Tier2 customer (based on the compensation to sales agents per account)
£40-60
Payback time per account (varies a lot between companies) 2-4 years
Price sensitivity of the UK electricity consumers
According to one professor, people claim to be very price-sensitive, although in the case of electricity they do not seem to be. There are other areas, for example car insurances, where people are very sensible for no good apparent reason, which would be explained by the re-occurring annual decision point. Although the people may or may not act pro-actively, when it comes to the price sensitivity of the customers, most of the respondents (like SSE for example) say that the customers want to see annual savings of around £100 before changing supplier. The convention is however that a customer must to be able to save approximately 10 % of an annual bill before switching. For electricity this would mean at least £35, but when switching both gas and electricity the sum could be anywhere between £60-100.101
ScottishPower point out that it however takes an event, like a price increase, for people to be price sensitive. The reaction from the customers due to price increases takes about 6-8 weeks and the losses will continue for a while, but then things will “get back to normal”. According to ScottishPower it has been a fairly easy pattern to predict.
Customer awareness increases
The UK consumers are well aware of that there exist different choices on the market. One professor, as well as many other respondents said that 90 % of the customers are aware of different alternatives, and most people can name the six biggest players. All respondents agree on that the consumers primarily become aware of the different choices through doorstep- and telephone sales. The online switching services have increased the level of awareness too, according to Centrica. As earlier stated, the switching is mostly reactive, and npower point out that the customers perceive the first switch as “high cost and low service”. The customers are therefore not as likely to switch again, since they did not get the savings they were hoping for and the process was problematic.102 One professor says that due to the hassle of changing supplier, some customers may be loyal to their incumbent, but the other professor claims that the switching costs are not very high these days. There could be monetary costs if the transfer does not go through as planned, but the main costs the customers perceive are the search of new suppliers and to go through the switching process. Most respondents think that the switching process has been much improved in comparison to the early years 2000-2003.
Loyalty and relations keep customers on Tier1 tariffs
The group that still has not switched once (40-50 % of the customers) do it out of different reasons. The ERA says that many of those customers are elderly who think that the electricity business still is a monopoly and energywatch add that other reasons are apathy, lack of understanding the differences between being a Tier1 and Tier2 customer, or out of loyalty to their incumbent. Like most respondents, ScottishPower say that Tier1 customers have more loyalty to the brand and pay more than Tier2 customers, but they also say that this behaviour is not seen among the young generation and therefore the concept of regional tariffs are likely to
101 Bizz Energy say that 10 % is a minimum, but British customers do not look at a percentage, only to a total sum. 102 This situation changes when the prices rise, according to npower.
Empirics
71
disappear within 10-15 years. One reason to the high degree of Tier1 customers in especially the north of Scotland is that they were never approached by anyone else but their incumbent supplier, according to energywatch. The ERA explains that retailers do not advertise that their Tier1 customers can get a better deal – if possible. One professor means that all retailers claim to have excellent customer service whether they do or not.
One of the professors concludes that retailers now put more effort in maintaining the relationship with the customer than a few years ago, when they used to take customers for granted, and a reason is that they now realize that customers can buy other things as well as energy.
The significance of home services and bundling
Dual-fuel is the focus for all retailers since it is most cost effective when one is going from door to door and customers value the convenience. There are different opinions on whether customers are really prepared to pay a price premium for bundled products, such as energy, boilers and insurance. 103 One professor’s impression is that home services have not impacted a lot on pricing and that Centrica are the only players in that field. He also thinks that bundling has become more common and made the market more opaque, so the customers’ insight of the actual cost is somewhat obscured. energywatch believe that bundling has caused some price reductions, but not to the extent that they had hoped for.
Centrica mean that customers might like home services since it is not as faceless as the pure energy company, but the best scenario is probably if they never have to contact their supplier at all.
Product development process
The customers are not directly involved in the product development process to a great extent according to the retailers. Some retailers do focus groups and conduct research through customer service. One of the professors says that innovation has been important to maintain loyalty, by providing new charging structures and introducing dual-fuel et cetera.
Customisation and segmentation
Powergen explain that they do not get a lot of customization and believe that it would not be economic to have a huge variety of offerings. It is seen as an opportunity but the cost would also be higher, thus instigating a price premium for the customer. They believe that they should be looking at smaller and smaller segments, and that it might be possible to do this based on customers’ load profiles. SSE are of the notion that there is not enough granularity on the UK market to segment it, and that Ofgem’s research results always show that the switching pattern is the same across the board; by region, social class or age profile.
The ERA concludes that there is no segmentation in the form of budget or luxury brands, but that there is some regional targeting although no region is more prone to be regionally loyal than another. Most respondents do however feel that Scotland have much more local patriotism than the rest of the UK.104 The ERA goes on to explain that it is hard to understand all customers, because it is such a diverse group and that power retailers have some way to go before having the same kind of relationship with the customers as in other industries.
103 According to ScottishPower people are not prepared to pay a price premium for electricity and gas, while Centrica think they do. Centrica would initially bundle the low price electricity offer with the high price gas offer, while Powergen did the other way around. 104 Several retailers do have specific Welsh brands, however. (ERA)
Empirics
72
5.3.2 INTENSITY OF RIVALRY
There were 14 companies at first, but after the shakeout in the deregulation there are now six big brands with more or less the same features. The industry is not going to grow and Centrica think it is actually in decline.105 “There are six actors eating of each other on a market where it’s a push for less consumption.” The retail industry is regarded as a low-margin, high-volume business.106
All respondents make a reference to the high number of switchers as a sign of intense competition, less than half of the consumers are now with their original supplier (more than 60 % switching rate according to Bizz Energy). The ERA suggests that the regulators should not measure the state of competition by switching rates; energy companies have less influence on price nowadays so they should focus less on prices.
You could have short-term or long-term contracts, where you have access to a variety of services. It’s like if you’ve been with a bank for a long time, then you get promotions. But for that to happen, the competition must be less driven on price.107
On the other hand, Bizz Energy and energywatch, who are probably the respondents with the most different perspective than the ‘Big Six’, say that the market is probably not as competitive as most people think and that it thrives due to the small number of competitors. The fact that prices move in unison supports that notion, according to energywatch. “These big players don’t really bother each other, so it is almost like an oligopoly. It is the interest of the big 6 to keep the status quo.”108
One of the professors on the other hand says that the rivalry is more intense than people think. The industry seems to have made quite high margins at times, but some companies were reporting losses in 2006. Retail margins at that time were thin, and the increases in retail price raises lagged behind wholesale prices (and vice versa). The new entrants couldn’t match the prices and got squeezed out; this indicates that the retail market is competitive. According to one of the professors, competition is somewhat muted now. The companies can rely on a fair amount of consumer reluctance to switch. Centrica was very expensive in 2006 but still maintained a worthwhile customer base.
Vertical integration is considered more or less necessary for long-term survival on the market;
105 SSE stand out and think that there are massive opportunities in the national market place, partly due to a re-adjustment towards renewables and energy efficiency. Powergen state an annual growth of 2 % and say that not all of the ‘Big Six’ can win if they stay within just the energy market. 106 According to Bizz Energy the margins are absolutely enormous, but they were then referring to the energy industry as a whole with vertically integrated companies using artificial transfer prices between the generation and supply arm. However, the domestic segment is definitely regarded as having higher margins and being more profitable than the industrial 1MW market, partly since retailers are able to sell more products than just electricity to households. 107 ERA 108 Bizz Energy
Empirics
73
most respondents agree that it is possible, but hard, to compete only in supply. The reason being is that the company can balance out the businesses as the wholesale market goes up and down, and that the daily balancing is hard to handle without own generation. As ScottishPower puts it: “To work as an ‘easy jet’-retailer could work in these times, but when the market swings again you’re in trouble.” However, to be a pure generator is deemed to be entirely feasible. energywatch thinks that the concept of vertical integration creates a feeling of ‘cosiness’ for the power companies. “Profit in supply is not very important to them. They use the supply business so that they can get money off the customers.”109
When it comes to the number of players in the industry and the degree of consolidation, almost all respondents agree that one or two more consolidations at most is possible without regulative intervention. The market is expected to consolidate to 4-5 suppliers, which would be sufficiently competitive according to one professor. He also thinks that 15 retailers on the market would be too many with regards to their fixed costs. 110 It is also subject to who is merging with whom; Centrica could not merge with any of the other five large players since they are already so dominant. Most likely is an acquisition of one of the Scottish companies, but the fact that all available suppliers are so big makes such a purchase extremely expensive. “A single transaction could well happen but it would trigger a reaction from regulators.”111
Different strategies
Our view is that all major retailers are seen as variations on the same concept, with no company establishing themselves as a niche supplier. Centrica say that price and brand are important to differentiate as a supplier, but in the end they are all virtually the same. The attitude among the retailers are that everyone is primarily competing with the market dominant Centrica and try to differentiate from them to various degrees. Centrica are seen as a colossus that the other can benchmark their offerings and prices against, but Centrica do not seem to mind this notion, since they build their brand on tradition and market share. energywatch think that there are no market leaders, but some retailers say that their focus are Centrica and to undercut them in every region. ScottishPower explains that Centrica traditionally has tended to lead any price changes, due to the exposure they have had in their contracts, which has enabled them to respond faster to the wholesale market, but also made them more vulnerable.112 At the moment, Centrica have the highest prices and the worst customer service, which have enabled the aggressive player SSE to steal a million customers from Centrica through very competitive prices and high customer service. Powergen claim that SSE are the most efficient supplier with the best management team, and SSE themselves say that they now have a problem in growing so fast organically. Powergen are also a national brand and EDF are in transition to become one, while npower maintain an image of chasing the big retailers. According to Powergen, ScottishPower actually use the relative weakness of their brand to their advantage and instead use franchisees with stronger identities to acquire customers. “ScottishPower want to be part of the social fabric in Scotland and do an awful lot of work in energy services”113
109 Bizz Energy 110 energywatch say that there is concern about the UK having a series of regional markets rather than a national one. If a few big suppliers would fall out it would not look sufficiently competitive. 111 npower 112 In 2005 Centrica took a gamble that the wholesale price would fall and set their tariffs accordingly. They were proved wrong and lost approximately £100 m over the course of a few months. (ScottishPower) 113 npower
Empirics
74
The traditional sales strategy is and has always been ‘push’, through doorstep and telephone sales. Since customer switching is reactive rather than pro-active, companies work a lot with focusing their sales attention strategically. ScottishPower say that when a retailer increases its prices, all other retailers will increase their sales forces in that retailer’s incumbent area, trying to take advantage of the momentum. A price increase always costs a retailer a lot of accounts and thereby money. Tariff changes are not done on a regular basis; in the past the retailers have adjusted their price perhaps once a year114, although in 2006 it happened many times. Centrica believe that the price difference between suppliers is becoming smaller and smaller, so there is much more need for differentiation, which is probably driving the competition rather than just price. In the end though, everyone agrees that electricity retailers primarily compete on price, although they try to differentiate their offers. According to the ERA it is hard to provide a range of services when a customer so easily can switch thanks to the ‘28-day rule’. “Most customers want to be confident in what they’re getting and a brand delivers that.”115 Apart from price, brand is extremely important, both nationally and locally. Energy is something that the public do not seem to trust anyone to handle; so traditional household names have a strong competitive advantage towards newcomers or brands that are not associated with the industry. Centrica’s residential brand British Gas is a heavyweight and tries to exploit that they are the only real British company, neither European nor Scottish, although in Scotland they are called Scottish Gas. Powergen say that Centrica’s name recognition is important since they are primarily known as a gas supplier and gas is seen as more dangerous than electricity, which is why people feel safer with a strong brand. All respondents say that the most popular way of building brand recognition is through heavy advertising and sponsoring of major sports events, or, as in Powergen’s case, the weather forecast on TV.
However, it is easier to do your brand more damage than good. “Brand can actually work against you”116 Basically, for an industry outsider, there is nothing to gain in brand equity by entering the energy market; it is only possible to not stain your reputation.
The professors think that the ‘Big Six’ follow each other, but that is not certain whether it is because they choose the same strategies or if they just react to the same cost structures. It is suggested that they watch each other but may do similar things for different reasons.
The new entrant, Bizz Energy, elaborates on the ‘Big Six’s strategies and states that because the industrial market is hugely competitive and undesirable due to very demanding and price sensitive customers, the domestic market is much more popular. In the residential segment you have customers who pay high prices and are not eager to switch. 114 One professor says he would not be surprised if some companies would not change their tariffs for three years. 115 Powergen 116 ScottishPower
The 28 day rule states that domestic customersare able to terminate their energy contracts at 28days of notice, regardless of the nature of thesupply contract. In a report by StephenLittlechild, he concludes that in Sweden there isno such rule and therefore more extensive use offixed-price, fixed-term contracts, and that therule is more likely to restrict competition thanenhance it. (Littlechild, 2004)
The Advertising Standards Authority foundCentrica guilty of scare tactics in the autumnof 2005, for adverts that among other thingsclaimed that customers not with British Gaswould lose access to their support services('Walk away from British Gas and wave goodbyeto our engineers’) although this was not correct.(Energy Business Review, 2005)
Empirics
75
The second thing these businesses want is to have an outlet for their production and then they thought they could sell other things as well on one bill. They are locking people in to a package, which from each you can get a small profit.117
We feel that it is a widespread notion that retailers have moved their focus from gaining to retaining customers. When prices are high, retention is the key success factor for retailers, according to energywatch. Vice versa, when prices are low, retailers are keener on acquiring new customers. “Retention has been more important during the last year and it will be interesting to see what happens now when prices are falling.”118 According to Bizz Energy 80 % of the effort is put into retaining customers and 20 % into gaining new ones, although Scottish Power are not familiar with these numbers and think that only a company in a retrenchment phase would allocate their efforts that way. Since customers will not move for less than £65-80 119 in savings per year, it is much easier to keep your customers than to persuade others to switch. It is worth noting that the first switch, away from your incumbent, is easy to motivate since the Tier1 prices are so much higher than Tier2 prices. The real question is then how much you must save in order to switch again, Bizz Energy think that a saving of roughly £40, which is often the case today, is not enough to persuade people to make the switch.
Need for change?
When discussing whether the retail industry has not been functioning, as it should in the past, Centrica mentions the wholesale market in 2006, when spot prices rose much higher than what should have been allowed by the market price. Centrica do believe that the retail market is operated efficiently though, in a robust and mechanistic manner. Most respondents think that the retail market has been competitive and that it is functioning well today, although Powergen mentions switching-related problems before Ofgem in 2003 pushed the retailers to settle down the transfer issues. Today there is supposedly no hassle in transfers, regardless of who the customer is, and switching is now perceived as an easy matter. energywatch thinks that the market works very well for the informed majority, but that there are still those for which the industry has not got their billing and metering together. One of the professors concludes that retail margins seem to be lower than in most EU countries, but that there is a significant ‘stickiness’ in pricing (retail price lagging behind the wholesale price) due to the reluctance to switch.
SSE and Powergen want to see less complexity in the industry rules and want less regulation still, and that the industry rules should not have to go through Ofgem, which is inappropriate for a competitive market. SSE push for a long-term vision where there is only regular consumer and competition protection, as in any other commodity market. Centrica is still thought of as a bit of a nuisance due to their dominance in gas. energywatch mean that service and foremost billing processes must still become a lot better, and that consumers should be given information in order to make decisions.
Bizz Energy stands out and claim that there is no real competition in the industry and that the regulator has no control over the ‘Big Six’, and they think it is down to the customers to become more mobile. They further feel that it is not in the interest of the ‘Big Six’ to have too much competition.
Industry evolving in the future
All respondents agree that the UK retail electricity market has matured a lot since deregulation 117 Bizz Energy 118 energywatch 119 Customers can save about £100 annually for a dual fuel switch, according to SSE, and one professor says as well that his research has shown that customers demand these sums in order to make the switch.
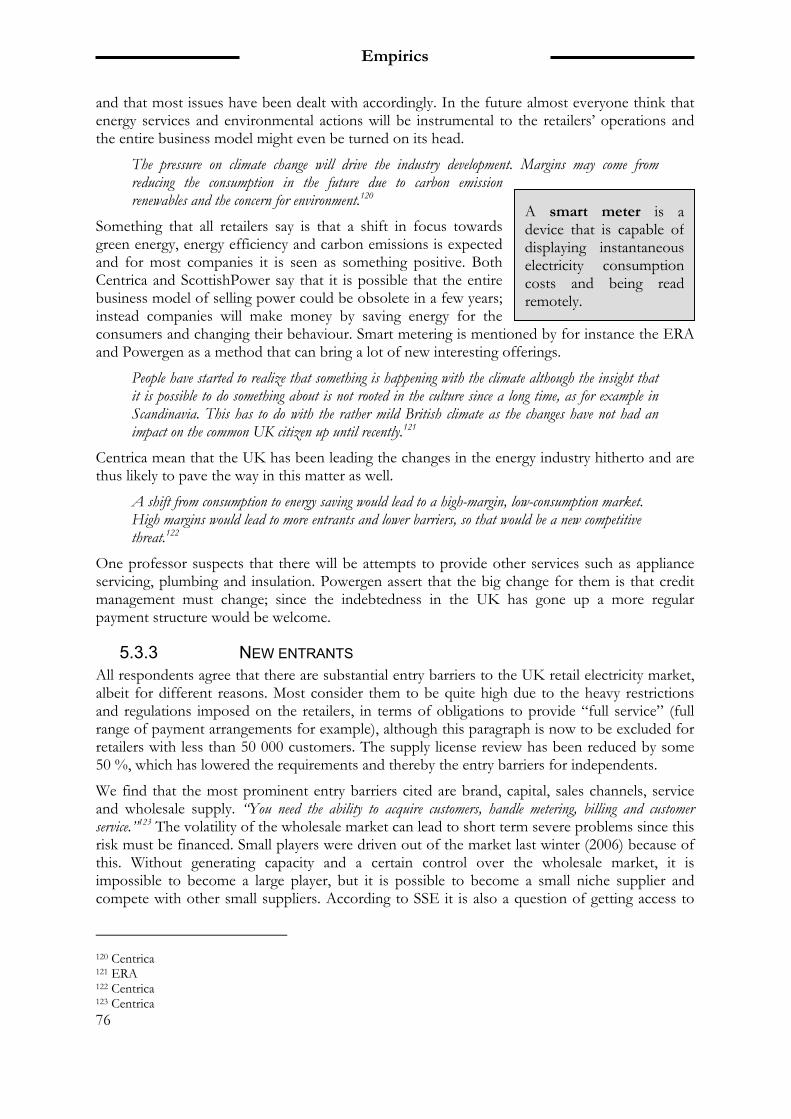
Empirics
76
and that most issues have been dealt with accordingly. In the future almost everyone think that energy services and environmental actions will be instrumental to the retailers’ operations and the entire business model might even be turned on its head.
The pressure on climate change will drive the industry development. Margins may come from reducing the consumption in the future due to carbon emission renewables and the concern for environment.120
Something that all retailers say is that a shift in focus towards green energy, energy efficiency and carbon emissions is expected and for most companies it is seen as something positive. Both Centrica and ScottishPower say that it is possible that the entire business model of selling power could be obsolete in a few years; instead companies will make money by saving energy for the consumers and changing their behaviour. Smart metering is mentioned by for instance the ERA and Powergen as a method that can bring a lot of new interesting offerings.
People have started to realize that something is happening with the climate although the insight that it is possible to do something about is not rooted in the culture since a long time, as for example in Scandinavia. This has to do with the rather mild British climate as the changes have not had an impact on the common UK citizen up until recently.121
Centrica mean that the UK has been leading the changes in the energy industry hitherto and are thus likely to pave the way in this matter as well.
A shift from consumption to energy saving would lead to a high-margin, low-consumption market. High margins would lead to more entrants and lower barriers, so that would be a new competitive threat.122
One professor suspects that there will be attempts to provide other services such as appliance servicing, plumbing and insulation. Powergen assert that the big change for them is that credit management must change; since the indebtedness in the UK has gone up a more regular payment structure would be welcome.
5.3.3 NEW ENTRANTS All respondents agree that there are substantial entry barriers to the UK retail electricity market, albeit for different reasons. Most consider them to be quite high due to the heavy restrictions and regulations imposed on the retailers, in terms of obligations to provide “full service” (full range of payment arrangements for example), although this paragraph is now to be excluded for retailers with less than 50 000 customers. The supply license review has been reduced by some 50 %, which has lowered the requirements and thereby the entry barriers for independents.
We find that the most prominent entry barriers cited are brand, capital, sales channels, service and wholesale supply. “You need the ability to acquire customers, handle metering, billing and customer service.”123 The volatility of the wholesale market can lead to short term severe problems since this risk must be financed. Small players were driven out of the market last winter (2006) because of this. Without generating capacity and a certain control over the wholesale market, it is impossible to become a large player, but it is possible to become a small niche supplier and compete with other small suppliers. According to SSE it is also a question of getting access to
120 Centrica 121 ERA 122 Centrica 123 Centrica
A smart meter is adevice that is capable ofdisplaying instantaneouselectricity consumptioncosts and being readremotely.
Empirics
77
the wholesale market, which takes time, effort and investments. There is plenty of liquidity so hedging your volumes is possible, but would require a lot of financial security, so the barriers are to invest in upfront systems. The punishments for imbalance in the system are severe. It seems to be acceptance in the industry to the need for financial security and the standards used to be unduly harsh for smaller suppliers.
Wholesale prices have been a deterrent to competition, but now when they are falling new customers are very profitable and we see very fierce competition in online marketing, and there is still room for cuts.124
A retailer needs to have a strong brand in order to attract customers, not just a better price. There have been several examples of new entrants with much lower tariffs who have failed to gain market shares. According to one professor, an argument to this assertion is that brand is not at all as important in the business segment, which accordingly has seen a lot of entry from independents. The service element is important not the least because of previous switching problems, which hits smaller suppliers worse than the ‘Big Six’.
energywatch think that the power of the ‘Big Six’ is the main barrier; they already have the customer databases, processes and practices that are so hard to acquire as a small newcomer. They also have the incumbent markets that can act as a cushion for falling retail prices. Unlike new entrants, they will always have a loyal customer base that is paying premium tariffs. Powergen means that you can get hold of the expertise, but that it must be hired.
One could employ consultants or outsource the billing et cetera. This is undesired though, since you are then not in control and these agents may act on their own initiative and damage your reputation.125
Powergen views the entry of established brands, attracting customers solely on name, as a huge threat. One example is Lloyds Bank who makes its customers feel comfortable in that they take care of both money and energy that way. However, according to one of the professors there is very little interest from outsiders of the industry to enter the market, and a deterrent is the failure of big supermarket brands (Virgin and Tesco) in the market a few years ago.
Centrica states that one must have at least a few million customers in order to gain necessary economies of scale.126 One professor suggests that there could actually be advantages for new entrants when putting up a system for their specific customers.
The mere process of becoming a supplier is not seen as a barrier of entry, the market has been designed to encourage new entrants to the market. Proof of this is that independents are much more prevalent in the business segment, where name recognition is not as important as in the domestic. A supplier must meet certain financial requirements to get a supply license, but it is more a question of credibility, to have paid your bills in the past, rather than having huge sums of cash in store. Bizz Energy explains that it is easy to get the license from Ofgem but then there are many other instances that must approve your business and that might well take a year before it is possible to start selling electricity. This process is very costly.
A problem with small retailers in the past has been that they have thought it was possible to “run the operations off a spread sheet” and have had too much risk in their business, and has failed accordingly. The majority of the small suppliers are seen to be in the green department,
124 Powergen 125 Bizz Energy 126 ERA claims there are no customer base thresholds to overcome and that there is evidence that you can survive as an independent supplier. Bizz Energy on the other hand say that there have been 15-20 companies trying to get in over the years, but that they are almost all gone now.
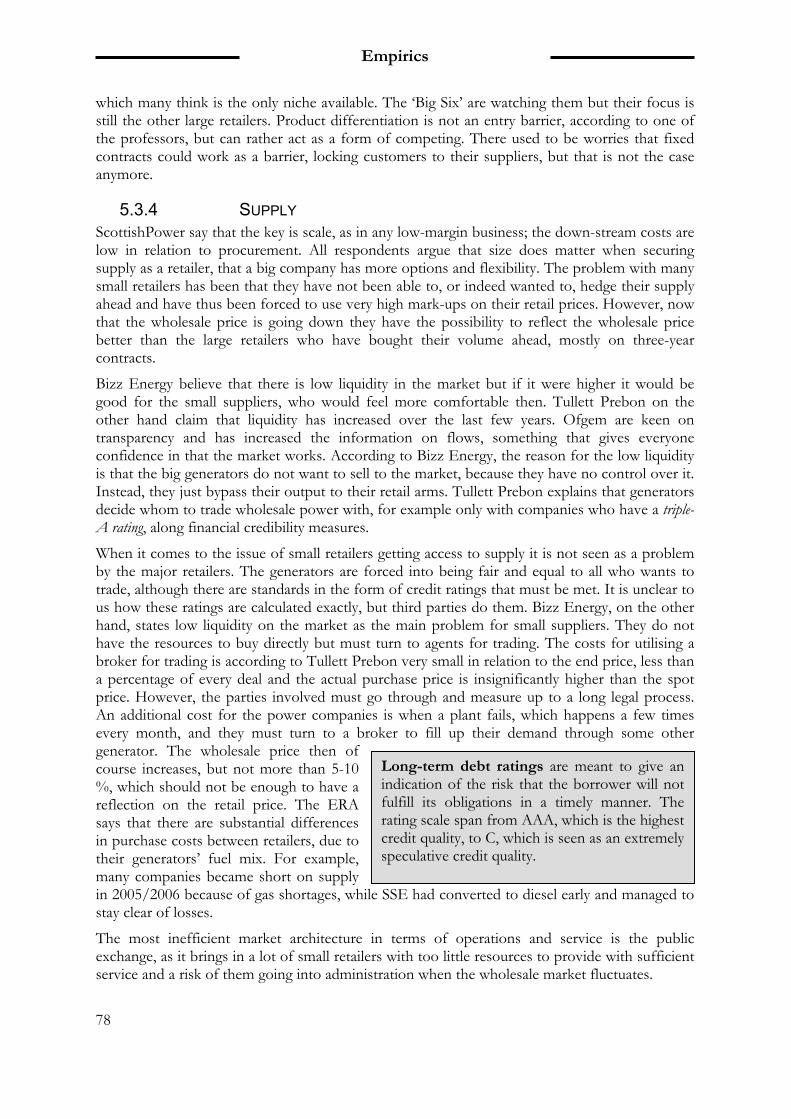
Empirics
78
which many think is the only niche available. The ‘Big Six’ are watching them but their focus is still the other large retailers. Product differentiation is not an entry barrier, according to one of the professors, but can rather act as a form of competing. There used to be worries that fixed contracts could work as a barrier, locking customers to their suppliers, but that is not the case anymore.
5.3.4 SUPPLY ScottishPower say that the key is scale, as in any low-margin business; the down-stream costs are low in relation to procurement. All respondents argue that size does matter when securing supply as a retailer, that a big company has more options and flexibility. The problem with many small retailers has been that they have not been able to, or indeed wanted to, hedge their supply ahead and have thus been forced to use very high mark-ups on their retail prices. However, now that the wholesale price is going down they have the possibility to reflect the wholesale price better than the large retailers who have bought their volume ahead, mostly on three-year contracts.
Bizz Energy believe that there is low liquidity in the market but if it were higher it would be good for the small suppliers, who would feel more comfortable then. Tullett Prebon on the other hand claim that liquidity has increased over the last few years. Ofgem are keen on transparency and has increased the information on flows, something that gives everyone confidence in that the market works. According to Bizz Energy, the reason for the low liquidity is that the big generators do not want to sell to the market, because they have no control over it. Instead, they just bypass their output to their retail arms. Tullett Prebon explains that generators decide whom to trade wholesale power with, for example only with companies who have a triple-A rating, along financial credibility measures.
When it comes to the issue of small retailers getting access to supply it is not seen as a problem by the major retailers. The generators are forced into being fair and equal to all who wants to trade, although there are standards in the form of credit ratings that must be met. It is unclear to us how these ratings are calculated exactly, but third parties do them. Bizz Energy, on the other hand, states low liquidity on the market as the main problem for small suppliers. They do not have the resources to buy directly but must turn to agents for trading. The costs for utilising a broker for trading is according to Tullett Prebon very small in relation to the end price, less than a percentage of every deal and the actual purchase price is insignificantly higher than the spot price. However, the parties involved must go through and measure up to a long legal process. An additional cost for the power companies is when a plant fails, which happens a few times every month, and they must turn to a broker to fill up their demand through some other generator. The wholesale price then of course increases, but not more than 5-10 %, which should not be enough to have a reflection on the retail price. The ERA says that there are substantial differences in purchase costs between retailers, due to their generators’ fuel mix. For example, many companies became short on supply in 2005/2006 because of gas shortages, while SSE had converted to diesel early and managed to stay clear of losses.
The most inefficient market architecture in terms of operations and service is the public exchange, as it brings in a lot of small retailers with too little resources to provide with sufficient service and a risk of them going into administration when the wholesale market fluctuates.
Long-term debt ratings are meant to give anindication of the risk that the borrower will notfulfill its obligations in a timely manner. Therating scale span from AAA, which is the highestcredit quality, to C, which is seen as an extremelyspeculative credit quality.
Empirics
79
If NordPool was changed into a bilateral market all smaller resellers would be hovered up.127
The level of the risk factor that is added to the retail price is about 10-20 % of the wholesale price (7-10 % is also stated), but according to Bizz Energy most big players do not do that at all, since they only buy from their own generation. One professor says that the UK retailers probably use the same mark-up factor and calculation as in Sweden.
5.3.5 (SUBSTITUTES AND) COMPLEMENTORS We conclude that the main complementors in the industry are without a doubt the online switching services and overall most respondents have a positive attitude towards them. Most happy are the retailers with the lowest tariffs and the new entrant, Bizz Energy, while Centrica are not very pleased with them. Centrica view online brokers as a huge threat to their acquisition and retention of customers, and claims that the customers’ price elasticity has been broken and that customer loyalty was higher before. The retailers definitely think that the online switching services have become a force to be reckoned with and that they are in fact retailers in the true sense of the word. Some smaller retailers have not thought it to be economic to join these services since the online brokers charge a fee, but energywatch provides a free of charge switching service on their website.
Most switching services are seen as impartial actors in the media but they do get commission from the suppliers and that is something that has kept the public a bit sceptic to these services. Uswitch are by far the biggest (80 % of the market) online broker. It is estimated that 25 % of all switchers go through these sites and they are seen as very attractive customers in that they have actively sought out their supplier, and are therefore prone to be satisfied and stick to their choice. However, these customers are also likely to be more sensitive to prices and only look to price and perhaps also to brand. According to the ERA it is the retailers themselves who have facilitated the data-flow when customers change supplier, something that was driven by complaints from customers that had had terrible experiences of changing supplier before.
The ERA provides an opportunity for the major retailers to cooperate and prepare collective responses to the media, the government and the public, but there are no suggestions of any form of collusion. In terms of collaboration, SSE has some joint ventures with for instance two Canadian pension funds. One professor thinks that there are possibilities for the retailers to signal their moves in advance, which is a method that can be used for cooperation.
There are also third party agents who own and maintain metering for the retailers, but in the beginning the contractual arrangements were not effective. Many agents work as sales representatives and there have been huge issues in the UK about misbehaviour from these actors. The cost for the sales agent must of course be built into the end-user price and when there have been bad sales practices, the retailers have not been able to get out of the contracts and thus suffered huge costs. The retailers are now seen as having the upper hand in these relations.
Home services
We find that retailers offer a wide variety of extra services, but it varies depending on their strategic view of them. Centrica try to sell as many different products as possible to their customers, while SSE want to stick to their core business and not sell gadgets. Retailers for instance offer maintenance for gas accounts, micro generation and energy efficiency services. SSE are very interested in the latter:
127 Centrica
Empirics
80
We should be selling heat and light, not kWh and therms, as we do for the moment. We could offer a wider range of products that responds to the customers’ entire energy needs, with more complex contracts for boiler maintenance, micro generation, and service packages come opportunities.128
5.4 MACRO ENVIRONMENT
5.4.1 ECONOMIC On the question whether the economic climate in the UK affects the view on electricity prices our respondents unanimously say that up until 2006 it has had little or nothing to do with it for the major part of the consumers. According to ScottishPower this is because energy has been relatively cheap. Consumption has gone up though as a reaction to more gadgets and electrical appliances in the households, which can be traced to the effects of the strong economy – the UK has not seen any recession since the deregulation of the energy industries. However, energywatch tells us that the customer group for which electricity prices always has been very important are the three million that suffers from fuel poverty.
The importance of electricity to the regular household is considered to be noticeable but rather small, although energy (electricity and gas) usually makes up the second biggest expense in the household, around £1000 annually. All such issues must be put in perspective to the remarkable price increases due to the volatile energy markets in 2006, when many customers according to Centrica really felt the electricity costs dig into their pockets. It is important to point out that most people do not refer to gas and electricity as separate products, but see them as just ‘energy’. However, gas is slightly more expensive and as the predominant cost in the energy bill, people are more sensitive to gas than electricity. It is also a more emotive product since it provides heating, which is seen as more of a basic human right.
When asked, most of the respondents believe that a reasonable/modest increase in taxes would not affect the companies’ gross margins at all. The taxes would just be passed on to the customers according to SSE, although an increase in carbon-based taxes would affect some players more than others. One professor suspect that an increase in taxes would reduce the margins and get the companies to push for energy saving products, which would make them sound very responsible. None believe that major tax increases (like an increase from 5 % to 25 %) are likely though. Bizz Energy explains this by that taxes are a politically hugely sensitive question.
5.4.2 ENVIRONMENTAL State of the environment
There has been little or no demand from the public about environmentally friendly products, partly due to that the British climate is fairly mild and that the consumers have not noticed effects of climate changes until recently. There seem to be a state where people profess that they
128 SSE
Empirics
81
care but do little about it. ScottishPower, for instance, feel that the government must do their part to increase the awareness and energy efficiency.
The renewables segment is increasing and the demand for green energy is now greater than the supply available. “Companies such as Tesco and M&S are leading the way for switching to green energy, more than the government.”129
Impact on load profile
“We like to think that we’re very environmentally friendly and aware and that influences our business. Our CEO is passionate on climate change.”130
Several respondents say that smart metering is a new technology that will gradually be phased into the UK households, which allows consumers to measure and see their exact consumption in real time. The government promotes smart meters due to the opportunities of energy savings when the end user understands its consumption better. SSE are involved in a test of the technology and results have been that people’s behaviour actually has changed. However, due to the massive costs of installing this new system on a grand basis, retailers feel results must be absolutely positive before they commit themselves.
5.4.3 POLITICAL Our view is that there is a lack of pressure on energy prices from politicians and regulators, who are more prone to focus on service, security of supply and energy efficiency. Competition is regarded as very good, although further consolidation may provoke serious attention from the competition commission.
Government attitude
The government is rather positive to the industry since their notion (through Ofgem) is that the industry is working and is fiercely competitive. This is according to energywatch largely due to that the intensity of rivalry is based on churn-rates on the UK electricity retail market, and that Ofgem continually has reported high numbers on customer switching. energywatch contributed to the switching in their early days by focusing their energy on that part. Further, energywatch is fairly content with the competitive situation although they think that it could be intensified by yet another huge retailer entering the market with good billing, metering and quality information for the customers. The primary concern of energywatch is customer services, which according to them has been very poor although it has improved significantly over the last few years. The market is now seen as very mature.
We also feel it is important to point out that the government is proud of the UK electricity industry, and sees it more or less as a role model of how a electricity market should be deregulated and structured. This is something that is pointed out by many of the respondents.
Competition regulations
There are different levels of political opinion according to Centrica; the government pushes around the issues of climate, fuel poverty, customer service and market volatility. The EU pushes for automated metering and competition. However, the government will not tell the industry to reduce their prices since it is an open market and competition is regarded as highly prevalent. They understand the need for competition and the importance of prices, but until there is no other route, they will not get involved, according to energywatch. energywatch elaborate on this and explain that the government only will go in with social responsibility when
129 ScottishPower 130 SSE
Empirics
82
the topic gets too hot for them. However, if the politicians did not think that the industry was supplied well, they would instantly take measures to change that situation, Tullett Prebon says.
Influences on regulation
As we interpret the respondents, there is a high level of awareness of the electricity industry among the politicians. For example, Tullett Prebon expressed surprise over how knowledgeable the parliament seems to be on the issue. The ERA says that it is keen on talking to the stakeholders, Ofgem and MP:s. The government and regulators have therefore supported the industry and not put it under pressure since they understand how the market works. The regulators and state officials go through ERA when they want to communicate something to the industry. One of the professors further tells us that the government uses the suppliers as means to an end for working out policies. Any obligations of that kind always involve staff and expertise that the big players have. The retailers agree and think that it is the proper way of doing things, since the industry actors are the ones with deep knowledge about the industry. ScottishPower adds that they, like every other retailer, have to be a political animal.
On the other hand, one important role for energywatch is to be a thorn in the regulator’s side, although they do have things in common with the regulator too. energywatch employ people who work in the House of Lords and with the MP’s. They feel that the current regulative regime believes that the market fixes everything and stay away from regulation as much as possible, although there are areas that need to be heavily regulated. ScottishPower tell us that there are also parties, particularly in Scotland due to the specific economic patriotism, that come out and act as consumer watchdogs. One such example is the Scottish nationalist party.
Environmental protection
The government tries to be a leader of the climate change agenda, and they find that it is much easier to influence a few large energy companies rather than the great public in order to push forward their policies according to ScottisPower. A number of carbon related initiatives are to be implemented in the near future, but as on retailer puts it:
They want to double the carbon reduction target, but then we will triple the costs. 25 % of households will be on the upside of such action and receive subsidies, and 75 % of the customers will lose.131
ScottishPower say that the retailers do seem to think they have a bit of power with respect to this issue, but overall it is a friendly approach in reducing carbon emissions. Heavy reductions will of course be expensive for the retailers, but some think of this as an opportunity. Those with a large share of renewable generation are likely to get competitive advantages in the future. It is already possible to sell wind power as a niche product, however if an independent player were to be successful in this respect, some of the ‘Big Six’ would just go in and grab that market according to Centrica. The problem about the renewables obligation is according to Bizz Energy that there is not enough green energy so the government just push a tax onto the customers. The government has a green agenda but they are also worried about national competitiveness. As Bizz Energy puts it, all the government does is to push prices up and the wind farms in Scotland are a huge waste of money. The government has raised the prices for green energy artificially. On the other hand it has provided opportunities as
131 Powergen
The Renewables Obligation requireslicensed electricity suppliers to source aspecific and annually increasingpercentage of the electricity they supplyfrom renewable sources. The currenttarget is 6.7% for 2006/07 rising to15.4% by 2015/16.
Empirics
83
well, and the big players are major investors in wind farms since it is now possible to make money out of them.
One professor does not believe that the environmental restrictions have affected the supply industry directly, but other levels instead.
5.4.4 PUBLIC OPINION The electricity industry is not particularly popular according to Powergen and this view is supported by many of the respondents. The industry is seen as a big utility that the government can push around, something that the public do not mind. Centrica describe the public opinion as the industry being a ‘necessary evil’ and mean that the public perception of the industry becomes more volatile in correlation with the prices. According to one professor, the opinion has become less and less concerned over the years though. This is according to Powergen partly an effect of that the ERA was set up to speak for the industry on areas where the retailers do not compete. They try to improve the image of the industry, and Powergen also think that the industry is not as hated anymore. energywatch say that they has also had a great impact on the industry and the perception of it. Much thanks to energywatch, the improvement of doorstep selling practices, transfer routines and disconnections have contributed to a more positive public view of the industry, although the ERA thinks that they had a share in this development as well. Not all consumers have strong views on their suppliers and some people do not even know who provides their energy at all. (ScottishPower) Some still thinks it is a monopoly utility according to ERA, but we believe that they obviously are a minority since at least 90 % are aware of alternatives.
The asked respondents all talk about the impact of media when it comes to forming the public opinion. The ERA thinks that there is not enough pressure on the customers to make demands, they leave it all to the media instead. The industry responds if the media pressure gets too high. One example of this, according to one professor, is when the retailers started to improve their service because they were criticized publicly in the media. SSE tell us that the public awareness of green issues is increasing now since it is becoming a big issue in the newspapers. ScottishPower were in Scotland accused of making massive profits, and explain these events by that it is not accepted for a company to be too successful. Instead of being proud of having a company that makes profits (which according to ScottishPower were not as high as publicly stated in the media), the Scotsmen became jealous.
ERA says that they must educate consumers in how wholesale prices affect retail prices, and that this primarily is done via the media. ERA are taking the journalists through their questions on for example prices in a pro-active way, to make them see their case. The ERA feel that there is a lot of media pressure on the industry, as journalists prefer to write about intriguing subjects, such as rising electricity prices instead of underlying factors, such as rising fuel costs. Particularly one story about an elderly couple that died that was connected to poor electricity supply had a huge impact on the industry. This emotive subject initialised a public and political opinion that ended in changes and improvements of the service and security practices of the electricity supply. ERA also says that energywatch contributes to the media pressure by tending to communicate via the media instead of directly with the industry and quietly solve problems. On occasions they have even been prompting issues that the industry has already begun to act upon. According to the ERA this is because energywatch must campaign through newspapers, since they measure themselves on how much exposure they get to justify their existence. energywatch on the other hand means that one of their tasks is to bring problems in the industry to the public’s attention. The two organizations often work with the same issues and goals, but from different perspectives. Therefore it is a lot of disagreement between them on which party to thank for positive outcomes on the issues they both have worked with and found positive
Empirics
84
solutions for. It is safe to say that energywatch and the ERA does not share the same view on most issues.
5.5 OFGEM’S REPORT OFFER NEW INSIGHTS The Office of Gas and Electricity Market is the regulator of the industry and have a very important voice in its development. Their response to our questionnaire arrived at a late stage in the study and offered little new information that has not already been covered, except data about customer behaviour from a study made in 2004. It reveals that price increases is indeed the most important factor when thinking about switching and actually switching, but that very many of those who switch cite ‘approach by sales person’ as the trigger to switch. The reason to switch is to 67 % related to cheaper price, but it is interesting to see that more than a third of switchers do not believe that they have saved money by switching supplier. This question is not presented in such a way that the respondent can make multiple choices or distribute a number of points to the different options. It is therefore only the primary reason for making a switch that show up, and all other underlying factors are lost. In our research, we would have needed to know about secondary factors as well, as service and security seem to be rather important secondary factors. Also, the question ‘reasons to switch’ is put in such a way that the switchers very well may answer based on the product they switched to, and not the product they changed from. Considering that almost 90 % of switchers also have switched to a dual-fuel account, we believe that importance of price is projected on the dual-fuel offering and not the pre-switch electricity account.
The main reason not to switch constituted of two components, satisfaction with the current supplier and that they see no reason to switch. These two components were however merged into one question with no possibility for the respondent to clarify which of the alternatives that applies. A vast majority of consumers however say that they are satisfied with their electricity supplier in another question. Unfortunately we have not been given the data on the following question in the questionnaire, where the consumers are asked to specify on what they are satisfied with. The second biggest reason for not switching supplier is that switching is seen as too much of a hassle.
The awareness of competition is widespread – 97 % of the population know that they can switch supplier. Switching is seen as easy by switchers and is expected to be easy by non-switchers, and most believe or know that their switch will not affect the supply of electricity. However, the question is put so that there is no difference between the ‘Big Six’ and smaller, unknown suppliers. It is therefore not possible to say if the consumers are confident that there is at least one supplier besides their current supplier that will be able to guarantee a secure supply or if it applies to suppliers in general. Ofgem concludes that the market is operating well and almost entirely on price, and that all customer segments can benefit from switching.
5.6 PRICING BEHAVIOUR – REPORT BY PROFESSOR WATERSON A study by Giulietti, Otero & Waterson that looks at the trends in regional pricing after the deregulation, came out in January this year and was apprehended by us after the frame of references had been completed, which is why we cannot use it as a source in our pre-study. It contains a number of interesting findings and conclusions that we are obliged to make the best possible use of, in order to fully penetrate the subject.
It is concluded that no anticompetitive moves have been detected, but that a fully competitive market has yet to emerge. From 1998-2002 consumers’ search costs were falling, while switching costs were rising. Search costs are highly related to the number of firms; as the number declines, it gets easier to search for the best offer. After the abolishment of pricing regulations in 2002 the

Empirics
85
trend was turned on its head, and switching costs sank while search costs rose. After 2002 more and more people had switched and became used to this idea, thus the decline.
The use of online services only rose from 4 to 10 % between 2001 and 2003, despite major increases in Internet connections. According to theory the price dispersion should be reduced thanks to increasing Internet use. Despite this, the authors surprisingly find that incumbent prices are resistant to change, which enables non-incumbents to do business at fairly non-competitive prices. Price dispersion and differences in non-incumbents’ bills have been fairly stable over the past five years, with increasing upwards volatility in 2005-06. The potential savings for consumers in switching have been approximately 10 % for high users (4 950 kWh per year) and 5 % for low users (1 650 kWh per year), since the turn of the century, with some fluctuations along the way.

Empirics
86
Analysis
87
6 ANALYSIS
This chapter will present the analysis made of each factor that was studied and other factors and parameters that were found in the field study. We find that there are factors that enable UK retailers to sustain gross margins that should not be possible on a perfectly competitive market. It is a combination of drivers that over time create a system where good gross margins can be found in retail electricity. There are four encompassing and historical factors that have driven the development of the situation to its current state: the market-friendly socio-culture, a history of problematic electricity deregulation, the linkage between gas and electricity, and the UK trading system. Today it is mainly the dominance of a few retailers who set the agenda that determines the overall price.
Analysis
88
The structure of the analysis will follow the sheet of factors, as in previous chapters, in order to make the content more comprehensible, although the demand side analysis will overlap the customer category completely and degree of competition will naturally be linked to rivalry. The first chapter pieces will focus heavily on the state of the market and will thus to a certain extent be a rehash of the empirics.
6.1 PERCEIVED CUSTOMER VALUE – MORE THAN JUST PRICE
Theory holds that there are possible factors that influence how consumers perceive the value of an offering and that retailers can go about in several ways to meet these criteria, thus instigating a premium price. There is a difference between factors that are related to the customer’s behaviour and those who are part of the offering. Our analysis shows that a set of factors is included in the perceived customer value, but also that the UK consumers’ attitude towards the electricity price is that it has not been of great importance to them. Factors influencing the consumer’s behaviour
Character of influence
Price Has been historically low, thus being of little importance to the regular household
Switching costs Create inertia of Tier1 customers on high tariffs and instigates very high savings for the customer to become triggered to switch only electricity
Reactive customers Will not necessarily switch to the cheapest option
6.1.1 PRICE SENSITIVITY HAS BEEN LOW The higher the share of the household income electricity is, the more sensitive to price the customer gets. A sign that supports this theory is that in the last years’ increase in retail prices, demand elasticity and churn went up substantially. Historically, the electricity price has been quite stable and relatively low compared to the rest of Europe and the days before de-regulation. One must remember that the retail electricity price has still not yet reached the heights of the early 1990’s in real terms, so consumers have definitely benefited from the deregulations. In combination with a rather small consumption and the prevalence of gas as the more costly fuel, electricity prices have not been the only focus for regular energy consumers; electricity has just not been a big share of the households’ expenses. Due to falling wholesale prices and very low taxes, the retail price levels have been fairly low even though the gross margins have been high, which has enabled consumers to value other factors than just price. That is not to say that price is of no importance; on the contrary, customers do claim that price is of great significance and most retailers think that this is true. The point is, that when facing soaring prices in 2006, consumers became much more aware and sensitive to price, which indicates further that they
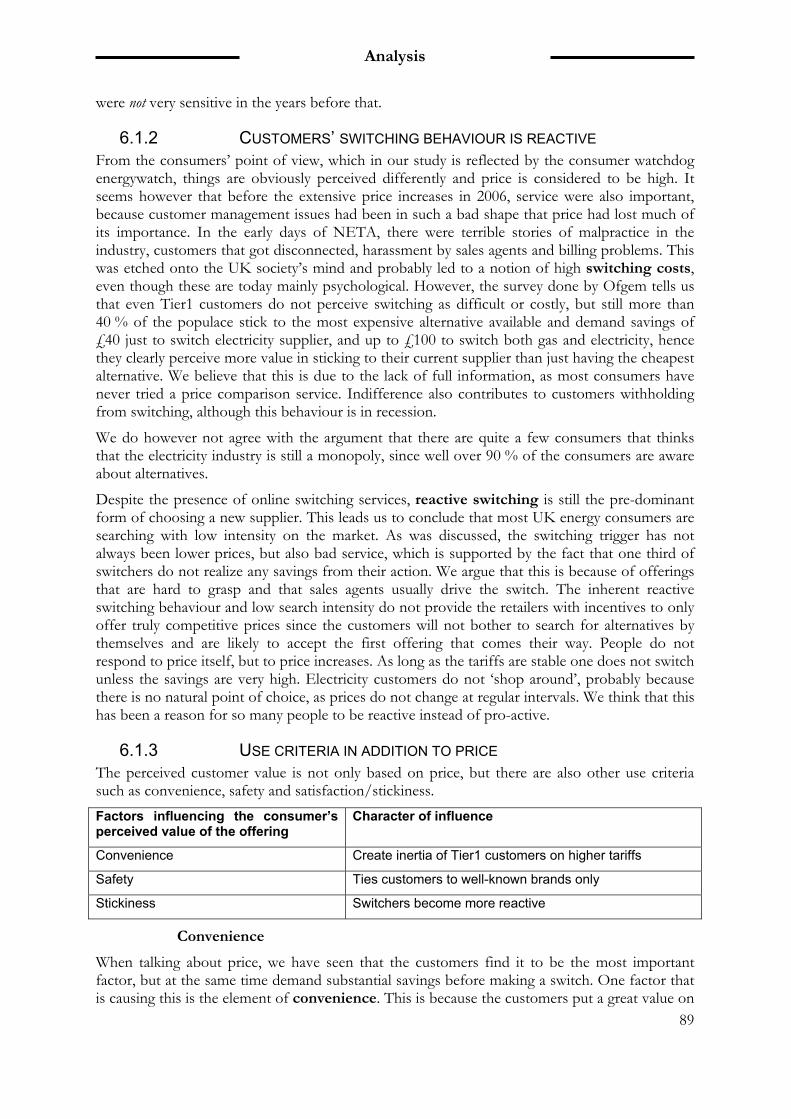
Analysis
89
were not very sensitive in the years before that.
6.1.2 CUSTOMERS’ SWITCHING BEHAVIOUR IS REACTIVE From the consumers’ point of view, which in our study is reflected by the consumer watchdog energywatch, things are obviously perceived differently and price is considered to be high. It seems however that before the extensive price increases in 2006, service were also important, because customer management issues had been in such a bad shape that price had lost much of its importance. In the early days of NETA, there were terrible stories of malpractice in the industry, customers that got disconnected, harassment by sales agents and billing problems. This was etched onto the UK society’s mind and probably led to a notion of high switching costs, even though these are today mainly psychological. However, the survey done by Ofgem tells us that even Tier1 customers do not perceive switching as difficult or costly, but still more than 40 % of the populace stick to the most expensive alternative available and demand savings of £40 just to switch electricity supplier, and up to £100 to switch both gas and electricity, hence they clearly perceive more value in sticking to their current supplier than just having the cheapest alternative. We believe that this is due to the lack of full information, as most consumers have never tried a price comparison service. Indifference also contributes to customers withholding from switching, although this behaviour is in recession.
We do however not agree with the argument that there are quite a few consumers that thinks that the electricity industry is still a monopoly, since well over 90 % of the consumers are aware about alternatives.
Despite the presence of online switching services, reactive switching is still the pre-dominant form of choosing a new supplier. This leads us to conclude that most UK energy consumers are searching with low intensity on the market. As was discussed, the switching trigger has not always been lower prices, but also bad service, which is supported by the fact that one third of switchers do not realize any savings from their action. We argue that this is because of offerings that are hard to grasp and that sales agents usually drive the switch. The inherent reactive switching behaviour and low search intensity do not provide the retailers with incentives to only offer truly competitive prices since the customers will not bother to search for alternatives by themselves and are likely to accept the first offering that comes their way. People do not respond to price itself, but to price increases. As long as the tariffs are stable one does not switch unless the savings are very high. Electricity customers do not ‘shop around’, probably because there is no natural point of choice, as prices do not change at regular intervals. We think that this has been a reason for so many people to be reactive instead of pro-active.
6.1.3 USE CRITERIA IN ADDITION TO PRICE The perceived customer value is not only based on price, but there are also other use criteria such as convenience, safety and satisfaction/stickiness. Factors influencing the consumer’s perceived value of the offering
Character of influence
Convenience Create inertia of Tier1 customers on higher tariffs
Safety Ties customers to well-known brands only
Stickiness Switchers become more reactive
Convenience
When talking about price, we have seen that the customers find it to be the most important factor, but at the same time demand substantial savings before making a switch. One factor that is causing this is the element of convenience. This is because the customers put a great value on
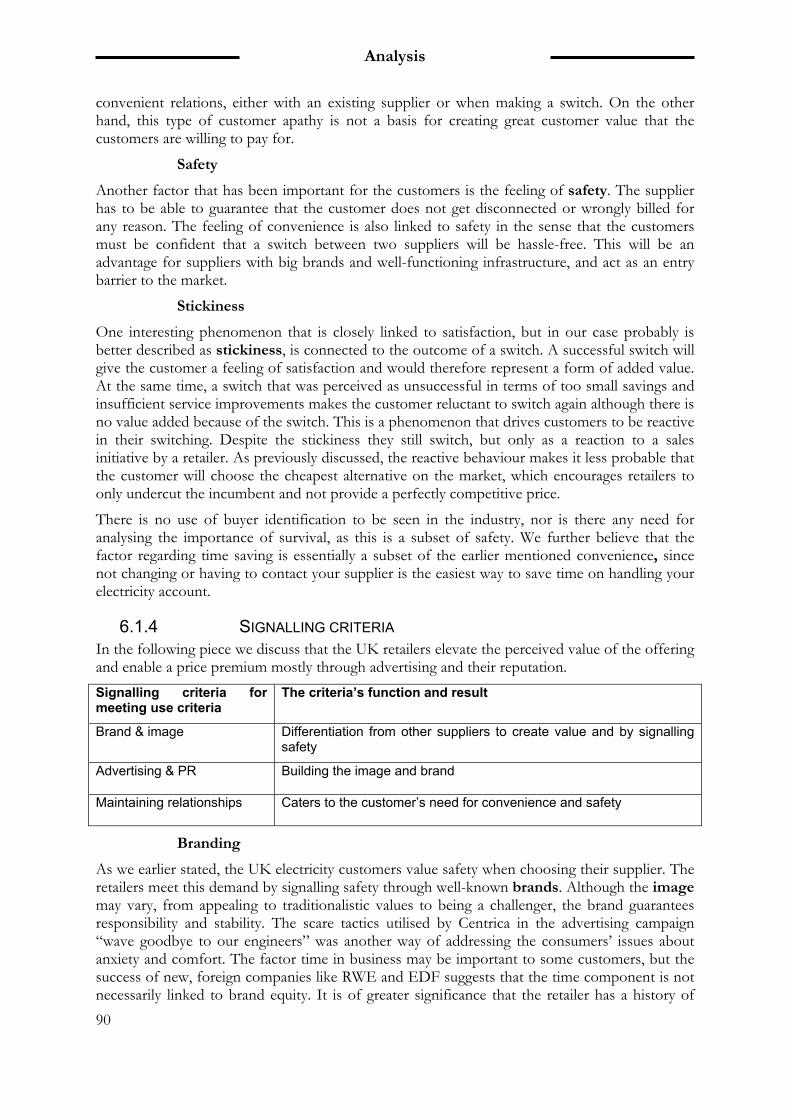
Analysis
90
convenient relations, either with an existing supplier or when making a switch. On the other hand, this type of customer apathy is not a basis for creating great customer value that the customers are willing to pay for.
Safety
Another factor that has been important for the customers is the feeling of safety. The supplier has to be able to guarantee that the customer does not get disconnected or wrongly billed for any reason. The feeling of convenience is also linked to safety in the sense that the customers must be confident that a switch between two suppliers will be hassle-free. This will be an advantage for suppliers with big brands and well-functioning infrastructure, and act as an entry barrier to the market.
Stickiness
One interesting phenomenon that is closely linked to satisfaction, but in our case probably is better described as stickiness, is connected to the outcome of a switch. A successful switch will give the customer a feeling of satisfaction and would therefore represent a form of added value. At the same time, a switch that was perceived as unsuccessful in terms of too small savings and insufficient service improvements makes the customer reluctant to switch again although there is no value added because of the switch. This is a phenomenon that drives customers to be reactive in their switching. Despite the stickiness they still switch, but only as a reaction to a sales initiative by a retailer. As previously discussed, the reactive behaviour makes it less probable that the customer will choose the cheapest alternative on the market, which encourages retailers to only undercut the incumbent and not provide a perfectly competitive price.
There is no use of buyer identification to be seen in the industry, nor is there any need for analysing the importance of survival, as this is a subset of safety. We further believe that the factor regarding time saving is essentially a subset of the earlier mentioned convenience, since not changing or having to contact your supplier is the easiest way to save time on handling your electricity account.
6.1.4 SIGNALLING CRITERIA In the following piece we discuss that the UK retailers elevate the perceived value of the offering and enable a price premium mostly through advertising and their reputation. Signalling criteria for meeting use criteria
The criteria’s function and result
Brand & image Differentiation from other suppliers to create value and by signalling safety
Advertising & PR Building the image and brand
Maintaining relationships Caters to the customer’s need for convenience and safety
Branding
As we earlier stated, the UK electricity customers value safety when choosing their supplier. The retailers meet this demand by signalling safety through well-known brands. Although the image may vary, from appealing to traditionalistic values to being a challenger, the brand guarantees responsibility and stability. The scare tactics utilised by Centrica in the advertising campaign “wave goodbye to our engineers” was another way of addressing the consumers’ issues about anxiety and comfort. The factor time in business may be important to some customers, but the success of new, foreign companies like RWE and EDF suggests that the time component is not necessarily linked to brand equity. It is of greater significance that the retailer has a history of
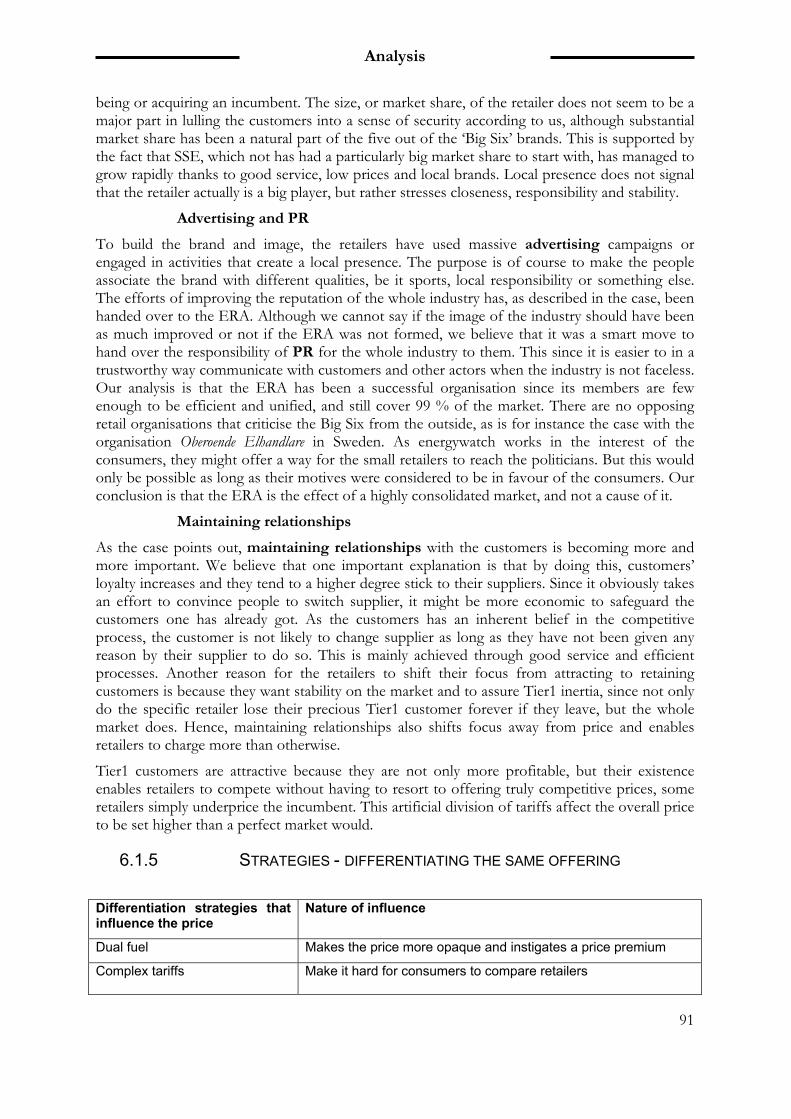
Analysis
91
being or acquiring an incumbent. The size, or market share, of the retailer does not seem to be a major part in lulling the customers into a sense of security according to us, although substantial market share has been a natural part of the five out of the ‘Big Six’ brands. This is supported by the fact that SSE, which not has had a particularly big market share to start with, has managed to grow rapidly thanks to good service, low prices and local brands. Local presence does not signal that the retailer actually is a big player, but rather stresses closeness, responsibility and stability.
Advertising and PR
To build the brand and image, the retailers have used massive advertising campaigns or engaged in activities that create a local presence. The purpose is of course to make the people associate the brand with different qualities, be it sports, local responsibility or something else. The efforts of improving the reputation of the whole industry has, as described in the case, been handed over to the ERA. Although we cannot say if the image of the industry should have been as much improved or not if the ERA was not formed, we believe that it was a smart move to hand over the responsibility of PR for the whole industry to them. This since it is easier to in a trustworthy way communicate with customers and other actors when the industry is not faceless. Our analysis is that the ERA has been a successful organisation since its members are few enough to be efficient and unified, and still cover 99 % of the market. There are no opposing retail organisations that criticise the Big Six from the outside, as is for instance the case with the organisation Oberoende Elhandlare in Sweden. As energywatch works in the interest of the consumers, they might offer a way for the small retailers to reach the politicians. But this would only be possible as long as their motives were considered to be in favour of the consumers. Our conclusion is that the ERA is the effect of a highly consolidated market, and not a cause of it.
Maintaining relationships
As the case points out, maintaining relationships with the customers is becoming more and more important. We believe that one important explanation is that by doing this, customers’ loyalty increases and they tend to a higher degree stick to their suppliers. Since it obviously takes an effort to convince people to switch supplier, it might be more economic to safeguard the customers one has already got. As the customers has an inherent belief in the competitive process, the customer is not likely to change supplier as long as they have not been given any reason by their supplier to do so. This is mainly achieved through good service and efficient processes. Another reason for the retailers to shift their focus from attracting to retaining customers is because they want stability on the market and to assure Tier1 inertia, since not only do the specific retailer lose their precious Tier1 customer forever if they leave, but the whole market does. Hence, maintaining relationships also shifts focus away from price and enables retailers to charge more than otherwise.
Tier1 customers are attractive because they are not only more profitable, but their existence enables retailers to compete without having to resort to offering truly competitive prices, some retailers simply underprice the incumbent. This artificial division of tariffs affect the overall price to be set higher than a perfect market would.
6.1.5 STRATEGIES - DIFFERENTIATING THE SAME OFFERING Differentiation strategies that influence the price
Nature of influence
Dual fuel Makes the price more opaque and instigates a price premium
Complex tariffs Make it hard for consumers to compare retailers
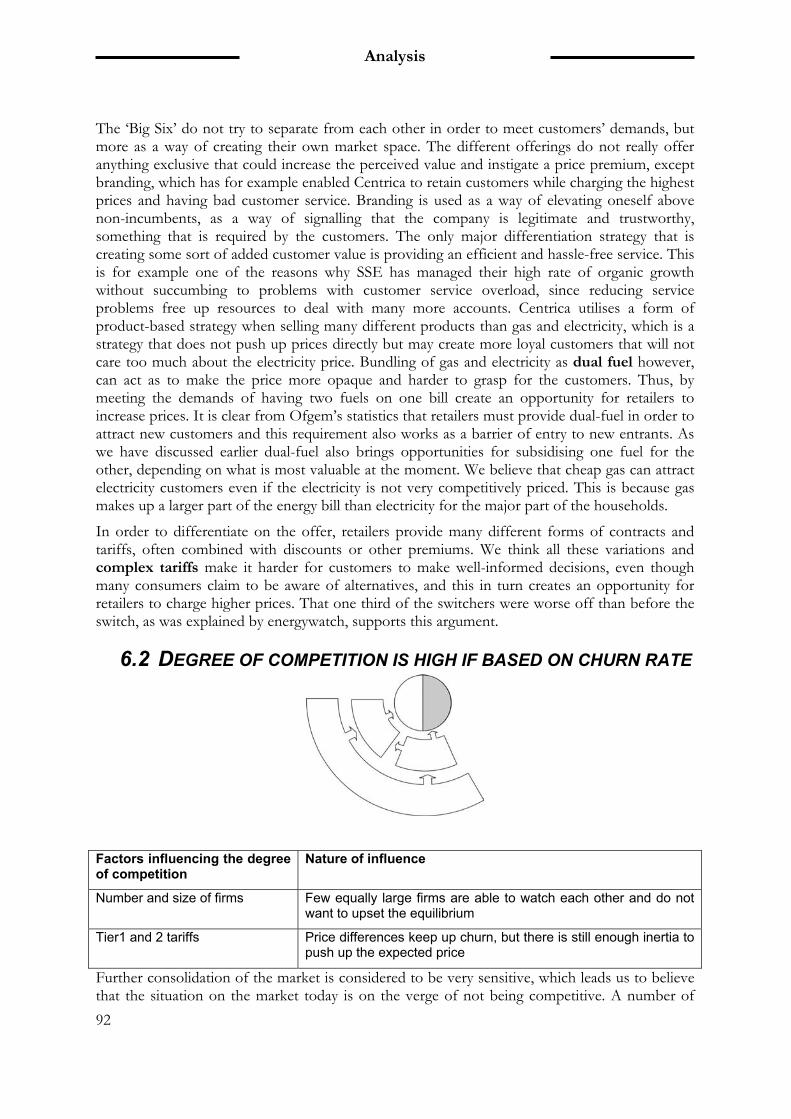
Analysis
92
The ‘Big Six’ do not try to separate from each other in order to meet customers’ demands, but more as a way of creating their own market space. The different offerings do not really offer anything exclusive that could increase the perceived value and instigate a price premium, except branding, which has for example enabled Centrica to retain customers while charging the highest prices and having bad customer service. Branding is used as a way of elevating oneself above non-incumbents, as a way of signalling that the company is legitimate and trustworthy, something that is required by the customers. The only major differentiation strategy that is creating some sort of added customer value is providing an efficient and hassle-free service. This is for example one of the reasons why SSE has managed their high rate of organic growth without succumbing to problems with customer service overload, since reducing service problems free up resources to deal with many more accounts. Centrica utilises a form of product-based strategy when selling many different products than gas and electricity, which is a strategy that does not push up prices directly but may create more loyal customers that will not care too much about the electricity price. Bundling of gas and electricity as dual fuel however, can act as to make the price more opaque and harder to grasp for the customers. Thus, by meeting the demands of having two fuels on one bill create an opportunity for retailers to increase prices. It is clear from Ofgem’s statistics that retailers must provide dual-fuel in order to attract new customers and this requirement also works as a barrier of entry to new entrants. As we have discussed earlier dual-fuel also brings opportunities for subsidising one fuel for the other, depending on what is most valuable at the moment. We believe that cheap gas can attract electricity customers even if the electricity is not very competitively priced. This is because gas makes up a larger part of the energy bill than electricity for the major part of the households.
In order to differentiate on the offer, retailers provide many different forms of contracts and tariffs, often combined with discounts or other premiums. We think all these variations and complex tariffs make it harder for customers to make well-informed decisions, even though many consumers claim to be aware of alternatives, and this in turn creates an opportunity for retailers to charge higher prices. That one third of the switchers were worse off than before the switch, as was explained by energywatch, supports this argument.
6.2 DEGREE OF COMPETITION IS HIGH IF BASED ON CHURN RATE
Factors influencing the degree of competition
Nature of influence
Number and size of firms Few equally large firms are able to watch each other and do not want to upset the equilibrium
Tier1 and 2 tariffs Price differences keep up churn, but there is still enough inertia to push up the expected price
Further consolidation of the market is considered to be very sensitive, which leads us to believe that the situation on the market today is on the verge of not being competitive. A number of
Analysis
93
players have in the past been able to enter with lower prices but have still been forced out of the market. This indicates that the prices are not entirely competitive and is dependent on the small number of firms and the power that they may exert, being of roughly equal size, but also that other components are of significance.
The switching rate and annual churn is undeniably rather high in international comparison and this is an indicator of high competition. This measure on competition is what both the regulators and consumer groups use, and it is reasonable to believe that this largely depends on the positive outcome of the deregulation in terms of prices. That is, electricity prices went down after the deregulation as expected, while the service problems of the past years have contributed to turn the focus of regulators and customers towards that aspect. This has lessened the attention on prices and gross margins, leaving them somewhat hidden in the background.
As discussed, most UK retail electricity consumers are low-intensity searchers and thus the expected price does not depend greatly on the number of firms, as was stated in the report by Janssen. Therefore it would take new entrants and many more well-informed customers before price dispersion decreases and gross margins fall. The price dispersion between suppliers is quite high, as was pointed out in Chapter 1.4.4, which means that there are substantial savings for the customers to make on a product that ought to be a commodity with a price set by the market. This relation gives us reason to believe that the emergence of a new, large retailer will not lower the expected price, but possibly create greater price dispersion.
Up until 2002, incumbents were not even allowed to compete on price while taking advantage of their previous monopoly status; hence we believe that when price regulations were lifted, retailers saw no immediate benefits in reducing their Tier1 prices as most customers were still sticking to them. If the competition was measured on prices, we believe that either the Tier1 arrangements soon would disappear, or that all the remaining customers in the Tier1 segment would have made their first switch far earlier than today’s estimate of ten years. This is because the Tier1 segment would be the first natural target of debate since it is obviously not competitive on prices.
6.3 INDUSTRY LEVEL – HARD TO CHANGE THE GAME
The main factors influencing the retail electricity price and gross margins on the industry level are preserving the status quo, entry & survival barriers and the importance of gas. The nature of the barriers will be thoroughly discussed in 6.3.3.
Analysis
94
Factors on the industry level Nature of influence
Preserving status quo The ‘Big Six’ do not want to start a price war
Entry and survival barriers Keep out new entrants from intensifying price competition
Gas Is connected to electricity; helps to explain price fluctuations and
is twice as costly for households as electricity
6.3.1 RIVALRY – PRESERVING THE STATUS QUO The low number of competitors, that is, the degree of consolidation, provides an opportunity for retailers to keep an eye on each other. According to the theory of Ohmae among others, this is possible without collusion, since no one wants a price war and therefore chooses to move in a herd. One example of this is when retailers publicly announce their tariff changes and facilitate for their competitors to respond in due time, as we could see during our field study in the UK. We have seen this pattern in whereas five retailers primarily try to position themselves against the currently most expensive retailer, Centrica, and undercut them. This creates almost a form of duopoly. The underlying factor is that Centrica received a unique position thanks to their previous gas monopoly and began to offer dual fuel to their huge base of Tier1 customers. Their dominance was secured because of the customers’ need for safety and convenience.
We suggest that this is another example of the power balance; retailers trying to uphold their internal status quo and not upset the rules of the game, but to play it correctly instead. The only shift in power that is desirable is to take market shares from Centrica; power balance does not change from nibbling on rivals of equal size. Since roughly half of all retailers’ customer base are on the profitable Tier1 tariffs, we believe they see no reason to upset the market too much, and that this behaviour is made possible by the high degree of consolidation. The slow growth of the market would in theory intensify rivalry and put a pressure on prices, but in reality it rather gives the retailers more incentives to not disturb the equilibrium.
The point is that there are one or two players (SSE and EDF Energy) that actively have sought out to be the low price retailer, while the others are realising that a price war may occur if they respond in the same way. SSE’s strategy acts as a deterrent towards new entrants since the focus on known brands makes it only possible to compete on price for unknown players. If one is to beat SSE at the price game, gross margins are likely to diminish. As was earlier concluded, if a new entrant would succeed in providing cheaper electricity, it still would not change the expected price on the market, according to the theory of Janssen & Moraga-Gonzalez.
When we in the frame of references said that the price was partly affected by the degree of competition, we were referring to the complete competitive situation. In reality, competition is high if based on churn, but low if based on price. As there obviously are different views on how competition should be measured, we assert that it is better to talk about consolidation of the market instead. This since it is a well-defined measure and we just concluded that it is the element that has enabled the UK electricity retailers to push up prices to a non-competitive level.
6.3.2 SUPPLY – FINANCIAL STABILITY IS REQUIRED As the empirics point out, the notion is that it is always possible to secure supply, but with no own generation one must be prepared to pay premium prices at periods of time. The incumbents therefore reason that it is a requirement to be vertically integrated to become a major retail player. It is further claimed that the bilateral system assures that small retailers do not flood the market, which could easily happen if a public exchange, like NordPool , was used
Analysis
95
instead. We believe that these claims more reflect the solutions most of the incumbents have chosen, and not the root of the problem. Instead, we argue that the underlying issue is financial strength. As the costs to engage intermediaries are negligible, they are not part of the explanation to why the UK market is kept from being flooded by small retailers. On the other hand, suppliers have to be financially credible to be allowed at all to enter into contracts with the generators. It is true that a public exchange handles the risk, but that does not necessarily mean that the supplier have to handle the risk by themselves on all bilateral markets. As was mentioned in the pre-study, Morgan Stanley and the KBC Bank are backing up Electricity 4 Business and provide the financial strength necessary. Although it has not been a widespread way of handling risk, this example shows that such solutions would be possible, and therefore the difference between a bilateral market and a public exchange would not be that big in general.
The question of vertical integration is simply all about being able to survive a full commodity cycle. Since the commodity cycle stretches years into the future it means that one has to have considerable financial strength, and most of the big incumbents do not have this, but instead levels out the overall margin by being vertically integrated. However, Centrica is evidence that shows that one is not required to do like the other big incumbents. Centrica’s downside because of this is of course that they have to accept losses or at least extremely thin margins on occasions, but they manage it by having huge financial assets. Therefore there will be major financial barriers of entry to the market in the start-up phase, as huge financial assets will be needed to either be able to survive a full commodity cycle or to obtain the generating capacity needed.
What is important to point out is that all parties seem to think that the current system is the more suitable since they deem a market with hundreds of players to be inefficient, albeit for different reasons. Suppliers find it convenient since it more or less guarantees that they are not disturbed, thus entry and survival barriers are kept high. Politicians think it is handy to have a handful of retailers that they can control, and they will in other words not try to complicate things for them. The politicians (and suppliers) also believe that service aspects will be suffering on a market with too many suppliers. The reason being is that a highly fragmented market with small independent retailers cannot withhold sufficient service and security levels for their customers, as has been exemplified in the past by small retailers going into administration with customers who are then left alone to manage their situation. As can be seen, this is connected to how one measures competition, and this view put focus on service aspects rather than price aspects. Therefore it is deemed acceptable to have as few retailers as of today, who focus on service issues.
It seems that the calculated risk cost is not much higher than in Sweden and cannot be considered a factor explaining high gross margins.
6.3.3 ENTRY AND SURVIVAL BARRIERS A PLENTY As stated, there have been a number of firms entering the retail market, but all of them have disappeared or work as very small niche suppliers, which indicates that barriers to entry on the market are high. It has been claimed that competition on the market is proven by the fact that new entrants are unable to survive on the market, but based on this reasoning one should probably change the concepts of entry barriers somewhat. The existing entry barriers are inarguably possible to overcome, but once on the market there are instead substantial survival barriers, which work in favour of those already on the market and are not only a consequence of a perfect market, as has been claimed in the field study.
Considering that the political pressure concerns customer service and secure of supply, the ‘Big Six’ earn more by working on increasing barriers of survival and to lock in their customers than to compete fiercely on price. By doing this, they create a sort of secluded island of their own,
Analysis
96
which they can control and operate on. They get away with this since is it is not considered as reducing competition and, as has already been mentioned, price levels have not been high in international comparison. Entry and survival barriers Implications
Financial requirements In order to trade and survive a full commodity cycle, also for setting up necessary infrastructure for customer processes
Knowledge requirements In order to operate the market and customers
Government policy Heavy service requirements and application processes
Brand Must be well-known to customers
Dual fuel Customer requirement, hard to manage
Tier1 accounts Steadily profitable, only available to incumbents
First and foremost it is financial and knowledge requirements that keep new entrants off the market. Retailers need the right infrastructure and a set of core skills in order to be successful and survive, and this is hard to acquire. However, these obstacles are not in any way impossible to overcome and it is not that complicated to start up a supply business, but when on the market, there are a number of other demands, such as extensive service requirements, that must be fulfilled. Government policy is therefore a factor. As was discussed in the previous section, the financial requirements to withstand a full commodity cycle are substantial barriers of survival. Apart from this, one has to be able to meet the customers’ demands, which we have earlier determined to be closely knit to safety. It means that a main barrier of survival is brand; a retailer without brand must compete solely on price, which has been deemed not enough in the past. Big players with established brands in other sectors are reluctant to enter because of the damage bad experiences might incur on the existing brand, as in the example with Virgin, so having a strong brand in another business can also be a deterrent. Another customer requirement, and therefore a barrier of entry, is dual fuel. The still very important sales agents also favour this combination, and its importance acts as another obstacle for smaller suppliers, who find it difficult to manage two energy products.
Another survival barrier are the highly profitable Tier1 accounts that are restricted to the incumbents only. A new retailer could move in on price only, but if this proved to be successful the incumbents could then possibly lower their Tier2 tariffs accordingly and still thrive on the inertia of their Tier1 customer base. The average price would probably have to fall at least temporary until the new entrant is forced out of the market, but the great price dispersion would still exist. Large retailers sometimes ‘block’ regions by hiring almost all existing sales agents in the area. Since personal selling is the dominant switching trigger, it serves as an entry barrier for small retailers, who cannot get access to this very important sales channel.
The small retailers do not constitute as a force to be reckoned with at all as they are too small in terms of market shares. It is unclear what the ambitions of the small retailers are, but it is evident that as soon as they find and create an interesting market the ‘Big Six’ will step in and grab that for themselves. Hence, there are not enough incentives for the small retailer to compete too hard, and they will not be able to have an impact on the market.
6.3.4 SUBSTITUTES & COMPLEMENTORS The only complementors to the industry that we have found to be of interest in this study are the online switching services that help develop more price sensitive customers. Further, gas is neither a substitute, nor a complement to electricity, but there is still great need to discuss and analyse their interrelations.
Analysis
97
Switching services could change the consumers’ behaviour
Our view is that the presence of online switching services such as Uswitch increases not only the possibilities to better informed and more price sensitive customers, but also increases the notion of a market under perfect competition. The common view is that people are focusing more on price and become increasingly aware of the state of the market. Since this was not the case four or five years ago, we have reason to believe that during the main period of our study (2001-2005), knowledge about alternatives and tariff structures was sparse among regular households, and thus helped to keep up prices and gross margins. 25 % of switchers use online services, so there is still some way to go before the demand side could be described as being pro-active. We further think that there are more people who know about these services, but do not use them and see them as proof of their supplier being competitive. Switching services enhance the public’s mindset of the market mechanisms working to their advantage; that the retailers already are doing their utmost to ensure that their customers get the best offer possible.
We have previously asserted that factors are shifting focus away from price; on the major switching websites (Uswitch and energywatch) the customer can arrange the alternatives based on service level and green alternatives as well as price. Since Uswitch only has 6-7 options available and that smaller suppliers do not see the economy in paying the fees to these services, online brokers may cause further inertia around the ‘Big Six’ and make it difficult for outsiders to gain entry. This would of course be a further entry barrier that would hamper competition and pressure on prices. However, our interpretation is that switching services have increased awareness, both to alternatives and to price sensitivity, and it is likely to become even more important and putting a pressure on prices and margins in the future.
Gas is tightly knit to electricity
The outset of this study was to only look at electricity, but we found it to be impossible to overlook the importance of gas in this matter, a fuel that is inseparable from electricity in several ways. The evidence points, once again, at the electricity price as not being of great importance to the UK public and government.
Since gas makes up roughly two-thirds of the regular household’s energy bills it will probably catch the eye of the customers. As has been stated by the respondents, an increase in the electricity price alone will seldom trigger a switch of dual-fuel supplier (which is the most popular form of buying the two fuels), while an increase in gas prices might. In other words, a customer is likely to live with a rather high electricity price as long as it is not in the vicinity of the gas price, a conclusion that is supported by the fact that retailers are often selling dual-fuel with cheap gas and expensive electricity.
Another factor that is connected to gas is that most electricity is produced by gas and naturally the wholesale price is strongly correlated to the gas price. Shortages in the UK’s gas resources and increasing gas prices were the major cause for the increase in electricity prices the past few years. These arguments have been fiercely promoted by the retailers and also by the regulator Ofgem, thus our analysis is that the industry are working hard and succeeding in explaining the root of the price mechanisms and getting the public to acknowledge this as a natural occurrence. The outcome is therefore that retail prices will fall less under public and regulative scrutiny, and can thus remain at levels high enough to enjoy healthy gross margins.
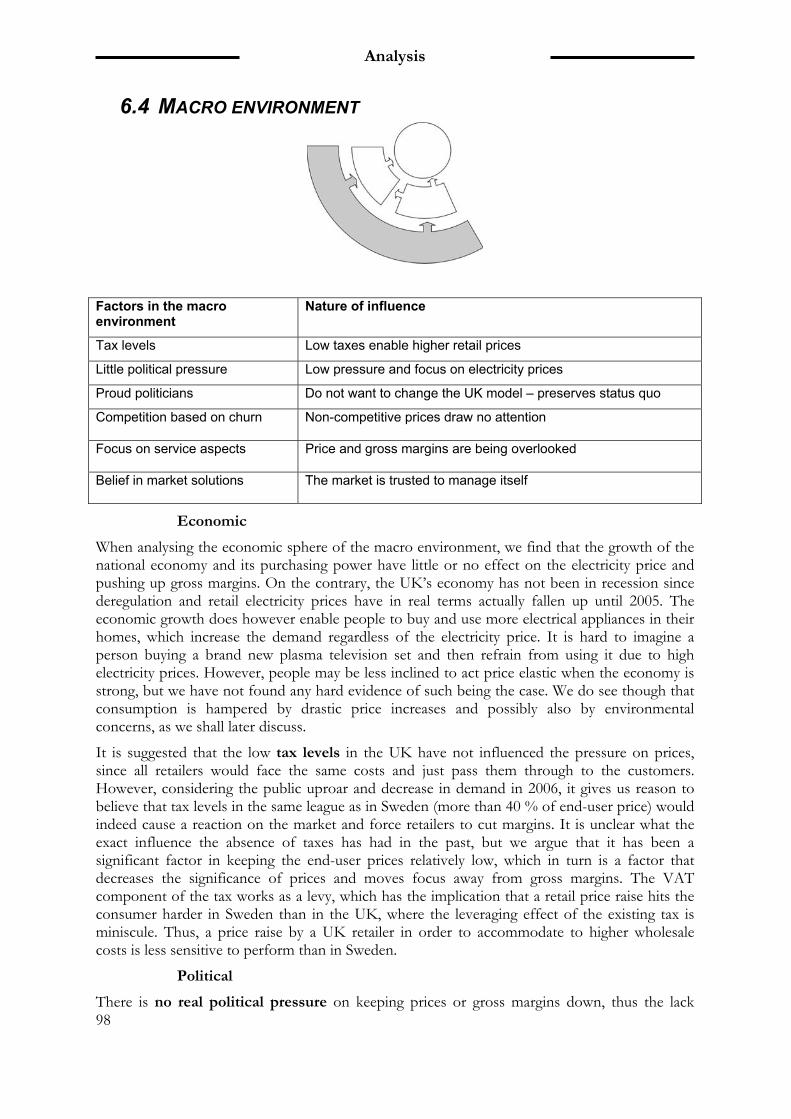
Analysis
98
6.4 MACRO ENVIRONMENT
Factors in the macro environment
Nature of influence
Tax levels Low taxes enable higher retail prices
Little political pressure Low pressure and focus on electricity prices
Proud politicians Do not want to change the UK model – preserves status quo
Competition based on churn Non-competitive prices draw no attention
Focus on service aspects Price and gross margins are being overlooked
Belief in market solutions The market is trusted to manage itself
Economic
When analysing the economic sphere of the macro environment, we find that the growth of the national economy and its purchasing power have little or no effect on the electricity price and pushing up gross margins. On the contrary, the UK’s economy has not been in recession since deregulation and retail electricity prices have in real terms actually fallen up until 2005. The economic growth does however enable people to buy and use more electrical appliances in their homes, which increase the demand regardless of the electricity price. It is hard to imagine a person buying a brand new plasma television set and then refrain from using it due to high electricity prices. However, people may be less inclined to act price elastic when the economy is strong, but we have not found any hard evidence of such being the case. We do see though that consumption is hampered by drastic price increases and possibly also by environmental concerns, as we shall later discuss.
It is suggested that the low tax levels in the UK have not influenced the pressure on prices, since all retailers would face the same costs and just pass them through to the customers. However, considering the public uproar and decrease in demand in 2006, it gives us reason to believe that tax levels in the same league as in Sweden (more than 40 % of end-user price) would indeed cause a reaction on the market and force retailers to cut margins. It is unclear what the exact influence the absence of taxes has had in the past, but we argue that it has been a significant factor in keeping the end-user prices relatively low, which in turn is a factor that decreases the significance of prices and moves focus away from gross margins. The VAT component of the tax works as a levy, which has the implication that a retail price raise hits the consumer harder in Sweden than in the UK, where the leveraging effect of the existing tax is miniscule. Thus, a price raise by a UK retailer in order to accommodate to higher wholesale costs is less sensitive to perform than in Sweden.
Political
There is no real political pressure on keeping prices or gross margins down, thus the lack
Analysis
99
thereof could be seen as a factor that helps sustaining them. We found that there is an attitude from government and regulators that is very forgiving and that breathes a feeling of fulfilment and proudness over the UK being a role model for other power industries to come. The composed picture of the response from Ofgem and the case shows that Ofgem vividly defend the industry from accusations of being uncompetitive in any respect. We have already analysed the competitive situation, but Ofgem’s view on competition is interesting from another respect. They declare that the market is operating well and almost entirely on price, and that all customer segments can benefit from switching. We question this assumption since our opinion is that the switching would be much more intense, and that today’s price dispersion on the market would not be possible in that case. A factor influencing Ofgem’s view of the situation is probably the industry taking measures to educate the politicians on the subject.
One also gets the feeling that politicians are not in full control of the industry; since it is liberalised, the major market players must be able to freely work and combined with their complete market dominance they exert a great deal of power over events and developments. We have not been able to extract any evidence of the industry having any substantial influence on the regulative agenda that could affect prices; on the contrary they try to ease up on the supply license demands through the ERA. However, the small retailers’ opinions risk getting lost to the politicians since they primarily communicate through the ERA when possible, and small retailers are not allowed in the ERA. This should facilitate for the ‘Big Six’ to only push for their opinions and somewhat block the smaller retailers from the political discussion.
The competition review, and therefore also the regulations, is based on churn rate and not price or gross margins, with the argument that if firms swap customers, then rivalry is intense. Further, there has been and is a focus on making the system function smoothly and efficient, and to secure the supply of power to the nation. The concern for fuel poverty and the solution to this are not directly associated with price reductions over all, but rather to energy efficiency and subsidies. We argue that the sharpening of competition and entry barrier regulations have not been triggered by the high degree of consolidation as it would have, had the competition been based on price rather than churn.
Environmental
Most political pressure is exercised on environmental and climate change issues, which is definitely a high-profile question in the UK at the moment. However, it is actually the industry and the largest corporations in the UK that has led much of the developments, such as increasing the demand on green energy.
Most retailers are aware of that energy efficiency and services will be core functions in the future and try to adjust their business models pre-emptively. The load profile over the year does not directly influence the view on electricity prices, since most people receive their bill based on expected consumption and hence do not see the immediate effects of their consumption. Since heating is the only real season-correlated activity and is not fuelled by electricity, the natural environment does not to a great extent affect the electricity price. The future introduction of smart metering could possibly alter this scenario.
Socio-culture
We have learnt that the public opinion views the energy industry as a necessary evil, however this is based on other factors than price, as has already been stated. The media direct the main share of consumers’ power, an occurrence which energywatch are eager to exploit. energywatch, through the media, are keen on focusing on negative and populist aspects, rather than the underlying factors, which may add to the negative view of the industry. The main focus has been bad service with specific “horror stories” and this has probably led to the price being
Analysis
100
over-looked. Therefore, prices and gross margins cannot be said to have been directly influenced by the public opinion. This situation has though led to that the retailers must focus on having a trust-worthy and primarily well-known brand. This links back as to being an entry barrier that limits competition and pushes prices upwards.
An interesting finding is that some customers seem to think that their supplier always will give them the best possible offer, in accordance to the power of the free market, which indicates an inherent belief in the market solution among the populace. Together with ongoing education and information from the industry affiliaties, this could be an underlying driver of the politicians’ and the regulator’s attitude towards the electricity market and its structure.
Since the general public in the UK has not been all too aware of any changes in the environment or climate, they have not been awfully worried about it. Thus there is no developed public opinion around environmental issues that has in any sense influenced retail electricity prices.
6.5 THE ANALYSIS MODEL REVISITED Before we move on to the conclusions of the analysis our findings are visualised by filling out the model that has been used as a road map for the analysis. As can be seen in Figure 6.1, not all factors and characteristics from the analysis are included, as we do not believe that all drivers are of equal importance and could be transferred directly to the model in such way that it would be easy to interpret. Instead, we try to present a summary of the factors from the analysis that describes the characteristics of each component of the model. Perceived customer value has been revised, since the customer’s behaviour has more explanatory value to why price and gross margins can be sustained when observing the relation between retailer and consumer, than the properties of the offering. From the discussion in 6.3.1 on how to view the degree of competition the insight emerges that it is really a question of degree of consolidation. Thus, the properties of this aspect is laid out in the final analysis model as ‘few large players’.
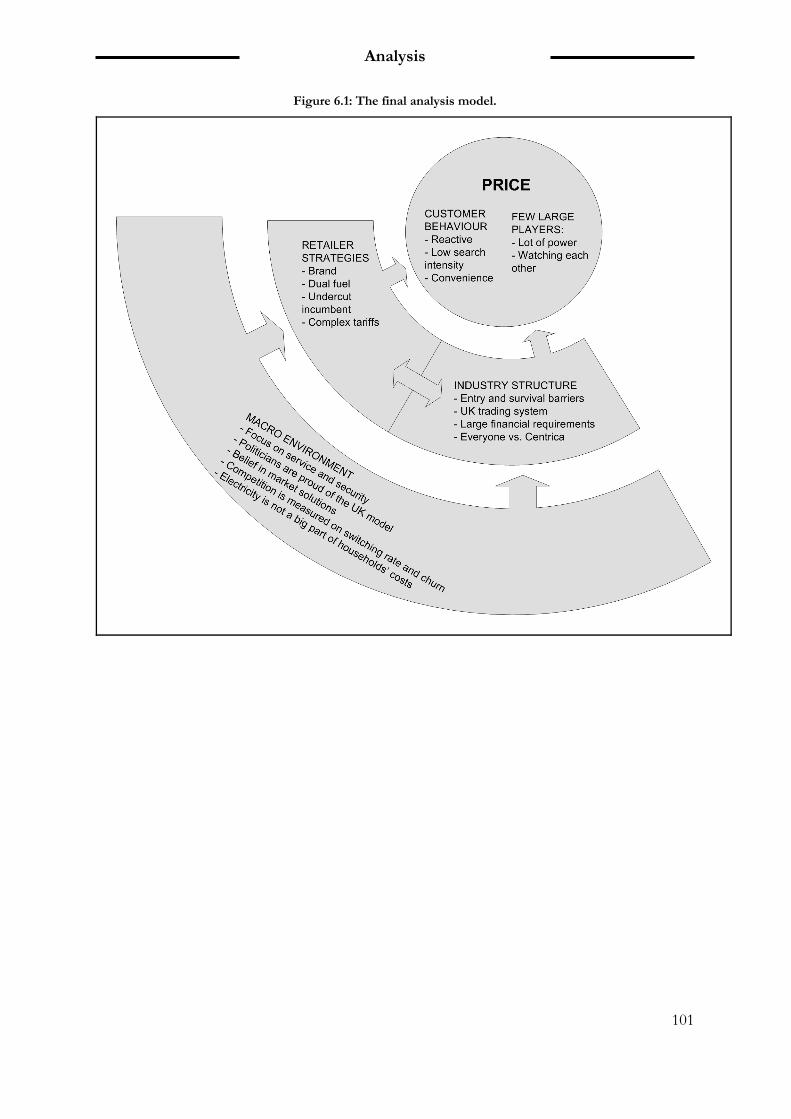
Analysis
101
Figure 6.1: The final analysis model.

Analysis
102
Conclusions
103
7 CONCLUSIONS
In this final chapter we present our conclusions of our research. We conclude that a market-friendly mentality, the deregulation history, the linkage between gas and electricity and the characteristics of the UK trading system are the underlying key drivers of the current state of the market. More to the point, high gross margins are possible due to a highly consolidated market.
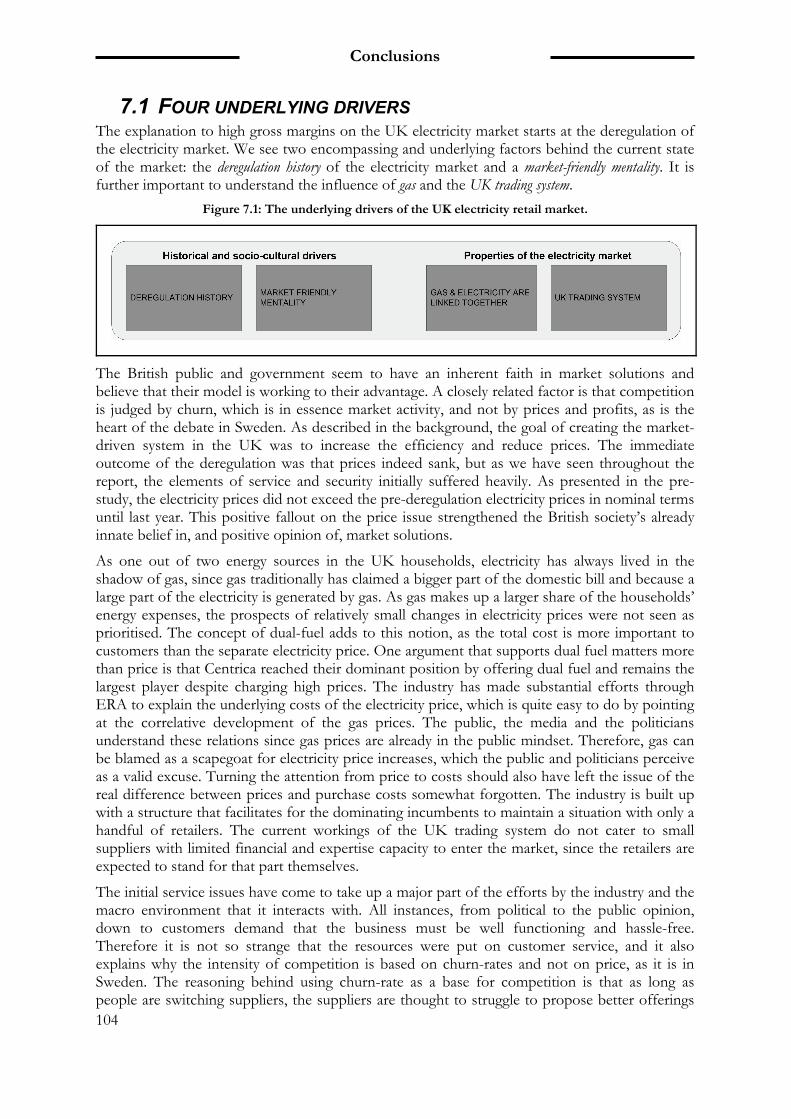
Conclusions
104
7.1 FOUR UNDERLYING DRIVERS The explanation to high gross margins on the UK electricity market starts at the deregulation of the electricity market. We see two encompassing and underlying factors behind the current state of the market: the deregulation history of the electricity market and a market-friendly mentality. It is further important to understand the influence of gas and the UK trading system.
Figure 7.1: The underlying drivers of the UK electricity retail market.
The British public and government seem to have an inherent faith in market solutions and believe that their model is working to their advantage. A closely related factor is that competition is judged by churn, which is in essence market activity, and not by prices and profits, as is the heart of the debate in Sweden. As described in the background, the goal of creating the market-driven system in the UK was to increase the efficiency and reduce prices. The immediate outcome of the deregulation was that prices indeed sank, but as we have seen throughout the report, the elements of service and security initially suffered heavily. As presented in the pre-study, the electricity prices did not exceed the pre-deregulation electricity prices in nominal terms until last year. This positive fallout on the price issue strengthened the British society’s already innate belief in, and positive opinion of, market solutions.
As one out of two energy sources in the UK households, electricity has always lived in the shadow of gas, since gas traditionally has claimed a bigger part of the domestic bill and because a large part of the electricity is generated by gas. As gas makes up a larger share of the households’ energy expenses, the prospects of relatively small changes in electricity prices were not seen as prioritised. The concept of dual-fuel adds to this notion, as the total cost is more important to customers than the separate electricity price. One argument that supports dual fuel matters more than price is that Centrica reached their dominant position by offering dual fuel and remains the largest player despite charging high prices. The industry has made substantial efforts through ERA to explain the underlying costs of the electricity price, which is quite easy to do by pointing at the correlative development of the gas prices. The public, the media and the politicians understand these relations since gas prices are already in the public mindset. Therefore, gas can be blamed as a scapegoat for electricity price increases, which the public and politicians perceive as a valid excuse. Turning the attention from price to costs should also have left the issue of the real difference between prices and purchase costs somewhat forgotten. The industry is built up with a structure that facilitates for the dominating incumbents to maintain a situation with only a handful of retailers. The current workings of the UK trading system do not cater to small suppliers with limited financial and expertise capacity to enter the market, since the retailers are expected to stand for that part themselves.
The initial service issues have come to take up a major part of the efforts by the industry and the macro environment that it interacts with. All instances, from political to the public opinion, down to customers demand that the business must be well functioning and hassle-free. Therefore it is not so strange that the resources were put on customer service, and it also explains why the intensity of competition is based on churn-rates and not on price, as it is in Sweden. The reasoning behind using churn-rate as a base for competition is that as long as people are switching suppliers, the suppliers are thought to struggle to propose better offerings
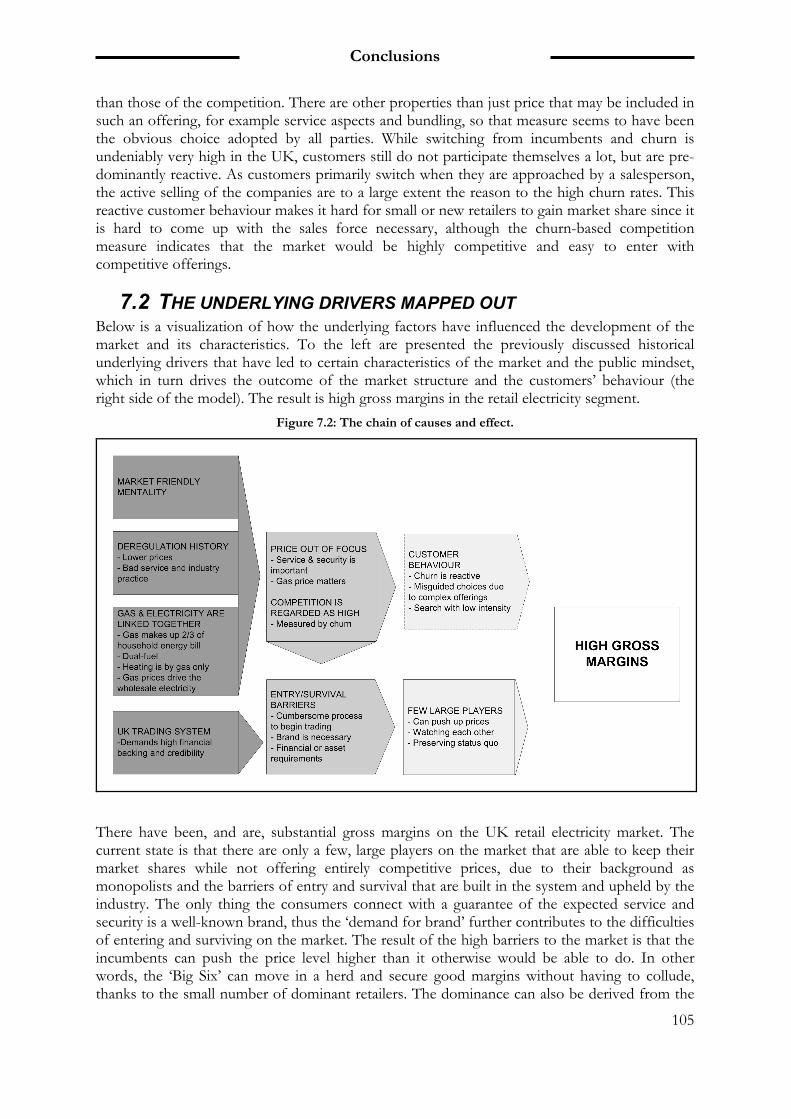
Conclusions
105
than those of the competition. There are other properties than just price that may be included in such an offering, for example service aspects and bundling, so that measure seems to have been the obvious choice adopted by all parties. While switching from incumbents and churn is undeniably very high in the UK, customers still do not participate themselves a lot, but are pre-dominantly reactive. As customers primarily switch when they are approached by a salesperson, the active selling of the companies are to a large extent the reason to the high churn rates. This reactive customer behaviour makes it hard for small or new retailers to gain market share since it is hard to come up with the sales force necessary, although the churn-based competition measure indicates that the market would be highly competitive and easy to enter with competitive offerings.
7.2 THE UNDERLYING DRIVERS MAPPED OUT Below is a visualization of how the underlying factors have influenced the development of the market and its characteristics. To the left are presented the previously discussed historical underlying drivers that have led to certain characteristics of the market and the public mindset, which in turn drives the outcome of the market structure and the customers’ behaviour (the right side of the model). The result is high gross margins in the retail electricity segment.
Figure 7.2: The chain of causes and effect.
There have been, and are, substantial gross margins on the UK retail electricity market. The current state is that there are only a few, large players on the market that are able to keep their market shares while not offering entirely competitive prices, due to their background as monopolists and the barriers of entry and survival that are built in the system and upheld by the industry. The only thing the consumers connect with a guarantee of the expected service and security is a well-known brand, thus the ‘demand for brand’ further contributes to the difficulties of entering and surviving on the market. The result of the high barriers to the market is that the incumbents can push the price level higher than it otherwise would be able to do. In other words, the ‘Big Six’ can move in a herd and secure good margins without having to collude, thanks to the small number of dominant retailers. The dominance can also be derived from the
Conclusions
106
inertia of Tier1 customers, which allow the retailers to profit on this segment while seemingly competing for the Tier2 market at price levels that are not the product of a perfect market situation.
Until SSE focused on offering products with the best service and lowest price of all participants, everyone’s target had been Centrica and thus no price war has been instigated. It has been sufficient to rely on brand and offer a slightly cheaper product than Centrica, and the moves of SSE are evidence that the other ‘Big Six’ have created the high churn-rate through not entirely competitive offerings. The government also find that it is quite convenient to use the industry to their intents, and rather let a few suppliers carry out their agenda than having to affect the whole public. This further stabilises and preserves the situation, and contributes to sustaining high margins in the retail segment. The retailers are further considered to need a rather high customer base to be effective and able to provide reasonable service levels, which is why politicians prefer the current model to a scattered low-price market, such as Sweden.
The reason why UK consumers do not put more pressure on the industry to cut their tariffs is that electricity prices have not been of great importance to UK households since deregulation and have not been the focus of public discussion. High consolidation enables retailers to merely watch each other’s moves and strive, consciously or not, to preserve the status quo. Through high entry and survival barriers they are able to restrict outsiders from changing the rules of the game. The main reason for being almost no other competitors than the ‘Big Six’ is that the trading system has been difficult to enter, as there are so many instances to pass before setting up a business and that one must have core knowledge of the industry. These obstacles can be overcome, but to survive in the industry one must have a well-known brand and the means to stay put through a full commodity cycle, be it financial backing or vertical integration.
However, we think that in the future, information will be better and more widespread, and customers will search with higher intensity and force retailers to accommodate to this behaviour. Tier1 is likely to disappear and we believe that in such a scenario a few new entrants can make a difference to the expected price level, as there would be no premium prices to undercut and consumers would per default choose the cheapest, or otherwise best, alternative of all available options. One should bear in mind that this is largely dependent on the continuation of the current market model and it will be interesting to see what other business models the future of the UK retail electricity industry holds. On the other hand, if the Tier1 arrangements should be abolished during the studied period of time, we have shown that the situation on the market still would not be fully competitive from a price perspective. This is because the consolidation has secured the ‘Big Six’ power and control over the residential market and thus enabled them to push price levels higher than otherwise would be possible.

Future research
107
8 FUTURE RESEARCH
During our work, a number of questions have arisen that would be interesting to investigate further. Some issues deal with the UK electricity market, but we have also found a few potential subjects for future academic research.
Future research
108
8.1 THE UK MARKET As we have discussed in the report, because of reasons beyond our control we were not able to fully explain how the service & security elements have an impact on the retail price although we concluded that they do. It would be interesting to investigate whether service & security only have contributed to the barriers of entry or if they also directly are important contributors that build up the customer’s perceived value.
In this study, we assumed that the wholesale costs were equal for all retailers. This is something that is not entirely correct; above all since Centrica’s hedging conditions differ considerably from the other retailers. Further, we have also found indications on that the distribution of margins in the value chain may vary quite a lot from the Scandinavian electricity market, which was the benchmark that initialised this study. It would therefore be interesting to investigate the total net and gross margins of the whole industry and see if they differ significantly from each other.
It would also be interesting to study the effects of the online switching services over time. As increasing numbers of consumers use the online switching services, we would like to know how the industry reacts to this change in customer behaviour. First of all one must study which dimensions are important when making a switch through the services. If the switch is based on price, we would like to know how the retailers respond to this. If the consumers’ price sensitivity increases one would like to know whether the expected price and price dispersion is reduced. If the price levels were not reduced, this would indicate competitive imperfection.
8.2 FURTHER SUBJECTS FOR ACADEMIC RESEARCH In this report we have struggled to explain the relationship between gas and electricity, which not has been easy since we have found no theory that satisfactory applies to such a relation. They are neither substitutes, nor complements, but still there is a correlative relation between them. Therefore we argue that this type of relation between such products and services should be investigated and explained.
It is quite obvious that the notion of what competition actually is differ. Our starting point was that a highly competitive market could not exist if the market power was concentrated to a few actors. This could have led to some confusion where we spoke in terms of low competition almost as an equivalent to high consolidation or few actors. What we would like to see is an investigation that provides guidelines on the types of measures for studying the degree of competition that are appropriate depending on the situation, and if there is any universal measure that successfully can be applied to any kind of situation.

Reflections
109
9 REFLECTIONS
During the research, we have gotten new insights and encountered information that is connected to the subject of the study. Although we have learnt much and raised many questions that are not necessary to present in order to answer the purpose of this study, there are still a few of these issues we especially would like to make reflections on. Those issues are presented in this chapter and will hopefully provide insights for the reader that highlight important areas to consider in relation to underlying drivers on any electricity market, that this report does not cover.
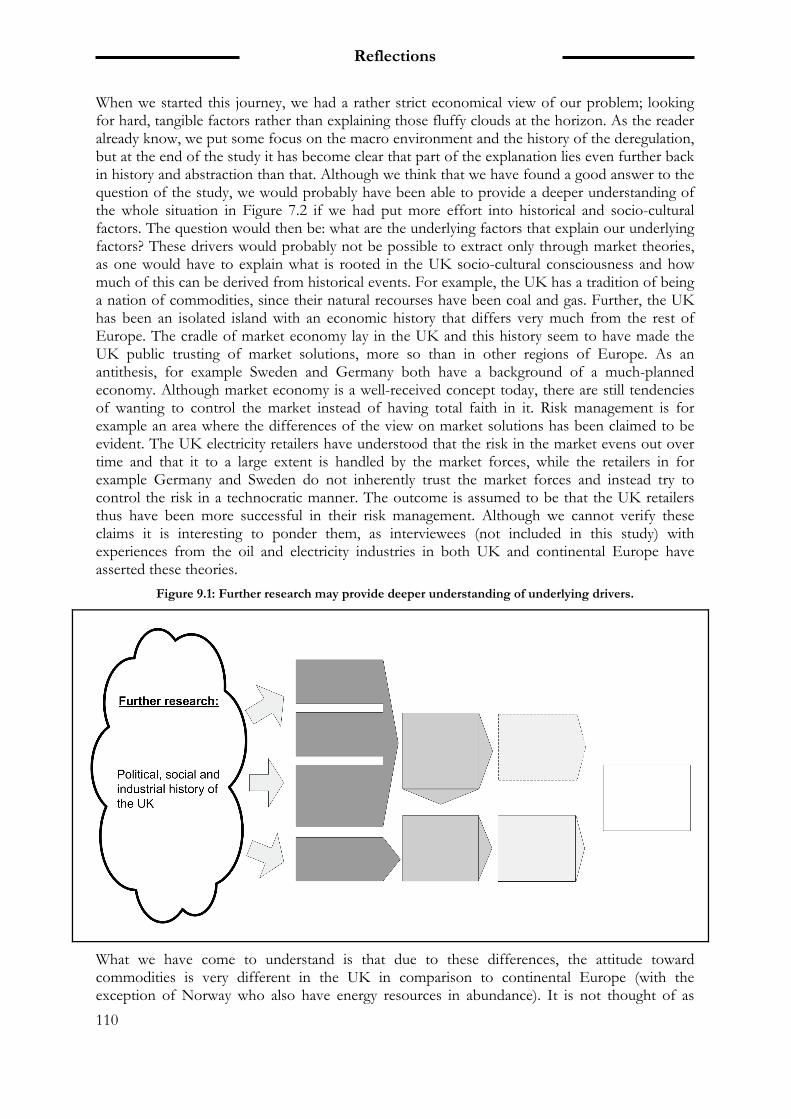
Reflections
110
When we started this journey, we had a rather strict economical view of our problem; looking for hard, tangible factors rather than explaining those fluffy clouds at the horizon. As the reader already know, we put some focus on the macro environment and the history of the deregulation, but at the end of the study it has become clear that part of the explanation lies even further back in history and abstraction than that. Although we think that we have found a good answer to the question of the study, we would probably have been able to provide a deeper understanding of the whole situation in Figure 7.2 if we had put more effort into historical and socio-cultural factors. The question would then be: what are the underlying factors that explain our underlying factors? These drivers would probably not be possible to extract only through market theories, as one would have to explain what is rooted in the UK socio-cultural consciousness and how much of this can be derived from historical events. For example, the UK has a tradition of being a nation of commodities, since their natural recourses have been coal and gas. Further, the UK has been an isolated island with an economic history that differs very much from the rest of Europe. The cradle of market economy lay in the UK and this history seem to have made the UK public trusting of market solutions, more so than in other regions of Europe. As an antithesis, for example Sweden and Germany both have a background of a much-planned economy. Although market economy is a well-received concept today, there are still tendencies of wanting to control the market instead of having total faith in it. Risk management is for example an area where the differences of the view on market solutions has been claimed to be evident. The UK electricity retailers have understood that the risk in the market evens out over time and that it to a large extent is handled by the market forces, while the retailers in for example Germany and Sweden do not inherently trust the market forces and instead try to control the risk in a technocratic manner. The outcome is assumed to be that the UK retailers thus have been more successful in their risk management. Although we cannot verify these claims it is interesting to ponder them, as interviewees (not included in this study) with experiences from the oil and electricity industries in both UK and continental Europe have asserted these theories.
Figure 9.1: Further research may provide deeper understanding of underlying drivers.
What we have come to understand is that due to these differences, the attitude toward commodities is very different in the UK in comparison to continental Europe (with the exception of Norway who also have energy resources in abundance). It is not thought of as
Reflections
111
something bad to make good money on commodity businesses like electricity in the UK, as they are seen more as a business among businesses, rather than an essential function of the society that should be managed by the authorities. Further, the people seem to have an understanding of that it is good to have successful industries, in national economical terms. In Sweden, for example, there have been a lot of discussion about individual gains or losses when buying electricity, and therefore the price tag has been very much focused upon. This discussion has further been initialised and fuelled by politicians. What is completely lost in such a discussion is the greater good of society, since a successful industry also will contribute with taxes, which can be distributed back to the public from the government. Even if the citizens do not receive the money straight into their pockets, the public in the UK might have understood this argument more so than in continental Europe, thanks to their specific history.
As has been repeated a number of times, the respondents did not think that a market with several hundred retailers would be effective. This is since the small retailers’ service levels according to them would suffer. However, the situation in Sweden conflict with this notion since the many small retailers provide good service while the big retailers have been having huge problems to match that. That is, the majority of the Swedish electricity customers are suffering from bad service. Therefore it is not possible for us to argue that swooping up the small retailers would improve the service levels for their customers just based on the consolidation. It could instead call for a discussion on consolidation in relation to the minimum service level on the market. That subject is however not possible for us to answer based on our research.

References
1. 12 Manage (2007), [Electronic] Available: http://12manage.com/i_m.html (2007-01-12) 2. Aldrich, E., H. & Fiol, M., C.”Fools Rush In? The Institutional Context of Industry Creation”,
Academy of Management Review, 19:4 (1994), 645-670. 3. Aktouf, O., Chenoufi, M. & Holford, D. ”General Issues in Management: The false expectations of
Michael Porter’s strategic management framework”, Problems and Perspectives in Management, no.4 (2005), 181-200.
4. APX Group (2007), Available: http://www.apxgroup.com/ (2007-04-19) 5. Arbnor,I. & Bjerke, B., Företagsekonomisk metodlära, Second edition. Lund, 1994. 6. Baden-Fuller, C. & Stopford, J., “The Firm Matters, Not the Industry”, Strategy – Process, Content,
Context (De Wit B. & Meyer R.). London, 1998. 7. Bell, J., Introduktion till forskningsmetodik, Second edition. Lund, 1995. 8. Burton, J., ”Composite Strategy: The combination of collaboration and competition”, Journal of
General Management, 21:1 (1995), 1-23. 9. ”Directive 2003/54/EC of the European Parliament and of the Council”, Official Journal of the
European Union (L176), 46: 15 July (2003), 37-55. 10. De Wit B. & Meyer R., Strategy – Process, Content, Context, Second edition. London, 1998. 11. Dye, T. R. & Groth, C. J.,”Service Quality: perceived value, expectations, shortfalls, and bonuses”,
Managing Service Quality, 9:4 (1999), 274-285. 12. DOJ, “Horizontal Merger Guidelines” [Electronic] Available:
http://www.usdoj.gov/atr/public/guidelines/horiz_book/hmg1.html (2007-01-20) 13. Electrica Services Limited, Electricity Industry Review 10, Surrey, 2006 14. Electricity Guide (2007), “New Electricity Companies Can't Cope with Price Rises” [Electronic]
Hampshire: Electricity Guide. Available: http://www.electricity-guide.org.uk/blog-new-electricty-companies-cant-cope-with-price-rises-20.html (2007-04-26)
15. Energy Business Review (2006), “Opportunities for asset-light energy retailers may soon come
around” [Electronic] London: Business Review. Available: http://www.energy-business-review.com/article_feature_print.asp?guid=C191EC67-F223-4469-9FDD-48022079FB6B (2007-04-19)
16. Energy Business Review (2005), “British Gas adverts found to be misleading” [Electronic] London:
Business Review. Available: http://www.energy-business-review.com/article_news.asp?guid=3239881D-26C9-4709-9537-CA42A7290430 (2007-04-19)
17. Frangouli, Z., ” Capital structure, product differentiation and monopoly power: a panel method
approach”, Managerial Finance, 28:5 (2002), 59-64. 18. Giulietti, M., Price, W. C. & Waterson, M., ”Consumer Choice and Competition Policy: A study of
UK energy markets”, The Economic Journal, 115: October (2005), 949-968.
19. Green, R., “Markets for electricity in Europe”, Oxford Review of Economic Policy, 17:3 (2001), 329-345. 20. Groth, C. J.,”The Exclusive value Principle – A Concept for Marketing”, Journal of Product & Brand
Management, 3:3 (1994), 8-18. 21. Grönroos, C. & Ravald, A.,”The value concept and relationship marketing”, European Journal of
Marketing, 30:2 (1996), 19-30 22. Hammarkvist K-O, Håkansson H. & Mattson L-G, Marknadsföring för konkurrenskraft. Kristianstad,
1982. 23. Holbrook, M., Consumer Value – A framework for analysis and research. Oxon, 1999. 24. Hollensen, S., Global Marketing: a Market-Responsive Approach. Harlow, 2001 25. Janssen, C., W., M. & Moraga-Gonzales, J., L., “Strategic Pricing, Consumer Search and the Number
of Firms”, Review of Economic Studies, 71:4 (2004), 1089-1118. 26. Jensen, M. K., Kvalitativa metoder. Lund, 1995. 27. Jewell, K. (2003), ”Manipulated, Misled, Ignored, Abused: Residential Consumer Experience with
Electric Deregulation in the United Kingdom” [Electronic] Greenwich: PSIRU & Texas: Consumers Union, Available: http://129.3.20.41/eps/pe/papers/0401/0401005.pdf (2007-02-22)
28. Khalifa, A. S., ”Customer value: a review of recent literature and an integrative configuration”,
Management Decision¸ 42:5 (2004), 645-666. 29. Kanter, R., “Collaborative Advantage”, Harvard Business Review, 72:4 (1994), 96-108. 30. Kotler, P. & Armstrong, G., Principles of Marketing, Sixth Ed. New Jersey, 1994. 31. Kvale, S., Den kvalitativa forskningsintervjun. Lund, 1997. 32. Lekwall, P. & Wahlbin, C., Information för Marknadsföringsbeslut, Third Edition. Gothenburg, 1993. 33. Littlechild, S., “Competition and contracts in the Nordic residential electricity markets”, Utilities
Policy, 14:3 (2006), 135-147. 34. Littlechild, S., “UK Domestic Energy Contracts: the 28-day rule and experience in Sweden”, CMI
Working Paper 45, University of Cambridge, (2004). 35. McCracken, G., The Long Interview. USA, 1988. 36. McGee, J. & Thomas, H., Strategic management research : a European perspective. Chichester, 1986. 37. McGee, J., Thomas, H. & Wilson, D., Strategy: Analysis and Practice. Glasgow, 2005. 38. Nalebuff B. & Brandenburger A., Co-opetition. New York, 1996. 39. Ofgem, ”Ofgem, 2006” [Electronic] Available: www.ofgem.gov.uk (2006-12-07)
40. Ofgem: “Customer Survey” [Electronic] Available: http://www.ofgem.gov.uk/Markets/RetMkts/Compet/Documents1/12882-2406b.pdf (2007-04-19)
41. Ofgem, “Domestic Retail Market Report - March 2006” [Electronic] Available:
http://www.ofgem.gov.uk/Markets/RetMkts/Compet/Documents1/14542-DRMR%20March%202006.pdf (2006-12-07)
42. Ofgem, “Domestic Retail Market Report - September 2005” [Electronic] Available:
http://www.ofgem.gov.uk/Markets/RetMkts/Compet/Documents1/12875-2306.pdf (2006-12-07) 43. Ofgem, ”Energy Billing and Metering” [Electronic] Available:
http://www.ofgem.gov.uk/Markets/RetMkts/Compet/Documents1/16915-2207.pdf (2007-04-19) 44. Ofgem (2007). ”Energy Companies Have A Choice: Cut prices or lose customers” [Electronic]
London: Ofgem. Available: http://www.ofgem.gov.uk/temp/ofgem/cache/cmsattach/18718_R7.pdf?wtfrom=/ofgem/press/pressrelease-list.jsp (2007-02-16)
45. Ohmae, K., The Mind of the Strategist- The art of Japanese business. USA, 1982. 46. Porter, M. E., Competitive Advantage. New York, 1985. 47. Porter, M. E., Competitive Strategy. New York, 1998. 48. Pass, C., Sturgess, B. & Wilson, N., “Advertising, Barriers to Entry and Competition Policy”, Journal
of Product & Brand Management, 3:3 (1994), 51-58. 49. Robson, C., Real world research: a resource for social scientists and practionners-researchers, 2nd ed.
Oxford, 1993. 50. Statens energimyndighet. Prisbildning och konkurrens på elmarknaden. ER 2006:13, (2006). 51. Toft S., Power System Economics, First edition. New Jersey, 2002. 52. Tovey, K. (2005), “Developments in the Electricity Markets in the UK: the move towards BETTA”
[Electronic] Norwich: University of East Anglia, Available: http://www2.env.uea.ac.uk/gmmc/neta/nktovey_moscow_2005.doc (2007-04-13)
53. Tovey, K. (2006), “The Changing Face of the Electricity Market in the UK” [Electronic] Norwich:
University of East Anglia, Available: http://www2.env.uea.ac.uk/gmmc/neta/neta_oct23_2006.ppt (2007-04-13)
54. Treacy, M. & Wiersema, F., The Discipline of Market Leaders. New York, 1995. 55. Wikipedia (2007), “Electricity Market” [Electronic] Available:
http://en.wikipedia.org/wiki/Electricity_market (2007-04-30) 56. Wright, P., “Competition in gas and electricity: companies profit, consumers pay”, Consumer Policy
Review, 17:1 (2007), 2-11. 57. Yin, R., Case study research: Design and Methods. London, 1994.

58. Zeithaml, V., “Consumer perception of price, quality and value: a means-end model and synthesis of evidence”, Journal of Marketing, 52:3 (1988), 2-22.
Interviews at Vattenfall 1. Charlotte Loid, 2006-12-15 2. Åsa Lilljekvist-Cramer, 2007-02-08 3. Tomas Sandberg, 2007-01-24 4. Bo Wahrgren, 2007-02-13
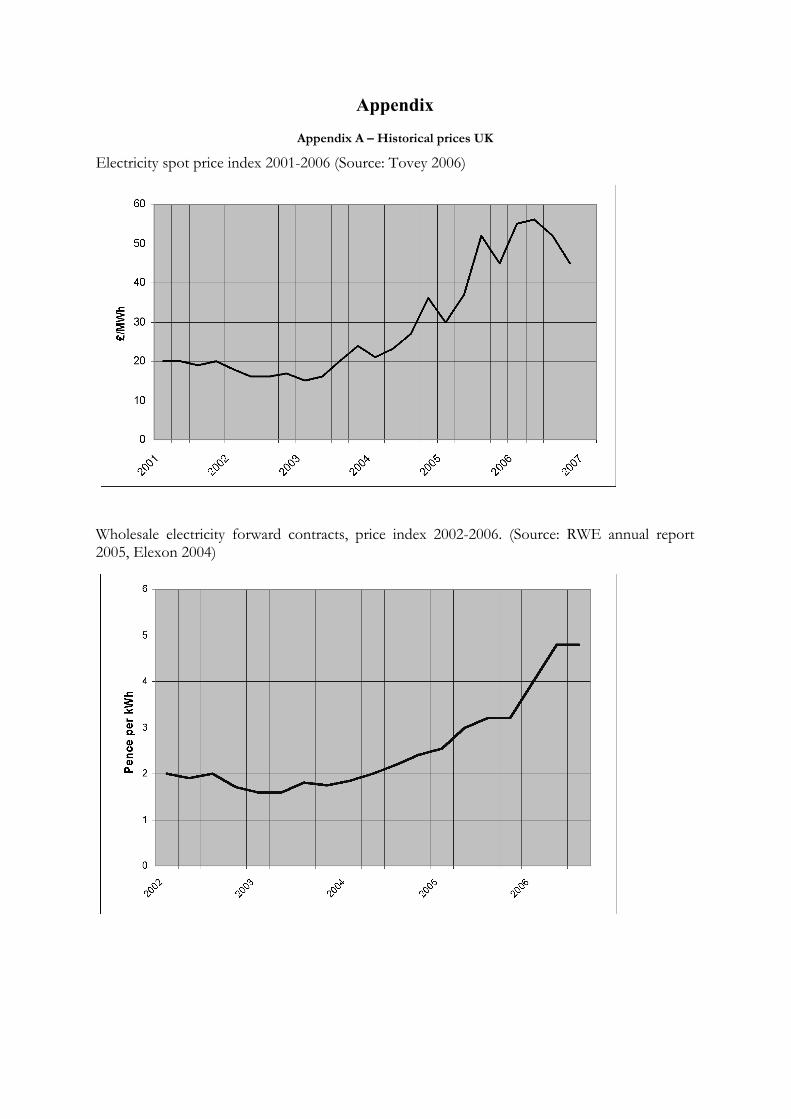
Appendix
Appendix A – Historical prices UK
Electricity spot price index 2001-2006 (Source: Tovey 2006)
Wholesale electricity forward contracts, price index 2002-2006. (Source: RWE annual report 2005, Elexon 2004)
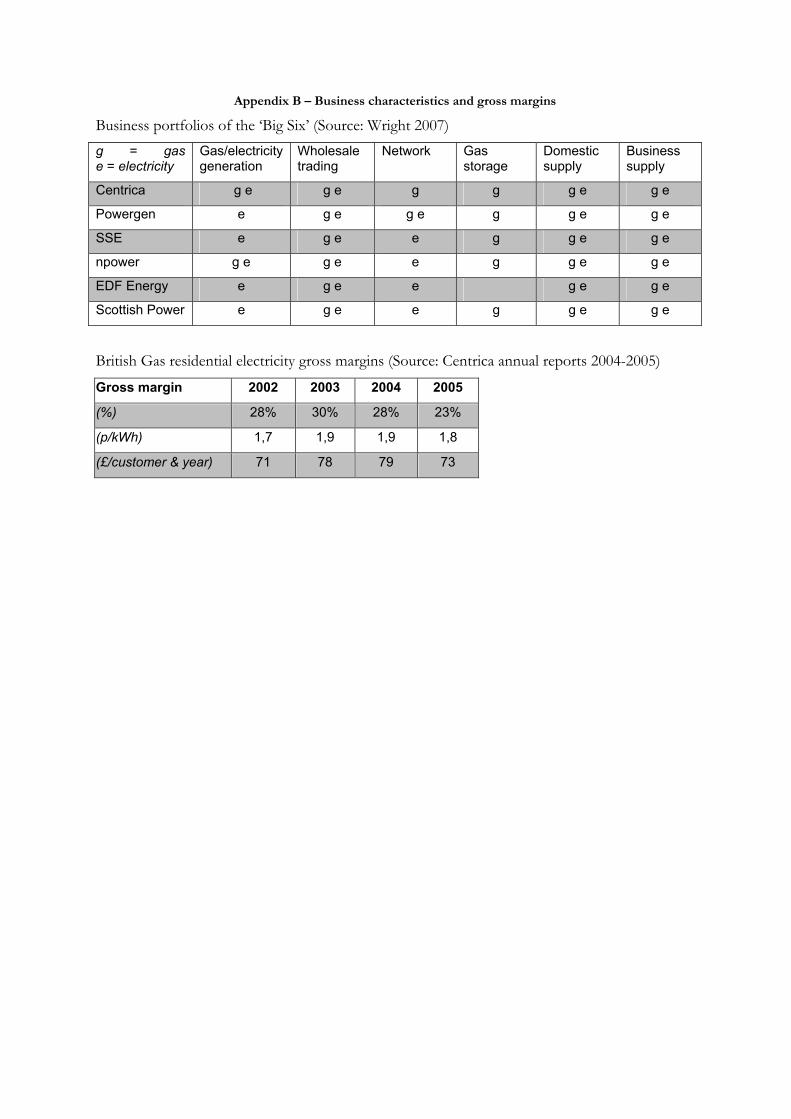
Appendix B – Business characteristics and gross margins
Business portfolios of the ‘Big Six’ (Source: Wright 2007) g = gas e = electricity
Gas/electricity generation
Wholesale trading
Network Gas storage
Domestic supply
Business supply
Centrica g e g e g g g e g e
Powergen e g e g e g g e g e
SSE e g e e g g e g e
npower g e g e e g g e g e
EDF Energy e g e e g e g e
Scottish Power e g e e g g e g e
British Gas residential electricity gross margins (Source: Centrica annual reports 2004-2005)
Gross margin 2002 2003 2004 2005
(%) 28% 30% 28% 23%
(p/kWh) 1,7 1,9 1,9 1,8
(£/customer & year) 71 78 79 73

Appendix C – Annual Domestic Energy Bills
Gas and electricity annual bills for UK households 2006 (Sources: DTI 2006, Eurostat 2006, Vattenfall)
Form of payment Electricity (£) Gas (£)
Standard credit 340 475
Direct debit 315 425
Prepayment meters 355 500
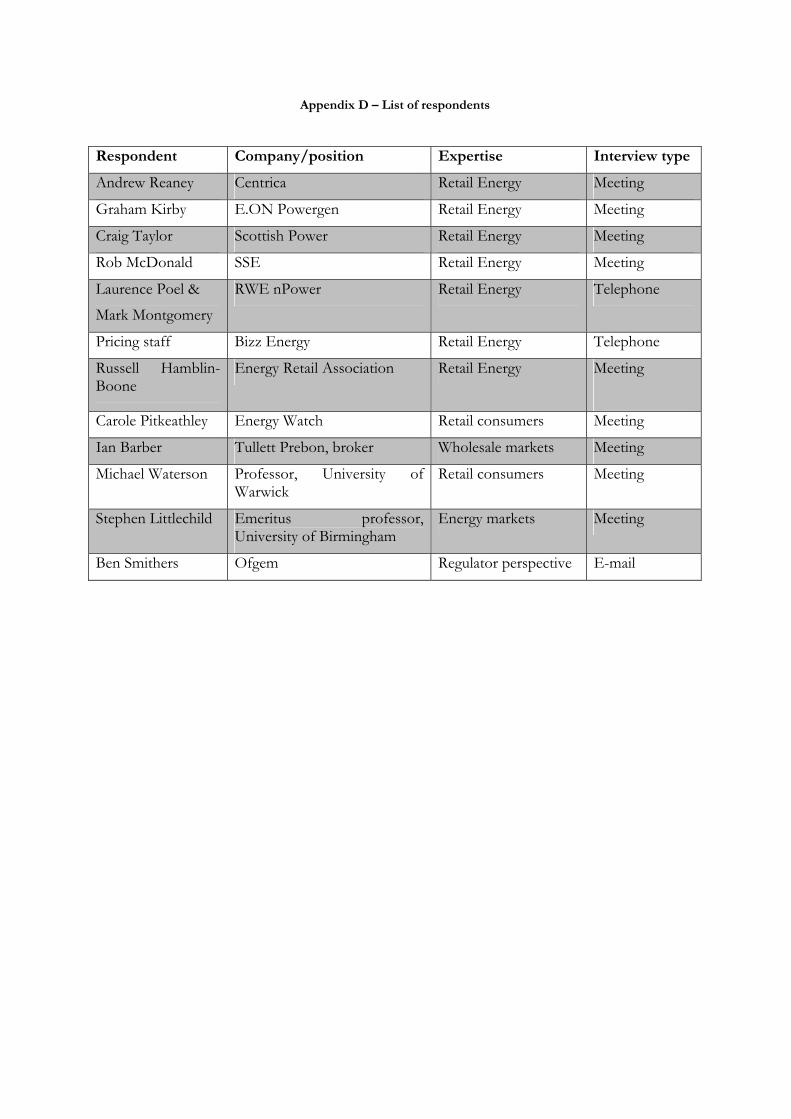
Appendix D – List of respondents
Respondent Company/position Expertise Interview type
Andrew Reaney Centrica Retail Energy Meeting
Graham Kirby E.ON Powergen Retail Energy Meeting
Craig Taylor Scottish Power Retail Energy Meeting
Rob McDonald SSE Retail Energy Meeting
Laurence Poel &
Mark Montgomery
RWE nPower Retail Energy Telephone
Pricing staff Bizz Energy Retail Energy Telephone
Russell Hamblin-Boone
Energy Retail Association Retail Energy Meeting
Carole Pitkeathley Energy Watch Retail consumers Meeting
Ian Barber Tullett Prebon, broker Wholesale markets Meeting
Michael Waterson Professor, University of Warwick
Retail consumers Meeting
Stephen Littlechild Emeritus professor, University of Birmingham
Energy markets Meeting
Ben Smithers Ofgem Regulator perspective E-mail

Appendix E – Questionnaire - All Questions
o Tell us about what you do
Macro environment
Economic issues
1. Describe how the economic well being of UK corresponds to the view on electricity prices. 2. Describe the importance of electricity prices to the regular household.
• As relative to gas? 3. How would an increase in taxes affect gross margins?
• Increase up to the levels in Sweden (40 %)?
Environmental issues
1. Tell us about a time when you noticed changes in customer behaviour due to seasonal changes. • Price elasticity? • Demand elasticity? • Churn-rate?
2. Describe how the state of the environment affects households’ demands on retailers • Global warming – describe how it affects your business? Product development? • Tell us about the effects the opinion has had on generation methods
• On consumption patterns
Political/legal issues
1. Describe the last time when you had relations between the government/regulators (and the retail electricity industry) • How do you communicate with the government/regulators? • About the last time you perceived any political attitude towards industry? • The attitude on competition and prices in particular?
2. In what way have environmental regulations restricted you? • Does it provide any opportunities?
3. Describe how the government policies affect new entrants
Socio-cultural issues
1. Tell us about a time when the public opinion affected the industry. 2. Tell us about a time when there was a pressure from consumers to cut prices
• (om alltid; när ledde det till faktiska förändringar?) 3. How does ecologic concerns in the society affect your business model? 4. Was there a time when you were criticised and confronted this publicly?
• Tell us about it. Industry level
Rivals and competition
1. Describe the competition and how you meet it • Who are your main competitors? In which regions and segments? • Do other retailers follow your moves closely? Describe how. • Explain how you concern yourselves with the small niche suppliers.

• Do you regard them as a homogenic group? • Describe your main competitors market strategies?
• How do you differ from them? • What triggers price changes? How does it work?
• How many times per year have your competitors changed their prices? • What about you? • Describe how you act in following the wholesale fluctuations
• How does the fact that the market is slow-growing affect the competition? • How does the fact that there are 14 different regions and respective tariffs affect you and
your overall price levels?
o Are any regions more or less desirable in terms of profitability?
o What would happen to the average UK electricity price if there were only one national tariff (with different payment types though)?
o During the gas monopoly, was the gas price the same in all of UK?
• Describe the gross margins in the retail segment in relation to other commodity industries
o Are there any benchmarks?
o Are they decent?
• How does billing work? Estimates?
2. Do you think the industry is working, as it should be? • Would you like to see some changes in the industry? Describe which. • Describe what can you do to make these changes happen.
3. How much further would it be possible to consolidate the market without having problems with the competitive situation?
4. Describe the main entry barriers to the market. • What is the industry’s view on risks when dealing with retailers? • How does licensing work? • Describe the proprietary knowledge that must be “overcome” • Are there any niches on the market for independent players to fill? • Describe the threats from incumbents to the new entrants
5. How are you involved in the licensing process? 6. Describe the interest in entering the market from outsiders
• Tell us about when an independent retailer entered the market and how it affected you. 7. Explain why so many retailers are vertically integrated
• Would if be possible to operate in only generation or supply? • Describe the consequences.
8. Tell us about a time when the industry was not working properly.
Supply
1. Describe how securing the supply is a concern for you. • Is it a concern or you?
2. Describe how the size of the retailer affects the supply process. 3. Describe how rising and sinking wholesale costs affect small and large retailers. 4. How does the retail industry cope with risks regarding spot prices?

• How is the risk factor calculated? • How are purchase risks valued by the retailer and how much is passed on to the
customer? • Describe how the big retailers’ procurement costs and forwards differ from the spot
price index?
o To what degree?
• Do independent retailers also use forward contracts for their procurement?
o Explain to what degree.
o What is the average length of these and what are the reasons for this?
o How does it differ from the major retailers?
5. How does the generators’ internal rating of the buyers (the retailers) work and measure?
Complementors
1. How do web-based switching services affect your business?
o What is your opinion on switching services?
2. How do you work with third party service providers and why?
3. Describe the opportunities to co-operate within the industry
o With complementors specifically?
Customers
1. Explain the relationship between gas and electricity.
o How do the customers perceive the two? Separate products? Just energy?
2. Describe what is most important to household customers when buying electricity.
o How do you respond to that?
o Tell us about the last time when you communicated your offering’s value.
o Describe the importance of service levels in relation to the other respects of the product offering
3. Describe the British consumers price sensitivity.
o In relation to gas?
4. Describe the switching costs for the customers.
o Describe the patterns in switching and re-switching.
5. Describe your product development process.
o How do you involve your customers in it?
6. How do the British consumers become aware of the choices available?
• Are the consumers aware of the choices available? • Describe the customer loyalty. What does it depend on? Are they loyal? • How do you think the customers value the relation to their supplier?
7. Have the customers shown interest in customized offerings?
• How does it affect the price?

8. Explain how home services affect pricing.
9. Explain how bundling affect prices.
10. Do you target any specific customer groups? Do any retailers do that?
• Along which dimensions is segmentation performed? 11. Describe how you value a customer in real terms or offerings.
• How much is a customer valued? According to the industry? • Can you tell us about any previous deals?
12. Describe a time when the pressure from consumers forced you to change your behaviour
Discussing numbers
1. Centrica’s gross margins were £73 in 2005 while ScottishPower’s were £130. o What is your reaction on that?
2. What is your view on the conditions on the Swedish market? Public exchange, low barriers of entrance, 120 retailers competing for a total of 2-3 million accounts.
Value – checklist
1. Are you focused on differentiating yourselves from the competition? • How? How do other retailers do this? • How do you work with branding and image? • How do you work with product/service development?
2. How do you deliver value to the customer? • How do you measure whether you succeed or not? • What importance does retailers attach to the relationship with the customer?
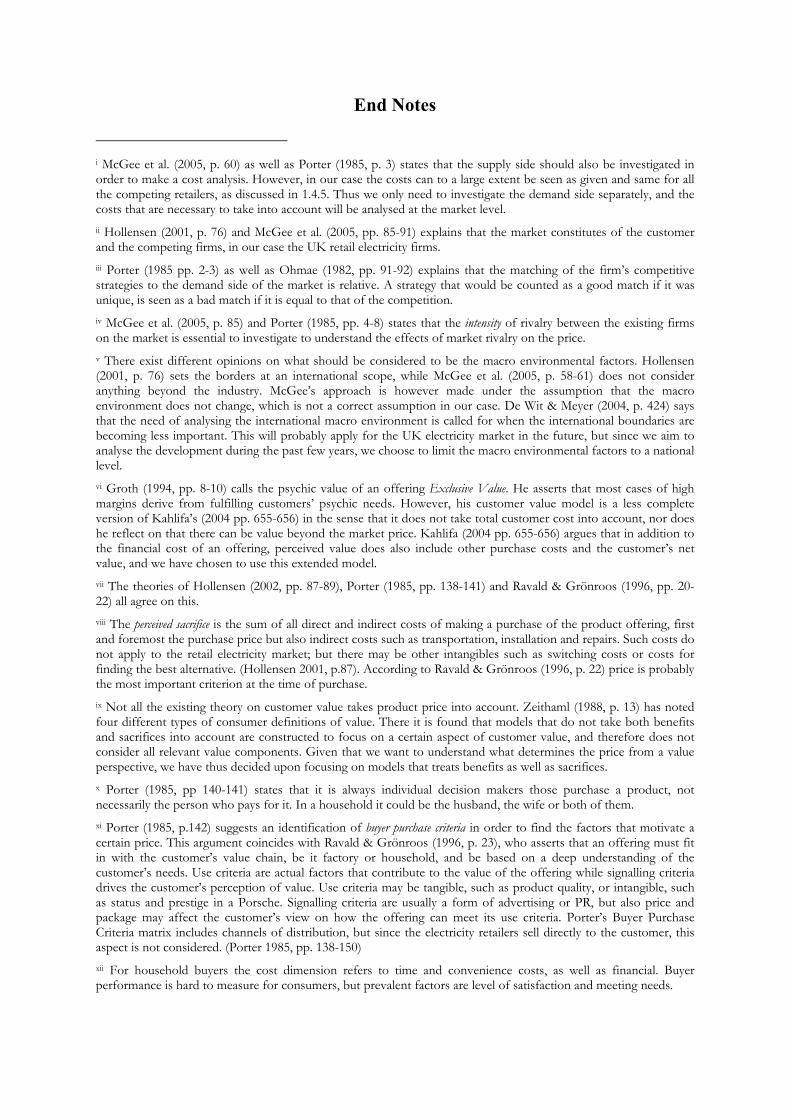
End Notes
i McGee et al. (2005, p. 60) as well as Porter (1985, p. 3) states that the supply side should also be investigated in order to make a cost analysis. However, in our case the costs can to a large extent be seen as given and same for all the competing retailers, as discussed in 1.4.5. Thus we only need to investigate the demand side separately, and the costs that are necessary to take into account will be analysed at the market level. ii Hollensen (2001, p. 76) and McGee et al. (2005, pp. 85-91) explains that the market constitutes of the customer and the competing firms, in our case the UK retail electricity firms. iii Porter (1985 pp. 2-3) as well as Ohmae (1982, pp. 91-92) explains that the matching of the firm’s competitive strategies to the demand side of the market is relative. A strategy that would be counted as a good match if it was unique, is seen as a bad match if it is equal to that of the competition. iv McGee et al. (2005, p. 85) and Porter (1985, pp. 4-8) states that the intensity of rivalry between the existing firms on the market is essential to investigate to understand the effects of market rivalry on the price. v There exist different opinions on what should be considered to be the macro environmental factors. Hollensen (2001, p. 76) sets the borders at an international scope, while McGee et al. (2005, p. 58-61) does not consider anything beyond the industry. McGee’s approach is however made under the assumption that the macro environment does not change, which is not a correct assumption in our case. De Wit & Meyer (2004, p. 424) says that the need of analysing the international macro environment is called for when the international boundaries are becoming less important. This will probably apply for the UK electricity market in the future, but since we aim to analyse the development during the past few years, we choose to limit the macro environmental factors to a national level. vi Groth (1994, pp. 8-10) calls the psychic value of an offering Exclusive Value. He asserts that most cases of high margins derive from fulfilling customers’ psychic needs. However, his customer value model is a less complete version of Kahlifa’s (2004 pp. 655-656) in the sense that it does not take total customer cost into account, nor does he reflect on that there can be value beyond the market price. Kahlifa (2004 pp. 655-656) argues that in addition to the financial cost of an offering, perceived value does also include other purchase costs and the customer’s net value, and we have chosen to use this extended model. vii The theories of Hollensen (2002, pp. 87-89), Porter (1985, pp. 138-141) and Ravald & Grönroos (1996, pp. 20-22) all agree on this. viii The perceived sacrifice is the sum of all direct and indirect costs of making a purchase of the product offering, first and foremost the purchase price but also indirect costs such as transportation, installation and repairs. Such costs do not apply to the retail electricity market; but there may be other intangibles such as switching costs or costs for finding the best alternative. (Hollensen 2001, p.87). According to Ravald & Grönroos (1996, p. 22) price is probably the most important criterion at the time of purchase. ix Not all the existing theory on customer value takes product price into account. Zeithaml (1988, p. 13) has noted four different types of consumer definitions of value. There it is found that models that do not take both benefits and sacrifices into account are constructed to focus on a certain aspect of customer value, and therefore does not consider all relevant value components. Given that we want to understand what determines the price from a value perspective, we have thus decided upon focusing on models that treats benefits as well as sacrifices. x Porter (1985, pp 140-141) states that it is always individual decision makers those purchase a product, not necessarily the person who pays for it. In a household it could be the husband, the wife or both of them. xi Porter (1985, p.142) suggests an identification of buyer purchase criteria in order to find the factors that motivate a certain price. This argument coincides with Ravald & Grönroos (1996, p. 23), who asserts that an offering must fit in with the customer’s value chain, be it factory or household, and be based on a deep understanding of the customer’s needs. Use criteria are actual factors that contribute to the value of the offering while signalling criteria drives the customer’s perception of value. Use criteria may be tangible, such as product quality, or intangible, such as status and prestige in a Porsche. Signalling criteria are usually a form of advertising or PR, but also price and package may affect the customer’s view on how the offering can meet its use criteria. Porter’s Buyer Purchase Criteria matrix includes channels of distribution, but since the electricity retailers sell directly to the customer, this aspect is not considered. (Porter 1985, pp. 138-150) xii For household buyers the cost dimension refers to time and convenience costs, as well as financial. Buyer performance is hard to measure for consumers, but prevalent factors are level of satisfaction and meeting needs.
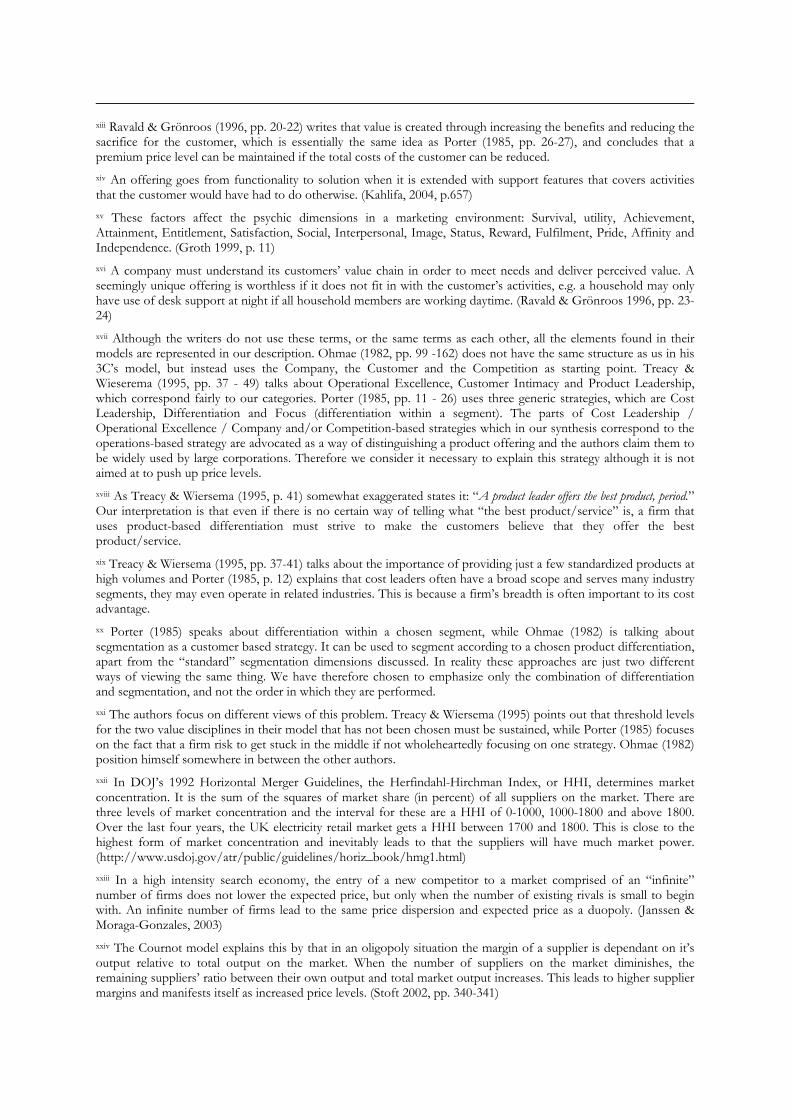
xiii Ravald & Grönroos (1996, pp. 20-22) writes that value is created through increasing the benefits and reducing the sacrifice for the customer, which is essentially the same idea as Porter (1985, pp. 26-27), and concludes that a premium price level can be maintained if the total costs of the customer can be reduced. xiv An offering goes from functionality to solution when it is extended with support features that covers activities that the customer would have had to do otherwise. (Kahlifa, 2004, p.657) xv These factors affect the psychic dimensions in a marketing environment: Survival, utility, Achievement, Attainment, Entitlement, Satisfaction, Social, Interpersonal, Image, Status, Reward, Fulfilment, Pride, Affinity and Independence. (Groth 1999, p. 11) xvi A company must understand its customers’ value chain in order to meet needs and deliver perceived value. A seemingly unique offering is worthless if it does not fit in with the customer’s activities, e.g. a household may only have use of desk support at night if all household members are working daytime. (Ravald & Grönroos 1996, pp. 23-24) xvii Although the writers do not use these terms, or the same terms as each other, all the elements found in their models are represented in our description. Ohmae (1982, pp. 99 -162) does not have the same structure as us in his 3C’s model, but instead uses the Company, the Customer and the Competition as starting point. Treacy & Wieserema (1995, pp. 37 - 49) talks about Operational Excellence, Customer Intimacy and Product Leadership, which correspond fairly to our categories. Porter (1985, pp. 11 - 26) uses three generic strategies, which are Cost Leadership, Differentiation and Focus (differentiation within a segment). The parts of Cost Leadership / Operational Excellence / Company and/or Competition-based strategies which in our synthesis correspond to the operations-based strategy are advocated as a way of distinguishing a product offering and the authors claim them to be widely used by large corporations. Therefore we consider it necessary to explain this strategy although it is not aimed at to push up price levels. xviii As Treacy & Wiersema (1995, p. 41) somewhat exaggerated states it: “A product leader offers the best product, period.” Our interpretation is that even if there is no certain way of telling what “the best product/service” is, a firm that uses product-based differentiation must strive to make the customers believe that they offer the best product/service. xix Treacy & Wiersema (1995, pp. 37-41) talks about the importance of providing just a few standardized products at high volumes and Porter (1985, p. 12) explains that cost leaders often have a broad scope and serves many industry segments, they may even operate in related industries. This is because a firm’s breadth is often important to its cost advantage. xx Porter (1985) speaks about differentiation within a chosen segment, while Ohmae (1982) is talking about segmentation as a customer based strategy. It can be used to segment according to a chosen product differentiation, apart from the “standard” segmentation dimensions discussed. In reality these approaches are just two different ways of viewing the same thing. We have therefore chosen to emphasize only the combination of differentiation and segmentation, and not the order in which they are performed. xxi The authors focus on different views of this problem. Treacy & Wiersema (1995) points out that threshold levels for the two value disciplines in their model that has not been chosen must be sustained, while Porter (1985) focuses on the fact that a firm risk to get stuck in the middle if not wholeheartedly focusing on one strategy. Ohmae (1982) position himself somewhere in between the other authors. xxii In DOJ’s 1992 Horizontal Merger Guidelines, the Herfindahl-Hirchman Index, or HHI, determines market concentration. It is the sum of the squares of market share (in percent) of all suppliers on the market. There are three levels of market concentration and the interval for these are a HHI of 0-1000, 1000-1800 and above 1800. Over the last four years, the UK electricity retail market gets a HHI between 1700 and 1800. This is close to the highest form of market concentration and inevitably leads to that the suppliers will have much market power. (http://www.usdoj.gov/atr/public/guidelines/horiz_book/hmg1.html) xxiii In a high intensity search economy, the entry of a new competitor to a market comprised of an “infinite” number of firms does not lower the expected price, but only when the number of existing rivals is small to begin with. An infinite number of firms lead to the same price dispersion and expected price as a duopoly. (Janssen & Moraga-Gonzales, 2003) xxiv The Cournot model explains this by that in an oligopoly situation the margin of a supplier is dependant on it’s output relative to total output on the market. When the number of suppliers on the market diminishes, the remaining suppliers’ ratio between their own output and total market output increases. This leads to higher supplier margins and manifests itself as increased price levels. (Stoft 2002, pp. 340-341)
xxv Hollensen (2001, p. 82) explains this behaviour by that firms need to be careful not to spoil a situation of competitive stability. They need to balance their own position against the well being of the industry as a whole. An intense price or promotional war may for example gain a few percentage points in market share, but lead to an overall fall in long-run industry profitability as competition respond to these moves. It is sometimes better to protect industry structure than to follow short-term self-interest. xxvi Porter (1998, p.6) presents a very large number of potential factors that may have an impact on industry competition, but not all are present in every one industry. What constitutes an industry is a matter of drawing the line between the five different actors within it, but this definition has little to do with the choice of strategy. (Porter 1998, p.32) The competing firms in an industry have little to say on industry development and profitability as individuals, as they are being shaped by the structural conditions of the industry. However, as a combined force, the competing firms may set the rules of the industry to their advantage. This could be the case in the British retail electricity industry. The contrasting view is called Industry leadership perspective and claims that a powerful and innovative firm can change the setting of an industry by their own actions, and that the industry’s actors then are irrelevant. Market shares are the reward of success, not the cause of profitability. Small players can do well if they reach a critical mass of customers by simply being a better option than the big firms. The major power struggle on the market is therefore between groups of firms that do things differently. (Baden-Fuller & Stopford 2004, pp.447-450) Since there is no real leader in the UK, Porter’s view is preferred. This means that small players that do not play by the rules cannot enter the arena. One could argue though that Centrica paves the way by introducing dual-fuel and being the largest player. If they would like lower prices and different competition, they could possibly change the industry. xxvii All the writers agree that these actors and their characteristics make up the industry level. We therefore choose to present the industry actors according to Porter’s framework. It is the opinions on how competition should best be developed in a healthy industry that differ between the authors. Brandenburger & Nalebuff (1996) lumps rivalry, new potential entrants and substitutes together under the moniker Competitors. xxviii The term complementor is used by Brandenburger 1996, p. 34) as well as De Wit & Meyer (2004, p. 427). De Wit & Meyer however categorizes it along with substitutes. xxix The main difference between Porter and Nalebuff & Brandenburger (1996) is that the former is focused on the industry as a field of fierce competition, whereas the latter two suggests that the different actors all can create value through co-opetition – collaboration is essential even between players who are seemingly competitors. Porter agrees with Nalebuff & Brandenburger though, that too intense competition, i.e. a price war, can destroy all value in an industry. (Porter 1985, p.13) xxx Aktouf et al (2005) presents a harsh criticism of Porter’s theories on the grounds that they justify oligopoly and market domination and provides no macro perspective or focus on the firm’s resources. They assert that alliances and non-competitive motives are of great importance when analysing the complexity of strategy emergence. The authors do not suggest any other models for industry analysis however, and base their criticism on Porter’s apparent vurm for dominant capitalism, which is why we argue that Porter’s framework is still a valid starting point for mapping out the industry structures. (Aktouf et al 2005, pp.181-185, p.198) Also, the British retail electricity industry shows no evident signs of collaboration or motives other than profit. xxxi On the British retail electricity market customers are extremely fragmented and there is no threat of vertical integration from the buyer’s side. All factors that are relevant in B2B industries are useless for our study. (McGee, 2005, p.151; Porter, 1998, pp.24-27) xxxii Porter (1998, p. 8) suggests that it is possible to reap economies of scale at entrance if it is possible to share operations with other units of the business, especially if there are joint costs. It is common for multi-businesses to share intangible assets, such as brands and expertise. Centrica is a prime example of this, who utilised their huge customer base in gas when entering the electricity market. Billing and customer service were the same for both operations, and the old household brand British Gas was exploited successfully. xxxiii Firms make up a strategic group when “A firm within a groups makes strategic decisions that cannot readily be imitated by firms outside the group without substantial costs, significant elapsed time, or uncertainty about the outcome of those decisions.” (McGee & Thomas, 1986, p.150) For the small players on the British retail electricity market it is associated with huge costs and to perform the same strategic activities as the “Big Six” and it is likely to take a long time before they reach the same status as the large incumbents. This is further reason why we tend to see the big and the small retailers as two strategic groups. xxxiv Hollensen (2001, pp. 141-176) focus purely on economical, political and socio-cultural factors, which Kotler (1994, pp. 72-73) also discuss apart from demographical, technological and environmental forces. As the electricity
industry is affected by the different electricity production methods’ impact on the environment, we need to include Environmental Forces as a relevant factor to investigate. However, in our case there has not been occurred any major technological changes that has affected the British electricity industry during the period of time we are investigating. We therefore consider Technological Forces to be a set of irrelevant macro environmental factors in this report. 12Manage PEST Analysis concludes that sometimes Legal Forces are investigated separately. This is however something that we choose to include in Political Forces since to two are intimately connected. Demographical characteristics will not be investigated, since nothing in the pre-study indicates that there is a need for it. xxxv The consciousness of the environment is based on 12Manage PEST Analysis’ health consciousness and Kotler’s (1994, pp. 89-90) people’s views of nature. The environment’s impact on the health of the individual and society is the only determinant of health consciousness that we have seen evidence of in the pre-study. xxxvi Kotler (1994, pp. 90-91) means that firms that take an environment management perspective take aggressive actions to affect the publics and forces in their macro environment. We interpret that this can be done to change the macro environment, but since we have seen indications on that there are favourable rivalry conditions among the British electricity retailers, the ability to preserve the current state should be equally important for the retailers. xxxvii Theory development is integral prior to any case study data collection. Yin (1994) asserts that a descriptive theory approach focuses on the purpose of the study and the complete description of the topics to be studied, and that this helps developing the theoretical base and research design for the study. For research topics where the existing theory is poor and sparse, the exploratory approach is more likely to be assumed. (Yin, 1994, pp. 28-29) This stance is essentially the same as the one presented in Lekvall & Wahlbin (1993), who classify studies along four levels of research depth: explorative, descriptive, explanatory and predictive. The main difference to Yin is that Lekvall & Wahlbin present much more clearly defined categories of study approaches and also rank them in order of ambition level, as in terms of amount of contained information. However, the difference between a descriptive and an explanatory study is subtle; the latter rests on a rather small number of factors while the former has a wider scope. (Lekvall & Wahlbin, 1993, pp. 128-130) Our study by all means aims at explaining the influence of factors, although we do have quite a long list of factors to study. xxxviii Qualitative studies aim at defining the analytic categories (the driving factors) during the research process rather than having them written in stone before the data collection begins. One has to expect the factors to change in scope and definition during the investigation. The qualitative method tries to map out interrelationships between a large number of analytic categories, which makes the conclusions less precise, but broader in scope as well. (McCracken, 1988, pp. 16-17) Thus, we do not try to specify each and every connection between the factors explicitly before the empirical research. xxxix Porter (1998, p. 378) provides a framework for potential sources of data for industry analysis to cover all areas and perspectives. The potential respondent groups are customers, distributors, suppliers, industry observers, service organizations and interview sources about competitors inside the company. This framework guided us when deciding which organizations and persons that could be appropriate respondents. In our case the distributors will be the retail firms. xl Lekvall & Wahlbin elaborates further on the chain of research to encompass the logical levels of the research report. The report should start at the top and work itself down to the foundation of the research - the field study – and then work its way up to the recommendations, based on the results and conclusions. The reason for this approach is to illustrate the innate connection that is between the separate components. For example, the methods described for collecting data must correspond to the actual empirics, and after the field study, the data can be evaluated with the aid of the methodology chapter. The same process is repeated on the other levels as well, to certify that the study is always driven by its initial problem and questions, and that all parts does have a purpose in the report. (Lekvall & Wahlbin, 1993, pp. 253-254) xli Yin provides a detailed list of what components must be prevalent when performing a case study, while Lekvall & Wahlbin’s model is the sequence of work during the research. We have left out the part report in our research design model since the report has been written continuously during our study. We have also left out the actual final recommendations, which are also part of the sequence of work in Lekvall & Wahlbin (1993, p.250) since this study aims to explain a phenomenon, and not to result in a final decision. A more basal model for case studies is to split the research into three parts: define & design, prepare, collect & analyse and analyse & conclude. The first is essentially the same as the first two horizontal blocks in Table 4-2, the second corresponds to the next three blocks and the last third is a combination of the analysis and conclusions and report. (Yin, 1994, p.49) xlii Bell (1995, p. 30) says that if there are no hypothesises when beginning a study, there is a risk that a massive amount of information is collected that one has no idea of what to do with.

xliii The frame of references is the sum of all knowledge and theory used to make up a mental image of how the system in question works and how the focused research questions are inter-connected with it. All that is collected during the research should fit inside the systemic view of the frame of references; all other data is pure coincidence. (Lekvall & Wahlbin, 1993, p. 131) xliv Theory development is crucial to the case study, field contacts should not be made as quickly as possible and relevant data collection depends first on an understanding of what is being studied (Yin, 1994, p.27) xlv Merely a review of the relevant literature would not result in anything but pages of text. (Bell, 2000) xlvi The theoretical frame of references’ main objective is to give the researcher an idea of how to classify and interpret the data from the study, often by facilitating the construction of an analytical framework. (Bell, 2000, p. 75) xlvii To discuss the ‘hot topics’ further into the interview is appropriate for a more productive interview. (Porter 1998, p. 382) xlviii According to Arbnor & Bjerke (p.251), validity in a system analysis is not so much determined by matching of theory and empirics, but more by that the results should be perceived as correct and reasonable by the researchers and the participants in the real system. They argue that one should cover as many perspectives and aspects of the system as possible, which is what we have done through the method of triangulation. xlix The best method is to write the report so that an auditor could perform the same study and get the same results. (Yin, 1994) l Both Jensen (1995, pp. 94-95) and Bell (2000, p. 88) writes that multiple sources are better in order to control the truth. Jensen (1995, p. 101) further suggests a use of different angles to give better precision in results. We primarily used interviews, but with different angles. However, in practice triangulation is often very complex and gives diffuse results; it can be hard to tell whether the data point in the same direction or if that is even desirable. (Jensen, 1995, pp. 94-95) li This is very similar to the method that Arbnor & Bjerke (2007, p.251) suggest as appropriate in a systems’ analysis in order to secure the validity of the system analytic research. It is also in accordance with Porter’s (1998, p. 378) framework for the research field study.
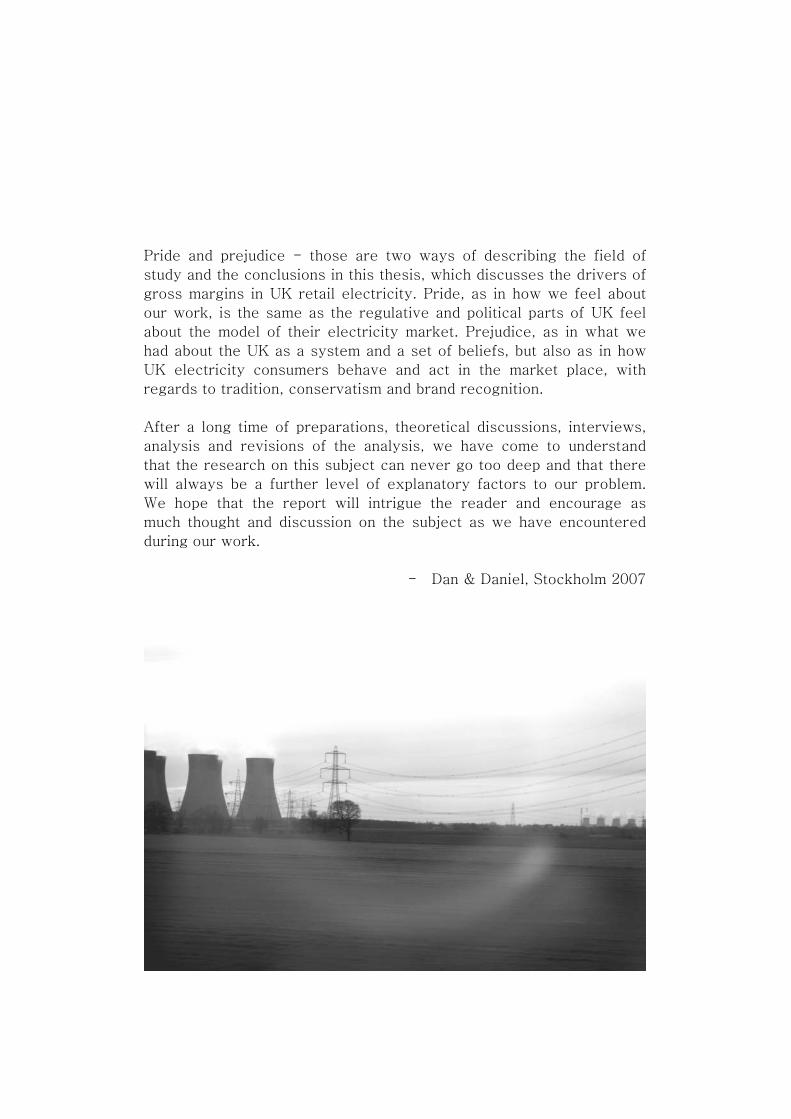
Pride and prejudice - those are two ways of describing the field of
study and the conclusions in this thesis, which discusses the drivers of
gross margins in UK retail electricity. Pride, as in how we feel about
our work, is the same as the regulative and political parts of UK feel
about the model of their electricity market. Prejudice, as in what we
had about the UK as a system and a set of beliefs, but also as in how
UK electricity consumers behave and act in the market place, with
regards to tradition, conservatism and brand recognition.
After a long time of preparations, theoretical discussions, interviews,
analysis and revisions of the analysis, we have come to understand
that the research on this subject can never go too deep and that there
will always be a further level of explanatory factors to our problem.
We hope that the report will intrigue the reader and encourage as
much thought and discussion on the subject as we have encountered
during our work.
- Dan & Daniel, Stockholm 2007