Embed Size (px)
Citation preview
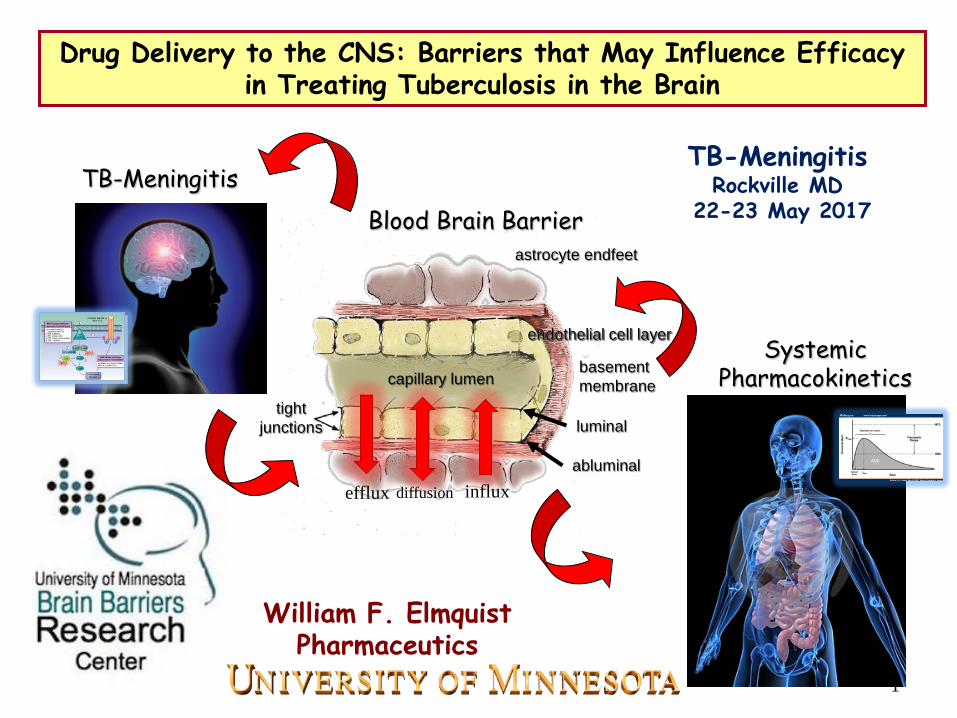
Drug Delivery to the CNS: Barriers that May Influence Efficacy in Treating Tuberculosis in the Brain
William F. ElmquistPharmaceutics
SystemicPharmacokinetics
TB-Meningitis
astrocyte endfeet
endothelial cell layerendothelial cell layer
basementmembranecapillary lumen
tightjunctions luminal
abluminal
Blood Brain Barrier
1
TB-MeningitisRockville MD
22-23 May 2017
efflux influxdiffusion

Why Does a Drug Work ??
Connect - Disconnect of the PK-PD Relationship
Pharmacodynamics(events at the target)
Pharmacokinetics(conc-time in blood)
Information
Balance
Why Doesn’t a Drug Work ??
Translational research in CNS Drug Delivery- Must keep in mind the big questions !
Information
Why does this one work, and that one doesn’t ??
Flow
Why
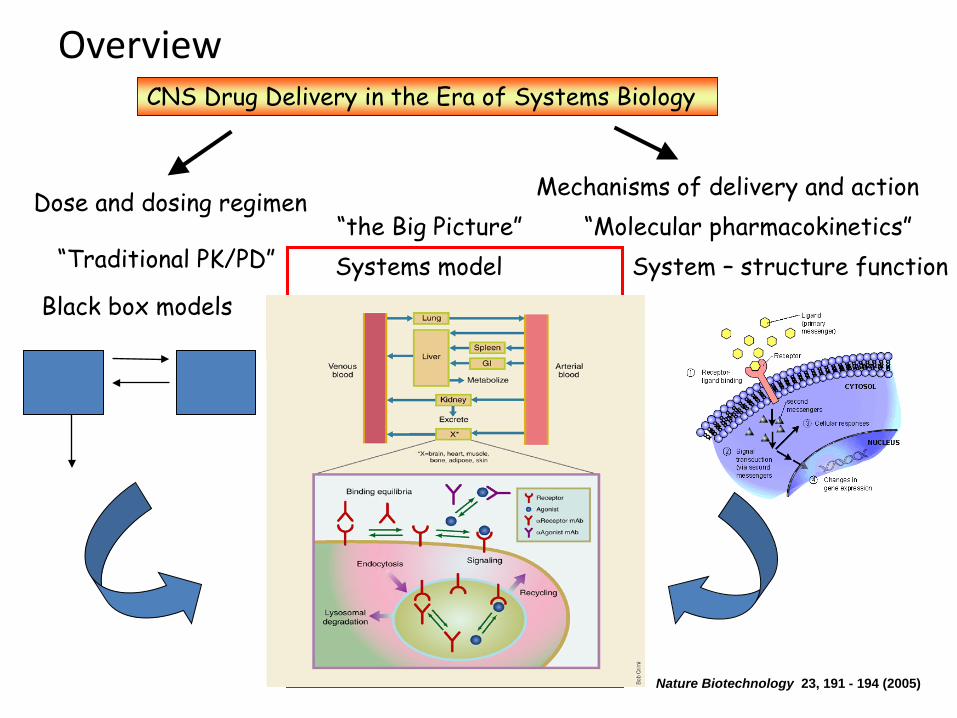
CNS Drug Delivery in the Era of Systems Biology
Dose and dosing regimen Mechanisms of delivery and action
“Traditional PK/PD”“Molecular pharmacokinetics”
Black box modelsSystem – structure function
Nature Biotechnology 23, 191 - 194 (2005)
Systems model“the Big Picture”
Overview
plasma
choroid plexusarachnoid membrane
BBBECF
ICF
ependymapia mater
neuronaland
glial cellmem-branes
cerebrospinal fluid
Lung
HeartKidney
Brain
Liver
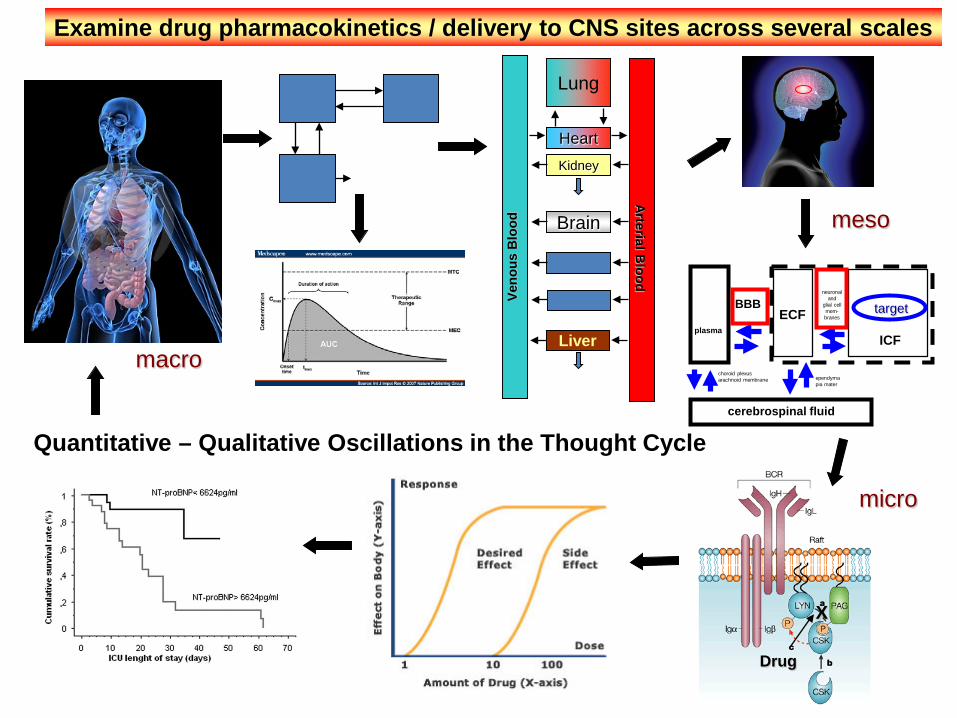
Examine drug pharmacokinetics / delivery to CNS sites across several scales
target
Drug
X
Veno
us B
lood
Arterial Blood
Quantitative – Qualitative Oscillations in the Thought Cycle
macro
micro
meso
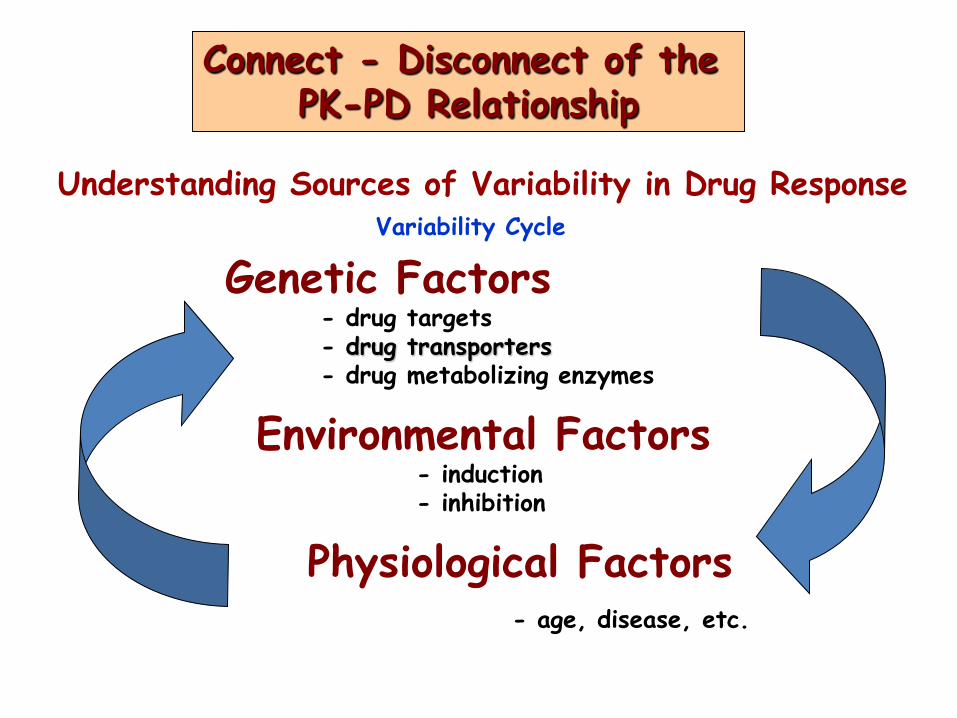
Genetic Factors- drug targets- drug transporters- drug metabolizing enzymes
Environmental Factors- induction- inhibition
Physiological Factors- age, disease, etc.
Understanding Sources of Variability in Drug ResponseVariability Cycle
Connect - Disconnect of the PK-PD Relationship
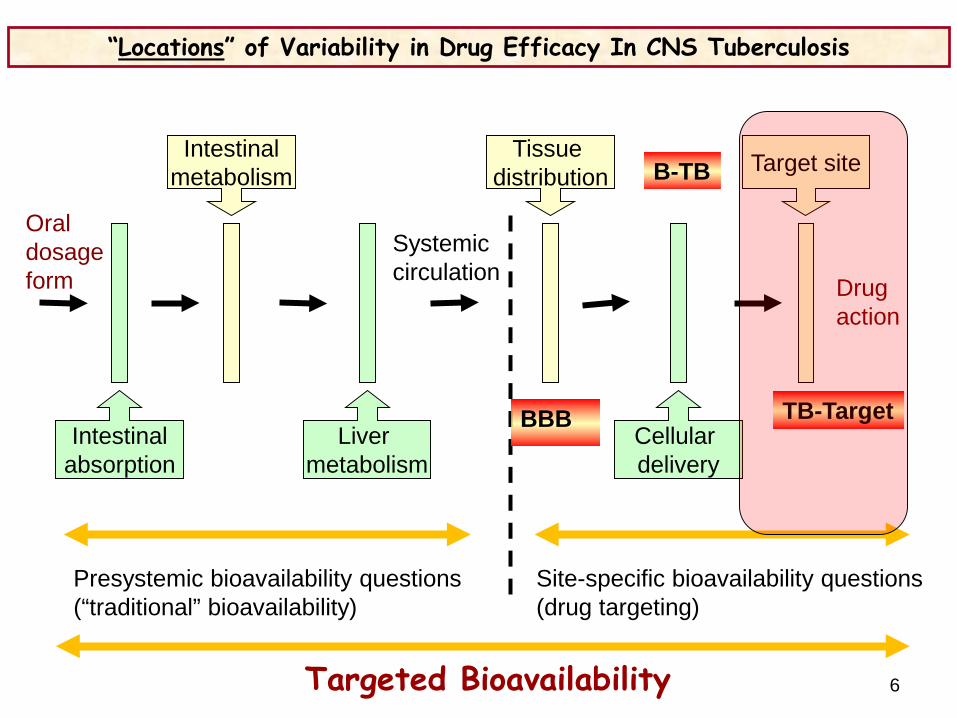
“Locations” of Variability in Drug Efficacy In CNS Tuberculosis
Presystemic bioavailability questions (“traditional” bioavailability)
Site-specific bioavailability questions (drug targeting)
Oraldosageform
Systemiccirculation Drug
action
Targeted Bioavailability
Intestinalabsorption
Liver metabolism
Cellular delivery
Intestinalmetabolism
Tissue distribution Target site
BBB
B-TB
TB-Target
6

“Locations” of Variability in Drug Response
Presystemic bioavailability questions (“traditional” bioavailability)
Site-specific bioavailability questions (drug targeting)
Oraldosageform
Systemiccirculation Drug
action
Targeted Bioavailability
Intestinalabsorption
Liver metabolism
Cellular delivery
Intestinalmetabolism
Tissue distribution Target site
Systemicclearance
Mechanisms that influence the fraction of the drug in the systemic circulation that is available for distribution to target tissue and the exposure of the tissue to the drug
- distribution of blood flow- ratio of total clearance to a distributional clearanceDistributional clearance - membrane permeability, competing carrier-mediated transport (influx or efflux), protein-binding, intracellular metabolism, tissue transit time, capillary structureTotal clearance – will affect the availability of the drug in the blood to distribute to the tissue
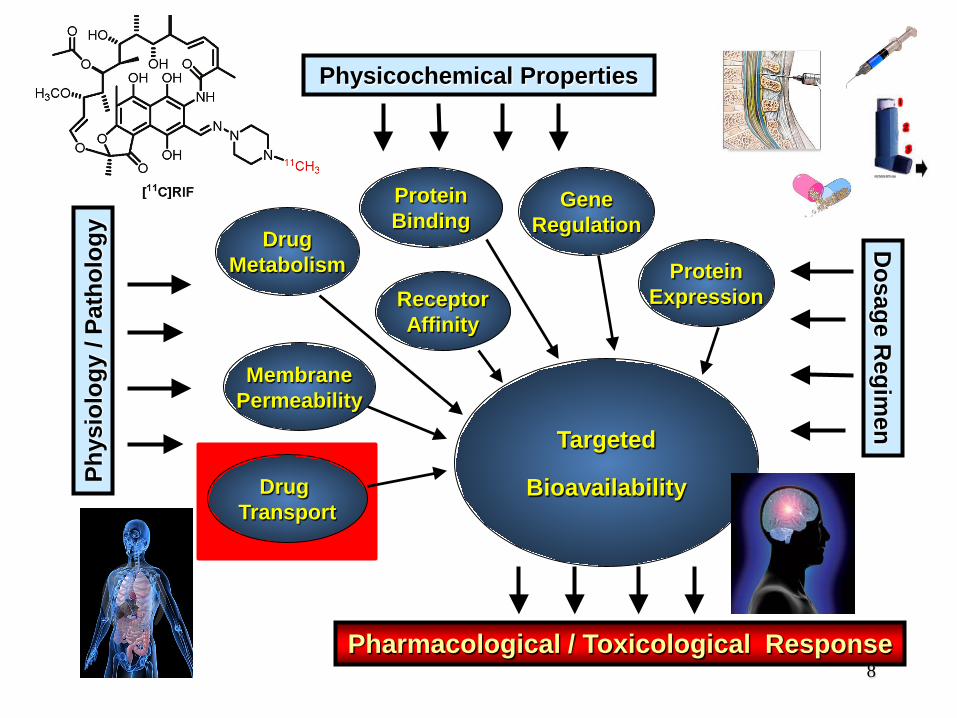
Physicochemical PropertiesPh
ysio
logy
/ Pa
thol
ogy Drug
MetabolismReceptorAffinity
ProteinBinding
MembranePermeability
Drug Transport
GeneRegulation
Targeted
Bioavailability
Dosage R
egimen
ProteinExpression
Pharmacological / Toxicological Response8
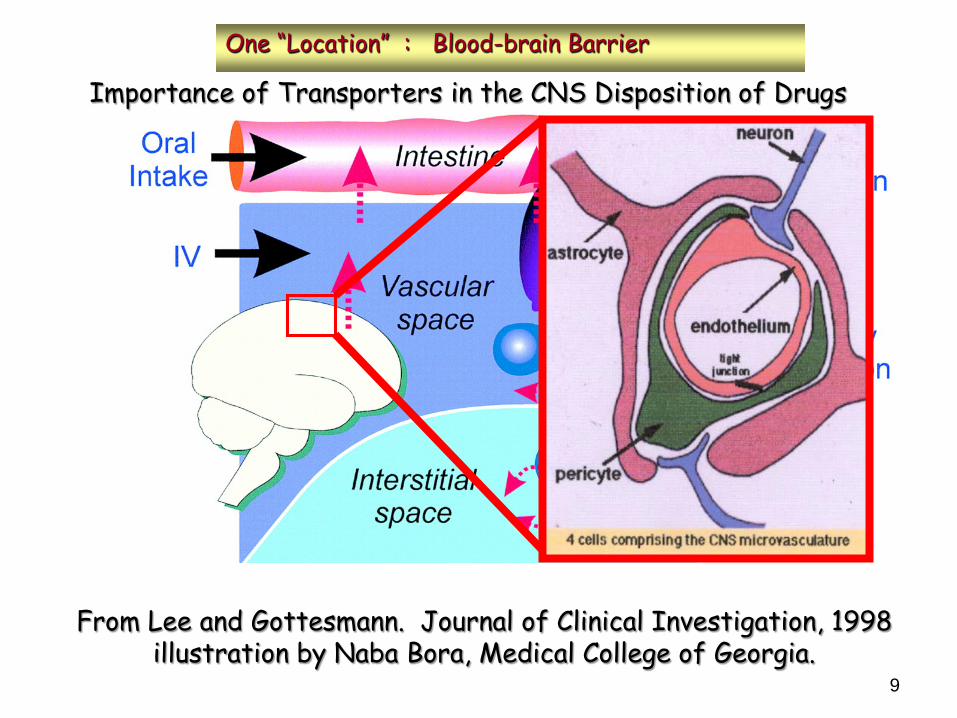
Importance of Transporters in the CNS Disposition of Drugs
From Lee and Gottesmann. Journal of Clinical Investigation, 1998illustration by Naba Bora, Medical College of Georgia.
One “Location” : Blood-brain Barrier
9

Modifed from:
Loscher, Aug. 2005Nature Rev. Neurosci.
GLUT1
P-gp(p-glycoprotein)
Co-localizationGLUT1 - P-gp
brain
brainbrain
blood
Clout
Clin
BCRPP-gp
10
Tight Junction
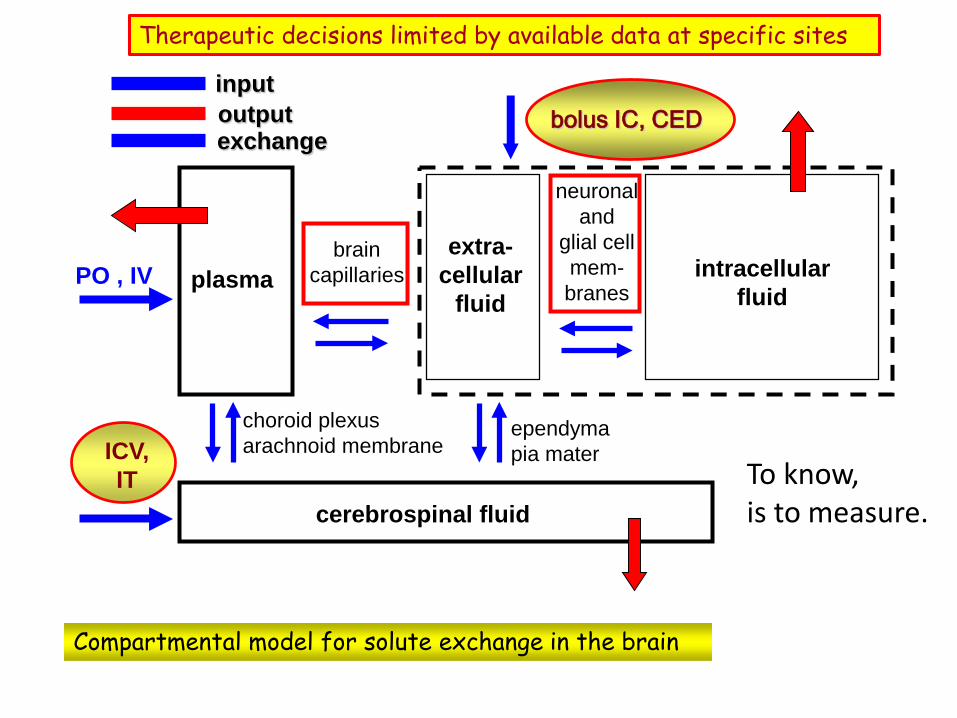
Compartmental model for solute exchange in the brain
Therapeutic decisions limited by available data at specific sites
plasma
choroid plexusarachnoid membrane
braincapillaries
extra-cellular
fluidintracellular
fluid
ependymapia mater
neuronaland
glial cellmem-branes
cerebrospinal fluid
PO , IV
ICV,IT
bolus IC, CEDinputoutputexchange
To know,is to measure.
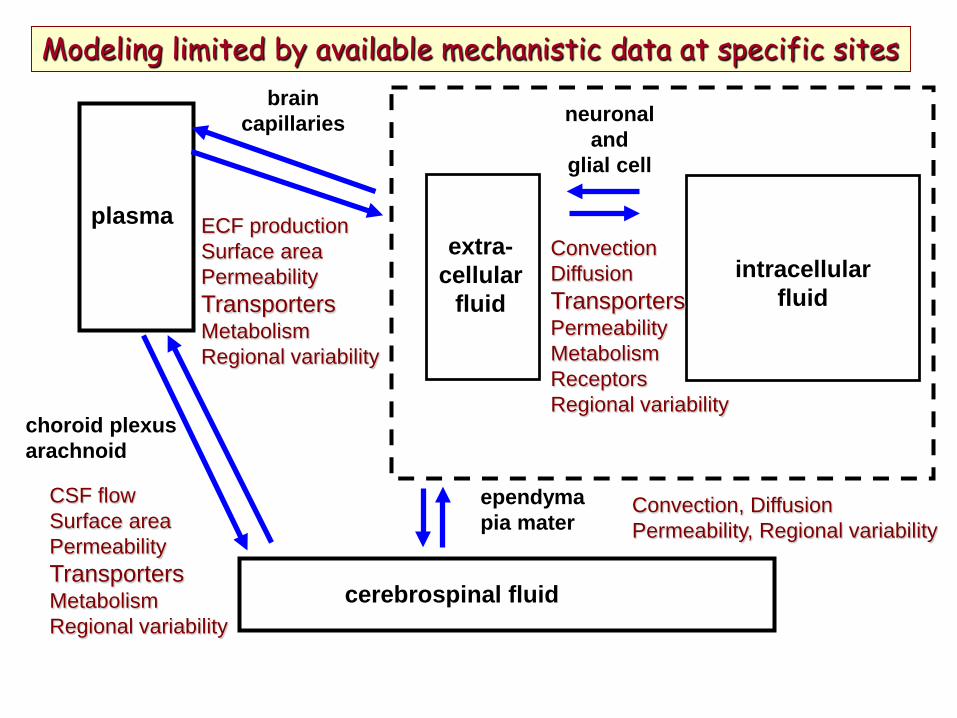
Modeling limited by available mechanistic data at specific sites
plasma
choroid plexusarachnoid
braincapillaries
extra-cellular
fluidintracellular
fluid
ependymapia mater
neuronaland
glial cell
cerebrospinal fluid
CSF flowSurface areaPermeabilityTransportersMetabolismRegional variability
ECF productionSurface areaPermeabilityTransportersMetabolismRegional variability
ConvectionDiffusionTransportersPermeabilityMetabolismReceptorsRegional variability
Convection, DiffusionPermeability, Regional variability
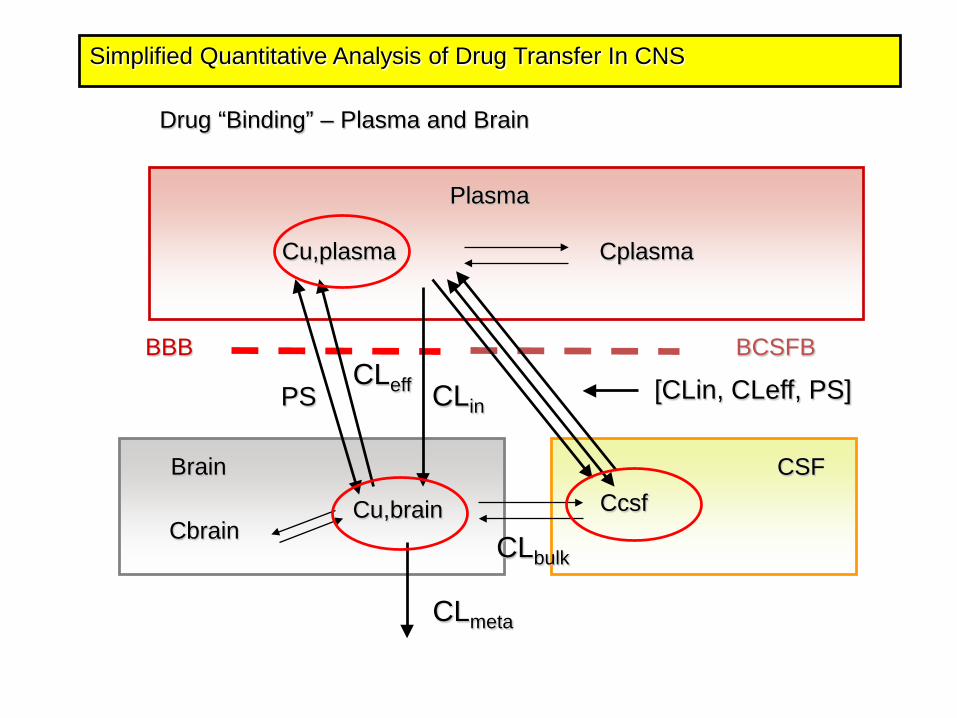
Simplified Quantitative Analysis of Drug Transfer In CNS
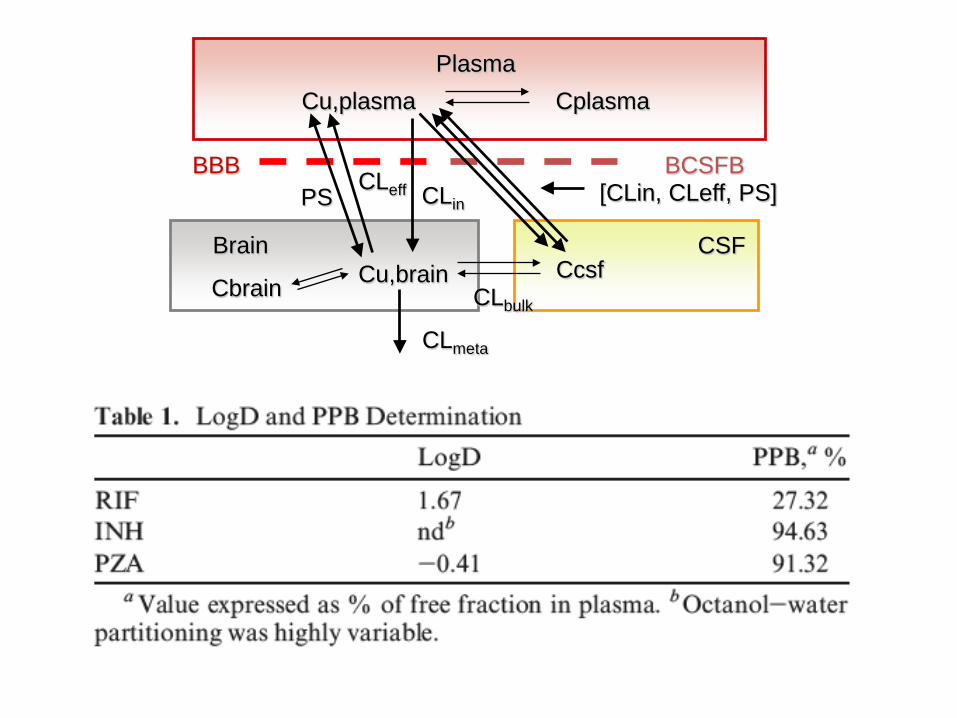
Drug “Binding” – Plasma and Brain
Plasma
Cu,plasma Cplasma
Brain CSF
BBB BCSFB
PSCLeff CLin
CcsfCu,brainCbrain CLbulk
CLmeta
[CLin, CLeff, PS]
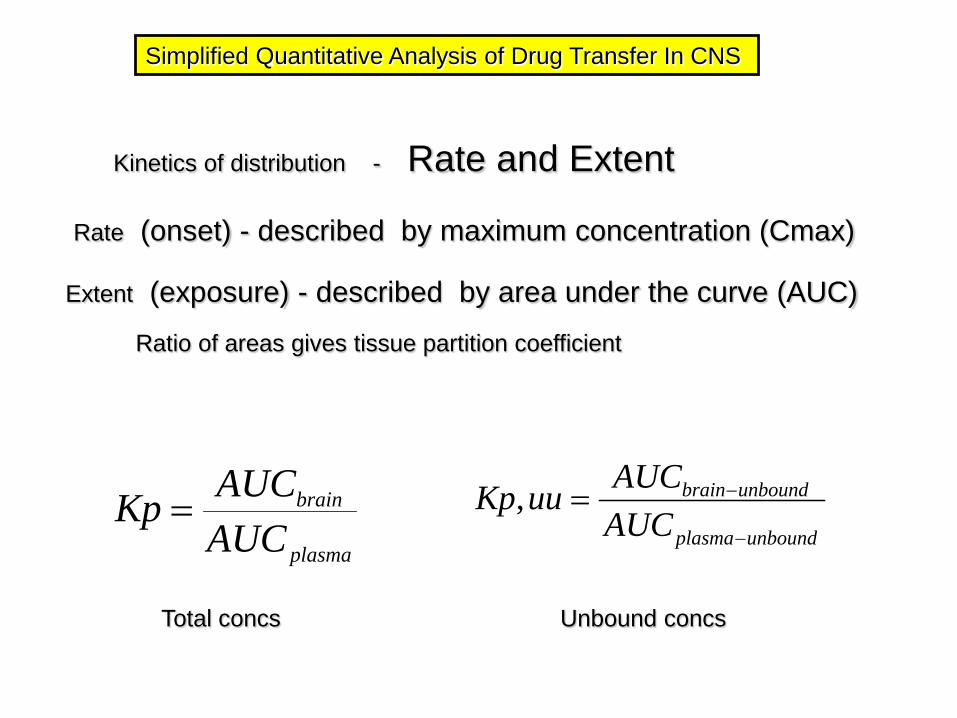
Simplified Quantitative Analysis of Drug Transfer In CNS
Kinetics of distribution - Rate and Extent
Extent (exposure) - described by area under the curve (AUC)
Ratio of areas gives tissue partition coefficient
plasma
brain
AUCAUCKp =
unboundplasma
unboundbrain
AUCAUCuuKp
−
−=,
Total concs Unbound concs
Rate (onset) - described by maximum concentration (Cmax)
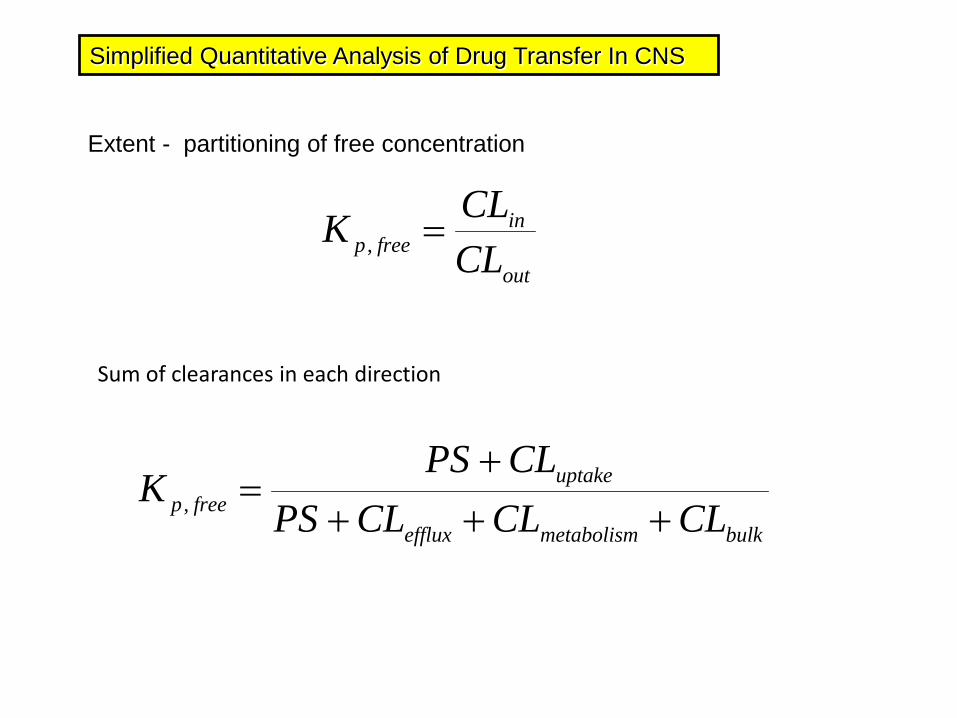
Simplified Quantitative Analysis of Drug Transfer In CNS
Extent - partitioning of free concentration
out
infreep CL
CLK =,
bulkmetabolismefflux
uptakefreep CLCLCLPS
CLPSK
++++
=,
Sum of clearances in each direction
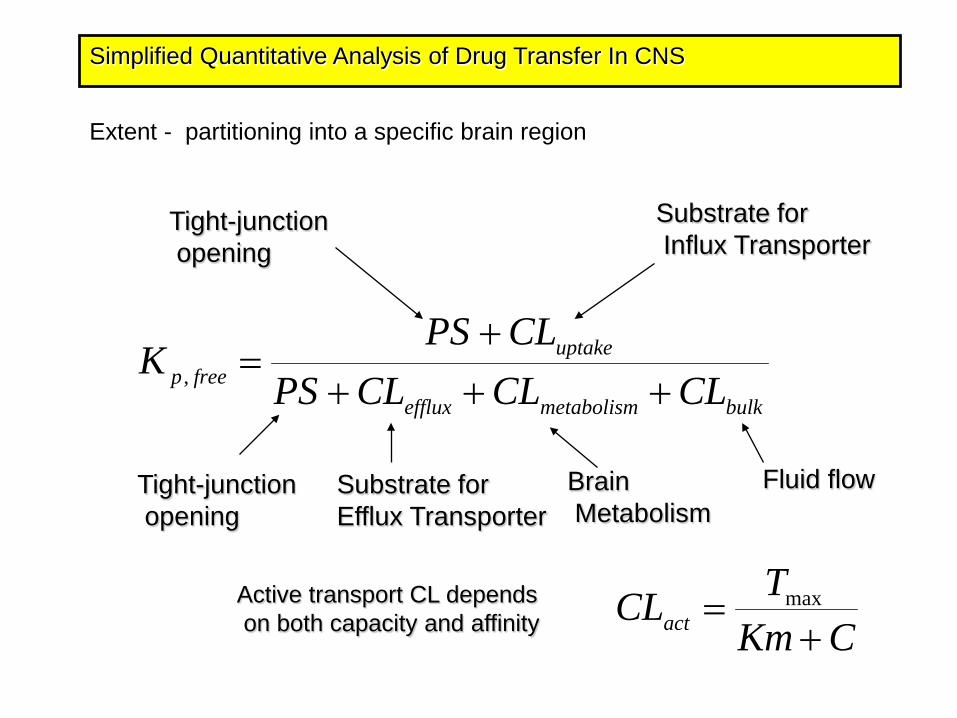
Simplified Quantitative Analysis of Drug Transfer In CNS
Extent - partitioning into a specific brain region
bulkmetabolismefflux
uptakefreep CLCLCLPS
CLPSK
++++
=,
Tight-junctionopening
Tight-junctionopening
Substrate forEfflux Transporter
Substrate forInflux Transporter
Active transport CL dependson both capacity and affinity CKm
TCLact += max
BrainMetabolism
Fluid flow
Representative Case Study:The Treatment of Glioblastoma with
Inhibition of P53 Degradation – MDM2 Inhibitor
Minjee Kim, Jann Sarkaria
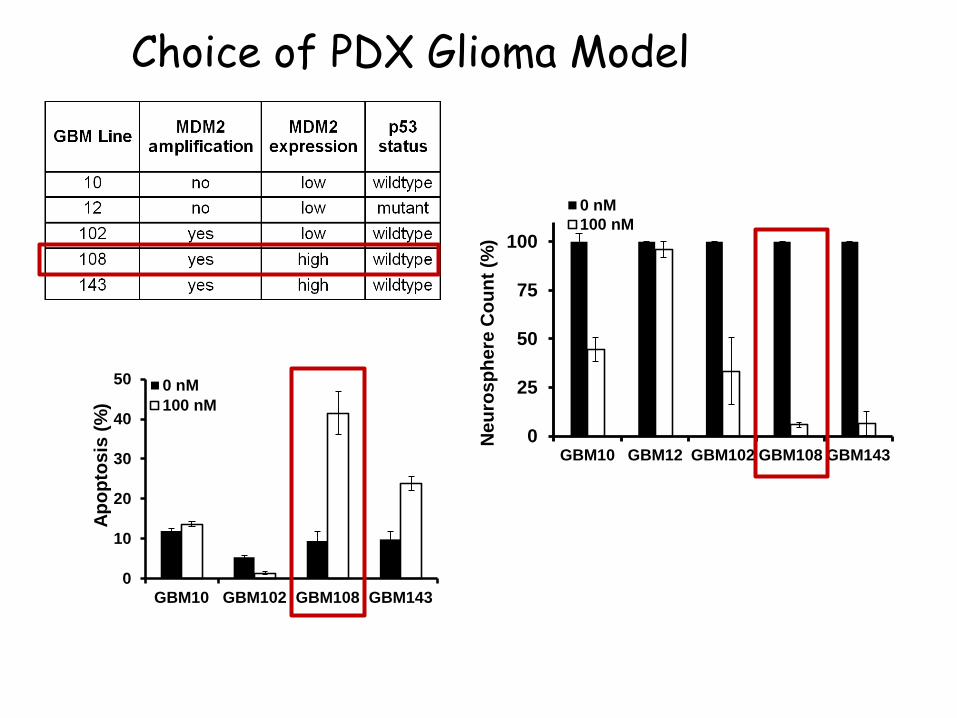
Choice of PDX Glioma Model
Neu
rosp
here
Cou
nt (%
)
0
25
50
75
100
GBM10 GBM12 GBM102 GBM108 GBM143
0 nM100 nM
0
10
20
30
40
50
GBM10 GBM102 GBM108 GBM143
0 nM100 nM
Apop
tosi
s (%
)
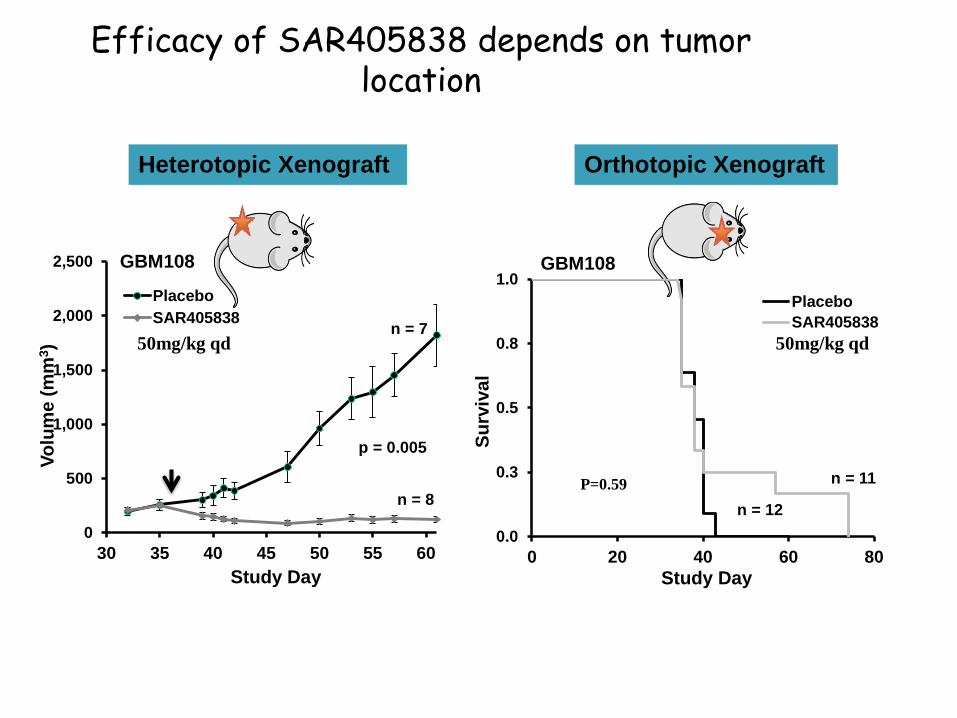
Efficacy of SAR405838 depends on tumor location
Heterotopic Xenograft Orthotopic Xenograft
0
500
1,000
1,500
2,000
2,500
30 35 40 45 50 55 60
PlaceboSAR405838
p = 0.005
n = 7
n = 8
Volu
me
(mm
3 )
GBM108
0.0
0.3
0.5
0.8
1.0
0 20 40 60 80Study Day
PlaceboSAR405838
n = 11
n = 12Su
rviv
al
GBM108
P=0.59
Study Day
50mg/kg qd 50mg/kg qd
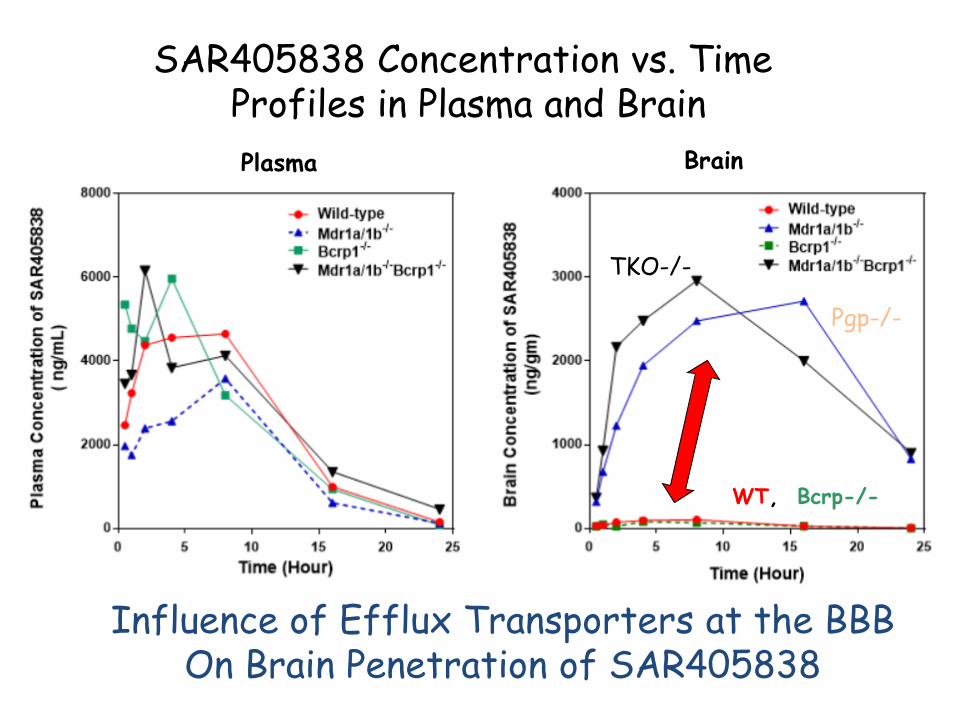
SAR405838 Concentration vs. TimeProfiles in Plasma and Brain Plasma Brain
Influence of Efflux Transporters at the BBBOn Brain Penetration of SAR405838
WT, Bcrp-/-
Pgp-/-
TKO-/-
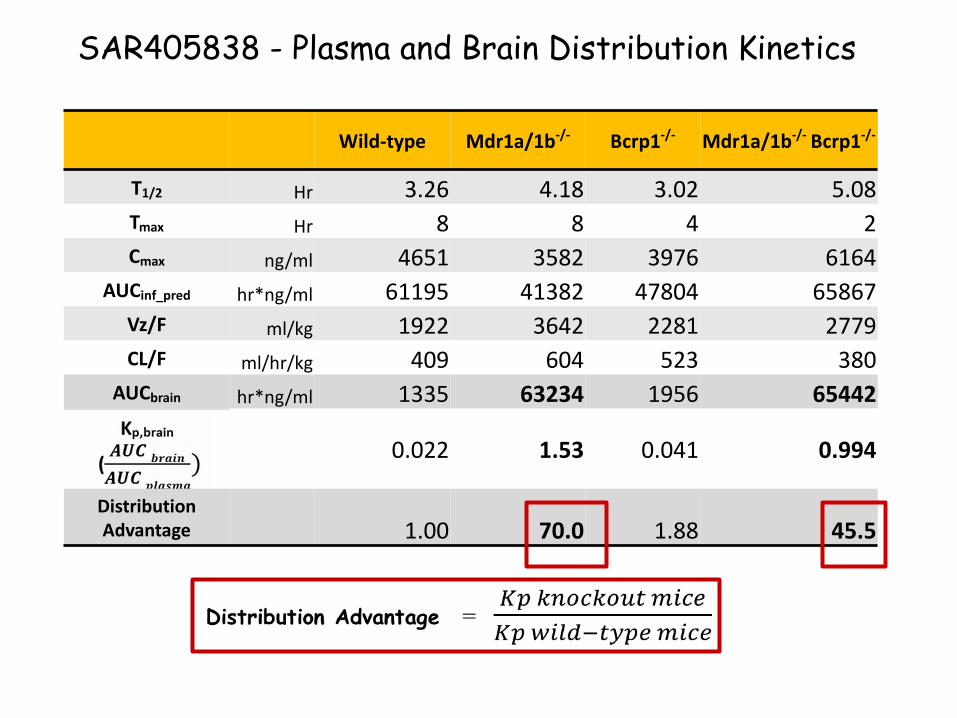
SAR405838 - Plasma and Brain Distribution Kinetics
Wild-type Mdr1a/1b-/- Bcrp1-/- Mdr1a/1b-/- Bcrp1-/-
T1/2 Hr 3.26 4.18 3.02 5.08Tmax Hr 8 8 4 2Cmax ng/ml 4651 3582 3976 6164
AUCinf_pred hr*ng/ml 61195 41382 47804 65867Vz/F ml/kg 1922 3642 2281 2779CL/F ml/hr/kg 409 604 523 380
AUCbrain hr*ng/ml 1335 63234 1956 65442
0.022 1.53 0.041 0.994
Distribution Advantage 1.00 70.0 1.88 45.5
22
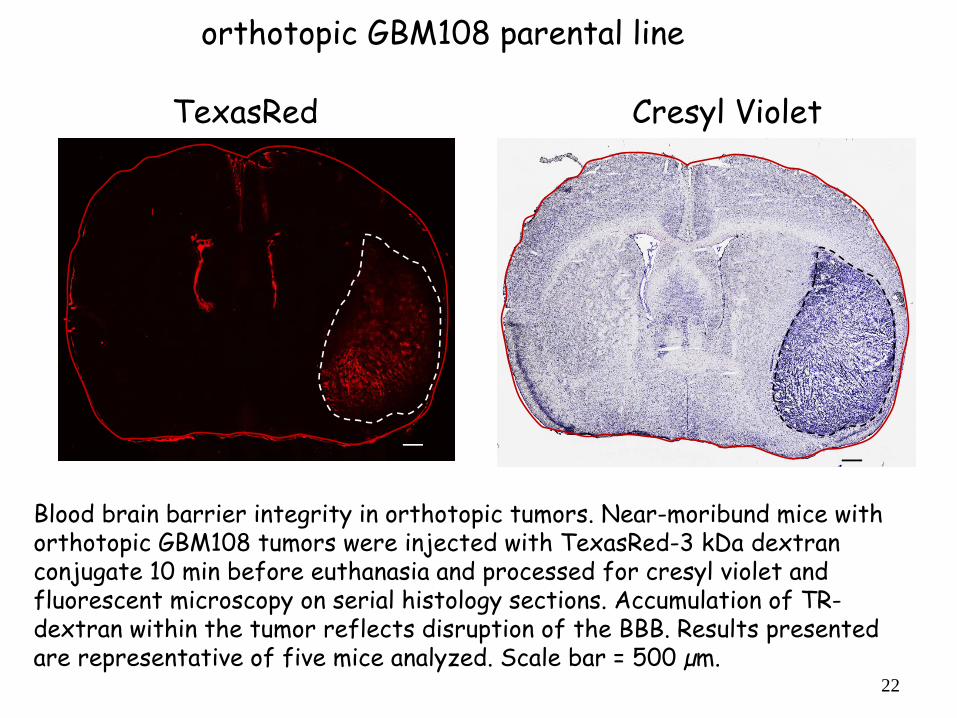
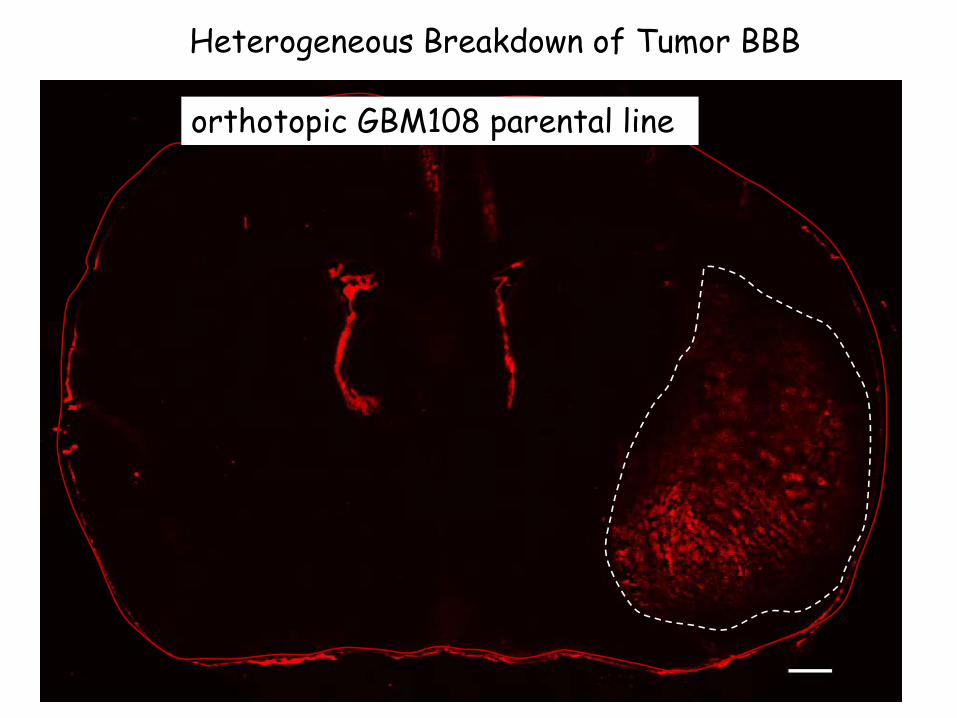
Blood brain barrier integrity in orthotopic tumors. Near-moribund mice with orthotopic GBM108 tumors were injected with TexasRed-3 kDa dextran conjugate 10 min before euthanasia and processed for cresyl violet and fluorescent microscopy on serial histology sections. Accumulation of TR-dextran within the tumor reflects disruption of the BBB. Results presented are representative of five mice analyzed. Scale bar = 500 µm.
TexasRed Cresyl Violet
orthotopic GBM108 parental line
23
Heterogeneous Breakdown of Tumor BBB
orthotopic GBM108 parental line
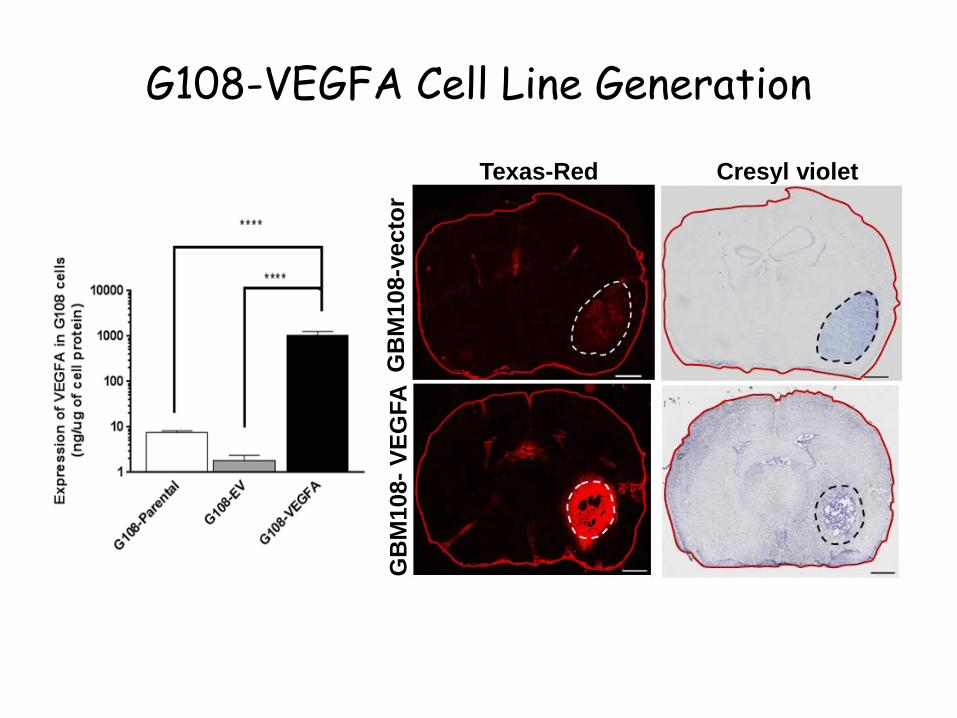
G108-VEGFA Cell Line Generation
Texas-Red Cresyl violet
GB
M10
8-ve
ctor
GB
M10
8-VE
GFA
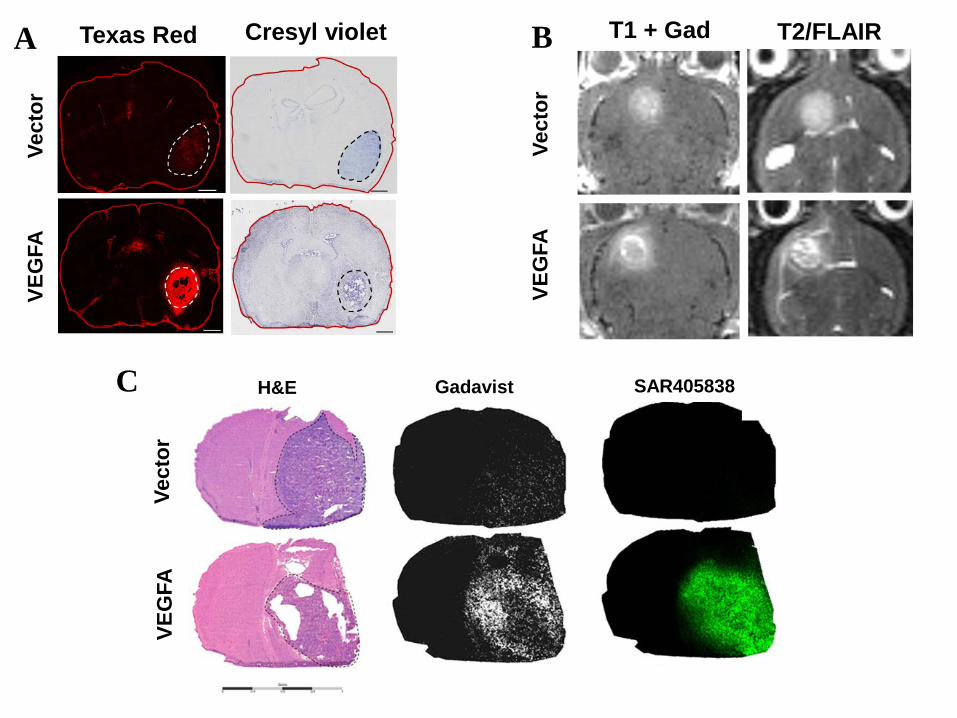
Texas Red Cresyl violetVe
ctor
VEG
FAA T1 + Gad T2/FLAIRB
Vect
orVE
GFA
Vect
orVE
GFA
C H&E Gadavist SAR405838
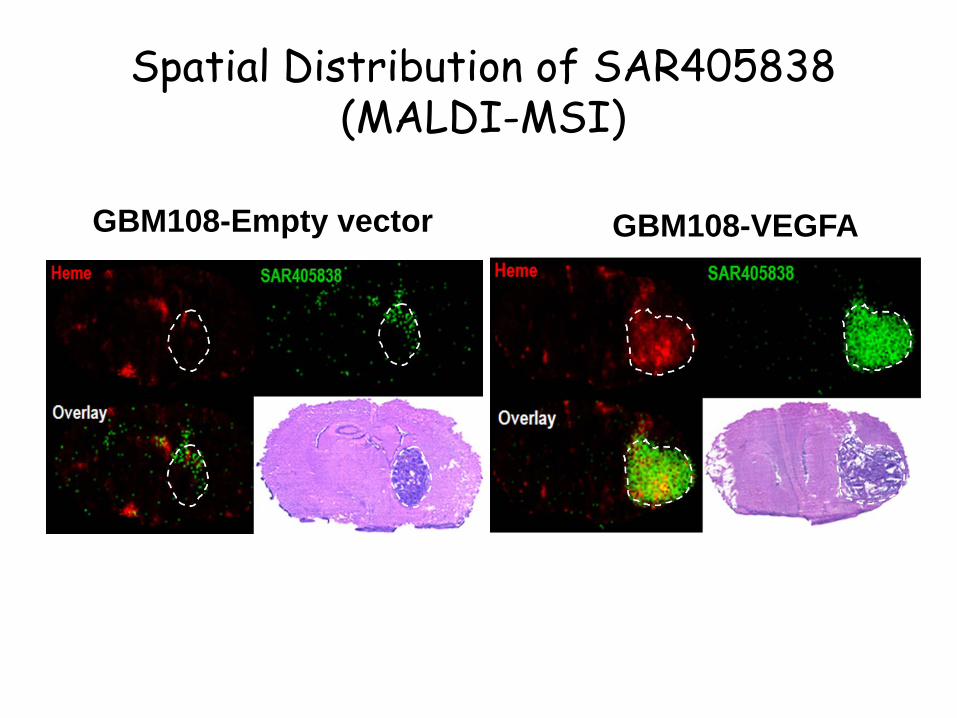
Spatial Distribution of SAR405838 (MALDI-MSI)
GBM108-Empty vector GBM108-VEGFA
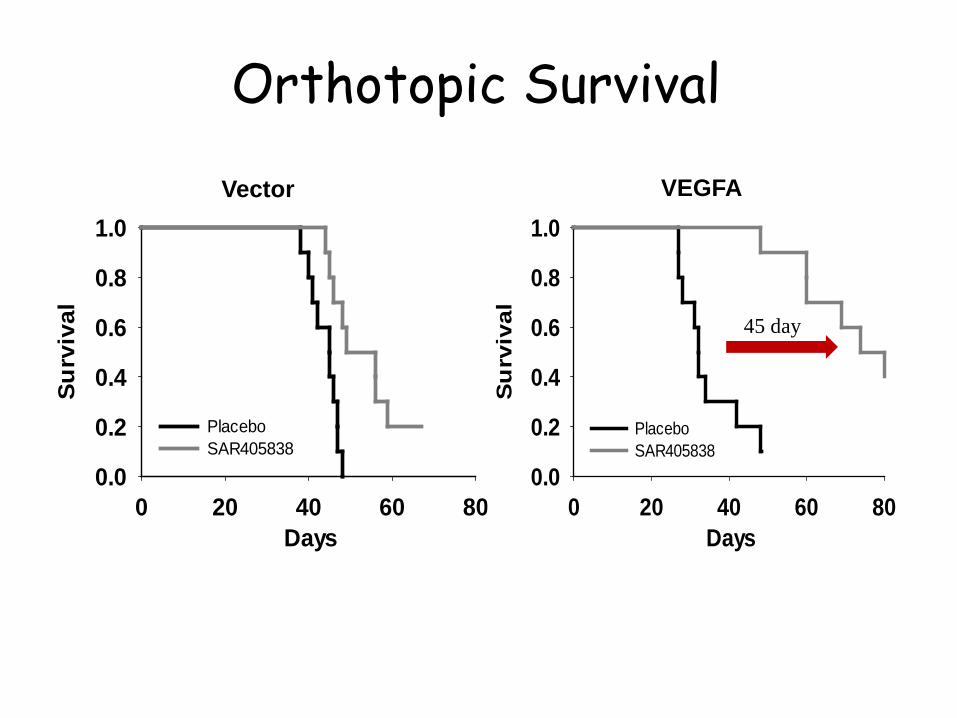
Orthotopic Survival
Days0 20 40 60 80
Surv
ival
0.0
0.2
0.4
0.6
0.8
1.0
Placebo SAR405838
Vector
Days0 20 40 60 80
Su
rviv
al0.0
0.2
0.4
0.6
0.8
1.0
Placebo SAR405838
VEGFA
45 day
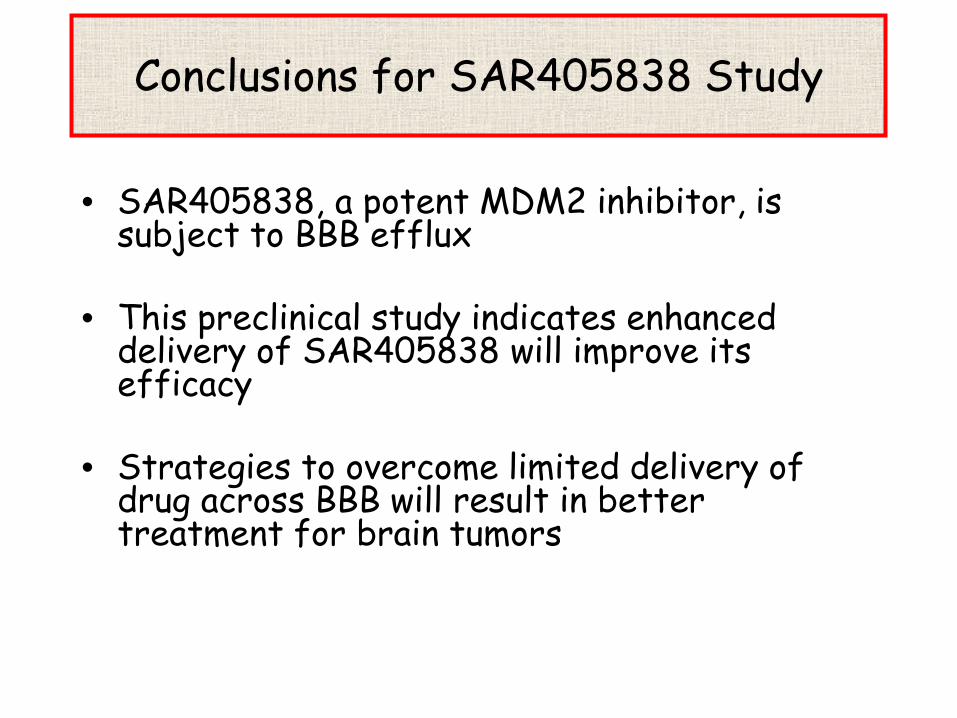
Conclusions for SAR405838 Study
• SAR405838, a potent MDM2 inhibitor, is subject to BBB efflux
• This preclinical study indicates enhanced delivery of SAR405838 will improve its efficacy
• Strategies to overcome limited delivery of drug across BBB will result in better treatment for brain tumors
Translation in the Clinic -Delivery and the BBB
Deb Brinkmann, Jann Sarkaria(Mayo Clinic)
30
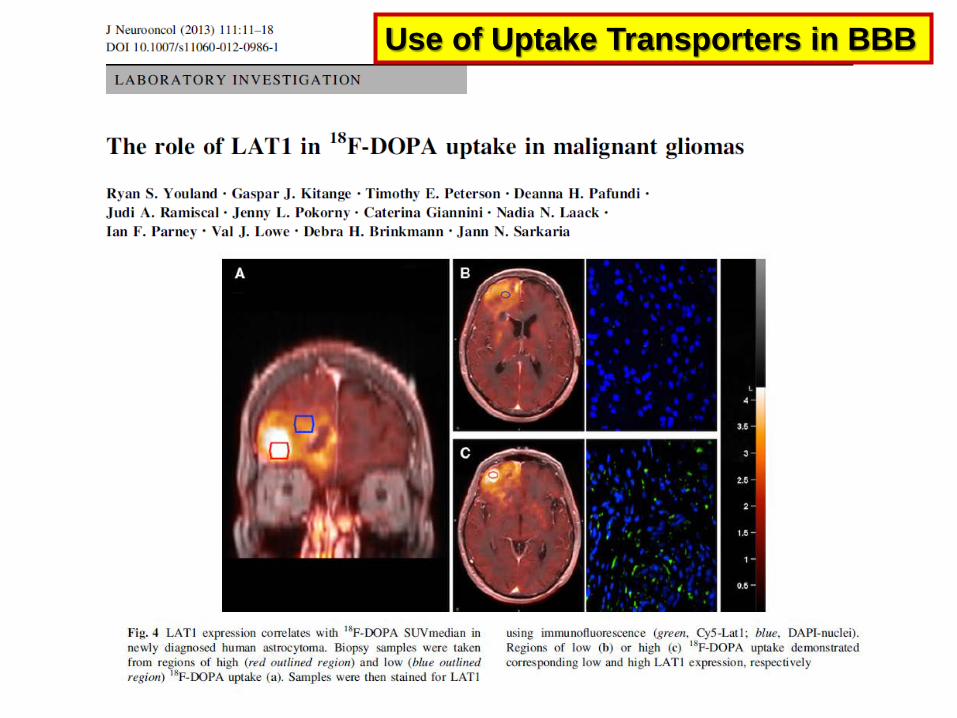
Use of Uptake Transporters in BBB
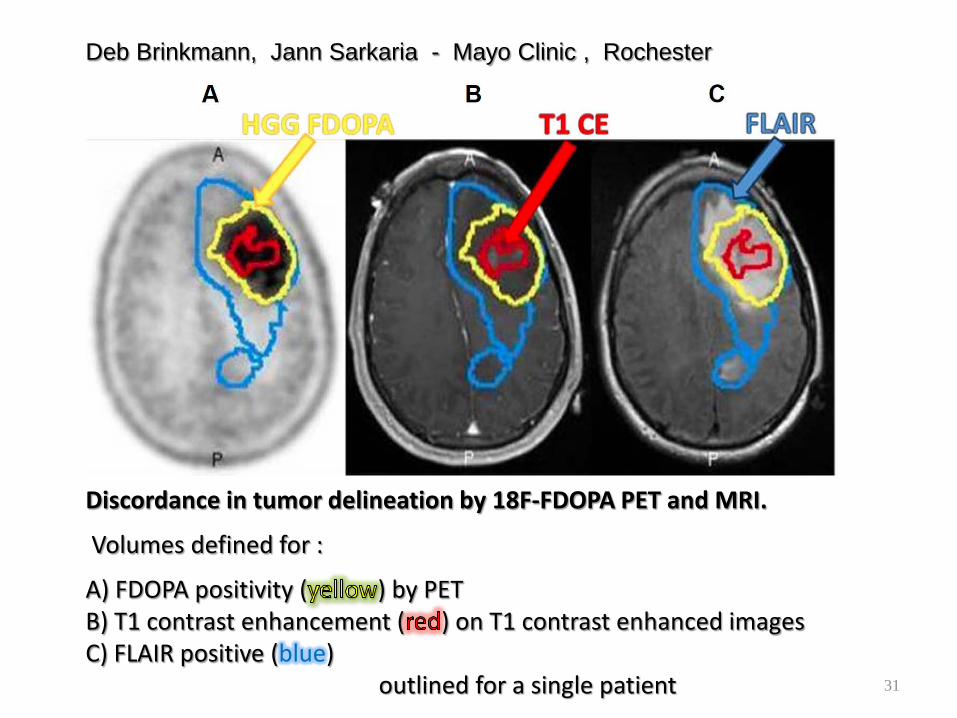
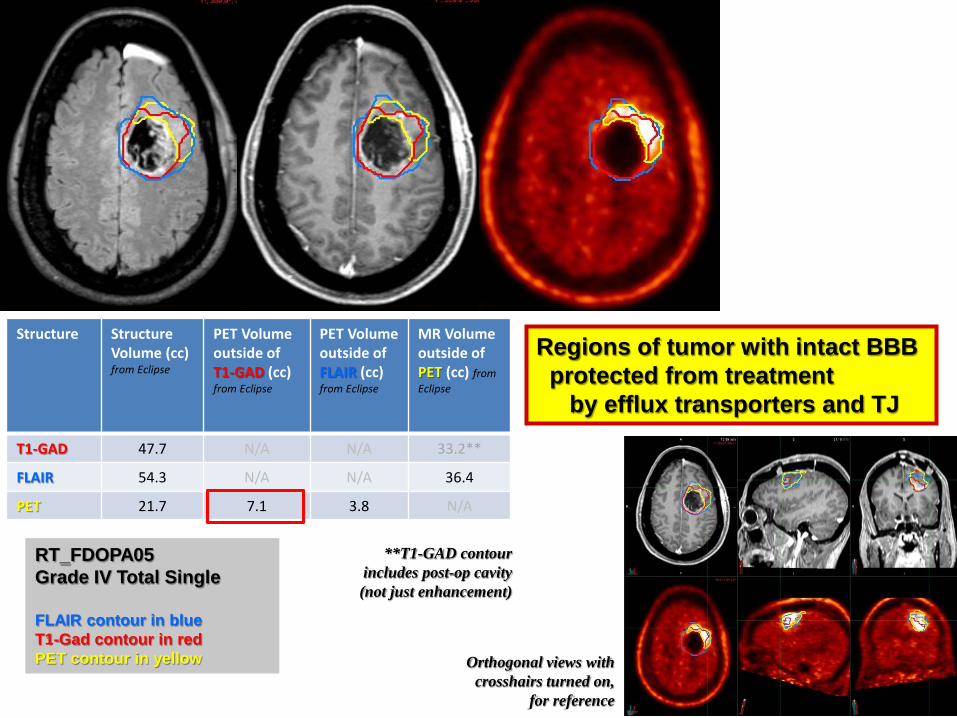
Discordance in tumor delineation by 18F-FDOPA PET and MRI.
Volumes defined for :
A) FDOPA positivity ( ) by PET B) T1 contrast enhancement ( ) on T1 contrast enhanced imagesC) FLAIR positive (blue)
outlined for a single patient
Deb Brinkmann, Jann Sarkaria - Mayo Clinic , Rochester
31
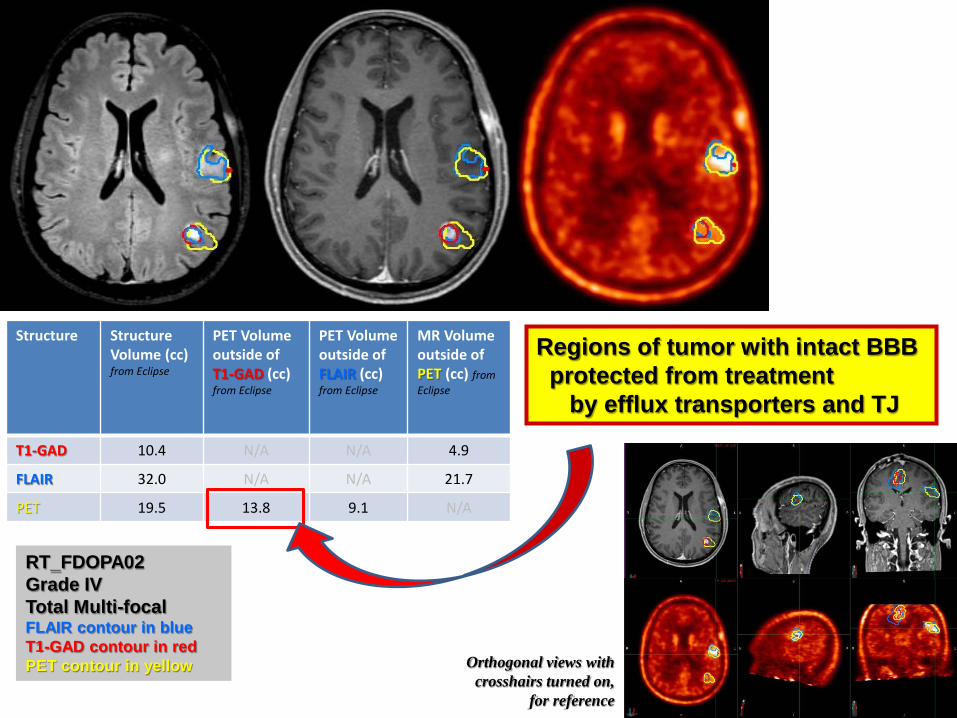
Structure Structure Volume (cc) from Eclipse
PET Volume outside of T1-GAD (cc) from Eclipse
PET Volume outside of FLAIR (cc) from Eclipse
MR Volume outside of PET (cc) fromEclipse
T1-GAD 10.4 N/A N/A 4.9
FLAIR 32.0 N/A N/A 21.7
PET 19.5 13.8 9.1 N/A
RT_FDOPA02Grade IVTotal Multi-focalFLAIR contour in blueT1-GAD contour in redPET contour in yellow Orthogonal views with
crosshairs turned on, for reference
Regions of tumor with intact BBBprotected from treatment
by efflux transporters and TJ
Orthogonal views with crosshairs turned on,
for reference
RT_FDOPA05Grade IV Total Single
FLAIR contour in blueT1-Gad contour in redPET contour in yellow
Structure Structure Volume (cc) from Eclipse
PET Volume outside of T1-GAD (cc) from Eclipse
PET Volume outside of FLAIR (cc) from Eclipse
MR Volume outside of PET (cc) from Eclipse
T1-GAD 47.7 N/A N/A 33.2**
FLAIR 54.3 N/A N/A 36.4
PET 21.7 7.1 3.8 N/A
**T1-GAD contour includes post-op cavity (not just enhancement)
Regions of tumor with intact BBBprotected from treatment
by efflux transporters and TJ
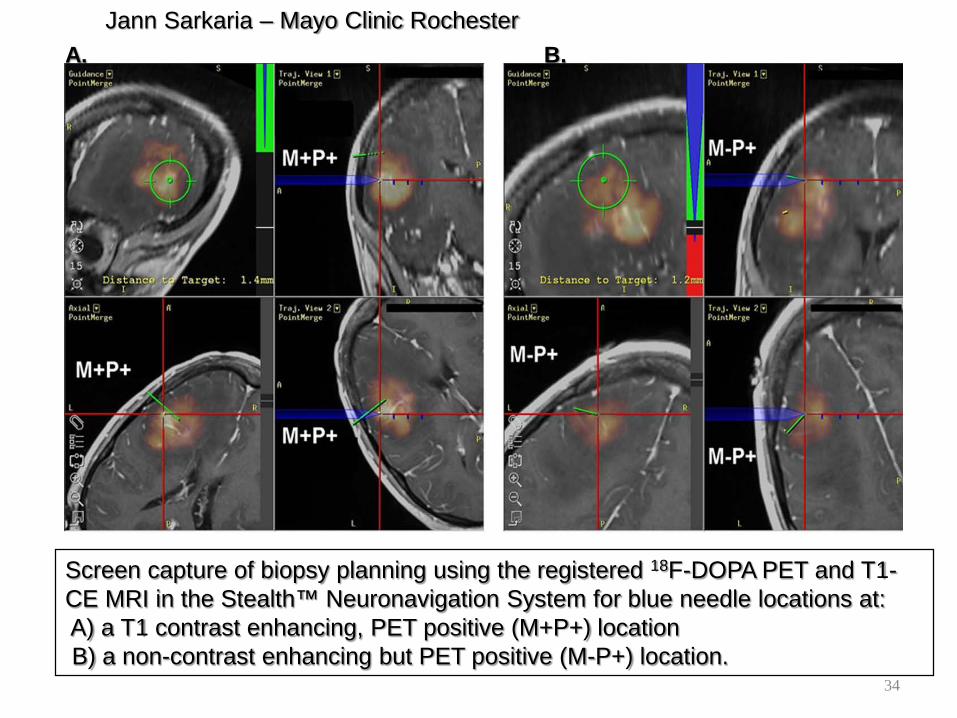
A. B.Jann Sarkaria – Mayo Clinic Rochester
Screen capture of biopsy planning using the registered 18F-DOPA PET and T1-CE MRI in the Stealth™ Neuronavigation System for blue needle locations at:A) a T1 contrast enhancing, PET positive (M+P+) location B) a non-contrast enhancing but PET positive (M-P+) location.
34
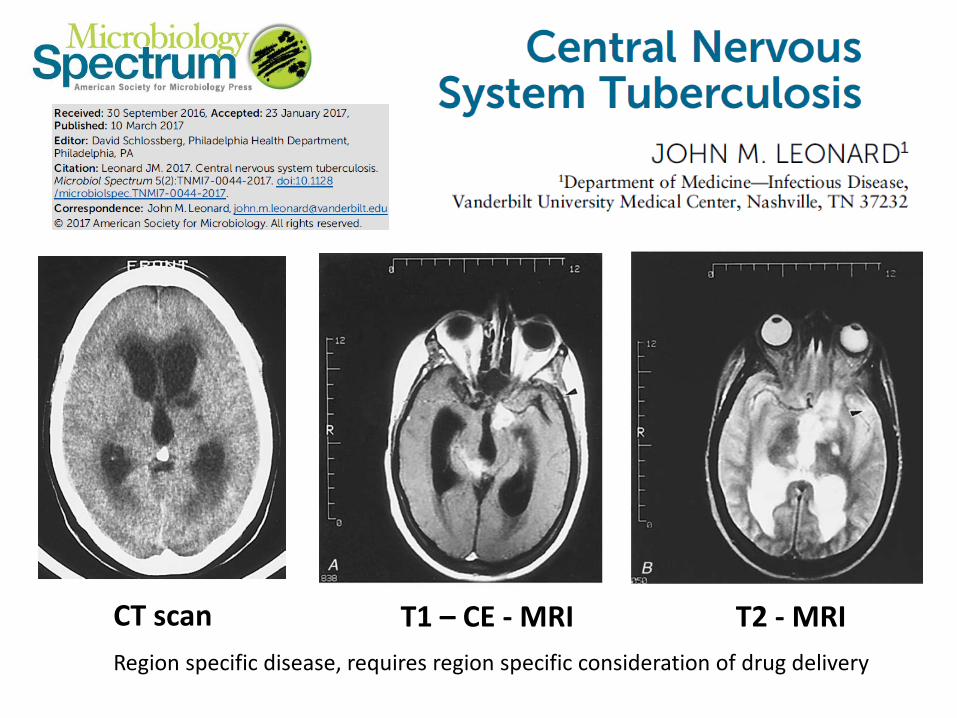
CT scan T1 – CE - MRI T2 - MRIRegion specific disease, requires region specific consideration of drug delivery
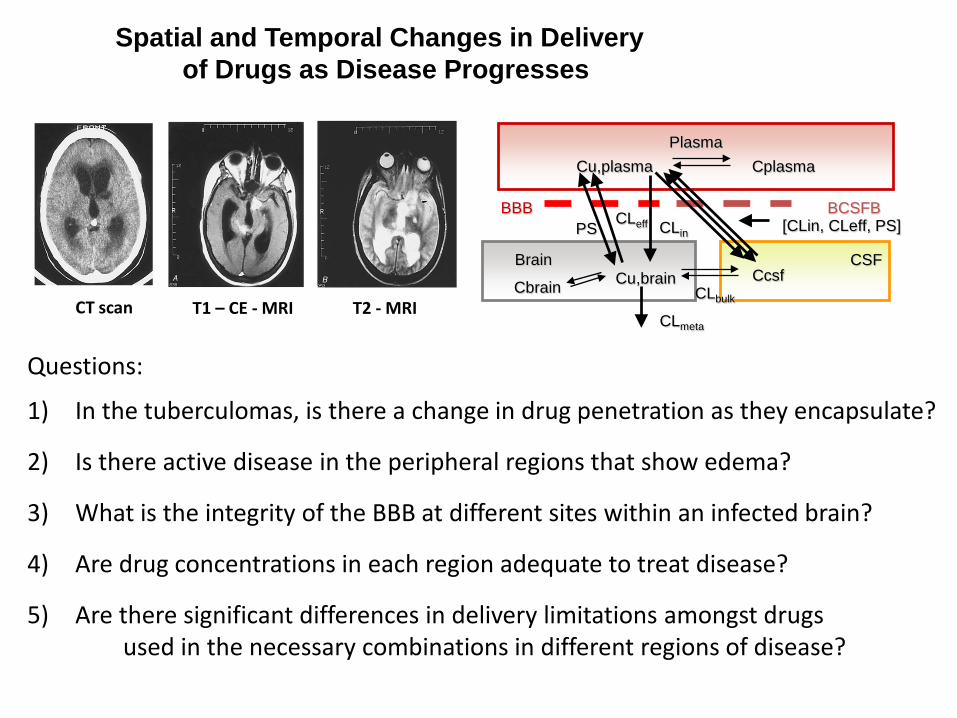
CT scan T1 – CE - MRI T2 - MRI
Questions:
1) In the tuberculomas, is there a change in drug penetration as they encapsulate?
2) Is there active disease in the peripheral regions that show edema?
3) What is the integrity of the BBB at different sites within an infected brain?
4) Are drug concentrations in each region adequate to treat disease?
5) Are there significant differences in delivery limitations amongst drugsused in the necessary combinations in different regions of disease?
PlasmaCu,plasma Cplasma
Brain CSF
BBB BCSFBPS CLeff CLin
CcsfCu,brainCbrain CLbulk
CLmeta
[CLin, CLeff, PS]
Spatial and Temporal Changes in Delivery of Drugs as Disease Progresses
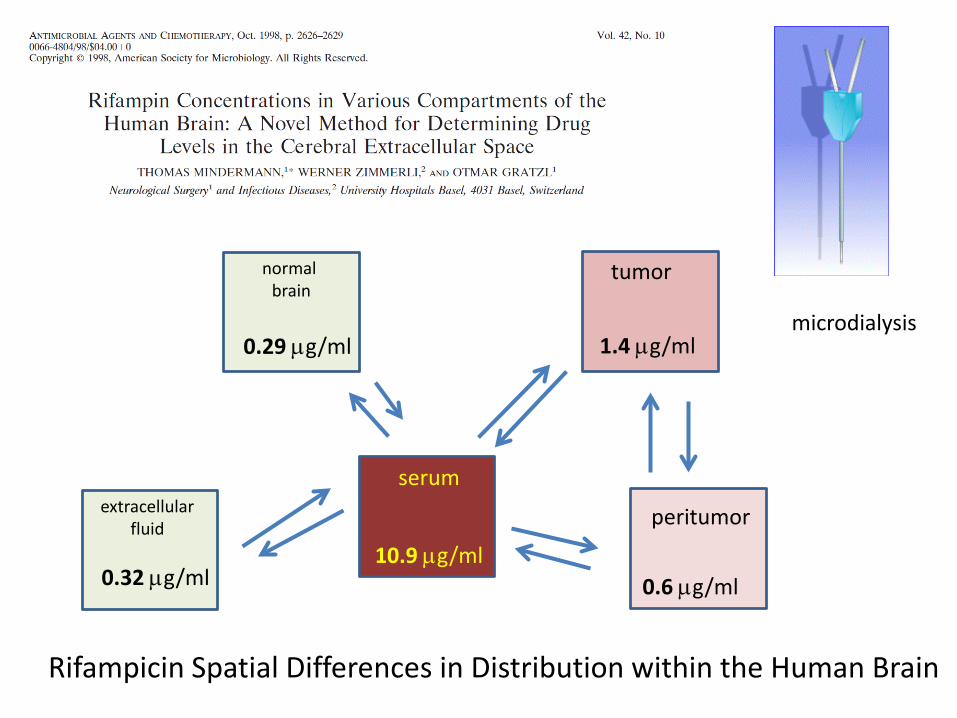
serum
normal brain
tumor
peritumorextracellularfluid
10.9 µg/ml
0.29 µg/ml
0.32 µg/ml 0.6 µg/ml
1.4 µg/ml
Rifampicin Spatial Differences in Distribution within the Human Brain
microdialysis
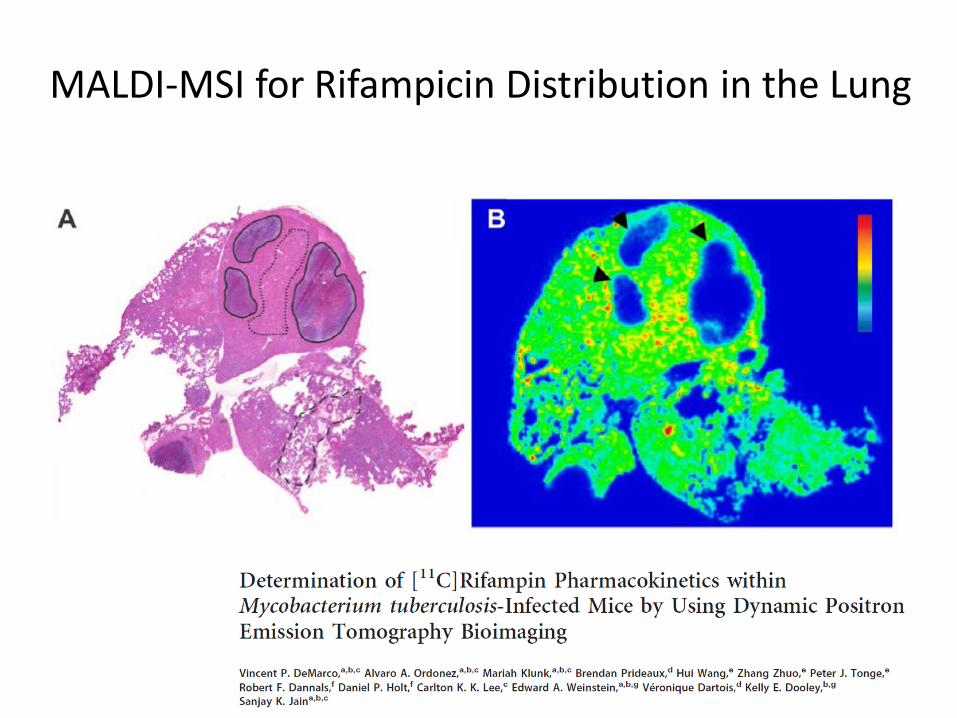
MALDI-MSI for Rifampicin Distribution in the Lung
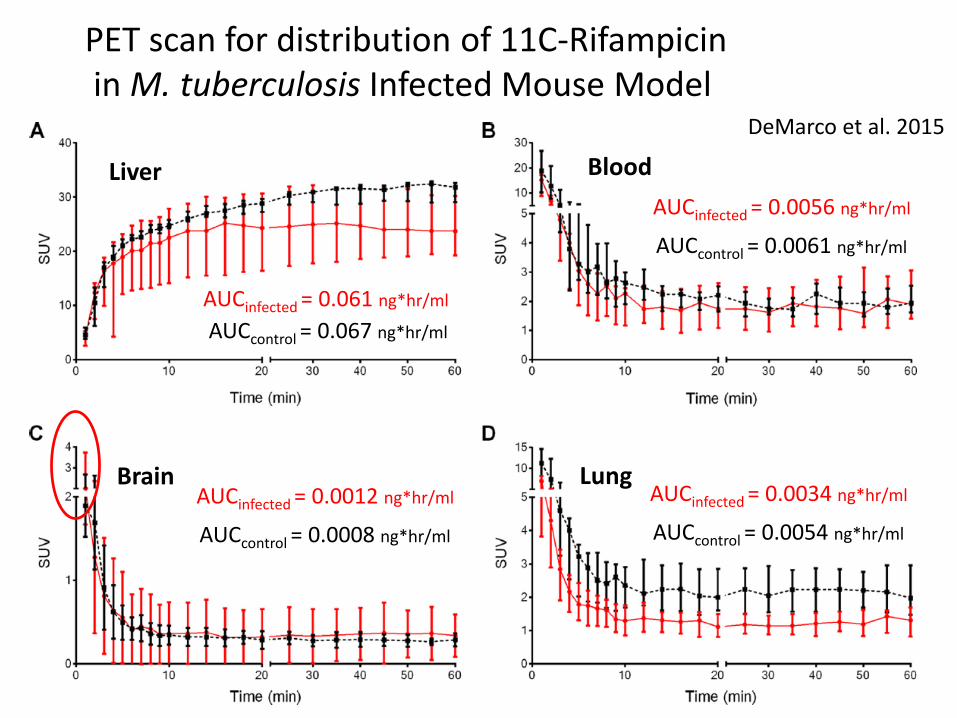
Liver
Lung
Blood
BrainAUCinfected = 0.0012 ng*hr/ml
AUCcontrol = 0.0008 ng*hr/ml
AUCinfected = 0.0034 ng*hr/ml
AUCcontrol = 0.0054 ng*hr/ml
AUCinfected = 0.061 ng*hr/ml
AUCcontrol = 0.067 ng*hr/ml
AUCinfected = 0.0056 ng*hr/ml
AUCcontrol = 0.0061 ng*hr/ml
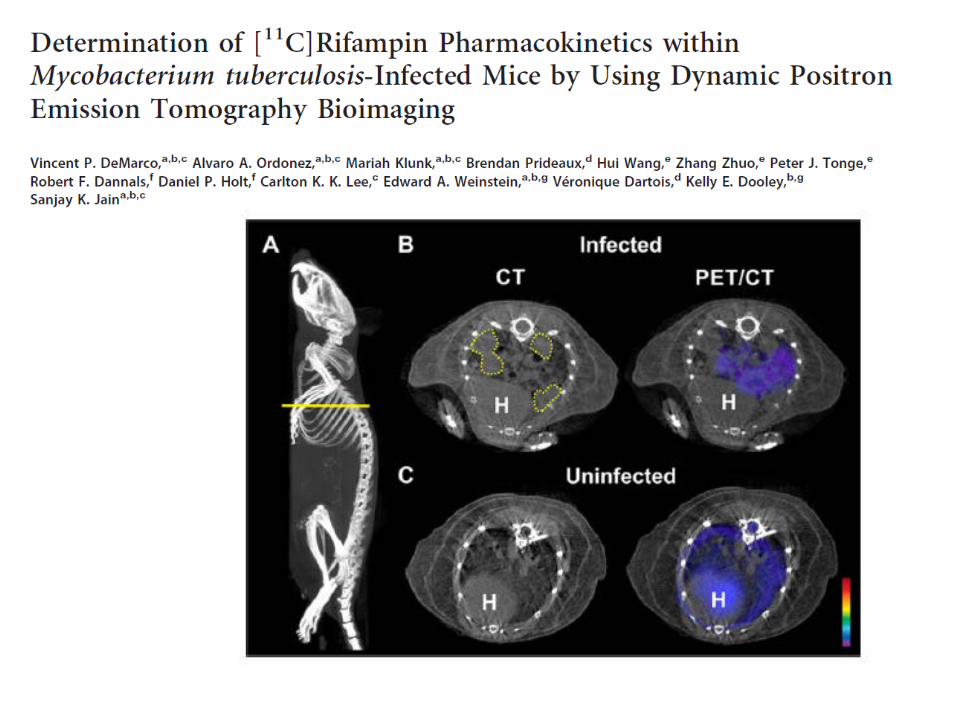
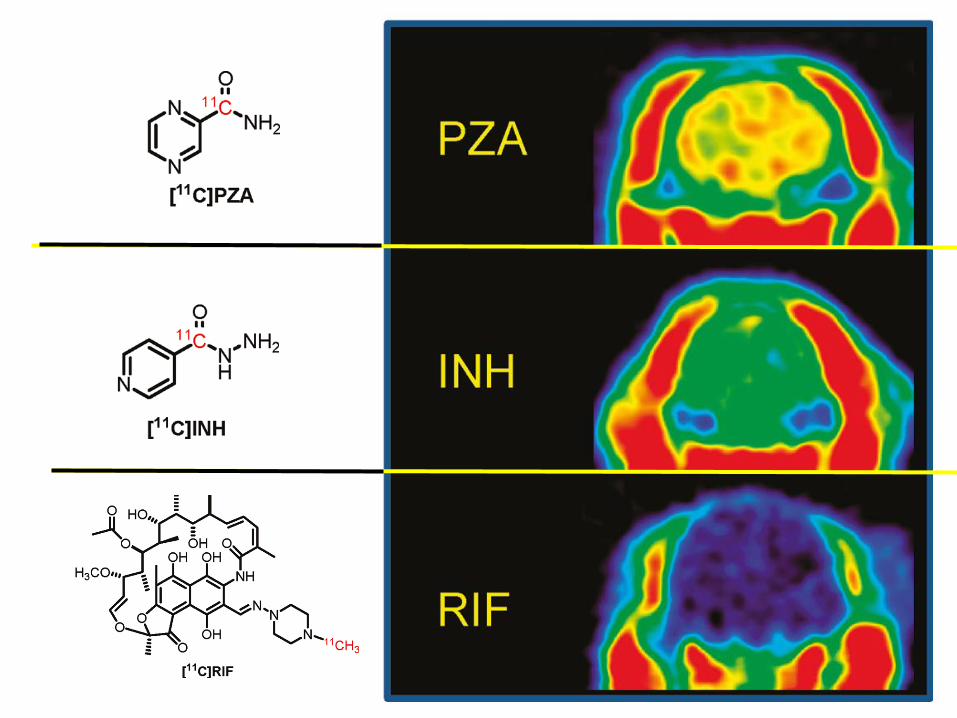
PET scan for distribution of 11C-Rifampicinin M. tuberculosis Infected Mouse Model
DeMarco et al. 2015
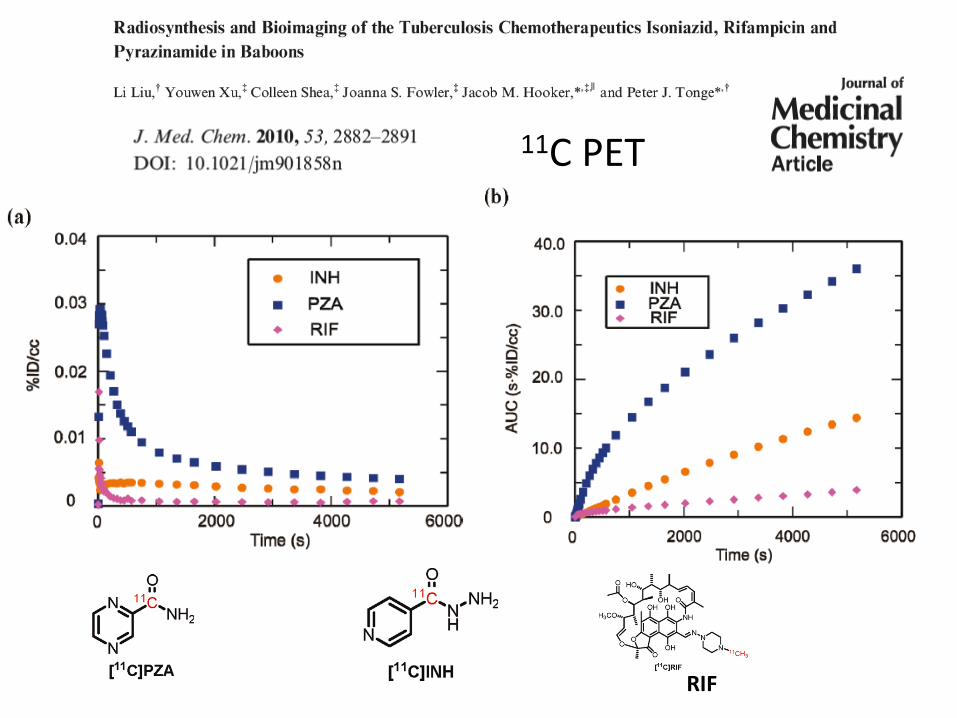
RIF
11C PET
PlasmaCu,plasma Cplasma
Brain CSF
BBB BCSFBPS
CLeff CLin
CcsfCu,brainCbrain CLbulk
CLmeta
[CLin, CLeff, PS]
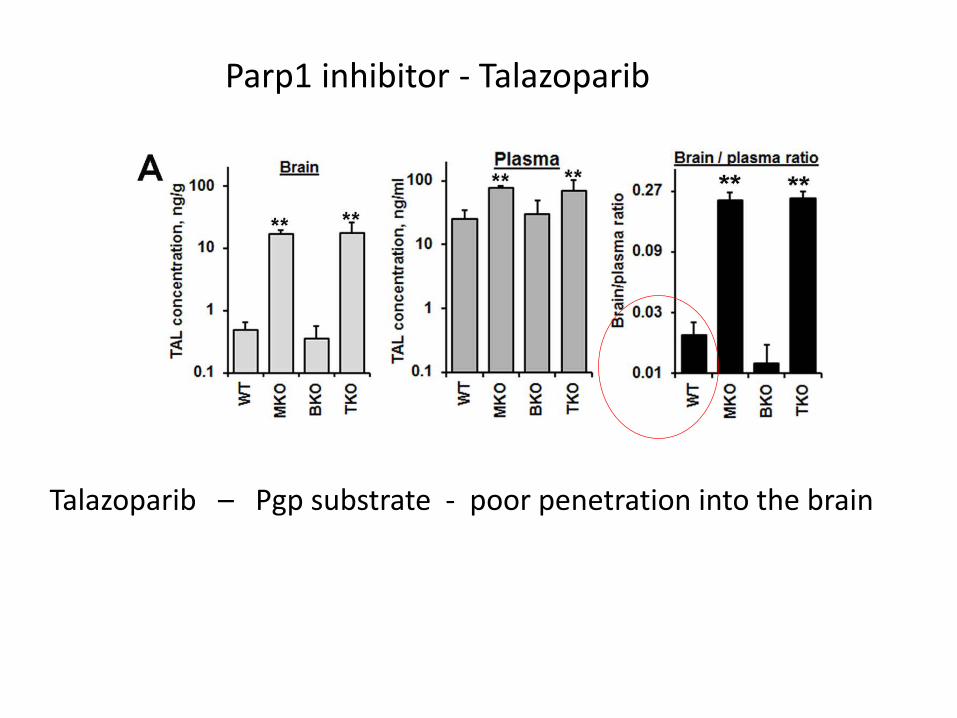
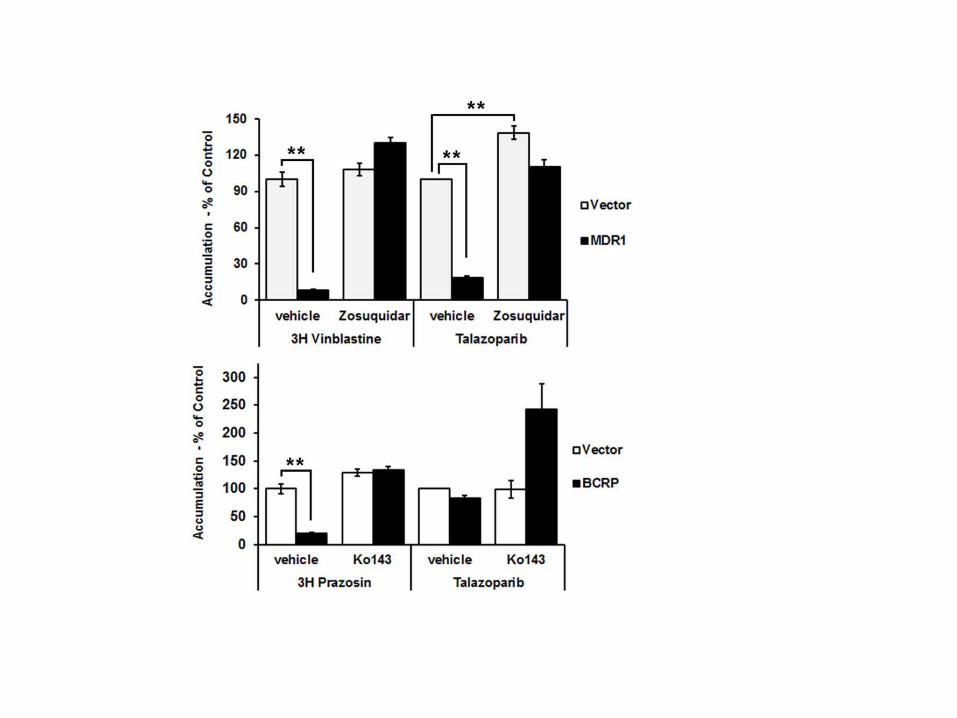
Parp1 inhibitor - Talazoparib
Talazoparib – Pgp substrate - poor penetration into the brain
toxicity
delivery
potency
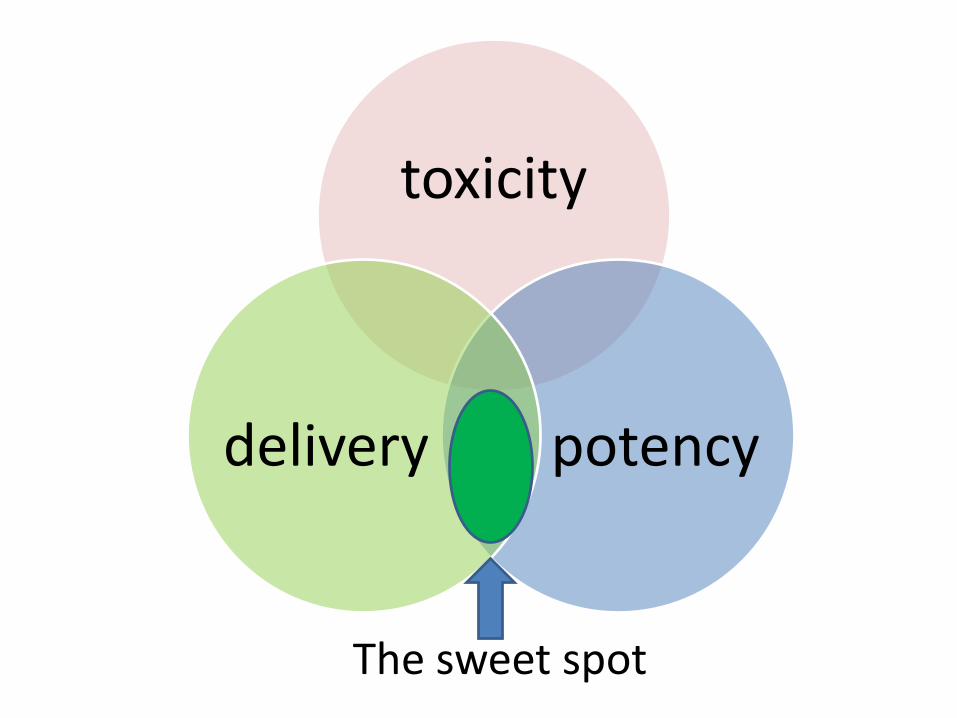
toxicity
potencydelivery
The sweet spot
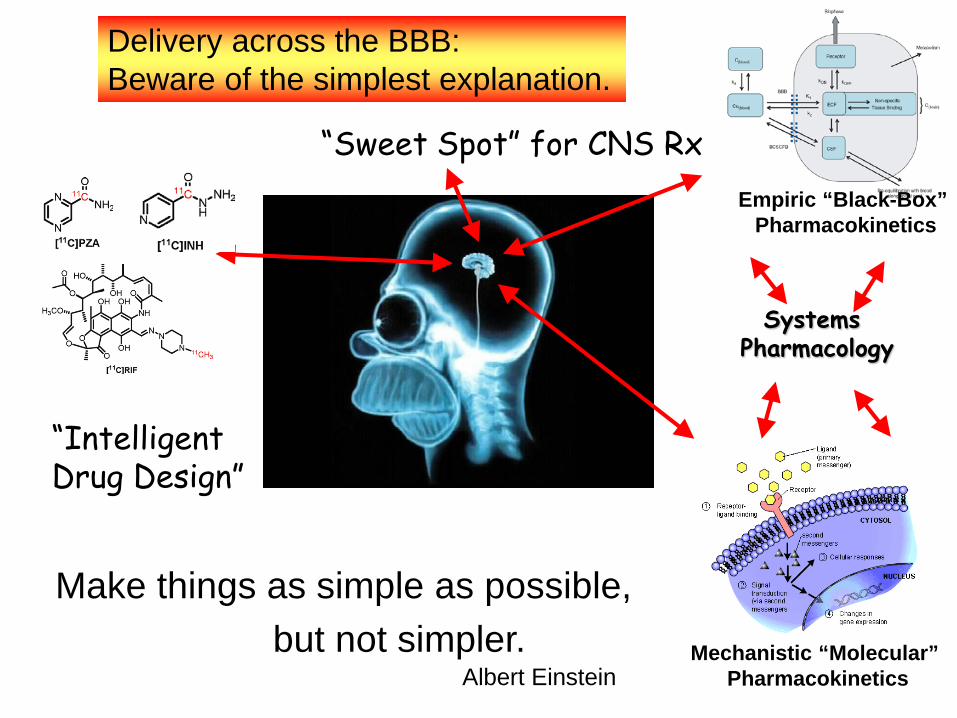
Make things as simple as possible,but not simpler.
Albert Einstein
Delivery across the BBB: Beware of the simplest explanation.
Systems Pharmacology
Mechanistic “Molecular” Pharmacokinetics
Empiric “Black-Box” Pharmacokinetics
“IntelligentDrug Design”
“Sweet Spot” for CNS Rx