Embed Size (px)
Citation preview
Dan Starman, Nigel Cornwall, Tom Musker, Stuart Leaver
______________________________________________________
This paper outlines the benefits and values of flexibility for different market participants, using a feasibility study in the Ipswich region. It finds that local flexibility markets are difficult to deploy without further interaction and information from the distribution network operator, the tendering of services from a distribution system operator, or changes to the underlying market structure. However, it identifies the significant value for flexibility behind the meter, and outlines the opportunity for local authorities to tackle fuel poverty through increasing on-site generation and flexibility provision through storage.
Dan Starman
Lead Consultant – New Markets
01603 542117

Getting to grips with the intricacies embedded in energy and water markets can be a daunting task. There is a wealth of information online to help you keep up-to-date with the latest developments, but finding what you are looking for and understanding the impact for your business can be tough. That’s where Cornwall Insight comes in, providing independent and objective expertise. You can ensure your business stays ahead of the game by taking advantage of our:
• Publications – Covering the full breadth of the GB energy industry our reports and publications will help you keep pace with the fast moving, complex and multi-faceted markets
• Market research and insight – Providing you with comprehensive appraisals of the energy landscape
• Training, events and forums – From new starters to industry veterans, our training courses will ensure your team has the right knowledge and skills
• Consultancy – Energy market knowledge and expertise utilised to provide you with a deep insight to help you prove your business strategies are viable
For more information about us and our services contact us on [email protected] or 01603 604400.
Pixie Energy is an advisory and services company established specifically to progress local energy market ideas and initiatives. The company’s focus initially was on the Local Supply Communities Project (LSCP), which started with work on how to structure local tariffs and the relative costs compared with national supplier offerings. Through this initial work we have established a strong local set of relationships, including with Ipswich Borough Council and Suffolk County Council, our primary partners for this work.
This combination of energy market expertise and relationships with local energy market stakeholders mean that Cornwall Insight and Pixie Energy are perfectly placed to provide support on local energy trading options.

Contents
1 Executive Summary 4
1.1 Introduction 4
1.2 Market context 4
1.3 Modelling approach 5
1.4 Key findings 5
1.5 Implications for future studies 6
1.6 Concluding remarks 6
2 Introduction 7
2.1 The project 7
3 Building Value from Flexibility 9
3.1 Approach to valuing local markets 9
3.2 Off-set consumption 9
3.3 Peak pricing response 10
3.4 National flexibility provision 11
3.5 Local flexibility provision 11
3.6 Potential sources of value 11
4 Method and scenarios 12
4.1 Method 12
4.2 Modelling approach 12
4.3 Scenarios 13
4.4 Market cases 15
4.5 Battery operation 16
5 Findings 18
5.1 Results 18
6 Conclusions and recommendations 24
Annex A: Glossary 27
Disclaimer
While Cornwall Insight considers the information and opinions given in this report and all other documentation are sound, all parties must rely upon their own skill and judgement when making use of it. Cornwall Insight will not assume any liability to anyone for any loss or damage arising out of the provision of this report howsoever caused.
The report makes use of information gathered from a variety of sources in the public domain and from confidential research that has not been subject to independent verification. No representation or warranty is given by Cornwall Insight as to the accuracy or completeness of the information contained in this report.
Cornwall Insight makes no warranties, whether express, implied, or statutory regarding or relating to the contents of this report and specifically disclaims all implied warranties, including, but not limited to, the implied warranties of merchantable quality and fitness for a particular purpose. Numbers may not add up due to rounding.
1.1 Introduction
The Ipswich Local Supply Community Assessment Project (‘the Project’) analyses mechanisms to exploit electricity flexibility at the household level in an urban setting. It models local demand, and tests the impact of adding solar and storage behind the consumer’s meter using representative consumption data for different types of consumer. It explores how emerging demand-side response techniques and programmed market initiatives, including the introduction of half hourly settlement (HHS) combined with time of use (ToU) retail pricing can enhance flexibility and support local system resilience.
This, the first stage of the Project is part-funded under the BEIS Flexibility Markets Feasibility Study (FMFS) competition, launched in July 2017.
The project is based around a case study, centred on Ipswich. The town had over 133,000 residents at the time of the 2011 census, with over 154,000 expected by the 2031 census. The total electricity demand of the Ipswich Borough Council area is 523.3GWh. The Bramford Grid Supply Point (GSP) to the west of the town connects to the national electricity transmission system. More information on the physical context is available in chapter 2.
This report and supporting modelling:
• Decomposes local demand into different “archetypes
• Assesses the additional value of micro-generation or storage interventions behind the meter both separately and in combination under HHS and ToU conditions
• Calculates pay-back periods for such consumer investments
• Discusses likely further potential sources of value and highlighted potential risks to the value of flexibility, and
• Makes suggestions about how this work can be developed going forward to enhance learnings.
We have had the support of two key local stakeholders, Ipswich Borough Council and Suffolk County Council, throughout the project to date. We have also shared our emerging thinking through the East Anglian Electricity Market Innovation Project.1
Readers should note that this is a condensed version of the full report provided to BEIS. For further information please contact [email protected].
1.2 Market context
The current electricity market structure and charging methodologies do not presently incentivise flexible local markets. They are predicated on a national top-down utility-scale generation model whereby the networks have sufficient capacity to distribute the power to customers connected at low voltage.
The electricity industry is undergoing a transition to a smart, flexible system centred on a distribution system operator (DSO), recognising that increasing levels of distributed generation are resulting in the need to more actively manage distribution networks. Approximately 29% of the population in East Anglia already benefits from smart metering (as of September 2018), and Suffolk has some 817.0MW and 91.7MW of capacity brought forward under the Renewables Obligation (RO) and Feed-in Tariff (FiT) regimes respectively2. Constraints at the local level are increasingly commonplace and have already lead to extensive deployment of active network management (ANM) by the local network operator.
1 Supported by UKPN, Green Star Energy, Cooperative Energy, and Shell, but which also includes other regional local authorities and Local Enterprise Partnerships. 2 From the Renewables and CHP register on 3 December 2018, and FiT installation report 30 September 2018
5
The only way that electricity market participants can access value for local flexibility presently is through negotiated distribution network owner (DNO)/ DSO service provision, but feasibility studies and pilots exploring the potential are at an early stage and are focussed on larger business consumers.
Looking forwards, suppliers, aggregators, or other parties will act as a route to market for flexibility services in at least three ways:
• First, they can use this flexibility to avoid exposure to red period network charges and/or high and volatile electricity imbalance price
• Second, they can aggregate flexible demand and generation in their portfolios to offer a larger combined response, and these portfolios may then be offered to DSOs to ameliorate network constraints (for example increasing demand to allow for some headroom for a constrained intermittent asset to generate), and
• Third, there are a range of revenues available for wider flexibility provision, often termed “revenue stacking”. We consider these sources in chapter 3.
However, at this stage, while some limited time of use charging structures are emerging, half hourly settlement is not viable for householders and smaller businesses.3 Determining the potential for domestic flexibility and how it can be impacted by activities behind the meter as we set out to do in the report should be an important factor in determining the scope for flexibility at the local level and the best route for the consumer, distributors, suppliers and other intermediaries to decide how to access its value.
1.3 Modelling approach
We constructed a local consumption model based on a representative customer typology, made up of 12 different customer archetypes, sourced from the Centre for Sustainable Energy. To this we have added a fixed proportion of micro-generation (solar PV at this stage) and storage and applied a number of different but simplified time of use tariff structures. The model is based on half hourly (rather than the current profile based, single or two rate tariff) settlement.
1.4 Key findings
The key lessons from this initial study are that local flexibility markets will deliver real benefits to consumers and the wider system. The value of these can be captured by a number of parties depending on the consumer preference and the commercial choices they are offered. However, the value of behind the meter interventions is user specific and dependent on a wide range of factors. These include relative demand load and generation sizing, demand and generation profiles, the presence of on-site storage or other flexibility, redundancy requirements and other factors.
It should be noted however that there are several important dependencies and uncertainties:
• The attainment of smart meter installation targets is being widely debated within the sector at present with many seeing real risks of delay beyond 2020 and lower market penetration
• The timetable for market-wide HHS has also yet to be confirmed with many seeing the 2022 target as unrealistic, and
• Ofgem is proposing that some elements of network charges (the “residual” component) should be unavoidable4. Should such changes be implemented, this is likely to negatively affect the business case
3 Optional (or elective) half hourly settlement has been available for smaller consumers since April 2017, but to date we understand only a few thousand consumers nationally have taken this up. Market-wide HHS is due to be implemented from April 2022. Similarly less than 10% of suppliers in the market presently offer dynamic tariffs and take-up is assessed as minimal. 4 https://www.ofgem.gov.uk/system/files/docs/2018/11/targeted_charging_review_minded_to_decision_and_draft_impact_assessment.pdf
6
for behind the meter generation and storage assets, although the impacts will vary by location, and the earliest changes are not expected until April 2021.
1.5 Implications for future studies
We believe the current work has led to the construction of a proven local supply model incorporating a decomposed consumption base, robust cost projections and inclusion of significant levels of solar and storage capability behind the meter. It has allowed us to develop a very powerful tool for testing and quantifying local flexibility in the domestic sector.
Further work is required to build more specific local samples and insights, and we set out some proposals below.
1.5.1 Greater granularity of consumption data
Metering data would enhance the current study – understanding the consumption profiles of different users, how these vary between households, and differences in use between the affluent and fuel poor are particularly relevant questions for local authorities. Such data would also contribute to framing social and low-carbon policy. This would require opt-in from a broad spectrum of users to allow their data to be assessed, or the use of anonymised data from suppliers. A further strand to this work would be considering other volumetric interventions behind the meter (EV deployment, smart appliances and thermostats etc).
1.5.2 Local generation interactions
At this stage we have only considered build out of solar and storage behind the meter. The Local Supply Community model, however, looks to match net consumption in any half hour period against available local generation. There is in excess of 14MW of existing low-carbon local generation in the immediate Ipswich area5, and we intend to look at the costs and benefits of local balancing. This would also provide an opportunity to test the appropriateness of current rules for allocating the cost of distribution losses and whether there would be opportunity to relieve local constraints and any imposed ANM limits.
1.5.3 Brandon
The areas we have identified is to apply the learnings to a different area locally where we know there are existing system inflexibilities. We propose to adapt the model to enable a trial in the Brandon area in Suffolk, around 40 miles northwest of the original project area in Ipswich. This area has been identified by UKPN as requiring distributed flexibility during weekday evenings, and the local authorities are keen to work with us on this workstream. In particular, this approach to phase two would assess the viability of a local flexibility platform providing services to UKPN through a local concentration of aggregated behind the meter batteries and a bespoke ToU charging structure to incentivise DSR from local consumers.
1.6 Concluding remarks
In summary local flexibility markets will deliver real benefits to consumers and the wider system. However, the value of behind the meter interventions is user specific and dependent on a wide range of factors, including demand load and generation sizing and profiles, the presence of on-site flexibility and other factors.
We look forward to continuing engaging with this nascent and evolving area of the market and conducting further modelling on the benefits and value of local flexibility markets in the future.
5 IP1-5 postcodes
7
2.1 The project
The Ipswich Local Supply Community Project (‘the Project’) explores mechanisms to exploit bottom-up flexibility, creating new local partnerships seeking to promote and commoditise flexibility. It models local production and demand, and tests feasibility of commercial innovations based on specific assets, using generation metering data and representative consumption data. It analyses how emerging demand-side techniques and programmed market initiatives, including the introduction of half hourly settlement (HHS) and fully marginal imbalance pricing, can enhance flexibility and support local system resilience.
The Project is part-funded under the BEIS Flexibility Markets Feasibility Study (FMFS) competition, launched in July 2017 to provide funding for feasibility studies about innovative approaches that can be used to value and trade flexibility in the UK electricity system. The FMFS is particularly focussed on distribution level interventions and innovations.
In this project, we:
• Explore opportunities to create and exploit bottom-up flexibility through local partnerships
• Model local production and demand, testing feasibility of commercial innovations, and
• Analyse how market initiatives and demand-side techniques, including co-location with storage, realise further value for users.
2.1.1 Ipswich
The town of Ipswich sits a few miles inland of the south-east coast port of Felixstowe in Suffolk, in East Anglia. It had over 133,000 residents at the time of the 2011 census, with over 154,000 expected by the 2031 census. Transport links – aside from Felixstowe, the UK’s busiest port dealing with 42% of the UK’s containerised trade – include the A12, A14 and mainline national rail services. The town lies in the Eastern Power Networks distribution region, owned and operated by UK Power Networks (UKPN).
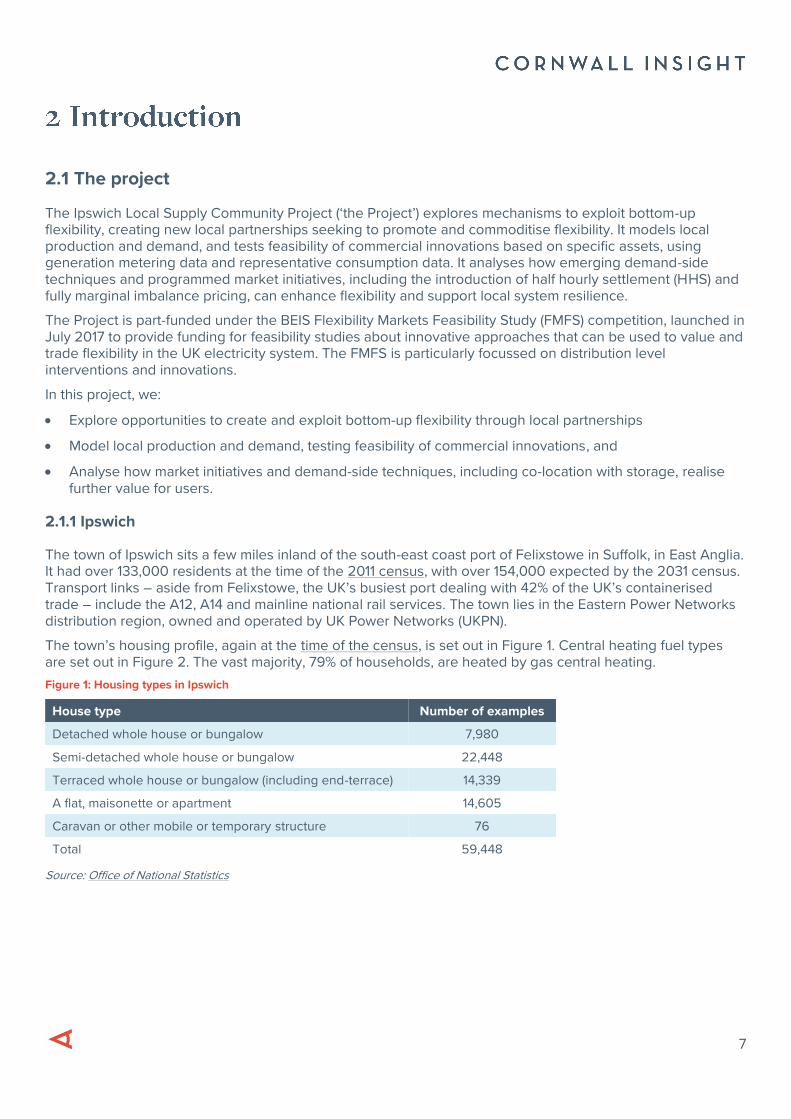
The town’s housing profile, again at the time of the census, is set out in Figure 1. Central heating fuel types are set out in Figure 2. The vast majority, 79% of households, are heated by gas central heating.
Figure 1: Housing types in Ipswich
House type Number of examples
Detached whole house or bungalow 7,980
Semi-detached whole house or bungalow 22,448
Terraced whole house or bungalow (including end-terrace) 14,339
A flat, maisonette or apartment 14,605
Caravan or other mobile or temporary structure 76
Total 59,448
Source: Office of National Statistics
8
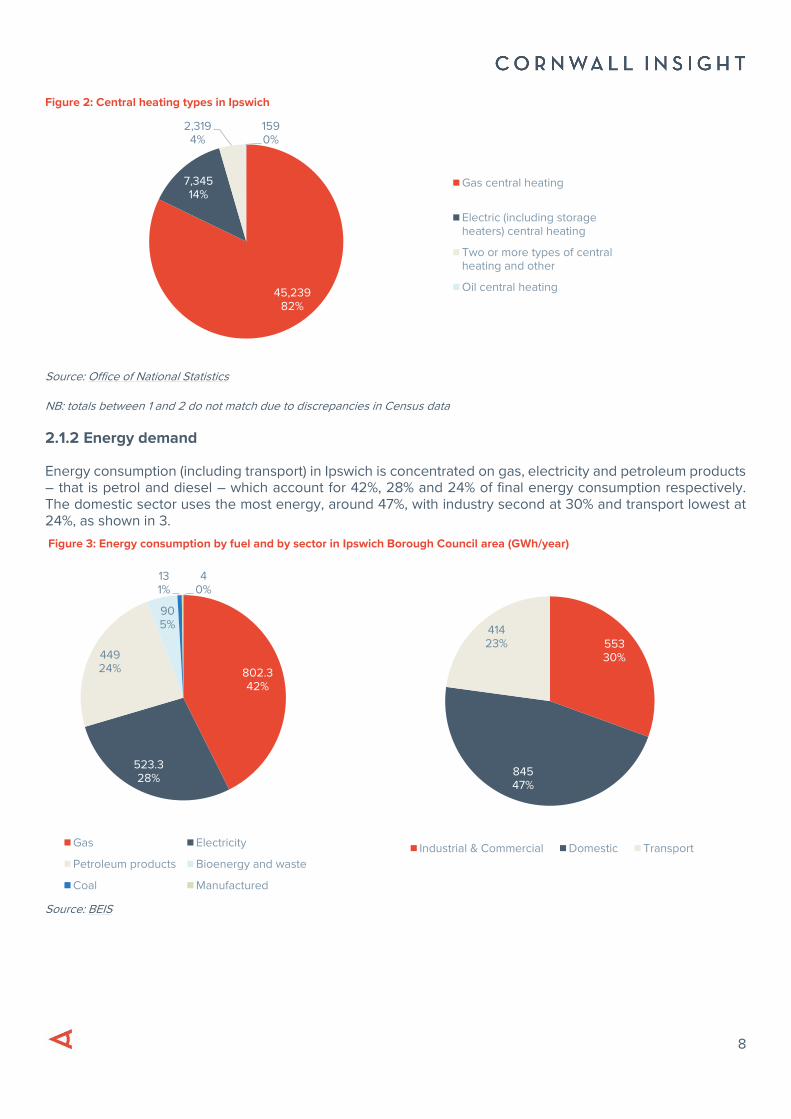
Figure 2: Central heating types in Ipswich
Source: Office of National Statistics
NB: totals between 1 and 2 do not match due to discrepancies in Census data
2.1.2 Energy demand
Energy consumption (including transport) in Ipswich is concentrated on gas, electricity and petroleum products – that is petrol and diesel – which account for 42%, 28% and 24% of final energy consumption respectively. The domestic sector uses the most energy, around 47%, with industry second at 30% and transport lowest at 24%, as shown in 3.
Figure 3: Energy consumption by fuel and by sector in Ipswich Borough Council area (GWh/year)
Source: BEIS
45,23982%
7,34514%
2,3194%
1590%
Gas central heating
Electric (including storageheaters) central heating
Two or more types of centralheating and other
Oil central heating
802.342%
523.328%
44924%
905%
131%
40%
Gas Electricity
Petroleum products Bioenergy and waste
Coal Manufactured
55330%
84547%
41423%
Industrial & Commercial Domestic Transport
9
3.1 Approach to valuing local markets
Taking the sources of value (revenues or avoided costs) for demand and generation in isolation, we have presented a range of mostly additive options for building value in a current flexibility market. All assessments are judged against a status quo of “no action”.
3.2 Off-set consumption
Behind the meter generation and flexibility provides the greatest value for assets. For a current domestic profile class 1 (PC1) tariff with no HHS, a unit rate of 12-16p/kWh is applied to every unit of electricity consumed. This is much larger than the 4-6p/kWh available on the wholesale market, and embedded benefits that average at best up to of up to 2p/kWh for exports. In contrast balancing market and balancing services revenues are much less reliable.
This value arises from a large number of additional costs and levies applied to the energy bill in addition to the costs of electricity itself, which the consumer can avoid by self-supply. This is due to successive government policies that have placed socialised cost burdens onto energy suppliers. The net result is now a system where it is cheaper to maximise consumption of power generated on-site or flexing demand to off-peak periods. This is likely to continue to drive forward deployment of renewable generation despite the imminent closure of renewable subsidy mechanisms.
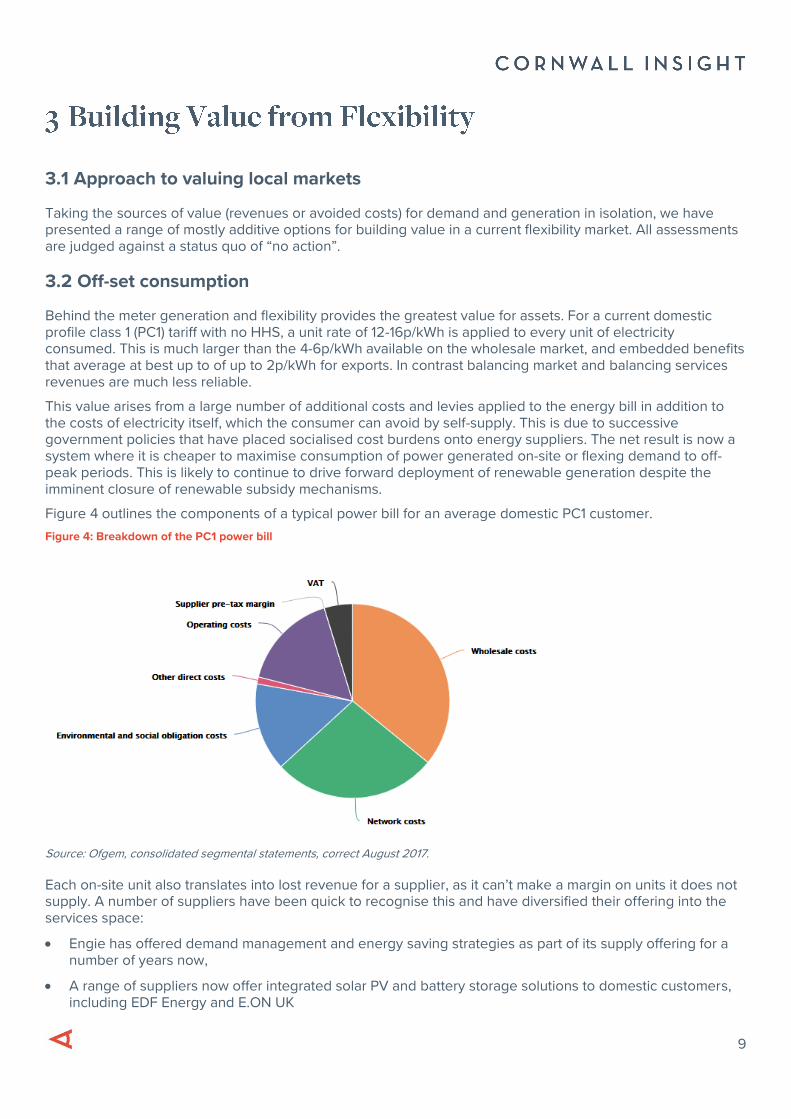
Figure 4 outlines the components of a typical power bill for an average domestic PC1 customer.
Figure 4: Breakdown of the PC1 power bill
Source: Ofgem, consolidated segmental statements, correct August 2017.
Each on-site unit also translates into lost revenue for a supplier, as it can’t make a margin on units it does not supply. A number of suppliers have been quick to recognise this and have diversified their offering into the services space:
• Engie has offered demand management and energy saving strategies as part of its supply offering for a number of years now,
• A range of suppliers now offer integrated solar PV and battery storage solutions to domestic customers, including EDF Energy and E.ON UK
10
3.3 Peak pricing response
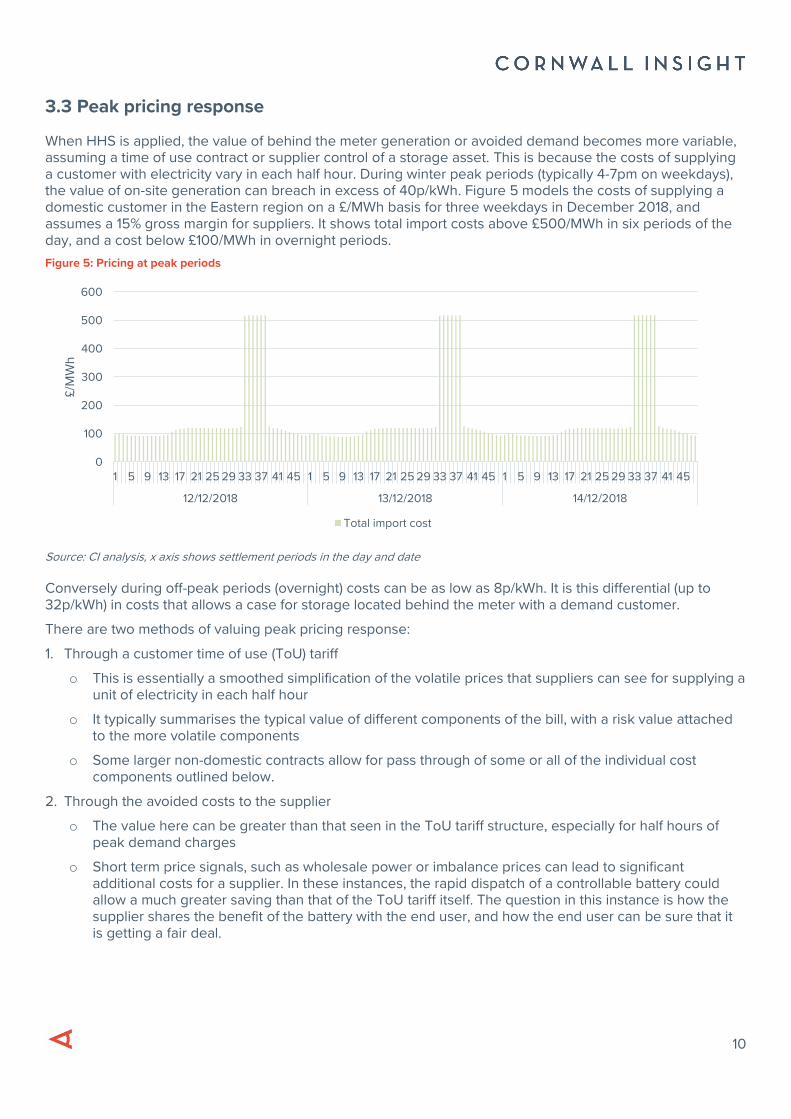
When HHS is applied, the value of behind the meter generation or avoided demand becomes more variable, assuming a time of use contract or supplier control of a storage asset. This is because the costs of supplying a customer with electricity vary in each half hour. During winter peak periods (typically 4-7pm on weekdays), the value of on-site generation can breach in excess of 40p/kWh. Figure 5 models the costs of supplying a domestic customer in the Eastern region on a £/MWh basis for three weekdays in December 2018, and assumes a 15% gross margin for suppliers. It shows total import costs above £500/MWh in six periods of the day, and a cost below £100/MWh in overnight periods.
Figure 5: Pricing at peak periods
Source: CI analysis, x axis shows settlement periods in the day and date
Conversely during off-peak periods (overnight) costs can be as low as 8p/kWh. It is this differential (up to 32p/kWh) in costs that allows a case for storage located behind the meter with a demand customer.
There are two methods of valuing peak pricing response:
1. Through a customer time of use (ToU) tariff
o This is essentially a smoothed simplification of the volatile prices that suppliers can see for supplying a unit of electricity in each half hour
o It typically summarises the typical value of different components of the bill, with a risk value attached to the more volatile components
o Some larger non-domestic contracts allow for pass through of some or all of the individual cost components outlined below.
2. Through the avoided costs to the supplier
o The value here can be greater than that seen in the ToU tariff structure, especially for half hours of peak demand charges
o Short term price signals, such as wholesale power or imbalance prices can lead to significant additional costs for a supplier. In these instances, the rapid dispatch of a controllable battery could allow a much greater saving than that of the ToU tariff itself. The question in this instance is how the supplier shares the benefit of the battery with the end user, and how the end user can be sure that it is getting a fair deal.
0
100
200
300
400
500
600
1 5 9 13 17 21 25 29 33 37 41 45 1 5 9 13 17 21 25 29 33 37 41 45 1 5 9 13 17 21 25 29 33 37 41 45
12/12/2018 13/12/2018 14/12/2018
£/M
Wh
Total import cost
11
3.4 National flexibility provision
National Grid procures a range of services to help it maintain system frequency within specified limits. See section 5.6 for more information on this but note that National Grid is currently reviewing its suite of balancing services under the System Needs and Product Strategy workstream.
National Grid first published its System Needs and Product Strategy (SNAPS) on 13 June 2017 and has since updated this with specific roadmaps for each service. National Grid is seeking to improve the transparency of where it sees system needs, helping it deliver improvements in customer value while managing the transition to a smart, flexible energy system.
This gives rise to a high level of uncertainty in the continuation of balancing services (in their current form) and to the value achievable for providing each service. Realistically, greater transparency and visibility should drive more participation, resulting in a more accurate price realisation.
3.5 Local flexibility provision
Local flexibility (as opposed to national flexibility procured by National Grid) is not currently valued outside of trial schemes put in place but distribution network operators (DNOs). These trials are being launched as part of the assumed transition from DNOs to distribution system operators (DSOs). This relatively sparse framework means there is not enough price realisation to develop a well-defined market value at present. However the majority of DNOs are now trialling some form of flexibility provision with local assets and demand users in their region. UKPN, which runs the Eastern network, has partnered with Piclo to trial the PicloFlex platform for procuring local flexibility.
3.6 Potential sources of value
There is potential value in providing services to the DSO to manage different facets of the local network. This includes:
• Managing voltage and reactive power levels
• Acting as a cheaper alternative to network reinforcement, and
• Managing energy flows through, for example, a balancing mechanism at the distribution level.
There is also potential value to other energy industry participants in managing use of the networks, especially where they are behind constraints or other issues. Such services could include:
• Actively managing constraints with specific assets, and
• Changing network usage to allow for additional connections.
This may be addressed by Ofgem’s decisions following the recommendations of the forward looking and network access charging task forces under the Charging Futures workstream. However, this would depend on regulatory action taking on board these requirements and deploying them in a shortened timeframe.
The key to the markets deploying this further value is transparency of the issues in the local distribution network, including the connections queue, and ways of resolving them. This activity should be provided for, and likely led by DNO and DSOs but there will be instances where this is generator or consumer led. This is because the value will lie with users of the network rather than the owner/ operator itself.
Note that the supplier sees very little or no value in actively managing issues within the distribution network. It would only expect to see value if it were to act as an aggregator, co-ordinating responses from its customers to provide a service.
12
4.1 Method
Due to the different values for flexibility in demand and generation, arising because of the different charges and credits accruing to different users of the network, we have developed separate models assessing the value of flexibility at different points.
4.1.1 Behind the meter
There are a number of unique cost components levied on electricity consumption; the charges allocated are dependent on a user’s type and whether it is half-hourly settled.
Due to the number of charges levied upon consumers of the electricity network, the greatest value arises from negating demand altogether (demand destruction), meeting the unit of demand with on-site generation (labelled “prosumption” in some reports) or moving the unit of demand from the peak period to the off-peak period (true demand-side response (DSR)).
These factors mean that a demand/ behind-the-meter model is a critical component of the broader modelling for this project. Linked is the fact that a unit of avoided demand (especially at peak periods) provides as much support to the local network as a unit of generation in a demand-dominated region.
4.1.2 Generation
There are a number of revenues available to generators that require a separate model to quantify. These include wholesale power prices, embedded benefits, value of any contracts for balancing services, or Capacity Market contracts.
4.2 Modelling approach
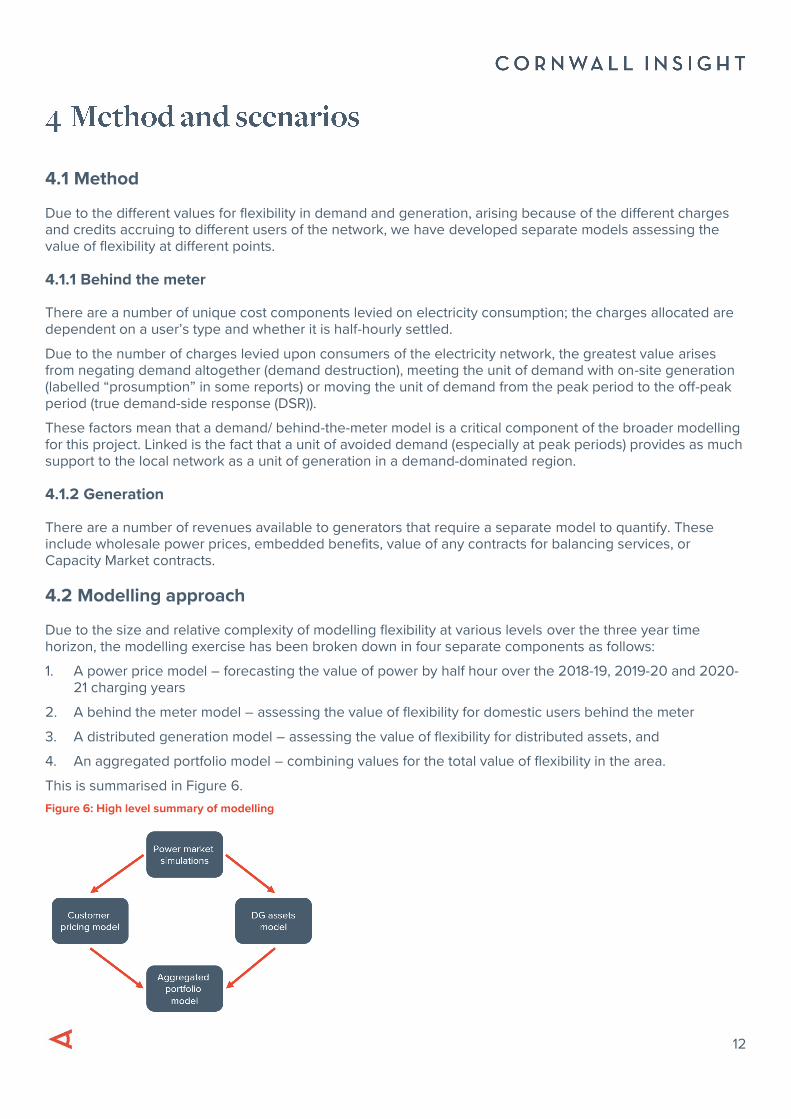
Due to the size and relative complexity of modelling flexibility at various levels over the three year time horizon, the modelling exercise has been broken down in four separate components as follows:
1. A power price model – forecasting the value of power by half hour over the 2018-19, 2019-20 and 2020-21 charging years
2. A behind the meter model – assessing the value of flexibility for domestic users behind the meter
3. A distributed generation model – assessing the value of flexibility for distributed assets, and
4. An aggregated portfolio model – combining values for the total value of flexibility in the area.
This is summarised in Figure 6.
Figure 6: High level summary of modelling
13
4.2.1 Power price modelling
Cornwall Insight has used its own proprietary models to create a forecast of prices for each half hour over the coming three years. The outturn power price is derived for each half hour of each simulation based on (1) the short-run marginal cost of the marginal unit needed, (2) a flexibility premium derived from the number of periods the unit is running, and (3) a scarcity premium which is a function of the available margin.
The outputs from this modelling feed into the behind the meter model and the distributed generation model.
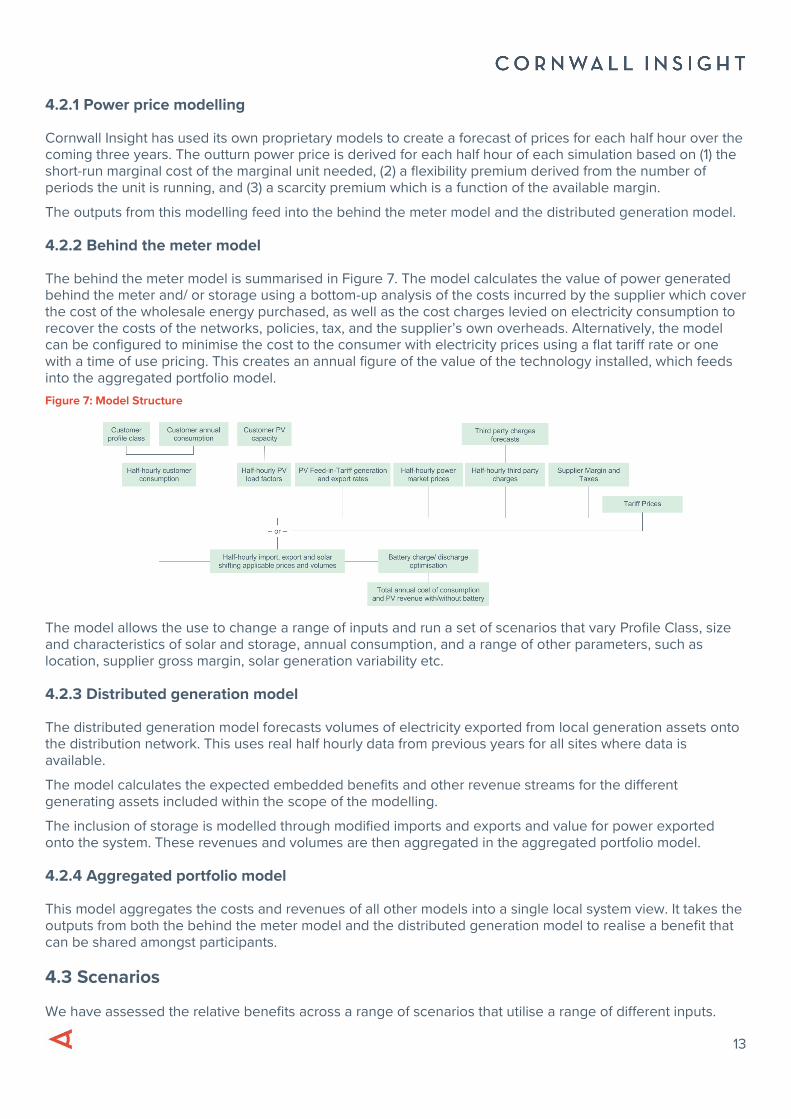
4.2.2 Behind the meter model
The behind the meter model is summarised in Figure 7. The model calculates the value of power generated behind the meter and/ or storage using a bottom-up analysis of the costs incurred by the supplier which cover the cost of the wholesale energy purchased, as well as the cost charges levied on electricity consumption to recover the costs of the networks, policies, tax, and the supplier’s own overheads. Alternatively, the model can be configured to minimise the cost to the consumer with electricity prices using a flat tariff rate or one with a time of use pricing. This creates an annual figure of the value of the technology installed, which feeds into the aggregated portfolio model.
Figure 7: Model Structure
The model allows the use to change a range of inputs and run a set of scenarios that vary Profile Class, size and characteristics of solar and storage, annual consumption, and a range of other parameters, such as location, supplier gross margin, solar generation variability etc.
4.2.3 Distributed generation model
The distributed generation model forecasts volumes of electricity exported from local generation assets onto the distribution network. This uses real half hourly data from previous years for all sites where data is available.
The model calculates the expected embedded benefits and other revenue streams for the different generating assets included within the scope of the modelling.
The inclusion of storage is modelled through modified imports and exports and value for power exported onto the system. These revenues and volumes are then aggregated in the aggregated portfolio model.
4.2.4 Aggregated portfolio model
This model aggregates the costs and revenues of all other models into a single local system view. It takes the outputs from both the behind the meter model and the distributed generation model to realise a benefit that can be shared amongst participants.
4.3 Scenarios
We have assessed the relative benefits across a range of scenarios that utilise a range of different inputs.
14
4.3.1 Technology assumptions
To identify benefit for a customer, the model splits households into the 12 CSE archetypes and can also be grouped under a technology category. Each of the four categories had a different assets of varying size:
1. None (N) – A household has no small scale renewable generation (solar PV) or storage assets (battery)
2. Battery only (B) – A household is assumed to have a battery unit without solar PV
o B1 is a smaller battery unit with an assumed 2kW capacity
o B2 is larger battery unit with an assumed 3kW capacity
3. Solar only (S) – A household is assumed to have a solar PV unit without a battery
o S1 is a smaller solar PV unit with an assumed 3kW capacity
o S2 is a larger solar PV unit with an assumed 4kW capacity
4. Solar and Battery (SB) – A household is assumed to have both a solar PV unit with integrated battery storage
o SB1 is a smaller solar PV unit (3kW) paired with a smaller battery (2kW)
o SB2 is a larger solar PV unit (4kW) paired with a larger battery (3kW)
The “none” category was used as the base case, allowing for comparison of any benefits created by the integration of generation or storage technologies for a customer. The different sizes for solar PV and batteries are based on the current average sizes of installed systems for households, and therefore are representative of the units available for customers.
4.3.2 User archetypes
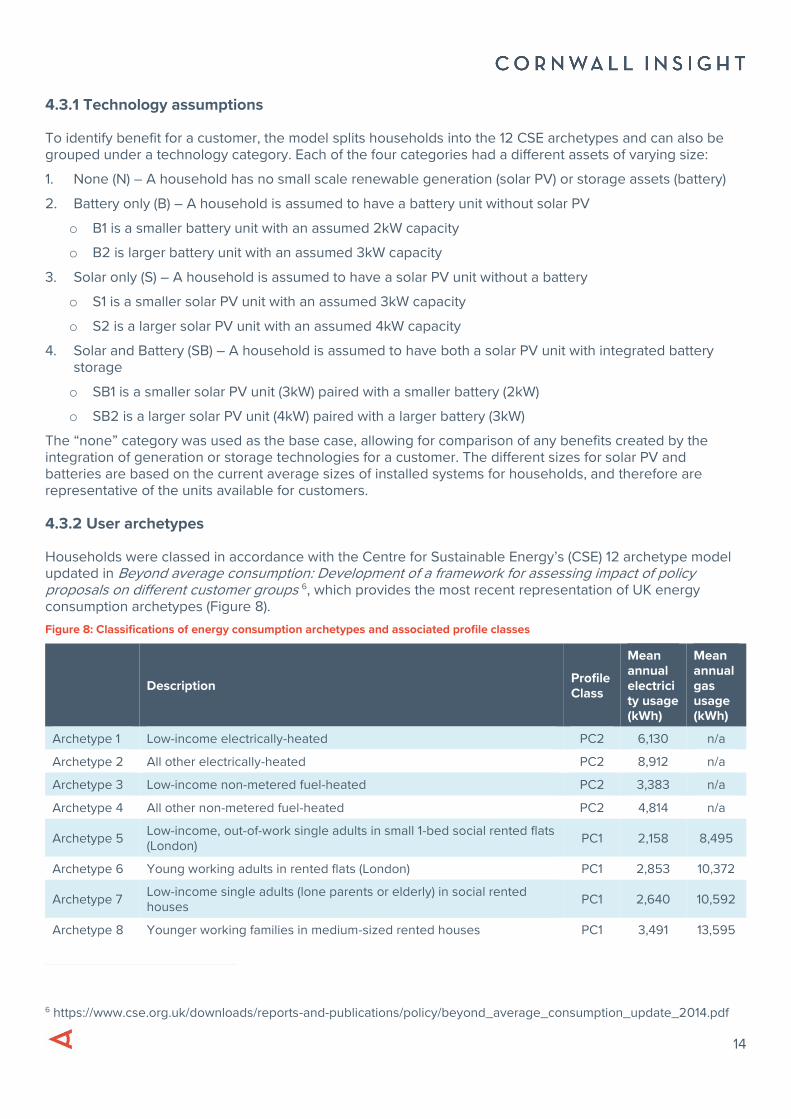
Households were classed in accordance with the Centre for Sustainable Energy’s (CSE) 12 archetype model updated in Beyond average consumption: Development of a framework for assessing impact of policy proposals on different customer groups 6, which provides the most recent representation of UK energy consumption archetypes (Figure 8).
Figure 8: Classifications of energy consumption archetypes and associated profile classes
Description Profile Class
Mean annual electricity usage (kWh)
Mean annual gas usage (kWh)
Archetype 1 Low-income electrically-heated PC2 6,130 n/a
Archetype 2 All other electrically-heated PC2 8,912 n/a
Archetype 3 Low-income non-metered fuel-heated PC2 3,383 n/a
Archetype 4 All other non-metered fuel-heated PC2 4,814 n/a
Archetype 5 Low-income, out-of-work single adults in small 1-bed social rented flats (London)
PC1 2,158 8,495
Archetype 6 Young working adults in rented flats (London) PC1 2,853 10,372
Archetype 7 Low-income single adults (lone parents or elderly) in social rented houses
PC1 2,640 10,592
Archetype 8 Younger working families in medium-sized rented houses PC1 3,491 13,595
6 https://www.cse.org.uk/downloads/reports-and-publications/policy/beyond_average_consumption_update_2014.pdf
15
Archetype 9 “Average” mains gas-heated households PC1 3,585 15,280
Archetype 10 Wealthy working families in 3-4 bed semi’s owned with mortgage PC1 4,588 18,784
Archetype 11 Asset-rich, “empty-nesters” in detached houses in less urban areas PC1 4,098 19,226
Archetype 12 Wealthy working families in larger detached houses in less urban areas
PC1 5,306 23,832
Source: CSE 2014
These archetypes represent the differing annual electricity consumptions of a range of different households.
The focus of the results is on archetypes 1-7; this is because they are categorised as either lower income households or PC2 households, which are most likely to suffer from fuel poverty compared to higher income counterparts in archetypes 8-12.
4.3.3 Ipswich
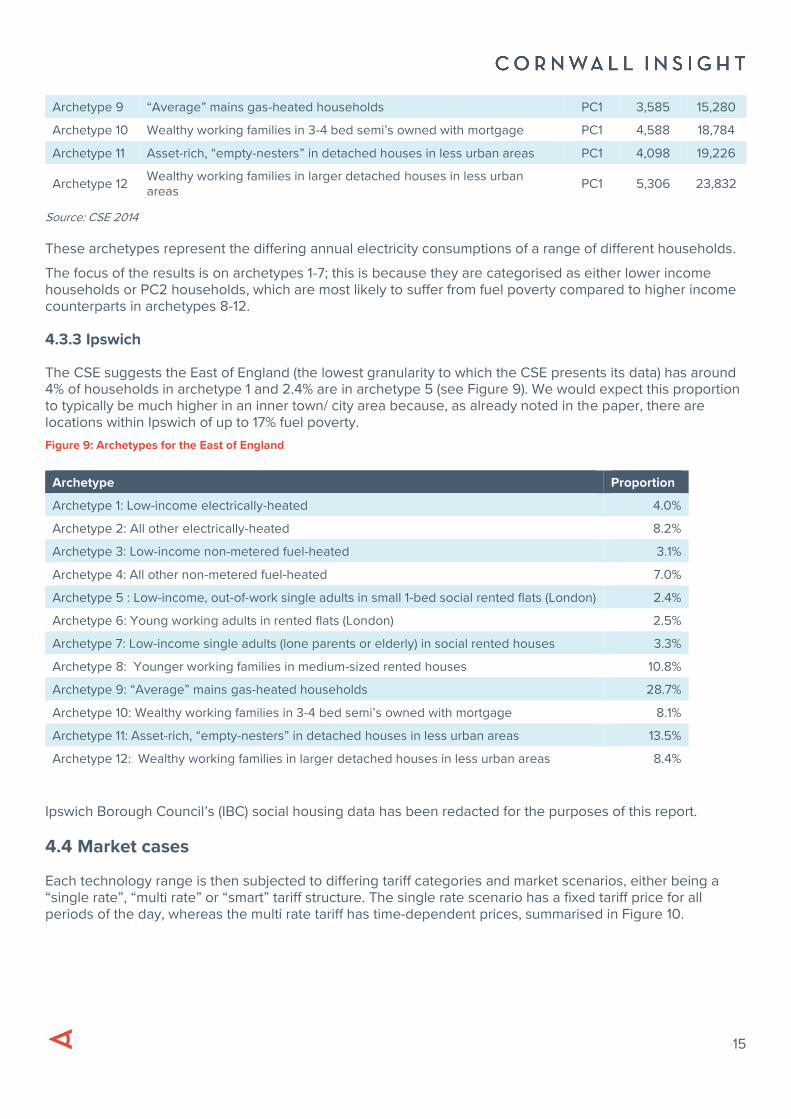
The CSE suggests the East of England (the lowest granularity to which the CSE presents its data) has around 4% of households in archetype 1 and 2.4% are in archetype 5 (see Figure 9). We would expect this proportion to typically be much higher in an inner town/ city area because, as already noted in the paper, there are locations within Ipswich of up to 17% fuel poverty.
Figure 9: Archetypes for the East of England
Ipswich Borough Council’s (IBC) social housing data has been redacted for the purposes of this report.
4.4 Market cases
Each technology range is then subjected to differing tariff categories and market scenarios, either being a “single rate”, “multi rate” or “smart” tariff structure. The single rate scenario has a fixed tariff price for all periods of the day, whereas the multi rate tariff has time-dependent prices, summarised in Figure 10.
Archetype Proportion
Archetype 1: Low-income electrically-heated 4.0%
Archetype 2: All other electrically-heated 8.2%
Archetype 3: Low-income non-metered fuel-heated 3.1%
Archetype 4: All other non-metered fuel-heated 7.0%
Archetype 5 : Low-income, out-of-work single adults in small 1-bed social rented flats (London) 2.4%
Archetype 6: Young working adults in rented flats (London) 2.5%
Archetype 7: Low-income single adults (lone parents or elderly) in social rented houses 3.3%
Archetype 8: Younger working families in medium-sized rented houses 10.8%
Archetype 9: “Average” mains gas-heated households 28.7%
Archetype 10: Wealthy working families in 3-4 bed semi’s owned with mortgage 8.1%
Archetype 11: Asset-rich, “empty-nesters” in detached houses in less urban areas 13.5%
Archetype 12: Wealthy working families in larger detached houses in less urban areas 8.4%
16
Figure 10: Example tariff bands and prices for the multi rate tariff scenario
Tariff Band Tariff Rate Times (24 hr)
1 9.92 23:00 - 07:00
2 11.83 07:00 - 11:00
3 15.76 11:00 - 15:00, 19:00 - 23:00
4 12.85 15:00 - 19:00
Both the single rate and multi rate tariffs can either be set under a half-hourly settled case, or a half-hourly “smart” case. The former does not allow for export, instead using 100% of the generated and stored electricity in the home. However, the half-hourly “smart” case allows for export and trading of electricity during periods where the battery is not being used, or when solar generation is at its peak and no longer recharging the battery during the early afternoon.
4.5 Battery operation
The battery usage is centred around importing and storing energy at non-peak times when prices are cheapest and exporting energy to the grid at peak times to receive the best price. The battery is not prescribed a schedule for operations to take place, just the market price at a time of day to which it adjusts its activity to.
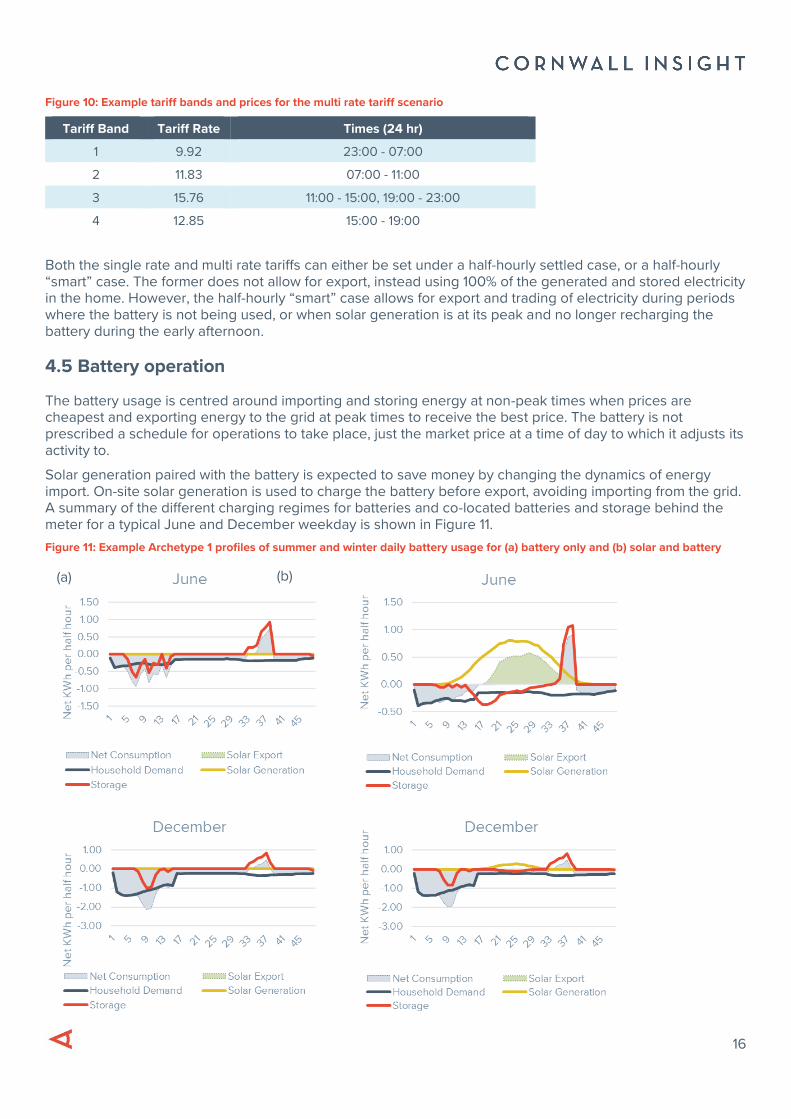
Solar generation paired with the battery is expected to save money by changing the dynamics of energy import. On-site solar generation is used to charge the battery before export, avoiding importing from the grid. A summary of the different charging regimes for batteries and co-located batteries and storage behind the meter for a typical June and December weekday is shown in Figure 11.
Figure 11: Example Archetype 1 profiles of summer and winter daily battery usage for (a) battery only and (b) solar and battery
(a) (b)
17
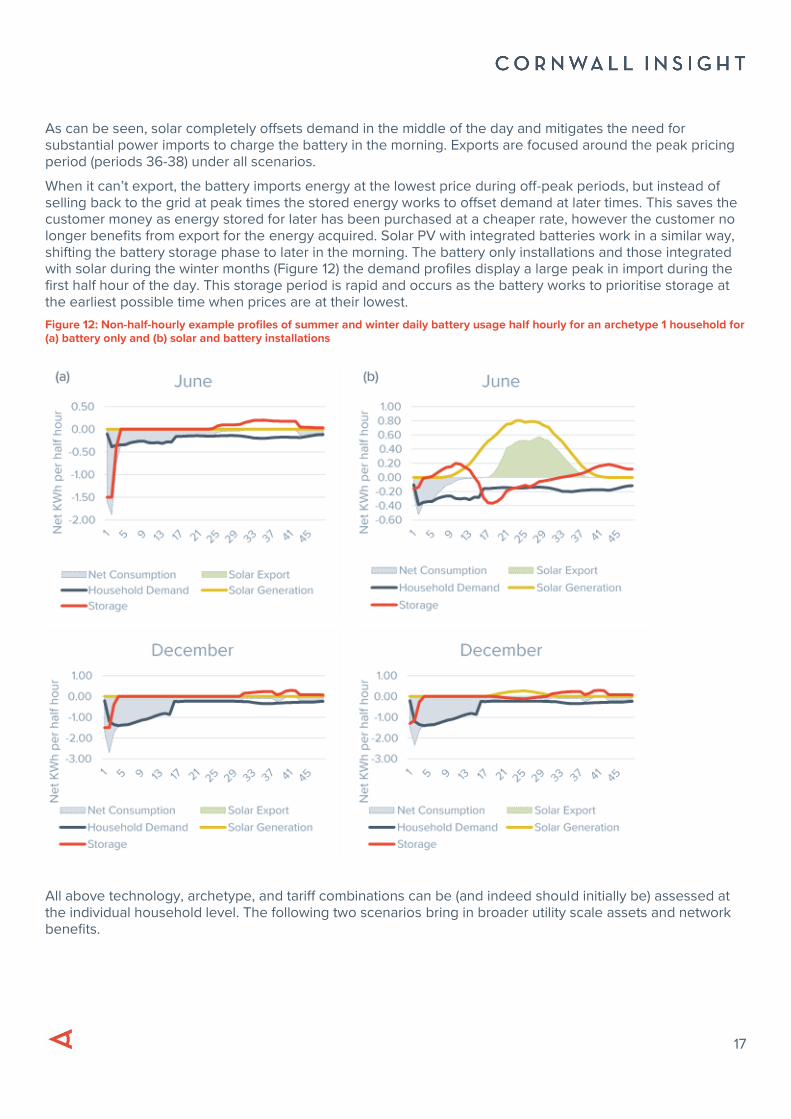
As can be seen, solar completely offsets demand in the middle of the day and mitigates the need for substantial power imports to charge the battery in the morning. Exports are focused around the peak pricing period (periods 36-38) under all scenarios.
When it can’t export, the battery imports energy at the lowest price during off-peak periods, but instead of selling back to the grid at peak times the stored energy works to offset demand at later times. This saves the customer money as energy stored for later has been purchased at a cheaper rate, however the customer no longer benefits from export for the energy acquired. Solar PV with integrated batteries work in a similar way, shifting the battery storage phase to later in the morning. The battery only installations and those integrated with solar during the winter months (Figure 12) the demand profiles display a large peak in import during the first half hour of the day. This storage period is rapid and occurs as the battery works to prioritise storage at the earliest possible time when prices are at their lowest.
Figure 12: Non-half-hourly example profiles of summer and winter daily battery usage half hourly for an archetype 1 household for (a) battery only and (b) solar and battery installations
All above technology, archetype, and tariff combinations can be (and indeed should initially be) assessed at the individual household level. The following two scenarios bring in broader utility scale assets and network benefits.
18
5.1 Results
The results for generation and stand-alone storage have been redacted for this report, but implications for demand and the market are outlined in the following pages.
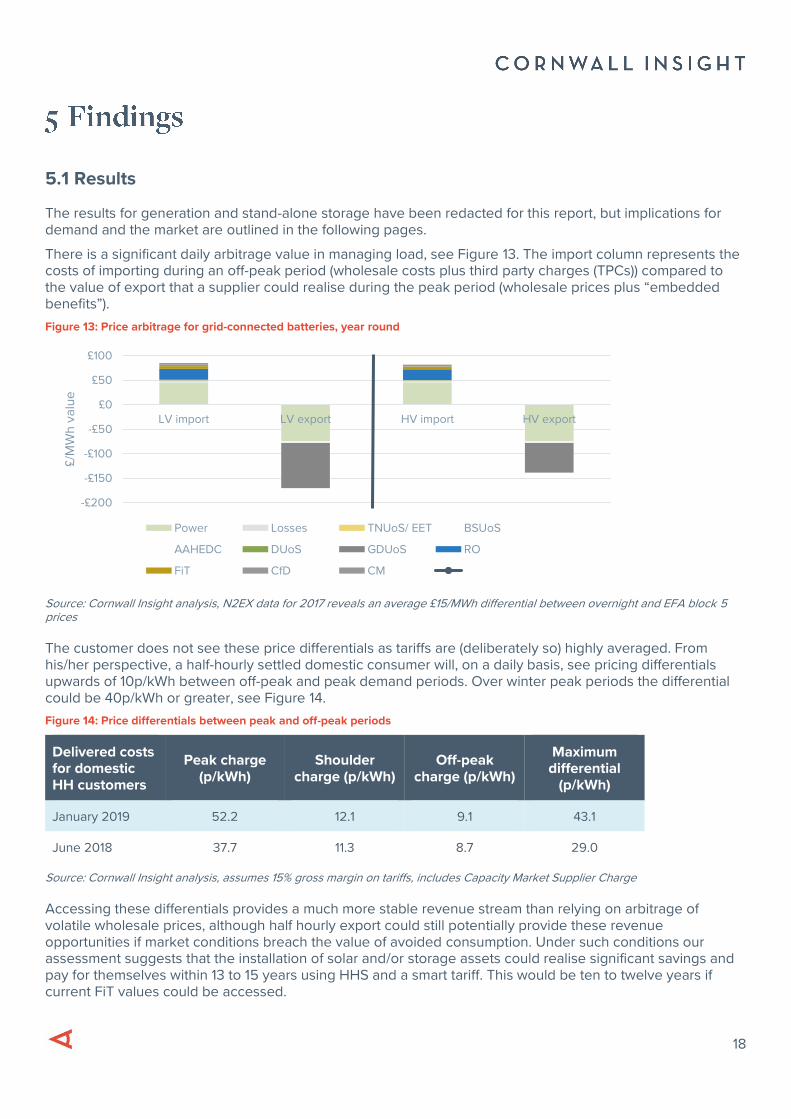
There is a significant daily arbitrage value in managing load, see Figure 13. The import column represents the costs of importing during an off-peak period (wholesale costs plus third party charges (TPCs)) compared to the value of export that a supplier could realise during the peak period (wholesale prices plus “embedded benefits”).
Figure 13: Price arbitrage for grid-connected batteries, year round
Source: Cornwall Insight analysis, N2EX data for 2017 reveals an average £15/MWh differential between overnight and EFA block 5 prices
The customer does not see these price differentials as tariffs are (deliberately so) highly averaged. From his/her perspective, a half-hourly settled domestic consumer will, on a daily basis, see pricing differentials upwards of 10p/kWh between off-peak and peak demand periods. Over winter peak periods the differential could be 40p/kWh or greater, see Figure 14.
Figure 14: Price differentials between peak and off-peak periods
Delivered costs for domestic HH customers
Peak charge (p/kWh)
Shoulder charge (p/kWh)
Off-peak charge (p/kWh)
Maximum differential
(p/kWh)
January 2019 52.2 12.1 9.1 43.1
June 2018 37.7 11.3 8.7 29.0
Source: Cornwall Insight analysis, assumes 15% gross margin on tariffs, includes Capacity Market Supplier Charge
Accessing these differentials provides a much more stable revenue stream than relying on arbitrage of volatile wholesale prices, although half hourly export could still potentially provide these revenue opportunities if market conditions breach the value of avoided consumption. Under such conditions our assessment suggests that the installation of solar and/or storage assets could realise significant savings and pay for themselves within 13 to 15 years using HHS and a smart tariff. This would be ten to twelve years if current FiT values could be accessed.
-£200
-£150
-£100
-£50
£0
£50
£100
LV import LV export HV import HV export
£/M
Wh
va
lue
Power Losses TNUoS/ EET BSUoS
AAHEDC DUoS GDUoS RO
FiT CfD CM
19
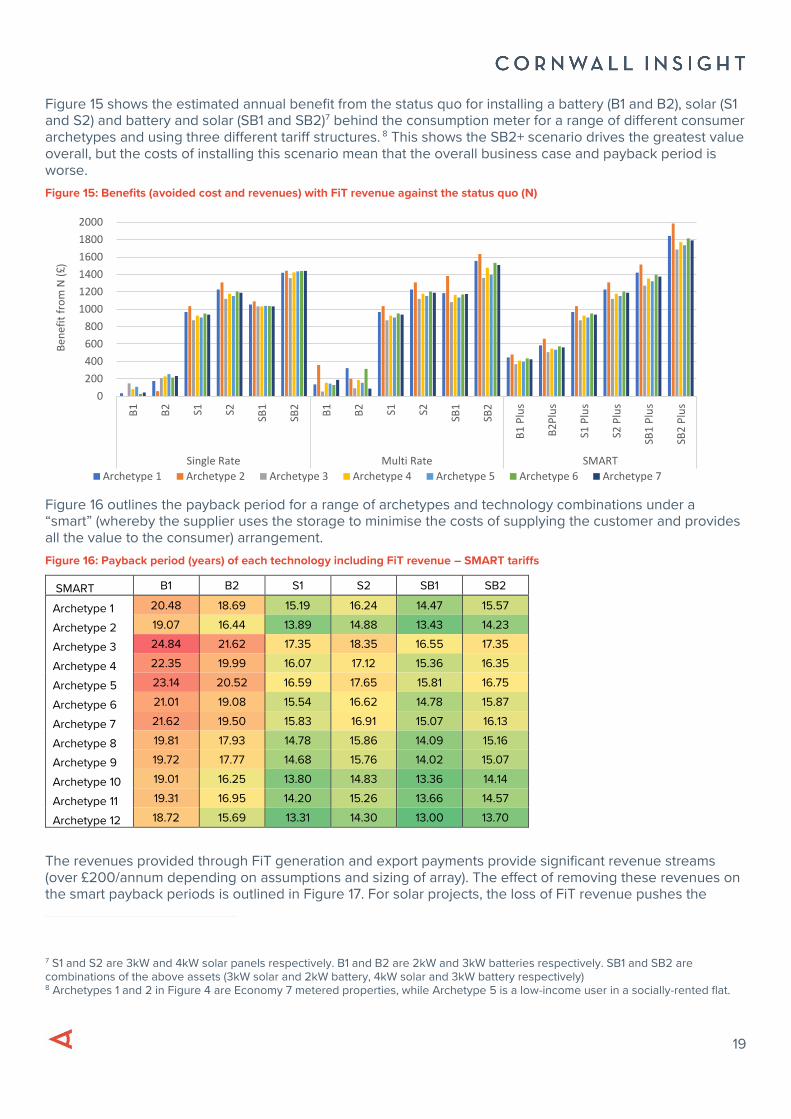
Figure 15 shows the estimated annual benefit from the status quo for installing a battery (B1 and B2), solar (S1 and S2) and battery and solar (SB1 and SB2)7 behind the consumption meter for a range of different consumer archetypes and using three different tariff structures. 8 This shows the SB2+ scenario drives the greatest value overall, but the costs of installing this scenario mean that the overall business case and payback period is worse.
Figure 15: Benefits (avoided cost and revenues) with FiT revenue against the status quo (N)
Figure 16 outlines the payback period for a range of archetypes and technology combinations under a “smart” (whereby the supplier uses the storage to minimise the costs of supplying the customer and provides all the value to the consumer) arrangement.
Figure 16: Payback period (years) of each technology including FiT revenue – SMART tariffs
SMART B1 B2 S1 S2 SB1 SB2
Archetype 1 20.48 18.69 15.19 16.24 14.47 15.57
Archetype 2 19.07 16.44 13.89 14.88 13.43 14.23
Archetype 3 24.84 21.62 17.35 18.35 16.55 17.35
Archetype 4 22.35 19.99 16.07 17.12 15.36 16.35
Archetype 5 23.14 20.52 16.59 17.65 15.81 16.75
Archetype 6 21.01 19.08 15.54 16.62 14.78 15.87
Archetype 7 21.62 19.50 15.83 16.91 15.07 16.13
Archetype 8 19.81 17.93 14.78 15.86 14.09 15.16
Archetype 9 19.72 17.77 14.68 15.76 14.02 15.07
Archetype 10 19.01 16.25 13.80 14.83 13.36 14.14
Archetype 11 19.31 16.95 14.20 15.26 13.66 14.57
Archetype 12 18.72 15.69 13.31 14.30 13.00 13.70
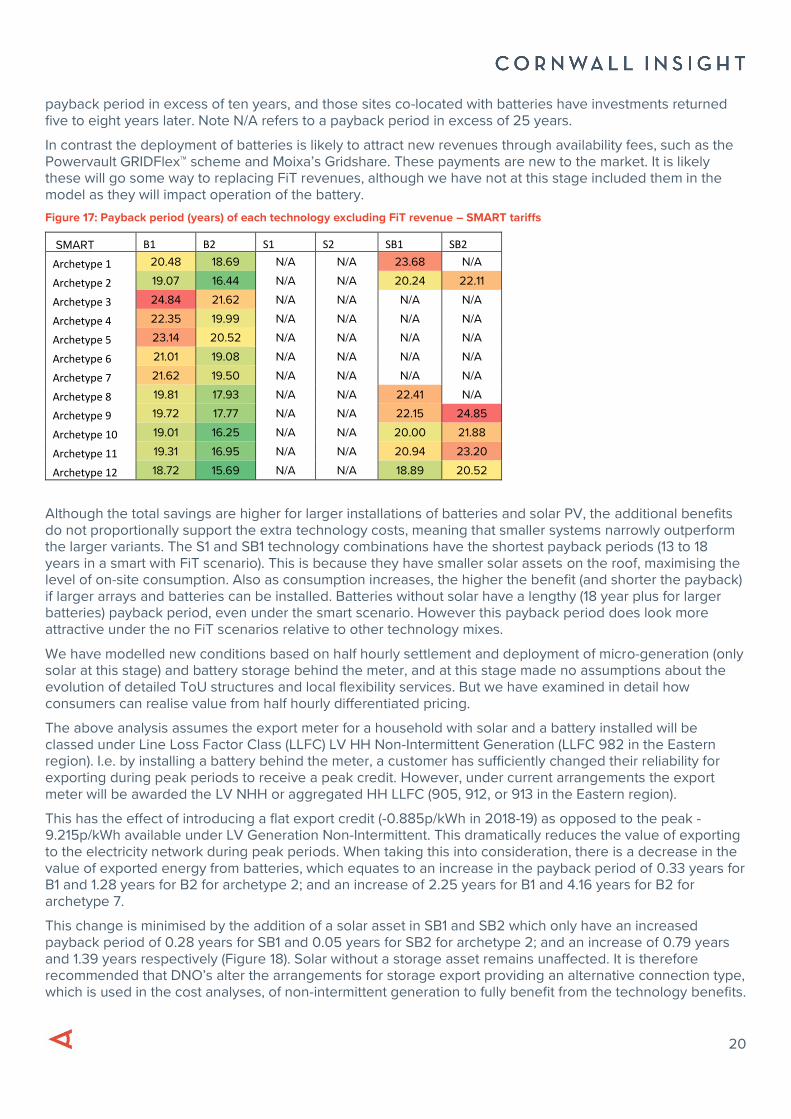
The revenues provided through FiT generation and export payments provide significant revenue streams (over £200/annum depending on assumptions and sizing of array). The effect of removing these revenues on the smart payback periods is outlined in Figure 17. For solar projects, the loss of FiT revenue pushes the
7 S1 and S2 are 3kW and 4kW solar panels respectively. B1 and B2 are 2kW and 3kW batteries respectively. SB1 and SB2 are combinations of the above assets (3kW solar and 2kW battery, 4kW solar and 3kW battery respectively) 8 Archetypes 1 and 2 in Figure 4 are Economy 7 metered properties, while Archetype 5 is a low-income user in a socially-rented flat.
0
200
400
600
800
1000
1200
1400
1600
1800
2000
B1
B2 S1 S2
SB1
SB2
B1
B2 S1 S2
SB1
SB2
B1
Plu
s
B2
Plu
s
S1 P
lus
S2 P
lus
SB1
Plu
s
SB2
Plu
s
Single Rate Multi Rate SMART
Ben
efit
fro
m N
(£
)
Archetype 1 Archetype 2 Archetype 3 Archetype 4 Archetype 5 Archetype 6 Archetype 7
20
payback period in excess of ten years, and those sites co-located with batteries have investments returned five to eight years later. Note N/A refers to a payback period in excess of 25 years.
In contrast the deployment of batteries is likely to attract new revenues through availability fees, such as the Powervault GRIDFlex™ scheme and Moixa’s Gridshare. These payments are new to the market. It is likely these will go some way to replacing FiT revenues, although we have not at this stage included them in the model as they will impact operation of the battery.
Figure 17: Payback period (years) of each technology excluding FiT revenue – SMART tariffs
SMART B1 B2 S1 S2 SB1 SB2
Archetype 1 20.48 18.69 N/A N/A 23.68 N/A
Archetype 2 19.07 16.44 N/A N/A 20.24 22.11
Archetype 3 24.84 21.62 N/A N/A N/A N/A
Archetype 4 22.35 19.99 N/A N/A N/A N/A
Archetype 5 23.14 20.52 N/A N/A N/A N/A
Archetype 6 21.01 19.08 N/A N/A N/A N/A
Archetype 7 21.62 19.50 N/A N/A N/A N/A
Archetype 8 19.81 17.93 N/A N/A 22.41 N/A
Archetype 9 19.72 17.77 N/A N/A 22.15 24.85
Archetype 10 19.01 16.25 N/A N/A 20.00 21.88
Archetype 11 19.31 16.95 N/A N/A 20.94 23.20
Archetype 12 18.72 15.69 N/A N/A 18.89 20.52
Although the total savings are higher for larger installations of batteries and solar PV, the additional benefits do not proportionally support the extra technology costs, meaning that smaller systems narrowly outperform the larger variants. The S1 and SB1 technology combinations have the shortest payback periods (13 to 18 years in a smart with FiT scenario). This is because they have smaller solar assets on the roof, maximising the level of on-site consumption. Also as consumption increases, the higher the benefit (and shorter the payback) if larger arrays and batteries can be installed. Batteries without solar have a lengthy (18 year plus for larger batteries) payback period, even under the smart scenario. However this payback period does look more attractive under the no FiT scenarios relative to other technology mixes.
We have modelled new conditions based on half hourly settlement and deployment of micro-generation (only solar at this stage) and battery storage behind the meter, and at this stage made no assumptions about the evolution of detailed ToU structures and local flexibility services. But we have examined in detail how consumers can realise value from half hourly differentiated pricing.
The above analysis assumes the export meter for a household with solar and a battery installed will be classed under Line Loss Factor Class (LLFC) LV HH Non-Intermittent Generation (LLFC 982 in the Eastern region). I.e. by installing a battery behind the meter, a customer has sufficiently changed their reliability for exporting during peak periods to receive a peak credit. However, under current arrangements the export meter will be awarded the LV NHH or aggregated HH LLFC (905, 912, or 913 in the Eastern region).
This has the effect of introducing a flat export credit (-0.885p/kWh in 2018-19) as opposed to the peak -9.215p/kWh available under LV Generation Non-Intermittent. This dramatically reduces the value of exporting to the electricity network during peak periods. When taking this into consideration, there is a decrease in the value of exported energy from batteries, which equates to an increase in the payback period of 0.33 years for B1 and 1.28 years for B2 for archetype 2; and an increase of 2.25 years for B1 and 4.16 years for B2 for archetype 7.
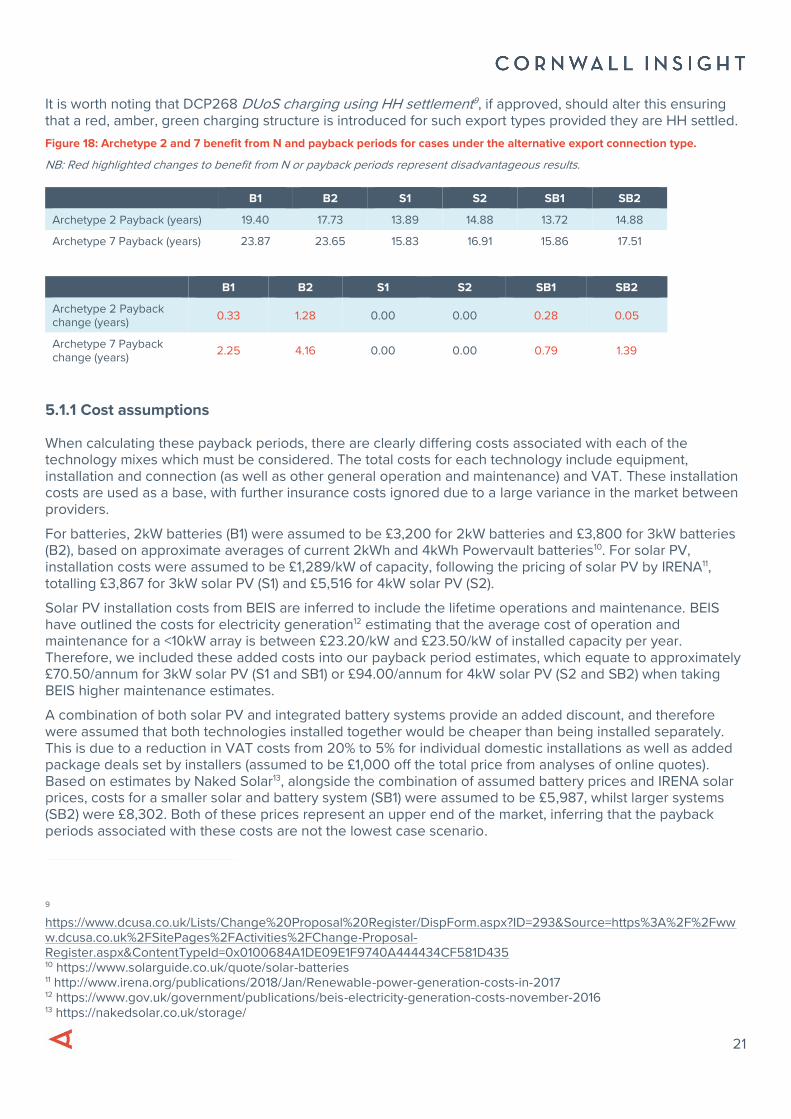
This change is minimised by the addition of a solar asset in SB1 and SB2 which only have an increased payback period of 0.28 years for SB1 and 0.05 years for SB2 for archetype 2; and an increase of 0.79 years and 1.39 years respectively (Figure 18). Solar without a storage asset remains unaffected. It is therefore recommended that DNO’s alter the arrangements for storage export providing an alternative connection type, which is used in the cost analyses, of non-intermittent generation to fully benefit from the technology benefits.
21
It is worth noting that DCP268 DUoS charging using HH settlement9, if approved, should alter this ensuring that a red, amber, green charging structure is introduced for such export types provided they are HH settled.
Figure 18: Archetype 2 and 7 benefit from N and payback periods for cases under the alternative export connection type.
NB: Red highlighted changes to benefit from N or payback periods represent disadvantageous results.
B1 B2 S1 S2 SB1 SB2
Archetype 2 Payback (years) 19.40 17.73 13.89 14.88 13.72 14.88
Archetype 7 Payback (years) 23.87 23.65 15.83 16.91 15.86 17.51
B1 B2 S1 S2 SB1 SB2
Archetype 2 Payback change (years)
0.33 1.28 0.00 0.00 0.28 0.05
Archetype 7 Payback change (years)
2.25 4.16 0.00 0.00 0.79 1.39
5.1.1 Cost assumptions
When calculating these payback periods, there are clearly differing costs associated with each of the technology mixes which must be considered. The total costs for each technology include equipment, installation and connection (as well as other general operation and maintenance) and VAT. These installation costs are used as a base, with further insurance costs ignored due to a large variance in the market between providers.
For batteries, 2kW batteries (B1) were assumed to be £3,200 for 2kW batteries and £3,800 for 3kW batteries (B2), based on approximate averages of current 2kWh and 4kWh Powervault batteries10. For solar PV, installation costs were assumed to be £1,289/kW of capacity, following the pricing of solar PV by IRENA11, totalling £3,867 for 3kW solar PV (S1) and £5,516 for 4kW solar PV (S2).
Solar PV installation costs from BEIS are inferred to include the lifetime operations and maintenance. BEIS have outlined the costs for electricity generation12 estimating that the average cost of operation and maintenance for a <10kW array is between £23.20/kW and £23.50/kW of installed capacity per year. Therefore, we included these added costs into our payback period estimates, which equate to approximately £70.50/annum for 3kW solar PV (S1 and SB1) or £94.00/annum for 4kW solar PV (S2 and SB2) when taking BEIS higher maintenance estimates.
A combination of both solar PV and integrated battery systems provide an added discount, and therefore were assumed that both technologies installed together would be cheaper than being installed separately. This is due to a reduction in VAT costs from 20% to 5% for individual domestic installations as well as added package deals set by installers (assumed to be £1,000 off the total price from analyses of online quotes). Based on estimates by Naked Solar13, alongside the combination of assumed battery prices and IRENA solar prices, costs for a smaller solar and battery system (SB1) were assumed to be £5,987, whilst larger systems (SB2) were £8,302. Both of these prices represent an upper end of the market, inferring that the payback periods associated with these costs are not the lowest case scenario.
9 https://www.dcusa.co.uk/Lists/Change%20Proposal%20Register/DispForm.aspx?ID=293&Source=https%3A%2F%2Fwww.dcusa.co.uk%2FSitePages%2FActivities%2FChange-Proposal-Register.aspx&ContentTypeId=0x0100684A1DE09E1F9740A444434CF581D435 10 https://www.solarguide.co.uk/quote/solar-batteries 11 http://www.irena.org/publications/2018/Jan/Renewable-power-generation-costs-in-2017 12 https://www.gov.uk/government/publications/beis-electricity-generation-costs-november-2016 13 https://nakedsolar.co.uk/storage/
22
Disaggregated installation costs are shown below for each technology, with batteries assumed to have no operations and maintenance costs across their lifetime.
Figure 19: A breakdown of installation costs for each technology class
Technology costs (£)
Equipment and installation O&M per year
S1 3,867.00 70.50
S2 5,156.00 94.00
B1 3,200.00 -
B2 4,420.00 -
SB1 5,986.95 70.50
SB2 8,302.60 94.00
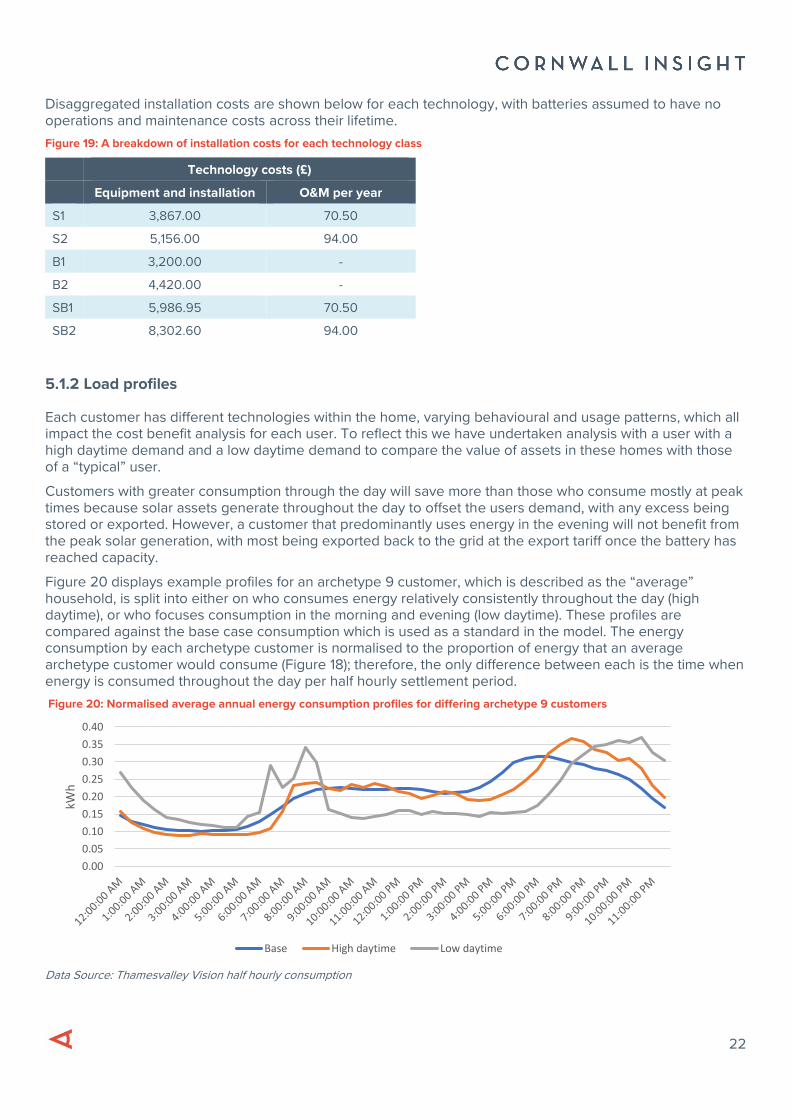
5.1.2 Load profiles
Each customer has different technologies within the home, varying behavioural and usage patterns, which all impact the cost benefit analysis for each user. To reflect this we have undertaken analysis with a user with a high daytime demand and a low daytime demand to compare the value of assets in these homes with those of a “typical” user.
Customers with greater consumption through the day will save more than those who consume mostly at peak times because solar assets generate throughout the day to offset the users demand, with any excess being stored or exported. However, a customer that predominantly uses energy in the evening will not benefit from the peak solar generation, with most being exported back to the grid at the export tariff once the battery has reached capacity.
Figure 20 displays example profiles for an archetype 9 customer, which is described as the “average” household, is split into either on who consumes energy relatively consistently throughout the day (high daytime), or who focuses consumption in the morning and evening (low daytime). These profiles are compared against the base case consumption which is used as a standard in the model. The energy consumption by each archetype customer is normalised to the proportion of energy that an average archetype customer would consume (Figure 18); therefore, the only difference between each is the time when energy is consumed throughout the day per half hourly settlement period.
Figure 20: Normalised average annual energy consumption profiles for differing archetype 9 customers
Data Source: Thamesvalley Vision half hourly consumption
0.00
0.05
0.10
0.15
0.20
0.25
0.30
0.35
0.40
kWh
Base High daytime Low daytime
23
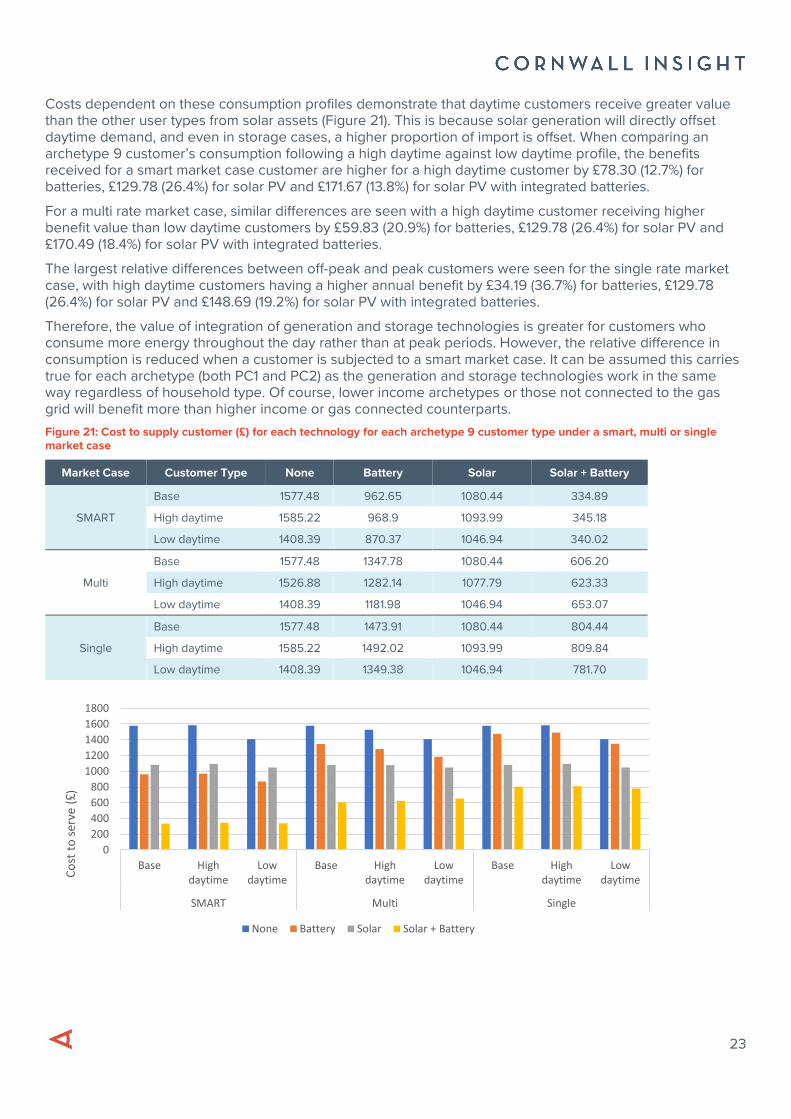
Costs dependent on these consumption profiles demonstrate that daytime customers receive greater value than the other user types from solar assets (Figure 21). This is because solar generation will directly offset daytime demand, and even in storage cases, a higher proportion of import is offset. When comparing an archetype 9 customer’s consumption following a high daytime against low daytime profile, the benefits received for a smart market case customer are higher for a high daytime customer by £78.30 (12.7%) for batteries, £129.78 (26.4%) for solar PV and £171.67 (13.8%) for solar PV with integrated batteries.
For a multi rate market case, similar differences are seen with a high daytime customer receiving higher benefit value than low daytime customers by £59.83 (20.9%) for batteries, £129.78 (26.4%) for solar PV and £170.49 (18.4%) for solar PV with integrated batteries.
The largest relative differences between off-peak and peak customers were seen for the single rate market case, with high daytime customers having a higher annual benefit by £34.19 (36.7%) for batteries, £129.78 (26.4%) for solar PV and £148.69 (19.2%) for solar PV with integrated batteries.
Therefore, the value of integration of generation and storage technologies is greater for customers who consume more energy throughout the day rather than at peak periods. However, the relative difference in consumption is reduced when a customer is subjected to a smart market case. It can be assumed this carries true for each archetype (both PC1 and PC2) as the generation and storage technologies work in the same way regardless of household type. Of course, lower income archetypes or those not connected to the gas grid will benefit more than higher income or gas connected counterparts.
Figure 21: Cost to supply customer (£) for each technology for each archetype 9 customer type under a smart, multi or single market case
Market Case Customer Type None Battery Solar Solar + Battery
SMART
Base 1577.48 962.65 1080.44 334.89
High daytime 1585.22 968.9 1093.99 345.18
Low daytime 1408.39 870.37 1046.94 340.02
Multi
Base 1577.48 1347.78 1080.44 606.20
High daytime 1526.88 1282.14 1077.79 623.33
Low daytime 1408.39 1181.98 1046.94 653.07
Single
Base 1577.48 1473.91 1080.44 804.44
High daytime 1585.22 1492.02 1093.99 809.84
Low daytime 1408.39 1349.38 1046.94 781.70
0
200
400
600
800
1000
1200
1400
1600
1800
Base Highdaytime
Lowdaytime
Base Highdaytime
Lowdaytime
Base Highdaytime
Lowdaytime
SMART Multi Single
Co
st t
o s
erve
(£
)
None Battery Solar Solar + Battery
24
Flexibility is required by different parties for different reasons. Users of the network can benefit from flexibility delivered by other market actors, while the DSO can procure flexibility to benefit the grid. These are noted in the Council of European Energy Regulator’s Conclusions paper on Flexibility Use at Distribution Level14.
There are a number of benefits to local flexibility:
• Energy system benefits – costs
o By including a range of on-site generation and behind the meter flexibility consumers are naturally more resilient and can meet their own electricity demand at a lower cost
• Energy system benefits – impact on carbon reduction and system resilience
o By relying less on imports from the public electricity network, customers are inherently more self-reliant and resilient. Charge from a battery can also act as a buffer during very short brown-outs or periods of system recovery
• Market potential
o Our analysis suggests there is significant market potential in delivering energy storage and solar PV behind the meter in the current environment. The development of a number of customers into the prosumer environment naturally opens up a further market for energy suppliers (and others) in energy services, technology installation, and meeting engaged customers needs
• Contribution to knowledge base and sector building capacity
o We believe this is the first fully costed model exploring various degrees of on-site generation and battery storage conducted at this scale. The modelling accounts for a huge swathe of customers with a range of consumption profiles and demand needs
BEIS should assess who is best placed to enable participant flexibility. For example, the supplier has generation and demand customers and communicates with these parties regularly but receive a no benefit from these actions themselves. Leaving this role with them may also act as a switching disincentive, as it requires generators and consumers to switch to the same supplier.
The DSO is clearly the party that contracts with flexibility providers to derive better outcomes for the grid, although whether this is the incumbent DNO or the local SO is as yet unclear, and different companies exhibit different behaviours The extended remit of the SO is possibly the most logical solution, to allow for holistic oversight of network management across transmission and distribution, and to prevent any conflicts of interest between the DNO and DSO functions of distribution networks.
6.1.1 Short-term changes
All users of the distribution network are charged in a similar manner, as outlined in the Common Distribution Charging Methodologies (CDCM for LV and HV connected users) and the Extra-High Voltage Charging Methodologies (EDCM for EHV connected users). These charge a substantial import tariff at assumed peak periods and provide for a credit for flexible generators over the same period. These charges (for LV and HV users) are agnostic of the stresses and power flows on the local infrastructure.
In order to drive increased flexibility values and further participation in local flexibility markets, the following actions can be taken by the DNO in the short term:
14 https://www.ceer.eu/documents/104400/-/-/e5186abe-67eb-4bb5-1eb2-2237e1997bbc?platform=hootsuite
25
• Further roll-out of service provision opportunities to the local energy marketplace through DSO workstreams and the Open Networks programme
• Provide more transparency on specific constraints – time of day, import/ export
o This provides potential connectees with a more useful information set and better information on how they might be impacted by a constraint
o It could also pave the way for further value or services in the future
Ofgem’s Significant Code Review (SCR) on half hourly settlement is also important to drive through value for flexibility – users can’t be billed or incentivised to provide flexibility without the industry settlement systems recognising demand or generation in each half hour.
Rules changes have been implemented to give effect to ‘elective HHS’. This means that as of June 2017 households can be half hourly settled without the supplier being at a commercial disadvantage. The interlinkage of many electricity charges requires not only the central settlement system (and rules) to change to accommodate domestic HHS, but also network charges and invoicing systems.
On 24 July 2017, Ofgem published an open letter that formally launched the HHS SCR and establishes its parameters and timeline. The objectives for the work programme are:
• Incentivising all retailers and suppliers to encourage customer behaviour in the future electricity demand contributing to a more cost-effective electricity system
• Promoting the efficient use of, and investment in, infrastructure delivering government’s objectives of a flexible, safe and secure low-carbon system
• Minimise undesirable distributional effects on consumers
Once a decision is made, Ofgem will raise code modifications in spring 2020 and take a final decision to implement in winter 2020.
6.1.2 Long-term changes
Further value creating modifications require fundamental changes to the underlying market structure, methodology for recovering network charges, or wholesale changes in participant behaviour. A range of different actors could deliver further value for flexibility:
• Allow network users to realise value through modifying generation or demand behaviour to either allow another party to connect or import/ export where there are typically constraints
o This does not need to be DNO/ DSO led – it is simply the trading of access rights for use of the DNO’s network
o No such facility presently exists, although Ofgem’s latest position under its Network Access workstream is that users could purchase different capacity products, thereby meaning they only have firm access to the network in discrete time-bands/ days/ units
– Subsequent trading of these access rights, which Ofgem considers would be an effective solution to access issues but recognises this would be costly to implement, would result in the outcome noted above
o Therefore Ofgem’s decision on whether to launch a Significant Code Review (SCR) into Network Access, expected in December, will an important juncture at which this value may start to materialise and be debated
• Allocate losses on a more granular and cost reflective basis
o This further drives a price signal to incentivise the location of assets and their import or export at different times of the day
• Carefully consider the correct balance between more cost-reflective charges that drive energy market behaviour and the social recovery of sunk network and energy policy costs

26
o This allows the markets themselves should send price signals for local flexibility rather than separately tendered balancing services
o To a degree this is being tackled by Ofgem’s Targeted Charging Review (TCR) and Charging Futures workstreams, but can be more focussed on delivery of flexible marketplaces
– In its consultation15 on Network Access and Forward Looking Charges issued on 23 July 2018, Ofgem proposed that larger sites could be charges based on their depth of access
– I.e. Local access vs wider access could allow cheaper connection for community project with a guaranteed offtake
• Ofgem also wants parties to be able to reallocate access between themselves
o This could allow aggregated local portfolios to share capacity
These changes would fundamentally improve the value of flexibility. However they would typically only impact up to 25% of electricity bill costs – namely network charges.
We look forward to continuing engaging with this nascent and evolving area of the market and conducting further modelling on the benefits and value of local flexibility markets in the future.
15 https://www.ofgem.gov.uk/system/files/docs/2018/07/network_access_consultation_july_2018_-_final.pdf
27
Term Definition
Annual Energy Consumption Energy consumption over a 12-month period
Arbitrage The practice of exploiting price differentials between different markets, times, products or locations
Balancing Mechanism (BM) A market-based mechanism that enables National Grid to instruct generators and suppliers to vary electricity production or consumption close to, or in real-time, in order to maintain safe operation of the system
Balancing Services Use of System (BSUoS)
Charges that are paid by electricity suppliers and generators based on the energy taken from or supplied to the National Grid system in each half-hour settlement period. It varies for each settlement period
Balancing & Settlement Code (BSC)
Electricity industry code covering the rules for the Balancing Mechanism and the settlement of imbalance charges in GB
BEIS Government department for business, Energy and industrial strategy. BEIS sets UK energy policy and replaced DECC in 2016
British Electricity Transmission & Trading Arrangements (BETTA)
A plan to create a single electricity market in GB, introduced on 1 April 2005 and based on the NETA (New Electricity Trading Arrangements) mechanism, which has been in operation in England and Wales since March 2001
Capacity
Electricity––the amount of power that can be generated from a unit
Gas––the amount of gas that can be held within the physical structures (pipeline and storage facilities)
Capacity Market (CM) Government scheme to ensure security of supply
Contract Price The price for your energy consumption as agreed in your contract. This could be a fixed or flexible price depending on your type of contract
Contract for Difference Support Mechanism (subsidy) for large scale low carbon generation
Connection & Use of System Code (CUSC)
The contractual framework for connection to, and use of, National Grid’s high-voltage transmission system and the high-voltage systems in Scotland
Decentralised Generation (DG)
Also, called embedded generation, decentralised generation, decentralised energy or distributed energy. It is essentially when electricity is generated from many small energy sources connected to the distribution rather than transmission system
Deemed Contract A contract where contractual terms and conditions have not been expressly agreed between the supplier and the customer.
Demand The requirement for power
Distribution Network Operator (DNO)
The operator of an electricity distribution network
Distribution System A network of mains operating at three pressure tiers––intermediate (2barg to 7barg), medium (75mbarg to 2barg) and low (less than 75mbarg)
Distribution Use of System (DUoS)
Charges that are levied by host distribution companies to electricity supply companies to cover the cost of distributing electricity to their customers. Half-hourly DUoS systems calculate site specific bills for large organisations where their energy consumption is significant on a half-hourly basis
Domestic Customer A customer supplier or requiring to be supplied at a domestic premises
Energy Consumption Use of energy as a source of heat or power. Energy consumption will be measured by a gas or electricity meter and you will be billed for the amount you have used
28
Energy Supplier The company supplying electricity, natural gas, fuel oil, kerosene, or LPG
Energy Trading The buying and selling of energy to take advantage of fluctuations in the energy market
Export Meter A meter which measures the quantity of export which, if registered pursuant to the BSC, such registration is to be the responsibility of the FiT licensee.
Feed-in Tariff (FiT) A payment made to generators of small scale renewable electricity generation for electricity produced.
FiT Export Export or deemed export from an accredited FiT installation in relation to which a FiT generator has requested to receive export payments.
FiT Licensee The collective term for mandatory FiT licensees and voluntary FiT licensees.
Generation Meter A meter which measures the quantity of electricity generated by an accredited FiT installation, for which the FiT generator is responsible.
Imbalance The difference between the quantity of gas delivered to the system by a shipper and the quantity delivered to the shippers’ customers (including trades), usually calculated on a daily basis
Kilowatt Hour (kWh)
A unit of energy used by the gas industry. Approximately equal to 0.0341 therms. One Megawatt hour (MWh) equals 103 kWh, one Gigawatt hour (GWh) equals 106 kWh, and one Terawatt hour (TWh) equals 109 kWh.
Kilowatt hour––3,600,000 joules
Megawatt (MW) Standard measure of generation plant capacity equal to one thousand kilowatts, or one million watts. Medium to large power stations have capacity typically in the range of 500MW to 2,000MW
Meter Reading Used to determine energy consumption and for issuing a bill for energy usage for a given period. Meter readings can be submitted online or by phone
Micro-Generation The small-scale production of energy via mini-wind turbines, solar panels or mini generators
Ofgem The UK regulator for both gas and electricity, previously separate as Ofgas and Offer. Ofgem is the Office of the Gas and Electricity Markets Authority (GEMA)
Smart Meter
A system installed for the purposes of the supply of electricity which, as a minimum: consists of an electricity meter and any associated or ancillary devices identified in; has the functional capability specified by; and complies with the other requirements of, the SME Technical Specification applicable at that date.
Supplier A party licensed by Ofgem to sell gas and/or power to end-users
System Operator (SO) The body that manages the operation of the system from day-to-day; part of National Grid’s role in GB for gas and power
Transmission Network Use of System (TNUoS)
Charges that are paid to National Grid by those generators and suppliers who are considered to have used the electricity transmission network to transport energy. The charges vary for both generators and suppliers according to their geographic location and the demand for grid usage at that location