Embed Size (px)
Citation preview
Dynamic effect of Young’s modulus on attachment and differentiation of mouse
embryonic stem cells
Shahzad Ali
2015
University College London
Thesis submitted for the degree of Doctor of Philosophy (PhD) in Biochemical Engineering

Shahzad Ali, UCL
2
Declaration
‘I, Shahzad Ali confirm that the work presented in this thesis is my own. Where
information has been derived from other sources, I confirm that this has been
indicated in the thesis.’
Shahzad Ali, UCL
3
Abstract
Embryonic stem cells have generated much interest due to their ability to differentiate
into any cell type within the body. This ability could potentially allow for scientists and
engineers to develop a number of therapies for diseases, which currently have no cure
such as Parkinson’s disease, Alzheimer’s disease and diabetes. However, the
differentiation process itself is one of the major bottlenecks in developing potential
therapies. Currently protocols involve the use of mixtures of growth factors in order to
create a suitable soluble microenvironment for differentiation. These growth factors
are often expensive, thereby limiting the potential for scale-up of cell bioprocesses.
Much interest has thus been generated into other elements of the microenvironment
that could improve differentiation efficiency. The field of mechanobiology in particular,
has developed rapidly in recent years.
The aim of this thesis was to investigate the effect of Young’s modulus on neuronal
differentiation of mouse embryonic stem cells (mESC’s). Instead of treating
differentiation as one long process, the decision was made to split the process into
three stages. The first, involved the formation of neural precursors from mESC’s. This
was followed by the formation of immature neurons from neural precursors. The final
stage was to allow the immature neurons to develop into a mature neuronal subtype.
The impact of Young’s modulus was split into three effects. One was the initial
attachment of cells. The second was the expansion of cells into colonies. The third was
the effect of Young’s modulus on enrichment of neuronal cells.
It was found that physiologically soft materials favoured the formation of all three
neuronal cell types (precursor, immature and mature). However, the exact effect of
differentiation varied over the course of differentiation. Over the first and second
stages, soft substrates favoured the initial attachment of cells without affecting
enrichment. Over the final stage, however, soft substrates directly favoured
maturation of immature neurons, without having a significant effect upon their
attachment. Thus the effect of Young’s modulus on neuronal differentiation changes
according to the level of cellular maturity.

Shahzad Ali, UCL
4
There have not been any previous studies, which have tried to characterise the effect
of the mechanical microenvironment on differentiation in a stage-by-stage manner.
These findings have many important implications in terms of regenerative medicine
bioprocessing. Firstly the optimal conditions for cellular attachment are not always the
same as the optimal conditions for increasing cell enrichment. By carefully fine-tuning
the mechanical properties at each stage of differentiation, both cell yields and final
enrichment could be increased substantially. Furthermore, different cell types will
require different optimisation strategies. Finally, by better understanding the
interaction between cells and their mechanical environment, these findings could
allow for better future design of tissue engineering biomaterials for implantation of
cells into target areas for cell therapies.

Shahzad Ali, UCL
5
Acknowledgements
I would like to thank my primary supervisor Dr Farlan Veraitch (Dept. of Biochemical
Engineering, University College London, London, UK) for his invaluable help and advice
throughout my project. I would also like to thank my secondary adviser Dr Ivan Wall
(Dept. of Biochemical Engineering, University College London, London, UK) for his
support. Furthermore, I would like to thank Dr Andrew Pelling (The Pelling Lab,
University of Ottawa, Ottawa, Canada) for providing the GXG substrate synthesis
method and Young’s modulus data.
Furthermore, I would like to give my most heartfelt appreciation to all the members of
the regenerative medicine laboratory, including Kate, Tristan, Rui, Amelia, Owen,
Giulia, John, Vishal, Zuming, Carlotta, Iwan and Ben.
Above all, I would like to thank Nathalie, my parents and Azeem for their constant,
unwavering support and love throughout my time at UCL.
On a separate note, I would like to thank Drake, Lana Del Rey and the many other
artists on my music playlists. Without their creativity and inspiration, long hours of
data analysis would not have been nearly the same.
This work was supported by the Engineering and Physical Sciences Research Council
(EPSRC) and Innovative Manufacturing Research Centre (IMRC).
Shahzad Ali, UCL
6
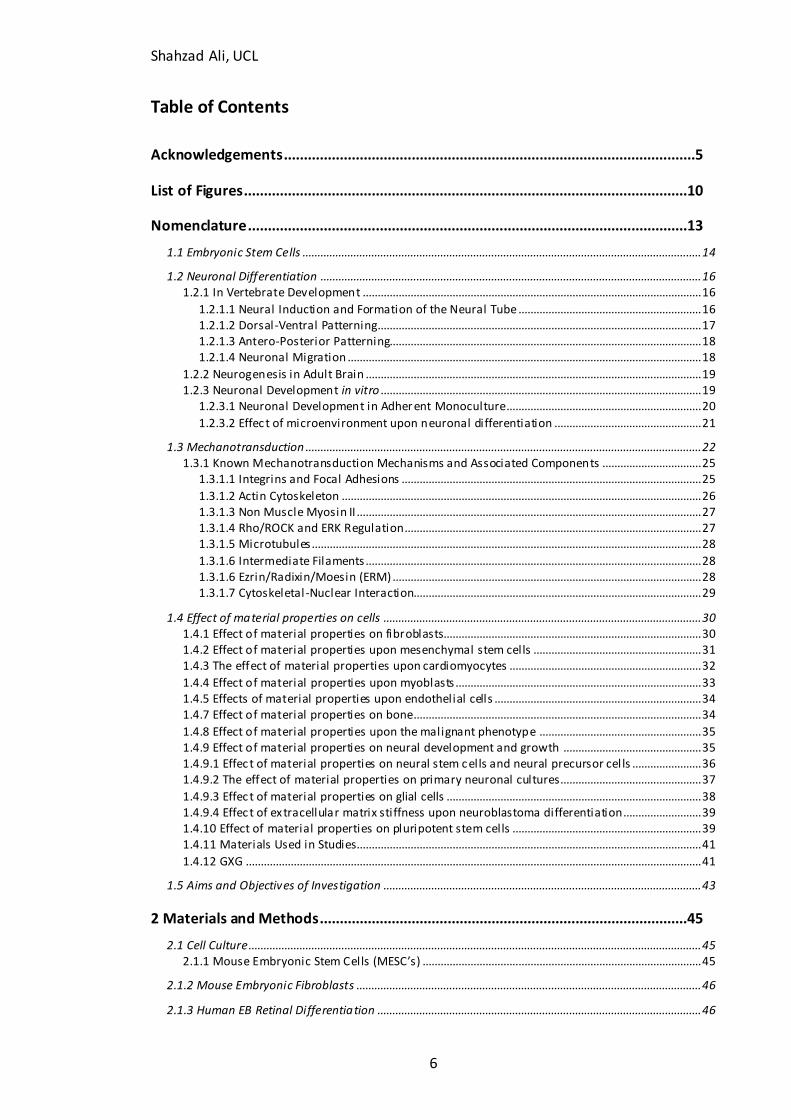
Table of Contents
Acknowledgements .......................................................................................................5
List of Figures ...............................................................................................................10
Nomenclature ..............................................................................................................13
1.1 Embryonic Stem Cells ..................................................................................................................................... 14
1.2 Neuronal Differentiation ............................................................................................................................... 16 1.2.1 In Vertebrate Development ................................................................................................................. 16
1.2.1.1 Neural Induction and Formation of the Neural Tube ............................................................. 16 1.2.1.2 Dorsal-Ventral Patterning ............................................................................................................ 17 1.2.1.3 Antero-Posterior Patterning........................................................................................................ 18 1.2.1.4 Neuronal Migration ...................................................................................................................... 18
1.2.2 Neurogenesis in Adult Brain ................................................................................................................ 19 1.2.3 Neuronal Development in vitro ........................................................................................................... 19
1.2.3.1 Neuronal Development in Adherent Monoculture................................................................. 20 1.2.3.2 Effec t of microenvironment upon neuronal differentiation ................................................. 21
1.3 Mechanotransduction .................................................................................................................................... 22 1.3.1 Known Mechanotransduction Mechanisms and Associated Components ................................. 25
1.3.1.1 Integrins and Focal Adhesions .................................................................................................... 25 1.3.1.2 Actin Cytoskeleton ........................................................................................................................ 26 1.3.1.3 Non Muscle Myosin II ................................................................................................................... 27 1.3.1.4 Rho/ROCK and ERK Regulation ................................................................................................... 27 1.3.1.5 Microtubules .................................................................................................................................. 28 1.3.1.6 Intermediate Filaments ................................................................................................................ 28 1.3.1.6 Ezrin/Radixin/Moesin (ERM) ....................................................................................................... 28 1.3.1.7 Cytoskeletal -Nuclear Interaction................................................................................................ 29
1.4 Effect of material properties on cells .......................................................................................................... 30 1.4.1 Effect of material properties on fibroblasts...................................................................................... 30 1.4.2 Effect of material properties upon mesenchymal stem cells ........................................................ 31 1.4.3 The effect of material properties upon cardiomyocytes ................................................................ 32 1.4.4 Effect of material properties upon myoblasts .................................................................................. 33 1.4.5 Effects of material properties upon endothelial cells ..................................................................... 34 1.4.7 Effect of material properties on bone................................................................................................ 34 1.4.8 Effect of material properties upon the malignant phenotype ...................................................... 35 1.4.9 Effect of material properties on neural development and growth .............................................. 35 1.4.9.1 Effec t of material properties on neural stem c ells and neural precursor cel ls ....................... 36 1.4.9.2 The effect of material properties on primary neuronal cultures............................................... 37 1.4.9.3 Effec t of material properties on glial cells ..................................................................................... 38 1.4.9.4 Effec t of extracellular matrix stiffness upon neuroblastoma differentiation .......................... 39 1.4.10 Effect of material properties on pluripotent stem cells ............................................................... 39 1.4.11 Materials Used in Studies................................................................................................................... 41 1.4.12 GXG ........................................................................................................................................................ 41
1.5 Aims and Objectives of Investigation .......................................................................................................... 43
2 Materials and Methods ............................................................................................45
2.1 Cell Culture....................................................................................................................................................... 45 2.1.1 Mouse Embryonic Stem Cells (MESC’s) ............................................................................................. 45
2.1.2 Mouse Embryonic Fibroblasts ................................................................................................................... 46
2.1.3 Human EB Retinal Differentiation ............................................................................................................ 46
Shahzad Ali, UCL
7
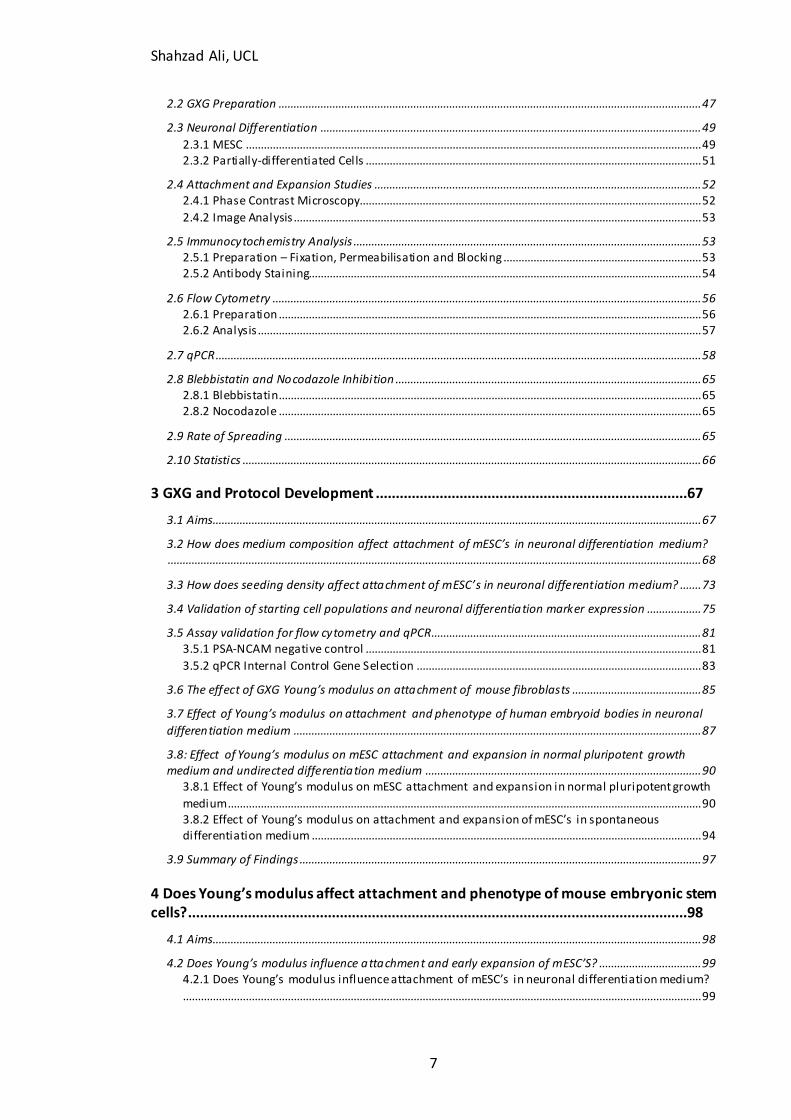
2.2 GXG Preparation ............................................................................................................................................. 47
2.3 Neuronal Differentiation ............................................................................................................................... 49 2.3.1 MESC ........................................................................................................................................................ 49 2.3.2 Partially-differentiated Cells ................................................................................................................ 51
2.4 Attachment and Expansion Studies ............................................................................................................. 52 2.4.1 Phase Contrast Microscopy.................................................................................................................. 52 2.4.2 Image Analysis ........................................................................................................................................ 53
2.5 Immunocytochemistry Analysis .................................................................................................................... 53 2.5.1 Preparation – Fixation, Permeabilisation and Blocking .................................................................. 53 2.5.2 Antibody Staining................................................................................................................................... 54
2.6 Flow Cytometry ............................................................................................................................................... 56 2.6.1 Preparation ............................................................................................................................................. 56 2.6.2 Analysis .................................................................................................................................................... 57
2.7 qPCR .................................................................................................................................................................. 58
2.8 Blebbistatin and Nocodazole Inhibition ...................................................................................................... 65 2.8.1 Blebbistatin ............................................................................................................................................. 65 2.8.2 Nocodazole ............................................................................................................................................. 65
2.9 Rate of Spreading ........................................................................................................................................... 65
2.10 Statistics ......................................................................................................................................................... 66
3 GXG and Protocol Development ..............................................................................67
3.1 Aims................................................................................................................................................................... 67
3.2 How does medium composition affect attachment of mESC’s in neuronal differentiation medium? .................................................................................................................................................................................. 68
3.3 How does seeding density affect attachment of mESC’s in neuronal differentiation medium? ....... 73
3.4 Validation of starting cell populations and neuronal differentiation marker expression .................. 75
3.5 Assay validation for flow cytometry and qPCR.......................................................................................... 81 3.5.1 PSA-NCAM negative control ................................................................................................................ 81 3.5.2 qPCR Internal Control Gene Selection ............................................................................................... 83
3.6 The effect of GXG Young’s modulus on attachment of mouse fibroblasts ........................................... 85
3.7 Effect of Young’s modulus on attachment and phenotype of human embryoid bodies in neuronal
differentiation medium ........................................................................................................................................ 87
3.8: Effect of Young’s modulus on mESC attachment and expansion in normal pluripotent growth medium and undirected differentiation medium ............................................................................................ 90
3.8.1 Effect of Young’s modulus on mESC attachment and expansion in normal pluripotent growth
medium.............................................................................................................................................................. 90 3.8.2 Effect of Young’s modulus on attachment and expansion of mESC’s in spontaneous differentiation medium .................................................................................................................................. 94
3.9 Summary of Findings ...................................................................................................................................... 97
4 Does Young’s modulus affect attachment and phenotype of mouse embryonic stem cells? .............................................................................................................................98
4.1 Aims................................................................................................................................................................... 98
4.2 Does Young’s modulus influence attachment and early expansion of mESC’S? .................................. 99 4.2.1 Does Young’s modulus influence attachment of mESC’s in neuronal differentiation medium?
............................................................................................................................................................................. 99
Shahzad Ali, UCL
8
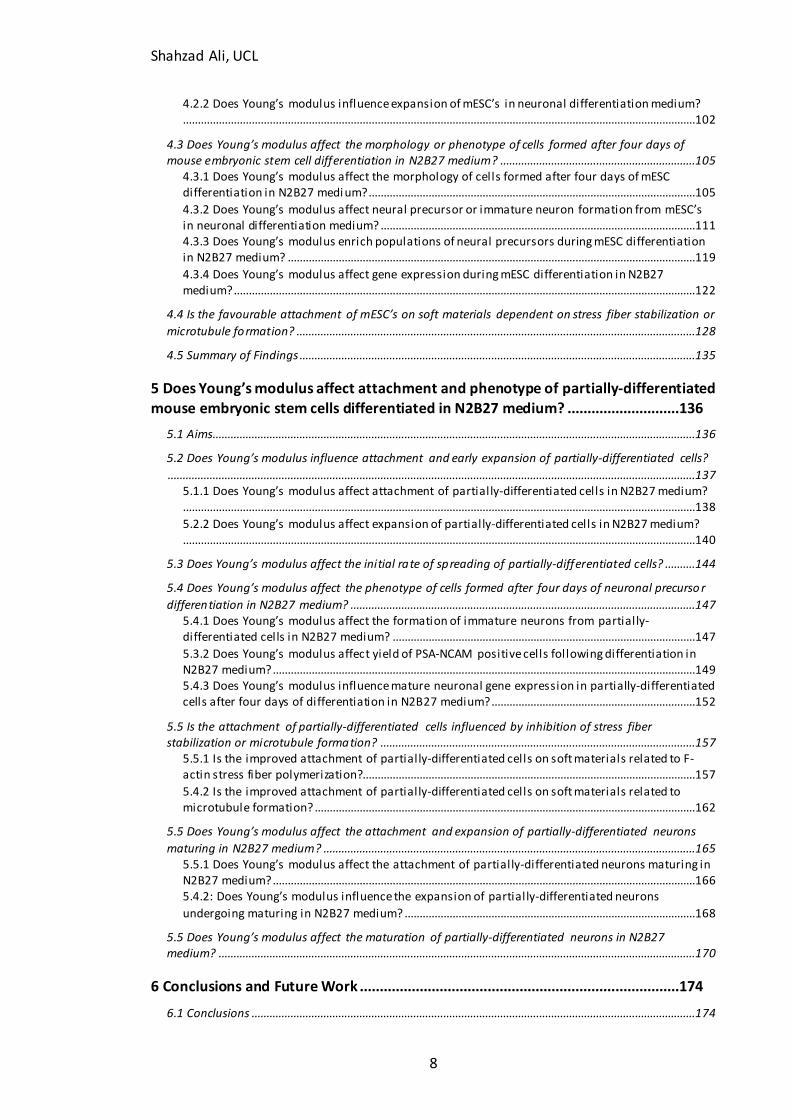
4.2.2 Does Young’s modulus influence expansion of mESC’s in neuronal differentiation medium?...........................................................................................................................................................................102
4.3 Does Young’s modulus affect the morphology or phenotype of cells formed after four days of mouse embryonic stem cell differentiation in N2B27 medium? .................................................................105
4.3.1 Does Young’s modulus affect the morphology of cells formed after four days of mESC differentiation in N2B27 medium? .............................................................................................................105 4.3.2 Does Young’s modulus affect neural precursor or immature neuron formation from mESC’s in neuronal differentiation medium? .........................................................................................................111 4.3.3 Does Young’s modulus enrich populations of neural precursors during mESC differentiation in N2B27 medium? ........................................................................................................................................119 4.3.4 Does Young’s modulus affect gene expression during mESC differentiation in N2B27 medium?..........................................................................................................................................................122
4.4 Is the favourable attachment of mESC’s on soft materials dependent on stress fiber stabilization or
microtubule formation? .....................................................................................................................................128
4.5 Summary of Findings ....................................................................................................................................135
5 Does Young’s modulus affect attachment and phenotype of partially-differentiated mouse embryonic stem cells differentiated in N2B27 medium? ............................136
5.1 Aims.................................................................................................................................................................136
5.2 Does Young’s modulus influence attachment and early expansion of partially-differentiated cells?
................................................................................................................................................................................137 5.1.1 Does Young’s modulus affect attachment of partially-differentiated cells in N2B27 medium?...........................................................................................................................................................................138 5.2.2 Does Young’s modulus affect expansion of partially-differentiated cells in N2B27 medium?...........................................................................................................................................................................140
5.3 Does Young’s modulus affect the initial rate of spreading of partially-differentiated cells? ..........144
5.4 Does Young’s modulus affect the phenotype of cells formed after four days of neuronal precurso r
differentiation in N2B27 medium? ...................................................................................................................147 5.4.1 Does Young’s modulus affect the formation of immature neurons from partially-differentiated cells in N2B27 medium? .....................................................................................................147 5.3.2 Does Young’s modulus affect yield of PSA-NCAM positive cells following differentiation in N2B27 medium?.............................................................................................................................................149 5.4.3 Does Young’s modulus influence mature neuronal gene expression in partially-differentiated cells after four days of differentiation in N2B27 medium?....................................................................152
5.5 Is the attachment of partially-differentiated cells influenced by inhibition of stress fiber stabilization or microtubule formation? .........................................................................................................157
5.5.1 Is the improved attachment of partially-differentiated cells on soft materials related to F-actin stress fiber polymerization?...............................................................................................................157 5.4.2 Is the improved attachment of partially-differentiated cells on soft materials related to microtubule formation? ...............................................................................................................................162
5.5 Does Young’s modulus affect the attachment and expansion of partially-differentiated neurons
maturing in N2B27 medium? ............................................................................................................................165 5.5.1 Does Young’s modulus affect the attachment of partially-differentiated neurons maturing in N2B27 medium?.............................................................................................................................................166 5.4.2: Does Young’s modulus influence the expansion of partially-differentiated neurons
undergoing maturing in N2B27 medium? .................................................................................................168
5.5 Does Young’s modulus affect the maturation of partially-differentiated neurons in N2B27 medium? ...............................................................................................................................................................170
6 Conclusions and Future Work ................................................................................174
6.1 Conclusions ....................................................................................................................................................174

Shahzad Ali, UCL
9
6.2 Future Work...................................................................................................................................................178
7 References...............................................................................................................181
Shahzad Ali, UCL
10
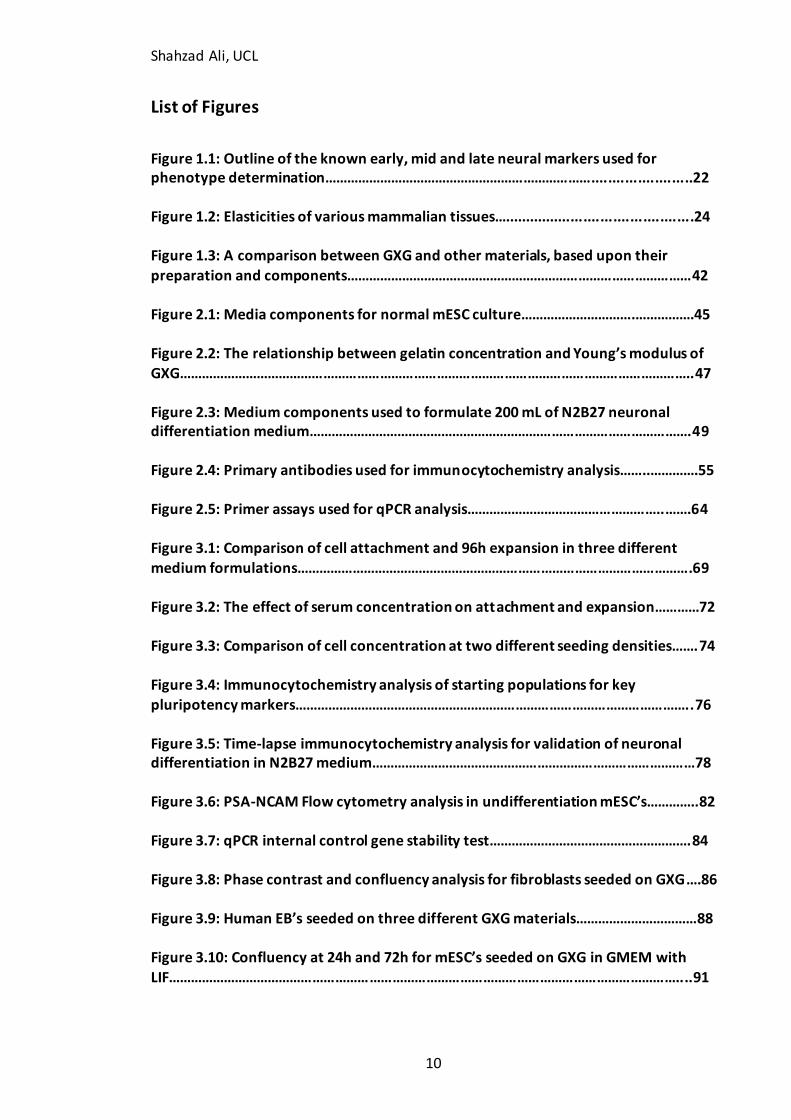
List of Figures
Figure 1.1: Outline of the known early, mid and late neural markers used for phenotype determination………………………………………………………………........................22 Figure 1.2: Elasticities of various mammalian tissues….............................................24 Figure 1.3: A comparison between GXG and other materials, based upon their
preparation and components…………………………………………………………………………………42
Figure 2.1: Media components for normal mESC culture………………………….…………….45
Figure 2.2: The relationship between gelatin concentration and Young’s modulus of GXG………………………………………………………………………………………………………………………..47 Figure 2.3: Medium components used to formulate 200 mL of N2B27 neuronal differentiation medium………………………………………………………………………………………….49 Figure 2.4: Primary antibodies used for immunocytochemistry analysis……..………….55 Figure 2.5: Primer assays used for qPCR analysis……………………………………………..…….64 Figure 3.1: Comparison of cell attachment and 96h expansion in three different medium formulations…………………………………………………………………………………………….69 Figure 3.2: The effect of serum concentration on attachment and expansion…………72 Figure 3.3: Comparison of cell concentration at two different seeding densities…….74
Figure 3.4: Immunocytochemistry analysis of starting populations for key pluripotency markers……………………………………………………………………………………………..76 Figure 3.5: Time-lapse immunocytochemistry analysis for validation of neuronal differentiation in N2B27 medium……………………………………………………………………………78 Figure 3.6: PSA-NCAM Flow cytometry analysis in undifferentiation mESC’s…………..82 Figure 3.7: qPCR internal control gene stability test……………………………………………….84 Figure 3.8: Phase contrast and confluency analysis for fibroblasts seeded on GXG….86 Figure 3.9: Human EB’s seeded on three different GXG materials……………………………88 Figure 3.10: Confluency at 24h and 72h for mESC’s seeded on GXG in GMEM with LIF………………………………………………………………………………………………………………………....91
Shahzad Ali, UCL
11
Figure 3.11: Confluency at 24h and 72h for mESC’s seeded on GXG in GMEM without
LIF…………………..……………………………………………………………………………………………………..96
Figure 4.1: Phase contrast images and confluency measurements at 24h for mESC’s seeded on GXG in N2B27 medium…......…………………………………………………………….…101
Figure 4.2: Confluency at 72h for mESC’s seeded on GXG in N2B27……………….…….104
Figure 4.3: Phase contrast images showing cell morphology at day four on GXG…..106
Figure 4.4A: Relating D4 morphologies to Nestin immunocytochemistry………..…….107
Figure 4.4B: Relating D4 morphologies to Sox17 immunocytochemistry……………....109
Figure 4.4C: Relating D4 morphologies to T-Brachyury immunocytochemistry………110
Figure 4.5: Time course analysis for pluripotent markers on GXG………………………….112 Figure 4.6: Immunocytochemistry analysis for Ki67………………………………………….…..115 Figure 4.7: Time course analysis for neural markers on GXG…………………………………117 Figure 4.8: Total cell concentration at day four on GXG in N2B27….……………………..121
Figure 4.9: Flow cytometry analysis and PSA-NCAM(+) cell yield on GXG………………123
Figure 4.10: Changes in gene expression with Young’s modulus…………………….…….126
Figure 4.11: Effect of blebbistatin on mESC attachment in N2B27 medium…………..129
Figure 4.12: Immunocytochemistry analysis for F-actin in mESC’s…………………………130
Figure 4.13: Immunocytochemistry analysis for F-actin with and without blebbistatin inhibition on GXG…….….……………………………………………………………………………………… .131 Figure 4.14: Effect of nocodazole on mESC attachment in N2B27 medium……………133
Figure 4.15: Immunocytochemistry analysis for -tubulin with and without nocodazole inhibition…………………………………………………………………………………………… 134 Figure 5.1: Phase contrast images and confluency measurements at 24h for partially-differentiated cells seeded on GXG in N2B27 medium………………………………………….139
Figure 5.2: Confluency at 72h for partially-differentiated cells seeded on GXG….….142 Figure 5.3: Rate of spreading for partially-differentiated cells seeded on GXG for 6h…………………………………………………………………………………………………………………………145
Shahzad Ali, UCL
12
Figure 5.4: Immunocytochemistry analysis for b-III tubulin in partially-differentiated cells on GXG………………………………………………………………………………………………….………146
Figure 5.5: Total cell concentration at day four on GXG in N2B27………………………….148
Figure 5.6: Flow cytometry and PSA-NCAM(+ve) cell yield…………………………………….151
Figure 5.7: Gene expression of mature neuronal and glial markers……………………….153
Figure 5.8: Effect of blebbistatin treatment on attachment of partially-differentiated
cells on GXG…………………………………………………………………………………………….……………158
Figure 5.9A): Morphological changes with blebbistatin treatment in partially-differentiated cells………………………………………………………………………….……………………159
Figure 5.9B-D): Immunocytochemistry analysis for F-actin in partially-differentiated cells with and without blebbistatin on GXG………………………………………..………………..159 Figure 5.10: Effect of nocodazole treatment on attachment of partially-differentiated cells on GXG…………………………………………………………………………………………………….……163
Figure 5.11: Immunocytochemistry analysis for -tubulin in partially-differentiated cells with and without nocodazole on GXG…………………………………………………………..164
Figure 5.12: Phase contrast images and confluency at 24h for partially-differentiated
neurons seeded on GXG in N2B27 medium………………………………………………………..…167
Figure 5.13: Confluency at 72h for partially-differentiated neurons seeded on GXG in N2B27 medium…………………………………………………………………………………………………….169
Figure 5.14: Immunocytochemistry analysis for b-III tubulin and MAP2 in partially-
differentiated neurons differentiated for a further six days on GXG in N2B27………174
Figure 5.15: Phase contrast images of partially-differentiated neurons replated from GXG to GXG………………………………………………………………………………………………………….172
Shahzad Ali, UCL
13
Nomenclature
ANOVA = Analysis of Variance BMP = Bone Morphogenetic Protein DAPI = 4’,6-Diamidino-2-Phenylindole DMSO = Dimethyl Sulfoxide EB = Embryoid Body ECM = Extracellular Matrix
ERK = Extracellular Signal-Regulated Kinases ESC = Embryonic Stem Cell
FBS = Fetal Bovine Serum FGF = Fibroblast Growth Factor
GABA = -Aminobutyric Acid GAD2 = Glutamate Decarboxylase 2
GFAP = Glial Fibrillary Acidic Protein GMEM = Glasgow Minimum Essential Medium
GXG = Gelatin Crosslinked with Glutaraldehyde hESC = Human Embryonic Stem Cell HUVEC = Human Umbilical Vein Endothelial Cell iPSC = Induced Pluripotent Stem Cell LIF = Leukemia Inhibitory Factor MAP2 = Microtubule-Associated Protein MEF = Mouse Embryonic Fibroblast mESC = Mouse Embryonic Stem Cell MSC = Mesenchymal Stem Cell NaBH4 = Sodium Borohydride NMMII = Non-Muscle Myosin II OCT4 = Octamer-Binding Transcription Factor PA = Polyacrylamide
PBS = Phosphate Buffer Saline PDMS = Polydimethylsiloxane
PGK1 = Phosphoglycerokinase PSA-NCAM = Polysialylated-Neural Cell Adhesion Marker qPCR = Quantitative Polymerase Chain Reaction RHB-A = Rory’s Home Brew RN18 = 18S Ribosomal RNA SGZ = Sub-Granular Zone Shh = Sonic Hedgehog SVZ = Sub-Ventricular Zone TBP = TATA Box Binding Protein TCP = Tissue Culture Polystyrene TH = Tyrosine Hydroxylase UTF1 = Undifferentiated Embryonic Cell Transcription Factor 1 vmIPN = Variable Moduli Interpenetrating Polymer Networks
Shahzad Ali, UCL
14
1 Introduction
1.1 Embryonic Stem Cells
Embryonic stem (ES) cells are capable of unlimited self-renewal in vitro (Evans &
Kaufman, 1981) and differentiation into any cell lineage from each of the three germ
layers (endoderm, ectoderm and mesoderm). Embryonic Stem Cells are derived in
culture by the removal and in vitro replating of the inner cell mass of blastocysts, 8
days post-fertilisation (Thomson et al., 1998). These cells can then be expanded as a
monolayer in adherent culture (on gelatin in the case of mouse ES cells or mitomycin-
treated mouse embryonic fibroblasts in the case of human ES cells). When expanded in
a suspension culture without gelatin or feeders, embryonic stem cells form cellular
aggregates termed embryoid bodies (Itskovitz-Eldor et al, 2000). Embryoid bodies
(EB’s) contain a mixture of differentiated cells from the three germ layers.
Regenerative medicine is the replacement or generation of cells, tissues and organs
damaged by disease in order to restore or establish normal function (Mason & Dunnill,
2008). The ability of embryonic stem cells to differentiate into multiple cell types has
generated much interest into potential regenerative medicine applications, including
potential therapies for Parkinson’s disease (Morizane et al, 2008; Lee et al, 2000;
Frilling et al. 2009), diabetes (Soria et al, 2000; Lumelsky et al, 2001) and
cardiovascular disease (Kehat et al, 2001; Kehat et al, 2002; Westfall et al, 1998; Min et
al, 2002). In the case of Parkinson’s disease for example, stem cells could be used to
replace populations of dopaminergic neurons, which die in large numbers during the
progress of the disease.
The ability of embryonic stem cells to differentiate into any cell type (other than extra-
embryonic tissue such as placenta) is termed pluripotency. This is in contrast to
multipotency, where cells such as adult stem cells have the potential to form a more
limited variety of cells restricted to certain lineages. For example, haematopoietic
stem cells, which are isolated from bone marrow (Gunsilius et al, 2001) and used in
haematopoietic stem cell transplantation (HSCT), form into blood cells (Lewis &
Shahzad Ali, UCL
15
Trobaugh, 1964). Similarly adult mesenchymal stem cells can only form into a limited
range of cell types, including neurons, myoblasts and osteoblasts (Engler et al., 2006).
In addition to lacking pluripotency, differentiated cells also have reduced proliferative
capacity compared to stem cells. For example, mature, terminally differentiated
neurons do not have the ability to self renew. When neurons are lost in the adult
brain, they are replaced by cells from a small sub-population of multipotent neural
stem cells in the sub-ventricular and sub-granular zones (Levitan & Kaczmarek, 2002),
not by proliferation of neurons.
Induced pluripotent stem cells (iPS cells) are a further source of pluripotent cells.
These are reprogrammed somatic cells (for example, fibroblasts), which are able to
express various pluripotent stem cell markers in addition to forming cells from the
three germ layers (Takahashi & Yamanaka, 2006). Fibroblasts can be induced into iPS
cells using lentiviral or (Yu et al., 2007) adenoviral (Stadtfeld, 2008; Zhou et al, 2009)
vectors containing genes associated with pluripotency. Induced pluripotent stem cells
are not yet a completely viable alternative to embryonic stem cells as the long-term
characterization of their stability in culture has yet to be established. However, recent
work using cells derived from iPSC’s have provided interesting results, including the
formation of miniature brain organoids (Lancaster et al, 2013), beating mouse hearts
(Lu et al, 2013) and vascularised livers (Takebe et al, 2013).
Mouse embryonic stem cells (mESCs) are frequently used for studying neuronal
differentiation and development as their differentiation protocols are relatively well
characterised. Mouse embryonic stem cells however are not completely analogous to
human embryonic stem cells as they differ in the signalling pathways they use. For
example, mouse embryonic stem cells signal through the leukaemia inhibitory factor
pathway during pluripotency, whilst human embryonic stem cells do not. However, the
overall self-renewal strategy is similar between human and mouse embryonic stem
cells (Ginis et al., 2004).
Shahzad Ali, UCL
16
1.2 Neuronal Differentiation
1.2.1 In Vertebrate Development
Overall vertebrate development from an embryo can be considered in four stages
(Levitan & Kaczmarek, 2002). The first stage of development is the cleavage of the
fertilized egg. The cleavage stage produces a number of identical cells each containing
a copy of the genome. The cells of the inner cell mass (which are plated out to form
embryonic stem cells) are isolated at this stage of development.
The next stage of development is the patterning, where the cells are allocated to the
three germ layers (ectodermal, mesodermal and endodermal). This stage is analogous
to the EB stage in ES cells. The cells that are destined to eventually become neuronal
cells are found within the ectodermal germ layer. The third stage in development is
morphogenesis, during which gastrulation occurs. Gastrulation involves extensive
migration of the patterned cells in order to form the main body plan.
The fourth stage of development is differentiation. Differentiation is the process by
which cells become structurally and functionally different from each other, forming
into specialized tissues (Levitan and Kaczmarek, 2002). The stages involved in neuronal
differentiation are outlined below. Within this report, the term ‘neural’ is used to
denote any cells or tissue of the central nervous system including neurons, astrocytes
and oligodendrocytes, whereas the term ‘neuronal’ specifically refers to neurons.
1.2.1.1 Neural Induction and Formation of the Neural Tube
The cells that undergo neural induction are found in the dorsal layer of the ectodermal
tissue. The remaining ventral cells in the ectodermal tissue form the epidermis. The
dorsal layer of ectodermal cells thickens to form a region known as the neural plate,
from which the nervous system is derived.
Shahzad Ali, UCL
17
The neural plate is formed by the induction of a small group of cells in the
neuroepithelium. Induction involves many different types of signalling, including bone
morphogenetic protein (BMP) signalling.
BMP is a type of transforming growth factor (TGF-) protein, of which Nodal and
Activin are also examples (Seuntjens et al., 2009). BMP influences differentiation by
diverting cells away from the neuronal fate. Neurectodermal specification is
encouraged by inhibition of BMP signalling by neural inducer molecules such as
Noggin.
Only a small fraction of neural plate cells mature into functional neurons. Their
partially differentiated neighbouring cells remain present as multipotent neural stem
cells in the adult sub-ventricular (SVZ) and sub-granular (SGZ) zones. Thus
neurogenesis is enabled to continue in the adult brain.
As gastrulation reaches its’ conclusion, the neural plate is folded in order to form the
neural tube. As this occurs, neural crest cells migrate away from the dorsal region of
the neural tube. The cells that remain within the neural tube form the central nervous
system and become patterned (in terms of identity and gene expression) along the
dorso-ventral and antero-posterior axis of the neural tube.
1.2.1.2 Dorsal-Ventral Patterning
Neurons of the central nervous system become specified according to their position
relative to the dorsal and ventral regions of the neural tube. This patterning is
regulated by BMP and sonic hedgehog (Shh) signalling. These two growth factors act
antagonistically to create a dorsal-ventral Shh gradient. The type of neurons formed
depends upon Shh concentration. Retinoic acid (a component of the N2B27 medium
used in this study, as outlined later) also has an effect on patterning and is secreted by
the notochord, a mesodermal rod-like structure that runs along the ventral midline.
Shahzad Ali, UCL
18
1.2.1.3 Antero-Posterior Patterning
FGF (fibroblast growth factor) signalling is the main regulator of neuronal fate along
the antero-posterior axis. FGF is secreted by mesodermal tissue and its signalling is
graded from a high posterior level to a low anterior levelling. This gradient of FGF
signalling gives rise to antero-posterior patterning of Hox gene expression. The
expression of Hox genes specifies the identity of the motor neurons.
Thus motor neurons are sub-divided into pools along the dorsal-ventral and antero-
posterior axes. The motor neurons within each pool direct axonal growth towards
specific target muscles.
1.2.1.4 Neuronal Migration
Neurons extend out processes from the central body called neurites. Neurites are
further subdivided into dendrites and axons. Dendrites conduct electrical impulses
towards the central cell body (the soma), whilst axons direct electrical impulses away
from the soma. During neuronal growth, the region at the end of the axon is known as
the neuronal growth cone. The neuronal growth cone directs axonal outgrowth during
migration. Growth cones generate traction through retrograde actin flow (Franze &
Guck, 2010), generated by myosin IIb activity (these processes are described in more
detail later in this Chapter). Migration of the growth cone is based on attractive and
repulsive cues. The stiffness of the extra-cellular matrix has a profound effect on
growth cone migration (Koch et al, 2012; Flanagan et al, 2002). Growth cones tend to
migrate towards more deformable substrates.
Once migration is complete, synapse formation and refinement occurs. During initial
synapse formation, more connections are formed than are necessary for normal nerve
function. During refinement, excess motor neurons die due to activation of apoptotic
pathways (programmed cell death). The surviving neurons then mature to become
fully functional adult neurons.
Shahzad Ali, UCL
19
1.2.2 Neurogenesis in Adult Brain
As mentioned before, the creation of neurons continues in the adult brain to replace
neurons that die during normal adult function. This process is known as neurogenesis.
Neurogenesis occurs from the small populations of neural stem cells in the adult sub-
ventricular (SVZ) and sub-granular zones (SGZ) mentioned earlier. These locations are
niches for the neural stem cells. Niches are privileged settings for support of self-
renewal (Conti et al., 2005) and thus, all stem cells exist within niches in vivo.
Cells within the adult sub-ventricular zone are more predisposed towards glial
(specifically, astrocytic) differentiation than cells within the developing central nervous
system. This may be due to higher expression of epidermal growth factor receptors
(EGFR), which causes neural stem cells to become more susceptible to the astrocytic-
inducing effects of leukaemia inhibitory factor (LIF). Within in vitro culture, mouse
embryonic stem cells require the addition of LIF to the growth medium in order to
remain undifferentiated. LIF acts through the JAK/STAT signalling pathway (Niwa et al,
1998).
A balance between proliferation and differentiation regulates neural stem cell
numbers within the adult niches. In addition to this, programmed cell death
(apoptosis) has an effect on balancing stem cell numbers.
1.2.3 Neuronal Development in vitro
Mouse embryonic stem cells are maintained undifferentiated in culture through the
addition of LIF and serum to the growth medium. Removal of serum leads to
spontaneous differentiation. Serum generally has a negative influence on neuronal
differentiation due to the presence of BMP4, which inhibits the conversion of mouse
embryonic stem cells to neural precursor cells (Finley et al, 1999; Zhang et al, 2010).
LIF removal can also cause spontaneous differentiation, forming some populations of
neuronal cells (Smukler et al, 2006). Mouse embryonic stem cells can be directed more
Shahzad Ali, UCL
20
accurately towards the neuronal fate in vitro by addition of neurogenic growth factors
and careful control over the microenvironment.
1.2.3.1 Neuronal Development in Adherent Monoculture
A protocol was developed by Ying et al (2003), based on earlier work by Pachernik et al
(2002) that allowed for differentiation of mouse embryonic stem cells into neurons in
adherent monoculture. The majority of other neuronal differentiation protocols for
mESC’s involve the use of EB’s (Wichterle & Peljto, 2008; Okada et al, 2008; Lee et al,
2000) or neural EB’s (Bouhon et al, 2005). Whilst these protocols do robustly produce
populations of neural cells, the three-dimensional nature of EB’s prevents some cells
from coming into contact with the extracellular matrix. As this study was focused
purely on the influence of the cell-matrix interactions, it was desirable to reduce the
effects of cell-cell interactions as much as possible.
The Ying et al (2003) protocol involved the use of N2B27, a serum-free medium
containing N2 and B27 supplements. The B27 supplement contains retinyl acetate, a
naturally occurring form of vitamin A (Brewer et al, 1993). Vitamin A oxidises to form
retinoic acid, which promotes neuronal differentiation. Both supplements also contain
a variety of growth factors, such as apo-transferrin, which support serum-free growth.
Embryonic stem cells were plated onto gelatin-coated well plates at a cell density of
(0.5-1.5) x 104 cells/cm2. The medium was then changed every 48 hours. Expression of
Sox1 (Figure 1.1) increases over the first 4 days of culture in the medium before
reaching a plateau, which is maintained until day 8. Sox1 expression then decreases
after day 8 as neuronal and glial differentiation occurs (Sox1 is downregulated during
neuronal and glial differentiation).
After 48 hours, Oct4 (a transcription factor involved in pluripotency in embryonic stem
cells) began to decrease until day 4 of culture. During the same time, expression of
nestin increases. Nestin is a type IV intermediate filament that is expressed in the
Shahzad Ali, UCL
21
developing central nervous system by neural precursors (Mokry & Nemecek, 1998). At
Day 4, attached neural precursor cells have a ‘rosette’-like morphology.
After Day 4, nestin begins to become downregulated as III-tubulin expression
increases from day 6 to day 8. III-tubulin is a microtubule filament, which is expressed
as neural precursors differentiate into immature neurons (Engler et al, 2006) and
extend axonal processes. Beyond day 8, cells differentiate into a variety of cells
including mature motor neurons, dopaminergic neurons, astrocytes and
oligodendrocytes and express the associated markers for these cells (MAP2, tyrosine
hydroxylase, GFAP and Olig2 respectively).
1.2.3.2 Effect of microenvironment upon neuronal differentiation
The examples described above mainly involve the use of media containing various
growth factors that favour neuronal commitment. It is likely that other elements of the
microenvironment, besides the soluble, also have an effect upon the proliferation and
neuronal differentiation of embryonic stem cells. Work carried out by Mondragon et
al. (2009) examined the relationship between the oxygen tension in which embryonic
stem cells are maintained and the efficiency of neuronal differentiation. It was found
that the percentage of cells expressing neuronal markers at the end of the Ying et al.
(2003) protocol increased when the local oxygen tension was reduced to a near-
physiological hypoxic oxygen tension of 2% from the ambient laboratory oxygen
tension of 20%. The increase in yield of the neuronal differentiation process in near-
physiological oxygen tensions suggests that control over the oxygen microenvironment
may be a crucial factor in increasing purities and yields of the embryonic stem cell
differentiation process.
Within current differentiation protocols, cell yield and enrichment are often low due to
the mixed populations of undifferentiated and differentiated cells that result post-
differentiation. As well as potentially reducing the efficacy of any therapy developed,
this raises concerns in terms of cost efficiency, as the usage of resources such as
medium and other consumables is high, in relation to the yield of target cells obtained.
Shahzad Ali, UCL
22
The presence of undifferentiated stem cells in any cell therapy to be administered into
a patient is also likely to raise safety and regulatory concerns with the Food and Drug
Administration (FDA) regarding tumorigenicity (Knoepfler, 2009).
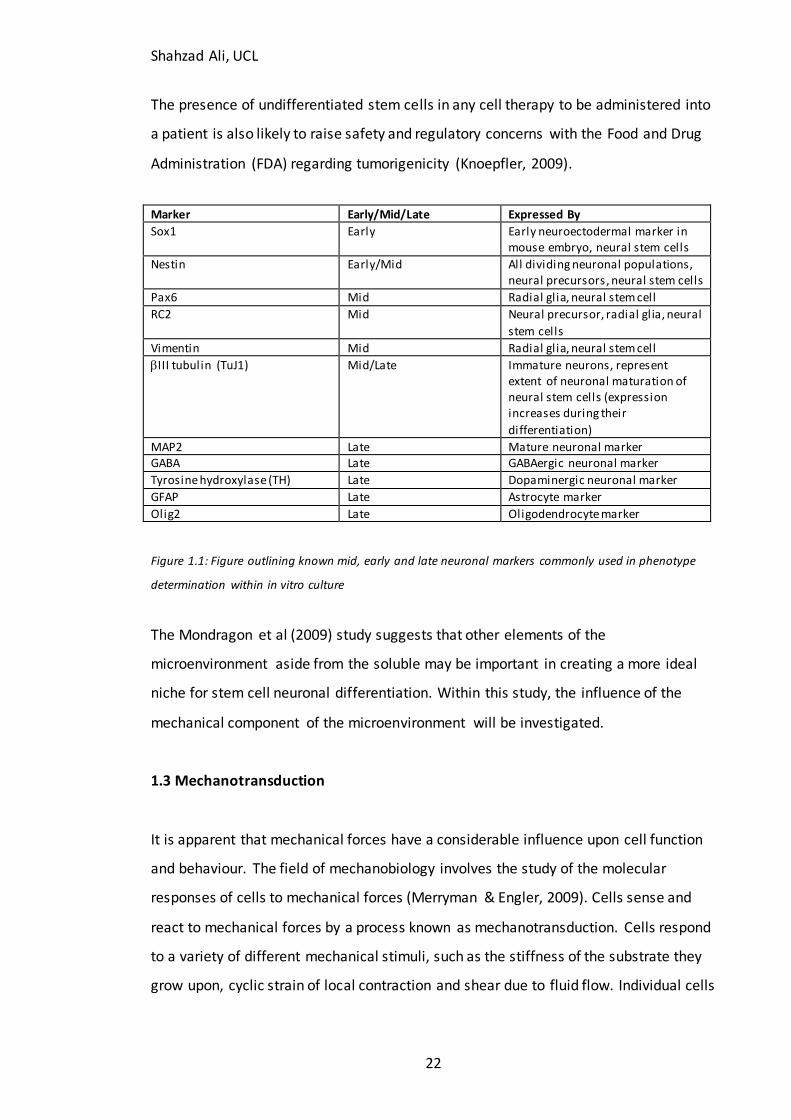
Marker Early/Mid/Late Expressed By
Sox1 Early Early neuroectodermal marker in mouse embryo, neural stem cells
Nestin Early/Mid All dividing neuronal populations, neural precursors, neural stem cells
Pax6 Mid Radial glia, neural stem cell
RC2 Mid Neural precursor, radial glia, neural
stem cells
Vimentin Mid Radial glia, neural stem cell
III tubulin (TuJ1) Mid/Late Immature neurons, represent extent of neuronal maturation of neural stem cells (expression increases during their
differentiation)
MAP2 Late Mature neuronal marker GABA Late GABAergic neuronal marker
Tyrosine hydroxylase (TH) Late Dopaminergic neuronal marker
GFAP Late Astrocyte marker
Olig2 Late Oligodendrocyte marker
Figure 1.1: Figure outlining known mid, early and late neuronal markers commonly used in phenotype
determination within in vitro culture
The Mondragon et al (2009) study suggests that other elements of the
microenvironment aside from the soluble may be important in creating a more ideal
niche for stem cell neuronal differentiation. Within this study, the influence of the
mechanical component of the microenvironment will be investigated.
1.3 Mechanotransduction
It is apparent that mechanical forces have a considerable influence upon cell function
and behaviour. The field of mechanobiology involves the study of the molecular
responses of cells to mechanical forces (Merryman & Engler, 2009). Cells sense and
react to mechanical forces by a process known as mechanotransduction. Cells respond
to a variety of different mechanical stimuli, such as the stiffness of the substrate they
grow upon, cyclic strain of local contraction and shear due to fluid flow. Individual cells
Shahzad Ali, UCL
23
vary in the ranges and types of forces that they respond to (Tee et al, 2009). For
example, the differentiation of stem cells into cardiac and vascular endothelial cells is
found to be particularly sensitive to shear due to blood flow (Stolberg & McCloskey,
2009). Some cells, such as those of central nervous system are also more vulnerable to
damage from mechanical forces than others. For this reason, the cells of the central
nervous system are relatively well protected from injury (Laplaca & Prado, 2009).
A study by Chowdhury et al. (2009) found that soft, embryonic stem cells are more
responsive (in terms of their spreading on surfaces) to local cyclic strain than harder,
more differentiated cell types. Cell stretching of heart cells has been found to activate
cell-signalling pathways that lead to release of Ca2+ ions (Prosser et al, 2011).
In this study, it is the mechanical properties of the underlying growth surface, which is
of greatest interest. In the in vivo environment, adherent cells attach to the
surrounding, or underlying extra-cellular matrix. The extra-cellular matrix is a three-
dimensional scaffold consisting of various structural proteins, such as fibronectin,
collagen, vitronectin and laminin. It has a variety of functions including anchoring cells,
providing cell support and sequestering growth factors to control their diffusion
(Discher et al., 2009). It also has a role in regulating the migration, growth and survival
of cells. For example, fibronectin binding plays a role in the migration and organization
of germ layer tissue during gastrulation (Ffrench-Constant et al, 1991).
Another very important characteristic of the extracellular matrix is its elasticity. The
elasticity of the extracellular matrix has been found to influence cell shape (Pelham &
Wang, 1997), protein expression (Collingsworth et al, 2002), gene expression
(Chowdhury et al, 2010), migration speed (Peyton & Putnam, 2005; Lo et al, 2000) and
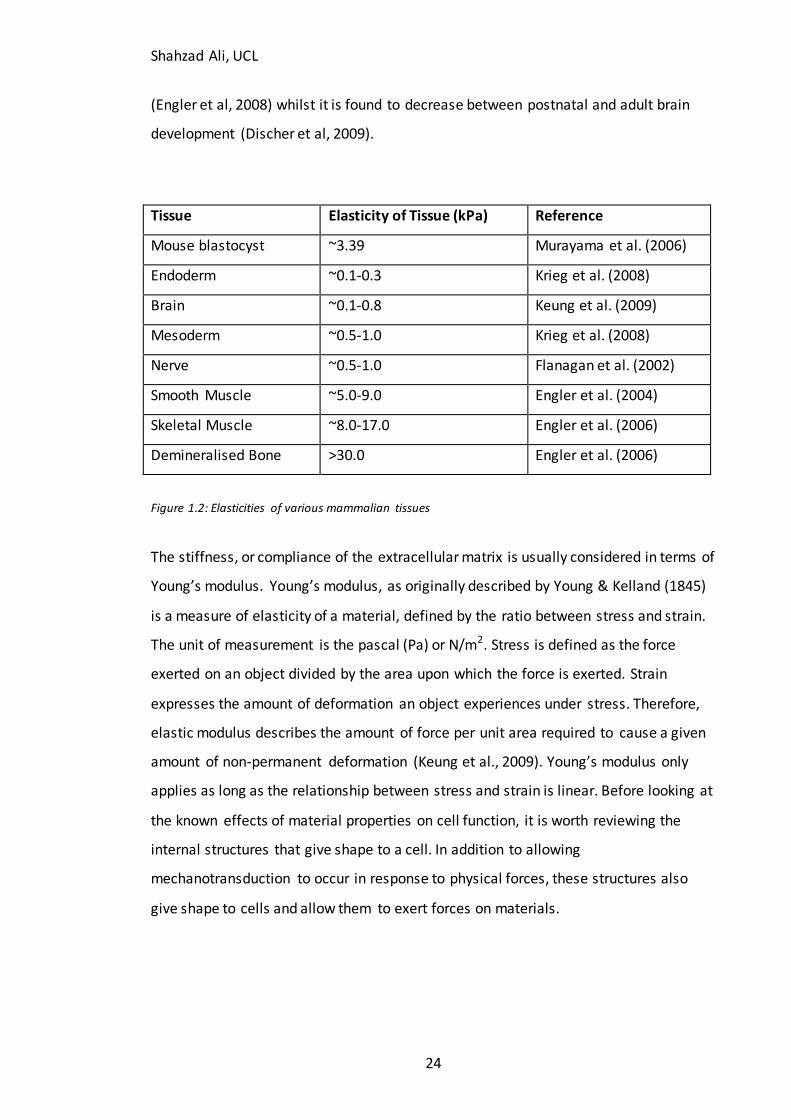
organization (Engler et al., 2008). Different tissues subsequently have different
elasticities (Figure 1.2).
Tissue stiffness varies during development (Murayama et al, 2006), ageing (Lee & Oh,
2010) and disease processes (Discher et al., 2009). For example, matrix stiffnes s is
found to increase during glial scarring (Georges et al, 2006) and myocardial infarction
Shahzad Ali, UCL
24
(Engler et al, 2008) whilst it is found to decrease between postnatal and adult brain
development (Discher et al, 2009).
Tissue Elasticity of Tissue (kPa) Reference
Mouse blastocyst ~3.39 Murayama et al. (2006)
Endoderm ~0.1-0.3 Krieg et al. (2008)
Brain ~0.1-0.8 Keung et al. (2009)
Mesoderm ~0.5-1.0 Krieg et al. (2008)
Nerve ~0.5-1.0 Flanagan et al. (2002)
Smooth Muscle ~5.0-9.0 Engler et al. (2004)
Skeletal Muscle ~8.0-17.0 Engler et al. (2006)
Demineralised Bone >30.0 Engler et al. (2006)
Figure 1.2: Elasticities of various mammalian tissues
The stiffness, or compliance of the extracellular matrix is usually considered in terms of
Young’s modulus. Young’s modulus, as originally described by Young & Kelland (1845)
is a measure of elasticity of a material, defined by the ratio between stress and strain.
The unit of measurement is the pascal (Pa) or N/m2. Stress is defined as the force
exerted on an object divided by the area upon which the force is exerted. Strain
expresses the amount of deformation an object experiences under stress. Therefore,
elastic modulus describes the amount of force per unit area required to cause a given
amount of non-permanent deformation (Keung et al., 2009). Young’s modulus only
applies as long as the relationship between stress and strain is linear. Before looking at
the known effects of material properties on cell function, it is worth reviewing the
internal structures that give shape to a cell. In addition to allowing
mechanotransduction to occur in response to physical forces, these structures also
give shape to cells and allow them to exert forces on materials.
Shahzad Ali, UCL
25
1.3.1 Known Mechanotransduction Mechanisms and Associated Components
The complete mechanism for the sensing of stiffness by a cell is unknown. What is
known is that various cell structures combine in order to detect forces or signals from
the ECM and produce an appropriate response. (Tee et al., 2009). The known
mechanisms and components involved are outlined below.
1.3.1.1 Integrins and Focal Adhesions
Integrins are multifunctional, integral cell surface proteins, which have generated
much interest in mechanotransduction research as they play a central role within the
mechanisms studied to date (Baker & Zaman, 2009). Integrins connect the
extracellular matrix to the cytoskeleton. The intracellular domain of integrins attach to
the cytoskeleton at specific sites. These specific attachment sites are known as focal
adhesions and consist of a complex of various proteins including vinculin, paxillin, talin
and -actinin. The spatial distribution of focal adhesions is one of the most influential
factors on the magnitude and efficiency of force transduction (Baker & Zaman, 2009).
Integrins tend to contain more developed focal adhesions on surfaces with higher
Young’s moduli (Jacot et al., 2009).
The extracellular head of the integrin binds to extracellular matrix components, such
as fibronectin, vitronectin, laminin and collagen at specific sequences known as RGD
(arginine-glycine-aspartate) motifs (Baker & Zaman, 2009). Different types of integrins
are involved in interactions with different extracellular matrix proteins. For example,
integrin interact with fibronectin, integrins vinteracts with vitronectin and
integrin interacts with laminin. Various human embryonic stem cell lines express
high levels of vand integrin sub-units. The integrins expressed by
mesenchymal stem cells may become upregulated or downregulated during
differentiation (Tan et al., 2012).
In a study by Katsumi et al. (2005) it was found that the mechanical stretching of
NIH3T3 fibroblasts induced conformational activation of v integrin in these cells.
Shahzad Ali, UCL
26
Binding of integrins to the ECM was found to mediate the activation of c-Jun NH2-
terminal kinase (JNK). Therefore, in addition to mechanically linking the actin
cytoskeleton to the extracellular matrix and acting as an intracellular source of force
transduction, integrins appear to also be able to convert mechanical signals such as
stretch into chemical signalling pathways.
1.3.1.2 Actin Cytoskeleton
The actin cytoskeleton is a network of stress fibres, which extend throughout the cell.
The stress fibres consist of polymerised F-actin. The cytoskeleton mechanically couples
the ECM (through integrins and focal adhesions) to the transcriptional machinery of
the nucleus, where it can influence the expression of certain genes. It acts as a conduit
for force transduction throughout the cell. Despite a continuous remodelling process
that occurs, it maintains an overall stable shape. This allows cells to resist forces
exerted by the ECM. (Wang et al, 2009).
The overall isometric tension throughout the cytoskeleton is known as its prestress
and is the primary means of maintaining cellular integrity. Furthermore, it is this
prestress which allows for long range force transduction within the cell and allows for
mechanical signals applied at the cell surface to be conveyed to the nucleus, where
further mechanochemical reactions occur. As well as maintaining an overall prestress
the cytoskeleton can be contracted in order to pull against the fibres of the
extracellular matrix when sensing the mechanical microenvironment. This is the
process, which regulates growth cone motility in neurons (Franze & Guck, 2010). Actin
tensile strength varies between cells. These variations play a vital role in germ layer
organisation during gastrulation (Krieg et al, 2008). In embryonic cells, myosin IIb and
F-actin concentrate at the cell periphery (Skoglund et al, 2008), a phenomenon that is
conserved in embryonic stem cells (Hemsley et al, 2011).
Shahzad Ali, UCL
27
1.3.1.3 Non Muscle Myosin II
Nonmuscle myosin II (NMMII) is an isoform of the myosin protein responsible for
contracting the actin cytoskeleton. Myosin contains six sub-units (two heavy chains
and four light chains). Myosin proteins are able to slide against the actin filament
before returning to their original positions. This process is known as the power stroke
and is responsible for actin contractions (Nelson & Cox, 2005).
There are conflicting views on how myosin becomes activated. The widely held belief
(Itoh et al., 1989) is that myosin becomes activated by phosphorylation of its light
chain at MLC20 by the myosin light chain kinase (MLCK) enzyme. However, some
studies (Gao et al., 2001; Nakamura et al., 2008) claim that this mechanism is not
necessary and that contraction can occur without the phosphorylation of the myosin
light chain. Studies on the effect of myosin on cell mechanobiology often inhibit NMM
II using a molecule known as blebbistatin (Engler et al., 2006). Calcium ions, in addition
to influencing the cellular response to stiffness through myosin activation, also have an
influence on cellular response to stiffness through the RhoA/ROCK signalling pathway.
Calcium signalling decreases with decreasing stiffness (Keung et al., 2009).
1.3.1.4 Rho/ROCK and ERK Regulation
Rho proteins are known to influence cytoskeletal tension by regulating myosin activity
(Paszek et al., 2005). ERK is a protein that forms part of the MAPK/ERK regulatory
pathway. This pathway is involved in the transcription of a number of genes, including
genes involved pluripotency. Rho and ERK form a part of a signalling circuit that
regulates the tensional homeostasis of the cell.
On stiffer substrates, integrin clustering causes ERK to become activated, depending
on growth factor concentrations. ERK activation increases Rho-dependent myosin
activity, thereby generating tension within the actin cytoskeleton.
Shahzad Ali, UCL
28
1.3.1.5 Microtubules
Microtubules are a further structural component of the cytoskeleton. Unlike F-actin
however, they do not have a dominant role in mechanotransduction. Instead they play
an important role in maintaining cell internal organisation, shape and structure, as
they are physically highly robust. They are constantly depolymerised and polymerised
from and tubulin subunits, according to the structural requirements of the cells
(Desai & Mitchison, 1997). In neurites, they form long, parallel bundles that allow for
structural stability. Their stability in neurites is dependent on microtubule-associated
proteins, such as MAP2 (Franze & Guck, 2010). In addition to their structural role, they
have also been implicated in neurite extension (Georges et al, 2006).
1.3.1.6 Intermediate Filaments
Intermediate filaments are the third form of cytoskeletal fibre. Unlike actin stress
fibres and microtubules, they do are not involved in mechanotranduction or motility.
Their main purpose is to provide stability and resist deformations in cells (Lodish et al,
2000). Although they do not play as key a role in cell function, they can be highly
abundant in cells. Within neurons in particular, they are by far the most abundant
fibres found in neurites (Tyler et al, 2012). Subtypes of neural intermediate filaments
are numerous, and include nestin, neurofilaments (NF’s) and glial fibrillary acidic
protein (GFAP).
1.3.1.6 Ezrin/Radixin/Moesin (ERM)
The Ezrin/Radixin/Moesin complex of proteins, more commonly known as ERM
proteins regulates the interaction between the actin cytoskeleton and the plasma
membrane by acting as a cross-linker between the two structures (Tsukita et al., 1997).
ERM proteins become activated through phosphorylation of a threonine residue
present in C-terminus domain (Parisiadou et al., 2009), to form pERM.
Shahzad Ali, UCL
29
ERM proteins have also been implicated in the initial formation of integrin-based
adherens junctions. They are however not involved in the maintenance of these
junctions (Tsukita et al., 1997). Furthermore, modulation of ERM activity by leucine-
rich repeat protein kinase 2 (LRRK2) was found to have had an effect upon neuronal
development, in terms of neurite outgrowth and neuronal process maintenance
(Parisiadou et al., 2009).
1.3.1.7 Cytoskeletal-Nuclear Interaction
The stiffness of the cell’s nucleus varies depending on cell type and the presence of
external forces. For example, nuclear stiffness increases in endothelial cells upon
exposure to shear forces such as fluid flow. Conversely, nuclear stiffness is found to be
lower in stem cells. The stiffness of the nucleus has an effect on various physical
properties of the cell, such as structure and mechanical response to forces but can also
have an effect in terms of gene expression in response to force (Dahl et al., 2009).
The nucleus is connected to and influenced by the extracellular mechanical
microenvironment via the actin cytoskeleton. The actin cytoskeleton connects with the
nucleoskeleton through a structure known as the LINC (linker to nucleoskeleton and
cytoskeleton) complex. The LINC complex consists of various proteins including
nesprins, SUN proteins and lamins (Wang et al., 2009). Similarly to the cytoskeleton,
the nucleus also contains actin and myosin, in the form of a nucleoskeleton. This
nucleoskeleton, like the cytoskeleton, has a defined prestress and thus allows for
mechanotransduction within the nucleus.
The LINC complex of proteins and nuclear scaffolds can be arranged to focus forces
from the actin cytoskeleton to specific DNA regulatory enzymes. In addition to this,
different cells may have differential tethering between nuclear scaffold and genes. This
may mean different responses to the same external stimuli. Stress and strain
experienced by the nuclear scaffold may also lead to changes in chromatin
organization, leading to changes in the accessibility of certain genes to certain
Shahzad Ali, UCL
30
transcription factors (Wang et al., 2009). Mechanical forces appl ied at the cell surface
can therefore influence gene expression within the nucleus.
1.4 Effect of surface material properties on cells
The structural and chemical properties of materials exert a number of key influences
on cell function. The response to these properties varies greatly between cell and
tissue types, as different cells will vary greatly in their internal structure. In the next
section, examples of different cell responses to changes in material properties are
outlined.
1.4.1 Effect of surface material properties on fibroblasts
In the earliest work involving substrate stiffness and cells, Pelham & Wang (1997)
developed a mechanically tuneable growth substrate consisting of polyacrylamide (PA)
cross-linked with varying concentrations of bis-acrylamide and functionalised with
collagen-I. This substrate was used to investigate the effect of substrate stiffness upon
morphology, motility and focal adhesion formation in 3T3 fibroblasts.
In that study it was found that on softer substrates, fibroblasts became more spindle-
shaped and lost stress fibres, compared to stiffer substrates, where appeared well
spread. Focal adhesions appeared to be more stable on stiffer substrates, where
regular, wedge-shaped complexes formed compared to softer substrates, where
complexes appeared to be irregular.
Yeung et al. (2005) investigated the effect of varying substrate stiffness upon
morphology, adhesion, F-actin and integrin expression in 3T3 mouse fibroblasts,
In this study, it was found that fibroblasts appeared to become larger and more spread
on stiffer substrates compared to the softest substrates, consistent with the findings of
Pelham & Wang (1997). In terms of cytoskeleton, F-actin and integrin expression
Shahzad Ali, UCL
31
increased with substrate stiffness. Actin stress fibres disappeared below stiffnesses of
3.5 kPa.
Other effects have been reported in fibroblasts in response to changes in material
properties. For example, fibroblast nuclei have been observed to flatten on stiff
materials (400 kPa), compared to softer (400 Pa) materials where they appear round
(Lovett et al, 2013). Furthermore, they have been observed to polarise on rigid
materials, but not on soft materials (Khoutorsky et al, 2011). This process is dependent
upon focal adhesion organisation and structure, which is regulated by the Shp2 protein
(Lee et al, 2012) in this case.
1.4.2 Effect of surface material properties upon mesenchymal stem cells
Work by Engler et al. (2006) showed that induced differentiation of mesenchymal stem
cells (MSC’s) into neuronal, myogenic and osteogenic lineages was strongly influenced
by matrix stiffness. RNA profiling showed a 5-fold increase in neuronal gene expression
on soft gels (0.1-1.0 kPa), a 6-fold increase in myogenic gene expression on gels with
stiffness near that of striated muscle (11 kPa) and a 4-fold increase in osteogenic gene
expression on the stiffest of the gels (34 kPa). The 5-fold increase in neurogenic
transcripts was taken as an average increase across a variety of neuronal cytoskeletal
mRNA transcripts including nestin (expressed during early ‘‘commitment’’), III
tubulin (expressed in immature neurons), NFL (a mature neurofilament marker) and
NCAM (an early/mid neural adhesion protein). MSC’s also became more branched on
softer materials.
The work furthermore suggested that the differentiation response to matrix stiffness is
dependent upon non-muscle myosin II (NMM II). This was investigated using
blebbistatin, an inhibitor of all isoforms of NMM II. Blebbistatin acts by inhibiting the
activation of NMM II by actin without having an effect on myosin light chain kinase
(MLCK). There was less cytoskeletal organisation on softer gels than on stiffer gels.
Cytoskeleton organization increased with matrix stiffness.
Shahzad Ali, UCL
32
This study clearly highlighted the effect of matrix elasticity upon differentiation into
multiple lineages. There have been other studies, which have looked at the effect of
matrix elasticity on specific MSC differentiation pathways. Soft materials (1-5 kPa)
have been observed to increase chondrogenesis in MSC’s (Bian et al, 2012), even in the
absence of induction factors. Osteogenic expression has also been observed to
increase as Young’s modulus decreases (Hu et al, 2011), however for a range that is
substantially higher than other studies (5 MPa-25 MPa). This reflects the higher
Young’s modulus of mineralised bone compared to other tissue. In induced neural
differentiation medium, soft (1 kPa) materials favoured neuronal differentiation, whilst
stiffer (10 kPa) materials favoured glial differentiation (Her et al, 2012).
In terms of other effects of Young’s modulus on MSC behaviour, increasing Young’s
modulus from 200 Pa to 2 kPa has been observed to decrease spreading, migration
and proliferation rate in normal culture conditions (Lei et al, 2010). In terms of non-
stiffness effects, topography appeared to have an interesting effect on cell phenotype.
Multipotency was retained in induced differentiation medium when MSC’s were
cultured in lattice-orientated nanopits (McMurray et al, 2011).
1.4.3 The effect of surface material properties upon cardiomyocytes
Another study by Engler et al. (2008) showed that embryonic cardiomyocytes contract
best upon collagen I-coated polyacrylamide (PA) gels with stiffness close to that of
striated muscle (approx. 10 kPa). Furthermore that study found that if matrix stiffness
was close to that of a fibrotic scar (where E = 35-70 kPa), such as that found within a
diseased, post-infarct heart, contractile capacity became limited.
The work carried out by Engler et al. (2008) suggests that in addition to efficiently
differentiating stem cells towards certain lineages, the elasticity of the substrate may
also have an effect on their in vivo function and efficacy (in this case the beating of
cardiomyocytes). This may have important implication when administering cells into
diseased areas, where the normal mechanical microenvironment may be severely
Shahzad Ali, UCL
33
disrupted, undermining the in vivo efficacy of the transplanted cells. It may also have a
bearing on the choice of material used for tissue engineering scaffolds.
Another study (Chopra et al, 2012) found that when cardiomyocytes were cultured on
hyaluronic (HA) gels coated with fibronectin, gelatin or fibrinogen (as opposed to
collagen-I), cells were able to assemble actin into organised networks on soft
materials, contrasting with the findings with PA gels by Engler et al (2008). Thus,s
urface chemistry and choice of material clearly influences the effects on cells.
1.4.4 Effect of surface material properties upon myoblasts
The fusion of myoblasts into myotubes is the first step in skeletal muscle
differentiation. A study conducted on PA gels by Engler et al. (2004b), there appeared
to be an optimal range of substrate elasticity for striation of actin and myosin in
myotubes (a physiological characteristic of skeletal muscle tissue).
The optimal range of substrate elasticities for skeletal muscle differentiation is narrow.
This has an implication when cells are introduced into diseased areas (for example
during infarctions or muscular dystrophy). Here, substrate stiffness may be
significantly increased. Within this environment, cells may not fully differentiate into
skeletal muscle and may differentiate into connective tissue instead.
The increase in cross-linking required for gel stiffening may have other effects on gels
(depending on the choice of material). These include reduction in access to binding
sites and changes in other mechanical properties of the material. These effects have
been found to have a negative effect upon spreading and growth of myoblasts (Grover
et al, 2012).
Another study found that as myoblasts differentiated in 3D fibrin gels (as opposed to
2D PA gels), they remodelled the surrounding gel (Chiron et al, 2012), increasing its
thickness. Furthermore, micropatterning of soft gels also has an effect upon myoblast
Shahzad Ali, UCL
34
differentiation (Zatti et al, 2012). Myoblasts cultured in wider channels fuse more
readily (but proliferate less rapidly) than cells in narrower channels.
In a separate study using myoblasts, Engler et al. (2004a) found that substrate
stiffness, and subsequently cytoskeletal organization had a dominant effect on
spreading over ligand density.
1.4.5 Effects of surface material properties upon endothelial cells
Deroanne et al. (2001) discovered that when human umbelical vein endothelial cells
(HUVEC) were cultured on softer substrates, morphology shifted from a monolayer
pattern to that of tube-like structures characteristic of cells undergoing tubulogenesis.
Decreasing the stiffness of the substrate also caused a reduction in actin and vinculin
(a focal adhesion protein) expression. Soft substrates have subsequently been
implicated in the remodelling of other focal adhesion proteins in Endothelial cells (Wei
et al, 2008). Thus remodelling of the cytoskeleton and focal adhesions appeared to be
a crucial prerequisite for angiogenesis. In addition to being implicated in
tubulogenesis, focal adhesions also enable endothelial cells to mechanically sense
blood flow, via ‘‘rafts’’ of lipids that are able to mobilise along the cell membrane
surface (Fuentes & Butler, 2012).
In addition to modulus, biomaterials may influence endothelial cell differentiation and
growth in other ways. As mentioned earlier, the ECM is able to sequester growth
factors and release them as required by cells during development. Based upon this,
Aguirre et al (2012) developed a ‘‘smart biomaterial’’ that was able to release VEGF
and VEGFR as required by endothelial cells during angiogenesis.
1.4.7 Effect of surface material properties on bone
Bone tissue undergoes a constant process of remodelling, whereby bone is formed by
osteoblasts and resorbed by osteoclasts (Bakker & Nullend, 2010). The balance
between these two populations of cells is controlled by osteocytes. Osteocytes are
Shahzad Ali, UCL
35
highly mechanosensitive to dynamic loading and compression of the growth material.
In addition to being influenced by the matrix, they also have the ability to influence the
Young’s modulus of the growth material, a process that is dependent on Lrp5 and Wnt
signalling (Zhao et al, 2013).
The adhesion of osteoblasts is influenced by nanotopography, in the form of
engineered grooves and pits (Nikkah et al, 2012), as well as surface chemistry
(Anselme & Bigerelle, 2012). Based upon these findings, a bioreactor was developed by
Van Dyke et al (2012), which was able to simulate the fluid flow and mechanical
loading of the growth material for bone cell growth. This is an interesting example of
how the mechanical influence of the growth material can be designed into larger scale
cell expansion processes.
1.4.8 Effect of surface material properties upon the malignant phenotype
The modulation of the tensional homeostasis within the cell during tumour formation
was investigated in work conducted by Paszek et al. (2005). Unlike normal, non-
malignant cells, malignant cells are able to stiffen on soft materials. This process is
dependent on elevation in ERK and Rho signalling. Myosin IIb was able to contract the
cytoskeleton independent of external ECM tension.
1.4.9 Effect of surface material properties on neural development and growth
In both the human and rat adult brain, Young’s modulus has been found to vary
substantially, from 0.1 kPa to 16 kPa (Tyler et al, 2012). However, the majority of the
neuronal tissues isolated within the laboratory, including spinal cord and grey matter
have very soft Young’s moduli, usually within the 500 Pa-2 kPa modulus range
(Flanagan et al, 2002; Christ et al, 2010). This is considerably less than the values (see
Figure 1.2) for muscle (approximately 17 kPa) and bone (30 kPa and upwards).
Differences exist between neural stells too. Despite being implicated in fibrosis in the
diseased state, glial cells actually have lower Young’s modulus than neurons (Lu et al,
2006). There are also differences within the cells themselves . Neurites (axons and
Shahzad Ali, UCL
36
dendrites) have lower moduli (Jiang et al, 2011) than the cell body of the neuron (the
soma). The majority of studies on the effects of stiffness upon neuronal growth
therefore focused on softer gels, within the ranges outlined above.
1.4.9.1 Effect of surface material properties on neural stem cells and neural
precursor cells
The terms neural stem cell and neural precursor (or progenitor) are used fairly
interchangeably within the literature. Broadly speaking, they describe populations of
proliferating cells, which are able to differentiate into immature neuronal or glial cells.
Neural stem cells tend to describe populations that exist in the adult brain, which
replace damaged or dying tissue, whilst the term precursor describes a cell within the
early development stages, such as embryogenesis.
In two studies involving neural stem cells (Saha et al, 2008; Banerjee et al, 2009)
isolated from the adult rat hippocampus, proliferation in expansion medium peaked at
lower moduli (between 1-4 kPa). When cells were allowed to differentiate into
immature neurons (positive for -III tubulin) in neuronal differentiation medium,
expression was maximised on soft materials (200 Pa in the Banerjee study, 500 Pa to 1
kPa in the Saha study). In mixed glial/neuronal medium, the percentage of cells
existing as astrocytes increased from 10 kPa onwards in the Saha study (2008). Thus
neural stem cells tended to prefer soft materials for both neuronal differentiation and
proliferation.
A study conducted by Liepzig & Schoichet (2009) showed that proliferation of NSPCs or
neural stem/progenitor cells was maximized on a substrate stiffness of 3.5 kPa, whilst
neuronal differentiation and migration was maximized on a substrate with stiffness
less than 1 kPa.
When neural precursors isolated form spinal cord cultures were plated on various
Young’s moduli (300 Pa, 6 kPa, 27 kPa and 47 kPa) by Previtera et al (2013), early
differentiation into mature MAP2-positive neurons was maximised on 6 kPa and 27
Shahzad Ali, UCL
37
kPa gels whilst late differentiation was maximised on 6 kPa gels. The lack of consensus
on precise Young’s moduli effects across different stages neuronal differentiation
process (for neural stem cells, neuronal progenitors or primary neurons) has been
directly addressed within this study.
Other aspects of surface structure and chemistry have also been shown to impact
precursor cells. For example, the presence of laminin on the growth surface has been
observed to enhance the migration, expansion and differentiation of neural
stem/precursor cells (Flanagan et al, 2006). Nanotopographic cues, in the form of
PDMS nanopillars have been shown to increase the ‘‘yield’’ of early neurons from ES
cell-derived neuronal precursors, when compared to flat PDMS surfaces (Migliorini et
al, 2011). Ma et al (2004) created a three-dimensional collagen-based polymer scaffold
for cell growth, in which neural stem/precursor cells were able to form functional
synapses and neural networks. If a similar scaffold could be created with the
appropriate mechanical properties, it could be a means of efficiently creating
biomaterials for tissue engineering purposes for expanding and differentiating neural
precursors.
1.4.9.2 The effect of surface material properties on primary neuronal cultures
The next group of studies used primary immature or mature, terminally differentiated
neuronal cell cultures. These cells were usually defined as III tubulin-positive and
would usually mature into MAP2-positive functional neurons.
In a study conducted by Flanagan et al. (2002), it was found that primary embryonic
spinal cord neurons exhibit more neurite (dendritic and axonal) branching on softer
rather than stiffer substrates. The range of stiffnesses that neurons responded to was
much narrower than that of fibroblasts.
A study conducted by Georges et al (2006) found that in mixed cortical cultures,
neurons grow independently of astrocytes on softer substrates whilst they appear to
only grow over glial cells on stiffer substrates, due to the soft nature of glial cells . This
Shahzad Ali, UCL
38
may have an impact on cell transplantation into injured areas of the spinal cord, where
a lesion area is likely to be surrounded by a stiff, fibrotic scar.
Jiang et al (2007) looked at the effect of substrate elasticity upon adhesion of primary
cultures of embryonic rat spinal cord. When neurons were separated from the mixed
population, adhesion increased with stiffness. Previtera et al (2010) cultured mixed
hippocampal cultures on a variety of materials. Here, the cell concentration (cells/cm2)
of neuronal cells at 24h and 48h increased as Young’s modulus was increased from 500
Pa to 2 kPa. Concentrations then appeared to remain constant as moduli increased to
18 kPa.
Another property of the ECM that will likely affect neuronal cell growth is surface
chemistry. Lam et al (2011) found that when the growth factors bFGF and EGF were
immobilised onto nanofibers, axonal growth improved in human ES-derived neural
cells. Using these findings, Kunze et al (2011) devised a micropatterned, microfluidic
device containing a three-dimensional layered hydrogel able to culture cortical neuron
cultures. Microfluidic devices allow for testing on cells using much smaller volumes of
reagents, and thus significantly reducing consumable costs. The mechanical properties
of microfluidic devices could be further optimised (through coating with gels) to
improve their differentiation.
1.4.9.3 Effect of surface material properties on glial cells
In the Jiang et al (2007) study mentioned earlier, glial cells were also isolated from the
mixed embryonic spinal cord culture and seeded onto variable gel moduli. In this case,
cell concentration of GFAP-positive mature astrocytes increased on stiff (>100 kPa)
materials. Similarly, Moshayedi et al (2010) found that astrocytes formed complex
morphologies and spread more on stiffer materials (10 kPa), compared to softer
materials (100 Pa), where they tended to became rounded. When oligodendrocyte
progenitor cells were cultured on varying Young’s moduli, survival, proliferation and
maturity into mature oligodendrocytes was maximised at 1 kPa gels (Jagielska et al,
2012). As with neuronal cells, glial cells also respond to other mechanical properties of
the biomaterials other than elasticity. Minev et al (2013), for example showed that glia
Shahzad Ali, UCL
39
proliferate less and become unable to form stress fibers when cultured on tall, 5 m
micropillars, compared to flat substrates.
1.4.9.4 Effect of extracellular matrix stiffness upon neuroblastoma differentiation
Lam et al (2010) conducted a study to investigate the relationship between the
stiffness of the extracellular matrix and differentiation of neuroblastomas (both
spontaneously and in the presence of retinoic acid). It was found that an increase in
stiffness caused an increase in average neurite length. Increased neurite length is an
indicator for differentiation of neuroblastomas.
1.4.10 Effect of surface material properties on pluripotent stem cells
In terms of their physiological niche, cells of the day-eight blastocyst have a Young’s
modulus of approximately 3.4 kPa (Murayama et al, 2006), similar to that of neuronal
tissue. When Pillarisetti et al (2011) carried out measurements of live mESC’s, cell
Young’s modulus was found to be 265 Pa. It would therefore be expected that the
majority of work with ES cells would involve softer materials.
Chowdhury et al (2010) carried out an experiment looking at the effect of soft
materials on mouse embryonic stem cell self-renewal. It was found that self-renewal
could be maintained for five days on soft materials in the absence of LIF. However, the
effects of biomaterial mechanical properties on pluripotent stem cell differentiation
are relatively poorly characterised. In the current study, mESC neuronal differentiation
has been characterised in far greater detail on a stage-by-stage basis.
An earlier study by Evans et al (2009) looked at the effect of PDMS Young’s modulus on
the early differentiation of mESC into bone. The range of Young’s modulus (40 kPa to
2.3 MPa) was higher than the physiological range given above. Cell attachment,
measured as the number of cells attached after 24 hours of culture was unaffected by
Young’s modulus in normal culture medium. Proliferation on the other hand, increased
with Young’s modulus. When cells were induced to differentiate, osteogenic marker
Shahzad Ali, UCL
40
expression and bone mineralisation increased with Young’s modulus. The stiffest
material had a Young’s modulus closest to mineralised bone.
In another study (Eroshenko et al, 2013) using PDMS substrates, attachment of human
embryonic stem cells (hESC’s) at 12h in spontaneous (undirected) differentiation
medium did not vary with Young’s modulus. Again the modulus range used in that
investigation was 80 kPa to 1 MPa, similar to the Evans et al (2009) study. Jaramillo et
al (2012) found that early endoderm gene expression was increased on softer (30 Pa)
materials when compared to mesoderm, ectoderm and pluripotent gene expression.
Two recent studies have attempted to look at the effect of substrate stiffness on
neuronal differentiation. Keung et al (2012) found that softer polyacrylamide materials
increased the number of cells positive for -III tubulin, Pax6 and Sox1 following early
hESC and iPSC neuronal differentiation. Soft materials also increased the percentage of
cells positive for TH during later neuronal differentiation. The moduli used in that
study covered a broad range (100 Pa, 700 Pa, 75 kPa and TCP). Kothapalli et al (2013)
carried out a similar study with mESC-derived EB’s in three-dimensional culture. Both
neurite length and percentage of cells differentiating towards the neuronal lineage
increased with Young’s modulus from 20 Pa to 1 kPa. The percentage of cells
differentiating into astrocytes showed the opposite trend. Taken together, this
suggests that materials with modulus in the range of 100 Pa to 1 kPa favour neuronal
differentiation over softer or stiffer materials.
In a study that did not involve material stiffness, Ma et al (2008) showed that hESC-
derived EB’s undergoing neuronal differentiation generate more neural progenitors
and greater neurite outgrowth on laminin-coated biomaterials, compared to
fibronectin, collagen I and poly-d-lysine. Interestingly, laminin is the earliest ECM
protein to appear in blastocysts, appearing as early as day eight (Ingber, 2006). Clearly,
other material properties also affect ES cell differentiation.
Furthermore, Lakins et al (2012) found that, unlike with fibroblasts and mesenchymal
stem cells, hESC’s tended to have more organised F-actin structures on soft materials
Shahzad Ali, UCL
41
(400 Pa) compared to stiffer material (60 kPa). Poh et al (2010) showed that ES cells
did not stiffen on rigid materials. Thus, ES cells are mechanically different to the
majority of adult cells.
1.4.11 Materials Used in Studies
The majority of studies were conducted using mechanically tuneable polyacrylamide
gels, functionalised for attachment with collagen I. This material was originally
described in the Pelham & Wang (1997) study. The synthesis procedure involves a
number of steps involving a variety of chemicals (Figure 1.4). Modulus was modified in
these gels by changing the concentration of bis-acrylamide in acrylamide.
In the Saha et al. (2008) study, a mechanically tuneable substrate named vmIPN was
developed to investigate the optimal elasticity for the proliferation and differentiation
of adult neural stem cells (aNSC). The material consisted of layers of various polymers
including polyacrylamide, bisacrylamide and polyethylene glycol (PEG). Elasticity was
varied by changing the polyacrylamide and bisacrylamide concentrations. The
substrate was functionalised with an RGD peptide.
1.4.12 GXG
GXG was the material used within this study. GXG is a substrate consisting of gelatin (in
phosphate buffer saline, PBS or deionised water) cross-linked with glutaraldehyde in
order to form a mechanically tuneable growth surface for mouse embryonic stem cells.
Changing the concentration of gelatin in PBS or water varies the Young’s modulus. The
Young’s modulus can be varied from 2 kPa (where the concentration of GXG is 3% in
PBS) to 35 kPa (where the concentration of GXG is 6% within water). The lowest value
within the range is relatively high compared to the substrate created by Saha et al.
(2008) whilst the highest value in the range are approximately equal to that achieved
using polyacrylamide substrate in the Engler et al. studies (2006 & 2008).
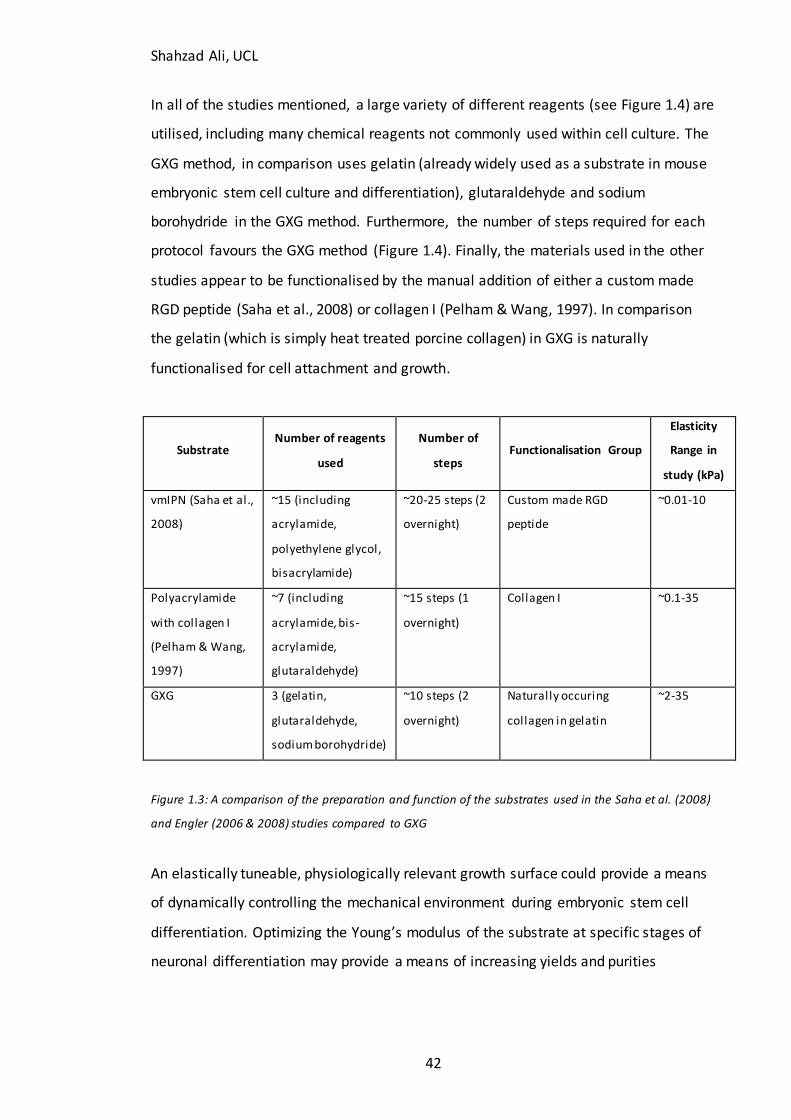
Shahzad Ali, UCL
42
In all of the studies mentioned, a large variety of different reagents (see Figure 1.4) are
utilised, including many chemical reagents not commonly used within cell culture. The
GXG method, in comparison uses gelatin (already widely used as a substrate in mouse
embryonic stem cell culture and differentiation), glutaraldehyde and sodium
borohydride in the GXG method. Furthermore, the number of steps required for each
protocol favours the GXG method (Figure 1.4). Finally, the materials used in the other
studies appear to be functionalised by the manual addition of either a custom made
RGD peptide (Saha et al., 2008) or collagen I (Pelham & Wang, 1997). In comparison
the gelatin (which is simply heat treated porcine collagen) in GXG is naturally
functionalised for cell attachment and growth.
Substrate Number of reagents
used
Number of
steps Functionalisation Group
Elasticity
Range in
study (kPa)
vmIPN (Saha et al.,
2008)
~15 (including
acrylamide,
polyethylene glycol,
bisacrylamide)
~20-25 steps (2
overnight)
Custom made RGD
peptide
~0.01-10
Polyacrylamide
with collagen I
(Pelham & Wang,
1997)
~7 (including
acrylamide, bis-
acrylamide,
glutaraldehyde)
~15 steps (1
overnight)
Collagen I ~0.1-35
GXG 3 (gelatin,
glutaraldehyde,
sodium borohydride)
~10 steps (2
overnight)
Naturally occuring
collagen in gelatin
~2-35
Figure 1.3: A comparison of the preparation and function of the substrates used in the Saha et al. (2008)
and Engler (2006 & 2008) studies compared to GXG
An elastically tuneable, physiologically relevant growth surface could provide a means
of dynamically controlling the mechanical environment during embryonic stem cell
differentiation. Optimizing the Young’s modulus of the substrate at specific stages of
neuronal differentiation may provide a means of increasing yields and purities
Shahzad Ali, UCL
43
associated with the process, which is currently a significant limiting step in the
development of stem cell bioprocessing (Mondragon et al., 2009).
1.5 Aims and Objectives of Investigation
The aim of this study is to investigate the effect of changes in Young’s modulus of GXG
on the monoculture neuronal differentiation of mouse embryonic stem cells. Other
investigations, such as the Kothapalli & Kamm (2013) study have tended to focus on
the entire differentiation process, starting from ES cells and ending with the formation
of neurons, without looking at the stages in between. The aim of this study was to
define the effect of Young’s modulus of differentiation, stage-by-stage in order to
assess whether the effects remain constant across the entire process or whether they
are dynamic and thus vary with maturity. Within this study, the mESC monoculture
neuronal differentiation (Ying et al, 2003) process was split into three stages.
The first stage involved the formation of neural precursors from mouse embryonic
stem cells. Neural precursor cells were defined as being nestin-positive (Lendahl et al,
1990; Engler et al, 2006; Ying et al, 2003; Migliorini et al, 2011; Previtera et al, 2013).
The second stage involved the formation of immature neurons from the neural
precursors. Immature neurons were defined as positive for -III tubulin (Sullivan &
Cleveland, 1986; Engler et al, 2006; Ying et al, 2003; Migliorini et al, 2011). The final
stage was the maturation of immature neurons into mature neurons, positive for
MAP2 (Bernhardt & Matus, 1984; Jiang et al, 2007; Previtera et al, 2013).
The first part of this study involved development of GXG and the neuronal
differentiation process. Protocols and conditions were optimised in the initial work.
This was followed by characterisation of the starting population, and the time frames
during which neuronal markers began to appear. The latter work allowed for selection
of time points during differentiation for harvesting of cells for seeding onto materials
for analysis. The next stage investigated modulus effects on two non-mESC cell lines, in
order to provide a basis for comparison with the ES work. The final part of the first
chapter involved seeding mESC’s in normal growth medium as well as spontaneous
Shahzad Ali, UCL
44
differentiation medium, in order to assess whether any effects were medium
dependent.
The next two chapters looked at the effects on cells of Young’s modulus over three
time frames of differentiation. There were three cell effects that we investigated. The
first was cell attachment at 24h (the time point used in the Evans et al, 2009 study).
The second was expansion of colonies to the 72h (post-seeding) time point. The third
effect was enrichment. This involved looking at presence of key markers and
expression of genes associated with both pluripotency and the neural lineages.
The second chapter looked at the impact of Young’s modulus on the differentiation of
mESC’s into neural precursors, in terms of the three effects listed above. Image
analysis, immunocytochemistry, flow cytometry and qPCR were used to investigate the
effects. This was then related to polymerisation of actin and tubulin using two small
molecule inhibitors.
The final chapter looked at the impact of Young’s modulus on the differentiation of
neural precursors into immature neurons, and finally immature neurons into mature
neurons. This was carried out by partially differentiating mESC’s on TCP to the relevant
stages of neuronal differentiation (four days for neural precursors or six days for
immature neurons) prior to seeding.
The central hypothesis behind the study was that physiologically soft materials favour
the formation of neurons from mouse embryonic stem cells in neuronal differentiation
medium.
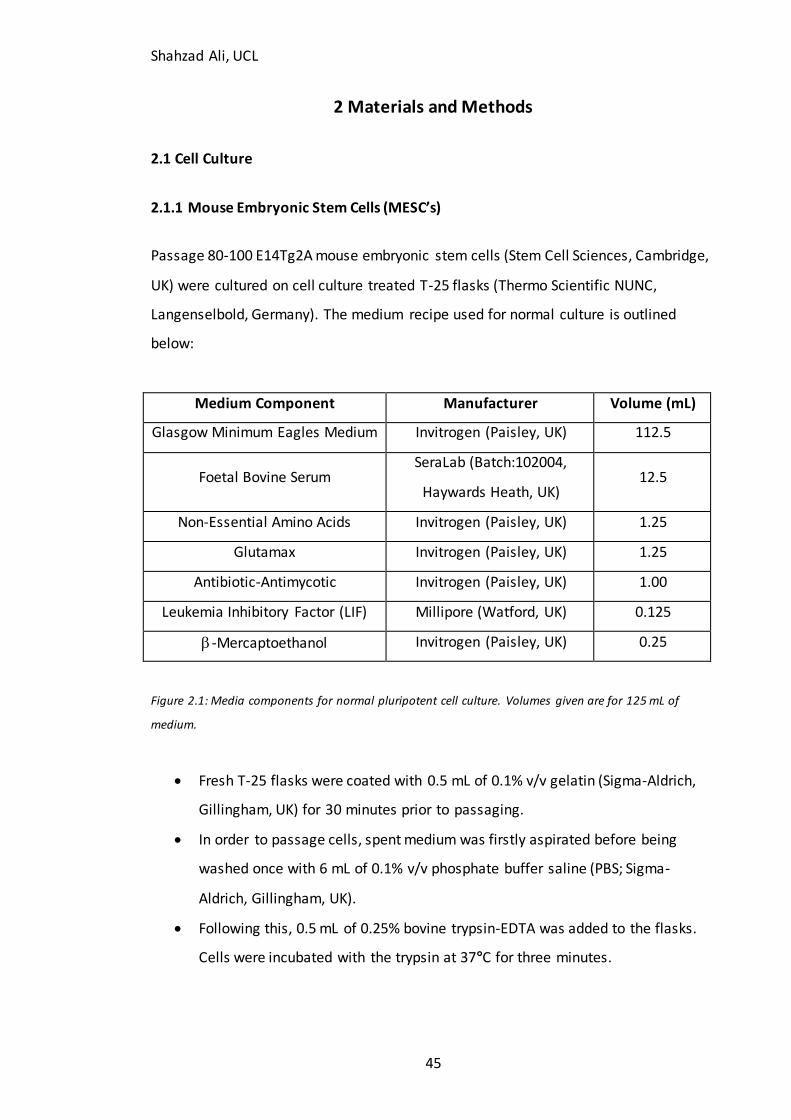
Shahzad Ali, UCL
45
2 Materials and Methods
2.1 Cell Culture
2.1.1 Mouse Embryonic Stem Cells (MESC’s)
Passage 80-100 E14Tg2A mouse embryonic stem cells (Stem Cell Sciences, Cambridge,
UK) were cultured on cell culture treated T-25 flasks (Thermo Scientific NUNC,
Langenselbold, Germany). The medium recipe used for normal culture is outlined
below:
Medium Component Manufacturer Volume (mL)
Glasgow Minimum Eagles Medium Invitrogen (Paisley, UK) 112.5
Foetal Bovine Serum SeraLab (Batch:102004,
Haywards Heath, UK) 12.5
Non-Essential Amino Acids Invitrogen (Paisley, UK) 1.25
Glutamax Invitrogen (Paisley, UK) 1.25
Antibiotic-Antimycotic Invitrogen (Paisley, UK) 1.00
Leukemia Inhibitory Factor (LIF) Millipore (Watford, UK) 0.125
-Mercaptoethanol Invitrogen (Paisley, UK) 0.25
Figure 2.1: Media components for normal pluripotent cell culture. Volumes given are for 125 mL of
medium.
Fresh T-25 flasks were coated with 0.5 mL of 0.1% v/v gelatin (Sigma-Aldrich,
Gillingham, UK) for 30 minutes prior to passaging.
In order to passage cells, spent medium was firstly aspirated before being
washed once with 6 mL of 0.1% v/v phosphate buffer saline (PBS; Sigma-
Aldrich, Gillingham, UK).
Following this, 0.5 mL of 0.25% bovine trypsin-EDTA was added to the flasks.
Cells were incubated with the trypsin at 37°C for three minutes.
Shahzad Ali, UCL
46
The trypsin was then quenched by dispensing 2.5 mL of normal culture medium
into the flasks. The quenched suspension was aspirated and dispensed 3-4
times in order to create a single cell suspension and eliminate aggregates.
The quenched cell suspension was then aspirated and dispensed into a 25 mL
centrifuge tube and centrifuged at 300 x g for three minutes.
Whilst the cell suspension was centrifuged, the gelatin was aspirated from the
fresh flasks.
Following centrifugation, the supernatant containing the trypsin and quench
medium was carefully removed from above the cell pellet. The cells were then
resuspended in normal culture medium (recipe above), whose volume
dependent on the passage split ratio (3 mL for 1:6 or 4 mL for 1:8). Cells were
split at a ratio between 1:6 and 1:8. 5 mL of normal culture medium was
dispensed into the flasks. 0.5 mL cell suspension was then carefully added to
each culture flask.
2.1.2 Mouse Embryonic Fibroblasts
Fibroblasts were passaged as above, using the same consumables, apart from the
media. The medium used for culturing fibroblasts was Dulbecco’s Medium Eagles
Medium (Invitrogen, Paisley, UK)), supplemented with 15% v/v fetal bovine serum
(SeraLab, Haywards Heath, UK), 1% v/v Glutamax (Invitrogen, Paisley, UK), 1% v/v non-
essential amino acids (Invitrogen, Paisley, UK). For GXG experiments, the seeding
density and rationale was identical to that for mESC’s, albeit in normal culture
medium.
2.1.3 Human EB Retinal Differentiation
Human embryoid bodies (EB’s) were derived from induced pluripotent stem cells
(iPSC’s), and were kindly provided by Vishal Sharma from the Department of
Biochemical Engineering at UCL. Briefly, undifferentiated iPSC’s were formed in
suspension over three days in 30 mm non-adherent culture dishes (Sterilin, Caerphilly,
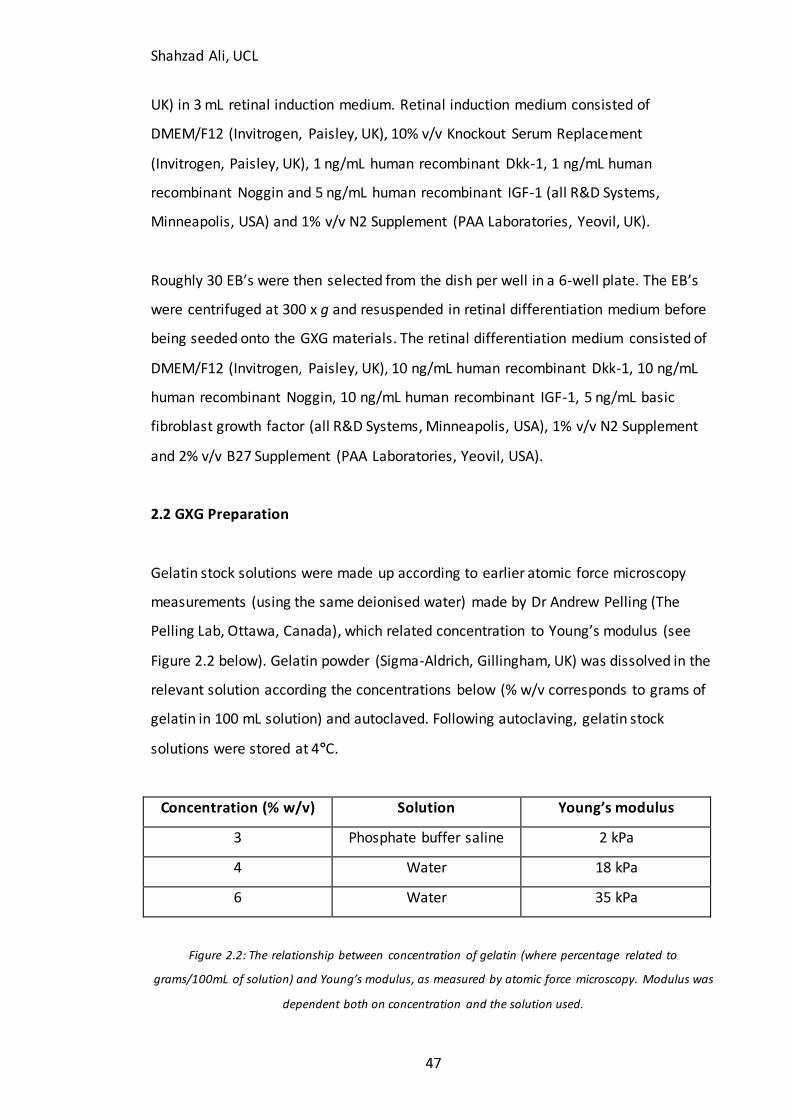
Shahzad Ali, UCL
47
UK) in 3 mL retinal induction medium. Retinal induction medium consisted of
DMEM/F12 (Invitrogen, Paisley, UK), 10% v/v Knockout Serum Replacement
(Invitrogen, Paisley, UK), 1 ng/mL human recombinant Dkk-1, 1 ng/mL human
recombinant Noggin and 5 ng/mL human recombinant IGF-1 (all R&D Systems,
Minneapolis, USA) and 1% v/v N2 Supplement (PAA Laboratories, Yeovil, UK).
Roughly 30 EB’s were then selected from the dish per well in a 6-well plate. The EB’s
were centrifuged at 300 x g and resuspended in retinal differentiation medium before
being seeded onto the GXG materials. The retinal differentiation medium consisted of
DMEM/F12 (Invitrogen, Paisley, UK), 10 ng/mL human recombinant Dkk-1, 10 ng/mL
human recombinant Noggin, 10 ng/mL human recombinant IGF-1, 5 ng/mL basic
fibroblast growth factor (all R&D Systems, Minneapolis, USA), 1% v/v N2 Supplement
and 2% v/v B27 Supplement (PAA Laboratories, Yeovil, USA).
2.2 GXG Preparation
Gelatin stock solutions were made up according to earlier atomic force microscopy
measurements (using the same deionised water) made by Dr Andrew Pelling (The
Pelling Lab, Ottawa, Canada), which related concentration to Young’s modulus (see
Figure 2.2 below). Gelatin powder (Sigma-Aldrich, Gillingham, UK) was dissolved in the
relevant solution according the concentrations below (% w/v corresponds to grams of
gelatin in 100 mL solution) and autoclaved. Following autoclaving, gelatin stock
solutions were stored at 4°C.
Concentration (% w/v) Solution Young’s modulus
3 Phosphate buffer saline 2 kPa
4 Water 18 kPa
6 Water 35 kPa
Figure 2.2: The relationship between concentration of gelatin (where percentage related to
grams/100mL of solution) and Young’s modulus, as measured by atomic force microscopy. Modulus was
dependent both on concentration and the solution used.
Shahzad Ali, UCL
48
Prior to coating of the culture surface, gelatin stock solutions were warmed in a
water bath (37°C) for 10-15 minutes until the solution was melted completely.
The stock solution was then added to glutaraldehyde in a 15 mL tube at a
concentration of 5 L glutaraldehyde per mL of gelatin stock solution (3 mL of
gelatin added to 15 L glutaraldehyde for a triplicate wells in a 6-well plate).
The GXG mixture was immediately mixed by vortexing before being added to
the culture surface. 0.7 mL was added to each well in the 6-well plates, whilst
5.25 mL was added to the T75 flasks (70 L per cm2 surface area). The GXG-
coated flasks or wells were left overnight at 4°C in a humidity chamber.
The next morning, the plates were washed three times with PBS (2 mL per well
in 6-well plates). On the third addition, PBS was left on GXG in order to prevent
the biomaterial from drying out whilst sodium borohydride was prepared.
Sodium borohydride (NaBH4) was used as a reducing agent to react with excess,
unreacted glutaraldehyde. The powdered form of NaBH4 (VWR, Lutterworth,
UK) was dissolved in ice cold PBS at a concentration of 1 mg NaBH4 per mL of
PBS solution (usually 15-20 mL borohydride solution made up for a 25 mL
centrifuge tube). After very brief mixing, the solution was immediately added
to the GXG culture surface (0.25 mL per cm2 of culture surface).
The well plates or T-flasks were kept on ice for one hour to allow the reduction
step to proceed.
Following the reduction step, the reacted NaBH4 solution was aspirated. The
culture surfaces were then washed twice with PBS. The second PBS wash was
left on the GXG overnight at 4°C.
The next morning (on the third day of the protocol), the PBS from the second
wash stage was removed and a third and final PBS wash stage performed.
Normal GMEM culture medium, without LIF, was then added to the culture
surface (0.2 mL per cm2 culture surface).
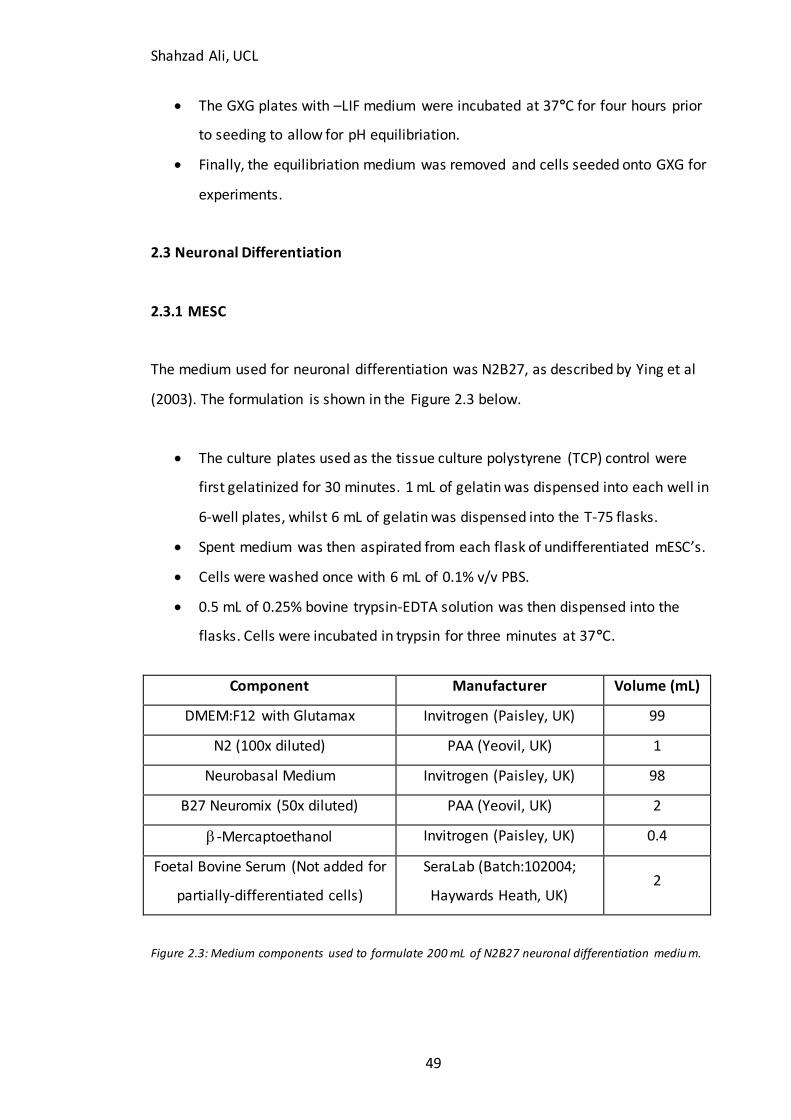
Shahzad Ali, UCL
49
The GXG plates with –LIF medium were incubated at 37°C for four hours prior
to seeding to allow for pH equilibriation.
Finally, the equilibriation medium was removed and cells seeded onto GXG for
experiments.
2.3 Neuronal Differentiation
2.3.1 MESC
The medium used for neuronal differentiation was N2B27, as described by Ying et al
(2003). The formulation is shown in the Figure 2.3 below.
The culture plates used as the tissue culture polystyrene (TCP) control were
first gelatinized for 30 minutes. 1 mL of gelatin was dispensed into each well in
6-well plates, whilst 6 mL of gelatin was dispensed into the T-75 flasks.
Spent medium was then aspirated from each flask of undifferentiated mESC’s.
Cells were washed once with 6 mL of 0.1% v/v PBS.
0.5 mL of 0.25% bovine trypsin-EDTA solution was then dispensed into the
flasks. Cells were incubated in trypsin for three minutes at 37°C.
Component Manufacturer Volume (mL)
DMEM:F12 with Glutamax Invitrogen (Paisley, UK) 99
N2 (100x diluted) PAA (Yeovil, UK) 1
Neurobasal Medium Invitrogen (Paisley, UK) 98
B27 Neuromix (50x diluted) PAA (Yeovil, UK) 2
-Mercaptoethanol Invitrogen (Paisley, UK) 0.4
Foetal Bovine Serum (Not added for
partially-differentiated cells)
SeraLab (Batch:102004;
Haywards Heath, UK) 2
Figure 2.3: Medium components used to formulate 200 mL of N2B27 neuronal differentiation mediu m.
Shahzad Ali, UCL
50
The trypsin was then quenched by dispensing 2.5 mL of normal GMEM medium
without LIF into the flasks. The cell suspension was aspirated and dispensed 3
times in order to create a single cell suspension and eliminate aggregates.
The quenched cell suspension was aspirated from the flasks and dispensed into
a 25 mL centrifuge tube and centrifuged at 300 x g for three minutes.
Following centrifugation, the quenched trypsin supernatant was removed from
above the cell pellet. The cell pellet was then resuspended in 10 mL of N2B27
medium with 1% v/v serum.
Cell counts were then made in order to calculate the volume of N2B27 cell
suspension required to achieve the desired seeding density of 1 x 10⁴ cells/cm2
(as characterized in Chapter 3, Figure 3.3). In order to make cell counts, 10 L
of suspension was aspirated from the cell suspension in N2B27 and dispensed
underneath a coverslip mounted on a hemocytometer.
The hemocytometer grid was then viewed using phase contrast microscopy
(with a 10x objective). Any cells contained within the grid were counted
(including cells lying on the top and left borders of the grid, but not the bottom
and right borders).
The output of these counts was the cell concentration in the suspension ( x104
cells/mL). This method was also used to calculate total cell concentration at the
end of four days of differentiation.
The volume of cell suspension required to achieve a seeding density of 1 x 10⁴
cells/cm2 was calculated using the below formula:
V1 = (V2.C2)/C1
Where: V1 = Volume needed from cell suspensi on (mL)
V2 = Total seeding volume (mL) = 0.2 mL for each cm2 culture area
C1 = Hemocytometer Cell Count (x104 cells/mL)
C2 = Cell concentration required to achieve seeding density of 1 x 10⁴ cells/cm
2 in the total seeding
volume, V2 = 5 x 10⁴ cells/mL
Shahzad Ali, UCL
51
The volume V1 was then removed from the cell suspension and diluted with
N2B27 medium to a volume of V2.
The gelatin (in the case of the TCP control) or equilibration medium (in the case
of GXG) was then aspirated from the plates or wells.
The cell suspension was immediately dispensed (2 mL per well in a 6-well plate
or 15 mL per T75 flask) onto the culture surface in order to ensure that GXG did
not dry out. The plates or well plates were swirled several times and placed in
an incubator at 37°C (5% v/v CO2).
Cells were fed with fresh medium every two days. This involved aspirating half
the spent medium from each well (1 mL) or plate (7.5 mL) and replacing with
the same volume of fresh medium. Serum was not added to fresh medium past
day four.
2.3.2 Partially-Differentiated Cells
MESC’s were partially-differentiated in tissue culture treated T75 flasks (Thermo
Scientific NUNC, Langenselbold, Germany) for four or six days in N2B27 medium as
outlined above.
On the day of seeding, 6-well plates (for attachment, expansion and
immunocytochemistry studies) or T75 flasks (for flow cytometry and qPCR)
were gelatinized.
Cells were then harvested as outlined above (2.3.1: MESC Neuronal
Differentiation) with scaled up volumes at each step (15 mL of PBS, 1 mL of
trypsin per T75 flask and 5 mL of quench medium) before being resuspended in
10 mL N2B27 medium (without serum).
Cell counts were again made using a hemocytometer at this stage. For
attachment and expansion studies, the same 1 x 10⁴ cells/cm2 seeding density
was used in order to directly compare findings against the mESC results.
However, this seeding density did not produce sufficient cells at day four in
Shahzad Ali, UCL
52
T75’s for flow cytometry or qPCR analysis. Therefore, for these experiments,
partially-differentiated cells were directly replated onto GXG or TCP. To
standardize the starting density, three mESC neuronal differentiations were
carried out in T75’s and the lowest value chosen as the starting seeding density
(3.5 x 10⁵ cells/mL for four day partially-differentiated cells – data not shown).
Cells were then seeded as with mESC’s onto GXG or TCP, in N2B27 medium.
2.4 Attachment and Expansion Studies
2.4.1 Phase Contrast Microscopy
Attachment and expansion were quantified for cells using confluency measurements
at 24h and 72h, respectively. All increase in cell number over the first 24h (0-24h) post-
seeding was considered as attachment. Any increase in cell number from 24h to 72h
was considered expansion. Cells were first washed three times with PBS prior to
measurements. Addition and removal of PBS for the wash step was standardised using
an S1 pipet filler (Thermo Scientific, Hudson, USA), where aspiration and dispension
speeds could be controlled to be consistent from run-to-run.
Phase contrast images were then obtained at 24h and 72h for confluency analysis.
Images were obtained using an Eclipse TE2000-U microscope (Nikon, Kingston-Upon-
Thames, UK) with a 4x objective, which was provided with the microscope. Five images
were obtained from each well. Images were obtained randomly at roughly defined
points (at the top-left, top-right, bottom-right, bottom-left and centre of each well).
This was performed in three wells (to make up a technical triplicate) for each modulus
condition. Three technical triplicates made up one biological replicate. This was
repeated over three independent cell passage numbers (experiments performed on
different days) to make up a biological triplicate.
Shahzad Ali, UCL
53
2.4.2 Image Analysis
Confluency was measured from the phase contrast images using ImageJ software
(rsbweb.nih.gov; NIH, Bethesda, USA). Images were first turned into an 8-Bit Binary
grayscale. An intensity threshold value was then selected in order to remove any non-
cellular artefacts from the image. Threshold values remained within ±10% of each
other across the technical replicates. The ‘’fill holes’’ function was used to remove any
white gaps in cells. The result was a white image with cells marked as black objects.
ImageJ then automatically measured percentage confluency by dividing the area of
black objects by the area of the white space.
The mean of these confluency measurements was calculated for each technical
replicate (from the five images for each well). Mean and standard deviation was then
calculated from the three technical replicates to make up a biological replicate for the
condition (N=1,2,3). The final mean and standard deviation was then calculated from
three biological replicates. All one-way ANOVA and t-test statistical analysis was then
performed from the three biological replicates.
Cell enumeration was performed on the confluency values to give values for cell
concentration. A standard curve was created to calculate cell areas at various time-
points during differentiation (0h, 24h, 48h, 96h). The % confluency (from above) was
then multiplied by the area of the image in cm2 to give the total area occupied by cells.
This value was matched to the given value of cell area at the given time-point (24h or
72h) to obtain a cell number for that field of view. This was divided by the area of the
image to give rise to a cell concentration value in cells/cm2.
2.5 Immunocytochemistry Analysis
2.5.1 Preparation – Fixation, Permeabilisation and Blocking
Well plates were removed from the incubator and washed twice with PBS.
Shahzad Ali, UCL
54
0.5 mL of 3.5% v/v paraformaldehyde (Sigma-Aldrich, Gillingham, UK) in PBS
with 2% v/v sucrose (Sigma-Aldrich, Gillingham, UK) was dispensed into each
well. Plates were incubated with the paraformaldehyde for ten minutes at
37°C.
Following fixation, cells were again washed three times with PBS. 0.5 mL of
0.25% v/v Triton X-100 (Sigma-Aldrich, Gillingham, UK) was then dispensed into
each well in order to permeabilise the cell membranes for intracellular
antibodies. Cells were incubated with Triton at 37°C for three minutes, before
being washed three times with PBS.
The final preparation stage was a blocking step, which was performed in order
to discourage non-specific binding of antibody cells. 0.5 mL of 2% v/v goat
serum in PBS was dispensed into each well. Cells were incubated at room
temperature for 20 minutes. The blocking agent was then removed using two
PBS wash steps.
2.5.2 Antibody Staining
0.5 mL of primary antibody solution at a dilution of 1:400 in 2% goat serum
(1:200 was used for nestin as it was not easily visible at higher ratios) was
dispensed into each well. Cells were incubated overnight at 4°C with the
primary antibodies. In the case of phalloidin, cells were incubated, covered in
foil for one hour at room temperature at a dilution of 1:100. As phalloidin is a
conjugated dye, secondary antibody incubation was not required. Thus these
cells went immediately to the DAPI stage.
Following incubation overnight, plates were washed three times with PBS. 0.5
mL of secondary antibodies (Invitrogen, Paisley, UK) were then dispensed into
each well at a dilution of 1:400 in 2% v/v goat serum. Plates were incubated
with the secondary antibodies, covered in foil at room temperature for one
hour.
The last stage was to stain cell nuclei, using 4’,6’-diamidino-2-phenylindole
(DAPI). Following a further three wash stages in PBS, 0.5 mL of DAPI
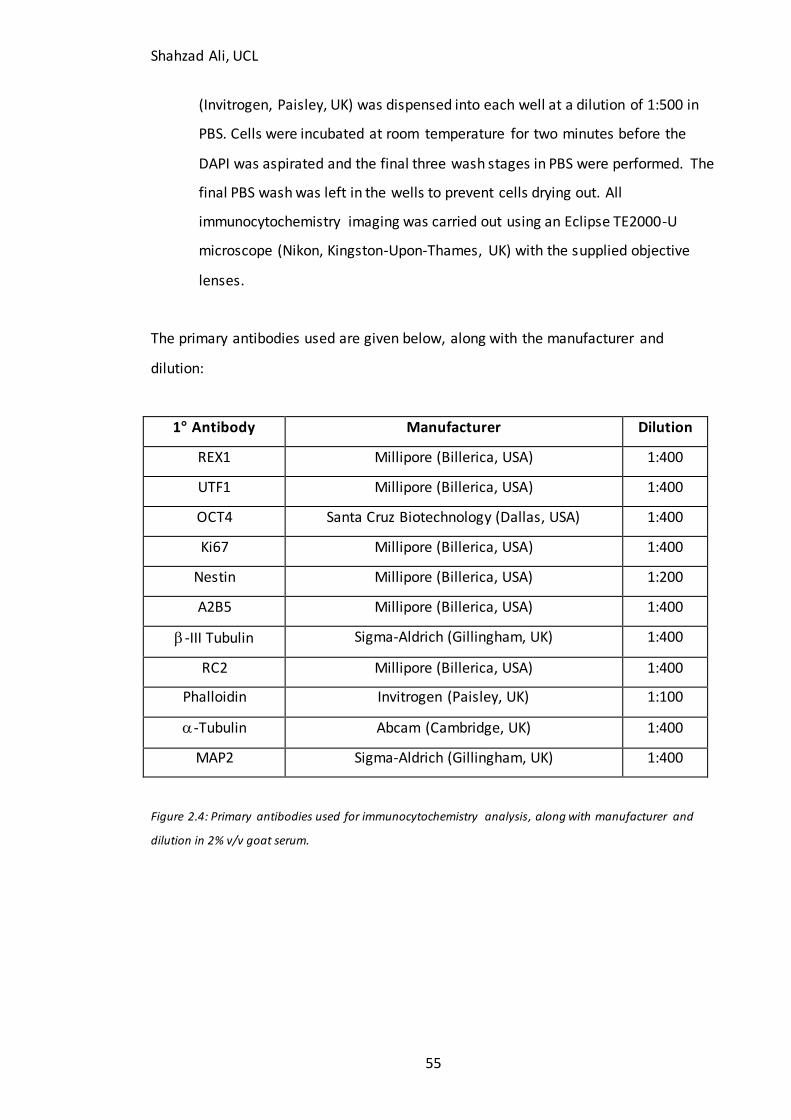
Shahzad Ali, UCL
55
(Invitrogen, Paisley, UK) was dispensed into each well at a dilution of 1:500 in
PBS. Cells were incubated at room temperature for two minutes before the
DAPI was aspirated and the final three wash stages in PBS were performed. The
final PBS wash was left in the wells to prevent cells drying out. All
immunocytochemistry imaging was carried out using an Eclipse TE2000-U
microscope (Nikon, Kingston-Upon-Thames, UK) with the supplied objective
lenses.
The primary antibodies used are given below, along with the manufacturer and
dilution:
1° Antibody Manufacturer Dilution
REX1 Millipore (Billerica, USA) 1:400
UTF1 Millipore (Billerica, USA) 1:400
OCT4 Santa Cruz Biotechnology (Dallas, USA) 1:400
Ki67 Millipore (Billerica, USA) 1:400
Nestin Millipore (Billerica, USA) 1:200
A2B5 Millipore (Billerica, USA) 1:400
-III Tubulin Sigma-Aldrich (Gillingham, UK) 1:400
RC2 Millipore (Billerica, USA) 1:400
Phalloidin Invitrogen (Paisley, UK) 1:100
-Tubulin Abcam (Cambridge, UK) 1:400
MAP2 Sigma-Aldrich (Gillingham, UK) 1:400
Figure 2.4: Primary antibodies used for immunocytochemistry analysis, along with manufacturer and
dilution in 2% v/v goat serum.
Shahzad Ali, UCL
56
2.6 Flow Cytometry
2.6.1 Preparation
The flow cytometry preparation protocol was similar to that above for
immunocytochemistry analysis, except that cells were prepared in suspension rather
than in-situ on well plates.
Cells were firstly harvested from T75 flasks by trypsinisation, as outlined
previously.
Following centrifugation, the quenched medium supernatant was removed
before cells were resuspended in PBS (with 2-3 aspirations and dispensions in
order to create a single cell suspension).
Hemocytometer counts (from a 10 L cell suspension sample) were then used,
similarly to before, in order to dilute cells to a concentration of 1 x 10⁶ cells/mL,
the recommended concentration for the flow cytometer. Cells were diluted to
the appropriate concentration in PBS. All subsequent stages were performed in
2 mL vials (Eppendorf, Hamburg, Germany) on ice.
As cells were analysed live using a cell surface marker, no fixation or
permeabilisation stage was required. One vial was created for each sample (2
kPa, 18 kPa, 35 kPa, TCP and undifferentiated E14). In addition two additional
vials were created. One was used for the isotype control (to isolate out
background and non-specific fluorescence), whilst the other as an unstained
control (in order to isolate target populations of cells for analysis using forward
scatter/side scatter).
Vials containing cells suspended in PBS were centrifuged in order to prepare for
blocking. All centrifugations were performed at 2500 rpm for five minutes at
4°C, unless otherwise stated. Following centrifugation, the supernatant PBS
was aspirated carefully and cells were resuspended in 600 L 2% v/v goat
serum blocking solution. This was followed by brief vortexing to ensure the
Shahzad Ali, UCL
57
formation of a single cell suspension, cells were incubated for 20 minutes on
ice.
Following blocking, vials were again centrifuged to prepare cells for primary
antibody addition. The supernatant was then aspirated carefully and 1 L PSA-
NCAM antibody (Abcam, Cambridge, UK) was added to the sample cell pellets.
1 L IgM isotype control (Sigma-Aldrich, Gillingham, UK) antibody was added to
the isotype control samples. These were then both diluted by aspirating 400 L
of 2% goat serum into the vials. Following vortexing, the cells were incubated
with the primary or isotype control antibodies for one hour on ice. Unstained
controls were simply resuspended in PBS, vortexed and kept on ice until they
were analysed in the flow cytometer.
Following primary antibody incubation, vials were centrifuged to prepare for
secondary antibody addition. An additional PBS wash stage was performed
before vials were centrifuged again (in order to reduce the risk of non-specific
binding of secondary antibodies on excess PSA-NCAM primary antibodies in
solution). 1 L of goat anti-mouse IgM 488 secondary antibody (Invitrogen,
Paisley, UK) was then added to each sample and isotype control. This was
diluted with 400 L of goat serum as before. Following vortexing, cells were
incubated for one hour on ice with the secondary antibody.
Following this, vials were centrifuged to prepare for the final PBS wash and
flow cytometry analysis. Cells were washed once more with PBS, and
centrifuged for a final time. Cells were resuspended in 1 mL PBS, vortexed and
taken over (on ice) immediately for flow cytometry analysis.
2.6.2 Flow Cytometry Analysis
Flow cytometry analysis was performed using the CyAn ADP flow cytometer (Beckman
Coulter, High Wycombe, UK).
Following initialization of the device (including a self-cleaning cycle of the flow
tubes), a run was performed using the unstained control. This was done in
Shahzad Ali, UCL
58
order to set device conditions (voltage and event rate, for example) as well as
to gate out viable cells from the overall population using forward scatter and
side scatter. 1 mL of the unstained control was dispensed into the flow tubes
supplied for the machine.
Once viable cells were gated out, a histogram was set up with an event limit of
10,000. An isotype control run was then performed using these conditions. 1
mL of the isotype control was dispensed into the flow tubes supplied for the
machine. From the resulting histogram, the lower 99.0% of the peak was gated
out as a negative control. Any fluorescence in the subsequent samples above
this gated value was counted as positive.
The PSA-NCAM stained samples were then run using the gated histogram from
the isotype control. 1 mL of each sample was dispensed into the flow tubes
supplied for the machine. Summit software (Beckman Coulter, High Wycombe,
UK) was used for all analysis.
2.7 qPCR
Following differentiation, cells were harvested from the T75’s by trypsinisation.
After the quenched trypsin was removed, PBS was aspirated onto the cell
pellet. The cells were pelleted once again by centrifugation and the
supernatant aspirated carefully using a pipette (Gilson, Middleton, WI, USA).
The dry cell pellets were stored at -20°C. All subsequent steps were performed
on ice.
2.7.1 RNA Extraction
RNA was extracted from the cell pellets using the RNeasy Micro Kit (Qiagen,
Sussex, UK). The cell pellets were thawed briefly at room temperature and
flicked by hand to displace from the bottom of the centrifugation tube.
75 L of Buffer RLT was dispensed into the pellet. The lysed suspension was
aspirated and dispensed a number of times in order for the reaction to proceed
fully. The lysed suspension was then pipetted into QIAshredder spin column
Shahzad Ali, UCL
59
(Qiagen, Sussex, USA). The spin column was placed in a 2 mL collection tube
(Qiagen, Sussex, USA) and centrifuged at full speed for two minutes. 75 L of
70% ethanol was then dispensed into the lysate solution in the 2 mL collection
tube. The solution was aspirated and dispensed multiple times until it became
clear. The solution was then aspirated from the collection tube and dispensed
into an RNeasy MiniElute spin column (Qiagen, Sussex, UK), placed inside a
fresh 2 mL collection tube. The lid of the spin column was gently closed and the
tube centrifuged at 8,000 x g for 15 seconds. The spin column was removed to
allow the flow through liquid within the collection tube to be poured out. The
spin column was then placed back inside it.
350 L of Buffer RW1 was dispensed into the spin column. The lid was again
gently closed and the tube centrifuged at 8,000 x g for 15 seconds. The flow
through within the collection tube was again poured out as waste before the
spin column was replaced.
70 L of Buffer RDD was dispensed into a separate 0.5 mL vial (Eppendorf,
Hamburg, Germany). To this, 10 L of DNase I stock solution was added. The
vial was gently inverted twice to mix. 10 L of DNase I mixture was then
dispensed onto each spin column filter. The tubes were then allowed to
incubate at room temperature for 15 minutes. Following the incubation step,
350 L of Buffer RW1 was added to each spin column. The lid was closed gently
and the tube centrifuged at 8,000 x g for 15 seconds. After centrifugation, the 2
mL collection tube was discarded, with the follow through liquid. The spin
column was then placed in a fresh 2 mL collection tube.
500 L of Buffer RPE was then dispensed into the spin column. The lid was
gently closed and the tube centrifuged at 8,000 x g for 15 seconds. Following
removal of the spin column, the follow through liquid in the collection tube was
poured out as waste. 500 L of 80% ethanol was then dispensed into the spin
column. The lid was gently closed and tube centrifuged at 8,000 x g for two
minutes. The collection tube (along with the flow through liquid) was
Shahzad Ali, UCL
60
discarded. The spin column was then placed in a fresh 2 mL collection tube. The
lid was opened and the tube centrifuged at full speed for five minutes. The
collection tube was then discarded again along with the follow through liquid.
The spin column was then placed in a 1.5 mL collection tube (Qiagen, Sussex,
UK) for the elution stage. To elute, 14 L of RNase free water was dispensed
into the centre of the spin column filter membrane. The lid was closed gently
and finally the tube was centrifuged at full speed for a minute to elute the
template RNA into the 1.5 mL collection tube.
The concentration of RNA in elute was measured using a Nanodrop
spectrophotometer (Thermo Scientific, Delaware, USA). The
spectrophotometer measured RNA concentration using absorbance at
wavelengths of 260 nm and 280 nm. 1 mL of distilled water sample was
dispensed onto the reader and a blank measurement made before each sample
reading. Following the reading, the vials were kept at -80°C for storage.
2.7.2 cDNA Synthesis
1 mg of RNA (calculated from the spectrophotometer reading) was then used to
synthesise first strand cDNA using the RETROscript First Strand Synthesis Kit (Qiagen,
Sussex, UK), again as per the manufacturer’s instructions, using random decamers to
prime the first strand reaction. A Mastercycler EP Realplex (Eppendorf) thermocycler
was used to carry out the synthesis reaction. The steps are outlined below:
The template RNA vials were defrosted on ice. The Reverse Transcriptase
(Qiagen, Sussex, UK), RT Buffer (Qiagen, Sussex, UK), RNase-free water (Qiagen,
Sussex, UK) and gDNA wipeout buffer (Qiagen, Sussex, UK) were also thawed,
albeit at room temperature.
The genomic DNA elimination reaction was then set up on ice. To increase the
accuracy of volume measurements, large stock quantities were made and
aliquoted for each gene and sample studied. For example for six genes across
the four samples (2 kPa, 18 kPa, 35 kPa and TCP), samples were made for 24
Shahzad Ali, UCL
61
reaction wells. An extra 10% volume was added to factor in pipetting error.
One 0.5 mL vial (Eppendorf, Hamburg, Germany) was used for each reaction
well. For each reaction well, 14 L was made up containing 2 mL gDNA wipeout
buffer, x mL template RNA (where x is the mL of RNA elute containing 1 mg of
RNA) and (12-x) mL of RNase free water. 14 L of elimination reaction mixture
was dispensed into each 0.5 mL vial. The vials were briefly spun (10,000 rpm for
five seconds) in order to mix. The vials were then placed inside the
thermocycler and incubated at 42°C for two minutes.
The reverse transcription master mix was then set up on ice. 6 L was created
for each reaction well, containing 1 L Reverse Transcriptase, 4 L RT Buffer
and 1 L RT Primer Mix. Primer sequences are proprietary but details can be
found at www.qiagen.com/GeneGlobe/. Primer assays are detailed in Figure
2.5. Once again, a large volume master mix was made up for the total number
of reactions plus an additional 10% for pipetting error. 6 L of reverse
transcription master mix was dispensed into each vial containing 14 L of gDNA
elimination reaction mixture. The vials were briefly spun (10,000 rpm for five
seconds) in order to mix.
The vials were then placed in the thermocycler. A second protocol was run,
where the vials were first incubated for 15 minutes at 42 before being
incubated at 95 for three minutes. The cDNA samples were stored long term at
-20°C.
2.7.3 PCR Plate Setup
For gene expression analysis, 1 L of the cDNA was used in a SYBRGreen real time PCR
reaction using the Eurogentec (Southampton, UK) SYBR Green PCR Kit and the pre-
validated QuantiTect Primer Assays (Qiagen, Sussex, UK) under the manufacturer’s
protocols.
Shahzad Ali, UCL
62
The components of the qPCR master mix were thawed on ice. These included
the MESA Blue MasterMix (Eurogentec, Southampton, UK), QuantiText Primer
Assay (Qiagen, Sussex, UK) and RNase-free water (Qiagen, Sussex, UK).
The larger volume qPCR master mix was made up in a 1.5 mL tube (Eppendorf,
Hamburg, Germany) to be aliquoted into cDNA samples. Per 20 L sample, 10
L of MESA Blue MasterMix, 2 L of Primer Assay and 8 L of RNase-free water
was used. In total, three (technical triplicate) samples were made per condition
studied (2 kPa, 18 kPa, 35 kPa and TCP), in addition to two additional control
samples (NTC – no template control and NRT – no reverse transcription
control). An additional sample was made up to account for pipetting error,
bringing the total up to 15 samples for four conditions. After pipetting, the tube
was centrifuged briefly (10s) at 10,000 rpm to mix.
The MasterMix was then aliquoted into 0.5 vials to prepare for plate setup.
Four vials were used per gene (one for each condition; 2 kPa, 18 kPa, 35 kPa
and TCP). 60 L was aliquoted into each vial. 3 L of cDNA (from the previous
stage) was pipetted into each vial containing MasterMix. They were mixed by
aspirating and dispensing several times using the pipette before being
centrifuged for 10s at 10,000 rpm.
20 L of the gene sample for study was then pipetted from the vials into each
well of the qPCR plate (BioRad, Hemel Hempstead, UK).
20 L of MasterMix alone (without cDNA) was dispensed into the penultimate
row (row G) of the PCR plate as the NTC control. Additionally, 20 L of
MasterMix with 1.0 mg RNA (from earlier) but without cDNA was added to the
last row (row H) of the PCR plate as the NRT control.
The lid was then covered by a supplied plastic cover (BioRad, Hemel
Hempstead, UK). A straight edged object was then used to force out air bubbles
between the plate and cover.
Finally the PCR plate was kept on ice to prepare for immediate analysis.
Shahzad Ali, UCL
63
2.7.4 PCR Analysis
After being centrifuged at 300 x g for three minutes, the PCR plates were placed in a
CFX Connect Real-Time PCR Detection System (Qiagen, Sussex, UK). The ‘‘Quickplate
SYBR Assay (Clear Wells)’’ protocol (Eurogentec, Southampton,UK) was then selected.
The lid of the machine was opened and the plate placed into the holder. The lid was
closed and the protocol was run.
For relative quantification, the DDCt method (Pfaffl, 2001) was used. Briefly, Ct refers
to the threshold cycle, the number of PCR cycles required for the threshold (set by the
machine) value of fluorescence signal to be overcome by the sample. DDCt is equal to
the difference between DCt treated (the difference in Ct between each sample and the
equivalent housekeeping genes for that condition) and DC t control (the difference in Ct
between each TCP control and the housekeeping genes for the control). RNA levels
were normalised against the housekeeping genes GAPDH and TBP, as selected in
Chapter 3. All calculations were performed using the BioRad CFX Manager software
(BioRad, Hemel Hempstead, UK).
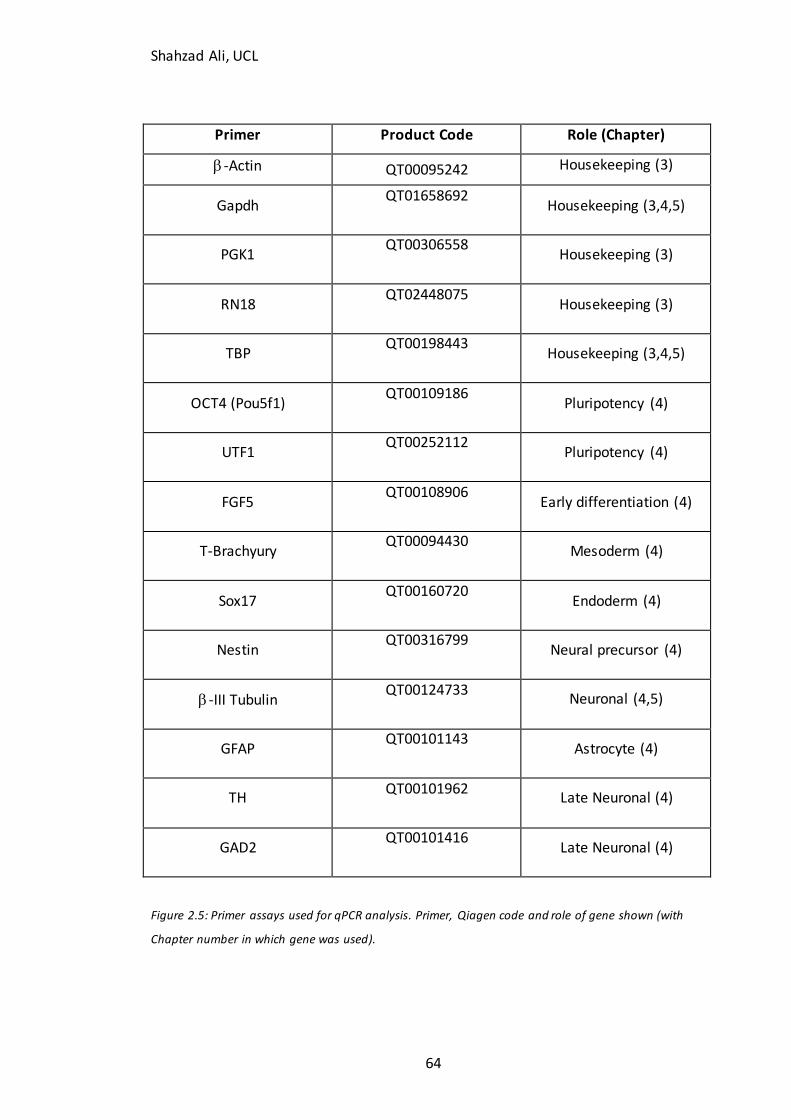
Shahzad Ali, UCL
64
Primer Product Code Role (Chapter)
-Actin QT00095242 Housekeeping (3)
Gapdh QT01658692
Housekeeping (3,4,5)
PGK1 QT00306558
Housekeeping (3)
RN18 QT02448075
Housekeeping (3)
TBP QT00198443
Housekeeping (3,4,5)
OCT4 (Pou5f1) QT00109186
Pluripotency (4)
UTF1 QT00252112
Pluripotency (4)
FGF5 QT00108906
Early differentiation (4)
T-Brachyury QT00094430
Mesoderm (4)
Sox17 QT00160720
Endoderm (4)
Nestin QT00316799
Neural precursor (4)
-III Tubulin QT00124733
Neuronal (4,5)
GFAP QT00101143
Astrocyte (4)
TH QT00101962
Late Neuronal (4)
GAD2 QT00101416
Late Neuronal (4)
Figure 2.5: Primer assays used for qPCR analysis. Primer, Qiagen code and role of gene shown (with
Chapter number in which gene was used).
Shahzad Ali, UCL
65
2.8 Blebbistatin and Nocodazole Inhibition
2.8.1 Blebbistatin
Powdered blebbistatin was dissolved into DMSO to form a stock solution. This solution
was then aliquoted into vials and stored at -20°C for further use. For experiments,
these aliquots were diluted in 10 mL of normal culture medium without LIF to a final
concentration of 50 M. This concentration was chosen on the basis of previous
studies using blebbistatin (Engler et al, 2006; Chowdhury et al, 2009).
Prior to treatment, spent medium was removed from the T25’s (E14) and T75’s
(Partially-differentiated cells). The medium containing blebbistatin was then added to
the flasks, which were allowed to incubate for 30 minutes. Following this pre-
treatment, the blebbistatin was removed and the cells were prepared for
differentiation as outlined earlier.
2.8.2 Nocodazole
Nocodazole was aliquoted and stored in a similar fashion in DMSO to blebbistatin (see
above). These aliquots were diluted to a final concentration of 50 m in 35 mL of
N2B27 medium. This medium was then added to the cell suspension before seeding
(Spedden et al, 2012).
2.9 Rate of Spreading
In order to analyse rate of spreading, partially-differentiated cells were pre-treated
with CellTracker (Invitrogen, Paisley, UK) using a similar method to that for
blebbistatin. CellTracker highlights the cell perimeter under fluorescence in such a way
that it becomes easy to accurately measure cell surface projection area using image
analysis software. Cell tracker was diluted in 10 mL of medium (at a dilution ratio of
1:200) before being added directly to the adhered partially-differentiated cells within
Shahzad Ali, UCL
66
the T75 flasks. The cells were then harvested and seeded for differentiation
experiments as outlined earlier.
Images were obtained 2 hours, 4 hours and 6 hours following seeding using the
fluorescence bulb on the Eclipse TE2000U (Nikon, Kingston-Upon-Thames, UK). Five
cells were selected at random from each well (from one field of view). A total of 15
cells were thus selected for each condition. The images were analysed in the same way
as with attachment, where ImageJ was used to create binary images of cells (black) on
the surfaces (white). The ‘‘analyze particles’’ function was used to measure the
projection areas of individual cells.
The mean projection areas of cells were compared across the four conditions at the
time points mentioned above. The projection areas at t=4h and t=6h were also
normalized to the initial projection area (the projection area at t=2h) in order to
measure rate of spreading.
2.10 Statistics
All statistical analyses were carried out using SPSS software (v.21; IBM). One-way
ANOVA analysis was used to calculate statistical significance amongst trends across the
four materials. Tukey’s test for multiple comparisons was then used to identify where
the statistical differences lay. For the blebbistatin and nocodazole experiments, as the
comparisons were being made between the treated and untreated conditions, rather
than across the population as a whole, independent-samples t-test was used for each
condition.
In all cases, a p-value less than 0.05 was considered statistically significant (95%
confidence interval).
Shahzad Ali, UCL
67
3 GXG and Protocol Development
In this chapter, a number of initial challenges were addressed before the effect of
Young’s modulus on mouse embryonic stem cell (mESC) neuronal differentiation was
investigated. The neuronal differentiation conditions outlined in Ying et al (2003)
produce large colonies of nestin-positive neural precursors (Engler et al, 2006) and -III
tubulin positive immature neurons (Engler et al, 2006). However, the commercially
available RHB-A (Stem Cells Inc, Cambridge, UK) medium caused a number of
variability issues in terms of cell attachment and expansion. As attachment and
expansion were key to the central hypothesis of this study, this was a problem that
immediately required addressing.
3.1 Aims
With this in consideration, the first experiments were aimed at characterizing the
starting conditions used for the experiments. Factors such as medium formulation
(commercially produced vs. ‘in-house’ preparation), serum concentration and seeding
density were all decided upon at this stage. Optimizing these conditions, allowed for
maximal neuronal precursor formation for Young’s modulus study,
In order to compare differentiation across different Young’s modulus conditions, it was
necessary to develop assays, which could robustly compare differentiation across
conditions. It was also important to establish the time-points during differentiation
where key markers for cell identity (for neural precursors, immature neurons and glial
cells) would be expressed.
To achieve this, the pluripotency of the starting cell populations were validated along
with the time-lapse emergence of key phenotype markers during differentiation. The
two key quantitative assays used in testing the main hypotheses of this study were
then validated, namely real-time, quantitative polymerase chain reaction (qPCR) and
flow cytometry.
Shahzad Ali, UCL
68
Prior to commencing Young’s modulus work in mESC’s, two non-mESC cell lines
(fibroblasts and human embryoid bodies) were plated on GXG in order to provide a
basis for comparison for the mESC cell work.
The final work in this chapter involved seeding mESC’s in other, non-neuronal
differentiation conditions, in order to assess whether the effect of Young’s modulus on
mESC attachment and expansion was influenced by the growth medium.
3.2 How does medium composition affect attachment of mESC’s in neuronal
differentiation medium?
Attachment of mESC’s was key to the central hypothesis tested in this study. It was
therefore, imperative to maximise the initial attachment of mESC’s in neuronal
differentiation medium. The most commonly used monolayer neuronal differentiation
medium for mESC’s is N2B27, as formulated in the study by Ying et al (2003). MESC’s
seeded on gelatin-coated tissue culture polystyrene (TCP) in N2B27 medium expand in
adherent monolayer culture, to form colonies with rosette-like morphologies, positive
for neural precursor and later immature neuronal markers such as nestin and -III
tubulin respectively. Further differentiation leads to development of mature neuronal
subtypes such as GABAergic and tyrosine hydroxylase-positive neurons.
The commercially available version of N2B27, termed RHB-A (Stem Cells Inc,
Cambridge, UK) is a modified, proprietary formulation. Initial attempts at seeding in
RHB-A medium resulted in negligible colony formation at day four, typified by the
morphologies observed on the top line of figures in Figure 3.1.
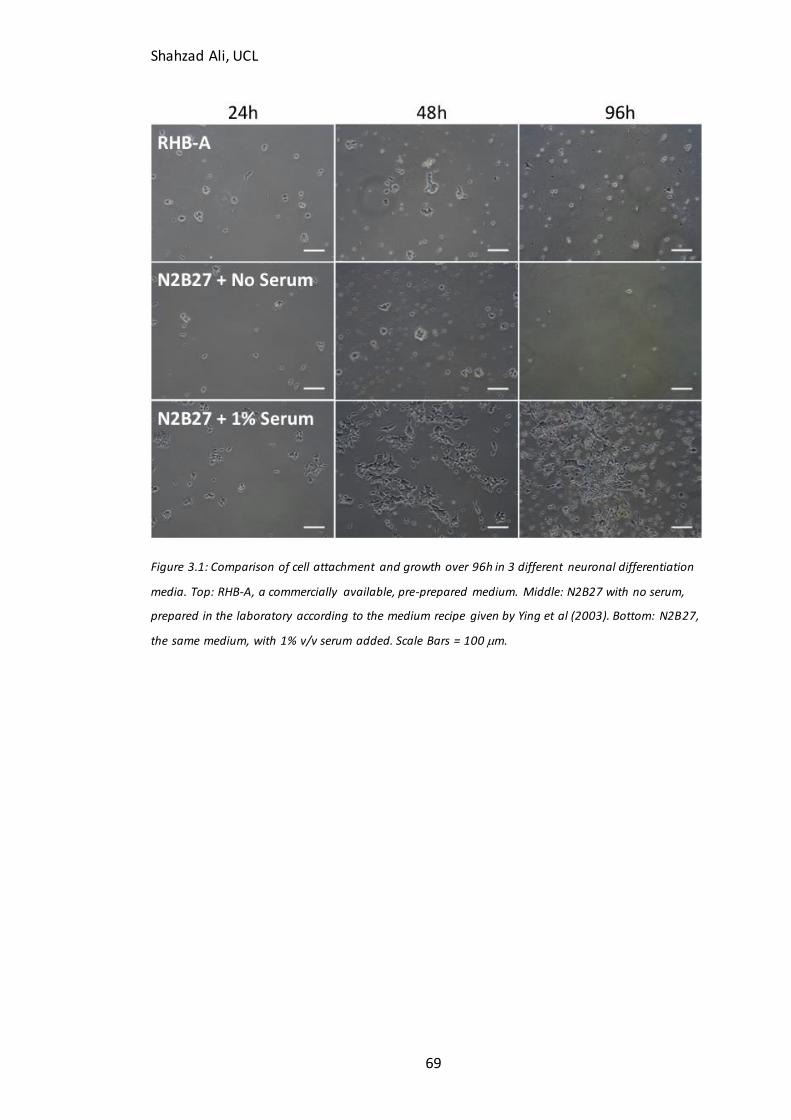
Shahzad Ali, UCL
69
Figure 3.1: Comparison of cell attachment and growth over 96h in 3 different neuronal differentiation
media. Top: RHB-A, a commercially available, pre-prepared medium. Middle: N2B27 with no serum,
prepared in the laboratory according to the medium recipe given by Ying et al (2003). Bottom: N2B27,
the same medium, with 1% v/v serum added. Scale Bars = 100 m.
Shahzad Ali, UCL
70
Attachment did occur over the first 48h, but following this there was a significant
amount of cell detachment and death. There were some rare occasions where cells did
remain attached (results not shown) following attachment, but the run-to-run
reproducibility of this effect was not satisfactory for attachment studies .
Neuronal differentiation in N2B27 is typified by significant amount of cell detachment
and death, as the medium selects against cells that do not differentiate towards a
neuronal lineage, but the amounts of detachment and lack of expansion at 96h in RHB-
A was excessive in comparison to the images seen in the Ying et al (2003) study.
Based on this, the decision was made to formulate the N2B27 medium ‘in house,’
using the defined components given in the Ying et al (2003) paper. When cells were
seeded in this more chemically defined medium (Figure 3.1, middle row), a similar
profile emerged in expansion following attachment. Forming neuronal precursors at
the 96h time-point was as difficult as with RHB-A.
The persistence of these initial problems led to the conclusion that serum may have
been the key to promoting cell spreading and expansion. Fetal bovine serum (FBS) is
commonly used as a medium component in order to promote attachment in many
adherent cells, including mESC’s owing to its vitronectin and to a lesser extent,
fibronectin content (Hayman et al, 1985). However, serum is undesirable for early
neuronal differentiation as it contains the bone morphogenetic protein BMP-4 (Finley
et al, 1999). BMP-4 antagonises Shh and noggin, two growth factors that play a key
role in early neurogenesis (see Introduction). Thus N2B27 medium is formulated for
serum free growth.
It was hoped, that by using a small amount of serum (1% v/v in N2B27) during seeding,
cells would remain adhered during expansion. The bottom row of Figure 3.1 highlights
the improvement that was observed with serum use during attachment. Cells attached
with similar numbers at 24h, whilst forming a markedly more spread out morphology
than that of the RHB-A and zero-serum N2B27 medium. Following attachment, despite
there being a continued detachment effect, considerably more cells appeared to form

Shahzad Ali, UCL
71
colonies than in the other media. This effect was reproducible across numerous
passages. Cells appeared to maintain a homogeneous morphology during
differentiation, implying that differentiation was occurring efficiently. On the basis of
these findings, the effects of serum were investigated further.
Three different serum conditions were used to complete optimization of the medium;
0%, 1% and 5% v/v serum. The highest condition was used in order to ascertain
whether attachment could be improved further and whether morphologies would
remain homogeneous during expansion.
As before, adding 1% v/v serum to N2B27 during seeding caused cells to become more
spread at 24h when compared to the serum-free N2B27. Increasing the serum
concentration to 5% v/v also lead to cells having a spread morphology at 24h following
seeding (Figure 3.2A). However, the cell morphologies did not appear to be as
homogeneous as that observed in the 1% v/v serum condition, implying that non-
neural differentiation is taking place.
Most cells detached in the 0% serum condition between the 24h and 72h time-points.
Those cells that remained attached appeared to be rounded and did not form large
colonies at 72h. In N2B27 medium with 1% v/v serum, cells expanded to form dense,
rosette-like colonies. These colonies contained cells that were more spread out than
the few cells that remained attached on the zero serum condition. 5% v/v serum also
resulted in cells proliferating and forming colonies but cellular morphologies were
again not as homogeneous as that of the 1% v/v serum condition. Ying et al (2003)
reported that serum use does produce some non-neuronal epithelial-like cells.
Confluency was quantified at 24h from phase contrast images in order to assess
whether 5% serum significantly increases attachment compared to the 1% and 0%
conditions. Serum concentration had no significant (p=0.393) effect upon attachment
of cells at 24h (Figure 3.2B).
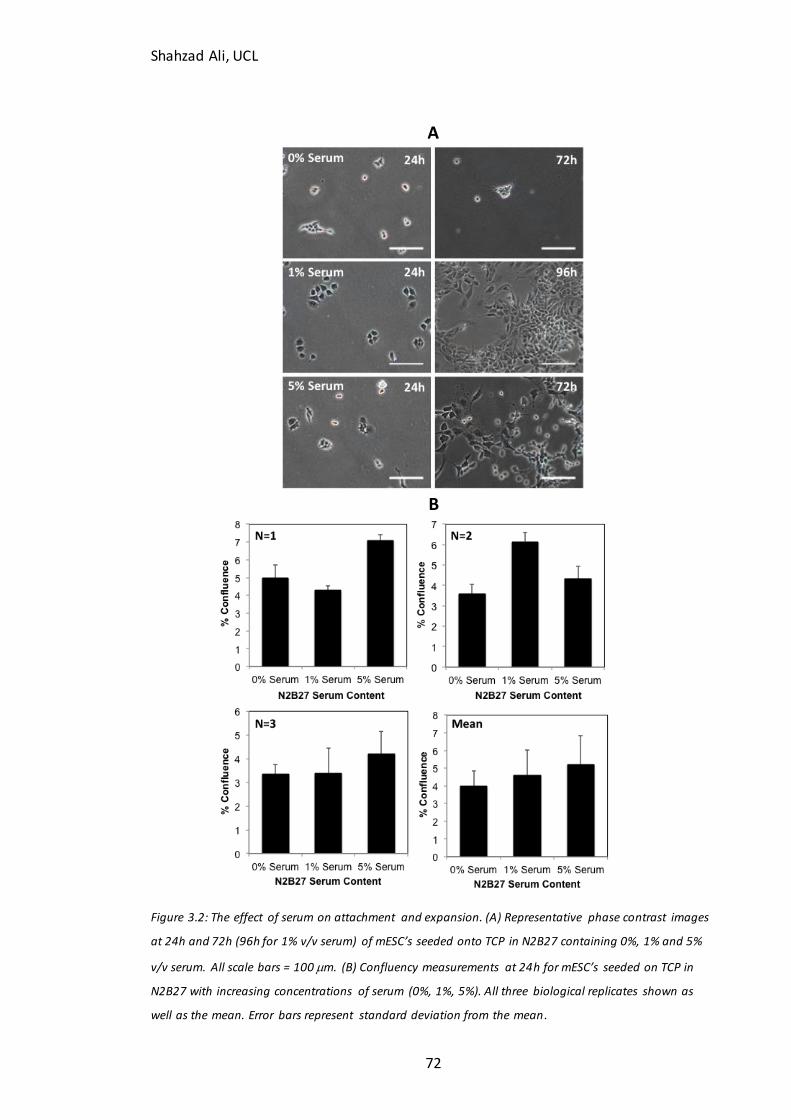
Shahzad Ali, UCL
72
A
B
Figure 3.2: The effect of serum on attachment and expansion. (A) Representative phase contrast images
at 24h and 72h (96h for 1% v/v serum) of mESC’s seeded onto TCP in N2B27 containing 0%, 1% and 5%
v/v serum. All scale bars = 100 m. (B) Confluency measurements at 24h for mESC’s seeded on TCP in
N2B27 with increasing concentrations of serum (0%, 1%, 5%). All three biological replicates shown as
well as the mean. Error bars represent standard deviation from the mean.
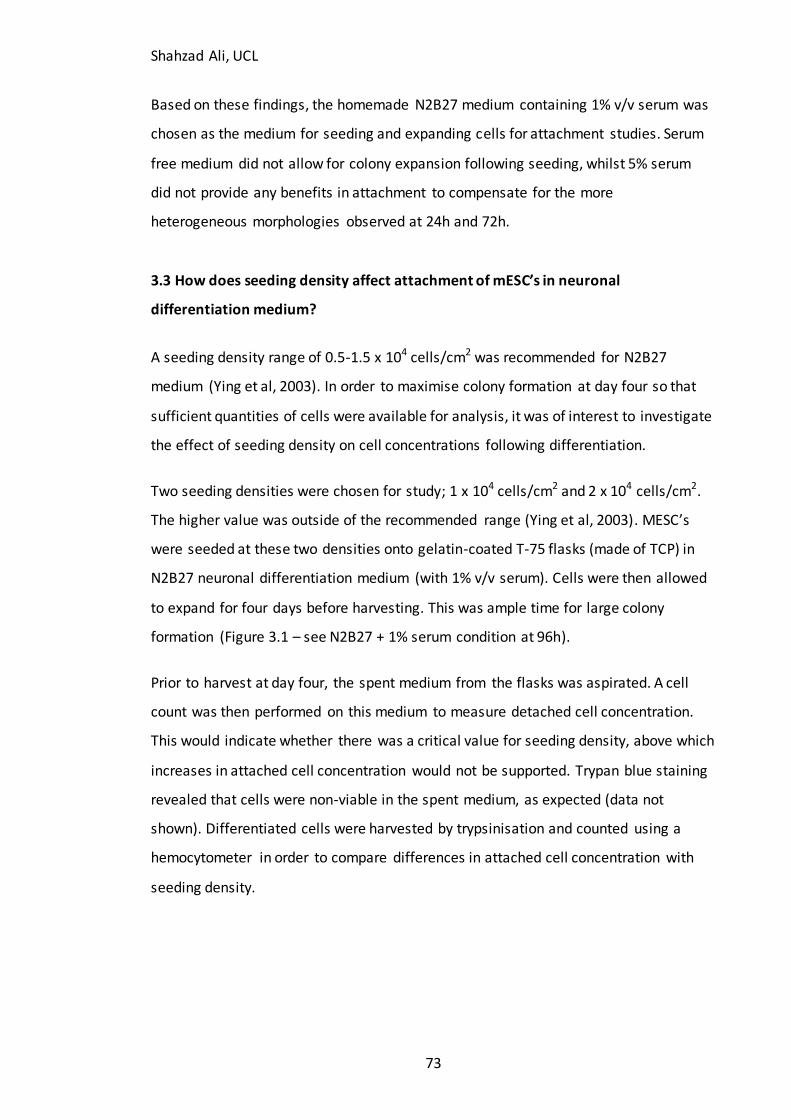
Shahzad Ali, UCL
73
Based on these findings, the homemade N2B27 medium containing 1% v/v serum was
chosen as the medium for seeding and expanding cells for attachment studies. Serum
free medium did not allow for colony expansion following seeding, whilst 5% serum
did not provide any benefits in attachment to compensate for the more
heterogeneous morphologies observed at 24h and 72h.
3.3 How does seeding density affect attachment of mESC’s in neuronal
differentiation medium?
A seeding density range of 0.5-1.5 x 10⁴ cells/cm2 was recommended for N2B27
medium (Ying et al, 2003). In order to maximise colony formation at day four so that
sufficient quantities of cells were available for analysis, it was of interest to investigate
the effect of seeding density on cell concentrations following differentiation.
Two seeding densities were chosen for study; 1 x 10⁴ cells/cm2 and 2 x 10⁴ cells/cm2.
The higher value was outside of the recommended range (Ying et al, 2003). MESC’s
were seeded at these two densities onto gelatin-coated T-75 flasks (made of TCP) in
N2B27 neuronal differentiation medium (with 1% v/v serum). Cells were then allowed
to expand for four days before harvesting. This was ample time for large colony
formation (Figure 3.1 – see N2B27 + 1% serum condition at 96h).
Prior to harvest at day four, the spent medium from the flasks was aspirated. A cell
count was then performed on this medium to measure detached cell concentration.
This would indicate whether there was a critical value for seeding density, above which
increases in attached cell concentration would not be supported. Trypan blue staining
revealed that cells were non-viable in the spent medium, as expected (data not
shown). Differentiated cells were harvested by trypsinisation and counted using a
hemocytometer in order to compare differences in attached cell concentration with
seeding density.
Shahzad Ali, UCL
74
Figure 3.3: Comparison of cell concentration at day four of neuronal differentiation on TCP at two
seeding densities: 10,000 cells/cm2 and 20,000 cells/cm
2. Cell concentration of the harvest was measured
as attached and cell concentration in the spent medium measured as unattached cells.
Shahzad Ali, UCL
75
Attached cell concentration at day four was 24% higher with a 100% increase in
seeding density from 1 to 2 x 10⁴ cells/cm2 (Figure 3.3). The seeding density increase
was accompanied by a 72% increase in unattached cell concentration. The large
increase in detached cell concentration with the increase in seeding density negated
the slight increase in attached cell concentration. The lower, 1 x 10⁴ cells/cm2 seeding
density was chosen as a result.
3.4 Validation of starting cell populations and neuronal differentiation marker
expression
Before the mESC’s underwent neuronal differentiation, their identity was validated in
order to ensure that they were true pluripotent cells. Immunocytochemistry analysis
was performed for four pluripotent markers; Rex1, Oct4, UTF1 and Ki67. The first three
are characteristic transcription factors present in the nuclei of pluripotent stem cells
(Ben-Shushan et al, 1998; Nichols et al, 1998; Okuda et al, 1998). Ki67 is actually a
marker for proliferative cells (Yu et al, 1992), but as unlimited self-renewal is one of
the key characteristics of pluripotent stem cells, it can act as a useful negative control
for differentiation.
When immunocytochemistry analysis was performed for these four factors (Figure
3.4), UTF1 and Oct4 were revealed to be present in the nuclei (staining corresponded
closely to that of nuclear stain DAPI) of the mESC’s. Ki67 was also present in the
nucleus and cytoplasm of all cells (it is not a transcription factor). This was evidence
that cells were proliferative. Morphology alone is not a very effective indication of
phenotype, but the cells did exhibit typical mESC morphologies. They were rounded,
and densely packed into compact colonies. Interestingly, Rex1 was not revealed in cell
nuclei during immunocytochemistry analysis. Rex1 is not as fundamental a marker for
pluripotency or stemness as Oct4 and is in fact regulated by Oct4 (Ben-Shushan et al,
1998). In that study, high levels of Oct4 activity were found to repress Rex1 expression
in certain conditions. It is likely that this phenomenon has occurred in the mESC’s used
for this investigation, explaining the abundance of Oct4 and the absence of Rex1.
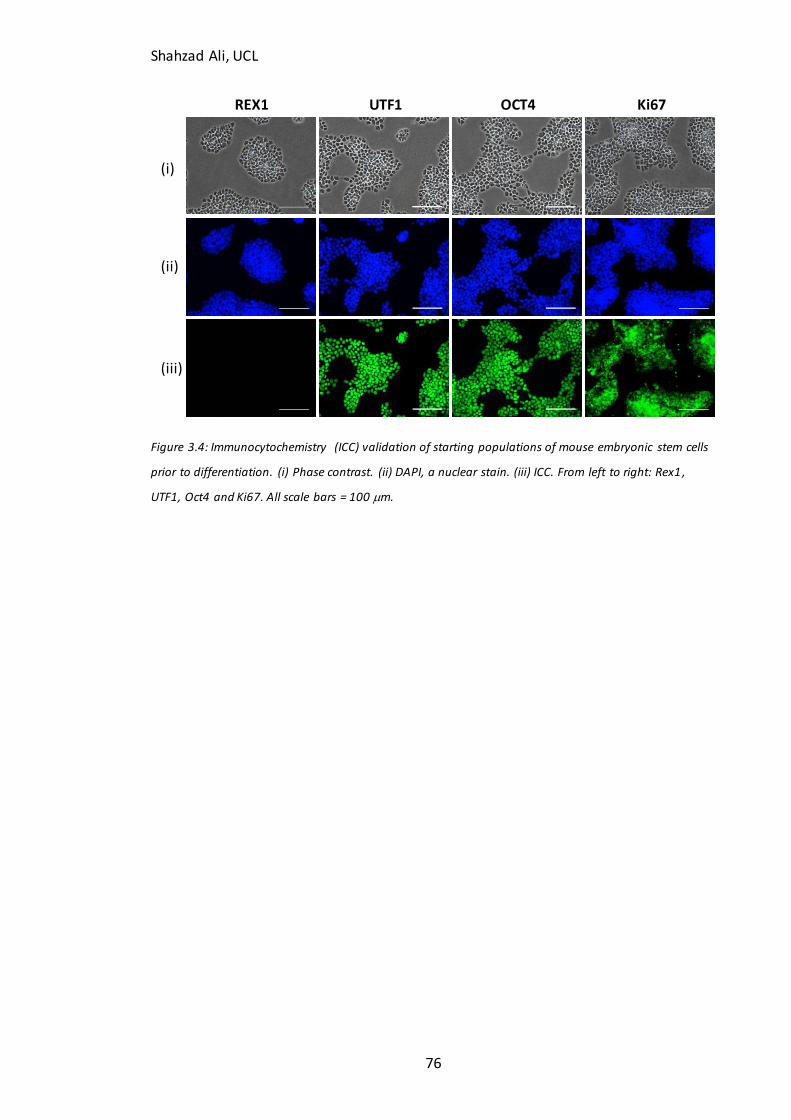
Shahzad Ali, UCL
76
REX1 UTF1 OCT4 Ki67
Figure 3.4: Immunocytochemistry (ICC) validation of starting populations of mouse embryonic stem cells
prior to differentiation. (i) Phase contrast. (ii) DAPI, a nuclear stain. (iii) ICC. From left to right: Rex1 ,
UTF1, Oct4 and Ki67. All scale bars = 100 m.
(i)
(ii)
(iii)
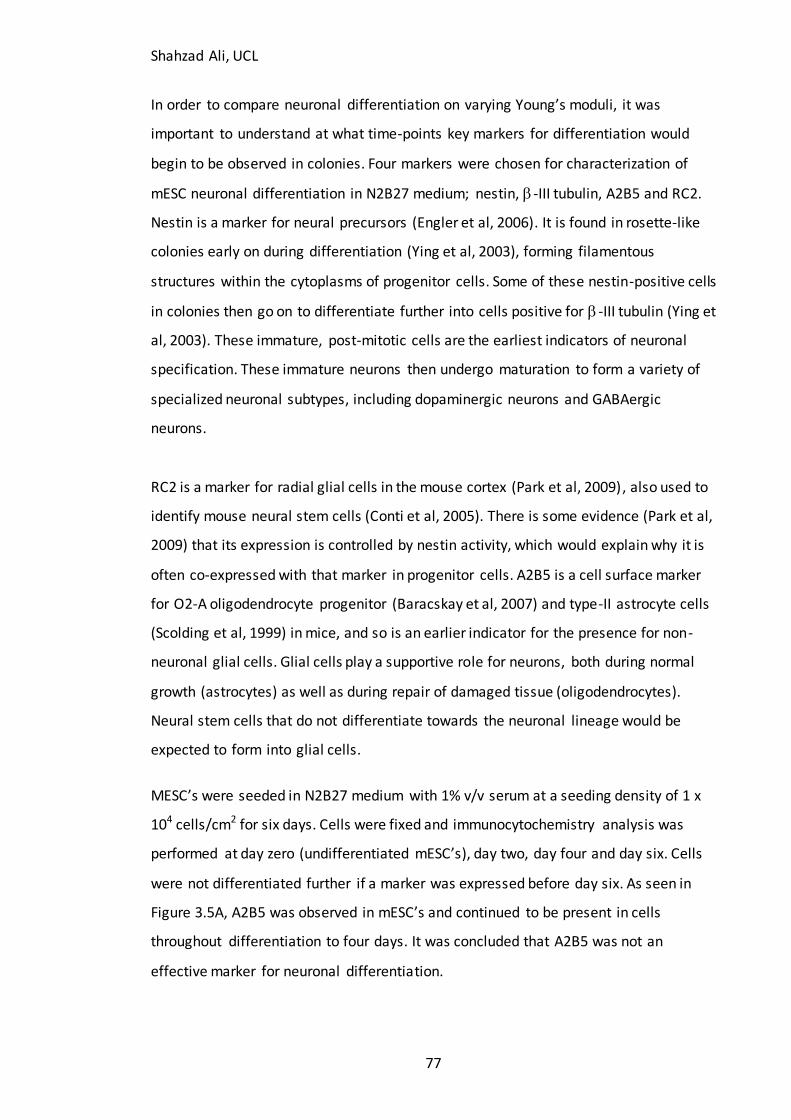
Shahzad Ali, UCL
77
In order to compare neuronal differentiation on varying Young’s moduli, it was
important to understand at what time-points key markers for differentiation would
begin to be observed in colonies. Four markers were chosen for characterization of
mESC neuronal differentiation in N2B27 medium; nestin, -III tubulin, A2B5 and RC2.
Nestin is a marker for neural precursors (Engler et al, 2006). It is found in rosette-like
colonies early on during differentiation (Ying et al, 2003), forming filamentous
structures within the cytoplasms of progenitor cells. Some of these nestin-positive cells
in colonies then go on to differentiate further into cells positive for -III tubulin (Ying et
al, 2003). These immature, post-mitotic cells are the earliest indicators of neuronal
specification. These immature neurons then undergo maturation to form a variety of
specialized neuronal subtypes, including dopaminergic neurons and GABAergic
neurons.
RC2 is a marker for radial glial cells in the mouse cortex (Park et al, 2009), also used to
identify mouse neural stem cells (Conti et al, 2005). There is some evidence (Park et al,
2009) that its expression is controlled by nestin activity, which would explain why it is
often co-expressed with that marker in progenitor cells. A2B5 is a cell surface marker
for O2-A oligodendrocyte progenitor (Baracskay et al, 2007) and type-II astrocyte cells
(Scolding et al, 1999) in mice, and so is an earlier indicator for the presence for non-
neuronal glial cells. Glial cells play a supportive role for neurons, both during normal
growth (astrocytes) as well as during repair of damaged tissue (oligodendrocytes).
Neural stem cells that do not differentiate towards the neuronal lineage would be
expected to form into glial cells.
MESC’s were seeded in N2B27 medium with 1% v/v serum at a seeding density of 1 x
104 cells/cm2 for six days. Cells were fixed and immunocytochemistry analysis was
performed at day zero (undifferentiated mESC’s), day two, day four and day six. Cells
were not differentiated further if a marker was expressed before day six. As seen in
Figure 3.5A, A2B5 was observed in mESC’s and continued to be present in cells
throughout differentiation to four days. It was concluded that A2B5 was not an
effective marker for neuronal differentiation.
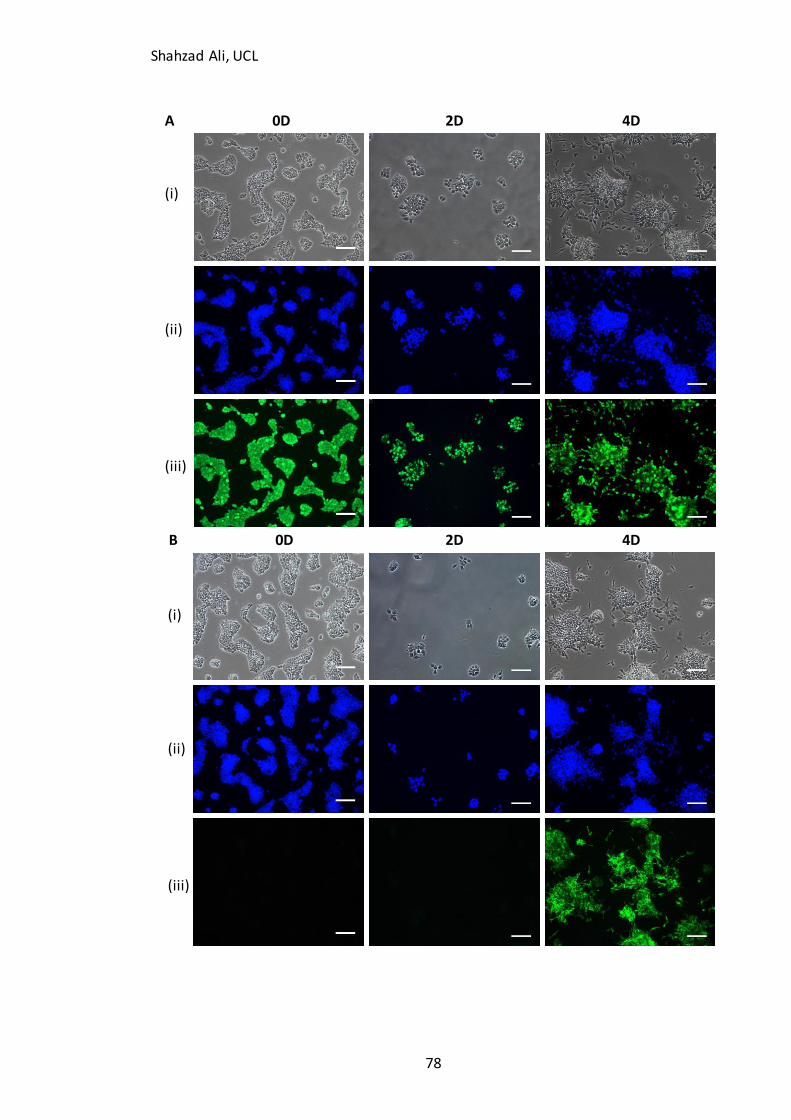
Shahzad Ali, UCL
78
A 0D 2D 4D
B 0D 2D 4D
(i)
(ii)
(iii)
(i)
(ii)
(iii)
Shahzad Ali, UCL
79
C 0D 2D 4D 6D
D 0D 2D 4D 6D
Figure 3.5: Time-lapse immunocytochemistry (ICC) analysis for validation of neuronal differentiation.
MESC’s were seeded on TCP in N2B27 medium and allowed to differentiate for four (A and B) or six days
(C and D). Four neuronal markers were tested: (A) A2B5 (B) Nestin (C) RC2 (D) -III Tubulin. (i) Phase
contrast. (ii) DAPI, a nuclear stain. (iii) ICC. All scale bars = 100 m.
(i)
(ii)
(iii)
(i)
(ii)
(iii)
Shahzad Ali, UCL
80
Nestin (Figure 3.5B) was a more robust indicator of neuronal differentiation. It was not
observed on any of the mESC’s at day zero. Similarly, no nestin-positive cells were
observed at day two of differentiation. At day four, however, as colonies began to
expand to form rosette-like morphologies, nestin appeared abundantly in cells. Nestin
formed filamentous internal structures. These filaments were particularly rich in parts
of the cell undergoing extension into neurites.
The nestin-positive neural precursors were similar in morphology and internal nestin
structures to the progenitors (Ying et al, 2003), neural stem cells (Conti et al, 2005;
Saha et al, 2008) and primary neuronal cultures (Previtera et al, 2013) seen in previous
studies. The wide range of cells that appear to contain nestin in literature reflects its
persistence during neuronal differentiation. Nestin begins to disappear in cultures
fairly late on during differentiation (Ying et al, 2003), making it an effective neural
precursor or immature neuronal marker.
In contrast to A2B5, the other glial marker, RC2 was not found on any of the colonies
(Figure 3.5C) after six days of differentiation. As with A2B5, a decision was made not to
use this marker as an indicator for mESC neuronal differentiation.
The final marker characterised was -III tubulin, which was used to isolate the time-
point at which immature neurons were formed from the neural precursors. As
observed in Figure 3.5D, -III tubulin did not appear in cells until later on in
differentiation. It appeared in cells at day six, as cells extend and branch out their
neurites within and between colonies of precursors. It appeared evenly within the
immature neuron bodies as well as their neurites. Cells positive for the marker
appeared to form networks between colonies. Whilst a large portion of mESC’s
became nestin-positive neural precursors at day four, a noticeably smaller fraction of
neural precursors form into -III tubulin positive neuronal cells at day six.
Shahzad Ali, UCL
81
3.5 Assay validation for flow cytometry and qPCR
3.5.1 PSA-NCAM negative control
Flow cytometry and quantitative polymerase chain reaction (qPCR) are two
techniques, which together provide a detailed understanding of the changes in cell
phenotype that occur during differentiation. Flow cytometry allows for quantification
of immunocytochemistry, by measuring the percentage of cells in a population positive
for a particular marker. Measurement of neural precursor marker expression in mESC’s
provided a negative control for differentiation studies as well as further characterizing
the starting population.
If the marker used for flow cytometry is a cell surface antigen marker, cells can be
analysed viable without fixation. Viable cells can be prepared for analysis with minimal
processing and wash stages. This allows for less cell losses during preparation and for a
more accurate representation of cell identity in culture than cells that are fixed in
paraformaldehyde for an extended period of time.
Most markers for neural precursors and neurons, such as -III tubulin and nestin, are
present within the cytoplasm and so require fixation (making them non-viable) and
permeabilisation in order to bind to their targets. However, PSA-NCAM (polysialic acid
neural cell adhesion molecule) is a neural adhesion marker expressed at the cell
surface, where it plays a role in neurogenesis and progenitor migration (Gago et al,
2003). Being expressed at the cell surface, fixation and permeabilisation are not
required and thus cells can be analysed whilst viable.
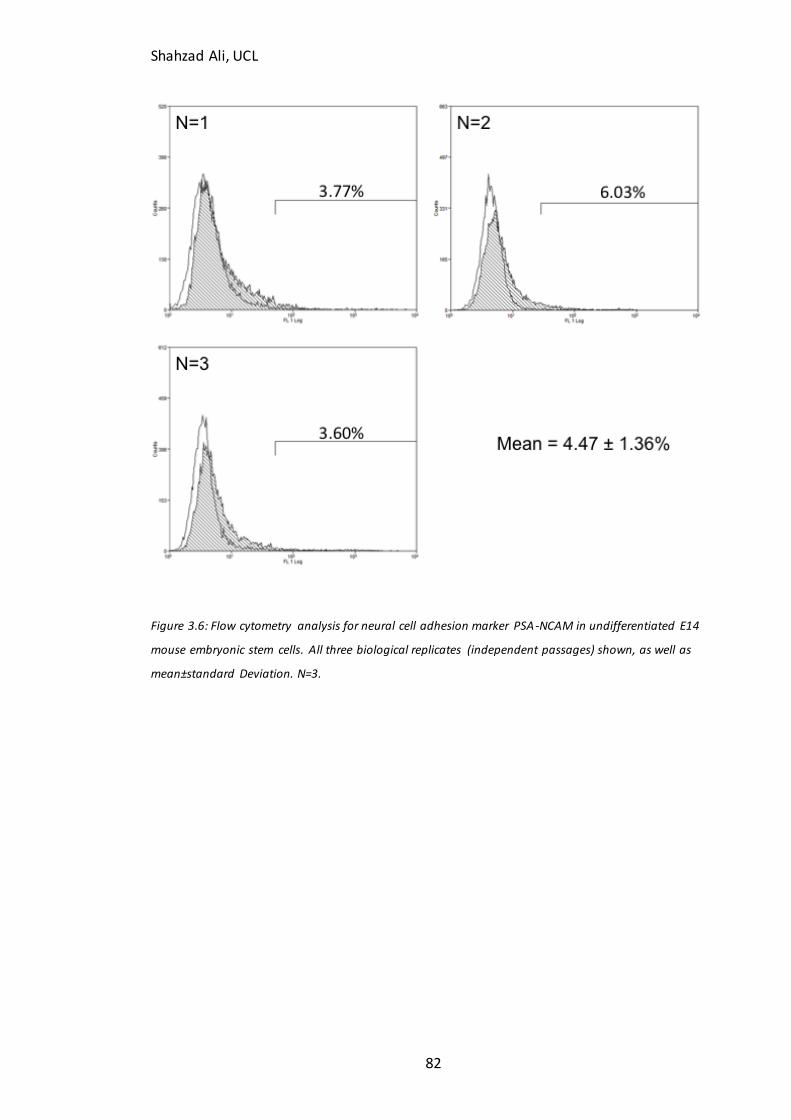
Shahzad Ali, UCL
82
Figure 3.6: Flow cytometry analysis for neural cell adhesion marker PSA-NCAM in undifferentiated E14
mouse embryonic stem cells. All three biological replicates (independent passages) shown, as well as
mean±standard Deviation. N=3.
Shahzad Ali, UCL
83
When flow cytometry was carried out on mESC’s (Figure 3.6), 4.47% of cells were
positive for PSA-NCAM. The vast majority (>95%) of cells were negative for the marker.
When considered along with the previous immunocytochemistry data, this confirmed
that the majority of cells within the starting population were undifferentiated mESC’s.
Any increase in the percentage of cells positive for PSA-NCAM above this value
indicated that neuronal differentiation is occurring. As with nestin, PSA-NCAM is
present extensively in both developing progenitors as well as more mature types (it is
found in the brain subventricular zone), and so is a useful marker for neuronal
populations across numerous identities and subtypes.
3.5.2 qPCR Internal Control Gene Selection
Quantitative PCR (qPCR) allows for real time quantification of gene expression in cells.
Expression of genes can be compared across a number of conditions to observe
phenotype changes at a cellular level. In order to compare expression across
conditions, expression has to be normalized to the cellular DNA content as well as an
internal control gene, whose expression will not vary significantly with a change in
phenotype.
The choice of internal control gene(s) varies between cell lines and conditions used. A
popular method used for deciding suitable internal control gene candidates was
devised by Vandesompele et al (2002). This method utilised the M-value, which is a
measure of stability for internal control genes. Higher M-values correspond to lower
degrees of stability. The M-value was measured for a host of candidate genes over
three samples of E14 mESC’s. What followed was an iterative process starting with the
removal of the internal control gene with the highest M-value. The M-values were
then re-measured and again the gene with the highest value was removed. This was
continued until the M-values of the remaining genes were under 0.7, which is the
value that appeared to eliminate the most variable and outlying genes in the data set
in the Vandesompele et al (2002) study.
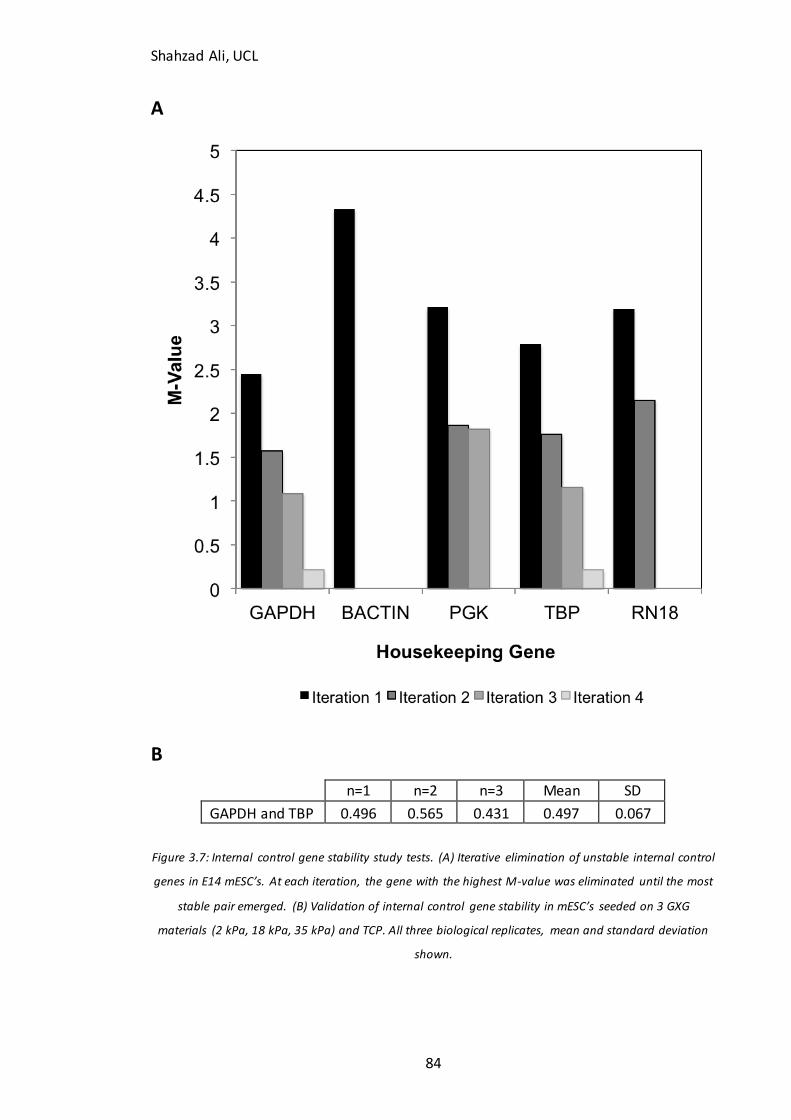
Shahzad Ali, UCL
84
A
B
n=1 n=2 n=3 Mean SD
GAPDH and TBP 0.496 0.565 0.431 0.497 0.067
Figure 3.7: Internal control gene stability study tests. (A) Iterative elimination of unstable internal control
genes in E14 mESC’s. At each iteration, the gene with the highest M-value was eliminated until the most
stable pair emerged. (B) Validation of internal control gene stability in mESC’s seeded on 3 GXG
materials (2 kPa, 18 kPa, 35 kPa) and TCP. All three biological replicates, mean and standard deviation
shown.
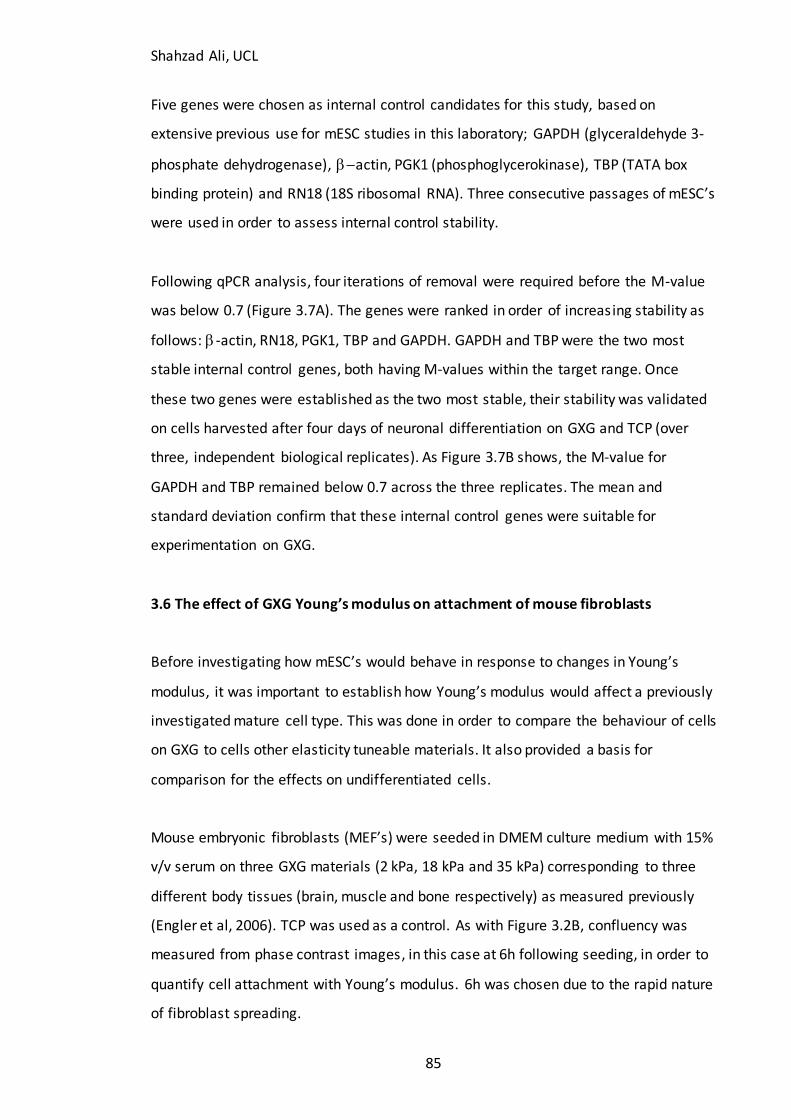
Shahzad Ali, UCL
85
Five genes were chosen as internal control candidates for this study, based on
extensive previous use for mESC studies in this laboratory; GAPDH (glyceraldehyde 3-
phosphate dehydrogenase), actin, PGK1 (phosphoglycerokinase), TBP (TATA box
binding protein) and RN18 (18S ribosomal RNA). Three consecutive passages of mESC’s
were used in order to assess internal control stability.
Following qPCR analysis, four iterations of removal were required before the M-value
was below 0.7 (Figure 3.7A). The genes were ranked in order of increasing stability as
follows: -actin, RN18, PGK1, TBP and GAPDH. GAPDH and TBP were the two most
stable internal control genes, both having M-values within the target range. Once
these two genes were established as the two most stable, their stability was validated
on cells harvested after four days of neuronal differentiation on GXG and TCP (over
three, independent biological replicates). As Figure 3.7B shows, the M-value for
GAPDH and TBP remained below 0.7 across the three replicates. The mean and
standard deviation confirm that these internal control genes were suitable for
experimentation on GXG.
3.6 The effect of GXG Young’s modulus on attachment of mouse fibroblasts
Before investigating how mESC’s would behave in response to changes in Young’s
modulus, it was important to establish how Young’s modulus would affect a previously
investigated mature cell type. This was done in order to compare the behaviour of cells
on GXG to cells other elasticity tuneable materials. It also provided a basis for
comparison for the effects on undifferentiated cells.
Mouse embryonic fibroblasts (MEF’s) were seeded in DMEM culture medium with 15%
v/v serum on three GXG materials (2 kPa, 18 kPa and 35 kPa) corresponding to three
different body tissues (brain, muscle and bone respectively) as measured previously
(Engler et al, 2006). TCP was used as a control. As with Figure 3.2B, confluency was
measured from phase contrast images, in this case at 6h following seeding, in order to
quantify cell attachment with Young’s modulus. 6h was chosen due to the rapid nature
of fibroblast spreading.
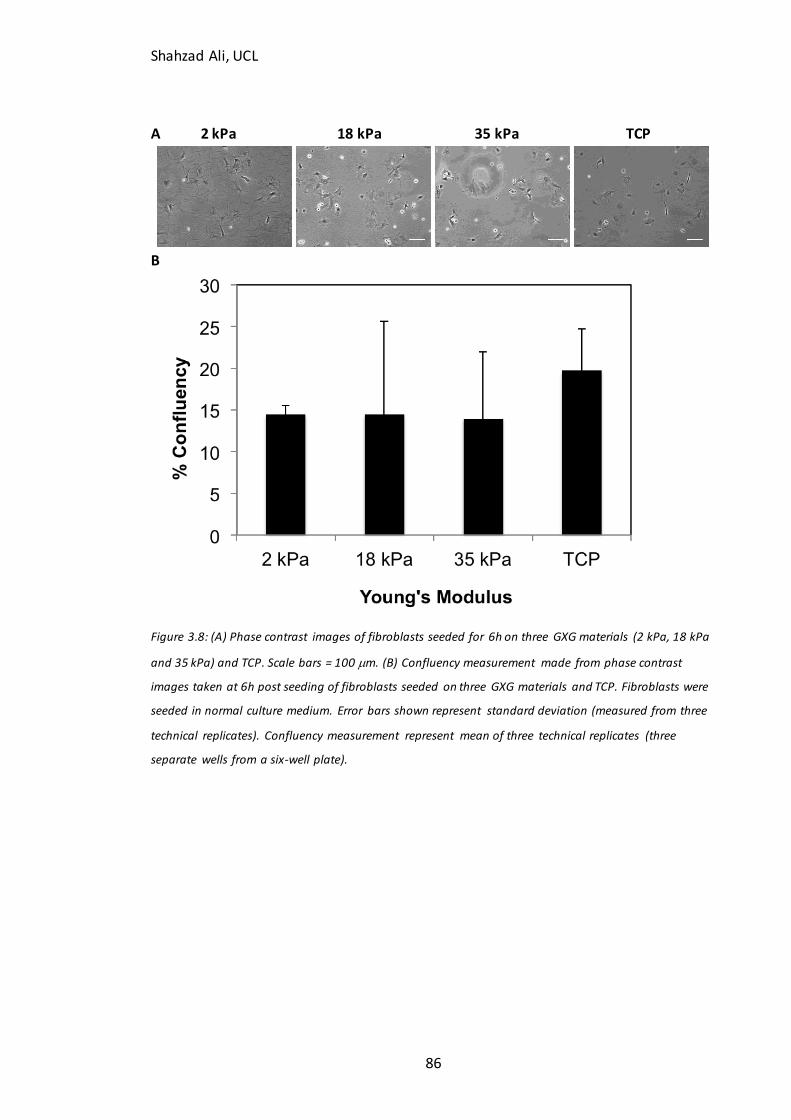
Shahzad Ali, UCL
86
A 2 kPa 18 kPa 35 kPa TCP
B
Figure 3.8: (A) Phase contrast images of fibroblasts seeded for 6h on three GXG materials (2 kPa, 18 kPa
and 35 kPa) and TCP. Scale bars = 100 m. (B) Confluency measurement made from phase contrast
images taken at 6h post seeding of fibroblasts seeded on three GXG materials and TCP. Fibroblasts were
seeded in normal culture medium. Error bars shown represent standard deviation (measured from three
technical replicates). Confluency measurement represent mean of three technical replicates (three
separate wells from a six-well plate).
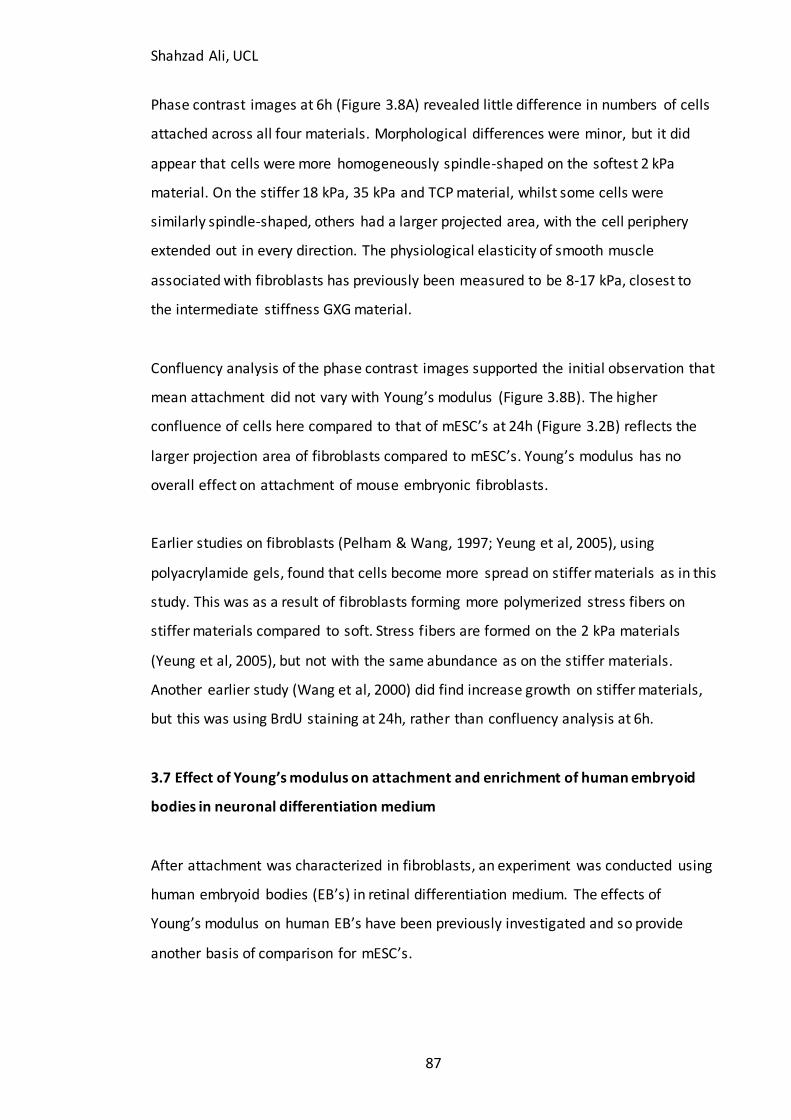
Shahzad Ali, UCL
87
Phase contrast images at 6h (Figure 3.8A) revealed little difference in numbers of cells
attached across all four materials. Morphological differences were minor, but it did
appear that cells were more homogeneously spindle-shaped on the softest 2 kPa
material. On the stiffer 18 kPa, 35 kPa and TCP material, whilst some cells were
similarly spindle-shaped, others had a larger projected area, with the cell periphery
extended out in every direction. The physiological elasticity of smooth muscle
associated with fibroblasts has previously been measured to be 8-17 kPa, closest to
the intermediate stiffness GXG material.
Confluency analysis of the phase contrast images supported the initial observation that
mean attachment did not vary with Young’s modulus (Figure 3.8B). The higher
confluence of cells here compared to that of mESC’s at 24h (Figure 3.2B) reflects the
larger projection area of fibroblasts compared to mESC’s. Young’s modulus has no
overall effect on attachment of mouse embryonic fibroblasts.
Earlier studies on fibroblasts (Pelham & Wang, 1997; Yeung et al, 2005), using
polyacrylamide gels, found that cells become more spread on stiffer materials as in this
study. This was as a result of fibroblasts forming more polymerized stress fibers on
stiffer materials compared to soft. Stress fibers are formed on the 2 kPa materials
(Yeung et al, 2005), but not with the same abundance as on the stiffer materials.
Another earlier study (Wang et al, 2000) did find increase growth on stiffer materials,
but this was using BrdU staining at 24h, rather than confluency analysis at 6h.
3.7 Effect of Young’s modulus on attachment and enrichment of human embryoid
bodies in neuronal differentiation medium
After attachment was characterized in fibroblasts, an experiment was conducted using
human embryoid bodies (EB’s) in retinal differentiation medium. The effects of
Young’s modulus on human EB’s have been previously investigated and so provide
another basis of comparison for mESC’s.
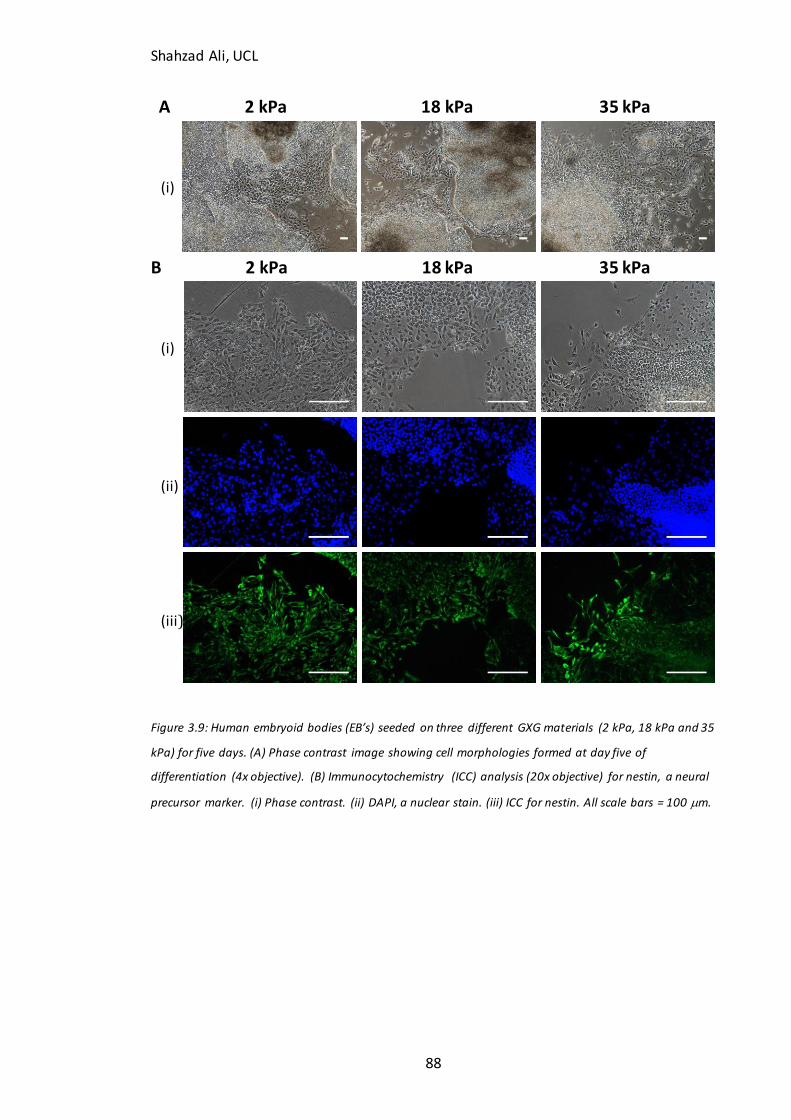
Shahzad Ali, UCL
88
A 2 kPa 18 kPa 35 kPa
B 2 kPa 18 kPa 35 kPa
Figure 3.9: Human embryoid bodies (EB’s) seeded on three different GXG materials (2 kPa, 18 kPa and 35
kPa) for five days. (A) Phase contrast image showing cell morphologies formed at day five of
differentiation (4x objective). (B) Immunocytochemistry (ICC) analysis (20x objective) for nestin, a neural
precursor marker. (i) Phase contrast. (ii) DAPI, a nuclear stain. (iii) ICC for nestin. All scale bars = 100 m.
(i)
(i)
(ii)
(iii)
Shahzad Ali, UCL
89
Human EB’s were plated in medium promoting retinal differentiation (Bae,D. et al,
2012). Like the differentiating mESC’s, these cells become nestin-positive roughly four
or five days into differentiation. The human EB’s were plated onto the 3 GXG materials
(2 kPa, 18 kPa and 35 kPa) and allowed to differentiate for five days. Phase contrast
images were obtained at this time-point (Figure 3.9A). Cells were then fixed and
immunocytochemistry analysis was performed for nestin (Figure 9B).
Cells rapidly expanded to form very dense aggregates covering much of the surface of
the plates at day five (Figure 3.9A). The final confluency was considerably higher on
the 2 kPa and 18 kPa materials (almost fully confluent) when compared to the 35 kPa
material, where these dense aggregates were smaller. At the periphery of these
aggregates, cells extended out to form rosette-like morphologies. Whilst the dense,
aggregates were smaller on the 35 kPa material compared to the 2 kPa and 18 kPa
materials, there were similar numbers of cells within the less dense, rosette-like
colonies.
When immunocytochemistry was performed, these rosette-like colonies were
abundant in nestin when compared to the denser aggregates, as expected (Figure
3.9B). However, as there are less dense aggregates compared to nestin-positive
precursors on the stiff material the conclusion was made that a higher proportion of
cells were nestin-positive on the stiffer material compared to softer materials. This is
despite there being similar numbers of nestin-positive cells overall on all materials.
This is consistent with previous work using mouse EB’s undergoing neuronal
differentiation in three-dimensional culture (Kothapalli et al, 2013), where the
percentage of cells undergoing neuronal differentiation increased with Young’s
modulus. However, separating the effects of Young’s modulus from cell-to-cell
interactions becomes difficult at the levels of cell density observed in EB studies.
Shahzad Ali, UCL
90
3.8: Effect of Young’s modulus on mESC attachment and expansion in normal
pluripotent growth medium and undirected differentiation medium
Before investigating the effects of Young’s modulus on mESC attachment in N2B27
medium, it was important to isolate the cooperative effects from the soluble
microenvironment. MESC’s were seeded in two media; GMEM with LIF, which is
normal maintenance medium (containing 10% v/v serum) containing the pluripotency
promoting agent LIF; and GMEM without LIF, which is maintenance medium that does
not contain LIF. The former medium was used to maintain cells in a pluripotent state in
vitro. The latter medium was used to allow cells to spontaneously differentiate.
3.8.1 Effect of Young’s modulus on mESC attachment and expansion in normal
pluripotent growth medium
MESC’s were harvested and seeded in GMEM with LIF at a seeding density of 1 x 10⁴
cells/cm2 in order to directly compare attachment and expansion with N2B27 neuronal
differentiation medium. Cells were seeded onto three GXG materials (2 kPa, 18 kPa
and 35 kPa) and TCP. Confluency was then measured from phase contrast images
obtained at 24h and 72h following seeding. The 24h time-point was used to quantify
cell attachment, whilst the 72h time-point was used to quantify differences in
expansion of cells with Young’s modulus.
At 24h, attachment was maximized on the softest, 2 kPa GXG material (Figure 3.10A).
Attachment decreased significantly (p<0.005) by 59% on the 18 kPa material and 94%
(p<0.001) on the 35 kPa material. Attachment was however 39% lower (p<0.005) on
the 2 kPa material compared to the TCP.
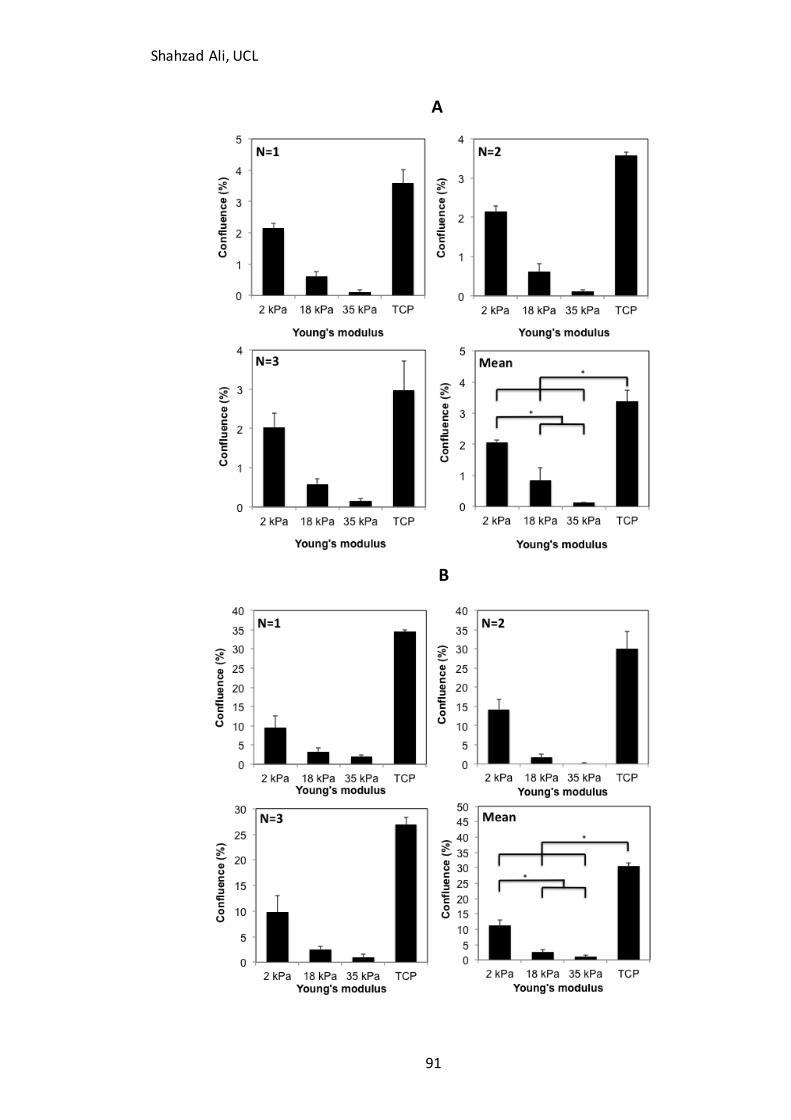
Shahzad Ali, UCL
91
A
B
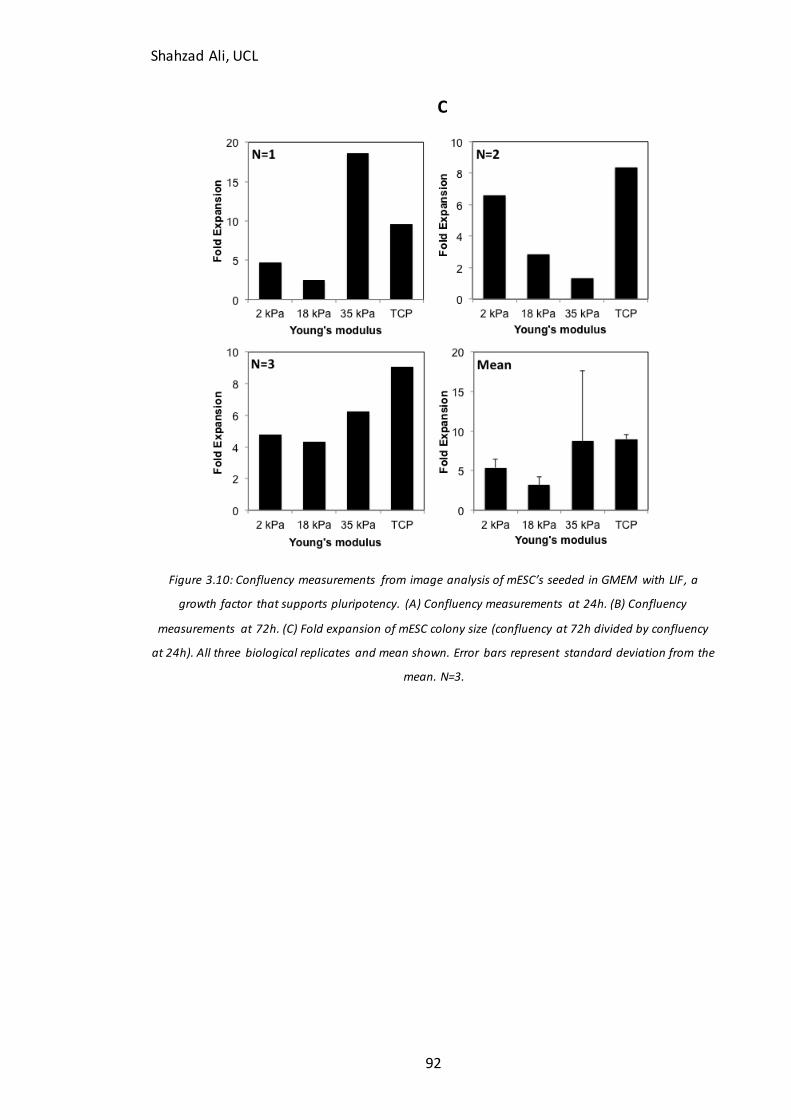
Shahzad Ali, UCL
92
C
Figure 3.10: Confluency measurements from image analysis of mESC’s seeded in GMEM with LIF , a
growth factor that supports pluripotency. (A) Confluency measurements at 24h. (B) Confluency
measurements at 72h. (C) Fold expansion of mESC colony size (confluency at 72h divided by confluency
at 24h). All three biological replicates and mean shown. Error bars represent standard deviation from the
mean. N=3.
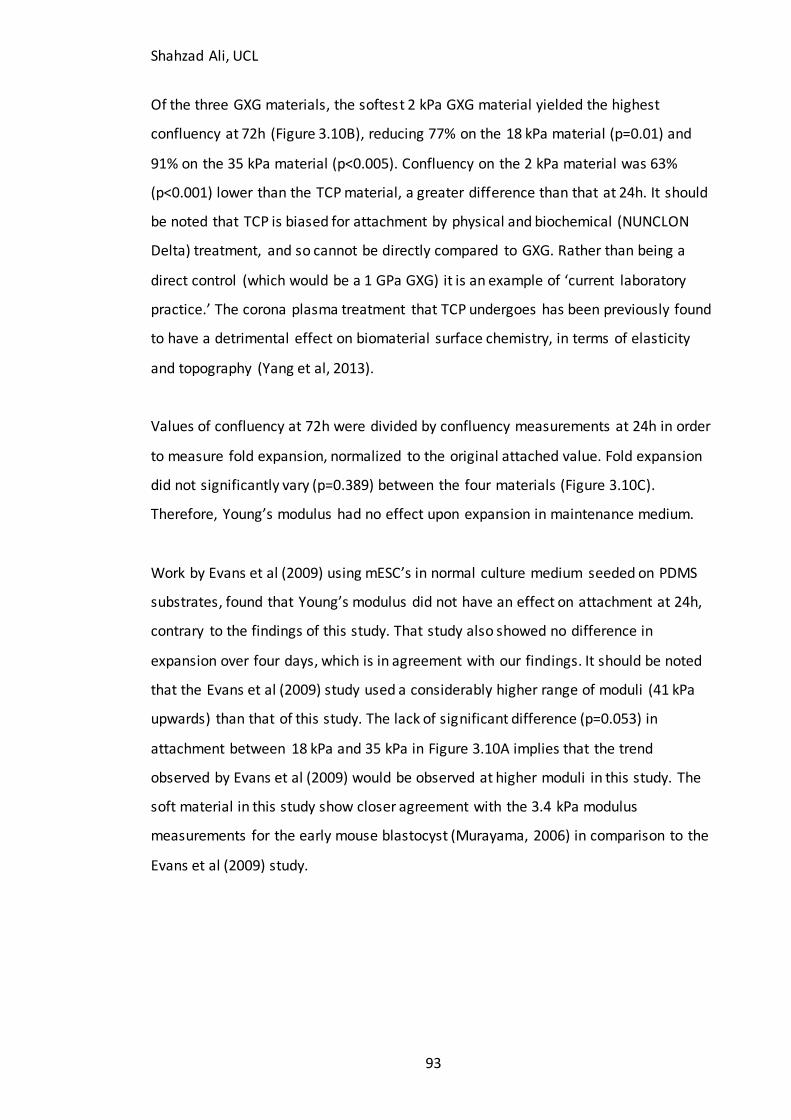
Shahzad Ali, UCL
93
Of the three GXG materials, the softest 2 kPa GXG material yielded the highest
confluency at 72h (Figure 3.10B), reducing 77% on the 18 kPa material (p=0.01) and
91% on the 35 kPa material (p<0.005). Confluency on the 2 kPa material was 63%
(p<0.001) lower than the TCP material, a greater difference than that at 24h. It should
be noted that TCP is biased for attachment by physical and biochemical (NUNCLON
Delta) treatment, and so cannot be directly compared to GXG. Rather than being a
direct control (which would be a 1 GPa GXG) it is an example of ‘current laboratory
practice.’ The corona plasma treatment that TCP undergoes has been previously found
to have a detrimental effect on biomaterial surface chemistry, in terms of elasticity
and topography (Yang et al, 2013).
Values of confluency at 72h were divided by confluency measurements at 24h in order
to measure fold expansion, normalized to the original attached value. Fold expansion
did not significantly vary (p=0.389) between the four materials (Figure 3.10C).
Therefore, Young’s modulus had no effect upon expansion in maintenance medium.
Work by Evans et al (2009) using mESC’s in normal culture medium seeded on PDMS
substrates, found that Young’s modulus did not have an effect on attachment at 24h,
contrary to the findings of this study. That study also showed no difference in
expansion over four days, which is in agreement with our findings. It should be noted
that the Evans et al (2009) study used a considerably higher range of moduli (41 kPa
upwards) than that of this study. The lack of significant difference (p=0.053) in
attachment between 18 kPa and 35 kPa in Figure 3.10A implies that the trend
observed by Evans et al (2009) would be observed at higher moduli in this study. The
soft material in this study show closer agreement with the 3.4 kPa modulus
measurements for the early mouse blastocyst (Murayama, 2006) in comparison to the
Evans et al (2009) study.
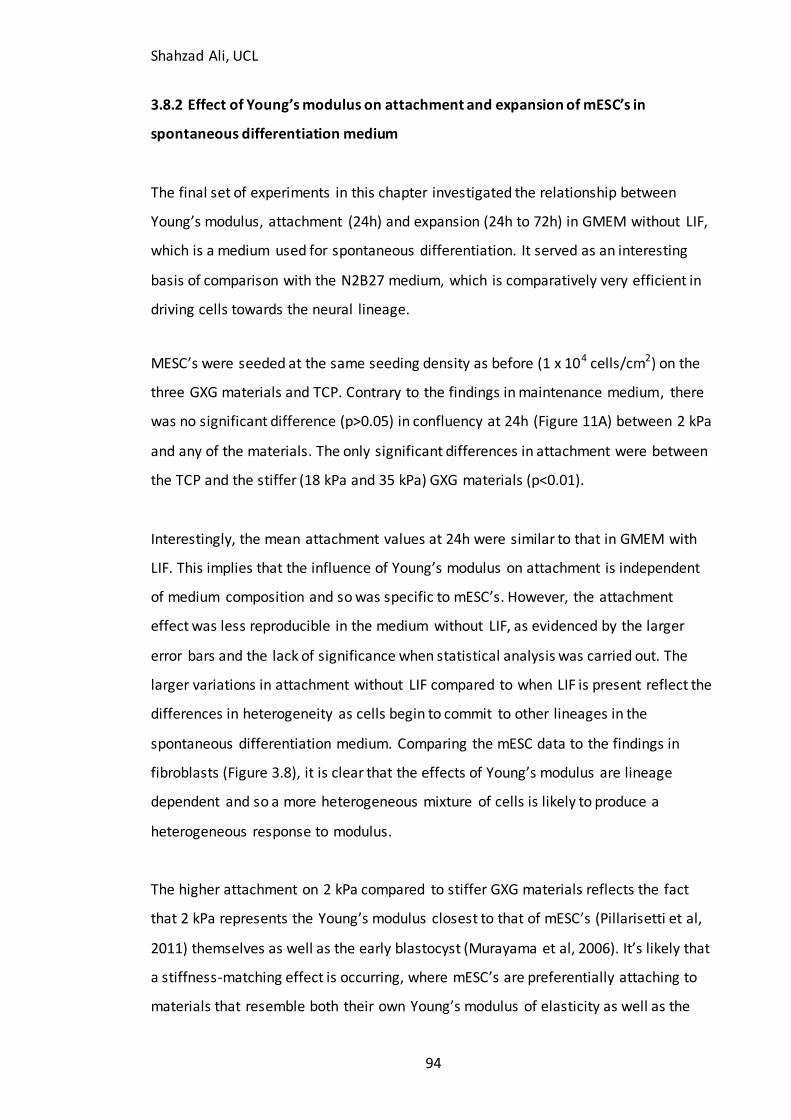
Shahzad Ali, UCL
94
3.8.2 Effect of Young’s modulus on attachment and expansion of mESC’s in
spontaneous differentiation medium
The final set of experiments in this chapter investigated the relationship between
Young’s modulus, attachment (24h) and expansion (24h to 72h) in GMEM without LIF,
which is a medium used for spontaneous differentiation. It served as an interesting
basis of comparison with the N2B27 medium, which is comparatively very efficient in
driving cells towards the neural lineage.
MESC’s were seeded at the same seeding density as before (1 x 10⁴ cells/cm2) on the
three GXG materials and TCP. Contrary to the findings in maintenance medium, there
was no significant difference (p>0.05) in confluency at 24h (Figure 11A) between 2 kPa
and any of the materials. The only significant differences in attachment were between
the TCP and the stiffer (18 kPa and 35 kPa) GXG materials (p<0.01).
Interestingly, the mean attachment values at 24h were similar to that in GMEM with
LIF. This implies that the influence of Young’s modulus on attachment is independent
of medium composition and so was specific to mESC’s. However, the attachment
effect was less reproducible in the medium without LIF, as evidenced by the larger
error bars and the lack of significance when statistical analysis was carried out. The
larger variations in attachment without LIF compared to when LIF is present reflect the
differences in heterogeneity as cells begin to commit to other lineages in the
spontaneous differentiation medium. Comparing the mESC data to the findings in
fibroblasts (Figure 3.8), it is clear that the effects of Young’s modulus are lineage
dependent and so a more heterogeneous mixture of cells is likely to produce a
heterogeneous response to modulus.
The higher attachment on 2 kPa compared to stiffer GXG materials reflects the fact
that 2 kPa represents the Young’s modulus closest to that of mESC’s (Pillarisetti et al,
2011) themselves as well as the early blastocyst (Murayama et al, 2006). It’s likely that
a stiffness-matching effect is occurring, where mESC’s are preferentially attaching to
materials that resemble both their own Young’s modulus of elasticity as well as the
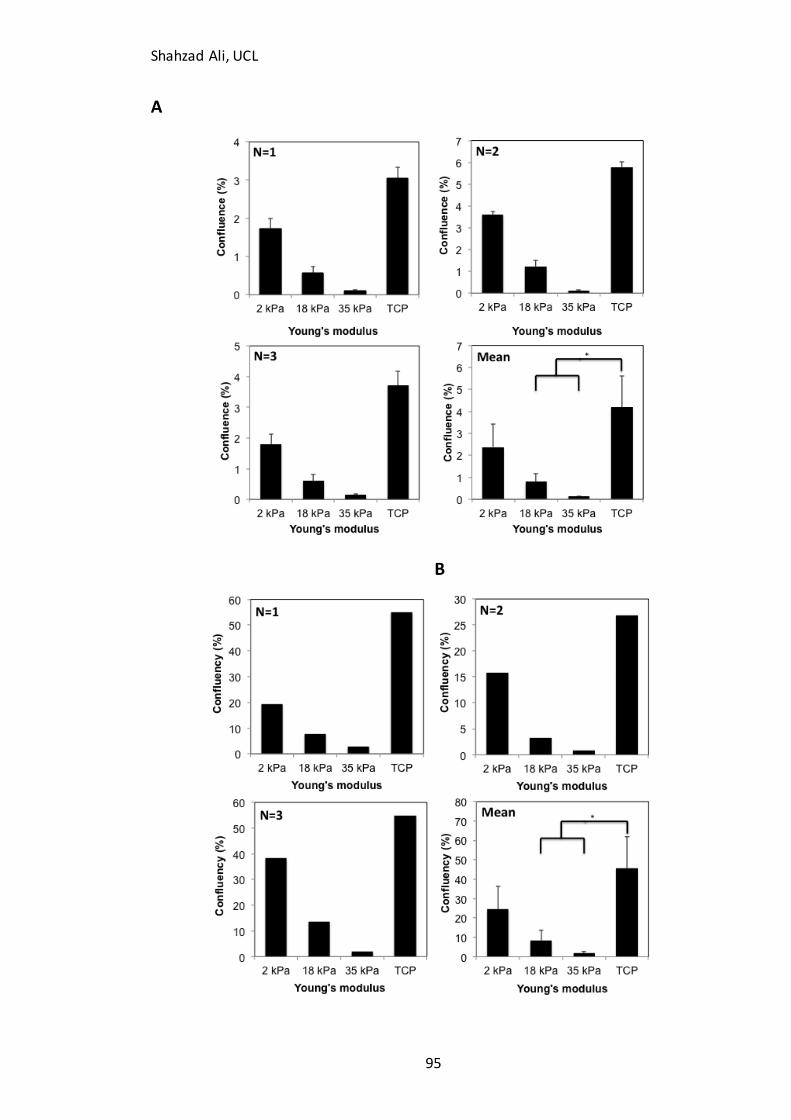
Shahzad Ali, UCL
95
A
B
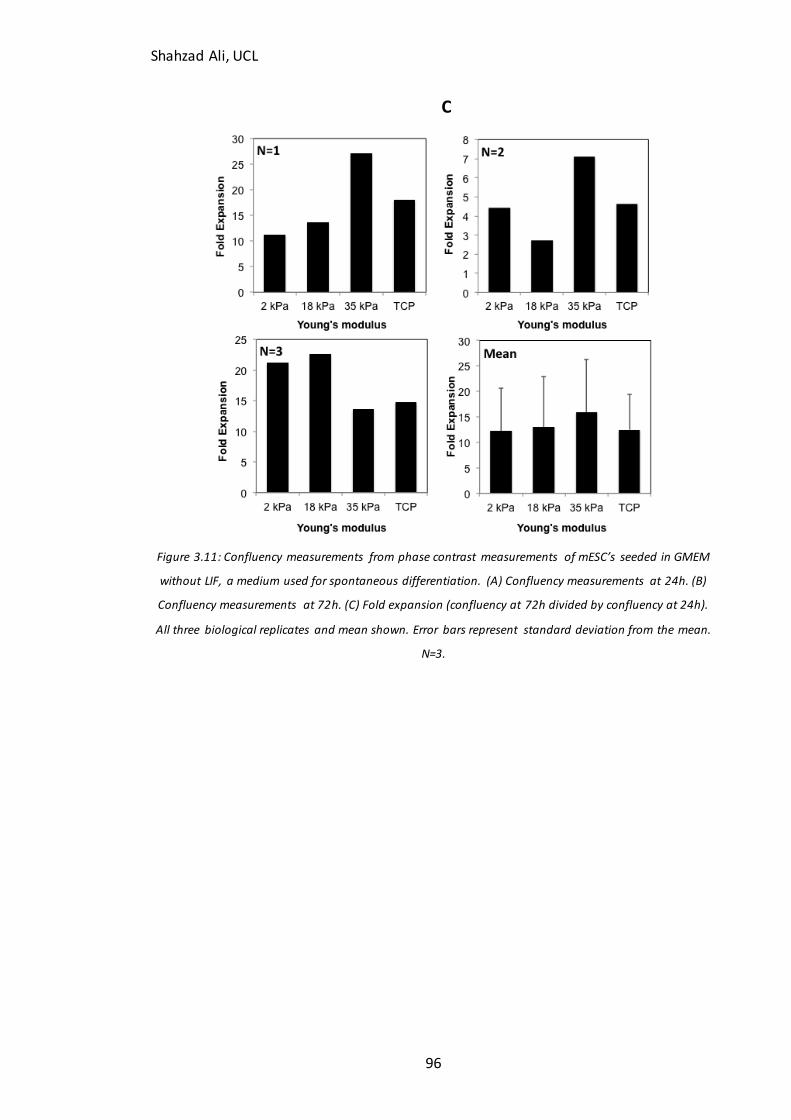
Shahzad Ali, UCL
96
C
Figure 3.11: Confluency measurements from phase contrast measurements of mESC’s seeded in GMEM
without LIF, a medium used for spontaneous differentiation. (A) Confluency measurements at 24h. (B)
Confluency measurements at 72h. (C) Fold expansion (confluency at 72h divided by confluency at 24h).
All three biological replicates and mean shown. Error bars represent standard deviation from the mean.
N=3.
Shahzad Ali, UCL
97
elasticity of their equivalent native tissue. It should be noted that ES cells only exist in
in vitro culture, and so some degree of adaptation to these conditions must occur.
The same pattern emerged at 72h as at 24h (Figure 11B). There was no significant
(p>0.05) difference in attachment between the softest 2 kPa material and any of the
other materials. The fold expansion did not vary significantly (p>0.05) with Young’s
modulus either (Figure 11C). The larger error bars in comparison to the maintenance
medium again likely reflect heterogeneity in cell commitment brought about by the
spontaneous differentiation medium.
3.9 Summary of Findings
In order to investigate the effect of Young’s modulus on neuronal differentiation of
mESC’s, a number of set conditions would be required. These conditions were
validated by the results shown in this chapter. MESC’s would be seeded in N2B27
formulated in-house, containing 1% v/v serum at a seeding density of 1 x 10⁴ cells/cm2.
To compare the formation of neural precursors and neurons on different materials,
nestin, PSA-NCAM and -III tubulin were chosen as markers for neuronal
differentiation. For qPCR, GAPDH and TBP were chosen as internal control genes due
to their sustainably low M-values.
Attachment of mESC’s in medium containing LIF (ideal for self-renewal) decreased with
increasing GXG Young’s modulus. When other cell types were seeded on varying
Young’s moduli, it was found that material elasticity did not impact the attachment of
fibroblasts and human EB’s. When mESC’s were seeded in medium without LIF (where
spontaneous differentiation is likely to occur), there was no impact of Young’s modulus
on differentiation.
Shahzad Ali, UCL
98
4 Does Young’s modulus affect attachment and enrichment of mouse
embryonic stem cells undergoing neuronal differentiation?
4.1 Aims
After protocols were established for differentiating mouse embryonic stem cells
(mESC’s) robustly on GXG, the next stage was to investigate how the neuronal
differentiation of mESC’s was affected by Young’s modulus. In Chapter 3, when mESC’s
were seeded in normal culture medium, there was a dramatic increase in attachment
on soft materials compared to stiffer materials. This was however not accompanied by
a change in self-renewal with modulus.
Earlier studies using primary neural precursors (Georges et al, 2006; Jiang et al, 2007;
Previtera et al, 2010) have shown that there is no change in attachment with modulus
in mature cells. This was also demonstrated in Chapter 3.8 of this study, where mouse
embryonic fibroblasts were seeded in normal culture medium (with a similar serum
content to the culture medium used for mESC’s) on varying GXG Young’s moduli. This
implies that the effect of Young’s modulus on attachment changes as cells mature.
Furthermore, it has also been previously demonstrated that soft materials favour the
neuronal differentiation of mesenchymal stem cells (Engler et al, 2006) as well as
neural stem cells (Saha et al, 2008). Therefore, the hypothesis under study in this
chapter was that increased neural precursor formation from mESC’s on soft materials
in neuronal differentiation medium is due to favourable attachment.
The first test for this hypothesis was to look at how elasticity affected the initial
attachment and expansion of cells. This was followed by an analysis of cell morphology
and phenotype at day four of differentiation. By finding out whether Young’s modulus
directly impacts the phenotype of cells formed, it could be understood whether any
increase in neural precursor formation was due to favourable initial attachment, or
due to a direct promotion of the neuronal fate. The final set of experiments in this
chapter investigated whether the effect of Young’s modulus on initial attachment was
Shahzad Ali, UCL
99
dependent on stress fibre stabilization and/or microtubule formation, in order to
derive an underlying mechanism for any effect on attachment.
4.2 Does Young’s modulus influence attachment and early expansion of mESC’S?
4.2.1 Does Young’s modulus influence attachment of mESC’s in neuronal
differentiation medium?
It was established in the previous chapter that soft materials promoted initial
attachment of mESC’s in normal maintenance medium. This effect was not
reproducible in spontaneous differentiation medium. In order to assess the effect of
Young’s modulus on attachment in neuronal differentiation conditions, mESC’s were
seeded onto three different GXG Young’s moduli, corresponding with the brain (2 kPa),
muscle (18 kPa) and bone (35 kPa) as well as gelatin-coated tissue culture polystyrene
(TCP), in N2B27 medium with 1% v/v serum (as characterised in Chapter 3). When
confluence was measured at 24h, it was found that amongst the GXG materials,
attachment was maximized on the softest 2 kPa substrate (Figure 4.1A), whose
Young’s modulus corresponded with that of mESC’s (Pillarisetti et al, 2011), brain
(Engler et al, 2006) and early mouse blastocysts (Murayama et al, 2006). Compared to
the 2 kPa material, confluency decreased 76% (p=0.056) on the 18 kPa material and
95% on the 35 kPa material (Figure 4.1B).
This favorability of attachment on physiological Young’s moduli is consistent with the
findings of other studies using mature cell types, such as fibroblasts (Pelham & Wang,
1997; Yeung et al, 2005) and osteoblasts (Gonzalez et al, 2012) where adhesion tends
to increase on physiologically elastic materials. It does however contrast with previous
findings using mouse (Evans et al, 2009) and hESC’s (Eroshenko et al, 2013), where
attachment did not vary with Young’s modulus. It should be noted that these studies
were carried out in expansion medium on material elasticities varying from 40 kPa to 3
MPa, significantly higher than this study. On GXG, attachment did not significantly
(p=0.854) vary with an increase in Young’s modulus from 18 kPa to 35 kPa (Figure
4.1B), suggesting that similar outcomes would result in this study.
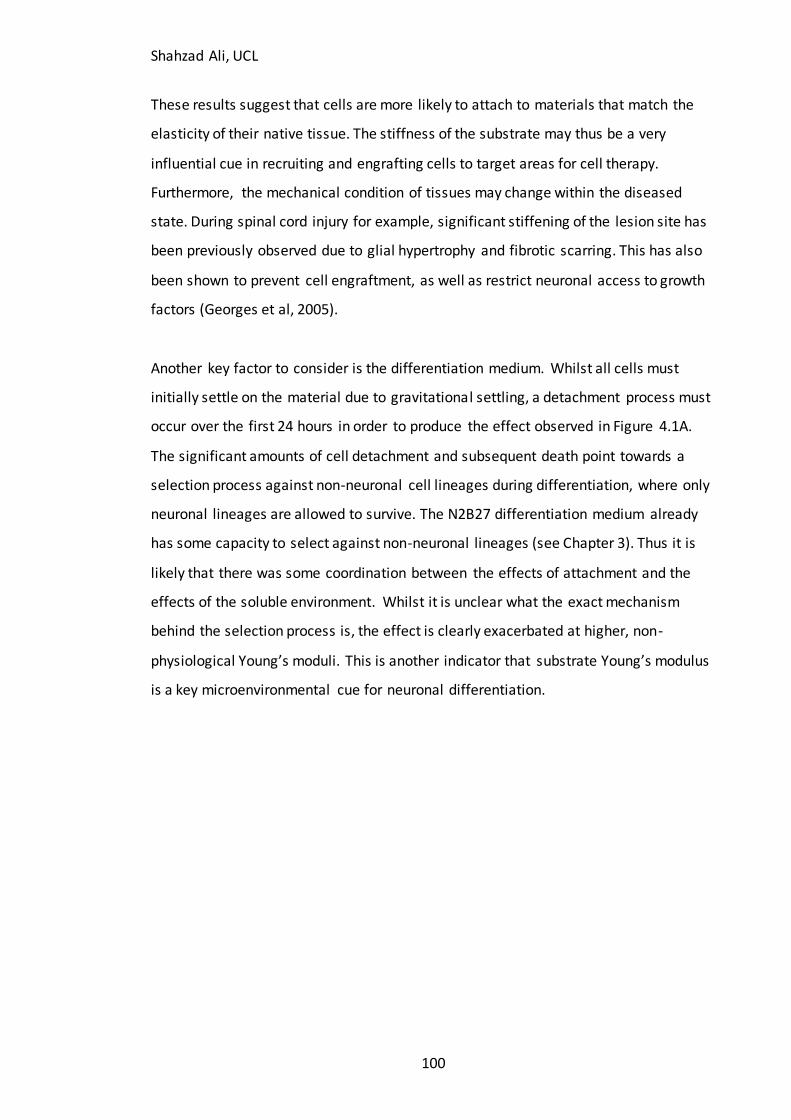
Shahzad Ali, UCL
100
These results suggest that cells are more likely to attach to materials that match the
elasticity of their native tissue. The stiffness of the substrate may thus be a very
influential cue in recruiting and engrafting cells to target areas for cell therapy.
Furthermore, the mechanical condition of tissues may change within the diseased
state. During spinal cord injury for example, significant stiffening of the lesion site has
been previously observed due to glial hypertrophy and fibrotic scarring. This has also
been shown to prevent cell engraftment, as well as restrict neuronal access to growth
factors (Georges et al, 2005).
Another key factor to consider is the differentiation medium. Whilst all cells must
initially settle on the material due to gravitational settling, a detachment process must
occur over the first 24 hours in order to produce the effect observed in Figure 4.1A.
The significant amounts of cell detachment and subsequent death point towards a
selection process against non-neuronal cell lineages during differentiation, where only
neuronal lineages are allowed to survive. The N2B27 differentiation medium already
has some capacity to select against non-neuronal lineages (see Chapter 3). Thus it is
likely that there was some coordination between the effects of attachment and the
effects of the soluble environment. Whilst it is unclear what the exact mechanism
behind the selection process is, the effect is clearly exacerbated at higher, non-
physiological Young’s moduli. This is another indicator that substrate Young’s modulus
is a key microenvironmental cue for neuronal differentiation.
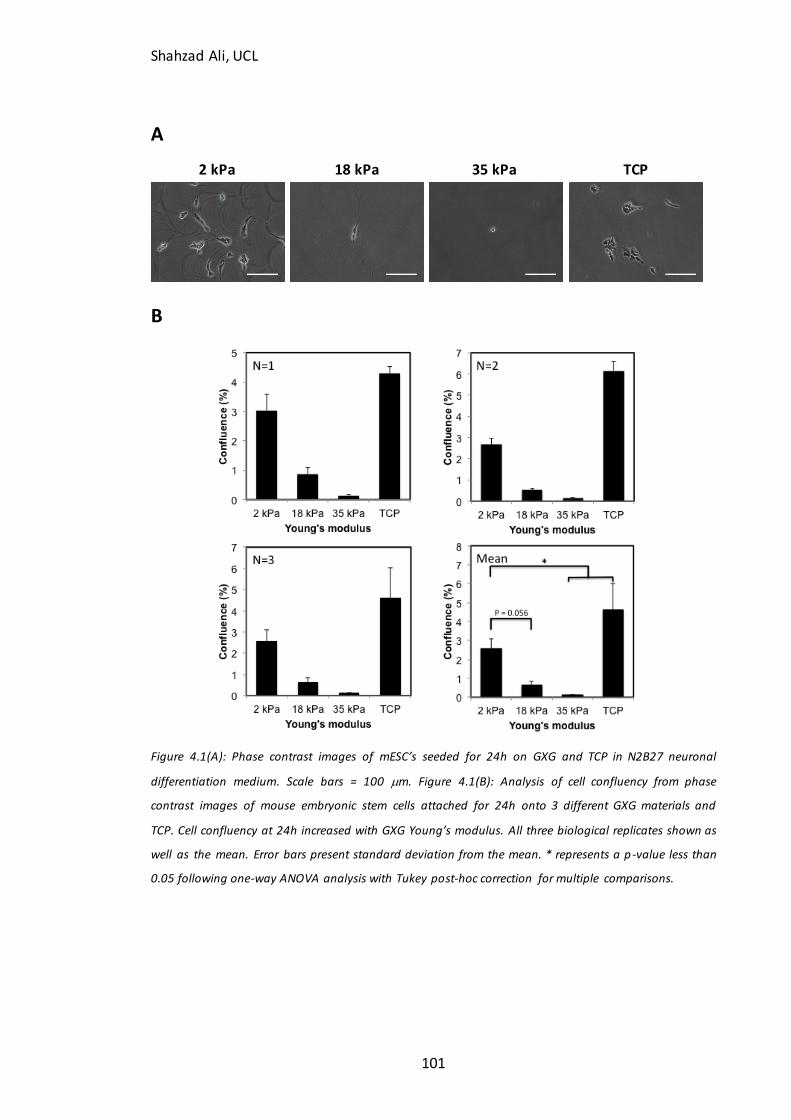
Shahzad Ali, UCL
101
A
2 kPa 18 kPa 35 kPa TCP
B
Figure 4.1(A): Phase contrast images of mESC’s seeded for 24h on GXG and TCP in N2B27 neuronal
differentiation medium. Scale bars = 100 m. Figure 4.1(B): Analysis of cell confluency from phase
contrast images of mouse embryonic stem cells attached for 24h onto 3 different GXG materials and
TCP. Cell confluency at 24h increased with GXG Young’s modulus. All three biological replicates shown as
well as the mean. Error bars present standard deviation from the mean. * represents a p-value less than
0.05 following one-way ANOVA analysis with Tukey post-hoc correction for multiple comparisons.

Shahzad Ali, UCL
102
D
Figure 4.1(D) Analysis of cell concentration from phase contrast images of mouse embryonic stem cells
attached for 24h onto 3 different GXG materials and TCP. Cell concentration at 24h decreased with GXG
Young’s modulus. Values shows are mean from three cell counts. Error bars present standard deviation
from the mean. * represents a p-value less than 0.05 following one-way ANOVA analysis with Tukey
post-hoc correction for multiple comparisons.
Shahzad Ali, UCL
103
4.2.2 Does Young’s modulus influence expansion of mESC’s in neuronal
differentiation medium?
Confluency was measured at 72h (post-seeding) to assess whether, following the initial
attachment at 24h, there was any effect of Young’s modulus on expansion of neuronal
precursor colonies. As seen in Figure 4.2A, the confluency pattern observed at 24h was
conserved at 72h. In this case, confluency decreased 81% on the 18 kPa material and
93% on the 35 kPa material, when compared to the 2 kPa GXG material.
Confluency was highest on the softest substrate, whose modulus corresponds to that
of embryonic stem cells, brain and early mouse blastocysts. When 72h confluency was
compared to that of 24h confluency, the resulting ‘fold expansion’ did not vary with
Young’s modulus (Figure 4.2B). This is consistent with other studies, using both mESC’s
and human ES cells. Candiello et al (2013) showed that proliferation of mESC’s
(measured by Alamar Blue assay) did not vary with alginate gel stiffness. A study using
human ES cells (Keung et al, 2010) also failed to find any difference in proliferation
between varying elasticities of polyacrylamide gels. In a recent study by Eroshenko et
al (2013), initial proliferation did not vary on any of the materials studied, including
variable elasticity PDMS substrates, feeder cells or fibronectin-coated tissue culture
polystyrene. It should be noted that the other studies all used normal expansion
medium (typically minimum eagles medium with upwards of 10% serum) as opposed
to neuronal differentiation medium, which is not specifically designed for proliferation.
It was concluded that Young’s modulus had no effect upon proliferation or expansion
of mESC colonies in neuronal differentiation medium. The increase in confluency after
three days of differentiation was exclusively due to increased initial attachment over
the first 24h on the physiologically soft GXG material (Figure 4.1).
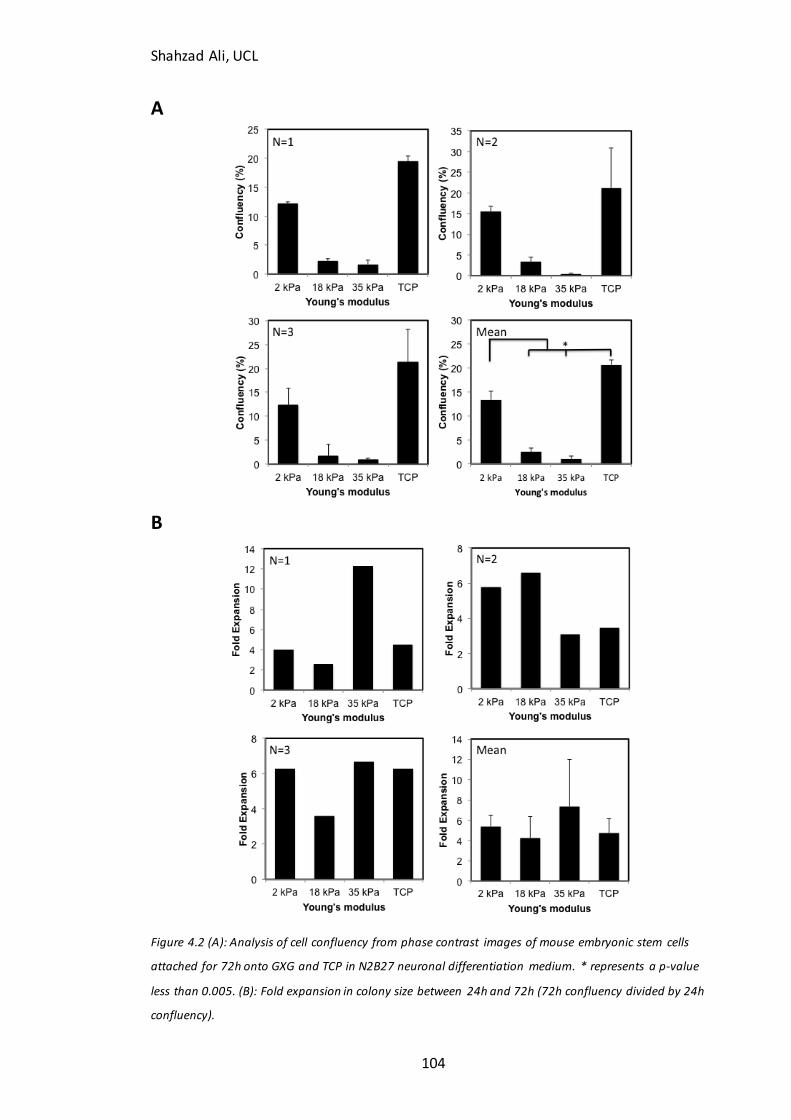
Shahzad Ali, UCL
104
A
B
Figure 4.2 (A): Analysis of cell confluency from phase contrast images of mouse embryonic stem cells
attached for 72h onto GXG and TCP in N2B27 neuronal differentiation medium. * represents a p-value
less than 0.005. (B): Fold expansion in colony size between 24h and 72h (72h confluency divided by 24h
confluency).
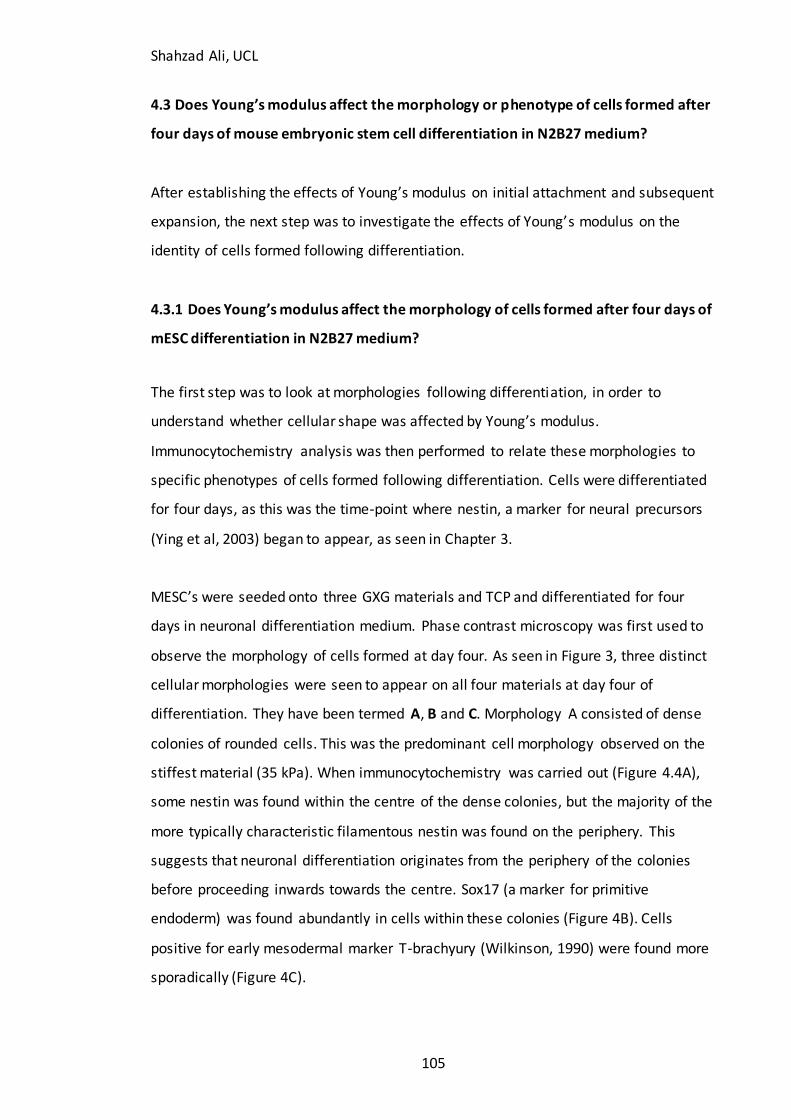
Shahzad Ali, UCL
105
4.3 Does Young’s modulus affect the morphology or phenotype of cells formed after
four days of mouse embryonic stem cell differentiation in N2B27 medium?
After establishing the effects of Young’s modulus on initial attachment and subsequent
expansion, the next step was to investigate the effects of Young’s modulus on the
identity of cells formed following differentiation.
4.3.1 Does Young’s modulus affect the morphology of cells formed after four days of
mESC differentiation in N2B27 medium?
The first step was to look at morphologies following differentiation, in order to
understand whether cellular shape was affected by Young’s modulus.
Immunocytochemistry analysis was then performed to relate these morphologies to
specific phenotypes of cells formed following differentiation. Cells were differentiated
for four days, as this was the time-point where nestin, a marker for neural precursors
(Ying et al, 2003) began to appear, as seen in Chapter 3.
MESC’s were seeded onto three GXG materials and TCP and differentiated for four
days in neuronal differentiation medium. Phase contrast microscopy was first used to
observe the morphology of cells formed at day four. As seen in Figure 3, three distinct
cellular morphologies were seen to appear on all four materials at day four of
differentiation. They have been termed A, B and C. Morphology A consisted of dense
colonies of rounded cells. This was the predominant cell morphology observed on the
stiffest material (35 kPa). When immunocytochemistry was carried out (Figure 4.4A),
some nestin was found within the centre of the dense colonies, but the majority of the
more typically characteristic filamentous nestin was found on the periphery. This
suggests that neuronal differentiation originates from the periphery of the colonies
before proceeding inwards towards the centre. Sox17 (a marker for primitive
endoderm) was found abundantly in cells within these colonies (Figure 4B). Cells
positive for early mesodermal marker T-brachyury (Wilkinson, 1990) were found more
sporadically (Figure 4C).
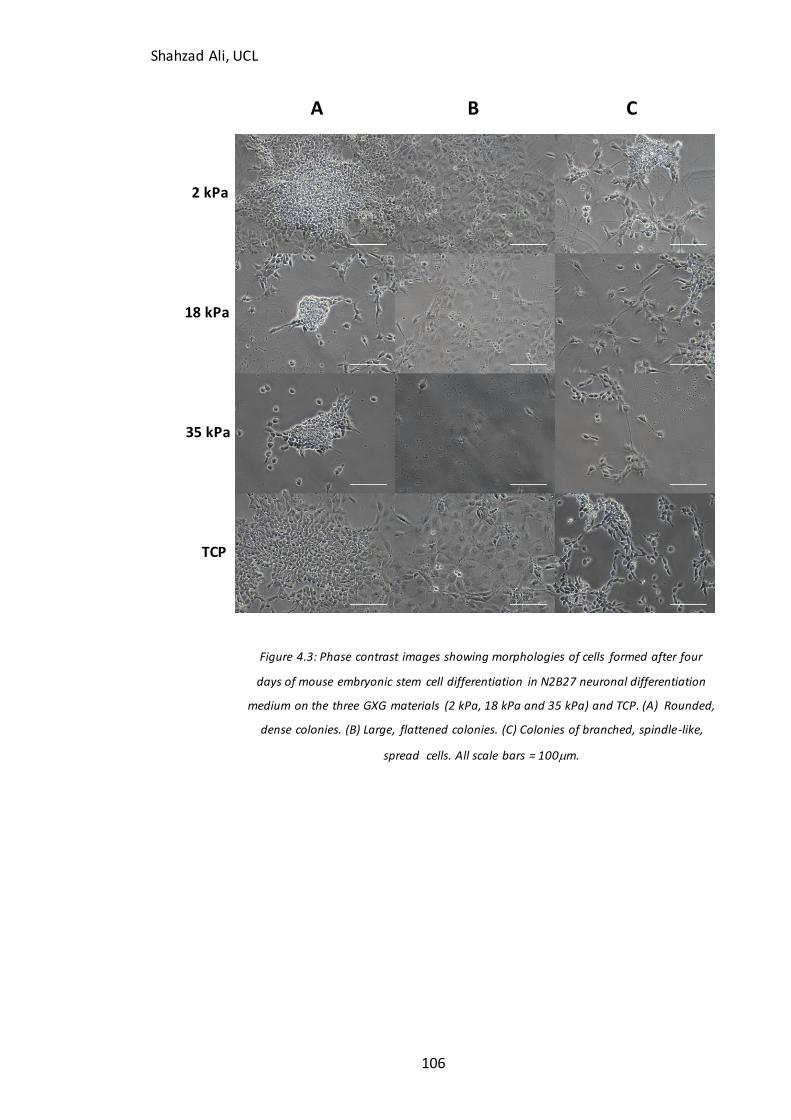
Shahzad Ali, UCL
106
A B C
Figure 4.3: Phase contrast images showing morphologies of cells formed after four
days of mouse embryonic stem cell differentiation in N2B27 neuronal differentiation
medium on the three GXG materials (2 kPa, 18 kPa and 35 kPa) and TCP. (A) Rounded,
dense colonies. (B) Large, flattened colonies. (C) Colonies of branched, spindle-like,
spread cells. All scale bars = 100m.
2 kPa
18 kPa
35 kPa
TCP
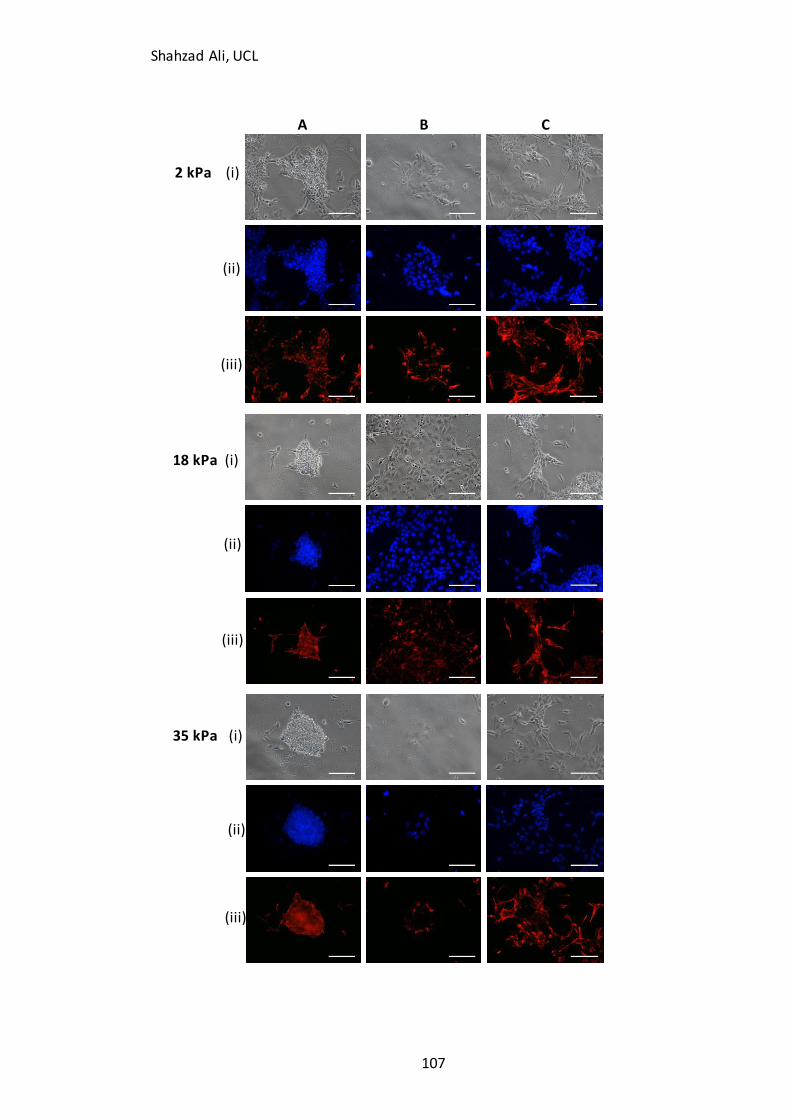
Shahzad Ali, UCL
107
A B C
DAPI DAPI DAPI
18 kPa 18 kPa
18 kPa
Nestin Nestin Nestin
DAPI DAPI DAPI
35 kPa 35 kPa 35 kPa
Nestin Nestin Nestin
(i)
18 kPa (i)
(ii)
(ii)
(ii)
(iii)
(iii)
(iii)
2 kPa (i)
35 kPa
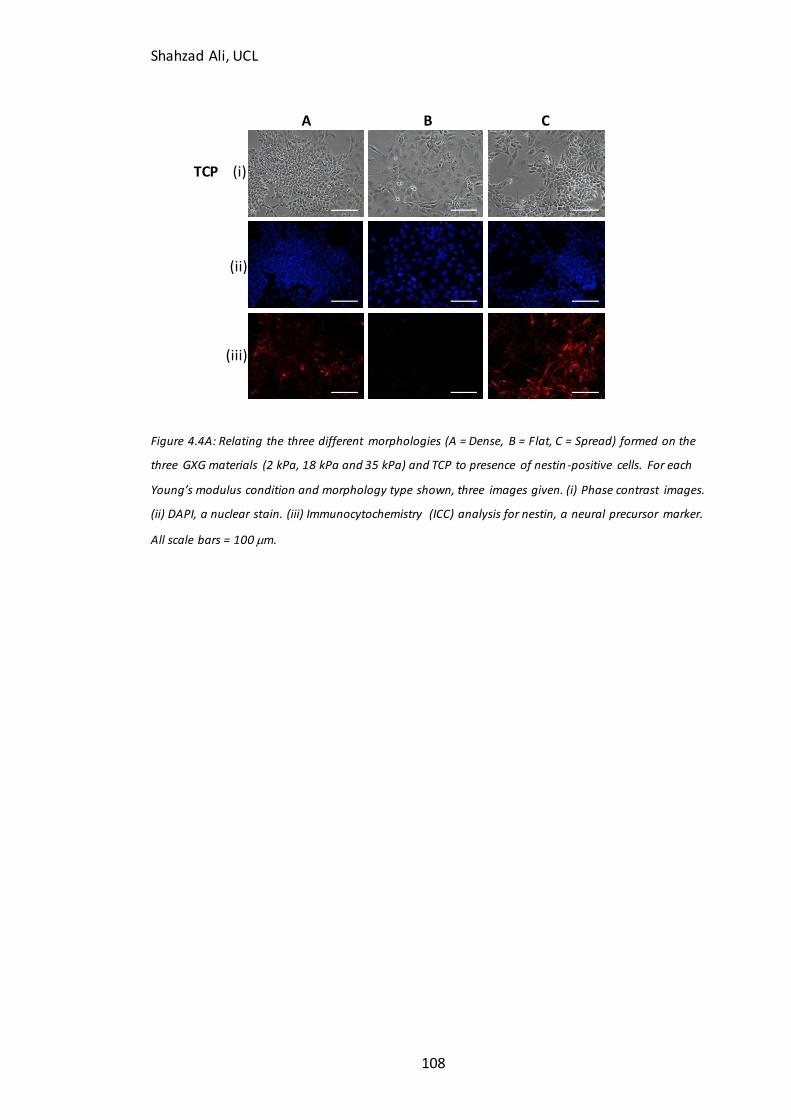
Shahzad Ali, UCL
108
A B C
Figure 4.4A: Relating the three different morphologies (A = Dense, B = Flat, C = Spread) formed on the
three GXG materials (2 kPa, 18 kPa and 35 kPa) and TCP to presence of nestin -positive cells. For each
Young’s modulus condition and morphology type shown, three images given. (i) Phase contrast images.
(ii) DAPI, a nuclear stain. (iii) Immunocytochemistry (ICC) analysis for nestin, a neural precursor marker.
All scale bars = 100 m.
TCP (i)
(ii)
(iii)
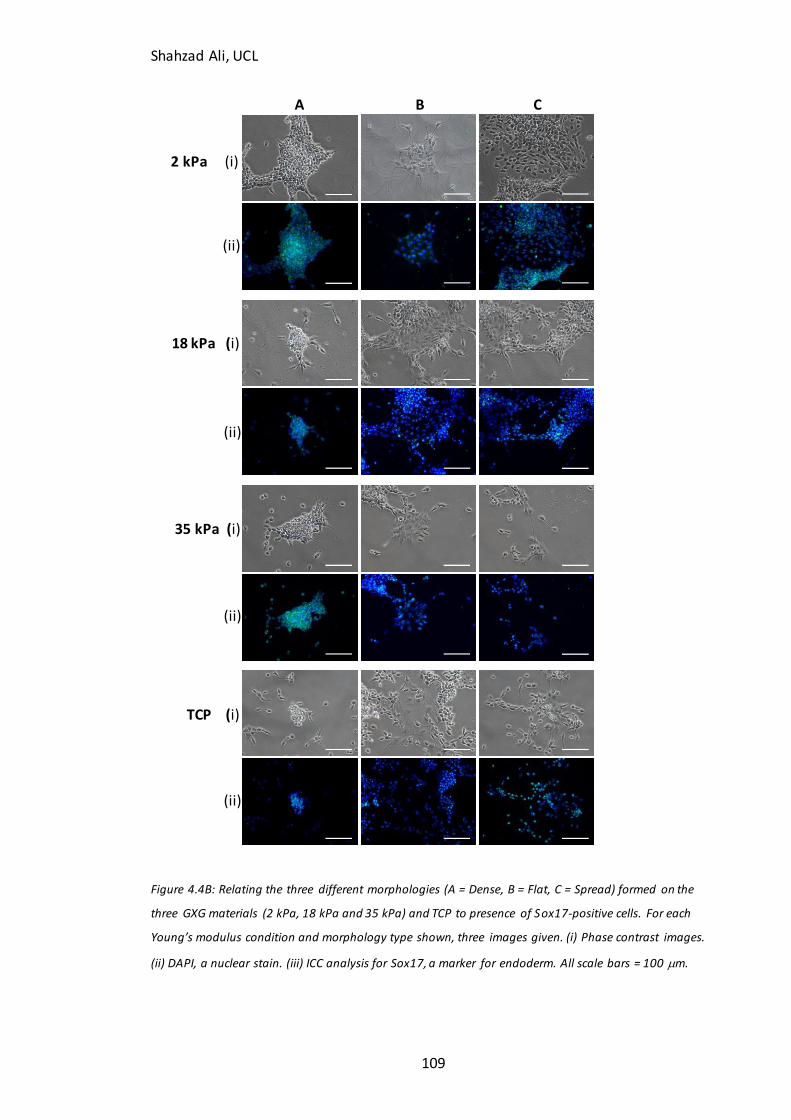
Shahzad Ali, UCL
109
A B C
Figure 4.4B: Relating the three different morphologies (A = Dense, B = Flat, C = Spread) formed on the
three GXG materials (2 kPa, 18 kPa and 35 kPa) and TCP to presence of Sox17-positive cells. For each
Young’s modulus condition and morphology type shown, three images given. (i) Phase contrast images.
(ii) DAPI, a nuclear stain. (iii) ICC analysis for Sox17, a marker for endoderm. All scale bars = 100 m.
2 kPa (i)
(ii)
18 kPa (i)
35 kPa (i)
(ii)
(ii)
TCP (i)
(ii)
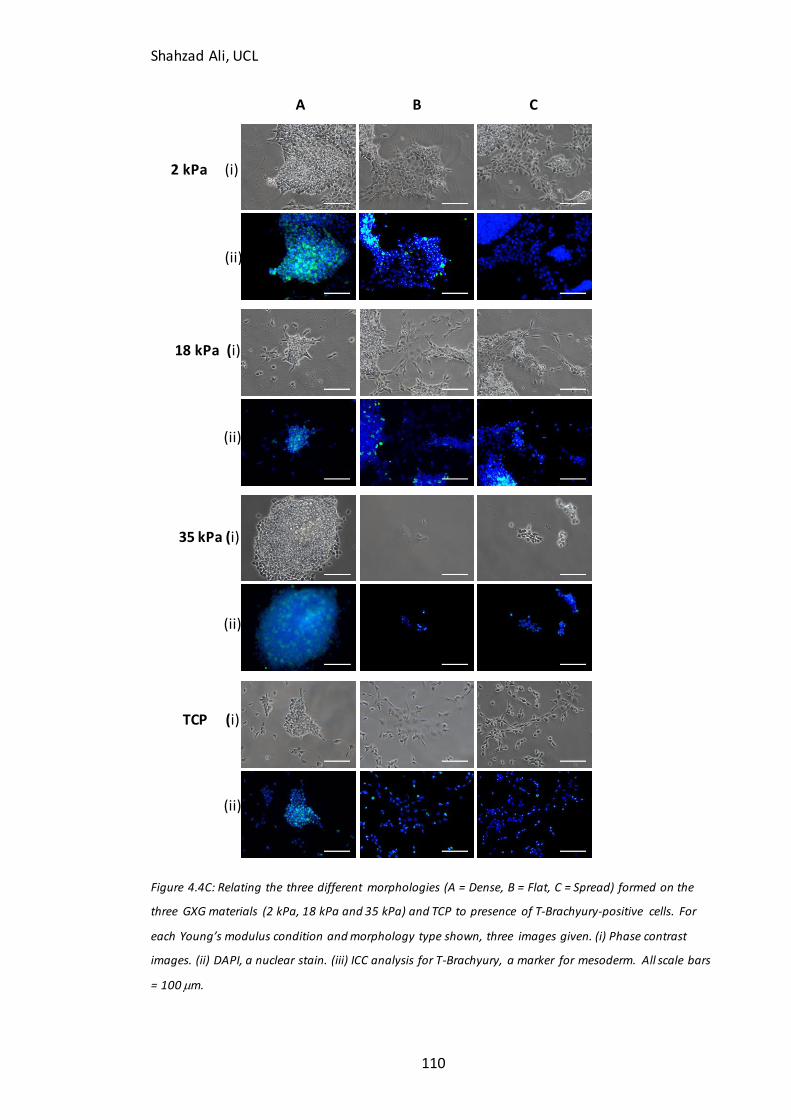
Shahzad Ali, UCL
110
A B C
Figure 4.4C: Relating the three different morphologies (A = Dense, B = Flat, C = Spread) formed on the
three GXG materials (2 kPa, 18 kPa and 35 kPa) and TCP to presence of T-Brachyury-positive cells. For
each Young’s modulus condition and morphology type shown, three images given. (i) Phase contrast
images. (ii) DAPI, a nuclear stain. (iii) ICC analysis for T-Brachyury, a marker for mesoderm. All scale bars
= 100 m.
2 kPa (i)
(ii)
18 kPa (i)
35 kPa (i)
(ii)
(ii)
TCP (i)
(ii)
Shahzad Ali, UCL
111
Cells with morphology B were larger bodied and flattened in shape, giving rise to
cobblestone-like colonies. These cells closely resembled neuroepithelial cells. This type
of cell has previously been reported (Ying et al, 2003) to be an artifact of the N2B27
protocol when serum is present. However, this morphology was not commonly
present on any of the materials. These cells were not found to be positive for nestin
(Figure 4.4A), Sox-17 (Figure 4.4B) or T-brachyury (Figure 4.4C). These may be more
mature cells of a non-neuronal lineage.
Cells with the third morphology, C, were spindle-shaped and spread in nature. The
cells extended out to form neurite-like branches. These cells contained the
characteristic filamentous nestin associated with neural precursor cells (Figure 4.4A).
These were the cells that differentiated out from the periphery of the dense colonies
(morphology A) in order to form characteristic neural precursor rosettes and
eventually immature neurons. These cells were also found to be pos itive for Sox17
(Figure 4.4B) and T-brachyury (Figure 4.4C), suggesting that they are at a very early
stage of differentiation.
4.3.2 Does Young’s modulus affect neural precursor or immature neuron formation
from mESC’s in neuronal differentiation medium?
The aim of the next set of experiments was to better understand how Young’s
modulus influenced the changes in cell identity during differentiation. By comparing
the proportion of neural precursor cells across materials, it was hoped that any effect
that soft materials have in directly promoting neuronal differentiation could be
isolated from the favourability in attachment seen in Figure 4.1.
In order to compare changes in phenotype with time across the various materials, a
time-course immunocytochemistry study for four markers (two pluripotent, two
neuronal) was performed. Of the pluripotent markers, OCT4 (Figure 4.5A) and UTF1
(Figure 4.5B) were investigated. As observed in the pluripotent characterization in
Chapter 3, the first two markers are transcriptional factors expressed in the nuclei of
ESC’s. Analysis for Ki67 was also carried out.
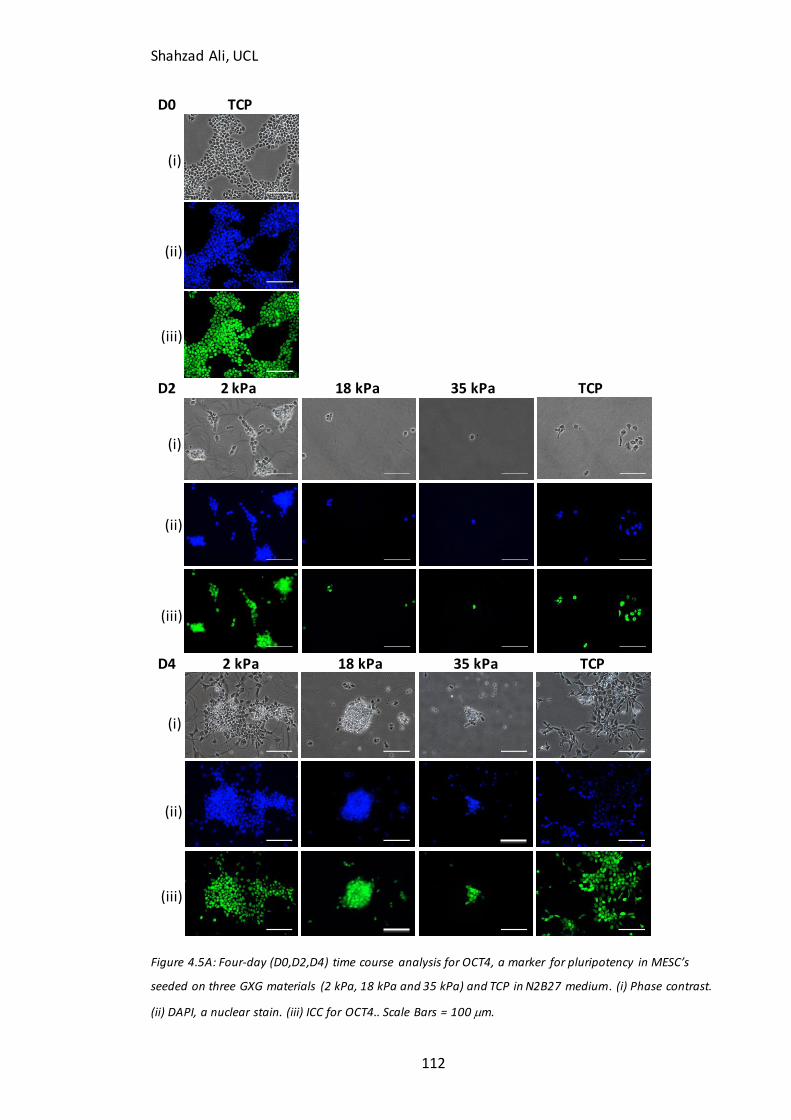
Shahzad Ali, UCL
112
D0 TCP
D2 2 kPa 18 kPa 35 kPa TCP
D4 2 kPa 18 kPa 35 kPa TCP
Figure 4.5A: Four-day (D0,D2,D4) time course analysis for OCT4, a marker for pluripotency in MESC’s
seeded on three GXG materials (2 kPa, 18 kPa and 35 kPa) and TCP in N2B27 medium. (i) Phase contrast.
(ii) DAPI, a nuclear stain. (iii) ICC for OCT4.. Scale Bars = 100 m.
(i)
(iii)
(ii)
(i)
(iii)
(ii)
(i)
(iii)
(ii)
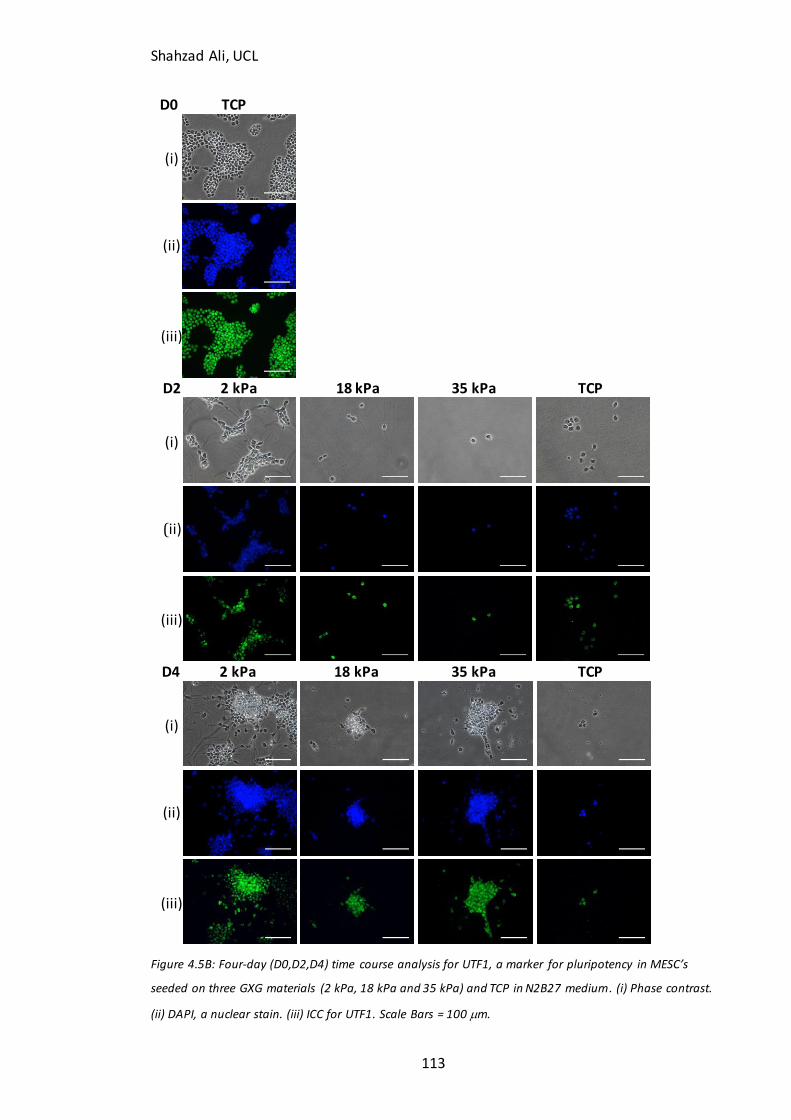
Shahzad Ali, UCL
113
D0 TCP
D2 2 kPa 18 kPa 35 kPa TCP
D4 2 kPa 18 kPa 35 kPa TCP
Figure 4.5B: Four-day (D0,D2,D4) time course analysis for UTF1, a marker for pluripotency in MESC’s
seeded on three GXG materials (2 kPa, 18 kPa and 35 kPa) and TCP in N2B27 medium. (i) Phase contrast.
(ii) DAPI, a nuclear stain. (iii) ICC for UTF1. Scale Bars = 100 m.
(i)
(iii)
(ii)
(i)
(iii)
(ii)
(i)
(iii)
(ii)
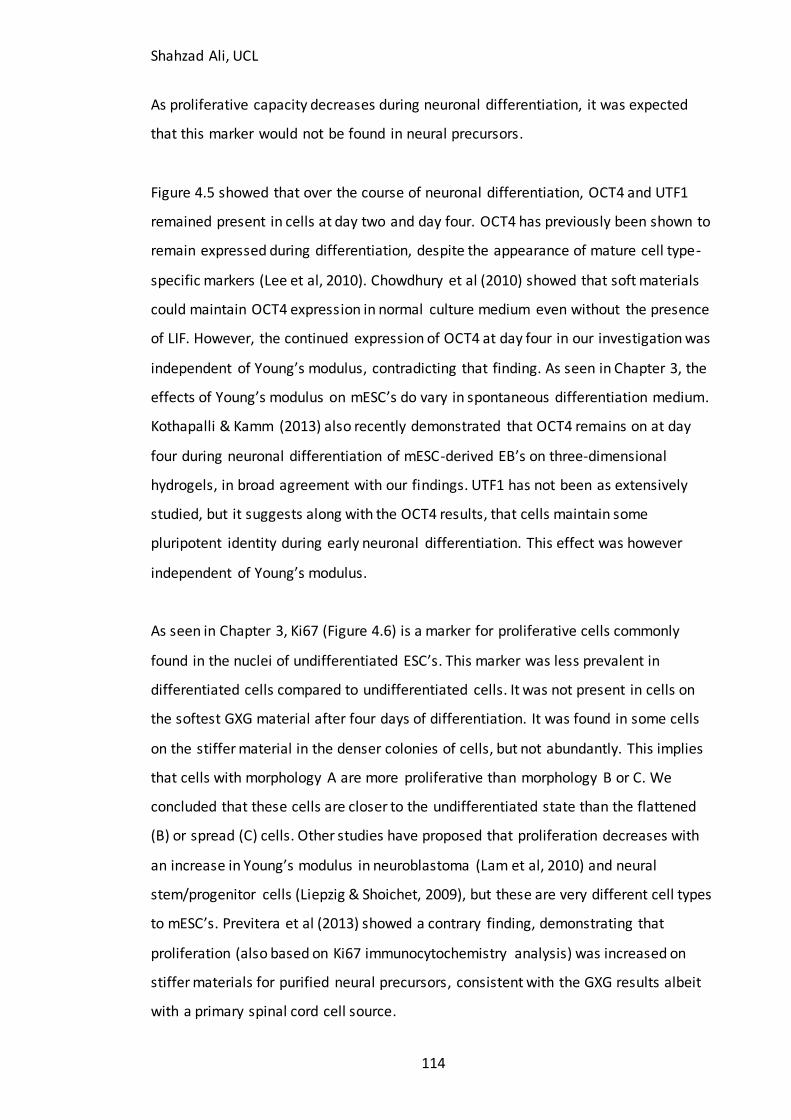
Shahzad Ali, UCL
114
As proliferative capacity decreases during neuronal differentiation, it was expected
that this marker would not be found in neural precursors.
Figure 4.5 showed that over the course of neuronal differentiation, OCT4 and UTF1
remained present in cells at day two and day four. OCT4 has previously been shown to
remain expressed during differentiation, despite the appearance of mature cell type-
specific markers (Lee et al, 2010). Chowdhury et al (2010) showed that soft materials
could maintain OCT4 expression in normal culture medium even without the presence
of LIF. However, the continued expression of OCT4 at day four in our investigation was
independent of Young’s modulus, contradicting that finding. As seen in Chapter 3, the
effects of Young’s modulus on mESC’s do vary in spontaneous differentiation medium.
Kothapalli & Kamm (2013) also recently demonstrated that OCT4 remains on at day
four during neuronal differentiation of mESC-derived EB’s on three-dimensional
hydrogels, in broad agreement with our findings. UTF1 has not been as extensively
studied, but it suggests along with the OCT4 results, that cells maintain some
pluripotent identity during early neuronal differentiation. This effect was however
independent of Young’s modulus.
As seen in Chapter 3, Ki67 (Figure 4.6) is a marker for proliferative cells commonly
found in the nuclei of undifferentiated ESC’s. This marker was less prevalent in
differentiated cells compared to undifferentiated cells. It was not present in cells on
the softest GXG material after four days of differentiation. It was found in some cells
on the stiffer material in the denser colonies of cells, but not abundantly. This implies
that cells with morphology A are more proliferative than morphology B or C. We
concluded that these cells are closer to the undifferentiated state than the flattened
(B) or spread (C) cells. Other studies have proposed that proliferation decreases with
an increase in Young’s modulus in neuroblastoma (Lam et al, 2010) and neural
stem/progenitor cells (Liepzig & Shoichet, 2009), but these are very different cell types
to mESC’s. Previtera et al (2013) showed a contrary finding, demonstrating that
proliferation (also based on Ki67 immunocytochemistry analysis) was increased on
stiffer materials for purified neural precursors, consistent with the GXG results albeit
with a primary spinal cord cell source.
Shahzad Ali, UCL
115
D0 TCP
D4 2 kPa 18 kPa 35 kPa TCP
Figure 4.6: ICC analysis for Ki67, a marker for proliferative cells in MESC’s seeded on three GXG materials
(2 kPa, 18 kPa and 35 kPa) and TCP in N2B27 medium.(i) Phase contrast. (ii) DAPI, a nuclear stain. (iii)
Ki67. Images obtained at day zero and day four post-seeding. Scale Bars = 100 m.
(i)
(ii)
(iii)
(i)
(ii)
(iii)
Shahzad Ali, UCL
116
Proliferation in the Previtera et al (2013) study did decrease over time on all materials,
despite growth being in expansion and not differentiation medium.
Following on from the analysis of pluripotent markers, the next stage was to
investigate the effect of Young’s modulus on formation of neural precursors and
immature neurons from mESC’s in N2B27. From the earlier neuronal characterization
work (Chapter 3), nestin and -III tubulin were identified as the two most suitable
markers for neuronal differentiation. Nestin was used as a marker for neural precursor
cells (Ying et al, 2003), whilst -III tubulin was used as a marker for immature neurons.
Time-course immunocytochemistry analysis for nestin (Figure 4.7A) over the first four
days of neuronal differentiation revealed that nestin began to be observed after two
days on all four materials, which was earlier than expected. At day four, nestin was
observed across all four materials.
Longer-term differentiation (seven days) of neural stem cells (Banerjee et al, 2009)
revealed a similar result, where nestin-positive neural precursor formation did not vary
with Young’s modulus. In the same study by Previtera et al (2013), there were more
nestin-positive cells on stiffer materials at day five of neural precursor growth in
expansion medium than on soft. Conversely, Engler et al (2006) found higher
expression of nestin on soft materials when mesenchymal stem cells were
differentiated in neuronal differentiation medium. Variations in conditions and cell
types between studies led to different responses to Young’s modulus.
Staining for -III tubulin started at day four as it was not previously found in cells at
this stage of neuronal differentiation (Chapter 3). At day six, -III tubulin was again
found in colonies on all four materials (Figure 4.7B). However, on stiffer GXG materials
the extension of -III tubulin positive neurites was restricted within colonies. On the
softest material (2 kPa) and TCP, neurites rich in -III tubulin branched and extended
between colonies.
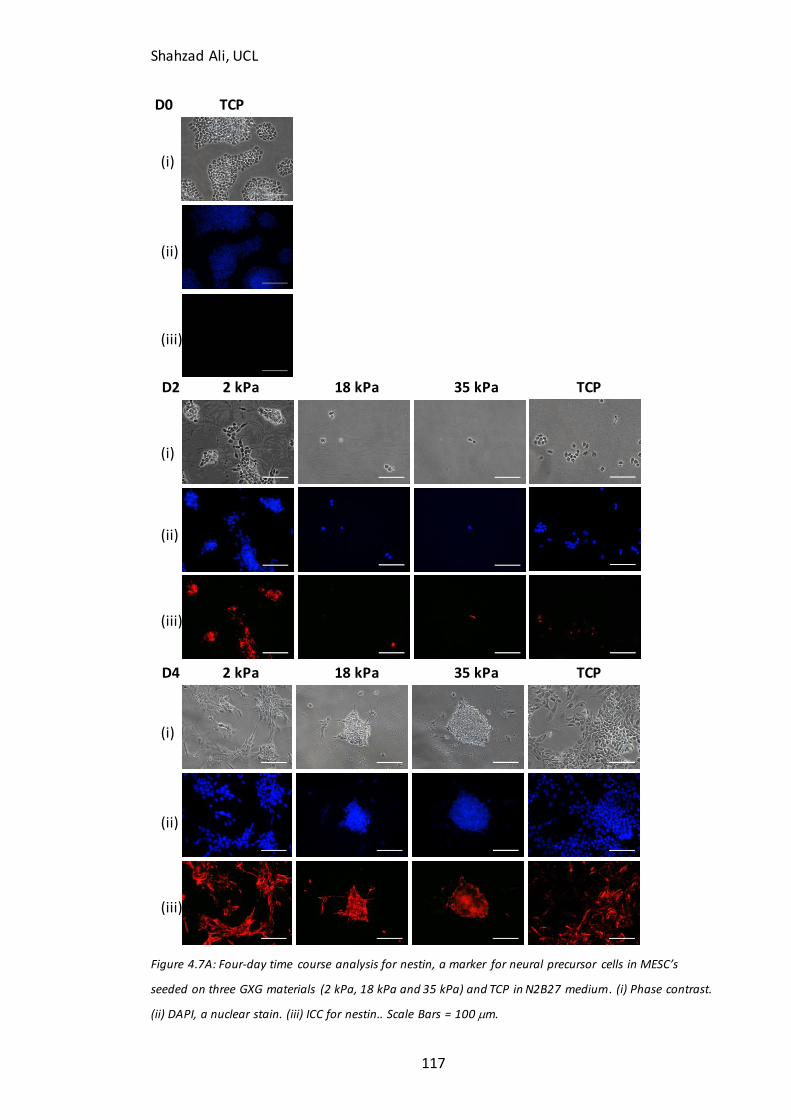
Shahzad Ali, UCL
117
D0 TCP
D2 2 kPa 18 kPa 35 kPa TCP
D4 2 kPa 18 kPa 35 kPa TCP
Figure 4.7A: Four-day time course analysis for nestin, a marker for neural precursor cells in MESC’s
seeded on three GXG materials (2 kPa, 18 kPa and 35 kPa) and TCP in N2B27 medium. (i) Phase contrast.
(ii) DAPI, a nuclear stain. (iii) ICC for nestin.. Scale Bars = 100 m.
(i)
(iii)
(ii)
(i)
(iii)
(ii)
(i)
(iii)
(ii)
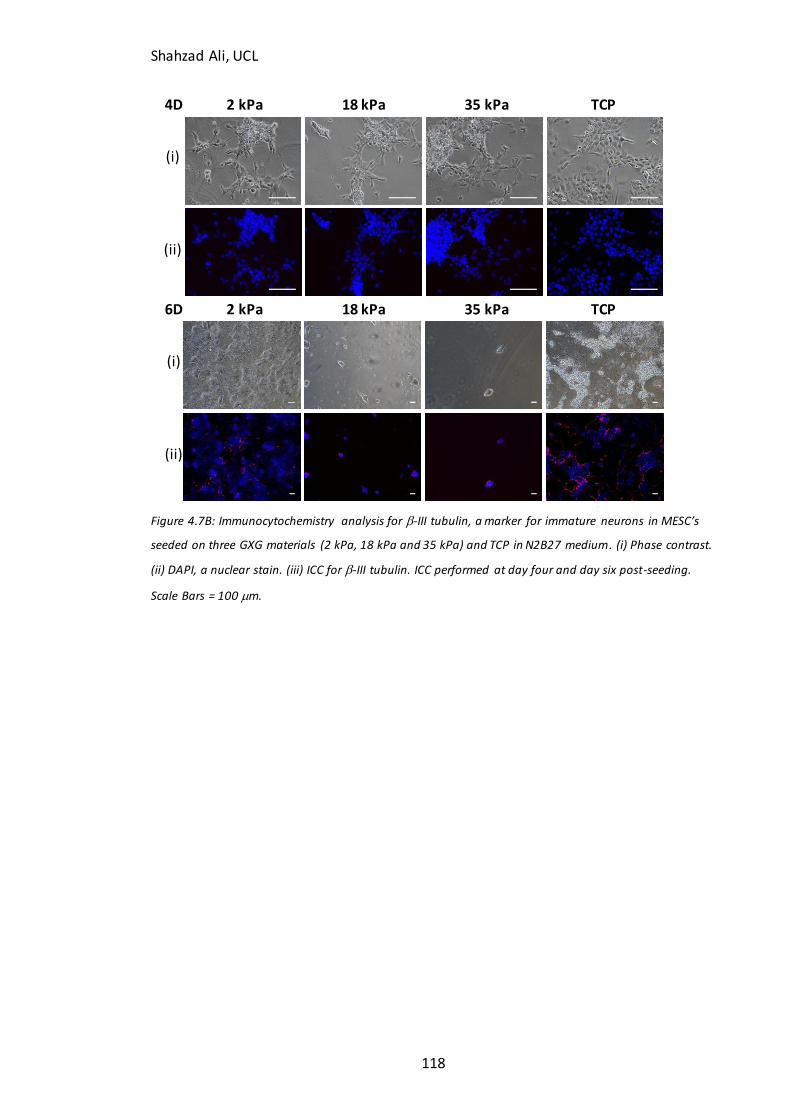
Shahzad Ali, UCL
118
4D 2 kPa 18 kPa 35 kPa TCP
6D 2 kPa 18 kPa 35 kPa TCP
Figure 4.7B: Immunocytochemistry analysis for -III tubulin, a marker for immature neurons in MESC’s
seeded on three GXG materials (2 kPa, 18 kPa and 35 kPa) and TCP in N2B27 medium. (i) Phase contrast.
(ii) DAPI, a nuclear stain. (iii) ICC for -III tubulin. ICC performed at day four and day six post-seeding.
Scale Bars = 100 m.
(i)
(ii)
(i)
(ii)
Shahzad Ali, UCL
119
Immunocytochemistry analysis by Kothapalli & Kamm (2013) in a recent study
demonstrated that both neurite length and formation of -III tubulin-positive cells
from mESC-derived EB’s were maximized at a similar Young’s modulus to our own
study. Both neurite length and -III tubulin-positive cell formation decreased as
Young’s modulus decreased to the 100’s of Pa. Keung et al (2012) showed agreement
with this data using similar techniques for induced pluripotent stem cells, which were
differentiated for nine days towards a neuronal lineage. The proportion of cells
positive for -III tubulin significantly decreased at higher Young’s moduli (75 kPa).
However, when the same techniques were used for hESC’s, the findings showed
similarity to the GXG results. The proportion of cells that were -III tubulin positive did
not significantly decrease within a similar Young’s modulus range. Earlier work by
Flanagan et al (2002) also showed agreement with our data, as primary spinal cord
neurites became more branched with a decrease in Young’s modulus (albeit over a
lower Young’s modulus range).
When considered along with the nestin findings, this suggests that more neural
precursors and immature neurons form on the softest GXG material, but this effect
was due to increased initial attachment on the soft material rather than a direct
promotion of neuronal differentiation. The increased branching and extension of -III
tubulin-rich neurites on soft materials was likely due to increased paracrine signalling
between colonies. An increase in the density of colonies resulted in considerably less
distance for signalling to occur between them.
4.3.3 Does Young’s modulus enrich populations of neural precursors during mESC
differentiation in N2B27 medium?
In order to further confirm the hypothesis that the increase in numbers of neural
precursors on soft materials was due to favourable initial attachment, flow cytometry
for neural cell surface marker PSA-NCAM (see Chapter 3) was carried out. By
comparing the percentage of cells positive for the marker across the four materials, it
could be ascertained whether soft materials were directly promoting neuronal
Shahzad Ali, UCL
120
differentiation by increasing the proportion of neural precursors in the total
population. Comparison between the harvest cell counts (which were expected to
correspond with the confluency measurements at 72h) and this value allowed for
confirmation that neural precursor yield increased due to favorable initial attachment
and not due to a neuronal promotion effect. Neuronal precursor yield was defined as
the product of the total harvested cell concentration (cells/cm2) and percentage of
cells positive for PSA-NCAM.
As seen in Figure 4.8, total cell concentration showed a significant (p<0.005) decrease
on the 18 kPa (57%) and 35 kPa (80%) when compared to the soft, 2 kPa GXG material.
These findings were consistent with the earlier 72h expansion results shown in Figure
4.2A.
Flow cytometry analysis did not show any variation in percentage of cells positive for
PSA-NCAM with Young’s modulus. This implies that soft materials do not select for the
formation of neural precursors over other cell lineages. The increase in percentage of
cells positive for the marker (30-40% of cells were positive on all four materials)
compared to that for undifferentiated cells (4.79% from Chapter 1) confirmed that
differentiation towards the neuronal lineage was taking place on all four materia ls.
Cell yield of PSA-NCAM positive neural precursors thus exhibited a similar pattern to
that of total harvested cell yield. It was concluded that that soft materials increase the
yield of neural precursors from mESC’s in N2B27, without enriching them.
The balance between these two properties – yield and enrichment is a crucial
consideration when designing bioprocesses effectively. Regenerative medicine is no
exception in this regard. For safety reasons, high cell enrichment is highly desirable in
the end cell therapy product. Elimination of non-target cells (undifferentiated as well
as other lineages) in stem cell-derived products is a key FDA requirement in reducing
the risk of tumorigenicity (Knoepfler, 2009).
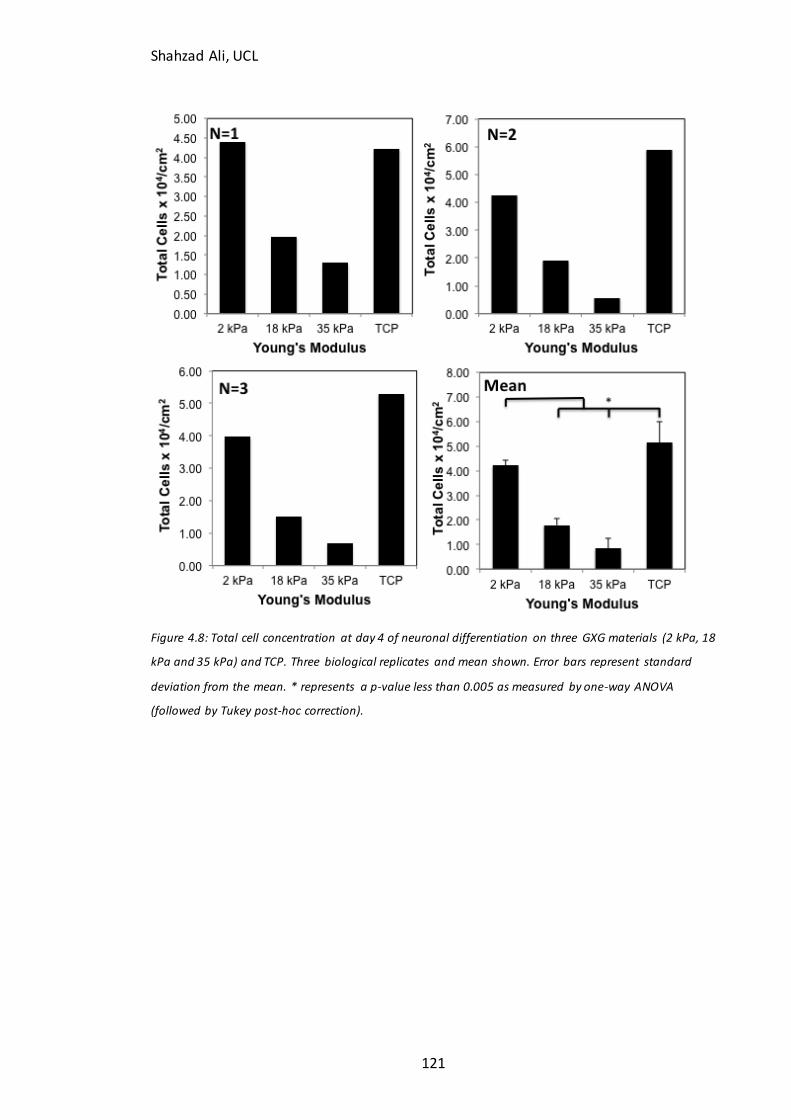
Shahzad Ali, UCL
121
Figure 4.8: Total cell concentration at day 4 of neuronal differentiation on three GXG materials (2 kPa, 18
kPa and 35 kPa) and TCP. Three biological replicates and mean shown. Error bars represent standard
deviation from the mean. * represents a p-value less than 0.005 as measured by one-way ANOVA
(followed by Tukey post-hoc correction).
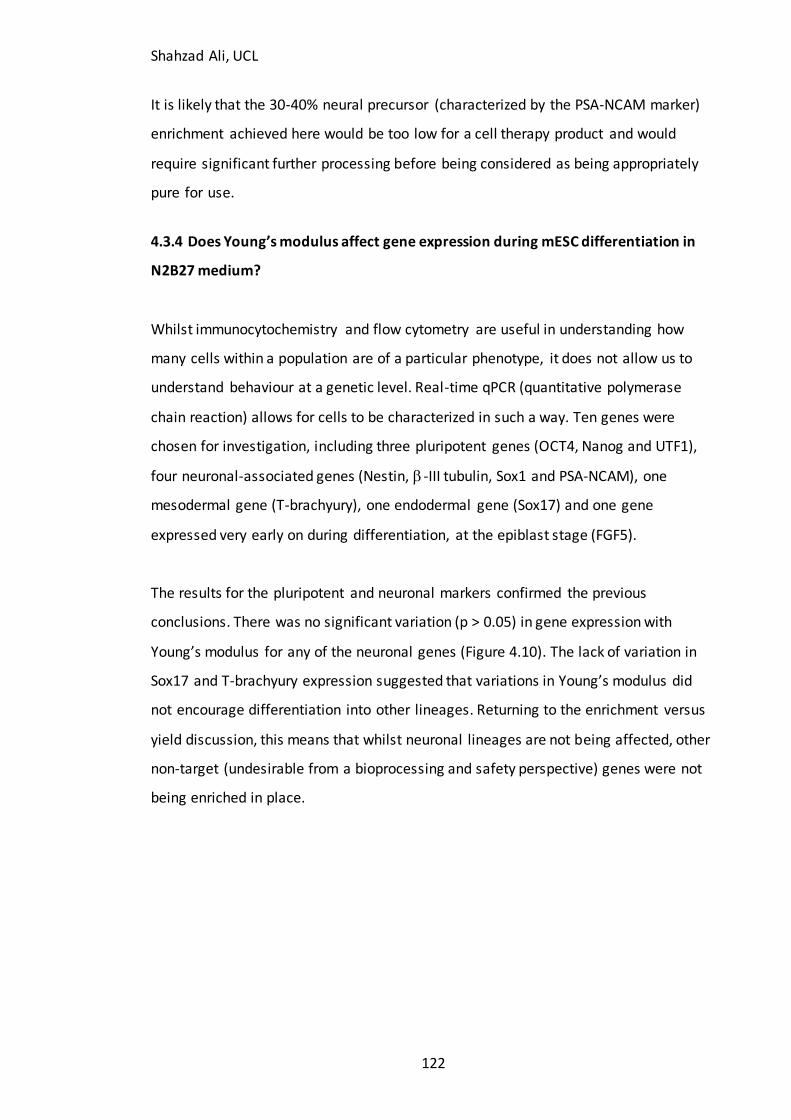
Shahzad Ali, UCL
122
It is likely that the 30-40% neural precursor (characterized by the PSA-NCAM marker)
enrichment achieved here would be too low for a cell therapy product and would
require significant further processing before being considered as being appropriately
pure for use.
4.3.4 Does Young’s modulus affect gene expression during mESC differentiation in
N2B27 medium?
Whilst immunocytochemistry and flow cytometry are useful in understanding how
many cells within a population are of a particular phenotype, it does not allow us to
understand behaviour at a genetic level. Real-time qPCR (quantitative polymerase
chain reaction) allows for cells to be characterized in such a way. Ten genes were
chosen for investigation, including three pluripotent genes (OCT4, Nanog and UTF1),
four neuronal-associated genes (Nestin, -III tubulin, Sox1 and PSA-NCAM), one
mesodermal gene (T-brachyury), one endodermal gene (Sox17) and one gene
expressed very early on during differentiation, at the epiblast stage (FGF5).
The results for the pluripotent and neuronal markers confirmed the previous
conclusions. There was no significant variation (p > 0.05) in gene expression with
Young’s modulus for any of the neuronal genes (Figure 4.10). The lack of variation in
Sox17 and T-brachyury expression suggested that variations in Young’s modulus did
not encourage differentiation into other lineages. Returning to the enrichment versus
yield discussion, this means that whilst neuronal lineages are not being affected, other
non-target (undesirable from a bioprocessing and safety perspective) genes were not
being enriched in place.
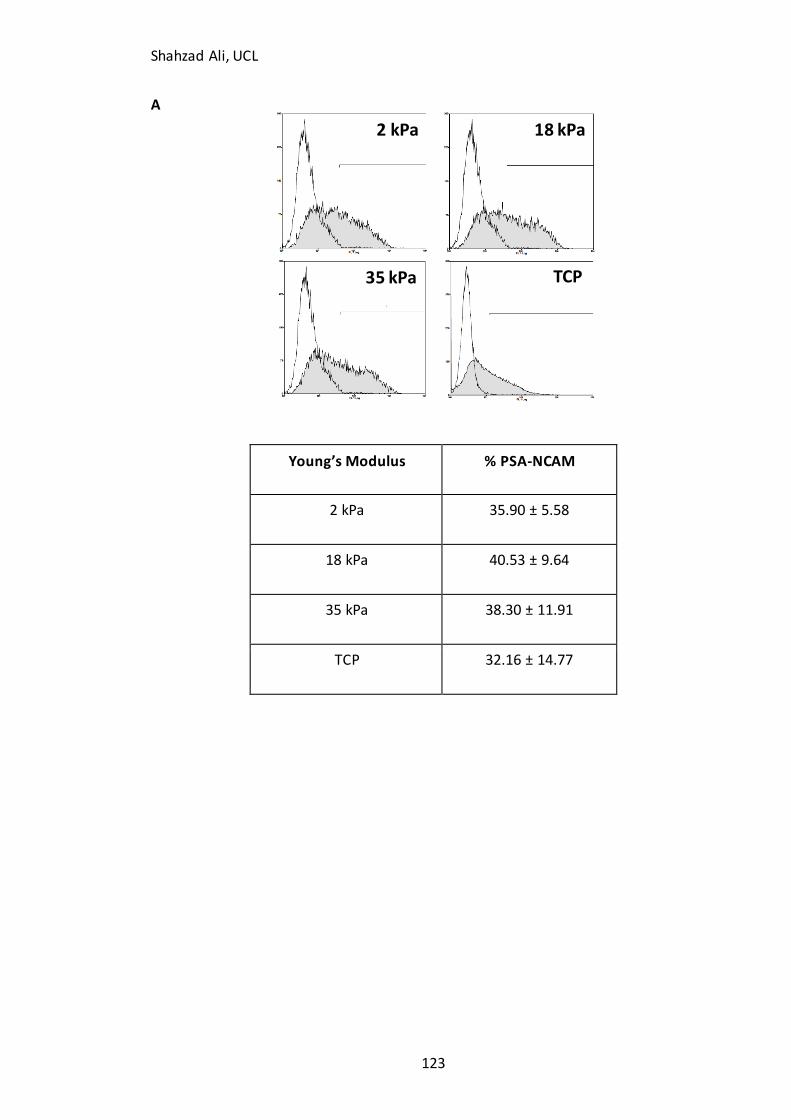
Shahzad Ali, UCL
123
A
Young’s Modulus % PSA-NCAM
2 kPa 35.90 ± 5.58
18 kPa 40.53 ± 9.64
35 kPa 38.30 ± 11.91
TCP 32.16 ± 14.77
2 kPa
35 kPa
18 kPa
TCP
Shahzad Ali, UCL
124
B
Figure 4.9(A): Flow cytometry results for PSA-NCAM, a neural precursor marker in mESC’s differentiated
for four days in N2B27 medium. The histogram shown is representative of a biological replicate. The
white area represents the isotype control, whilst the shaded area represents the stained sample. The
values given in the table are the means ± standard deviations derived from biological triplicates. Figure
4.9(B): Yield of PSA-NCAM positive neural precursors following four days of differentiation from three
GXG materials and TCP. All three biological replicates shown as well as the mean.
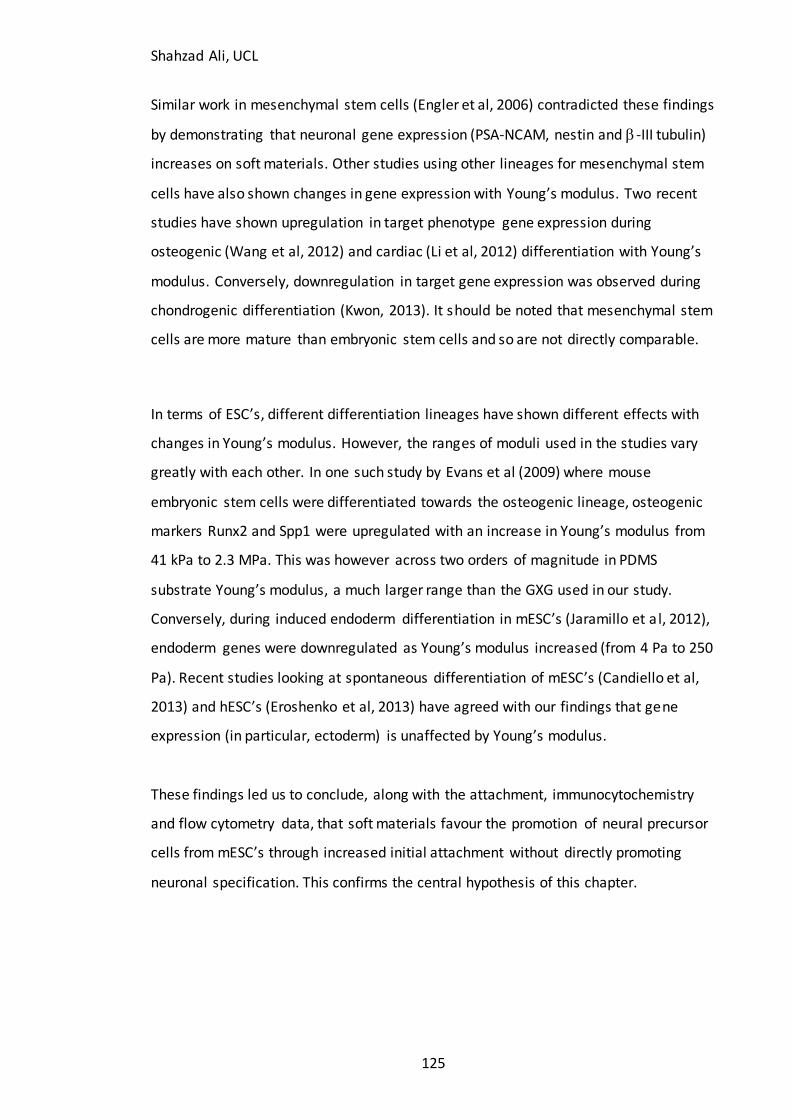
Shahzad Ali, UCL
125
Similar work in mesenchymal stem cells (Engler et al, 2006) contradicted these findings
by demonstrating that neuronal gene expression (PSA-NCAM, nestin and -III tubulin)
increases on soft materials. Other studies using other lineages for mesenchymal stem
cells have also shown changes in gene expression with Young’s modulus. Two recent
studies have shown upregulation in target phenotype gene expression during
osteogenic (Wang et al, 2012) and cardiac (Li et al, 2012) differentiation with Young’s
modulus. Conversely, downregulation in target gene expression was observed during
chondrogenic differentiation (Kwon, 2013). It should be noted that mesenchymal stem
cells are more mature than embryonic stem cells and so are not directly comparable.
In terms of ESC’s, different differentiation lineages have shown different effects with
changes in Young’s modulus. However, the ranges of moduli used in the studies vary
greatly with each other. In one such study by Evans et al (2009) where mouse
embryonic stem cells were differentiated towards the osteogenic lineage, osteogenic
markers Runx2 and Spp1 were upregulated with an increase in Young’s modulus from
41 kPa to 2.3 MPa. This was however across two orders of magnitude in PDMS
substrate Young’s modulus, a much larger range than the GXG used in our study.
Conversely, during induced endoderm differentiation in mESC’s (Jaramillo et a l, 2012),
endoderm genes were downregulated as Young’s modulus increased (from 4 Pa to 250
Pa). Recent studies looking at spontaneous differentiation of mESC’s (Candiello et al,
2013) and hESC’s (Eroshenko et al, 2013) have agreed with our findings that gene
expression (in particular, ectoderm) is unaffected by Young’s modulus.
These findings led us to conclude, along with the attachment, immunocytochemistry
and flow cytometry data, that soft materials favour the promotion of neural precursor
cells from mESC’s through increased initial attachment without directly promoting
neuronal specification. This confirms the central hypothesis of this chapter.
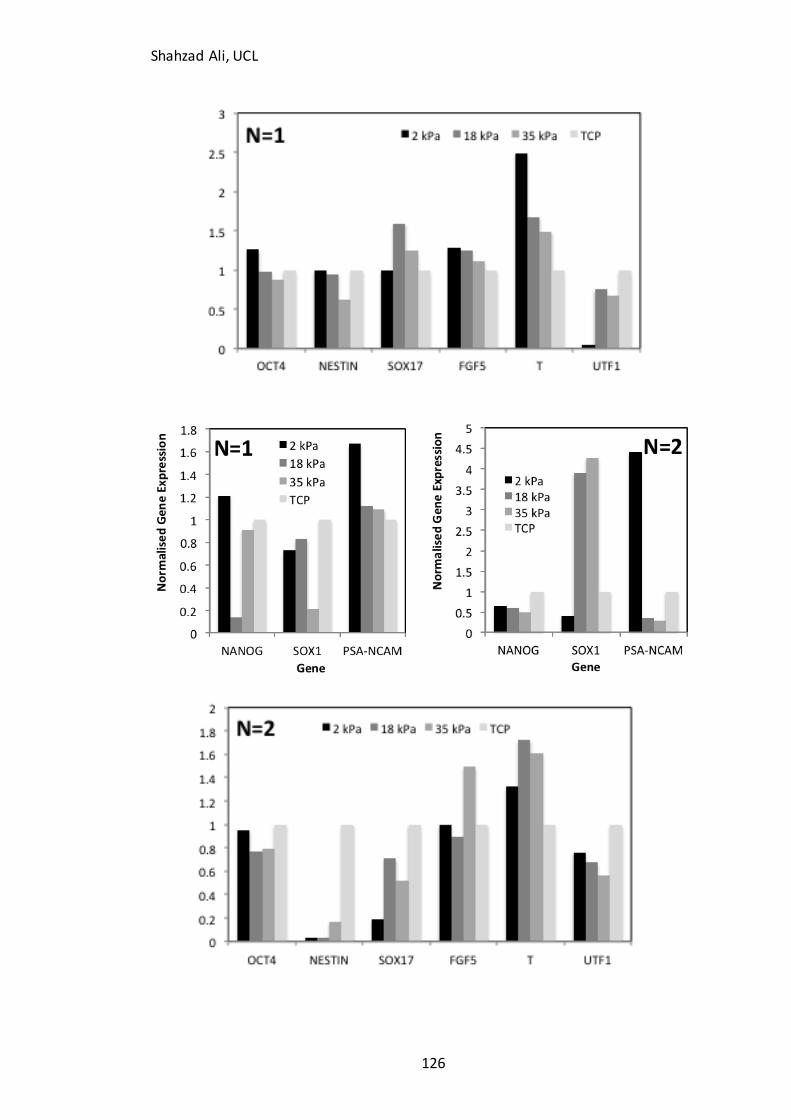
Shahzad Ali, UCL
126
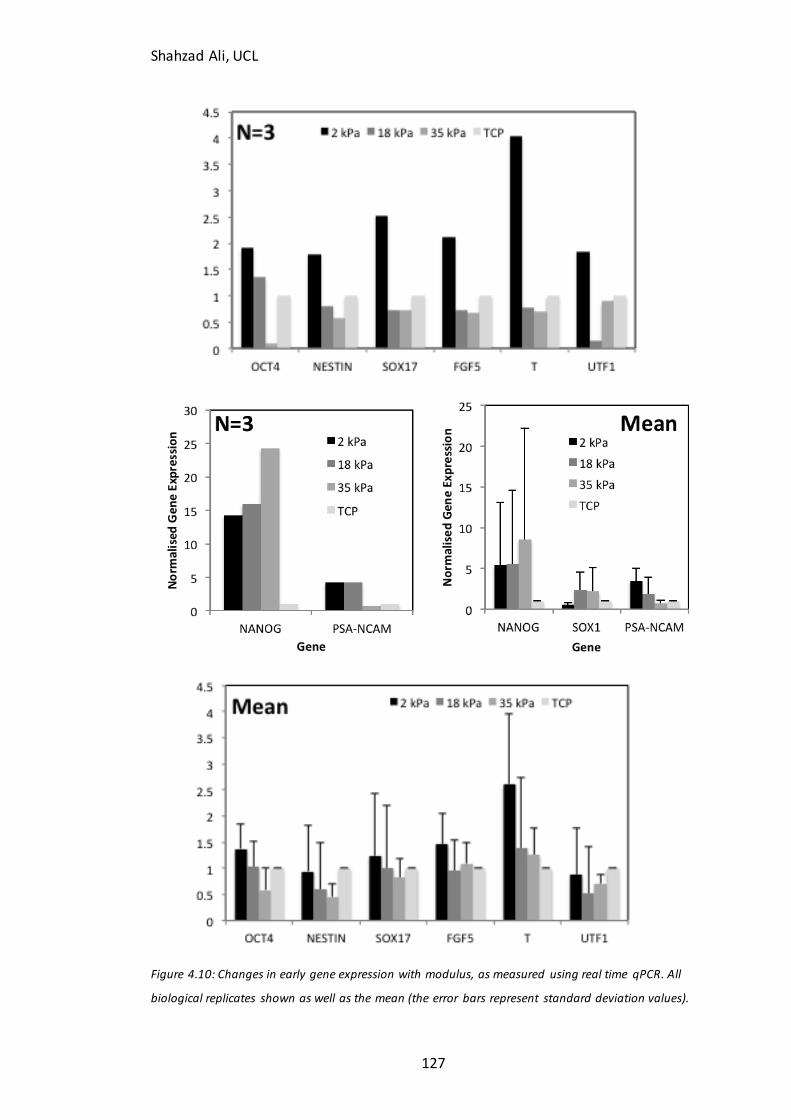
Shahzad Ali, UCL
127
Figure 4.10: Changes in early gene expression with modulus, as measured using real time qPCR. All
biological replicates shown as well as the mean (the error bars represent standard deviation values).
Shahzad Ali, UCL
128
4.4 Is the favourable attachment of mESC’s on soft materials dependent on stress
fiber stabilization or microtubule formation?
After it was established that the increase in neural precursor cell yield on soft
materials was due to favourable attachment and not direct promotion of the neuronal
fate by the material, an attempt was made to elucidate the mechanism behind this
attachment effect. Two inhibitors were used to investigate this mechanism. One was
blebbistatin, which inhibits stress fiber contraction (via non-muscle myosin II or
NMMII). The other was nocodazole, which inhibits microtubule formation. Stress fibers
and microtubules are the two most influential components of the cytoskeleton, and so
they are instrumental in allowing cells to adhere and spread on materials (Wang et al,
2009).
As shown in Figure 4.11, attachment was unaffected by blebbistatin inhibition, both
when cells were pre-treated with it as well as when cells were seeded with it.
Blebbistatin is a reversible inhibitor, and so it is likely that pre-treated cells will
eventually reform a similar actin structure as they exhibited prior to inhibition.
Cells were then stained with phalloidin, a dye that specifically binds to F-actin in cells.
When ES cells were stained with phalloidin, F-actin appeared diffuse and concentrated
mainly within the periphery of cells (Figure 4.12). This was in contrast to cells such as
fibroblasts (Pelham & Wang, 1997) and mesenchymal stem cells (Engler et al, 2006),
which form organised stress fibers within the cytoplasm. This is also likely to be one of
the reasons why ES cells are more three-dimensional in nature than fibroblasts, which
tend to be flattened, spread and two-dimensional (Chapter 3). As mentioned earlier,
actin also concentrates at the cortical regions in cells during the gastrulation stage of
embryogenesis (Krieg et al, 2008; Skoglund et al, 2008).
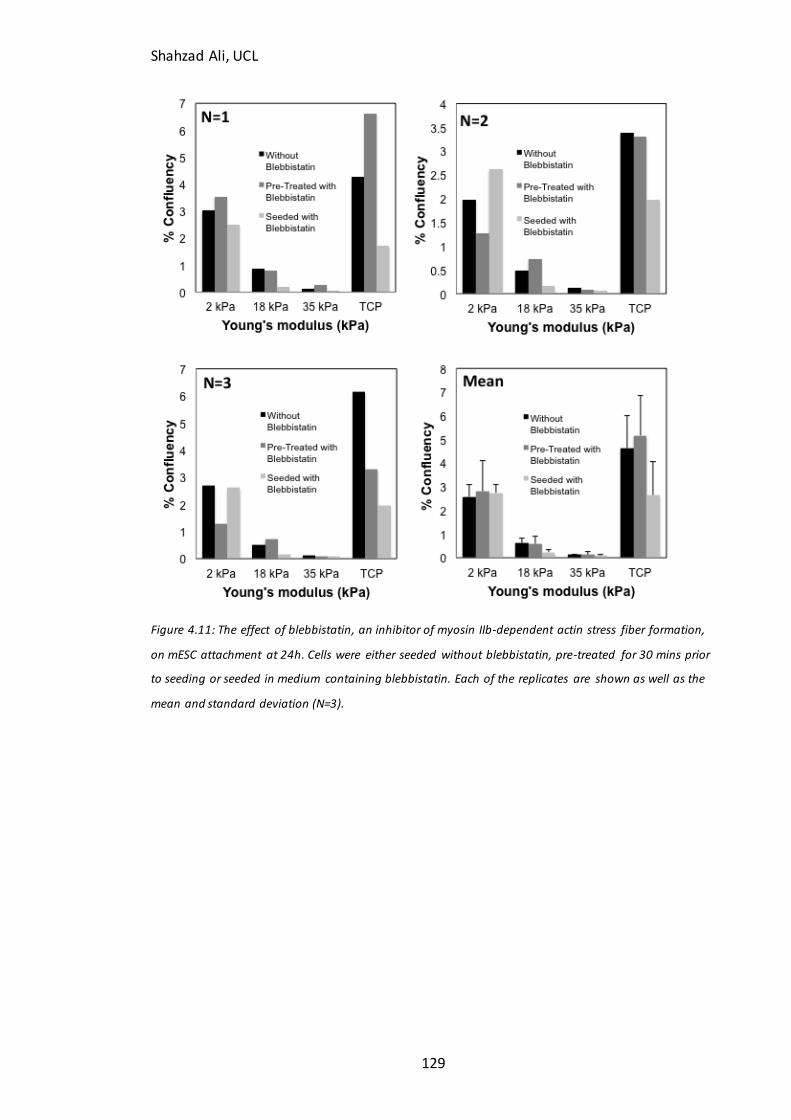
Shahzad Ali, UCL
129
Figure 4.11: The effect of blebbistatin, an inhibitor of myosin IIb-dependent actin stress fiber formation,
on mESC attachment at 24h. Cells were either seeded without blebbistatin, pre-treated for 30 mins prior
to seeding or seeded in medium containing blebbistatin. Each of the replicates are shown as well as the
mean and standard deviation (N=3).
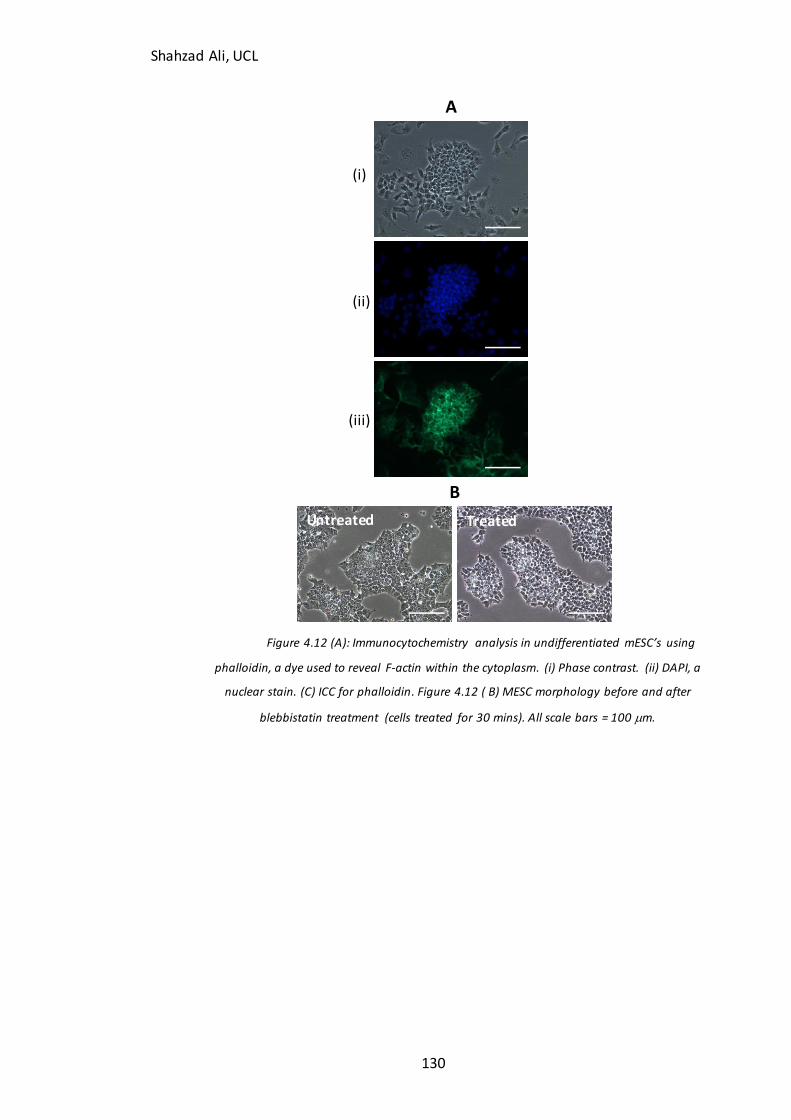
Shahzad Ali, UCL
130
A
B
Figure 4.12 (A): Immunocytochemistry analysis in undifferentiated mESC’s using
phalloidin, a dye used to reveal F-actin within the cytoplasm. (i) Phase contrast. (ii) DAPI, a
nuclear stain. (C) ICC for phalloidin. Figure 4.12 ( B) MESC morphology before and after
blebbistatin treatment (cells treated for 30 mins). All scale bars = 100 m.
(i)
(ii)
(iii)
Untreated Treated
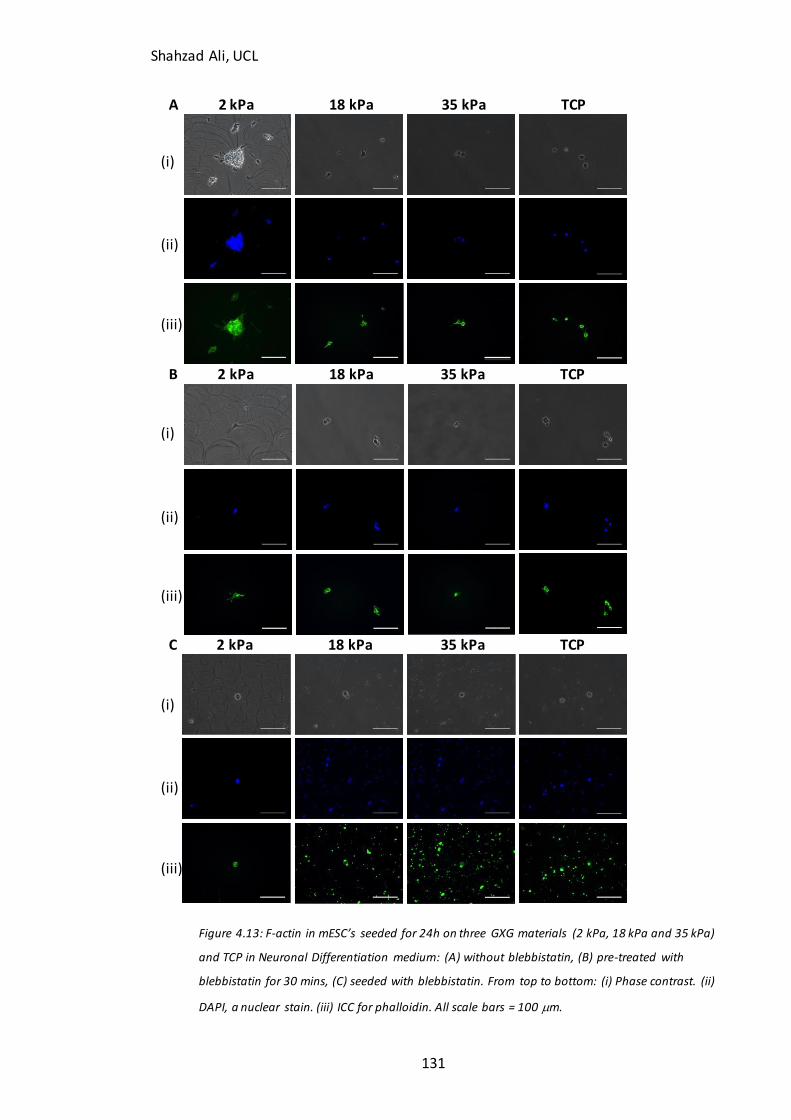
Shahzad Ali, UCL
131
A 2 kPa 18 kPa 35 kPa TCP
B 2 kPa 18 kPa 35 kPa TCP
C 2 kPa 18 kPa 35 kPa TCP
Figure 4.13: F-actin in mESC’s seeded for 24h on three GXG materials (2 kPa, 18 kPa and 35 kPa)
and TCP in Neuronal Differentiation medium: (A) without blebbistatin, (B) pre-treated with
blebbistatin for 30 mins, (C) seeded with blebbistatin. From top to bottom: (i) Phase contrast. (ii)
DAPI, a nuclear stain. (iii) ICC for phalloidin. All scale bars = 100 m.
(i)
(iii)
(ii)
(i)
(iii)
(ii)
(i)
(iii)
(ii)
Shahzad Ali, UCL
132
When phalloidin staining was performed on cells seeded for 24h on GXG and TCP
(Figure 4.13) without blebbistatin, stress fibres were not formed on any of the
materials. F-actin appeared diffuse, mainly concentrated at the cell cortex.
As expected, when cells were pre-treated with blebbistatin or seeded with
blebbistatin, the same F-actin structure was observed in treated cells as in untreated
cells, as no organised F-actin stress fibres were present in the untreated condition. The
lack of stress fibres in mESC’s prevented blebbistatin from having any effect on initial
attachment. Thus mESC’s do not require actin stress fibre stabilization in order to
attach to any material.
The actin cytoskeleton is the main conduit for the transduction of mechanical signals
to the nucleus. The nucleoskeleton, which also contains polymerized F-actin is
connected to both the cytoskeleton as well as the transcriptional machinery of the cell
(Wang et al, 2009). For this reason, actin stress fibre contraction, dependent on
myosin IIb (the protein inhibited by blebbistatin) is implicated in gene expression
(Engler et al, 2006) responses to changes in stiffness. However, as the mouse ES cells
have no organised stress fibers, there is no conduit for mechanotransduction of
mechanical signals from the ECM to the nucleus. This may explain why Young’s
modulus changes do not provoke gene expression responses in mESC’s during early
differentiation (Figure 4.10).
Microtubules are another key structural component of cells. Unlike F-actin,
microtubules have not been previously found to be implicated in gene expression
responses to changes in Young’s modulus. However, as the effect of Young’s modulus
on neural precursor formation is based on attachment and not gene expression, it is
possible that the effect of Young’s modulus on mESC’s may be dependent on another
structural component other than the actin cytoskeleton. Thus, this chapter’s final pair
of experiments aimed to investigate whether attachment was dependent on the
formation of microtubules from -tubulin. This was achieved by inhibiting microtubule
formation using another small molecule, nocodazole.
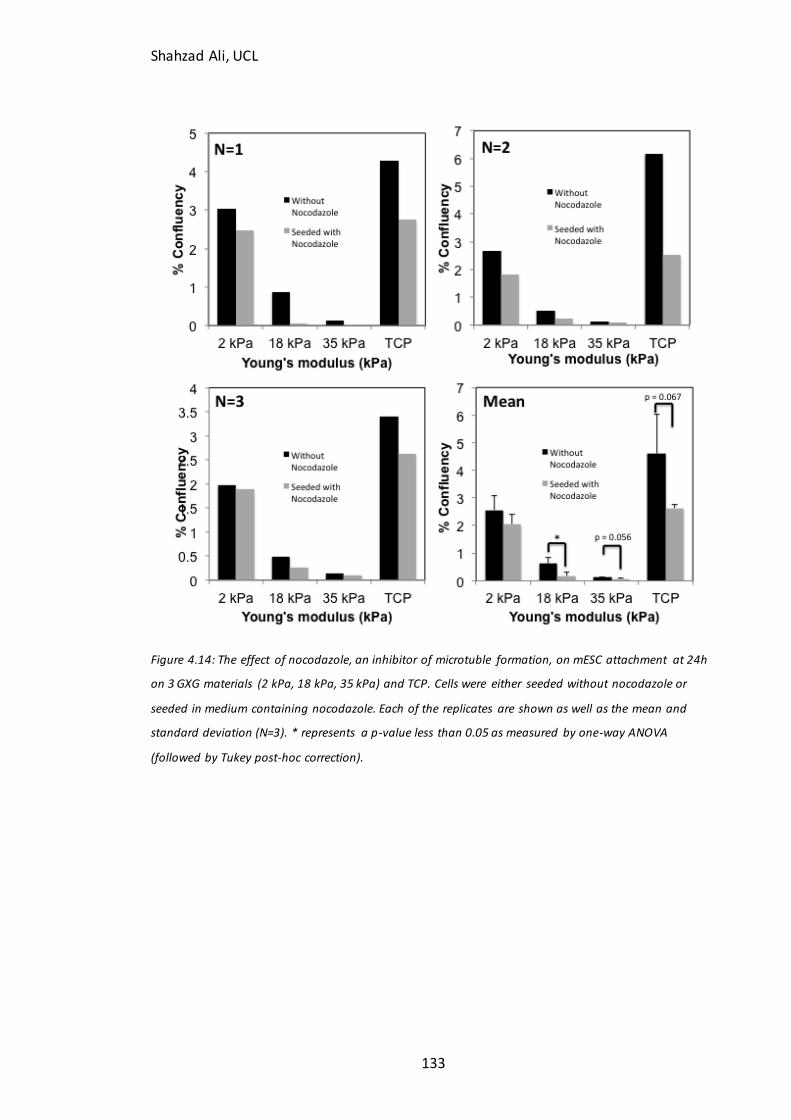
Shahzad Ali, UCL
133
Figure 4.14: The effect of nocodazole, an inhibitor of microtuble formation, on mESC attachment at 24h
on 3 GXG materials (2 kPa, 18 kPa, 35 kPa) and TCP. Cells were either seeded without nocodazole or
seeded in medium containing nocodazole. Each of the replicates are shown as well as the mean and
standard deviation (N=3). * represents a p-value less than 0.05 as measured by one-way ANOVA
(followed by Tukey post-hoc correction).
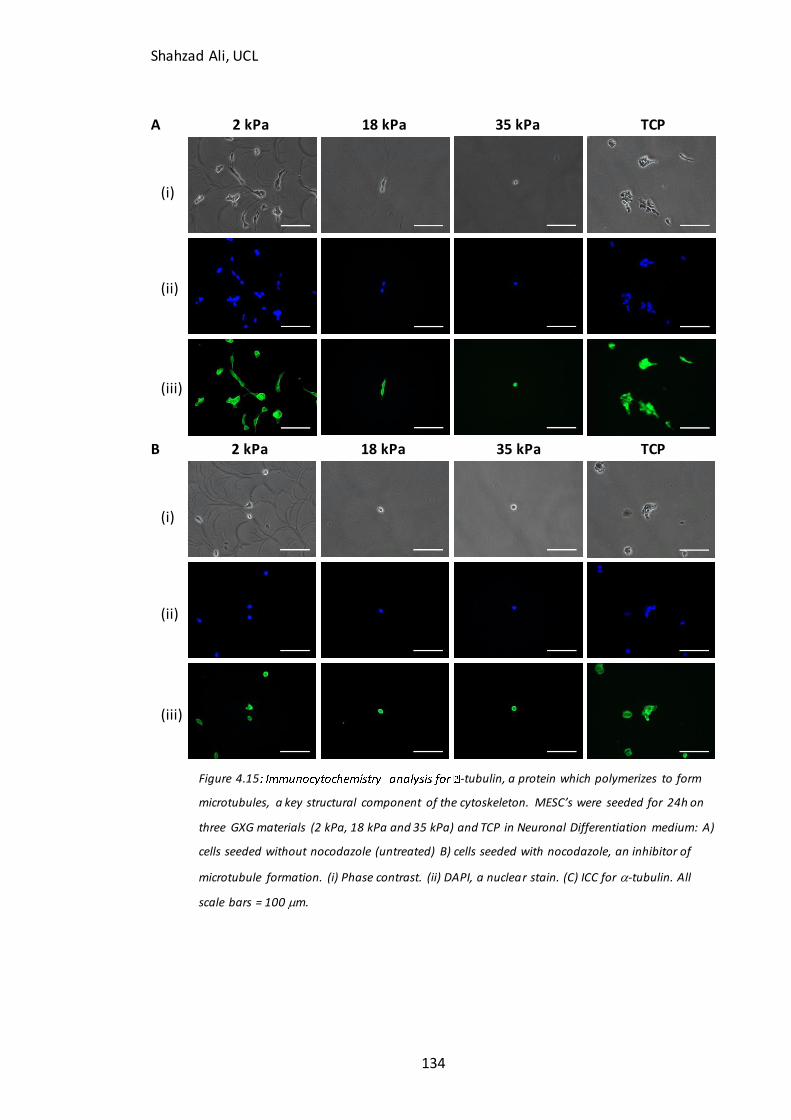
Shahzad Ali, UCL
134
A 2 kPa 18 kPa 35 kPa TCP
B 2 kPa 18 kPa 35 kPa TCP
Figure 4.15 -tubulin, a protein which polymerizes to form
microtubules, a key structural component of the cytoskeleton. MESC’s were seeded for 24h on
three GXG materials (2 kPa, 18 kPa and 35 kPa) and TCP in Neuronal Differentiation medium: A)
cells seeded without nocodazole (untreated) B) cells seeded with nocodazole, an inhibitor of
microtubule formation. (i) Phase contrast. (ii) DAPI, a nuclear stain. (C) ICC for -tubulin. All
scale bars = 100 m.
(i)
(iii)
(ii)
(i)
(iii)
(ii)
Shahzad Ali, UCL
135
As with blebbistatin, seeding with nocodazole had no significant (p=0.322) effect upon
attachment on the soft 2 kPa GXG material. However, on stiffer GXG materials
attachment decreased with nocodazole seeding compared to the untreated condition.
This result was only significant (p<0.05) on the 18 kPa GXG materials, where
attachment decreased by 71%. However the p-value was 0.056 on the 35 kPa material
(confluency decreased 44%), implying that a trend did exist.
Interestingly, cells that do attach on stiffer materials cannot remain attached (or
cannot initially attach) if microtubule formation is inhibited. Cells on the softest
material remain attached regardless of microtubule formation. Microtubule
concentration has been previously been implicated in the stiffening of neuronal cells
(Spedden et al, 2012). This may also be the case in ES cells, as they do not have the
actin stress fibres required for stiffening. Cells have been previously shown to undergo
‘stiffness matching’ (Tee et al, 2009). This is where cells stiffen on stiff materials and
remain soft on soft materials. In a soluble microenvironment that promotes neuronal
differentiation, the stiffening of cells on stiff materials is unlikely to occur without
microtubule formation. Therefore, cells on stiffer materials (cells which have
undergone stiffening themselves) are more susceptible to the effects of nocodazole
than cells on softer materials.
4.5 Summary of Findings
It was concluded that soft materials favour the formation of neural precursors from
mESC’s in neuronal differentiation medium. This effect is dependent upon increased
attachment of mESC’s on soft materials, rather than a direct promotion of neuronal
differentiation. This was demonstrated using a number of assays for cell identity. The
assays revealed no differences in gene expression, or marker presence with Young’s
modulus. When compared to the increased confluency at 24h on soft materials, this
confirmed the central hypothesis. It was furthermore found that this effect is neither
dependent on stress fibre stabilisation. Interestingly, mESC’s did not attach on stiffer
materials if microtubule polymerisation was inhibited.
Shahzad Ali, UCL
136
5 Does Young’s modulus affect attachment and enrichment of partially-
differentiated mouse embryonic stem cells differentiated in N2B27
medium?
Once it was understood how Young’s modulus influenced the formation of neural
precursor from mESC’s, the next stage was to investigate how modulus affected later
stages of mESC neuronal differentiation. In Chapter 4, it was found that when mESC’s
were seeded on GXG in neuronal differentiation medium, attachment was maximized
on the softest GXG material, whose elasticity was most similar to that of the early
mouse blastocyst. This favourable attachment led to increased neural precursor
formation at day four. Despite this, soft materials had no direct effect promoting
neuronal differentiation.
5.1 Aims
The aim of Chapter 5 was to investigate whether Young’s modulus had an effect on the
attachment of partially-differentiated cells. This involved differentiating mESC’s for a
defined period of time on TCP (partial differentiation), before differentiating them
further on GXG. Previous studies using stem cells at a more advanced stage of
differentiation such as mesenchymal stem cells (Engler et al, 2006) and neural stem
cells (Banerjee et al, 2009; Saha et al, 2008; Leipzig & Schoichet, 2009) have shown
that, unlike with mESC’s, soft substrates directly favour neuronal differentiation,
independent of initial attachment.
Similar results were found in more mature neuronal cell types such as neural
precursors (Georges et al, 2006; Jiang et al, 2007; Previtera et al, 2010) and primary
cortical neurons (Flanagan et al, 2006). In these cases, neuronal growth and
maturation was optimized on soft materials. Taking this into account with the results
of Chapter 4, this suggests that the effect of Young’s modulus on neuronal
differentiation changes as cells mature. During early differentiation of mESC’s, Young ’s
modulus favours attachment without directly promoting the neuronal fate. This effect
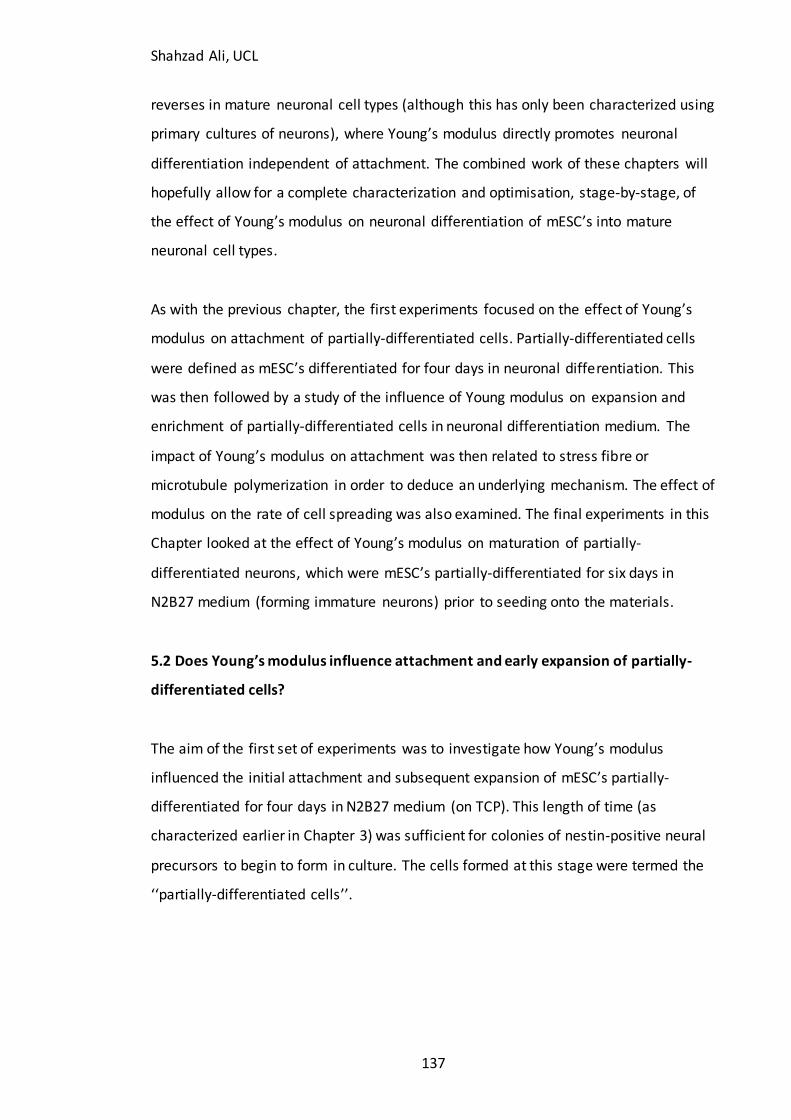
Shahzad Ali, UCL
137
reverses in mature neuronal cell types (although this has only been characterized using
primary cultures of neurons), where Young’s modulus directly promotes neuronal
differentiation independent of attachment. The combined work of these chapters will
hopefully allow for a complete characterization and optimisation, stage-by-stage, of
the effect of Young’s modulus on neuronal differentiation of mESC’s into mature
neuronal cell types.
As with the previous chapter, the first experiments focused on the effect of Young’s
modulus on attachment of partially-differentiated cells. Partially-differentiated cells
were defined as mESC’s differentiated for four days in neuronal differentiation. This
was then followed by a study of the influence of Young modulus on expansion and
enrichment of partially-differentiated cells in neuronal differentiation medium. The
impact of Young’s modulus on attachment was then related to stress fibre or
microtubule polymerization in order to deduce an underlying mechanism. The effect of
modulus on the rate of cell spreading was also examined. The final experiments in this
Chapter looked at the effect of Young’s modulus on maturation of partially-
differentiated neurons, which were mESC’s partially-differentiated for six days in
N2B27 medium (forming immature neurons) prior to seeding onto the materials.
5.2 Does Young’s modulus influence attachment and early expansion of partially-
differentiated cells?
The aim of the first set of experiments was to investigate how Young’s modulus
influenced the initial attachment and subsequent expansion of mESC’s partially-
differentiated for four days in N2B27 medium (on TCP). This length of time (as
characterized earlier in Chapter 3) was sufficient for colonies of nestin-positive neural
precursors to begin to form in culture. The cells formed at this stage were termed the
‘‘partially-differentiated cells’’.
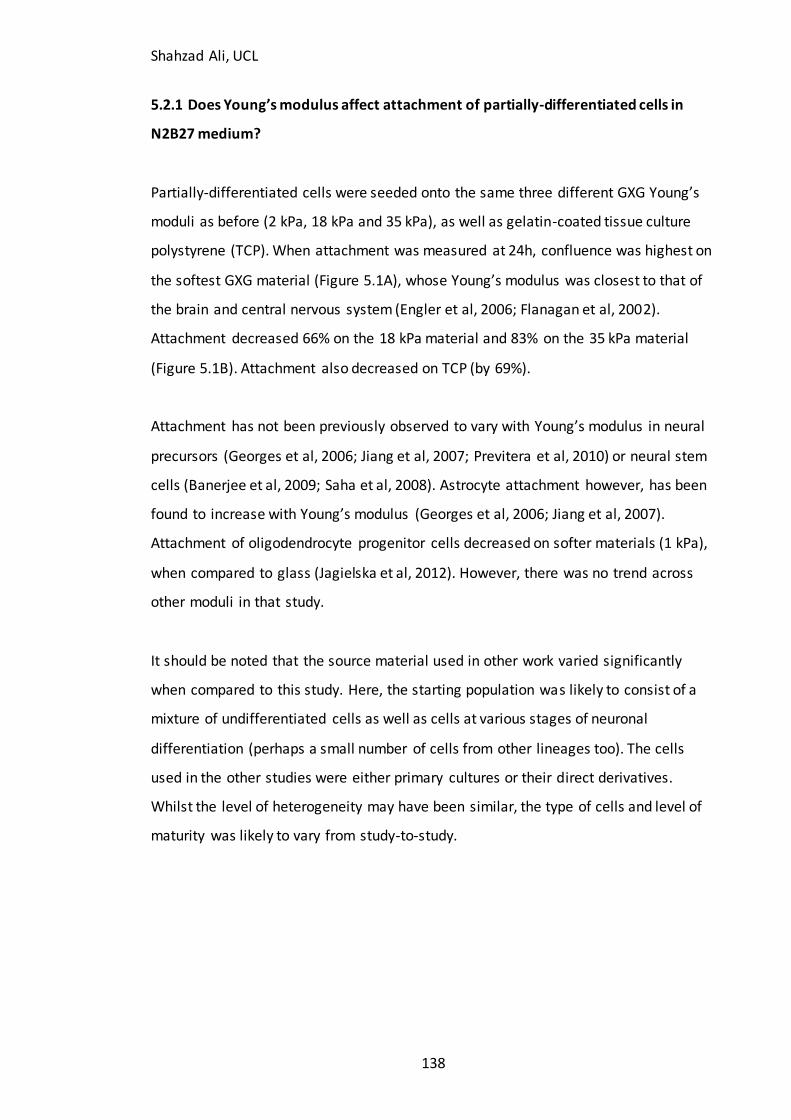
Shahzad Ali, UCL
138
5.2.1 Does Young’s modulus affect attachment of partially-differentiated cells in
N2B27 medium?
Partially-differentiated cells were seeded onto the same three different GXG Young’s
moduli as before (2 kPa, 18 kPa and 35 kPa), as well as gelatin-coated tissue culture
polystyrene (TCP). When attachment was measured at 24h, confluence was highest on
the softest GXG material (Figure 5.1A), whose Young’s modulus was closest to that of
the brain and central nervous system (Engler et al, 2006; Flanagan et al, 2002).
Attachment decreased 66% on the 18 kPa material and 83% on the 35 kPa material
(Figure 5.1B). Attachment also decreased on TCP (by 69%).
Attachment has not been previously observed to vary with Young’s modulus in neural
precursors (Georges et al, 2006; Jiang et al, 2007; Previtera et al, 2010) or neural stem
cells (Banerjee et al, 2009; Saha et al, 2008). Astrocyte attachment however, has been
found to increase with Young’s modulus (Georges et al, 2006; Jiang et al, 2007).
Attachment of oligodendrocyte progenitor cells decreased on softer materials (1 kPa),
when compared to glass (Jagielska et al, 2012). However, there was no trend across
other moduli in that study.
It should be noted that the source material used in other work varied significantly
when compared to this study. Here, the starting population was likely to consist of a
mixture of undifferentiated cells as well as cells at various stages of neuronal
differentiation (perhaps a small number of cells from other lineages too). The cells
used in the other studies were either primary cultures or their direct derivatives.
Whilst the level of heterogeneity may have been similar, the type of cells and level of
maturity was likely to vary from study-to-study.
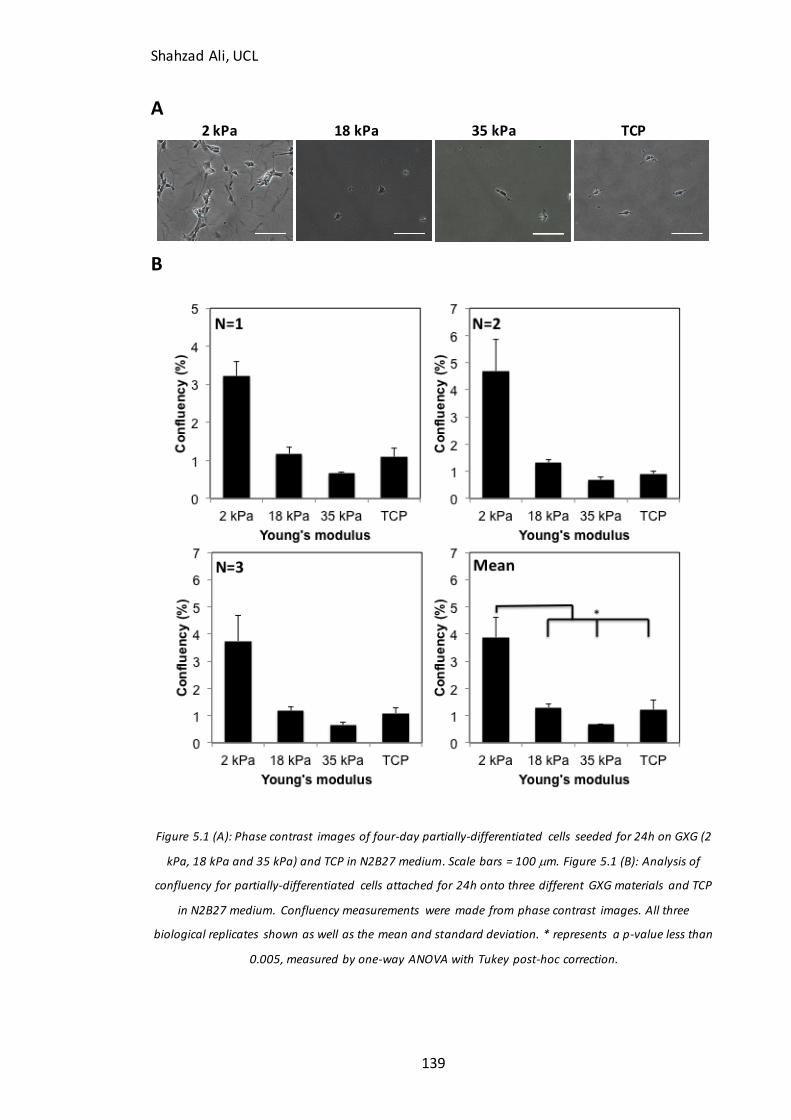
Shahzad Ali, UCL
139
A
2 kPa 18 kPa 35 kPa TCP
B
Figure 5.1 (A): Phase contrast images of four-day partially-differentiated cells seeded for 24h on GXG (2
kPa, 18 kPa and 35 kPa) and TCP in N2B27 medium. Scale bars = 100 m. Figure 5.1 (B): Analysis of
confluency for partially-differentiated cells attached for 24h onto three different GXG materials and TCP
in N2B27 medium. Confluency measurements were made from phase contrast images. All three
biological replicates shown as well as the mean and standard deviation. * represents a p-value less than
0.005, measured by one-way ANOVA with Tukey post-hoc correction.
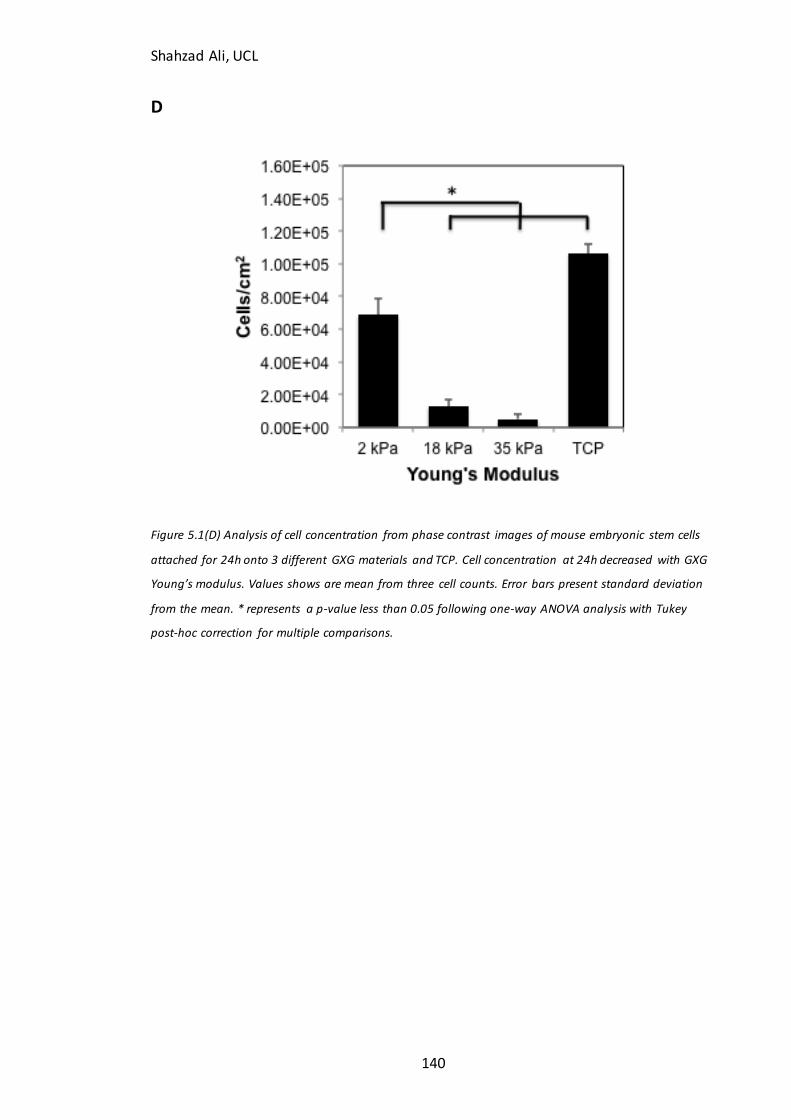
Shahzad Ali, UCL
140
D
Figure 5.1(D) Analysis of cell concentration from phase contrast images of mouse embryonic stem cells
attached for 24h onto 3 different GXG materials and TCP. Cell concentration at 24h decreased with GXG
Young’s modulus. Values shows are mean from three cell counts. Error bars present standard deviation
from the mean. * represents a p-value less than 0.05 following one-way ANOVA analysis with Tukey
post-hoc correction for multiple comparisons.
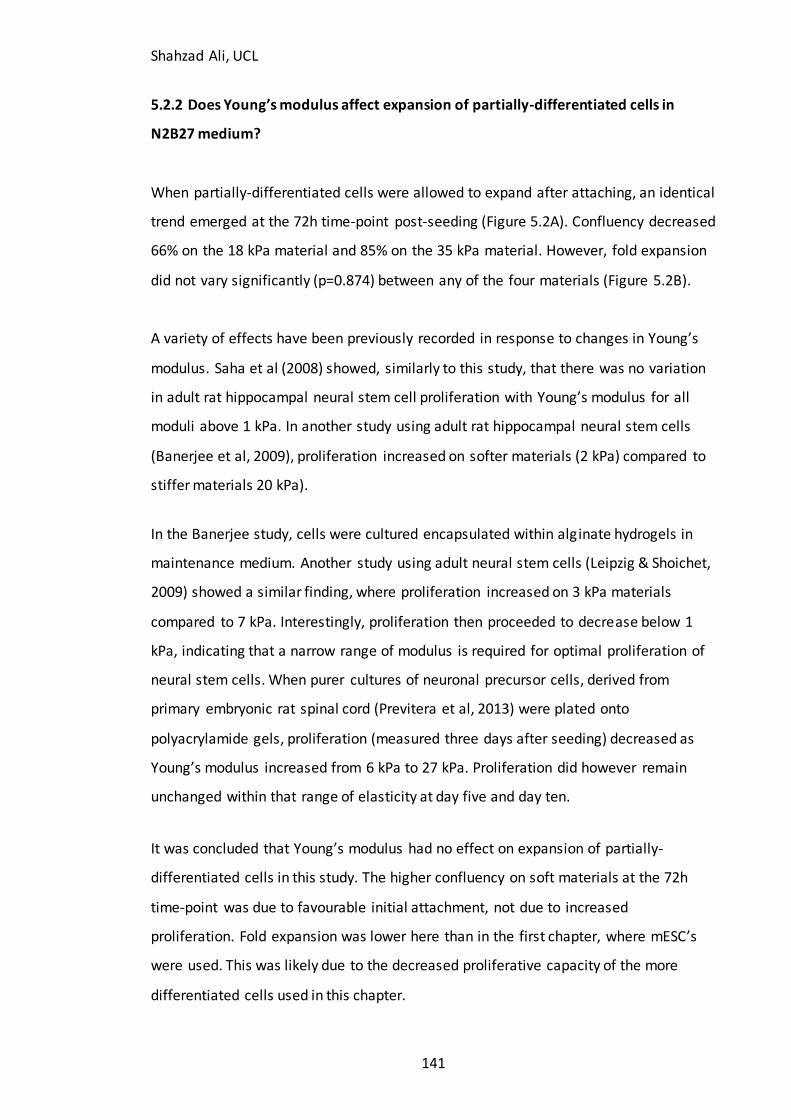
Shahzad Ali, UCL
141
5.2.2 Does Young’s modulus affect expansion of partially-differentiated cells in
N2B27 medium?
When partially-differentiated cells were allowed to expand after attaching, an identical
trend emerged at the 72h time-point post-seeding (Figure 5.2A). Confluency decreased
66% on the 18 kPa material and 85% on the 35 kPa material. However, fold expansion
did not vary significantly (p=0.874) between any of the four materials (Figure 5.2B).
A variety of effects have been previously recorded in response to changes in Young’s
modulus. Saha et al (2008) showed, similarly to this study, that there was no variation
in adult rat hippocampal neural stem cell proliferation with Young’s modulus for all
moduli above 1 kPa. In another study using adult rat hippocampal neural stem cells
(Banerjee et al, 2009), proliferation increased on softer materials (2 kPa) compared to
stiffer materials 20 kPa).
In the Banerjee study, cells were cultured encapsulated within alginate hydrogels in
maintenance medium. Another study using adult neural stem cells (Leipzig & Shoichet,
2009) showed a similar finding, where proliferation increased on 3 kPa materials
compared to 7 kPa. Interestingly, proliferation then proceeded to decrease below 1
kPa, indicating that a narrow range of modulus is required for optimal proliferation of
neural stem cells. When purer cultures of neuronal precursor cells, derived from
primary embryonic rat spinal cord (Previtera et al, 2013) were plated onto
polyacrylamide gels, proliferation (measured three days after seeding) decreased as
Young’s modulus increased from 6 kPa to 27 kPa. Proliferation did however remain
unchanged within that range of elasticity at day five and day ten.
It was concluded that Young’s modulus had no effect on expansion of partially-
differentiated cells in this study. The higher confluency on soft materials at the 72h
time-point was due to favourable initial attachment, not due to increased
proliferation. Fold expansion was lower here than in the first chapter, where mESC’s
were used. This was likely due to the decreased proliferative capacity of the more
differentiated cells used in this chapter.
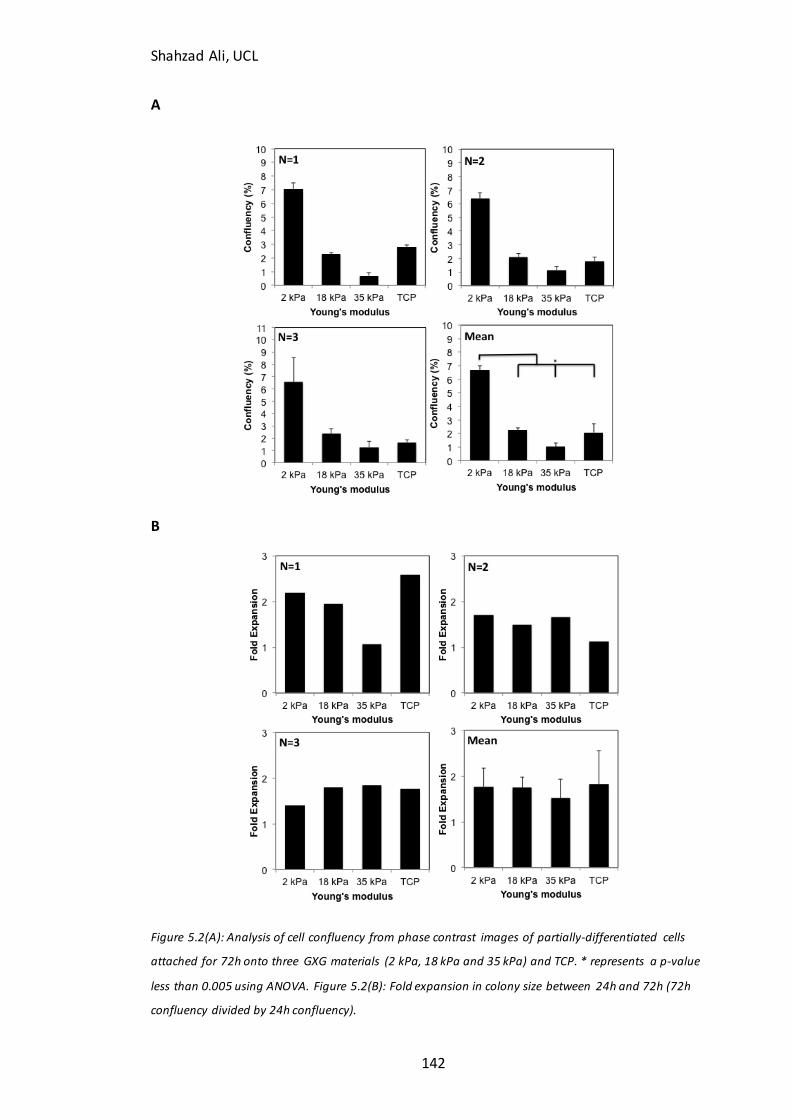
Shahzad Ali, UCL
142
A
B
Figure 5.2(A): Analysis of cell confluency from phase contrast images of partially-differentiated cells
attached for 72h onto three GXG materials (2 kPa, 18 kPa and 35 kPa) and TCP. * represents a p-value
less than 0.005 using ANOVA. Figure 5.2(B): Fold expansion in colony size between 24h and 72h (72h
confluency divided by 24h confluency).

Shahzad Ali, UCL
143
Shahzad Ali, UCL
144
5.3 Does Young’s modulus affect the initial rate of spreading of partially-
differentiated cells?
Rate of spreading measurement allowed for identification of whether the higher
confluency on soft materials was exclusively dependent on initial attachment of
partially-differentiated cells. To investigate rate of spreading, partially-differentiated
cells were seeded onto three GXG materials and TCP after being incubated for 30
minutes in CellTracker, a membrane-specific dye that allowed for easy identification of
the cell perimeter. Measurements of projected cell surface area were made at two,
four and six hours after seeding.
As Figure 5.3 shows, there was no difference in rate of spreading (increase in
projection area) amongst the GXG materials. There was a 36.5% increase in
projected area on TCP, but overall mean cell surface area was the same across all
materials at the 6h time-point. Soft materials did not increase rate of spreading.
In an earlier study (Georges et al, 2006), mixtures of cortical neurons were plated onto
varying Young’s moduli. In that study, cellular projected area at 24 hours was
significantly higher on stiff materials (9 kPa) compared to the soft materials (100 Pa).
This contradicted our findings at 6 hours, where projection area did not vary with
modulus. The mean projected areas of cells in this study (500 to 700 m2) were lower
on every GXG material compared to the 2000 m2 measured in that study (Georges et
al, 2005) for a similar Young’s modulus range. This likely reflects the differences in
source material. Cortical neurons are considerably more mature and larger in surface
area (when taking into account their long, branched neurites) than the day four
neuronal precursors in this study.
In other studies using other cell types such as fibroblasts (Pelham & Wang, 1995);
C2C12 skeletal myoblasts; FC7 fibroblasts (Engler et al, 2004b); and endothelial cells
(Yeung et al, 2005), projected areas (defined as spreading) were also higher on stiffer
materials.
Shahzad Ali, UCL
145
Figure 5.3: Rate of spreading for partially-differentiated cells over the first six hours of attachment on
three GXG materials (2 kPa, 18 kPa and 35 kPa) and TCP in neuronal differentiation medium. The figure
on the left shows the mean surface area of cells. The figure on the right shows cell surface area
normalized against the initial value at t=2h. Error bars represent standard deviation from the mean,
based upon three technical triplicates (from three independent GXG wells for each condition based).
N=15 randomly selected cells.
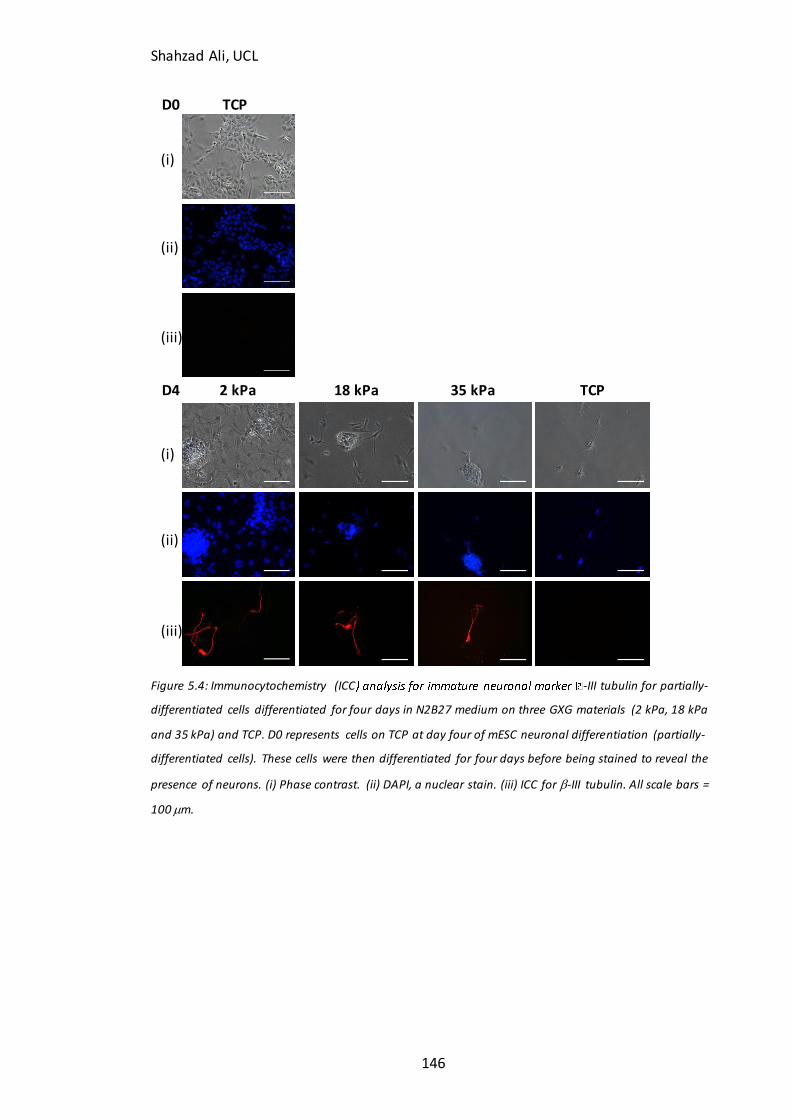
Shahzad Ali, UCL
146
D0 TCP
D4 2 kPa 18 kPa 35 kPa TCP
Figure 5.4: Immunocytochemistry (ICC -III tubulin for partially-
differentiated cells differentiated for four days in N2B27 medium on three GXG materials (2 kPa, 18 kPa
and 35 kPa) and TCP. D0 represents cells on TCP at day four of mESC neuronal differentiation (partially-
differentiated cells). These cells were then differentiated for four days before being stained to reveal the
presence of neurons. (i) Phase contrast. (ii) DAPI, a nuclear stain. (iii) ICC for -III tubulin. All scale bars =
100 m.
(i)
(iii)
(ii)
(i)
(iii)
(ii)
Shahzad Ali, UCL
147
5.4 Does Young’s modulus affect the phenotype of cells formed after four days of
neuronal precursor differentiation in N2B27 medium?
5.4.1 Does Young’s modulus affect the formation of immature neurons from
partially-differentiated cells in N2B27 medium?
Partially-differentiated cells were allowed to further differentiate for four days on GXG
and TCP in neuronal differentiation medium. At this stage, immunocytochemistry was
performed for -III tubulin, a marker for immature neurons (Ying et al, 2003).
This marker was used, as it is typically the earliest neuronal subtype to appear during
differentiation (Chapter 3). At day four, -III tubulin appeared in colonies on all three
GXG materials (Figure 5.4). Furthermore, unlike in Chapter 4, cells containing -III
tubulin extended neurites out from the colonies on all four materials. In Chapter 4,
neurites only extended out from colonies on the 2 kPa material. Young’s modulus
therefore has no effect on the formation of immature neurons from partially-
differentiated cells.
This trend was consistent with the findings of other studies (with a similar Young’s
modulus ranges) that used -III tubulin immunocytochemistry analysis on neural stem
cells in neuronal differentiation medium (Saha et al, 2008: Banerjee et al, 2009). A
similar result was also shown in another study using MAP2, a more mature neuronal
marker (Previtera et al, 2010). There were other studies, which provided contradictory
findings both to this study as well as when compared to each other. For example, more
-III tubulin positive cells were shown to be present on lower moduli (Georges et al,
2006) in an earlier study, whilst more have been found on higher moduli (Previtera et
al, 2013; Kothapalli & Kamm, 2013) in two recent studies. These discrepancies reflect
variations in source material (embryonic, adult, spinal cord or brain) as well as
differentiation length and conditions. There is a limited basis for comparison between
biomaterials and TCP. The study by Saha et al (2008) did find that the proportion of
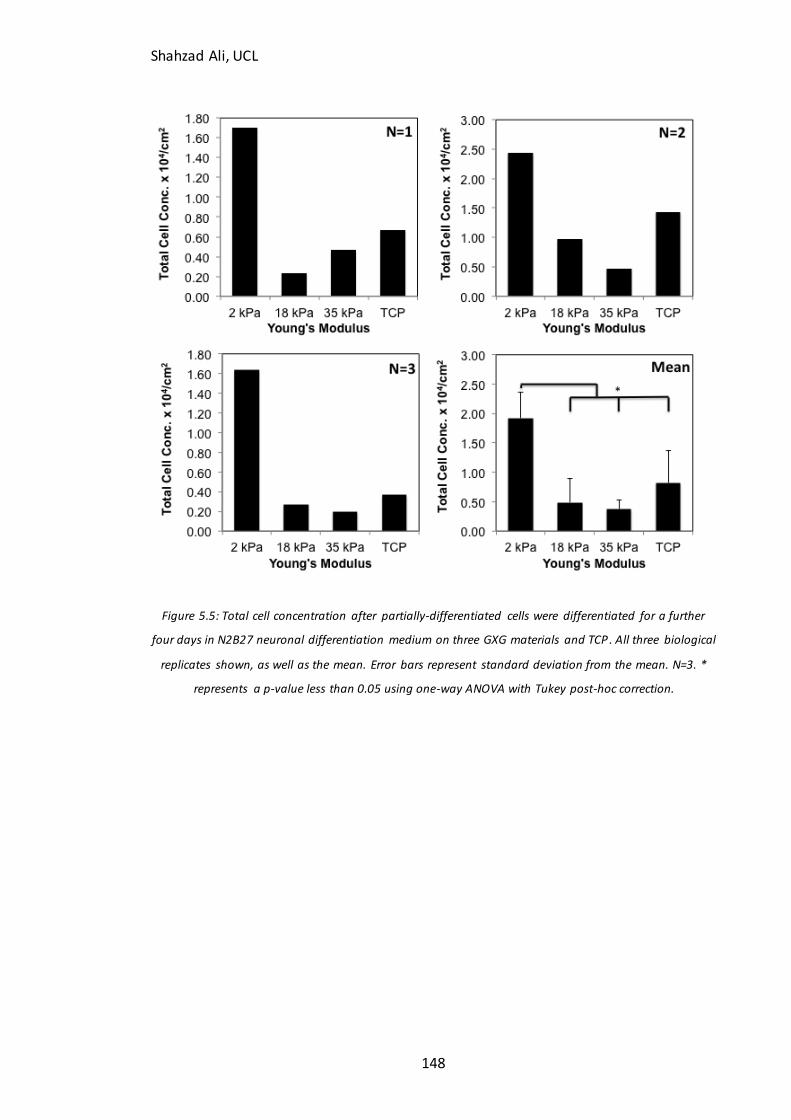
Shahzad Ali, UCL
148
Figure 5.5: Total cell concentration after partially-differentiated cells were differentiated for a further
four days in N2B27 neuronal differentiation medium on three GXG materials and TCP . All three biological
replicates shown, as well as the mean. Error bars represent standard deviation from the mean. N=3. *
represents a p-value less than 0.05 using one-way ANOVA with Tukey post-hoc correction.
Shahzad Ali, UCL
149
total cells that were -III tubulin positive was significantly higher on biomaterials
compared to TCP, which was consistent with our findings.
5.4.2 Does Young’s modulus affect yield of PSA-NCAM positive cells following
differentiation in N2B27 medium?
A similar trend was emerging in partially-differentiated cells as with the mESC’s in
Chapter 4, where neuronal differentiation was not being directly promoted on soft
materials. In order to test this hypothesis further, flow cytometry was again performed
for PSA-NCAM. In order to isolate whether any increases in neuronal yield from
partially-differentiated cells on soft materials were solely due to the favourable initial
attachment and not due to a direct promotion of the neuronal fate, the flow
cytometry findings were compared to the total cell concentration at harvest.
To achieve this, cell counts (Figure 5.5) were performed at day four in order to assess
the total cell concentration (normalized against culture surface area) on each GXG
material and TCP. Total cell concentration was maximized on the softest material,
reducing by 75-80% on the stiffer GXG materials and almost 60% on the tissue culture
polystyrene. This finding was in agreement with the results of Figure 5.1 and 5.2,
where confluency analysis at 24h and 72h revealed the same patterns.
As with the mESC’s in Chapter 4, there was no significant (p=0.583) variation in
percentage of cells positive for PSA-NCAM (Figure 5.6A). The percentage varied from
60-75% across all four materials. In the case of all three GXG materials, the percentage
of cells positive for PSA-NCAM was significantly higher (p<0.05) than the value at day
four of mESC differentiation on TCP (32%). The value for partially-differentiated cells
on TCP after four days was also higher, but not significantly so (p=0.056). This is
evidence that neuronal differentiation was occurring on all materials.
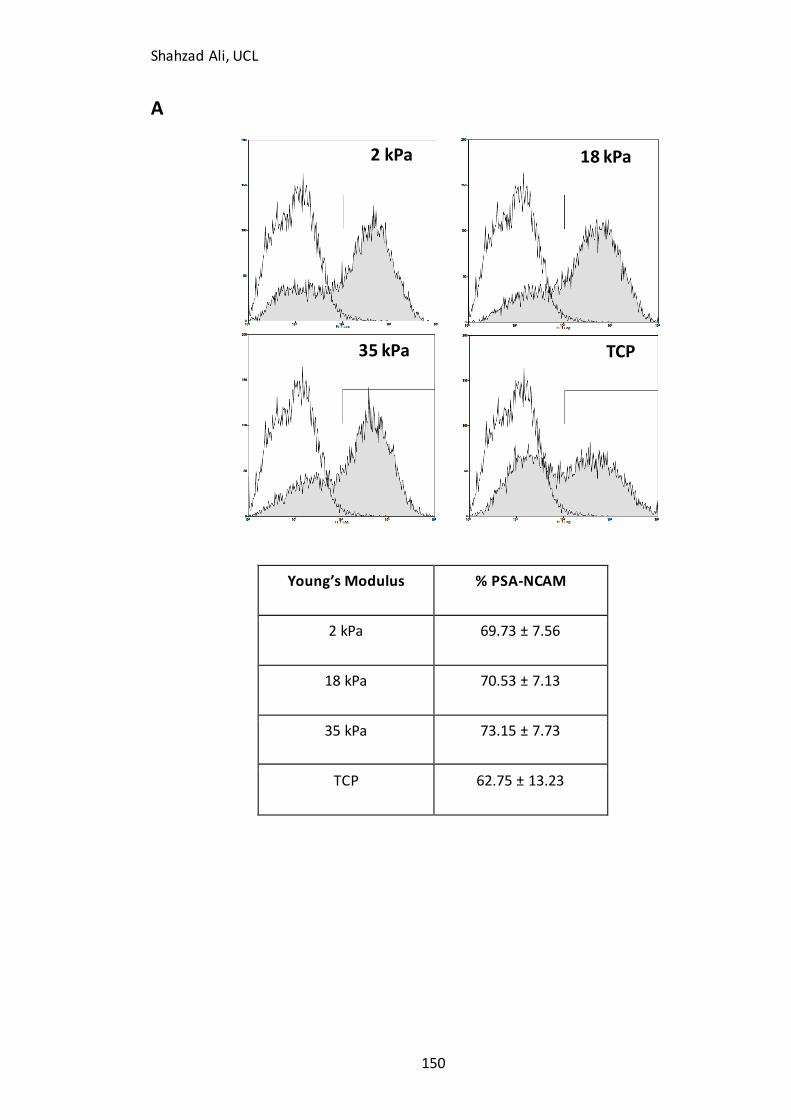
Shahzad Ali, UCL
150
A
Young’s Modulus % PSA-NCAM
2 kPa 69.73 ± 7.56
18 kPa 70.53 ± 7.13
35 kPa 73.15 ± 7.73
TCP 62.75 ± 13.23
18 kPa
TCP 35 kPa
2 kPa
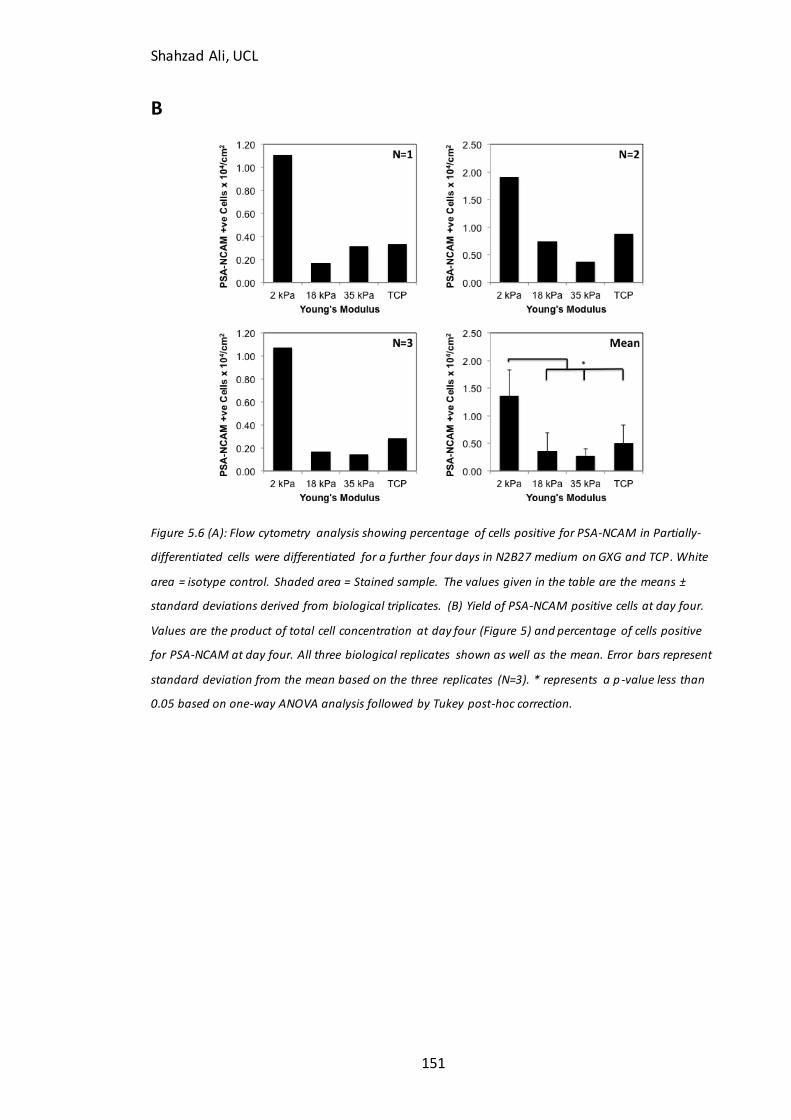
Shahzad Ali, UCL
151
B
Figure 5.6 (A): Flow cytometry analysis showing percentage of cells positive for PSA-NCAM in Partially-
differentiated cells were differentiated for a further four days in N2B27 medium on GXG and TCP . White
area = isotype control. Shaded area = Stained sample. The values given in the table are the means ±
standard deviations derived from biological triplicates. (B) Yield of PSA-NCAM positive cells at day four.
Values are the product of total cell concentration at day four (Figure 5) and percentage of cells positive
for PSA-NCAM at day four. All three biological replicates shown as well as the mean. Error bars represent
standard deviation from the mean based on the three replicates (N=3). * represents a p -value less than
0.05 based on one-way ANOVA analysis followed by Tukey post-hoc correction.
Shahzad Ali, UCL
152
Interestingly, the rate of change in percentage of cells positive for PSA-NCAM was
higher for partially-differentiated cells differentiating for four days on GXG than for
mESC’s differentiating for four days on TCP. The rates of change were similar for both
cell types on GXG. The rate of increase did not vary on the TCP throughout the eight
days of differentiation. This suggests the GXG increases the rate of neuron formation
compared to TCP without directly promoting the neuronal fate.
When the product of the total cell concentration and the percentage of cells positive
for PSA-NCAM was calculated, the resulting yield of PSA-NCAM positive cells following
differentiation varied with Young’s modulus according to a similar pattern to that
observed in Figure 5 (Figure 5.6B). PSA-NCAM positive yield was maximized upon the
softest GXG material (2 kPa). The percentage decreased significantly (p<0.05) upon the
other materials, falling by 74% on the 18 kPa material, 80% on the 35 kPa material and
63% on the TCP.
Despite the yield of neural precursors being maximized on the soft material, the
percentage of cells positive for the marker did not vary. Therefore, this effect is due to
favourable initial attachment over the first 24 hours and not due to a direct promotion
of the neuronal fate.
5.4.3 Does Young’s modulus influence mature neuronal gene expression in partially-
differentiated cells after four days of differentiation in N2B27 medium?
The final test for the hypothesis that soft substrates do not directly promote the
neuronal fate involved looking at the effect of Young’s modulus on gene expression in
cells following differentiation. Changes in phenotype, as measured by changes in cell
surface antigen presence do not tell the complete story. Real time qPCR allowed for
quantification of changes in key neuronal marker expression at a cellular level. In
addition to -III tubulin, three mature genes were investigated: 1) GFAP (glial fibrilliary
acidic protein), a gene expressed in astrocytes, which are non-neuronal glial cells that
play a number of supportive roles to neuronal growth; 2) TH (tyrosine hydroxylase), a
gene expressed in dopaminergic neurons, a neuronal subtype whose
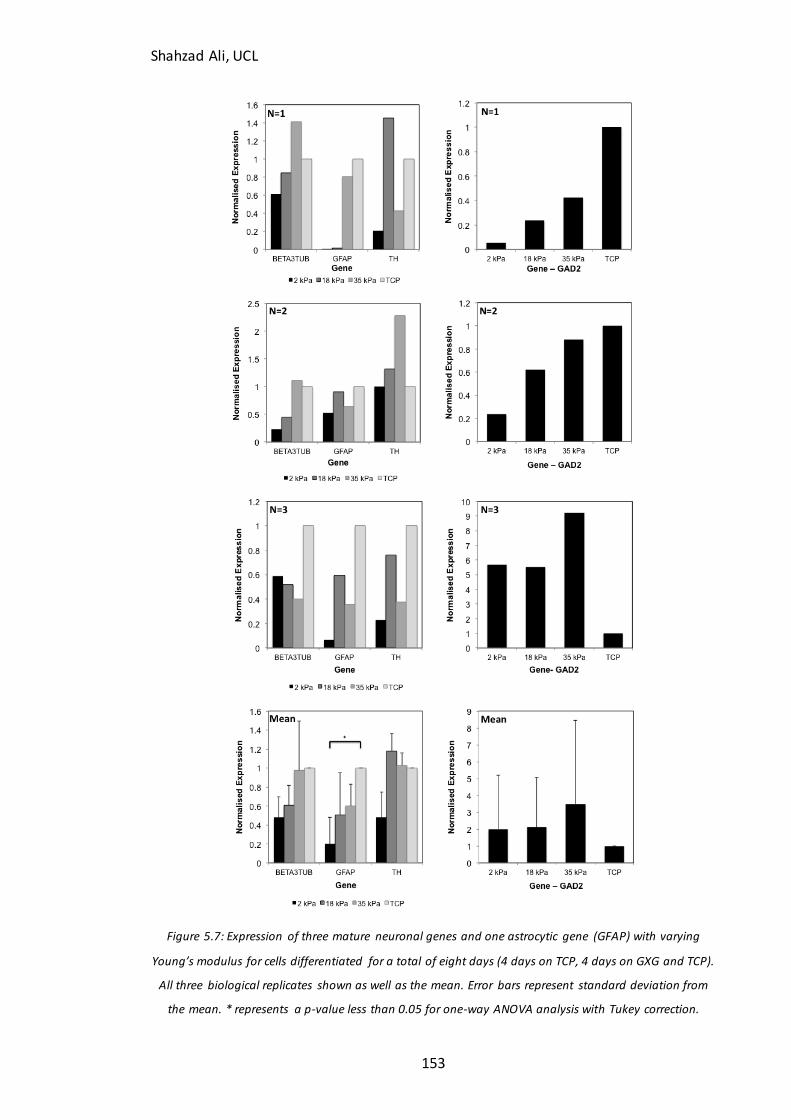
Shahzad Ali, UCL
153
Figure 5.7: Expression of three mature neuronal genes and one astrocytic gene (GFAP) with varying
Young’s modulus for cells differentiated for a total of eight days (4 days on TCP, 4 days on GXG and TCP).
All three biological replicates shown as well as the mean. Error bars represent standard deviation from
the mean. * represents a p-value less than 0.05 for one-way ANOVA analysis with Tukey correction.
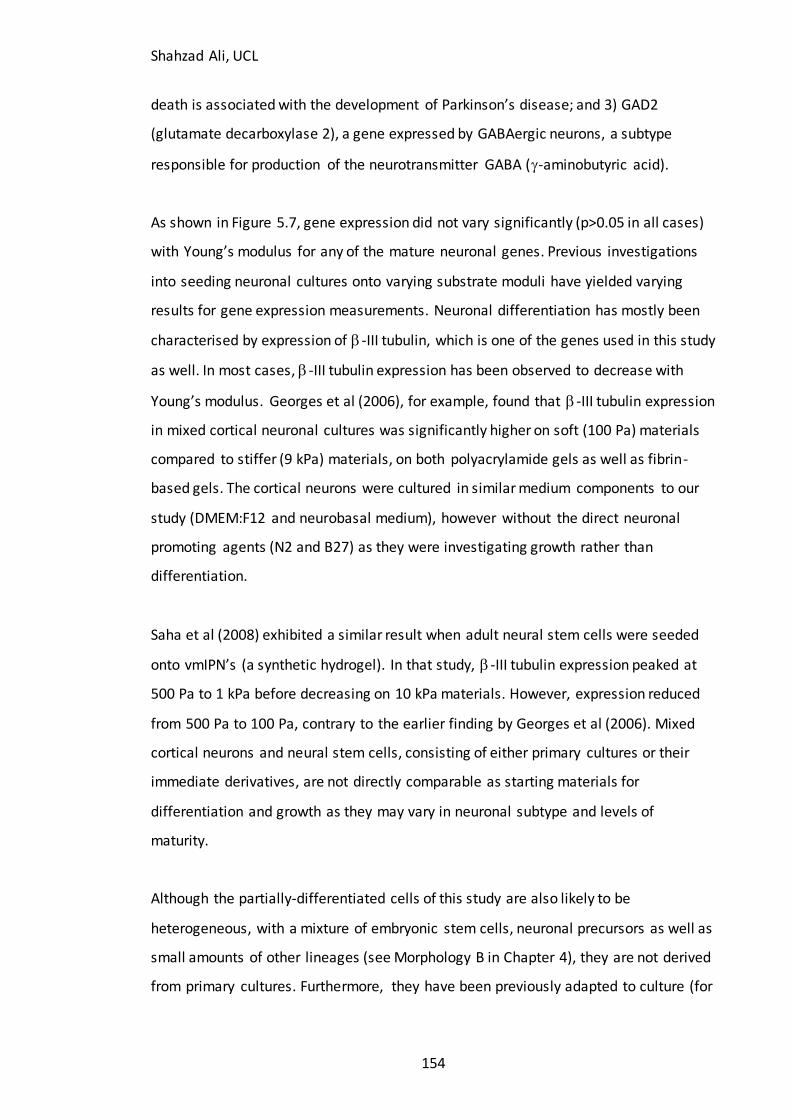
Shahzad Ali, UCL
154
death is associated with the development of Parkinson’s disease; and 3) GAD2
(glutamate decarboxylase 2), a gene expressed by GABAergic neurons, a subtype
responsible for production of the neurotransmitter GABA (-aminobutyric acid).
As shown in Figure 5.7, gene expression did not vary significantly (p>0.05 in all cases)
with Young’s modulus for any of the mature neuronal genes. Previous investigations
into seeding neuronal cultures onto varying substrate moduli have yielded varying
results for gene expression measurements. Neuronal differentiation has mostly been
characterised by expression of -III tubulin, which is one of the genes used in this study
as well. In most cases, -III tubulin expression has been observed to decrease with
Young’s modulus. Georges et al (2006), for example, found that -III tubulin expression
in mixed cortical neuronal cultures was significantly higher on soft (100 Pa) materials
compared to stiffer (9 kPa) materials, on both polyacrylamide gels as well as fibrin-
based gels. The cortical neurons were cultured in similar medium components to our
study (DMEM:F12 and neurobasal medium), however without the direct neuronal
promoting agents (N2 and B27) as they were investigating growth rather than
differentiation.
Saha et al (2008) exhibited a similar result when adult neural stem cells were seeded
onto vmIPN’s (a synthetic hydrogel). In that study, -III tubulin expression peaked at
500 Pa to 1 kPa before decreasing on 10 kPa materials. However, expression reduced
from 500 Pa to 100 Pa, contrary to the earlier finding by Georges et al (2006). Mixed
cortical neurons and neural stem cells, consisting of either primary cultures or their
immediate derivatives, are not directly comparable as starting materials for
differentiation and growth as they may vary in neuronal subtype and levels of
maturity.
Although the partially-differentiated cells of this study are also likely to be
heterogeneous, with a mixture of embryonic stem cells, neuronal precursors as well as
small amounts of other lineages (see Morphology B in Chapter 4), they are not derived
from primary cultures. Furthermore, they have been previously adapted to culture (for
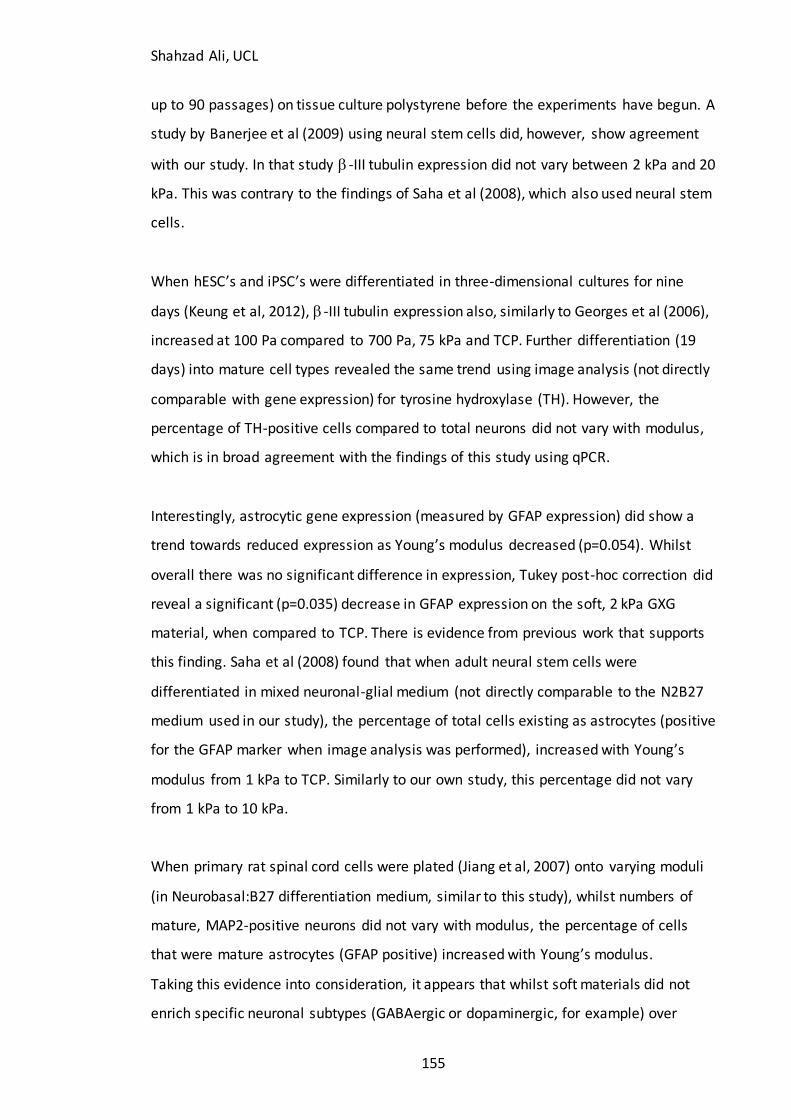
Shahzad Ali, UCL
155
up to 90 passages) on tissue culture polystyrene before the experiments have begun. A
study by Banerjee et al (2009) using neural stem cells did, however, show agreement
with our study. In that study -III tubulin expression did not vary between 2 kPa and 20
kPa. This was contrary to the findings of Saha et al (2008), which also used neural stem
cells.
When hESC’s and iPSC’s were differentiated in three-dimensional cultures for nine
days (Keung et al, 2012), -III tubulin expression also, similarly to Georges et al (2006),
increased at 100 Pa compared to 700 Pa, 75 kPa and TCP. Further differentiation (19
days) into mature cell types revealed the same trend using image analysis (not directly
comparable with gene expression) for tyrosine hydroxylase (TH). However, the
percentage of TH-positive cells compared to total neurons did not vary with modulus,
which is in broad agreement with the findings of this study using qPCR.
Interestingly, astrocytic gene expression (measured by GFAP expression) did show a
trend towards reduced expression as Young’s modulus decreased (p=0.054). Whilst
overall there was no significant difference in expression, Tukey post-hoc correction did
reveal a significant (p=0.035) decrease in GFAP expression on the soft, 2 kPa GXG
material, when compared to TCP. There is evidence from previous work that supports
this finding. Saha et al (2008) found that when adult neural stem cells were
differentiated in mixed neuronal-glial medium (not directly comparable to the N2B27
medium used in our study), the percentage of total cells existing as astrocytes (positive
for the GFAP marker when image analysis was performed), increased with Young’s
modulus from 1 kPa to TCP. Similarly to our own study, this percentage did not vary
from 1 kPa to 10 kPa.
When primary rat spinal cord cells were plated (Jiang et al, 2007) onto varying moduli
(in Neurobasal:B27 differentiation medium, similar to this study), whilst numbers of
mature, MAP2-positive neurons did not vary with modulus, the percentage of cells
that were mature astrocytes (GFAP positive) increased with Young’s modulus.
Taking this evidence into consideration, it appears that whilst soft materials did not
enrich specific neuronal subtypes (GABAergic or dopaminergic, for example) over
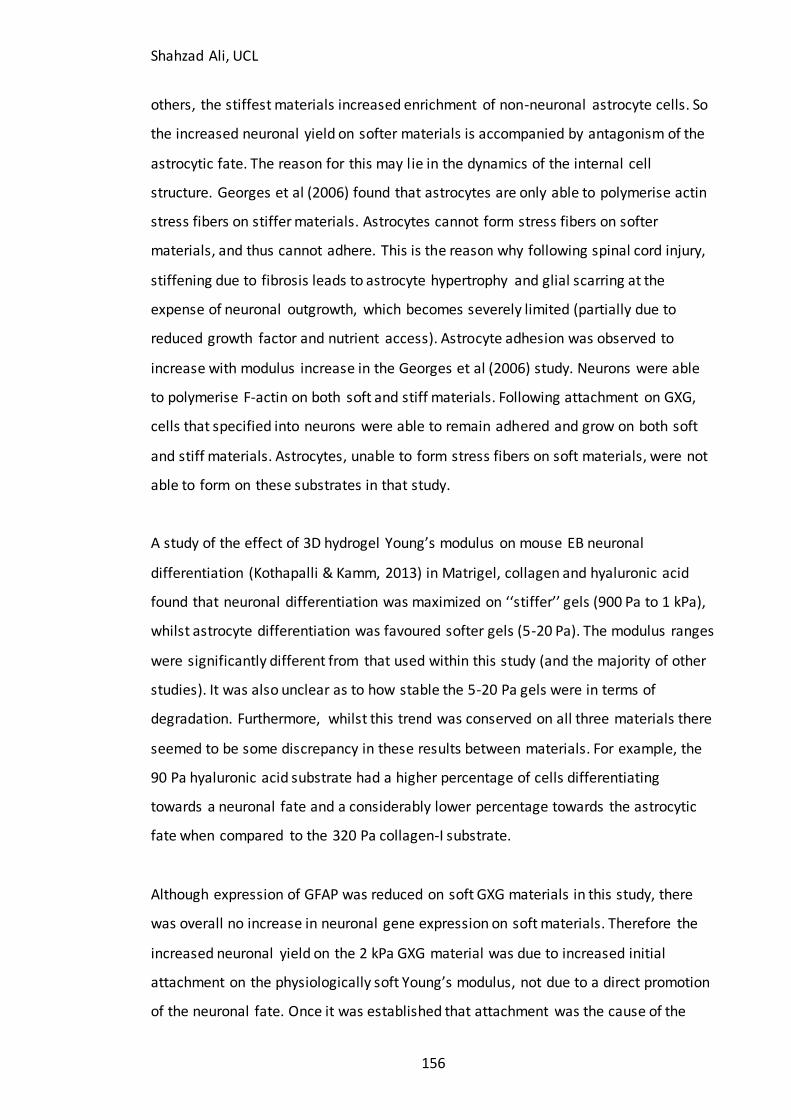
Shahzad Ali, UCL
156
others, the stiffest materials increased enrichment of non-neuronal astrocyte cells. So
the increased neuronal yield on softer materials is accompanied by antagonism of the
astrocytic fate. The reason for this may lie in the dynamics of the internal cell
structure. Georges et al (2006) found that astrocytes are only able to polymerise actin
stress fibers on stiffer materials. Astrocytes cannot form stress fibers on softer
materials, and thus cannot adhere. This is the reason why following spinal cord injury,
stiffening due to fibrosis leads to astrocyte hypertrophy and glial scarring at the
expense of neuronal outgrowth, which becomes severely limited (partially due to
reduced growth factor and nutrient access). Astrocyte adhesion was observed to
increase with modulus increase in the Georges et al (2006) study. Neurons were able
to polymerise F-actin on both soft and stiff materials. Following attachment on GXG,
cells that specified into neurons were able to remain adhered and grow on both soft
and stiff materials. Astrocytes, unable to form stress fibers on soft materials, were not
able to form on these substrates in that study.
A study of the effect of 3D hydrogel Young’s modulus on mouse EB neuronal
differentiation (Kothapalli & Kamm, 2013) in Matrigel, collagen and hyaluronic acid
found that neuronal differentiation was maximized on ‘‘stiffer’’ gels (900 Pa to 1 kPa),
whilst astrocyte differentiation was favoured softer gels (5-20 Pa). The modulus ranges
were significantly different from that used within this study (and the majority of other
studies). It was also unclear as to how stable the 5-20 Pa gels were in terms of
degradation. Furthermore, whilst this trend was conserved on all three materials there
seemed to be some discrepancy in these results between materials. For example, the
90 Pa hyaluronic acid substrate had a higher percentage of cells differentiating
towards a neuronal fate and a considerably lower percentage towards the astrocytic
fate when compared to the 320 Pa collagen-I substrate.
Although expression of GFAP was reduced on soft GXG materials in this study, there
was overall no increase in neuronal gene expression on soft materials. Therefore the
increased neuronal yield on the 2 kPa GXG material was due to increased initial
attachment on the physiologically soft Young’s modulus, not due to a direct promotion
of the neuronal fate. Once it was established that attachment was the cause of the
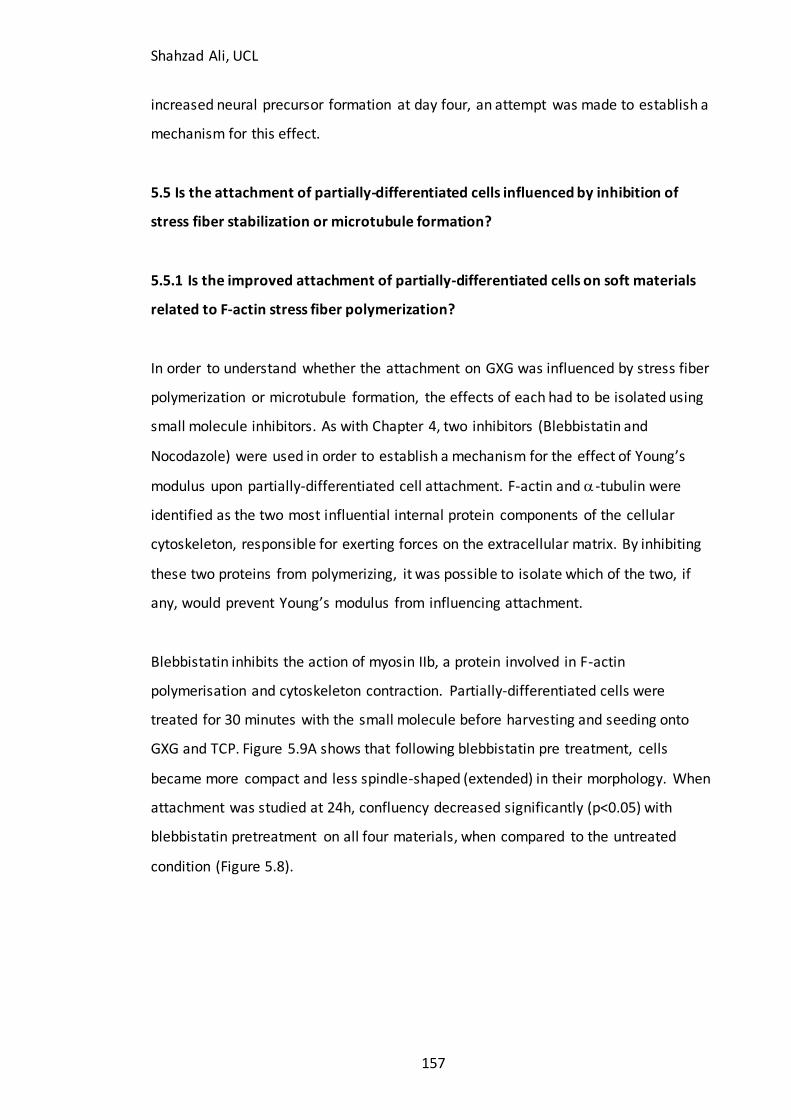
Shahzad Ali, UCL
157
increased neural precursor formation at day four, an attempt was made to establish a
mechanism for this effect.
5.5 Is the attachment of partially-differentiated cells influenced by inhibition of
stress fiber stabilization or microtubule formation?
5.5.1 Is the improved attachment of partially-differentiated cells on soft materials
related to F-actin stress fiber polymerization?
In order to understand whether the attachment on GXG was influenced by stress fiber
polymerization or microtubule formation, the effects of each had to be isolated using
small molecule inhibitors. As with Chapter 4, two inhibitors (Blebbistatin and
Nocodazole) were used in order to establish a mechanism for the effect of Young’s
modulus upon partially-differentiated cell attachment. F-actin and -tubulin were
identified as the two most influential internal protein components of the cellular
cytoskeleton, responsible for exerting forces on the extracellular matrix. By inhibiting
these two proteins from polymerizing, it was possible to isolate which of the two, if
any, would prevent Young’s modulus from influencing attachment.
Blebbistatin inhibits the action of myosin IIb, a protein involved in F-actin
polymerisation and cytoskeleton contraction. Partially-differentiated cells were
treated for 30 minutes with the small molecule before harvesting and seeding onto
GXG and TCP. Figure 5.9A shows that following blebbistatin pre treatment, cells
became more compact and less spindle-shaped (extended) in their morphology. When
attachment was studied at 24h, confluency decreased significantly (p<0.05) with
blebbistatin pretreatment on all four materials, when compared to the untreated
condition (Figure 5.8).
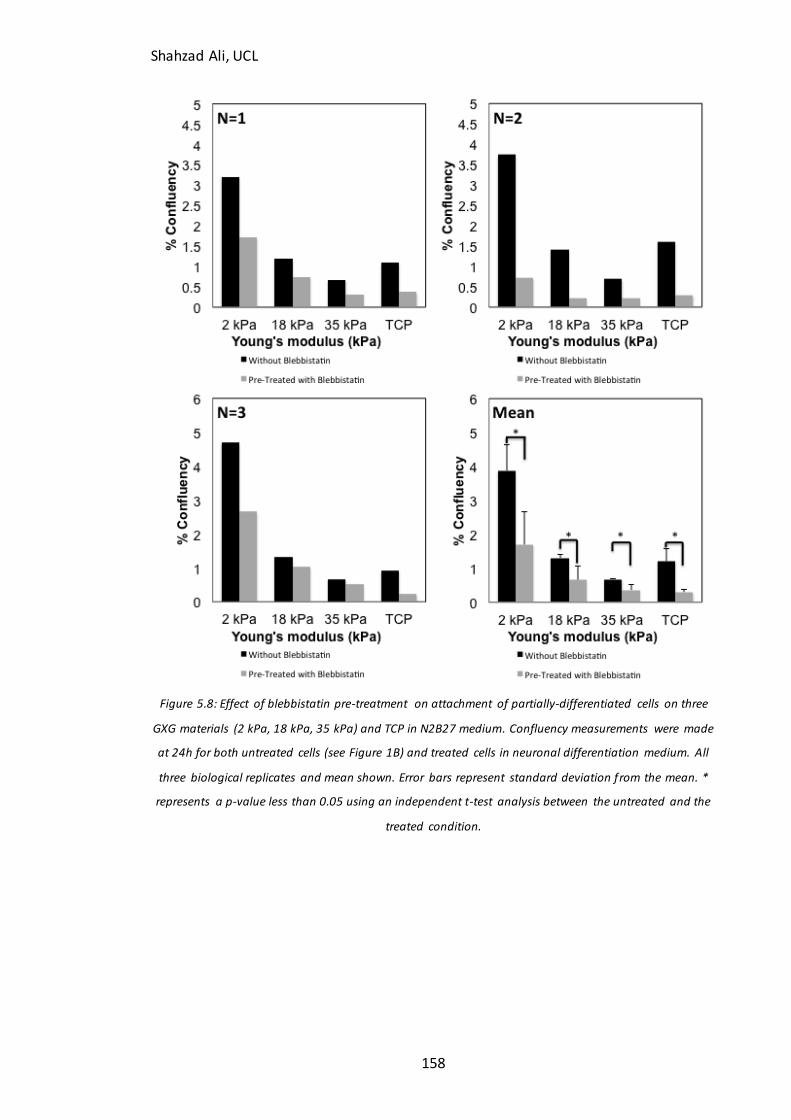
Shahzad Ali, UCL
158
Figure 5.8: Effect of blebbistatin pre-treatment on attachment of partially-differentiated cells on three
GXG materials (2 kPa, 18 kPa, 35 kPa) and TCP in N2B27 medium. Confluency measurements were made
at 24h for both untreated cells (see Figure 1B) and treated cells in neuronal differentiation medium. All
three biological replicates and mean shown. Error bars represent standard deviation from the mean. *
represents a p-value less than 0.05 using an independent t-test analysis between the untreated and the
treated condition.
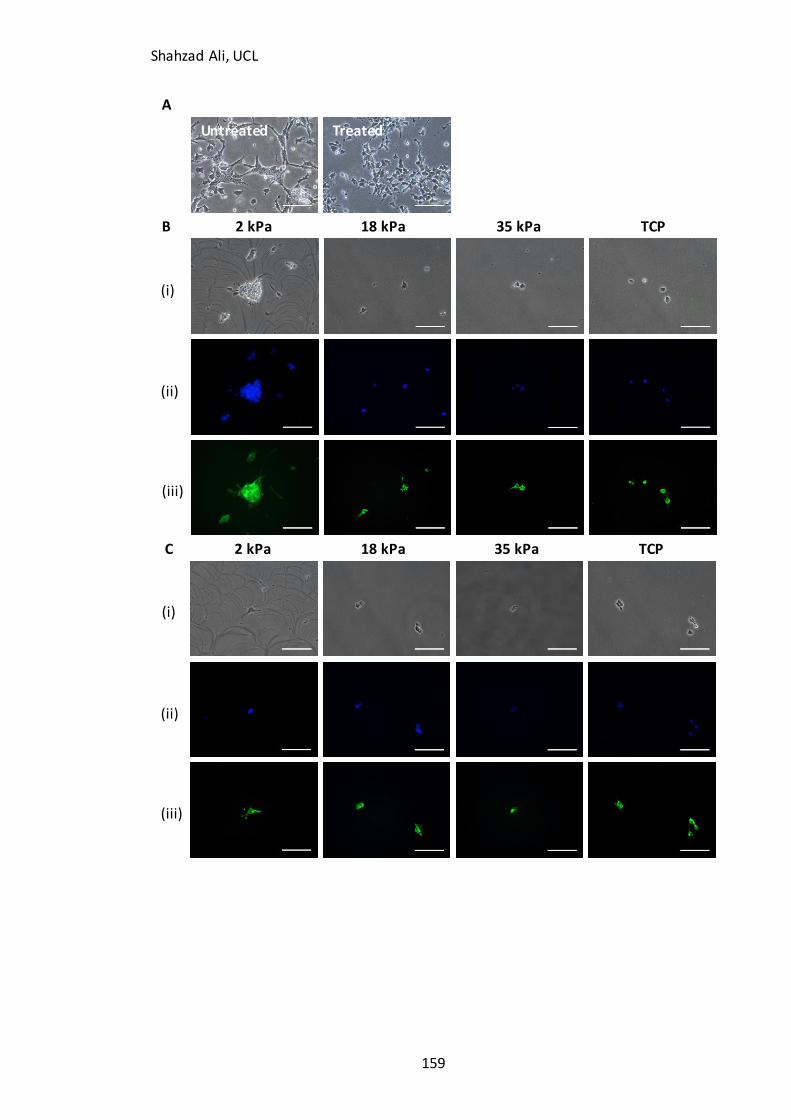
Shahzad Ali, UCL
159
A
B 2 kPa 18 kPa 35 kPa TCP
C 2 kPa 18 kPa 35 kPa TCP
Untreated Treated
(i)
(ii)
(iii)
(i)
(ii)
(iii)
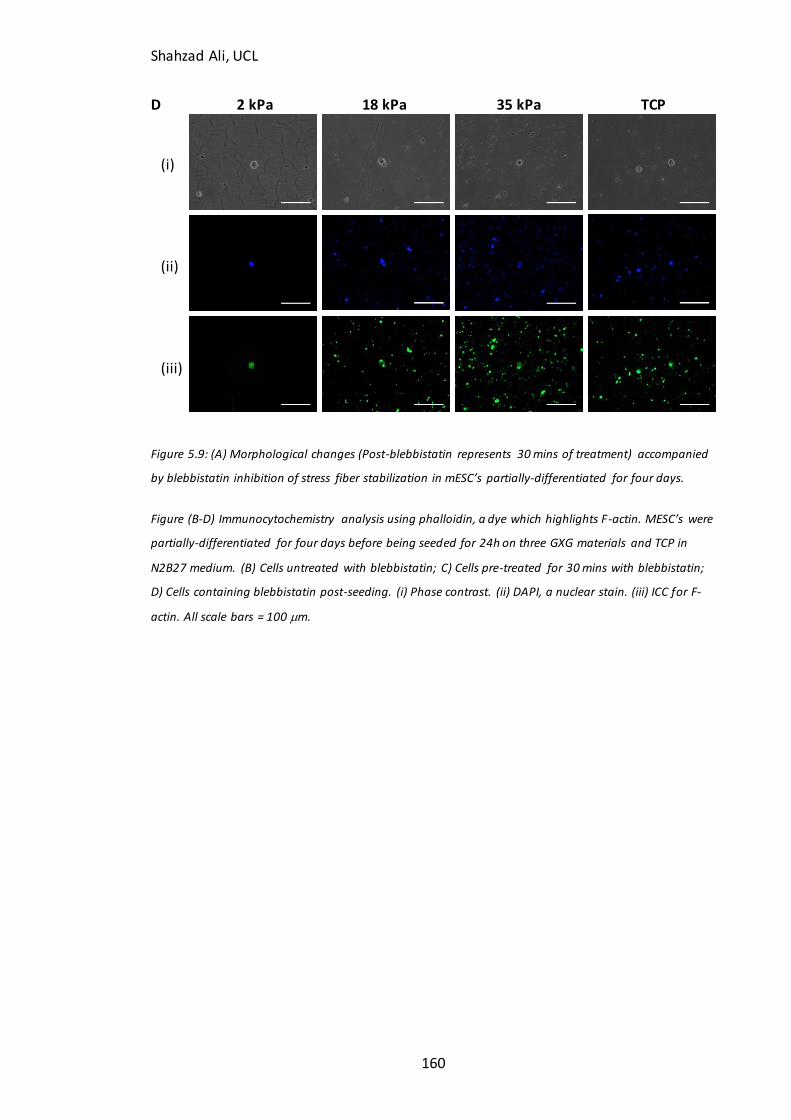
Shahzad Ali, UCL
160
D 2 kPa 18 kPa 35 kPa TCP
Figure 5.9: (A) Morphological changes (Post-blebbistatin represents 30 mins of treatment) accompanied
by blebbistatin inhibition of stress fiber stabilization in mESC’s partially-differentiated for four days.
Figure (B-D) Immunocytochemistry analysis using phalloidin, a dye which highlights F-actin. MESC’s were
partially-differentiated for four days before being seeded for 24h on three GXG materials and TCP in
N2B27 medium. (B) Cells untreated with blebbistatin; C) Cells pre-treated for 30 mins with blebbistatin;
D) Cells containing blebbistatin post-seeding. (i) Phase contrast. (ii) DAPI, a nuclear stain. (iii) ICC for F-
actin. All scale bars = 100 m.
(i)
(ii)
(iii)
Shahzad Ali, UCL
161
This implies that F-actin polymerisation influences the attachment of partially-
differentiated cells on every material. Attachment decreases on all materials, as F-actin
polymerises on both soft and stiff materials (Georges et al, 2006) in neuronal cells.
However, there is no significant difference in attachment with Young’s modulus with
blebbistatin treatment. For this reason, the conclusion was made that stress fiber
depolymerisation reduced the influence of Young’s modulus on attachment.
To identify whether polymerised stress fibers existed within partially-differentiated
cells on GXG and how they were influenced by blebbistatin, immunocytochemistry was
performed using phalloidin, a fluorescent dye that specifically stains F-actin. As with
undifferentiated cells, phalloidin appeared to mainly concentrate and polymerise at
the periphery of the cells (Figure 9B), particularly in regions of the cell body that
appeared to be spreading outwards to form neurite growth cones . This phenomenon
was consistent with the findings of Georges et al (2006). In that study, it was also
found that F-actin can polymerise on both soft and stiff materials. As seen in Figure 9,
the appearance of actin in this study is comparably diffuse. Actin doesn’t tend to form
stress fibers in neurons (rather it tends to aggregate at points of extension), but the
images in Georges et al (2006) do suggest a level of organization not observed in
partially-differentiated cells. However, the partially-differentiated cells are not as
mature as the cortical neurons used within that study, and thus may have cytoskeletal
structures akin to that of mESC’s rather than mature neurons.
Overall, these cytoskeletal structures were unaffected by blebbistatin pre-treatment.
(Figure 9C). Actin remained concentrated at the periphery, driving the outwards
spreading of the cells. However, continued blebbistatin treatment overnight (Figure
9D) did not allow for cells to spread. Instead, cells formed rounded structures with no
actin accumulation in the cytoplasm. A significant amount of actin-rich cell debris was
observed on stiffer materials, as the extended periods of blebbistatin inhibition likely
caused substantial cell death.
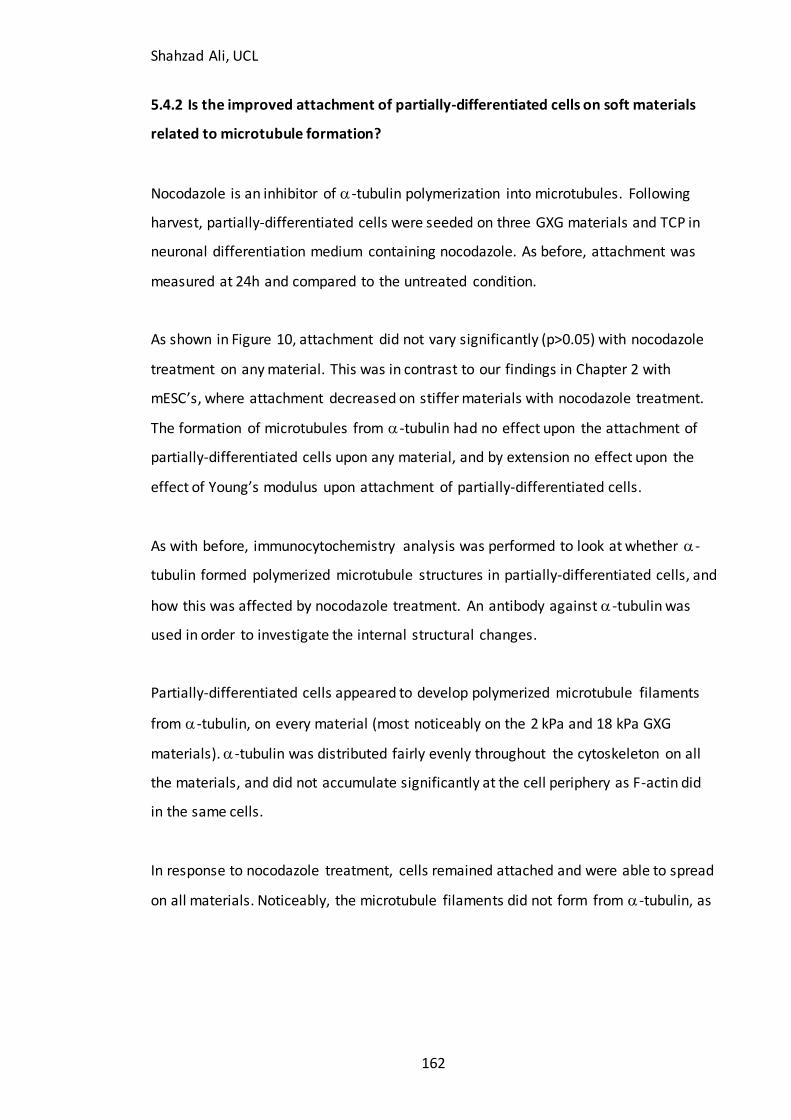
Shahzad Ali, UCL
162
5.4.2 Is the improved attachment of partially-differentiated cells on soft materials
related to microtubule formation?
Nocodazole is an inhibitor of -tubulin polymerization into microtubules. Following
harvest, partially-differentiated cells were seeded on three GXG materials and TCP in
neuronal differentiation medium containing nocodazole. As before, attachment was
measured at 24h and compared to the untreated condition.
As shown in Figure 10, attachment did not vary significantly (p>0.05) with nocodazole
treatment on any material. This was in contrast to our findings in Chapter 2 with
mESC’s, where attachment decreased on stiffer materials with nocodazole treatment.
The formation of microtubules from -tubulin had no effect upon the attachment of
partially-differentiated cells upon any material, and by extension no effect upon the
effect of Young’s modulus upon attachment of partially-differentiated cells.
As with before, immunocytochemistry analysis was performed to look at whether -
tubulin formed polymerized microtubule structures in partially-differentiated cells, and
how this was affected by nocodazole treatment. An antibody against -tubulin was
used in order to investigate the internal structural changes.
Partially-differentiated cells appeared to develop polymerized microtubule filaments
from -tubulin, on every material (most noticeably on the 2 kPa and 18 kPa GXG
materials). -tubulin was distributed fairly evenly throughout the cytoskeleton on all
the materials, and did not accumulate significantly at the cell periphery as F-actin did
in the same cells.
In response to nocodazole treatment, cells remained attached and were able to spread
on all materials. Noticeably, the microtubule filaments did not form from -tubulin, as
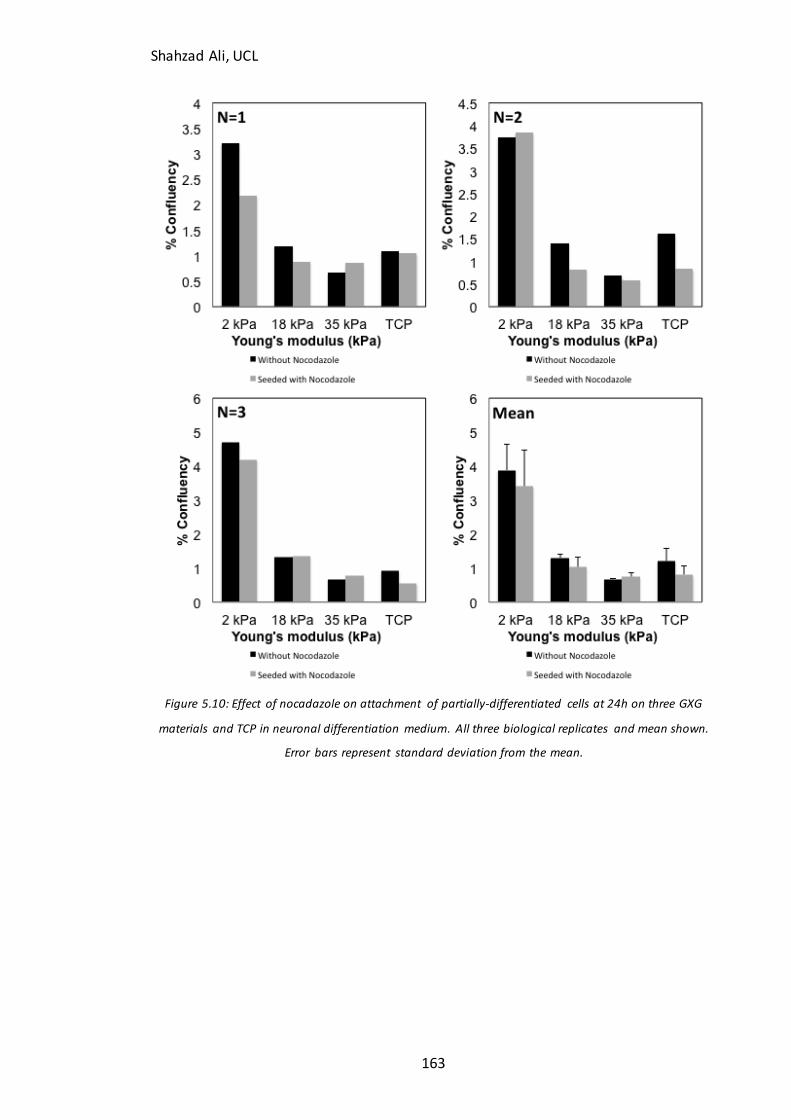
Shahzad Ali, UCL
163
Figure 5.10: Effect of nocadazole on attachment of partially-differentiated cells at 24h on three GXG
materials and TCP in neuronal differentiation medium. All three biological replicates and mean shown.
Error bars represent standard deviation from the mean.
Shahzad Ali, UCL
164
A 2 kPa 18 kPa 35 kPa TCP
B 2 kPa 18 kPa 35 kPa TCP
Figure 5. -tubulin in Partially-differentiated cells were
seeded for 24h on three GXG materials and TCP in neuronal differentiation medium: A) without
nocodazole, an inhibitor of microtubule formation; and B) containing nocodazo le. (i) Phase
contrast. (ii) DAPI, a nuclear stain. (c) ICC for -tubulin. All scale bars = 100 m.
(i)
(ii)
(iii)
(i)
(ii)
(iii)
Shahzad Ali, UCL
165
expected. This implies that partially-differentiated cell spreading following attachment
is dependent on actin and not upon microtubule polymerisation in the cytoskeleton.
Tubulin is mostly associated with neuronal cells in the form of the isoform (-III in
particular). However, the subtype has been demonstrated to play an important role
in a variety of mechanical processes in neuronal cells. Whilst microtubules do not
directly influence gene expression, as they are not directly linked to the cell nuclear
machinery (as the actin cytoskeleton is), they do respond to changes in Young’s
modulus in other ways. Spedden et al (2012)’s elasticity mapping of neuronal cells
revealed that localized stiffening in neurons is dependent on microtubule formation
(an effect which can be inhibited by nocodazole), and not on stress fiber
polymerization.
When considered along with the data in Figure 10, this implies that neuronal cells do
not have to stiffen in order to attach to stiffer GXG materials, unlike with
undifferentiated cells (Chapter 2). Microtubules are also implicated in neurite
extension, and are even able to take over in order to drive extension when actin
polymerisation is inhibited (Georges et al, 2006).
Taken together, the data suggests that actin polymerisation plays the most important
role in driving attachment of partially-differentiated cells on all GXG materials. Actin
and -tubulin then cooperate to drive neurite extension as the neuronal cells form
their characteristic branched networks.
5.5 Does Young’s modulus affect the attachment and expansion of partially-
differentiated neurons maturing in N2B27 medium?
The final set of experiments looked at mESC’s partially-differentiated further, to six
days instead of four. Day six is where -III tubulin, the immature neuronal marker
begins to appear in colonies of nestin-positive differentiating cells (Chapter 1). The
previous work looked at the effect of Young’s modulus on mESC’s differentiating into
neural precursors (Chapter 4) and partially-differentiated neural precursors into
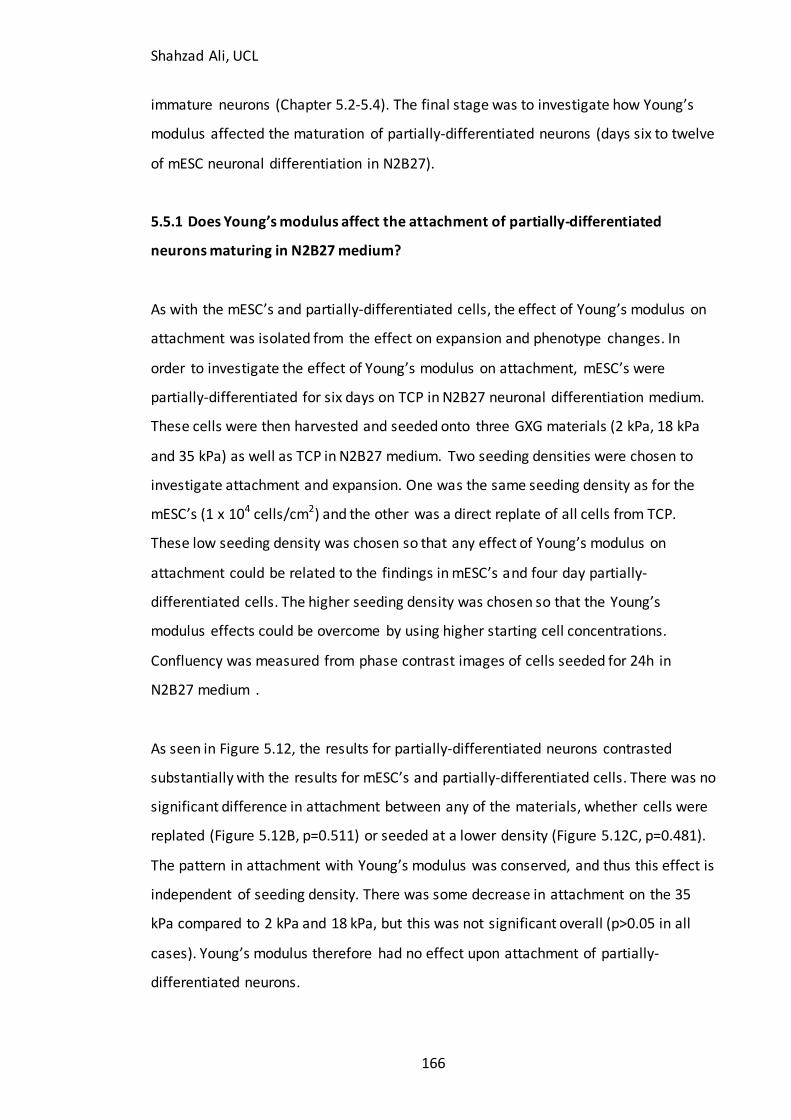
Shahzad Ali, UCL
166
immature neurons (Chapter 5.2-5.4). The final stage was to investigate how Young’s
modulus affected the maturation of partially-differentiated neurons (days six to twelve
of mESC neuronal differentiation in N2B27).
5.5.1 Does Young’s modulus affect the attachment of partially-differentiated
neurons maturing in N2B27 medium?
As with the mESC’s and partially-differentiated cells, the effect of Young’s modulus on
attachment was isolated from the effect on expansion and phenotype changes. In
order to investigate the effect of Young’s modulus on attachment, mESC’s were
partially-differentiated for six days on TCP in N2B27 neuronal differentiation medium.
These cells were then harvested and seeded onto three GXG materials (2 kPa, 18 kPa
and 35 kPa) as well as TCP in N2B27 medium. Two seeding densities were chosen to
investigate attachment and expansion. One was the same seeding density as for the
mESC’s (1 x 10⁴ cells/cm2) and the other was a direct replate of all cells from TCP.
These low seeding density was chosen so that any effect of Young’s modulus on
attachment could be related to the findings in mESC’s and four day partially-
differentiated cells. The higher seeding density was chosen so that the Young’s
modulus effects could be overcome by using higher starting cell concentrations.
Confluency was measured from phase contrast images of cells seeded for 24h in
N2B27 medium .
As seen in Figure 5.12, the results for partially-differentiated neurons contrasted
substantially with the results for mESC’s and partially-differentiated cells. There was no
significant difference in attachment between any of the materials, whether cells were
replated (Figure 5.12B, p=0.511) or seeded at a lower density (Figure 5.12C, p=0.481).
The pattern in attachment with Young’s modulus was conserved, and thus this effect is
independent of seeding density. There was some decrease in attachment on the 35
kPa compared to 2 kPa and 18 kPa, but this was not significant overall (p>0.05 in all
cases). Young’s modulus therefore had no effect upon attachment of partially-
differentiated neurons.
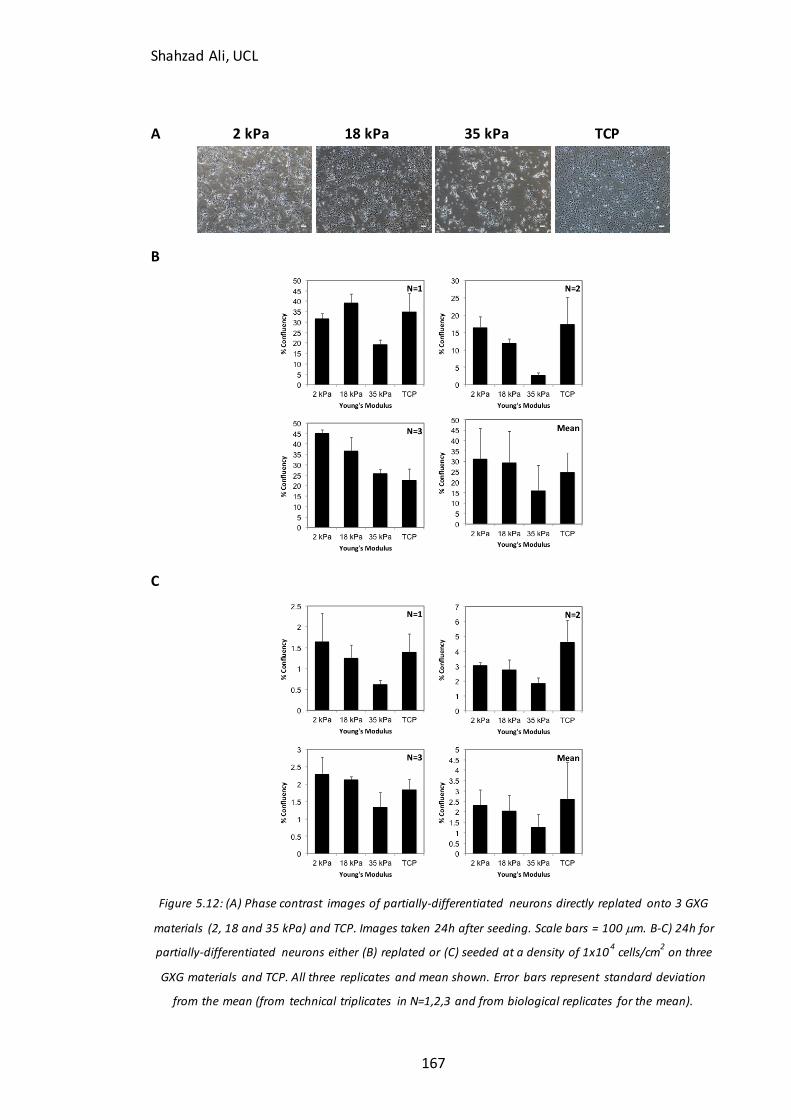
Shahzad Ali, UCL
167
A 2 kPa 18 kPa 35 kPa TCP
B
C
Figure 5.12: (A) Phase contrast images of partially-differentiated neurons directly replated onto 3 GXG
materials (2, 18 and 35 kPa) and TCP. Images taken 24h after seeding. Scale bars = 100 m. B-C) 24h for
partially-differentiated neurons either (B) replated or (C) seeded at a density of 1x10⁴ cells/cm
2 on three
GXG materials and TCP. All three replicates and mean shown. Error bars represent standard deviation
from the mean (from technical triplicates in N=1,2,3 and from biological replicates for the mean).
Shahzad Ali, UCL
168
Morphology (Figure 5.12A) did not drastically vary on any of the GXG materials. The
majority of cells on the GXG materials were morphology C (Chapter 4), the spread,
spindle-like cells. This was expected, as cells are at a more advanced stage of maturity
than in the previous chapter. The cells on the TCP material, however, were a mixture
of cells of morphology C, and morphology B; the flattened, neuroepithelial-like cells
observed in considerably smaller numbers at day four in Chapter 4. This suggests that,
unlike the softer materials, TCP allowed for considerable numbers of morphology B
cells (negative for nestin, amongst other neuronal markers) to attach, survive and
grow.
Whilst this trend contrasts with the earlier work shown in Chapter 3,4 and this
Chapter, it is consistent with the majority of earlier work involving neural precursors
(Georges et al, 2006; Jiang et al, 2007; Previtera et al, 2010) and neural stem cells
(Banerjee et al, 2009; Saha et al, 2008). This suggests that the starting cultures of
neural precursors and neural stem cells in the other studies are more comparable to
the six day matured partially-differentiated neurons than the nestin-positive partially-
differentiated cells at day four. It was concluded that favourable attachment of cells on
soft materials is maturity dependent, and that the effect reduces as cells reach more
advanced stages of specification.
5.4.2: Does Young’s modulus influence the expansion of partially-differentiated
neurons undergoing maturing in N2B27 medium?
In order to investigate the effect of Young’s modulus on expansion, the partially-
differentiated neurons seeded at the lower density were allowed to expand to a time-
point of 72h. We did not investigate the replated cells as they had already reached a
high confluency at 24h. Confluency did not vary significantly (p=0.541) between any of
the materials at 72h (Figure 5.13). As with the earlier findings in mESC’s and partially-
differentiated cells, fold-expansion did not vary significantly with Young’s modulus
(p=0.808). Based upon this evidence, it was concluded that maturity has no influence
on the expansion of cells on any substrate modulus.
Shahzad Ali, UCL
169
A
B
Figure 5.13: (A) 72h attachment of partially-differentiated neurons plated at a seeding density of 1x10⁴
cells/cm2 on three GXG materials (2, 18 and 35 kPa) and TCP. Figure 5.13(B) Fold expansion in colony
size for partially-differentiated neurons in N2B27 medium (Confluency at 72h divided by confluency at
24h). All three replicates and mean shown. Error bars represent standard deviation from the mean.
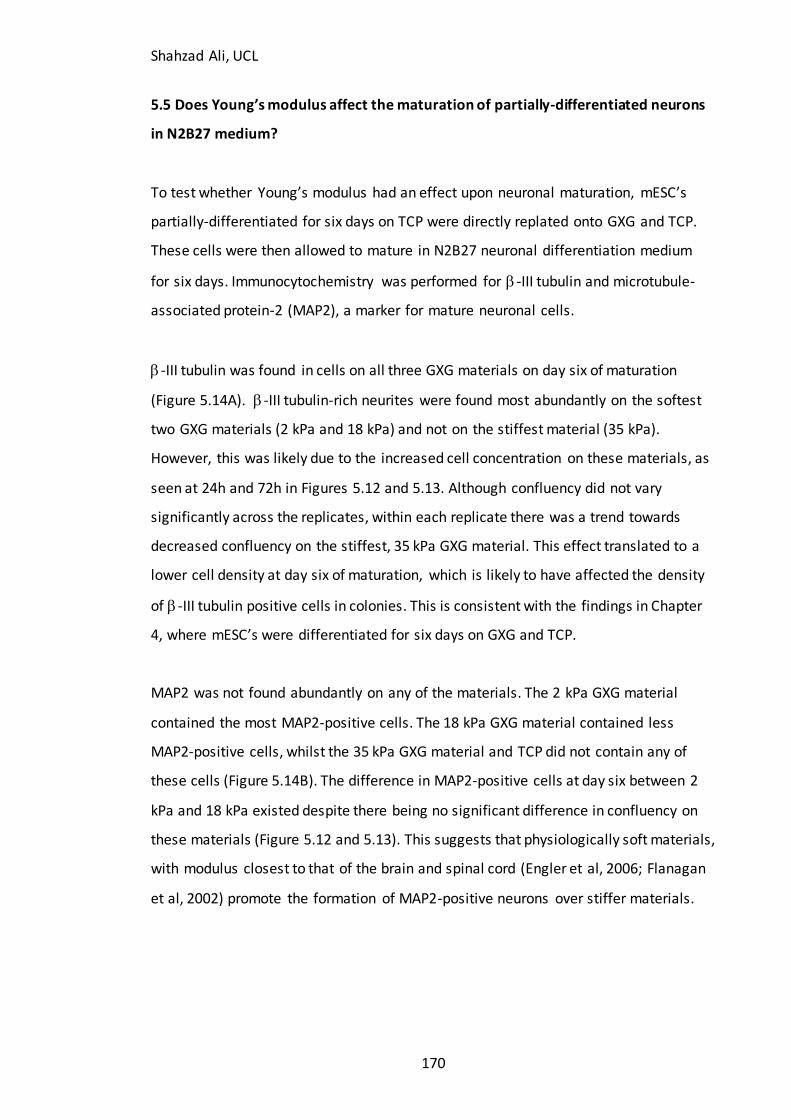
Shahzad Ali, UCL
170
5.5 Does Young’s modulus affect the maturation of partially-differentiated neurons
in N2B27 medium?
To test whether Young’s modulus had an effect upon neuronal maturation, mESC’s
partially-differentiated for six days on TCP were directly replated onto GXG and TCP.
These cells were then allowed to mature in N2B27 neuronal differentiation medium
for six days. Immunocytochemistry was performed for -III tubulin and microtubule-
associated protein-2 (MAP2), a marker for mature neuronal cells.
-III tubulin was found in cells on all three GXG materials on day six of maturation
(Figure 5.14A). -III tubulin-rich neurites were found most abundantly on the softest
two GXG materials (2 kPa and 18 kPa) and not on the stiffest material (35 kPa).
However, this was likely due to the increased cell concentration on these materials, as
seen at 24h and 72h in Figures 5.12 and 5.13. Although confluency did not vary
significantly across the replicates, within each replicate there was a trend towards
decreased confluency on the stiffest, 35 kPa GXG material. This effect translated to a
lower cell density at day six of maturation, which is likely to have affected the density
of -III tubulin positive cells in colonies. This is consistent with the findings in Chapter
4, where mESC’s were differentiated for six days on GXG and TCP.
MAP2 was not found abundantly on any of the materials. The 2 kPa GXG material
contained the most MAP2-positive cells. The 18 kPa GXG material contained less
MAP2-positive cells, whilst the 35 kPa GXG material and TCP did not contain any of
these cells (Figure 5.14B). The difference in MAP2-positive cells at day six between 2
kPa and 18 kPa existed despite there being no significant difference in confluency on
these materials (Figure 5.12 and 5.13). This suggests that physiologically soft materials,
with modulus closest to that of the brain and spinal cord (Engler et al, 2006; Flanagan
et al, 2002) promote the formation of MAP2-positive neurons over stiffer materials.
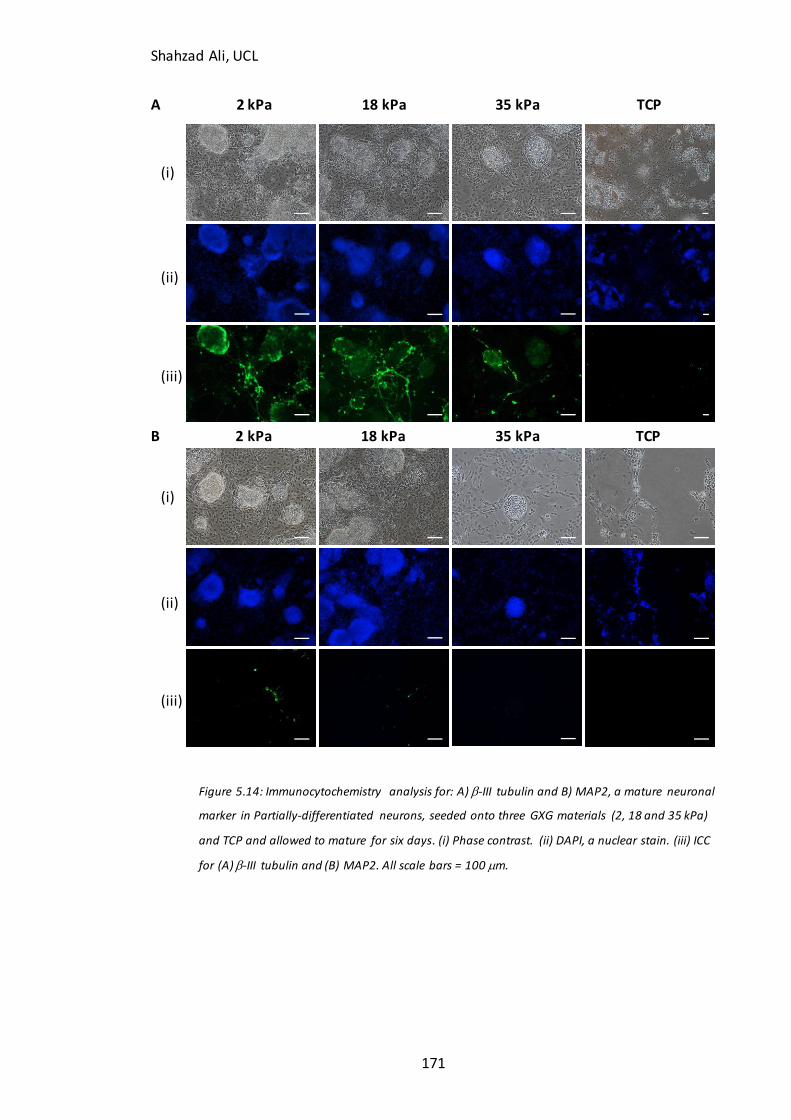
Shahzad Ali, UCL
171
A 2 kPa 18 kPa 35 kPa TCP
B 2 kPa 18 kPa 35 kPa TCP
Figure 5.14: Immunocytochemistry analysis for: A) -III tubulin and B) MAP2, a mature neuronal
marker in Partially-differentiated neurons, seeded onto three GXG materials (2, 18 and 35 kPa)
and TCP and allowed to mature for six days. (i) Phase contrast. (ii) DAPI, a nuclear stain. (iii) ICC
for (A) -III tubulin and (B) MAP2. All scale bars = 100 m.
(i)
(ii)
(iii)
(i)
(ii)
(iii)
Shahzad Ali, UCL
172
(Optional) Figure 5.15: Phase contrast images revealing morphologies of cells partially-differentiated for
six days on three GXG materials and TCP before being replated onto the corresponding GXG materials
and TCP (for example six days on 2 kPa, harvested and plated onto 2 kPa for a further six days). (i) 2 kPa.
(ii) 18 kPa. (iii) 35 kPa. (iv) TCP. Scale bars = 100 m.
(i) (ii)
(iii) (iv)
Shahzad Ali, UCL
173
This result, whilst contrasting with the previous results (Figures 4.9A, 4.10, 5.6A and
5.7, where Young’s modulus did not promote neuronal differentiation), is consistent
with earlier work by Previtera et al (2013) using pure cultures of neural precursor cells
where the percentage of cells which were MAP2 positive increased as modulus
decreased from 27 kPa to 6 kPa. The soft modulus range is consistent with the
measured ranges of Young’s modulus for the brain and spinal cord (Flanagan et al,
2002).
There were negligible amounts of both -III tubulin and MAP2 positive cells on TCP,
(Figure 5.14). This result suggests, along with the comparison of morphology that TCP
supports the attachment, survival and expansion of non-neuronal cell types.
It was concluded that, interestingly, the effect of Young’s modulus on phenotype of
cells formed following differentiation is dependent on cell maturity.
The final experiment performed was to assess whether the differences in
morphologies of cells formed on the materials was due an adaptation or priming
process that is undertaken on TCP. To test this, mESC’s were differentiated for six days
on three GXG materials and TCP, before harvesting them and seeding them onto their
equivalent modulus material. As before, TCP resulted in a predominantly non-neuronal
appearing morphology (the flat morphology B). 2 kPa resulted in a predominantly
dense, rounded morphology of cells (the dense morphology A), whilst 18 kPa resulted
in an even mixture of morphology B and the spread, spindle-like morphology C.
There is clearly a difference based upon adaptation that arises when cells are cultured
for extended periods of time on varying Young’s modulus. However, an explanation for
why certain materials result in certain morphologies of cells forming is unclear, when
considered against the literature. It would be expected, from the literature and from
our own previous findings that cells of morphology C (spread) would be most
abundantly found on the physiologically, soft material. This is a topic for potential
future study.
Shahzad Ali, UCL
174
6 Conclusions and Future Work
6.1 Conclusions
In Chapter 3, the optimal conditions for differentiation were determined. The decision
was made to formulate the N2B27 medium with 1% v/v serum ‘in house’, instead of
buying in the commercially available RHB-A. This was due to issues with variability in
expansion and formation of neural precursors with the latter medium. Using 1% v/v
serum was sufficiently enough serum to promote attachment, spreading and
formation of neuronal precursor colonies, whilst not directly affecting the
homogeneity of cells formed during differentiation.
The mESC’s were characterised as being pluripotent using immunocytochemistry
analysis for key pluripotent markers as well as flow cytometry for PSA-NCAM, a
neuronal adhesion markers (used as a negative control). MESC’s were found to be
positive for OCT4, UTF1 and Ki67, whilst being negative for REX1 (which is a
pluripotency marker, but downregulated when OCT4 is highly expressed). When flow
cytometry was performed for PSA-NCAM, only 4.67% of cells were found to be positive
for the neural precursor marker.
Neuronal differentiation was validated with a time-lapse study using a number of
neuronal and astroglial markers. Based on immunocytochemistry analysis, nestin was
chosen to identify formation of neural precursors (at day four) and -III tubulin was
chosen to identify formation of immature neurons (at day six).
For later qPCR studies, GADPH and TBP1 were chosen as the internal control genes due
to their stability in mESC’s as well as differentiated cells across all four GXG materials,
over three independent passage numbers.
When mouse fibroblasts were seeded on GXG, there was no significant difference in
initial attachment with Young’s modulus. Human EB’s, when seeded on GXG in retinal
Shahzad Ali, UCL
175
differentiation conditions, formed larger colonies on the 2 kPa and 18 kPa. However,
presence of nestin-positive neural precursors was equal across all three materials,
suggesting that the proportion of cells that were neural precursors was highest on the
stiffest material.
MESC’s were seeded on three GXG materials and TCP in pluripotent medium
(GMEM+LIF) as well as spontaneous differentiation medium (GMEM-LIF). In
pluripotent medium, attachment decreased significantly (p<0.05) with an increase in
GXG Young’s modulus. In spontaneous differentiation medium, attachment did not
significantly vary with GXG Young’s modulus (p>0.05), implying that the increased
attachment on soft materials is dependent on seeding medium. Expansion did not vary
with Young’s modulus in either media.
When compared together, this shows that whilst mESC attachment increases with on
soft materials, attachment in mature cells does not vary with Young’s modulus. This
implies that the effect of Young’s modulus on attachment varies as cells differentiate
and mature.
The main hypothesis of this study was that soft materials favour the formation of
neurons from mESC’s over stiff materials in neuronal differentiation medium. Based on
the findings in Chapter 3, the effect of Young’s modulus on attachment of mESC’s
forming into neural precursors (early differentiation) was investigated in Chapter 4.
Chapter 5 then looked at the effect of Young’s modulus on attachment and maturation
of partially-differentiated cells and neurons (late differentiation). The end result was a
stage-by-stage, dynamic characterization of the effect of Young’s modulus on
attachment and neuronal differentiation of mESC’s.
In Chapter 4, it was found that attachment of mESC’s in N2B27 medium was
maximized on the softest GXG material, when compared to stiffer GXG materials.
Despite this difference in initial attachment, subsequent expansion was unaffected by
Young’s modulus.
Shahzad Ali, UCL
176
When immunocytochemistry analysis was carried out, it was found that neural
precursor formation was maximized on the soft materials. However, flow cytometry
analysis revealed that the proportion of the total cells that were neural precursors did
not vary across the materials. A similar result was found when gene expression was
measured by qPCR. Expression of pluripotent, neuronal and non-neuronal (other
lineages) genes did not vary with Young’s modulus. Taken together, these results
suggest that soft materials increase the yield of neural precursors from mESC’s without
directly promoting neuronal differentiation. Instead, soft materials favour attachment
of mESC’s in N2B27 medium. This effect was found to not be dependent on F-actin or
microtubule polymerization. Inhibition of these two processes had no effect on the
maximization of attachment on soft materials.
The next stages of mESC differentiation into neurons were characterized in the same
way in Chapter 5. First, mESC’s were partially-differentiated for four days in N2B27
medium into nestin-positive neural precursors. These four-day partially-differentiated
cells were seeded onto three GXG materials and TCP as before. Attachment of these
partially-differentiated cells was again maximized on soft materials in N2B27 medium.
The mean cellular projected area did not vary across materials and so did not
contribute to the increased confluency on soft materials. Expansion and formation of
-III tubulin positive neurons was unaffected by GXG Young’s modulus (although
neurons did not form on the TCP control).
Flow cytometry and qPCR gene expression (for mature neurons) analysis revealed a
similar result to before where an increase in neuronal yield on soft materials was not
accompanied by an increase in proportion of total cells that were neuronal. Therefore,
it was concluded that the increase in neuronal yield from partially-differentiated cells
was due to favourable initial attachment of partially-differentiated cells and not a
direct promotion of the neuronal fate. This effect was not dependent on stress fibre or
microtubule polymerization.
Shahzad Ali, UCL
177
Interestingly, qPCR analysis revealed that expression of non-neuronal astrocyte genes
reduced on soft materials, compared to the TCP control. This implies that soft
materials antagonize the astrocytic fate.
In the final experiments, mESC’s were partially-differentiated further (for six days) into
immature neurons to form partially-differentiated neurons. These partially-
differentiated neurons were then allowed to attach and mature on the three GXG
materials and TCP. Young’s modulus had no significant (p>0.05) effect upon
attachment of partially-differentiated neurons, in contrast to the previous findings.
Expansion and formation of -III tubulin again did not vary with Young’s modulus.
However, formation of mature, MAP2 positive cells was maximized on the soft
materials despite no difference in attachment and expansion. The conclusion was
made that soft materials directly promote the maturation of neurons, without
promoting attachment. This was in contrast to the findings for early mESC neuronal
differentiation.
Overall, the effect of Young’s modulus on attachment and promotion of the neuronal
fate are dependent upon cell maturity. The effect of modulus on attachment
disappears as cells mature, whilst modulus begins to directly affect neuronal cell
formation in more mature cells during neuronal differentiation. This will be a key
consideration when designing future cell bioprocesses, as the entire differentiation
stage cannot be considered as one process. Instead each stage of differentiation
requires careful optimisation to maximise either attachment and by extension yield, or
enrichment. This will also impact the design of biomaterials for neuronal tissue
engineering, where materials will have to be carefully optimised for both attachment
as well as differentiation, depending on the maturity levels of the cells.
Shahzad Ali, UCL
178
6.2 Future Work
The next immediate experiment to perform would be to drive mESC
differentiation further towards clinically relevant populations of neurons, such
as dopaminergic subtypes for treatment of Parkinson’s. This would allow for
the full characterization of the effect of Young’s modulus on mESC neuronal
differentiation into clinically relevant neuronal populations.
One issue that was briefly touched upon earlier in Chapter 5 was the effect of
Young’s modulus upon the expression of GFAP, an astrocyte gene. Once further
differentiation of neurons is characterized, this is where the impact of Young’s
modulus on promotion or antagonism of the astrocytic fate could be explored
in further detail. These cells may be clinically relevant in their own right but will
act as a contaminant in neuronal populations, particularly if they start
undergoing glial scarring, which would significantly increase the Young’s
modulus of the material.
Whilst actin stress fibers and microtubule networks are a very crucial element
of the cell internal structure, they did not contribute to the cell response to
Young’s modulus. There are other structural components of the cell that do not
play as key a role as the aforementioned molecules but may still prove vital in
unlocking the reason why Young’s modulus influences attachment as it does.
Focal adhesion proteins, including integrins could be included in this study.
Neuronal differentiation was chosen for study as it is perhaps the most well
defined and intensely studied lineage for mouse embryonic stem cells,
particularly in adherent monoculture, thanks to the Ying et al (2003) protocol.
However, it would be very interesting to analyse the effects of Young’s
modulus on other lineages, which are associated with different ranges of
Young’s modulus to this study. It would be expected that whilst initial
attachment of mESC’s would show a similar result (as soft substrates are most
Shahzad Ali, UCL
179
similar to that of the early mouse blastocyst), the effect of Young’s modulus
would change with maturation, particularly if cell function depends on certain
mechanical characteristics. For example, cardiomyocytes are unable to contract
and beat on materials, which are too soft or too stiff (Engler et al, 2008).
Once the overall effect of Young’s modulus on attachment is better
understood, it would be interesting to investigate changes at the level of
individual cells. Changes in softness could be measured by atomic force
microscopy, for example. Optical tweezers could be used to investigate how
cell stretching changes the effect of Young’s modulus on attachment.
GXG was used in this study as it is easier, faster and cheaper to produce than
the majority of other biomaterials used for modulus studies. However, as seen
in Kothapalli & Kramm’s (2013) earlier work, different materials may produce
different responses in cells.
Although the biomaterials did support robust cell growth, individual steps in
the synthesis protocols could be further optimized in order to improve their
function further. An economic evaluation of the protocol could be performed in
order to isolate the stages most suitable for optimization. A possible
modification to the material could be to coat the materials with ECM
component proteins.
Once these effects are fully characterized in mouse, further characterization of
the effect of Young’s modulus on human embryonic stem cell or induced
pluripotent stem cell differentiation into clinically relevant neuronal
populations could be carried out.
One of the benefits of using GXG is that it is easily scalable within the static
culture format. It could be used to coat cell factories, for example. However in
order to produce cells at a significantly larger scale, the bioreactor format may
Shahzad Ali, UCL
180
be of greater use. In order to use bioreactors, cells may have to be cultured on
microcarriers. Either the elasticity of the microcarriers themselves could be
tuned using novel materials, or GXG could be used to coat microcarriers.
Beyond the cell culturing stage, other processing stages may be impacted by
the GXG coating of culture materials. Whilst robust processes for large s cale
harvesting and purification of target cells have yet to be developed, these steps
are likely to be impacted by decisions made at the cell culture stage. If cells are
harvested mechanically, it is possible that GXG may be removed along with the
cells. Clumps of GXG or gelatin may interfere with further processing steps. This
may necessitate appropriate design of further processing steps or a separate
stage in order to remove GXG from the harvest material. The impact of GXG on
downstream processing, as well as potential removal operations would require
further investigation.
As well as studying attachment, detachment on all Young’s moduli could be
studied in more detailed. One approach would be to use dilute solutions of
trypsin in order to slowly enzymatically detach cells from GXG.
In addition to the Young’s modulus of elasticity, surface topography will have
an important role in determining cell fate and attachment. Further study of the
effect of topography using specially engineered biomaterials could be used for
this study.
Finally, coating the GXG material with key extracellular matrix proteins may aid
in further improving cell attachment and differentiation. Laminin, for example,
has been shown to play a key role in germ layer organization during
gastrulation (Ingber, 2000).
Shahzad Ali, UCL
181
7 References
1. Aguirre, A., Gonzalez, A., Navarro, M., Castano, O., Planell, J.A., Engel, E. (2012).
‘‘Control of microenvironmental cues with a smart biomaterials composite promotes endothelial progenitor cell angiogenesis.’’ European Cells and Materials 24: 90-106
2. Anselme, K., Bigerelle, M. (2012). ‘‘On the Relation Between Surface Roughness
of Metallic Substrates and Adhesion of Human Primary Bone Cells.’’ Scanning 00:1-10
3. Baker, E., Zaman, M.H. (2009). ‘‘The Biomechanical Integrin.’’ Journal of
Biomechanics 43: 38-44
4. Baracskay, K.L., Kidd, G.J., Miller, R.H., Trapp, B.D. (2007). ‘‘NG2-positive cells generate A2B5-positive oligodendrocyte precursor cells.’’ Glia 55(10): 1001-1010
5. Bakker, A.D., Klein-Nulend, J. (2010). ‘‘Mechanisms of Osteocyte
Mechanotransduction.’’ Clinical Reviews in Bone and Mineral Metabolism 8: 163-169
6. Banerjee, A., Arha, M., Choudhary, S., Ashton, R.S., Bhatia, S.R., Schaffer, D.V.,
Kane, R.S. (2009). ‘‘The influence of hydrogel modulus on the proliferation and differentiation of encapsulated neural stem cells.’’ Biomaterials 30: 4695-4699
7. Ben-Shushan, E., Thompson, J.R., Gudas, L.J., Bergman, Y. (1998). ‘‘Rex-1, a
gene encoding a transcription factor expressed in the early embryo, is
regulated via Oct-3/4 and Oct-6 binding to an octamer site and a novel protein, Rox-1, binding to an adjacent site.’’ Molecular and Cellular Biology 18(4): 1866-1878
8. Bernhardt, R., Matus, A.I. (1984). ‘‘Light and electron microscopy studies of the
distribution of microtubule-associated protein 2 in rat brain: A difference between the dendritic and axonal cytoskeletons.’’ J Comp Neurol 226: 203-219
9. Bian, L., Hou, C., Tous, E., Rai, R., Mauck, R.L., Burdick, J.A. (2013) ‘‘The
influence of hyaluronic acid hydrogel crosslinking density and macromolecular diffusivity on human MSC chondrogenesis and hypertrophy.’’ Biomaterials 34: 413-421
10. Chiron, S., Tomczak, C., Duperray, A., Laine, J., Bonne, G., Eder, A., Hansen, A.,
Eschenhagen, T., Verdier, C., Coirault, C. (2012). ‘‘Complex Interactions between Human Myoblasts and the Surrounding 3D Fibrin-Based Matrix.’’ PLoS One 7(4): e36173
Shahzad Ali, UCL
182
11. Chopra, A., Lin, V., McCollough, A., Atzet, S., Prestwich, G.D., Wechsler, A.S.,
Murray, M.E., Oake, S.A., Kresh, J.Y., Janmey, P.A. (2012). ‘‘Reprograming cardiomyocyte mechanosensing by crosstalk between integrins and hyaluronic
acid receptors.’’ Journal of Biomechanics 45: 824-831
12. Chowdhury, F., Na, S., Li, D., Poh, Y., Tanaka, T.S., Wang, F., Wang, N. (2009). ‘‘Material properties of the cell dictate stress-induced spreading and
differentiation in embryonic stem cells.’’ Nature Materials 9: 82-88
13. Chowdhury, F., Li, Y., Poh, Y.C., Yokohama-Tamaki, T., Wang, N., Tanaka, T.S. (2010). ‘‘Soft substrates promote homogeneous self-renewal of embryonic
stem cells via downregulating cell-matrix tractions.’’ PLoS One 15(12):e15655
14. Christ, A.F., Franze, K., Gautier, H., Moshayedi, P., Fawcett, J., Franklin, R.J.M., Karadottir, R.T., Guck, J. (2010). ‘‘Mechanical difference between white and
gray matter in the rat cerebellum measured by scanning force microscopy.’’ Journal of Biomechanics 43: 2986-2992
15. Collingsworth, A.M., Zhang, S., Kraus, W.E., Truskey, G.A.(2002). ‘‘Apparent
elastic modulus and hysteresis of skeletal muscle cells throughout differentiation.’’ American Physiological Society 283: 1219-1227
16. Conti, L., Pollard, S.M., Gorba, T., Reitano, E., Toselli, M., Biella, G., Sun, Y.,
Sanzone, S., Ying, Q-L., Cattaneo, E., Smith, A. (2005). ‘‘Niche-Independent
Symmetrical Self-Renewal of a Mammalial Tissue Stem Cell.’’ PLoS Biology 3: 1594-1606
17. Bae, D., Mondragon-Teran, P., Hernandez, D., Ruban, L., Mason, C.,
Bhattacharya, S.S., Veraitch, F.S. (2012). ‘‘Hypoxia Enhances the Generation of Retinal Progenitor Cells from Human Induced Pluripotent and Embryonic Stem
Cells.’’ Stem Cells and Development 21(8): 1344-1355
18. Dahl, K.N., Booth-Gauthier, E.A., Ladoux, B. (2009). ‘‘In the middle of it all: Mutual mechanical regulation between the nucleus and the cytoskeleton.’’ Journal of Biomechanics 43: 2-8
19. Davidson, L.A., Oster, G.F., Keller, R.E., Koehl, M.A. (1999) ‘‘Measurements of
mechanical properties of blastula wall reveal which hypothesized mechanisms of primary invagination are physically plausible in the sea urchin Strongylocentrus purpuratus.’’ Developmental Biology 209: 221-238
20. Deroanne, C.F., Lapiere, C.M., Nusgens, B.V. (2001). ‘‘In vitro tubulogenesis of
endothelial cells by relaxation of the coupling extracellular matrix-cytoskeleton.’’ Cardiovascular Research 49: 647-658
21. Desai, A., Mitchison, T.J. (1997). ‘‘Microtubule polymerization dynamics.’’
Annual Review of Cell and Developmental Biology 13: 83-117
Shahzad Ali, UCL
183
22. Discher, D.E. (2009). ‘‘Growth Factors, Matrices, and Forces Combine and Control Stem Cells.’’ Science 324: 1673-1677
23. Engler, A.J., Bacakova, L., Newman, C., Hategan, A., Griffin, M., Discher, D.
(2004a). ‘‘Substrate Compliance versus Ligand Density in Cell on Gel Responses.’’ Biophysical Journal 86: 617-628
24. Engler, A.J., Griffin, M.A., Sen, S., Bönnemann, C.G., Sweeney, H.L., Discher, D.E.
(2004b). ‘‘Myotubes differentiate optimally on substrates with tissue-like stiffness: pathological implications for soft or stiff microenvironments.’’ The
Journal of Cell Biology 166(6): 877-887
25. Engler, A.J., Richert, L., Wong, J.Y., Picart, C., Discher, D.E. (2004c). ‘‘Surface probe measurements of the elasticity of sectioned tissue, thin gels and
polyelectrolyte multilayer films: correlations between substrate stiffness and cell adhesion.’’ Surface Science 570: 142-154
26. Engler, A.J., Sen, S., Sweeney, H.L., Discher, D.E. (2006). ‘‘Matrix Elasticity
Directs Stem Cell Lineage Specification.’’ Cell 126: 677-689
27. Engler, A.J., Carag-Krieger, C., Johnson, C.P., Raab, M., Tang, H., Speicher, D.W., Sanger, J.W., Sanger, J.M., Discher, D.E. (2008). ‘‘Embryonic Cardiomyocytes beat best on a matrix with heart-like elasticity: scar-like rigidity inhibits
beating.’’ Journal of Cell Science 121: 3794-3802
28. Eroshenko, N., Ramachandran, R., Yadavalli, V.K., Rao, R.R. (2013) ‘‘Effect of substrate stiffness on early human embryonic stem cell differentiation.’’
Journal of Biological Engineering 7(1): 7
29. Evans, M.J., Kaufman, M.H. (1981) ‘‘Establishment in culture of pluripotent cells from mouse embryos.’’ Nature 292: 154-156
30. Evans, N.D., Minelli, C., Gentleman, E., LaPointe, V., Patankar, S.N., Kallivretaki,
M., Chen, X., Roberts, C.J., Stevens, M.M. (2009). ‘‘Substrate stiffness affects early differentiation events in embryonic stem cells.’’ European Cells and Materials 18: 1-14
31. Ffrench-Constant, C., Hollingsworth, A., Heasman, J., Wylie, C.C. (1991).
‘‘Response to fibronectin of mouse primordial germ cells before and after migration.’’ Development 113: 1365-1373
32. Finley, M.F.A., Devata, S., Huettner, J.E. (1999) ‘‘BMP-4 Inhibits Neural
Differentiation of Murine Embryonic Stem Cells.’’ Journal of Neurobiology 40(3): 271-287
Shahzad Ali, UCL
184
33. Flanagan, L.A., Ju, Y.E., Marg, B., Osterfeld, M., Jamney, P.A. (2002). ‘‘Neurite
branching on deformable substrates.’’ Neuroreport 13: 2411-2415
34. Flanagan, L.A., Rebaza, L.M., Derzic, S., Schwartz, P.H., Monuki, E.S. (2006). ‘‘Regulation of Human Neural Precursor Cells by Laminin and Integrins.’’
Journal of Neuroscience Research 83: 845-856
35. Fox, N., Damjanov, I., Martinez-Hernandez, A., Knowles, B.B., Solter, D. (1981). ‘‘Immunohistochemical localization of the early embryonic antigen (SSEA-1) in
postimplantation mouse embryos and fetal and adult tissues.’’ Developmental Biology 83(2): 391-398
36. Franze, K., Guck, J. (2010). ‘‘The biophysics of neuronal growth.’’ Reports on
Progress in Physics 73: 094601
37. Frilling, S., Andersson, E., Thompson, L.H., Jönsson, M.E., Hebsgaard, J.B., Nanou, E., Alekseenko, Z., Marklund, U., Kjellander, S., Volakakis, N., Hovatta, O., El Manira, A., Björklund, A., Perlmann, T., Ericson, J. (2009). ‘‘Efficient production of mesencephalic neurons by Lmx1a expression in embryonic stem cells.’’ Proceedings of the National Academy of Sciences USA. 106(18): 7613-7618
38. Fuentes, D.E., Butler, P.J. (2012). ‘‘Coordinated Mechanosensitivity of
Membrane Rafts and Focal Adhesions.’’ Cell Molecular Bioengineering 5(2):
143-154
39. Gago, N., Avellana-Adalid, V., Baron-Van Evercooren, A., Schumacher, M. (2003). ‘‘Control of cell survival and proliferation of postnatal PSA-NCAM(+)
progenitors.’’ Molecular and Cellular Neurosciences 22(2): 162-178
40. Gao, Y., Ye, L., Kishi, H., Okagaki, T., Samizo, K., Nakamura, A., Kohama, K. (2001). ‘‘Myosin Light Chain Kinase as a Multifunctional Regulatory Protein of
Smooth Muscle Contraction.’’ Life 51: 337-344
41. Georges, P.C., Miller, W.J., Meaney, D.F., Sawyer, E.S., Janmey, P.A. (2006). ‘‘Matrices with Compliance Comparable to that of Brain Tissue Select Neuronal over Glial Growth in Mixed Cortical Cultures.’’ Biophysical Journal 90:3012-3018
42. Ginis, I., Luo, Y., Miura, T., Thies, S., Brandenberger, R., Gerecht-Nir, S., Amit,
M., Hoke, A., Carpenter, M.K., Itskovitz-Eldor, J., Rao, M.S. (2004). ‘‘Differences between human and mouse embryonic stem cells.’’ Developmental Biology 269: 360-380
43. Grover, C.N., Gwynne, J.H., Pugh, N., Hamaia, S., Farndale, R.W., Best, S.M.,
Camerson, R.E. (2012). ‘‘Crosslinking and composition influence the surface properties, mechanical stiffness and cell reactivity of collagen-based films.’’ Acta Biomaterialia 8: 3080-3090
Shahzad Ali, UCL
185
44. Gunsilius, E., Gastl, G., Petzer, A.L. (2001). ‘‘Haematopoietic stem cells.’’ Biomedicine and Pharmacotherapy 55(4): 186-194
45. Her, G.J., Wu, H.C., Chen, M.H., Chen, M.Y., Chang, S.C., Wang, T.W. (2013).
‘‘Control of three-dimensional substrate stiffness to manipulate mesenchymal stem cell fate toward neuronal or glial lineages.’’ Acta Biomaterialia 9: 5170-
5180
46. Hu, X., Park, S.H., Gil, E.S., Xia, X.X., Weiss, A.S., Kaplan, D.L. (2011) ‘‘The influence of elasticity and surface roughness on myogenic and osteogenic
differentiation of cells on silk-elastin biomaterials.’’ Biomaterials 32: 8979-8989
47. Ingber, D.E. (2006). ‘‘Mechanical control of tissue morphogenesis during embryological development.’’ The International Journal of Developmental
Biology 50: 255-266
48. Itoh, T., Ikebe, M., Kargacin, G.J., Hartshorne, D.J., Kemp, B.E., Fay, F.S. (1989). ‘‘Effect of modulators of myosin light-chain kinase activity in single smooth muscle cells.’’ Letters to Nature 338: 164-167
49. Itskovitz-Eldor, J., Schuldiner, M., Karsenti, D., Eden, A., Yanuka, O., Amit, M.,
Soreq, H., Benvenisty, N. (2000). ‘‘Differentiation of human embryonic stem cells into embryoid bodies compromising the three embryonic germ layers.’’
Molecular Medicine 6(2): 88-95
50. Jagielska, A., Norman, A.L., Whyte, G., Van Vliet, K.J., Guck, J., Franklin, R.J.M. (2012). ‘‘Mechanical Environment Modulates Biological Properties of
Oligodendrocyte Progenitor Cells.’’ Stem Cells and Development 21(16): 2905-2914
51. Jaramillo, M., Singh, S.S., Velankar, S., Kumta, P.N., Banerjee, I. (2012).
‘‘Inducing endoderm differentiation of modulating mechanical properties of soft substrates.’’ Journal of Tissue Engineering and Regenerative Medicine 2012:10:1002
52. Jiang, F.X., Lin, D.C., Horkay, F., Langrana, N.A. (2011). ‘‘Probing Mechanical
Adaptation of Neurite Outgrowth on a Hydrogel Material Us ing Atomic Force Microscopy.’’ Annals of Biomedical Engineering 39(2): 706-713
53. Katsumi, A., Naoe, T., Matsushita, T., Kaibuchi, K., Schwartz, M.A. (2005).
‘‘Integrin Activation and Matrix Binding Mediate Cellular Responses to Mechanical Stretch.’’ The Journal of Biological Chemistry 17: 16546-16549
54. Kehat, I., Kenyagin-Karsenti, D., Snir, M., Segev, H., Amit, M., Gepstein, A.,
Livne, E., Binah, O., Itskovitz-Eldor, J., Gepstein, L. (2001). ‘‘Human embryonic stem cells can differentiate into myocytes with structural and functional
Shahzad Ali, UCL
186
properties of cardiomyocytes.’’ The Journal of Clinical Investigation 108(3): 407-
414
55. Kehat, I., Khimovich, L., Caspi, O., Gepstein, A., Shofti, R., Arbel, G., Huber, I., Satin, J., Itskovitz-Eldor, J., Gepstein, L. (2004) ‘‘Electromechanical integration
of cardiomyocytes derived from human embryonic stem cells.’’ Nature Biotechnology 22: 1282-1289
56. Keller, G. (2005). ‘‘Embryonic stem cell differentiation: emergence of a new era
in biology and medicine.’’ Genes and Development 19: 1129-1155
57. Keung, A.J., Healy, K.E., Kumar, S., Schaffer, D.V. (2009). ‘‘Biophysics and dynamics of natural and engineered stem cell microenvironments.’’ Wiley
Interdisciplinary Reviews: Systems Biology and Medicine 2: 49-64
58. Keung, A.J., Asuri, P., Kumar, S., Schaffer, D.V. (2012). ‘‘Soft microenvironments promote the early neurogenic differentiation but not self-renewal of human
pluripotent stem cells.’’ Integrative Biology 4: 1049-1058
59. Knoepfler, P.S. (2009). ‘‘Deconstructing Stem Cell Tumorigenicity: A Roadmap to Safe Regenerative Medicine.’’ Stem Cells 27(5): 1050-1056
60. Kothapalli, C.R., Kamm, R.D. (2013). ‘‘3D matrix microenvironment for targeted
differentiation of embryonic stem cells into neural and glial lineages.’’ Biomaterials 34: 5995-6007
61. Krieg, M., Arboleda-Estudillo, Y., Puech, P.H., Kafer, J., Graner, F., Muller, D.J.,
Heisenberg, C.P. (2008). ‘‘Tensile forces govern germ-layer organization in zebrafish.’’ Nature Cell Biology 10: 429-436
62. Kunze, A., Giugliano, M., Valero, A., Renaud, P. (2011). ‘‘Micropatterning neural cell cultures in 3D with a multi-layered scaffold.’’ Biomaterials 32: 2088-2098
63. Lakins, J.N., Chin, A.R., Weaver, V.M. (2012). ‘‘Exploring the Link Between
Human Embryonic Stem Cell Organization and Fate Using Tension-Calibrated Extracellular Matrix Functionalized Polyacrylamide Gels.’’ Methods in molecular
biology 916: 317-350
64. Lam, H.J., Patel, S., Wang, A., Chu, J., Li, S. (2010). ‘‘In Vitro Regulation of Neural Differentiation and Axon Growth by Growth Factors and Bioactive Nanofibers.’’ Tissue Engineering: Part A 16(8): 2641-2648
65. Lam, W.A., Cao, L., Umesh, V., Keung, A.J., Sen, S., Kumar, S. (2010).
‘‘Extracellular matrix rigidity modulates neuroblastoma cell differentiation and N-myc expression.’’ Molecular Cancer 9: 35
Shahzad Ali, UCL
187
66. Lancaster, M.A., Renner, M., Martin, C., Wenzel D., Bicknell, L.S., Hurles, M.E.,
Homfray, T., Penninger, J.M., Jackson, A.P., Knoblich, J.A. (2013). ‘‘Cerebral organoids model human brain development and microcephaly.’’ Nature.
Published online August 28th 2013.
67. LaPlaca, M.C., Prado, G.R. (2009). ‘‘Neural Mechanobiology and Neuronal Vulnerability to Traumatic Loading.’’ Journal of Biomechanics 43: 71-78
68. Lee, H.H., Lee, H.C., Chou, C.C., Hur, S.S., Osterday, K., del Alamo, J.C., Lasheras,
J.C., Chien, S. (2012). ‘‘Shp2 plays a crucial role in cell structural orientation and force polarity in response to matrix rigidity.’’ Proceedings of the National
Academy of Sciences of the United States of America 110(8): 2840-2845
69. Lee, H.Y., Oh, B.H. (2010). ‘‘Ageing and arterial stiffness.’’ Circulation Journal 74(11): 2257-2262
70. Lee, S.H., Lumelsky, N., Studer, L., Auerbach, J.M., McKay, R.D. (2000).
‘‘Efficient generation of midbrain and hindbrain neurons from mouse embryonic stem cells.’’ Nature Biotechnology 18: 675-679
71. Lei, Y., Gojgini, S., Lam, J., Segura, T. (2011). ‘‘The spreading, migration and
proliferation of mouse mesenchymal stem cells cultured inside hyaluronic acid hydrogels.’’ Biomaterials 32: 39-47
72. Lendahl, U., Zimmerman, L.B., McKay, R.D. (1990). ‘‘CNS stem cells express a new class of intermediate filament protein.’’ Cell 60(4): 585-595
73. Levitan, I.B., Kaczmarek, L.K. (2002) ‘‘The Neuron: Third Edition.’’ Oxford
University Press, New York, USA, pp. 230-235, 375-387
74. Lewis, J.P., Trobaugh, F.E. (1964). ‘‘Haematopoietic Stem Cells.’’ Nature 204: 589-590
75. Liepzig, N.D., Shoichet, M.S. (2009). ‘‘The effect of substrate stiffness on adult
neural stem cell behaviour.’’ Biomaterials 30: 6867-6878
76. Lo, C.M., Wang, H.B., Dembo, M., Wang, Y.L. (2000). ‘‘Cell movement is guided by the rigidity of the substrate.’’ Biophysics Journal 79: 144-152
77. Lodish, H., Berk, A., Zipursky, S.L., Matsudaira, P., Baltimore, D., Darnell, J.
(2004). ‘‘Molecular biology of the cell: 5th Edition.’’ W.H. Freeman, New York, USA, pp.818
78. Lovett, D.B., Shekhar, N., Nickerson, J.A., Roux, K.J., Lele, T.P. (2013).
‘‘Modulation of Nuclear Shape by Substrate Rigidity.’’ Cellular and Molecular Bioengineering 6(2): 230-238
Shahzad Ali, UCL
188
79. Lu, T.Y., Lin, B., Kim, J., Sullivan, M., Tobita, K., Salama, G., Yang, L. (2013).
‘‘Repopulation of decellularised mouse heart with human induced pluripotent stem cell-derived cardiovascular progenitor cells.’’ Nature Communications
4:2307
80. Lu, Y.B., Franze, K., Selfert, G., Steinhäuser, C., Kirchhoff, F., Wolburg, H., Guck, J., Janmey, P., Wei, E.Q., Käs, J., Reichenbach, A. (2006). ‘‘Viscoelastic
properties of individual glial cells and neurons in the CNS.’’ Proceedings of the National Academy of Sciences USA 103(47): 17759-1764
81. Lumelsky, N., Blondel, O., Laeng, P., Velasco, I., Ravin, R., McKay, R. (2001).
‘‘Differentiation of embryonic stem cells to insulin-secreting structures similar to pancreatic islets.’’ Science 292(5520): 1389-1394
82. Ma, W., Fitzgerald, W., Liu, Q.Y., O’Shaughnessy, T.J, Maric, D., Lin, H.J., Alkon,
D.L., Barker, J.L. (2004). Experimental Neurology 190: 276-288
83. Ma, W., Tavakoli, T., Derby, E., Serebryakova, Y., Rao, M.S., Mattson, M.P. (2008). BMC Developmental Biology 8:90
84. Mason, C., Dunnill, P. (2008). ‘‘A brief definition of regenerative medicine.’’
Regenerative Medicine 3(1): 1-5
85. Mcmurray, R.J., Gadegaard, N., Tsimbouri, P.M., Burgess, K.V., McNamara, L.E.,
Tare, R., Murawski, K., Kingham, E., Oreffo, R.O.C., Dalby, M.J. (2011). ‘‘Nanoscale surfaces for the long-term maintenance of mesenchymal stem cell
phenotype and multipotency.’’ Nature Materials 10: 637-644
86. Merryman, D., Engler, A.J. (2010). ‘‘Innovations in cell mechanobiology.’’ Journal of Biomechanics 43: 1
87. Migliorini, E., Grenci, G., Ban, J., Pozzato, A., Tormen, M., Lazzarino, M., Torre,
V., Ruaro, M.E. (2011). ‘‘Acceleration of Neuronal Precursors Differentiation Induced by Substrate Nanotopography.’’ Biotechnology and Bioengineering 108: 2736-2746
88. Min, J.Y., Yang, Y., Converso, K.L., Liu, L., Huang, Q., Morgan, J.P., Xiao, Y.F.
(2002). ‘‘Transplantation of embryonic stem cells improves cardiac function in postinfarcted rats.’’ Journal of Applied Physiology 92(1): 288-296
89. Minev, I.R., Moshayedi, P., Fawcett, J.W., Lacour, S.P. (2013). ‘‘Interaction of
glia with a compliant, microstructured silicone surface.’’ Acta Biomaterialia 9(6): 6936-6942
90. Mokry, J., Nemecek, S. (1998) ‘‘Angiogenesis of extra- and intraembryonic
blood vessels is associated with expression of nestin in endothelial cells.’’ Folia biologica 44(5): 155-161
Shahzad Ali, UCL
189
91. Mondragon-Teran, P., Lye, G.J., Veraitch, F.S. (2009). ‘‘Lowering Oxygen Tension Enhances the Differentiation of Mouse Embryonic Stem Cells into
Neuronal Cells.’’ Biotechnology Progress 25: 1480-1488
92. Morizane, A., Li, J.Y., Brundin, P. (2008). ‘‘From bench to bed: the potential of stem cells for the treatment of Parkinson’s disease.’’ Cells and tissue research
331: 323-336
93. Moshayedi, P., Costa, L.F., Christ, A., Lacour, S.P., Fawcett, J., Guck, J., Franze, K. (2010). ‘‘Mechanosensitivity of astrocytes on optimized polyacrylamide gels
analysed by quantitative morphometry.’’ Journal of Physics: Condensed Matter 22: 194114
94. Murayama, Y., Mizuno, J., Kamakura, H., Fueta, Y., Nakamura, H., Akaishi, K.,
Anzai, K., Watanabe, A., Inui, H., Omata, S. (2006). ‘‘Mouse zona pellicuda dynamically changes its elasticity during oocyte maturation, fertilization and early embryo development.’’ Human Cell 19(4): 119-125
95. Myers, K.A., Applegate, K.T., Danuser, G., Fischer, R.S., Waterman, C.M. (2011)
‘‘Distinct ECM mechanosensing pathways regulate microtubule dynamics to control endothelial cell branching morphogenesis.’’ Journal of Cell Biology 192(2): 321-334
96. Nakamura, A., Xie, C., Zhang, Y., Gao, Y., Wang, H., Ye, Li., Kishi, H., Okagaki, T., Yoshiyama, S., Hayakawa, K., Ishikawa, R., Kohama, K. (2007). ‘‘Role of non-
kinase activity of myosin light-chain kinase in regulating smooth muscle contraction.’’ Biochemical and Biophysical Research Communications 369: 135-
143
97. Nelson, D., Cox, M. (2004) ‘‘Lehninger Principles of Biochemistry: Fourth Edition.’’ W.H. Freeman, New York, USA, pp. 182
98. Nichols, J., Zevnik, B., Anastassiadis, K., Niwa, H., Klewe-Nebenius, D.,
Chambers, I., Schöler, H., Smith, A. ‘‘Formation of pluripotent stem cels in the mammalian embryo depends on the POU transcription factor Oct4.’’ Cell 95(3): 379-391
99. Nikkah, M., Edalat, F., Manoucheri, S., Khademhosseini, A. (2012). ‘‘Engineering
microscale topographies to control the cell-substrate interface.’’ Biomaterials 33: 5230-5246
100. Niwa, H., Burdon, T., Chambers, I., Smith, A. (1998). ‘‘Self-renewal of
pluripotent embryonic stem cells is mediated via activation of STAT3.’’ Genes and Development 12: 2048-2060
Shahzad Ali, UCL
190
101. Okada, Y., Shimazaki, T., Sobue, G., Okano, H. (2004) ‘‘Retinoic-acid-
concentration-dependent acquisition of neural cell identity during in vitro differentiation of mouse embryonic stem cells.’’ Developmental Biology 275:
124-142
102. Okuda, A., Fukushima, A., Noshimoto, M., Orimo, A., Yamagishi, T., Nabeshima, Y., Kuro-o, M., Nabeshima, Y., Boon, K., Keaveney, M., Stunnenberg, H.G.,
Muramatsu, M. (1998). ‘‘UTF1, a novel transcription coactivator expressed in pluripotent embryonic stem cells and extra-embryonic cells.’’ The EMBO
Journal 17(7): 2019-2032
103. Pachernik, J., Esner, M., Bryja, V., Dvorak, P., Hampl, A. (2002). ‘‘Neural differentiation of mouse embryonic stem cells grown in monolayer.’’
Reproduction Nutrition Development 42: 317-326
104. Parasiadou, L., Xie, C., Cho, H.J., Lin, X., Gu, X-L., Long, C-X., Lobbestael, E., Baekelandt, V., Taymans, J-M., Sun, L., Cai, H. (2009). ‘‘Phosphorylation of Ezrin/Radixin/Moesin Proteins by LRRK2 Promotes the Rearrangement of Actin Cytoskeleton in Neuronal Morphogenesis.’’ Journal of Neuroscience 29: 13971-13980
105. Park, D., Xiang, A.P., Zhang, L., Mao, F.F., Walton, N.M., Choi, S.S., Lahn, B.T.
(2009). ‘‘The radial glia antibody RC2 recognizes a protein encoded by nestin.’’ Biochemical and Biophysical Research Communications 382(3): 588-592
106. Paszek, M.J., Zahir, N., Johnson, K.R., Lakins, J.N., Rozenburg, G.I., Gefen, A.,
Reinhart-King, C.A. Marguiles, S.S., Dembo, M., Boettiger, D., Hammer, D.A., Weaver, V.M. (2005). ‘‘Tensional homeostasis and the malignant phenotype.’’
Cancer Cell 8: 241-254
107. Pelham, R.J., Wang, Y. (1997). ‘‘Cell locomotion and focal adhesions are regulated by substrate flexibility.’’ Proceedings of the National Academy of
Sciences USA. 94: 13661-13665
108. Peyton, S.R., Putnam, A.J. (2005) ‘‘Extracellular matrix rigidity governs smooth muscle motility in a biphasic fashion.’’ Journal of Cellular Physiology 204(1): 198-209
109. Pillarisetti, A., Desai, J.P., Ladjal, H., Schiffmacher, A., Ferreira, A., Keefer, C.L.
(2011) ‘‘Mechanical Phenotyping of Mouse Embryonic Stem Cells: Increase in Stiffness with Differentiation.’’ Cellular Reprogramming 13(4): 371-380
110. Poh, Y., Chowdhury, F., Tanaka, T.S., Wang, N. (2010) ‘‘Embryonic Stem Cells Do
Not Stiffen on Rigid Substrates.’’ Biophysical Journal 99: L19-L21
Shahzad Ali, UCL
191
111. Pompe, T., Kaufmann, M., Kasimir, M., Johne, S., Glorius, S., Renner, L., Bobeth,
M., Pompe, W., Werner, C. (2011). ‘‘Friction-Controlled Traction Force in Cell Adhesion.’’ Biophysical Journal 101: 1863-1870
112. Prager-Khoutorsky, M., Lichtenstein, A., Krishnan, R., Rajendran, K., Mayo, A.,
Kam, Z., Geiger, B., Bershadsky, A.D. (2011). ‘‘Fibroblast polarization is a matrix-rigidity dependent process controlled by focal adhesion mechanosensing.’’
Nature Cell Biology 13(12): 1457-1466
113. Previtera, M.L., Hui, M., Verma, D., Shahin, A.J., Schloss, R., Langrana, N.A. (2013). ‘‘The Effects of Substrate Elastic Modulus on Neural Precursor Cell
Behavior.’’ Annals of Biomedical Engineering 41(6): 1193-1207
114. Prosser. B.L., Ward, C.W., Lederer, W.J. (2011). ‘‘X-ROS signalling: rapid mechano-chemo transduction in heart.’’ Science 333(6048): 1440-1445
115. Rao, M.S. (2006). ‘‘Neural Development and Stem Cells.’’ Humana Press,
Totowa, USA, pp. 54, 67-84
116. Rienzo, C.D., Jacchetti, E., Cardarelli, F., Bizzarri, R., Beltram, F., Cecchini, M. (2013). ‘‘Unveiling LOX-1 receptor interplay with nanotopography: mechanotransduction and atherosclerosis onset.’’ Scientific Reports 3: 1141
117. Saha, K., Keung, A.J., Irwin, E.F., Li, Y., Little, L., Schaffer, D.V., Healy, K.E. (2008).
‘‘Substrate Modulus Directs Neural Stem Cell Behavior.’’ Biophysical Journal 95: 4426-4438
118. Seuntjens, E., Umans, L., Zwijsen, A., Sampaolesi, M., Verfaille, C.M.,
Huylebroeck, D. (2009). ‘‘Transforming Growth Factor typebeta and Smad family signalling in stem cell function.’’ Cytokine & Growth Factor Reviews 20:
449-458
119. Skoglund, P., Rolo, A., Chen, X., Gumbiner, B.M., Keller, R. (2008). ‘‘Convergence and extension at gastrulation require a myosin II-b dependent cortical actin network.’’ Development 135: 2435-2445
120. Smukler, S.R., Runciman, S.B., Xu, S., van der Kooy, D. (2006). ‘‘Embryonic
stem cells assume a primitive neural stem cell fate in the absence of extrinsic influences.’’ The Journal of Cell Biology 172(1): 72-90
121. Soria, B., Roche, E., Berná, G., León-Quinto, T., Reig, J.A., Martín, F. (2000).
‘‘Insulin-secreting cells derived from embryonic stem cells normalize glycemia in streptozotocin-induced diabetic mice.’’ Diabetes 49(2): 157-162
122. Stadtfeld,M., Nagaya, M., Utikal, J., Weir, G., Hochedlinger, K. (2008).
‘‘Induced Pluripotent Stem Cells Generated Without Viral Integration.’’ Science 322: 945-949
Shahzad Ali, UCL
192
123. Stolberg, S., McCloskey, K.E. (2009). ‘‘Can Shear Stresss Direct Stem Cell Fate?’’ Biotechnology Progress 25: 10-19
124. Sullivan, K.F., Cleveland, D.W. (1986). ‘‘Identification of conserved isotype-
defining variable region sequences for four vertebrate beta tubulin polypeptide classes. Proc Natl Acad Sci USA 83(12): 4327-4331
125. Takahashi, K., Yamanaka, S. (2006). ‘‘Induction of pluripotent stem cells from
mouse embryonic and adult fibroblast cultures by defined factors.’’ Cell 126(4): 663-676
126. Takebe, T., Sekine, K., Enomura, M., Koike, H., Kimura, M., Ogaeri, T., Zhang,
R., Ueno, Y., Zheng, Y., Koike, N., Aoyama, S., Adachi, Y., Taniguchi, H. (2013) ‘‘Vascularized and functional human liver from an iPSC-derived organ bud
transplant.’’ Nature 499(7459): 481-484
127. Tan, F., Naciri, M., Dowling, D., Al-Rubeai, M. (2012) ‘‘In vitro and in vivo bioactivity of CoBlast hydroxyapatite coating and the effect of impaction on its osteoconductivity.’’ Biotechnology Advances 30(1): 352-362
128. Tee, S., Bausch, A.R., Janmey, P.A. (2009). ‘‘The Mechanical Cell.’’ Current
Biology 19: 745-748
129. Thomson, J.A., Itsovitz-Eldor, J., Shapiro, S.S., Waknitz, M.A.,Swiergiel, J.J.,Marshall, V.S., Jones, J.M. (1998). ‘‘Embryonic Stem Cells Derived from
Human Blastocytsts.’’ Science 282: 1145-1147
130. Tsukita, S., Yonemura, S., Tsukita, S. (1997). ‘‘ERM proteins: head-to-tail regulation of actin-plasma membrane interation.’’ Trends in Biochemical
Sciences 22: 53-58
131. Van Dyke, W.S., Sun, X., Richard, A.B., Nauman, E.A., Akkus, O. (2012). ‘‘Novel mechanical bioreactor for concomitant fluid shear stress and substrate
strain.’’ Journal of Biomechanics 45: 1323-1327
132. Wang, N., Tytell, J.D., Ingber, D.E. (2009). ‘‘Mechanotransduction at a distance: mechanically coupling the extracellular matrix with the nucleus.’’
Nature Review Mol. Cell Biol. 10: 75-82
133. Wei, W.C., Lin, H.H., Shen, M.R., Tang, M.J. (2008). ‘‘Mechanosensing machinery for cells under low substratum rigidity.’’ American Journal of Physiology. Cell Physiology 295(6): 1579-1589
134. Westfall, M.V., Pasyk, K.A., Yule, D.I., Samuelson, L.C., Metzger, J.M. (1997).
‘‘Ultrastructure and cell-cell coupling of cardiac myocytes differentiating in embryonic stem cell cultures.’’ Cell motility and the Cytoskeleton 36: 43-54
Shahzad Ali, UCL
193
135. Wichter, H., Peljto, M. (2008). ‘‘Differentiation of Mouse Embryonic Stem Cells
to Spinal Motor Neurons.’’ Current Protocols in Stem Cell Biology Chapter 1: Unit 1H.1.1-1H.1.9
136. Wilkinson, D.G., Bhatt, S., Herrmann, B.G. (1990). ‘‘Expression pattern of the mouse T gene and its role in mesoderm formation.’’ Nature 343: 657-659
137. Wolpert, L., Jessell, T., Lawrence, P., Meyerowitz, E., Robertson, E., Smith, J., (2007). ‘‘Principles of Development: Third Edition.’’ Oxford University Press,
New York, USA, pp. 332-334, 387-417
138. Yang, Y., Kulangara, K., Lam, R.T.S., Dharmawan, R., Leong, K.W. (2012). ‘‘Effects of Topographical and Mechanical Property Alterations Induced by
Oxygen Plasma Modification on Stem Cell Behavior.’’ American Chemical Society: Nano 6(10): 8591-8598
139. Yeung, T., Georges, P.C., Flanagan, L.A., Marg, B., Ortiz, M., Funaki, M., Zahir,
N., Ming, W., Weaver, V., Janmey, P.A. (2005). ‘‘Effects of Substrate Stiffness on Cell Morphology, Cytoskeletal Structure and Adhesion.’’ Cell Motility and
the Cytoskeleton 60:24-34
140. Ying, Q., Stavridis, M., Griffiths, D., Li, M., Smith, A. (2003). ‘‘Conversion of embryonic stem cells into neuroectodermal precursors in adherent
monoculture.’’ Nature 21: 183-186
141. Young, T., Kelland, P. (1845). ‘‘A course of lectures on natural philosophy and the mechanical arts.’’ Taylor and Walton, London, UK, Lecture XIII: pp.106
142. Yu, C.C., Woods, A.L., Levison, D.A. (1992). ‘‘The assessment of cellular
proliferation by immunocytochemistry: a review of currently available
methods and their applications.’’ The Histochemical Journal 24(3): 121-131
143. Yu J, Vodyanik MA, Smuga-Otto K, Antosiewicz-Bourget J, Frane JL, Tian S, Nie J, Jonsdottir GA, Ruotti V, Stewart R, Slukvin II, Thomson JA. (2007). ‘‘Induced
pluripotent stem cell lines derived from human somatic cells.’’ Science 383: 1917-1920
144. Zatti, S., Zoso, A., Serena, E., Luni, C., Cimetta, E., Elvassore, N. (2012).
‘‘Micropatterning Topology on Soft Substrates Affects Myoblast Proliferation and Differentiation.’’ Langmuir 28: 2718-2726
145. Zhang, K., Li, L., Huang, C., Shen, C., Tan, F., Xia, C., Liu, P., Rossant, J., Jing, N.
(2010). ‘‘Distinct functions of BMP4 during different stages of mouse ES cell neural commitment.’’ Development 137(13): 2095-2105

Shahzad Ali, UCL
194
146. Zhao, L., Shim, J.W., Dodge, T.R., Robling, A.G., Yokota, H. (2013). ‘‘Inactivation
of Lrp5 in osteocyte reduces Young’s modulus and responsiveness to the mechanical loading.’’ Bone 54: 35-43
147. Zhou, W., Freed, C.R. (2009) ‘‘Adenoviral gene delivery can reprogram human
fibroblasts to induced pluripotent stem cells.’’ Stem Cells 27(11): 2667-2674