Embed Size (px)
Citation preview
Dynamic GIS Case Studies: Wildfire Evacuation and Volunteered Geographic Information
by
Edward Pultar and Martin Raubal Department of Geography
University of California, Santa Barbara 1832 Ellison Hall
Santa Barbara, CA 93106-4060 Voice: 805.893.3663
E-mail: [email protected]
Thomas J. Cova Department of Geography
University of Utah 260 S. Central Campus Dr. Salt Lake City, UT 84112
and
Michael F. Goodchild
spatial@ucsb Department of Geography
University of California, Santa Barbara 5707 Ellison Hall
Santa Barbara, CA 93106-4060
Keywords: dynamic, spatiotemporal, GIS, wildfire evacuation, volunteered geographic information
Abstract Incorporating the temporal element into traditional GIS is a challenge that has been researched for many years and has many proposed solutions. The implemented system “Extended Dynamic GIS” or EDGIS is based on the “geo-atom” and Space Time Point (STP). EDGIS provides a platform for spatiotemporal data representation, storage, and query in order to address the need for a dynamic GIS to manage complex geographic data types. The system has the capability of executing spatiotemporal object interaction queries (OIQs) such as crossing and coincidence of field-objects and object-fields. In this paper existing dynamic GIS analysis techniques are further improved and enhanced through exploration of more in-depth case studies. Further examined here are applications to wildfire evacuation modeling and travel scenarios of urban environments with individuals providing volunteered geographic information (VGI). The EDGIS platform provides a means for interacting with a range of dynamic geographic phenomena. The areas of transportation, location based services (LBS), hazards, and geo-sensor networks provide challenges intertwined with the above applications as well as additional challenges pertinent to the ongoing GIScience research topic of spatiotemporal GIS. Using EDGIS to explore the described case studies of wildfire evacuation as well as VGI provides the advancements described above and demonstrates implemented uses for dynamic GIS.
1. Introduction The integration of time with GIS has been researched for decades and still continues to be a challenging topic. Many approaches to this problem have been put forward (Frank et al. 1992, Peuquet 2001, Yuan and McIntosh 2002, Miller 2005, O’Sullivan 2005, Reitsma and Albrecht 2005, Worboys and Duckham 2005, Albrecht 2007). This paper focuses particularly on the “geo-atom” (Goodchild et al. 2007) approach incorporated into the system known as Extended Dynamic GIS or EDGIS (Pultar et al. 2009) written in the Java™ programming language. EDGIS is a piece of software created using the Eclipse™ Integrated Development Environment (IDE) and the Standard Widget Toolkit (SWT™). The Java™ language was chosen for its mixture of efficiency and cross-platform compatibility. This paper uses the existing EDGIS software package within the Windows XP™ environment for the first case study and the OS X™ environment for the second. In EDGIS geo-atoms are implemented as “Space Time Points” (STPs), which are the fundamental building blocks used to create geographic features. Utilizing STPs to compose Features and Themes in EDGIS allows for the handling of complex representations of moving fields and objects with internal variation. Particularly in this research, an exploration of dynamic GIS case studies is needed to further demonstrate the applicability of this spatiotemporal information handling approach. The transition from a static to a dynamic GIS is useful as real world geographic objects are constantly changing through time. Therefore any methods making use of the growing amount of geographic data (geodata) provide better analysis, query abilities, and visualization. Enhanced geodata collection has become more widely available in recent years due to increased availability and temporal granularity of remote sensing data, more and more location-aware mobile phones, and online repositories of geographic information uploaded by individuals around the world. Handling this multitude of potential data sources is a task addressed through the geographic representations used in this research. The wealth of geodata today requires an efficient and user-friendly system to answer questions while paying particular attention to the temporal nature of our earth. The research questions concerning the utility of dynamic GIS that are investigated in this paper include:
1) How can a wildfire and evacuation trigger buffer scenario be implemented in a dynamic GIS?
2) How can remote sensing be used in combination with a dynamic GIS to study wildfire evacuation?
3) How can a collection of social, data, and transport networks be utilized in a dynamic GIS in order to aid travelers in their spatiotemporal decision-making?
4) How can travelers use web-based networks to find suitable travel destinations based on their preferences within multiple network levels?
This paper’s purpose is to exhibit explicit situations where EDGIS can provide utility through spatiotemporal data representation, storage, visualization, and query ability. Specifically, scenarios of wildfire evacuation and Volunteered Geographic Information (VGI) are integrated into the existing dynamic GIS framework. Wildfire
evacuation is chosen due to its dynamic nature of the multiple objects involved: the fire itself, humans, wildlife, and vehicles. Also, some results from this natural hazard can be extrapolated to other phenomena such as hurricanes, earthquakes, and flooding. VGI is integrated here through an e-tourism scenario where people make travel decisions by utilizing multiple networks, i.e., a social, a data, and a transportation network. This scenario was chosen to demonstrate the system’s architecture and capability for making highly dynamic spatiotemporal decisions. Its functionality can later be generalized to choices made in a variety of environments by humans as well as other organisms or organizations. Examining these case studies will further demonstrate the utility of a system that aids in dynamic spatiotemporal decision making. Section 2 presents related work on spatiotemporal and dynamic GIS. The third section presents the architecture of EDGIS, the dynamic GIS used in this research. Section 4 discusses the use case of wildfire evacuation and section 5 the use case of multi-network travel utilizing VGI. A discussion is provided in section 6 and the final section contains conclusions and future work. 2. Related Work Representing parts of the earth in a dynamic fashion has a history of approaches with one of the first being the snapshot method. This method uses a discrete snapshot for each point in time there is data available (Langran 1992, Peuquet 2001). Typically the snapshot stored is field-based, having a value at every point in a grid layout, and can be thought of as taking successive pictures of the same location at different time steps. This can produce some interesting visualizations through animating the collection of snapshots. Also the detection of change can be noticeable to the human eye depending on the spatial as well as temporal resolution. However, by not storing any features such as a building explicitly it can be difficult to construct useful object-based data from the raster-based snapshots. Implementing spatiotemporal queries with this approach can also be quite time intensive as each snapshot must be fully examined and may contain a large number of data points not pertinent to a user’s specific query. The raster-based “ESTDM” or event-based spatiotemporal data model (Peuquet et al. 1995) uses an approach where geographic phenomena are stored as events that occur through time. The three-domain model (Yuan 1996) separates dynamic geographic data into the three core components of spatial, temporal, and semantic. These distinct domains are then linked to each other as pointers between the three different tables or databases. MODs or Moving Object Databases (Wolfson et al. 1998, Güting et al. 2005) contain moving points and polygons with useable queries. There are also methods utilizing the computer science-based object-oriented approach for representing geographic data (Worboys 1994, Raper et al. 1995). At the 2008 GIScience conference1 in Park City, Utah, a workshop entitled “Temporal GIS: the past 20 years and the next 20 years” was held to continue development in this topic. Further discussion of these and other approaches can be found in Worboys and Duckham (2005), Yuan and Stewart (2008), and Stewart and Yuan (2008). 1 http://www.giscience.org
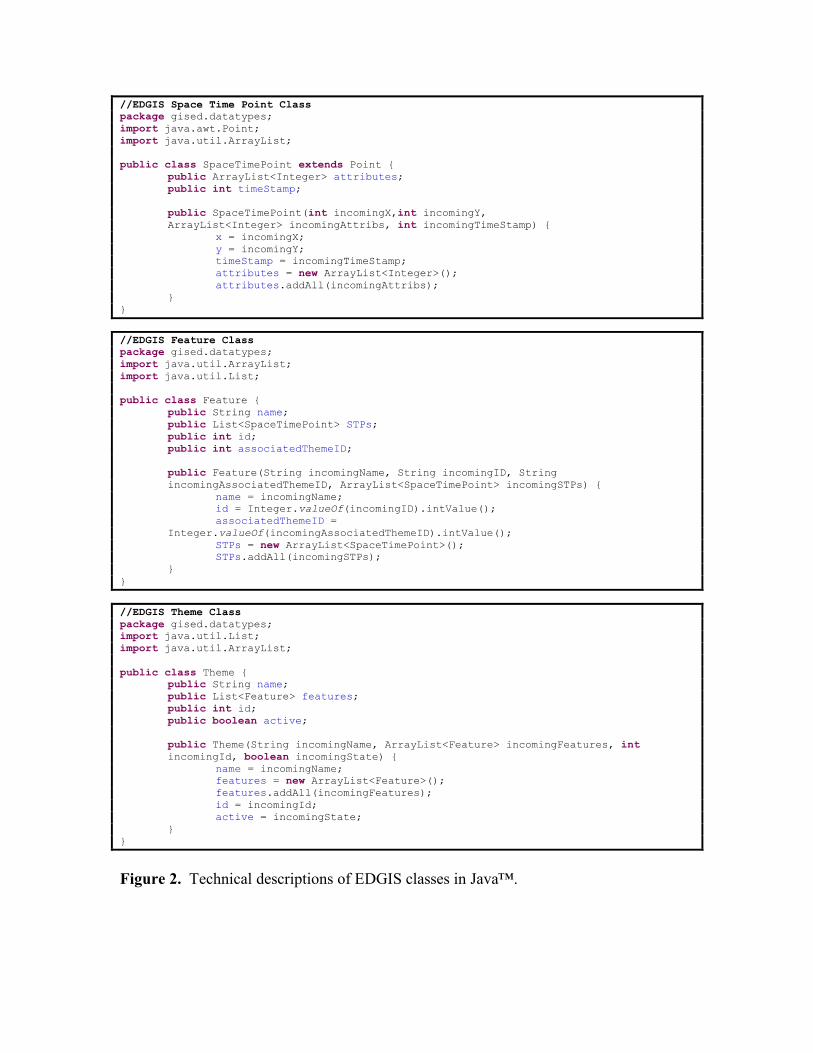
3. EDGIS Spatiotemporal Information Architecture In the EDGIS architecture, space time points (STPs) make up the building blocks of features and features are aggregated into themes (Figure 1). Therefore underneath any geographic information in this architecture are the underlying STPs, which are vectors of spatiotemporal information and attributes. This provides a powerful and flexible geographic data structure (Albrecht 1996). An example of an STP is a weather station with a location, attributes such as wind speed, direction, and temperature, as well as a time at which the properties were collected. A feature can be composed of one or more STPs associated in addition to its own attributes. For example, a wildfire could be represented as a feature made up of over a hundred STPs, of which each STP has its own space-time information and attribute values. This allows for internal variation of a feature as the number of STPs composing a feature and their attributes such as flame height are dynamic and may change at any time. The next level is a theme, which is defined as a set of features along with any attributes of the theme such as a name and whether it is actively drawn in the current display. A theme can represent a group of features such as all of the wind turbines in the state of Utah owned by any company, where each feature can be the collection of one company’s turbines with STPs representing each turbine individually. Dynamic geographic phenomena may be changing location, attribute, and/or shape through time. Hence wildfires (variable location, attributes, and shape) are dynamic in a different sense than weather stations (static location with variable attributes and shape). However, the STP architecture allows for the use and interaction of geographic features based on the Java™ skeleton classes in Figure 2. [Figure 1 here] [Figure 2 here] 4. Dynamic GIS and Wildfire Evacuation A Dynamic GIS can store information, perform analysis and help visualize physical geographical events such as hurricanes, wildfires, and earthquakes. Recently humans have increased their desire to live in urban areas yet still have accessibility to nature. This brings about the concept of the Wildland-Urban interface (WUI), which is studied here particularly in a context combining wildfire and urban living areas. The results make use of and build upon the WUIVAC system (Dennison et al. 2007) and its use of evacuation trigger buffer polygons. An evacuation trigger buffer is a boundary surrounding a community such that when a fire crosses this boundary an evacuation should be recommended (Cova et al. 2005). This requires an estimate of both fire travel times toward the community as well as the estimated time that it will take the community to evacuate. Simulation combining wildfire modeling and evacuation modeling is not new and agent-based approaches have been used in the past (Huibo et al. 2004, Korhonen et al. 2008). However, in this work we are implementing these scenarios in the context of a dynamic GIS. Agent-based models often focus on simulation but a dynamic GIS is used here for its querying ability and compatibility with existing GIS information. However, using the STP as a component of an agent provides a potential combination of the approaches.
A static GIS can be helpful in showing recent and critical information such as the current fire boundary polygon, shelters, and evacuated areas. However, these objects are all highly dynamic producing rapid changes. While the portability of a printed map is convenient for showing an overall view of the situation for a designated point in time, the ubiquity and mobility of modern computing devices has reached a point where having a dynamic GIS combined with the data from these physical earth events can provide a higher utility than static approaches. 4.1 Wildfire Evacuation Scenario
This recent trend of human communities being close to nature leads to areas where urban dwellings meet the wild. Specifically in the United States, Salt Lake City, Utah, and Santa Barbara, California, are examples of urban areas in close proximity to a large amount of trees and brush that if lit can cause an instantaneous danger to human lives. The recent Gap Fire and Tea Fire in the Santa Barbara area threatened local residents’ lives and burned hundreds of homes in 2008. As timing is critical in these situations the use of modern, portable technology can provide up-to-date information to disseminate to a wide audience. Particularly the latest information about the natural hazard has greater accessibility, visibility, and reusability with a dynamic GIS as part of the effort as opposed to a static paper map. With disaster relief centers and evacuation points a static paper map showing fire information has a time lag as a printed map will need to be delivered to each location concerned with the evacuation relief. Rapid updates to multiple locations from one central spatiotemporal database are an exciting possibility. This allows for keeping everyone involved in the emergency correctly informed by having computer display devices equipped with a dynamic GIS at disaster relief centers scattered around the affected area. The implementation of this approach utilizing a central spatiotemporal database with a distributed architecture is left for future work.
In order to demonstrate the utility of the STP approach a wildfire scenario is used as a specific case study. This is a prime example as the situation involves: the wildfire itself (moving object with changing shape and internal attributes), an evacuation trigger buffer (object with variable shape based on fire properties and weather conditions), homes (stationary points), and humans (moving points, walking, or in automobiles).
4.2 Wildfire Data and Methods The fire data used for this case study was acquired from the MODIS Active Fire Mapping Program2. Data from the summer of 2004 in an area near Fairbanks, Alaska, is used here to demonstrate the capabilities of EDGIS with access to dynamic data about natural hazards in addition to the applicability for evacuation scenarios. MODIS Active Fire collects data for 1km by 1km areas at multiple times per day, providing real-world dynamic data suitable for this case study. Interpolation techniques may be needed to produce more STPs when the 1km by 1km spatial resolution is not sufficient. An example of this is a scenario where an analyst needs to determine whether or not to evacuate an area less than 1 km across. The MODIS satellite stores temporal and spatial data for a detected active fire in addition to 4 micron and 11 micron band brightness temperatures. For this example the 4 micron temperatures are used to describe the 2 http://activefiremaps.fs.fed.us/gisdata.php
ground temperature of the fire and produce dynamic polygons with internal variation due to their STP composition. These temperatures are stored in units of Kelvin in this simple dataset and range from 305K to 500K. The fire data from the United States Department of Agriculture (USDA) Forest Service was first converted to XML (eXtensible Markup Language) format. Then JavaScript code making use of the DOM (Document Object Model) extracted proper elements and converted them to the STP format (<x, Z, z(x)>) used in EDGIS. Evacuation trigger buffers were then calculated for the nearby Alaskan urban areas of Fairbanks, North Pole, and Salcha. These buffers are dynamic objects themselves as their shape can change quickly and drastically due to the latest weather data such as wind speed and direction. The equation used to create the initial evacuation trigger buffers in this case scenario is based on the simple equation used in calculating hurricane evacuation trigger decision arcs (FEMA 2000). The formula for the circular buffer polygons around Fairbanks, Alaska, is given by: r = t * s (1) where r is the trigger radius around the community, t is the estimated evacuation time and s is the speed of the fire/threat toward the community (e.g. mph). The estimated evacuation time used in this example was 10 hours, which is a conservative measure but these evacuations can happen at any time of day and such amount of time puts lives less at risk. The fire speeds were estimated using the distance the fire front moved between the two data collection periods: morning and evening. This distance was then divided by 12 hours to get a speed in miles per hour. For example, between the evening of June 30, 2004, and the morning of July 1, 2004, the fire moved 25 miles or approximately 25mi / 12 hr. ~ 2.1 mph. With an estimated evacuation time of 10 hours the evacuation buffer created around Fairbanks is ~ 21 miles. This basic approach takes into account the speed of the approaching threat and the time it takes to evacuate a community. These numbers are realistic as past evacuations have occurred in communities of the Los Angeles, California, area that were over 20 miles away from the active fire (Kim et al. 2006). Combining all of this information with an Object Interaction Query (OIQs) of EDGIS the system provides a time and location where the fire has touched or crossed the evacuation trigger buffer. OIQs are queries about space-time relationships between two entities. In EDGIS OIQs can be used to determine if, where, and when two objects crossed as well as the time duration the objects coincided. Currently EDGIS uses a brute force approach with loops to examine the STPs composing the two objects of interest. Once location information is found the temporal component of each STP determines if, when, and for how long the objects coincide. For example, one object may be a fire evacuation trigger buffer and the other the wildfire itself. When STPs of the two objects coincide in space and time EDGIS informs the analyst to recommend an evacuation in order to protect lives of those residing in nearby areas. To evaluate this case study we can use a test scenario where a given fire threatens a community according to the equation defining the evacuation trigger buffer (in this case Equation 1). An OIQ
returning the time and location a fire touched or crossed the trigger buffer would be a successful outcome. 4.3 Scenario and Value The Alaska 2004 fire scenario is shown in EDGIS in Figures 3 and 4 and in a screenshot animation on the web3. These demonstrate the functionality of the sample polygons with internal variation (the fire itself), moving points (vehicles), and dynamic polygons (evacuation trigger buffer). In the figures the hue of the fire is displayed based on the following criteria (Table 1). [Table 1 here] Note that the fire crosses the evacuation trigger buffer on the morning of July 1, 2004, which activates the evacuating vehicles seen as blue STPs in Figure 4. While the data for the fire is by no means complete, it provides an initial step at being able to collect real-time data about the earth and analyze it in a dynamic GIS to protect individual lives. This is triggered automatically and checked by an analyst querying whether the fire has crossed the evacuation trigger buffer boundary at each time of data collection. If so, as it occurs during the morning of July 1, 2004, in this sample dataset, then evacuation procedures are commenced. Further real-time data collection techniques with enhanced resolution and finer temporal granularity will be useful in providing a dynamic GIS the means to better aid in spatiotemporal decision-making. The value of such an exercise is primarily to recreate the dynamics of the various elements in such a way that they can be easily communicated and analyzed in concert. For example, in hindsight it may be obvious that an agreed upon trigger buffer did not provide enough time for a community to evacuate. While it is common to represent fire spread or vehicle congestion in separate environments (e.g. fire modeling or traffic modeling), neither of these systems alone can capture and represent the two processes together, which is essential in understanding the timing and geography of a given event. Given that EDGIS can represent dynamic objects, fields and their interactions, a key need is moving this toward something that can be done in real-time during an event to aid in making decisions about who should evacuate and when. [Figure 3 here] [Figure 4 here] 5. Dynamic GIS and Volunteered Geographic Information Due to a growing availability of computing devices around the world, more and more people are able to author information that is then widely distributed via the internet. With a large amount of this information comes a geographical component, such as the location from where the information was submitted or the location that is being described. This growing field has come to be known as volunteered geographic 3 http://EdwardPultar.com/FireAnim.html

information or VGI with the billions of humans on earth all being capable sensors (Goodchild 2007). VGI can come in many different forms (e.g., restaurant reviews, travel logs, or geo-tagged photos), but in order to use any VGI for analysis and visualization in a GIS it must be in a proper geospatial data format. Extracting the geographical attributes of this and other VGI ranges widely in difficulty and resolution. Discovering VGI is also possible by crawling the web with a software agent that later performs data mining and geospatial data creation (Pultar et al. 2008). Recent advances in technologies have also led to many new ways for movement. An amalgamation of social, data, and transportation networks leads to novel forms of world travel specifically studied in this paper. Each independent network creates types of VGI as detailed above but when all three are used simultaneously in one system it opens new doors for spatiotemporal decision-making (Pultar and Raubal forthcoming 2009). The CouchSurfing4 (CS) project is a free and global social network of travelers and hosts where members offer other members space (e.g., couch, floor, extra bed) to stay while they are traveling. CS is the largest non-profit organization of its kind and has seen incredible growth in recent years to arrive at over 1,000,000 members in 2009. Users create a profile with basic, descriptive information and VGI such as locations traveled previously, current city of residence, and photographs. Members of this network establish friend links between other members from around the globe and declare a link strength level that depicts strong vs. weak ties in their social networks. The social network also allows users to leave references for one another which add to the safety of travelers since those that acquire positive reviews are more likely to host and be hosted (Molz 2007). The links between members can be quite extensive as there are CS users on every continent which also makes for unique individual social network maps (Larsen et al. 2006) when used in conjunction with a GIS. When a user wishes to travel using the CS network she first uses a search utility to generate a list of potential hosts that match her designated criteria (e.g., age, gender, languages spoken) and then decides who to contact via the data network or messaging system. Analysis of a potential host’s social network (e.g., breadth and depth of friend connections, number of positive references) also influences the decision. Once a guest and host have exchanged messages and agreed on a meeting place, transportation networks are needed to change from virtual to physical presence (Janelle 2004). Related research has also been done taking an activity-based approach combined with time geography (Wang and Cheng 2001, Timmermans et al. 2002, Miller 2005). Note another effect of the data and social networks at this step is the presence of a local host’s recommendations on methods of travel, e.g., discount airline vs. bus vs. train. Once a visitor’s stay is complete they may return home or continue on their travels potentially staying with another host. The dynamic GIS EDGIS supports this multi-network spatiotemporal decision-making. This process is aided by being able to store a user’s travel preferences and show matches visually in EDGIS with an appropriate base layer. As this form of travel allows for mid-trip itinerary changes (e.g., as a result of transportation strikes or inclement 4 http://www.couchsurfing.com
weather) with flexible travelers, the dynamic GIS installed on a mobile device affords a modern traveler great utility in overall trip experience. A traveler’s preferences may be stored as attributes inside of a STP. Likewise potential hosts and their attributes and VGI are elements of other STPs. EDGIS then allows the user to query and locate potential hosts. However, travel itself constitutes dynamic spatial behavior (Golledge and Stimson 1997) and the possible scenarios of a traveler using this multi-network system change drastically through time. The social network data itself are quickly changing and two searches with the same criteria but one hour apart will not always return identical results. Representing such travel behavior in a dynamic GIS produces a scenario for demonstrating the utility of spatiotemporal querying with respect to the highly variable geographic phenomena of human individuals, data clouds, and multiple modes of transportation. For example, travelers using the CS networks may have varying levels of flexibility. After contacting multiple potential hosts for a destination the final plans may still not be solidified prior to departure to the destination. However, this type of travel behavior with its extensive use of data networks allows the traveler to check the network at the airport in order to realize the most current options. From this information the traveler can perform an instantaneous itinerary change in the middle of their trip and take a different standby flight that better fits their desires. They may also have flexibility in choosing their host, contacting them with the most recent arrival information and personal description to ensure a smooth transition from virtual to physical communication and presence. 5.1 VGI and CouchSurfer Data The amalgamation of networks utilized in CouchSurfing lends itself as an interesting case study for further examination in EDGIS due to the highly dynamic nature of the involved networks and processes. In particular this travel scenario is set in a part of Europe covering Hungary, Czech Republic, Austria, Slovakia, and Slovenia. Traveler A begins her trip in the Czech Republic’s capital Prague staying three days with a host in the southern part of town. The traveler is looking to experience a variety of cultures and thus a multitude of potential hosts have been contacted in Austria, Croatia, Slovakia, and Hungary. Initially Traveler A has envisioned traveling from north to south and timing their itinerary to adhere to this plan. However, a train strike has led to a barrier in the transportation network for connecting to Vienna, Austria. Utilizing a dynamic GIS with multi-network representation capabilities the traveler is able to visualize potential mid-trip itinerary changes. Examining the air travel network the traveler finds a cheap flight to Zagreb, Croatia, and is able to quickly utilize the social network to communicate with potential hosts in Croatia. This type of mid-trip spatiotemporal decision-making leads to a different order of movement as the traveler will now approach Vienna by train from the south. In evaluating the travel scenario case study, the verification of each network being utilized properly can be used to create metrics that specify how successful EDGIS was. For example, with a test where all modes of transportation leaving the traveler's origin have current barriers, the system would return no recommendations. The traveler’s preferences are stored as attributes in an STP. This is part of a list of variables such as:
• Preferred gender of host (e.g., male, female, no preference) • Age of host (e.g., 30-50 years old) • Host’s number of positive references (e.g., 10 or more) • Languages spoken (e.g., English or German, Spanish and English) • Preferred locations to visit (e.g., Berlin, Germany, London, England, and Paris,
France) • Preferred values for travel cost and time (e.g., a person would rather arrive at their
destination cheaply even if it means spending more time in transit) • Preferred transportation modes (e.g., train and bus)
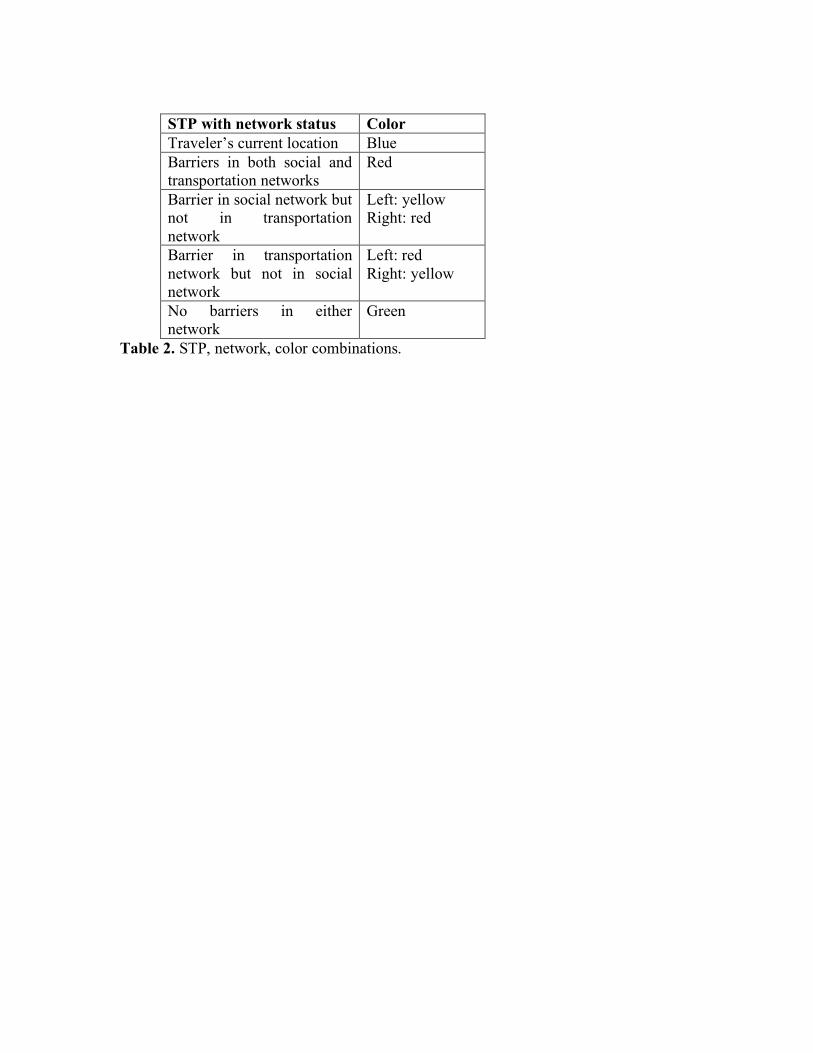
5.2 Scenario Integrating Dynamic VGI and Dynamic GIS In this scenario the traveler’s preferred places to travel are extracted as an attribute from the STP in addition to their preferences for transportation modes and price versus amount of travel time. For instance, some may prefer the cheapest possible option even if this is on a slower train while others would rather maximize their time at their destination and will pay more for a flight arriving at their destination sooner. These are matched according to the current situation which is dependent on the time of query. In this scenario the utility of a dynamic GIS is demonstrated as a spatiotemporal decision can vary heavily depending on the time the query is issued. For instance, an individual may make a similar query at 6:00 a.m., 12:00 p.m., and 6:00 p.m. but the results of these spatiotemporal queries will vary based on the current status of the networks. This is similar to Google Maps™ transit directions being based on the current state of the transport networks but here we have an additional network, i.e., the social network that is also critical in decision-making. Specifically, Traveler A is unable to travel directly to Austria by train in the morning at 6:00 a.m., but based off of their preferences query results return a recommendation of flying to Croatia and taking a train to Austria three days later. However, with the train transportation strike ending later that day, the same query issued in the evening at 6:00 p.m. results in the opportunity to travel directly to Austria then later Croatia, which best fits Traveler A’s preference for frugal travel. Similar variability exists for the social network as well since a host may have availability in the morning but later that afternoon the host makes a confirmation to let someone stay. Hence the query in the morning returns availability with this host but the query in the afternoon returns no availability for this host in the social network. Therefore when Traveler A issues their query the current status of all network levels is examined and a suitable match in the transportation and social network may be found or a barrier in one or more networks may be encountered as a consequence of the time desired to travel. Hence details of each network can be explicitly stored in STPs, one set of STPs for each network type and queries can be made that utilize any combination of the network properties. Due to the dynamic nature of these networks and the capabilities of the STP approach, the different query results are returned based on Traveler A’s choice to leave at 6:00a.m., 12:00p.m., or 6:00p.m (Table 2, Figures 5-7). In this example the traveler, located in Prague, Czech Republic, wants to go to Ljubljana, Vienna, Bratislava, Budapest, or Zagreb. Different temporal granularities such as finding suitable travel scenarios on four separate days are possible as well. This demonstrates the enhanced
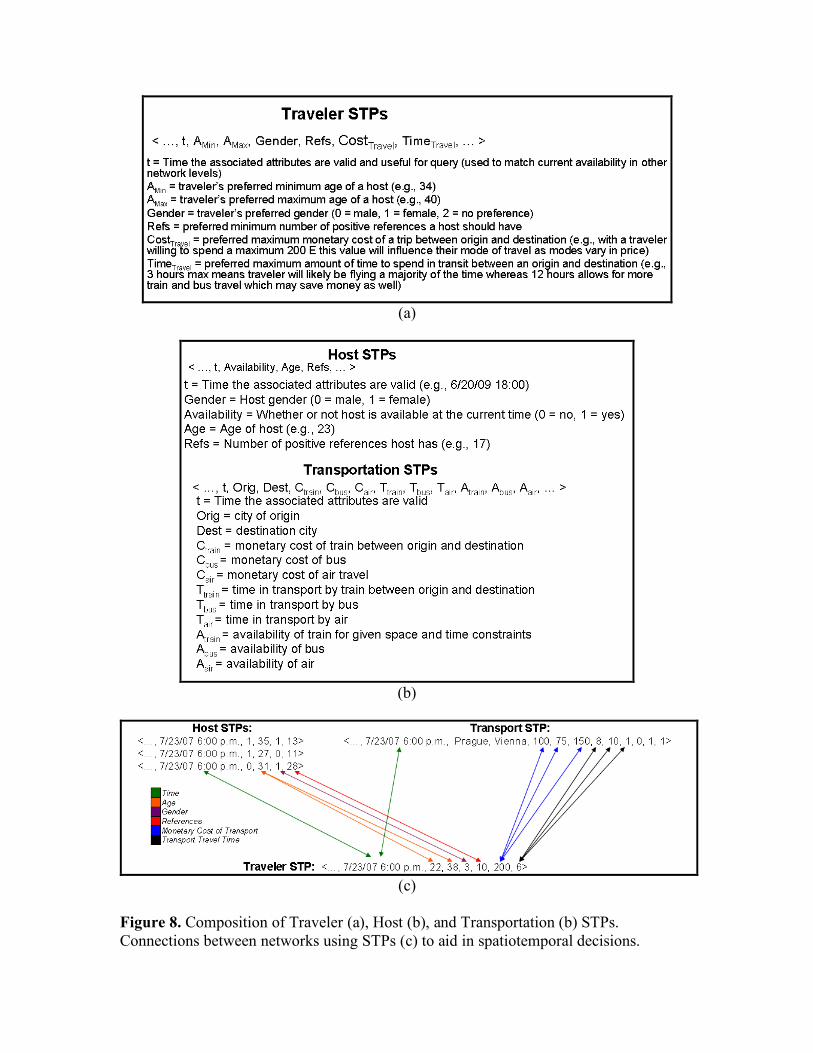
capabilities of a dynamic GIS being able to use different time scales and in this scenario can result in even more widely varied answers than on an hourly basis. [Table 2 here] [Figure 5 here] [Figure 6 here] [Figure 7 here] Networks can be represented by varying sizes and distributions of STPs, data networks such as the internet contain larger collections of STPs, each with attributes of network availability and speed values. With a social network, STPs comprise a smaller collection of points with details of the host’s residence along with the traveler's home and current location. Transportation networks in this example are represented such that they show the connectedness of places with respect to time, price, and other costs. Integrating these independent systems (social, data, and transportation) together as they are represented with Space Time Points allows queries spanning multiple networks based on an individual’s spatiotemporal preferences. 5.3 Space Time Points and Networks This section discusses the representation of social and transportation networks in the Space Time Point architecture utilized in EDGIS. This can then be combined with user preferences to recommend travel decisions to be made taking all of the available information into account (Raubal et al. 2004). To be used for queries the social network is represented as STPs of the traveler and potential hosts. The transportation network is represented as a collection of travel times and monetary costs. The barriers for transit are formalized in their corresponding availability attribute depicting whether that mode of transit is currently active or inactive. Specifically, Figure 8 illustrates the STP form of traveler, host, and transportation STPs used in this scenario. Part (c) of Figure 8 presents a traveler in Prague looking for potential destinations. The arrows reveal how STPs representing social and transportation networks are utilized to make a decision. Presented here are potential STPs returned following a user query. The example shows how STP values are compared to satisfy the constraints between the multiple network levels. Explicit location coordinates are stored as latitude, longitude pairs in each STP. This example results in two hosts available in the social network and suggests an airplane flight that fits time and monetary cost preferences. [Figure 8 here] The relations between members may be represented as additional attributes as members of the network are also connected by a measure of link strength between 1 and 7. Continuing development of this representation on a mobile platform allows for travelers in the same current location to meet in addition to the guest and host connection described in the last paragraph. The queries for this case study examine each appropriate
STP and compare attribute values in order to make recommendations. For example, a traveler may have STP attributes corresponding to a preference for a host between 36 and 44 years of age. The suitable host STPs are then refined by checking if their age attribute falls within this range. This query process is continued for all social and transportation network preferences to produce fitting results. 6. Discussion The presented case studies demonstrate the extended capabilities possible when working with spatiotemporal data in a dynamic GIS. In contrast to static GIS, which have largely ignored temporal aspects, it is now possible to explicitly account for the impact of current spatial and temporal data on the outcome of a decision-making process. This leads to more accurate and up-to-date information concerning time-critical tasks, such as evacuating from a dangerous area. In a wildland-urban interface, making use of measures of fire intensity and temperature as variables creates time-specific internal variation of wildfire objects. Using such information along with fire boundaries aids in making smarter decisions as more details of the scenario are available to the analyst. This further information about the geographical phenomenon changes the calculation of the evacuation trigger buffers and when used properly the additional knowledge of fire behavior will help save people’s lives. Therefore, having a dynamic GIS based on these concepts of the STP, Feature, and Theme is able to handle the large amount of information from such a quickly changing scenario as a wildfire near an urban area.
Having more data, able to be updated in a rapid fashion, allows individuals to make travel decisions that better suit their current needs. These choices can be made mid-trip and the use of a dynamic GIS further allows satisfaction even with these potential itinerary changes. EDGIS is capable of handling this wealth of spatiotemporal information in order to connect two or more parties in a highly mobile environment. In addition, such connections can be represented on different network levels, therefore allowing for analysis of critical interactions, such as when a bottleneck in one network impacts parts of other networks. This research also demonstrates a need for more detailed data collection, particularly in the wildfire evacuation scenario. Potentially, geosensor networks (Stefanidis & Nittel 2005) inside fires can be used to collect more about the internal variation of fire intensity and flame length. Also the availability of more extensive and finer temporal granularity for satellite data will yield more detailed results. 7. Conclusions and Future Work This research portrayed example applications of the dynamic GIS known as EDGIS. The first case study presented wildfire evacuation trigger buffers to demonstrate the availability and utility of dynamic GIS scenarios. Trigger buffer polygons were created from remotely sensed wildfire behavior in order to provide critical moments when communities should be evacuated. The use of more advanced trigger buffer calculations, e.g., utilizing topography and weather data, is to be done in the future but as shown earlier the EDGIS environment serves as an ample tool for storing, visualizing, and querying the data. Now expanding to more types of hazard scenarios such as
hurricanes, earthquakes, and tornados is also more straightforward having researched possibilities with the wildland-urban interface. The second case study integrated multiple network levels to help in making travel decisions. This amalgamation of social, data, and transportation networks along with VGI has been discussed but expansion to other networks is possible, e.g., water networks or biological networks. This case study presented a different side of potential utility for EDGIS, especially when used in combination with mobile devices. Working with these highly dynamic travel scenarios presents possibilities of personalized travel attainable with a dynamic GIS available on a mobile device. Having EDGIS on a mobile device provides better accessibility for the user. Future studies will investigate the utility of a dynamic GIS on a device such as a mobile phone that has a worldwide area of network coverage. This paper presented studies of some real world use cases to address the research questions concerning a dynamic GIS in a natural disaster scenario in addition to a separate spatiotemporal decision-making travel scenario. Dynamic data possibilities were shown such as representing a geographic object’s internal variation through time and an individual’s changing travel preferences. After further development, the EDGIS project can be submitted as an OSgeo5 project as it is an inexpensive tool for working with temporal geographic information. The work discussed points regarding data collection, accessibility, visualization, and the ability to answer questions in a dynamic GIS environment. These specific case studies were presented but more are still yet to be found and discussed. While the STP approach does not answer all dynamic GIS possibilities, it has been demonstrated to be useful in a variety of real-world use cases. Acknowledgements Thanks to the anonymous reviewers for their excellent comments. Thank you to Michael P. Toomey and the VIPER lab at UCSB for remote sensing and fire information. 8. References Albrecht J 1996 Geographic objects, and how to avoid them. In Burrough P A and Frank A U (eds) Geographic objects with indeterminate boundaries. London, Taylor & Francis: 325-31 Albrecht J 2007 Dynamic GIS. In Wilson J P and Fotheringham A S (eds) Handbook of
Geographic Information Science. Oxford, Blackwell: 436-46 Cova T J and Goodchild M F 2002 Extending geographical representation to include
fields of spatial objects. International Journal of Geographic Information Science 16: 509-32
Cova T J, Dennison P E, Kim T H, and Moritz M A 2005 Setting wildfire evacuation
trigger-points using fire spread modeling and GIS. Transactions in GIS 9: 603-17 5 http://www.osgeo.org/
Dennison P E, Cova T J, and Moritz M A 2007 WUIVAC: A wildland urban interface
evacuation model applied in strategic wildfire scenarios. Natural Hazards 41: 181-99
FEMA Federal Emergency Management Agency 2000 HURREVAC and Inland Winds:
Documentation and User’s Manual Version 1.0. Washington, D.C. Frank A U, Campari I, and Formentini U (eds) 1992 Theories and Methods of Spatio-
temporal Reasoning in Geographic Space. Berlin, Springer Lecture Notes in Computer Science
Goodchild M 2007 Citizens as sensors: The world of volunteered geography. GeoJournal
69: 211-21
Golledge R and Stimson R 1997 Spatial Behavior: A Geographic Perspective. New York, Guilford Press
Huibo L, Wen T, and Simpson D 2004 Behavior based motion simulation for fire evacuation procedures. In Theory and Practice of Computer Graphics 2004, Bournemouth, UK: 112-18
Janelle D 2004 Impact of Information Technologies. In Hanson S and Giuliano G (eds) The Geography of Urban Transportation. 3rd edition. New York, Guilford Press
Kim T H, Cova T J, and Brunelle A 2006 Exploratory map animation for post-event analysis of wildfire protective action recommendations. Natural Hazards Review 7: 1-11
Korhonen T, Hostikka S, Heliöyaara S, and Ehtamo H 2008 FDS+Evac: An Agent Based Fire Evacuation Model. In Proceedings of the 4th International Conference on Pedestrian and Evacuation Dynamics, Wuppertal, Germany
Langran G 1992 Time in Geographic Information Systems. Bristol, PA, Taylor & Francis Miller H J 2005 What about people in geographic information science? In Fisher P and Unwin D (eds) Re-Presenting Geographic Information Systems. England, John Wiley & Sons: 215-42
Larsen J, Urry J, and Axhausen K 2006 Mobilities, Networks, Geographies. England, Ashgate
Molz J G 2007 Cosmopolitans on the Couch: Mobile Hospitality and the Internet. In Molz J G and Gibson S (eds) Mobilizing Hospitality: The Ethics of Social Relations in a Mobile World. Aldershot, Ashgate: 65-80 O’Sullivan D 2005 Geographical information science: Time changes everything.
Progress in Human Geography 29: 749-56
Peuquet D J 2001 Making space for time: Issues in space-time data representation.
Geoinformatica 5: 11-32 Pultar E, Raubal M, and Goodchild M 2008 GEDMWA: Geospatial Exploratory Data Mining Web Agent. In Proceedings of the 16th ACM SIGSPATIAL International Conference on Advances in Geographic Information Systems (ACM GIS 2008), Irvine, California: 499-502
Pultar E and Raubal M forthcoming 2009 Progressive Tourism: Integrating Social, Transportation, and Data Networks. In Sharda N (ed) Tourism Informatics: Visual Travel Recommender Systems, Social Communities and User Interface Design. Pennsylvania, IGI Global
Pultar E, Cova T J, Yuan M, and Goodchild M F forthcoming 2009 EDGIS: A Dynamic
GIS Based on Space Time Points. International Journal of Geographical Information Science
Raubal M, Miller H, and Bridwell S 2004 User-Centred Time Geography For Location- Based Services. Geografiska Annaler B 86: 245-65 Reitsma F and Albrecht J 2005 Implementing a new data model for simulation processes. International Journal of Geographical Information Science 19: 1073-90 Stefanidis A and Nittel S (eds) 2005 GeoSensor Networks. Boca Raton, FL, CRC Press Stewart K and M. Yuan (eds) 2008 Understanding Dynamics in Geographic Domains. Boca Raton, FL, CRC Press Timmermans H, Arentze T, and Joh C H 2002 Analyzing space time behaviour: new approaches to old problems. Progress in Human Geography 26: 175-90 Wang D and Cheng T 2001 A spatio-temporal data model for activity-based transport demand modeling. International Journal of Geographical Information Science 15: 561-85 Worboys M 1994 A unified model for spatial and temporal information. Computer Journal 37: 26-34 Worboys M F and Duckham M 2005 GIS: a computing perspective. Boca Raton, FL: CRC Press Yuan M and McIntosh J 2002 A typology of spatiotemporal information queries. In Shaw
K, Ladner R, and Abdelguerfi M (eds) Mining Spatiotemporal Information Systems. Dordrecht, Kluwer Academic Publishers: 63–82

Yuan M and Stewart K 2008 Computation and Visualization for the Understanding of Dynamics in Geographic Domains: A Research Agenda. Boca Raton, FL, CRC Press

Temperature (in Kelvin) Color < = 315K Very Light gray > 315K and < = 330K Light Gray > 330K and < = 345K Gray > 345K Dark gray
Table 1. Fire temperature and corresponding color.
STP with network status Color Traveler’s current location Blue Barriers in both social and transportation networks
Red
Barrier in social network but not in transportation network
Left: yellow Right: red
Barrier in transportation network but not in social network
Left: red Right: yellow
No barriers in either network
Green
Table 2. STP, network, color combinations.
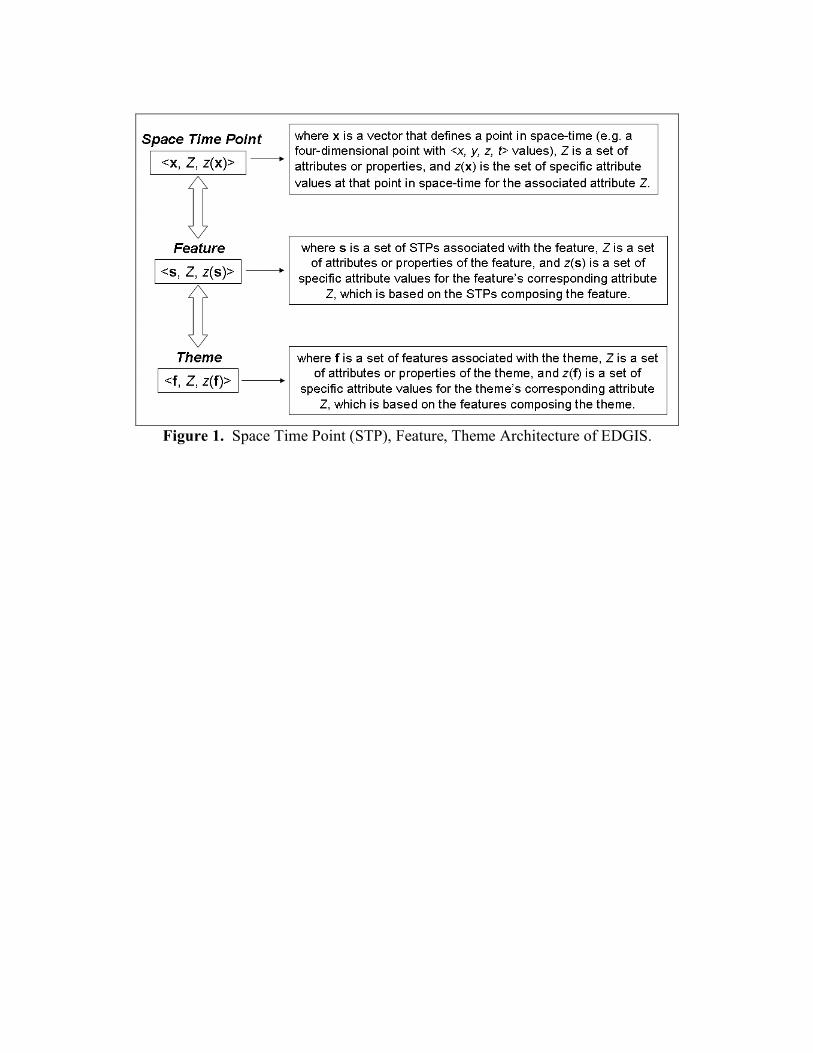
Figure 1. Space Time Point (STP), Feature, Theme Architecture of EDGIS.
//EDGIS Space Time Point Class package gised.datatypes; import java.awt.Point; import java.util.ArrayList; public class SpaceTimePoint extends Point { public ArrayList<Integer> attributes; public int timeStamp; public SpaceTimePoint(int incomingX,int incomingY, ArrayList<Integer> incomingAttribs, int incomingTimeStamp) { x = incomingX; y = incomingY; timeStamp = incomingTimeStamp; attributes = new ArrayList<Integer>(); attributes.addAll(incomingAttribs); } }
//EDGIS Feature Class package gised.datatypes; import java.util.ArrayList; import java.util.List; public class Feature { public String name; public List<SpaceTimePoint> STPs; public int id; public int associatedThemeID; public Feature(String incomingName, String incomingID, String incomingAssociatedThemeID, ArrayList<SpaceTimePoint> incomingSTPs) { name = incomingName; id = Integer.valueOf(incomingID).intValue(); associatedThemeID = Integer.valueOf(incomingAssociatedThemeID).intValue(); STPs = new ArrayList<SpaceTimePoint>(); STPs.addAll(incomingSTPs); } }
//EDGIS Theme Class package gised.datatypes; import java.util.List; import java.util.ArrayList; public class Theme { public String name; public List<Feature> features; public int id; public boolean active; public Theme(String incomingName, ArrayList<Feature> incomingFeatures, int incomingId, boolean incomingState) { name = incomingName; features = new ArrayList<Feature>(); features.addAll(incomingFeatures); id = incomingId; active = incomingState; } }
Figure 2. Technical descriptions of EDGIS classes in Java™.
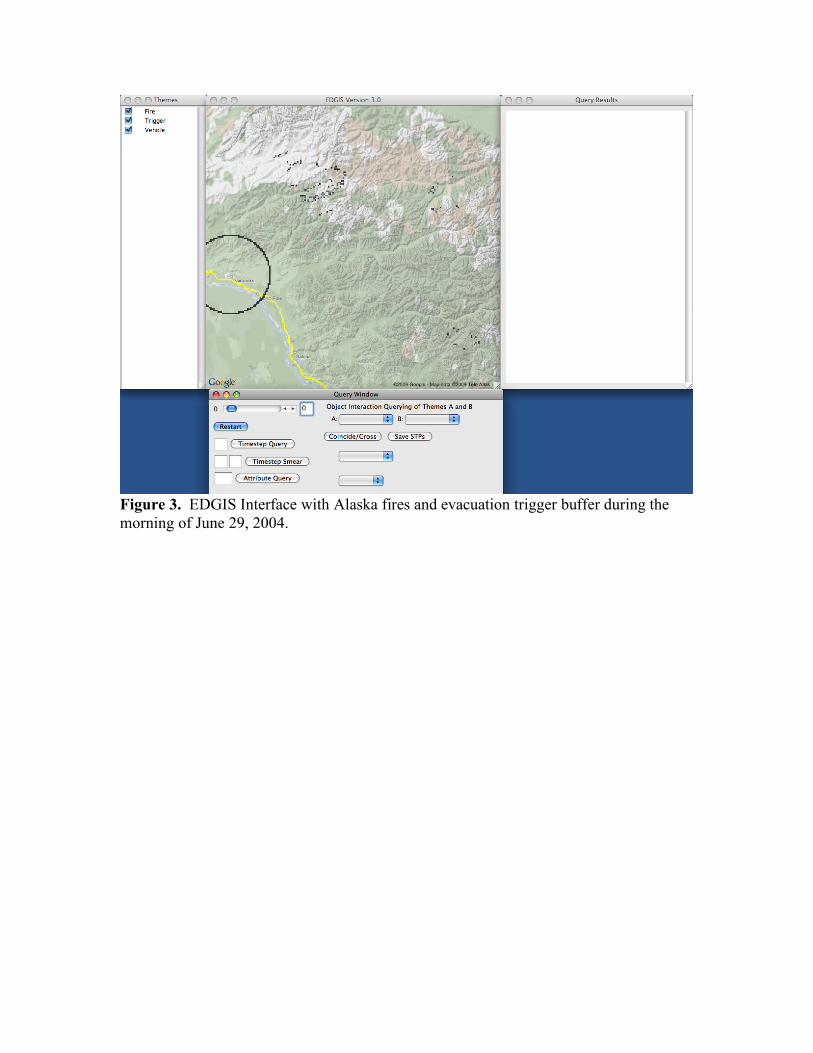
Figure 3. EDGIS Interface with Alaska fires and evacuation trigger buffer during the morning of June 29, 2004.
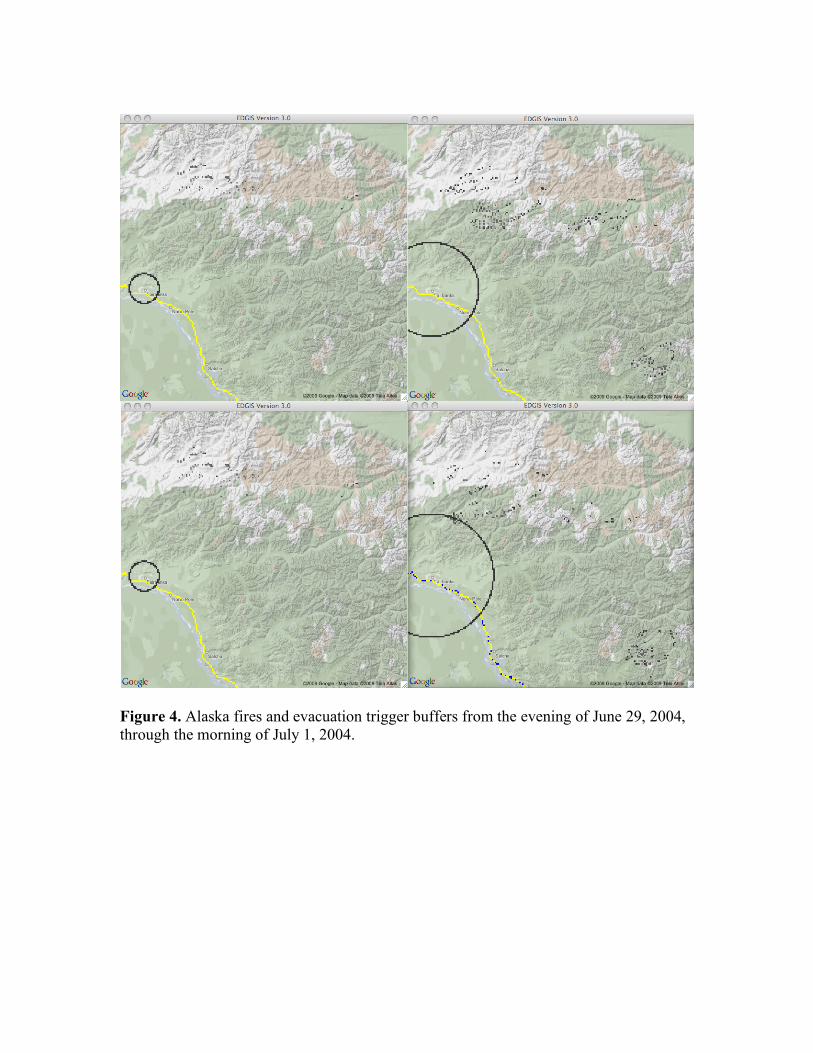
Figure 4. Alaska fires and evacuation trigger buffers from the evening of June 29, 2004, through the morning of July 1, 2004.
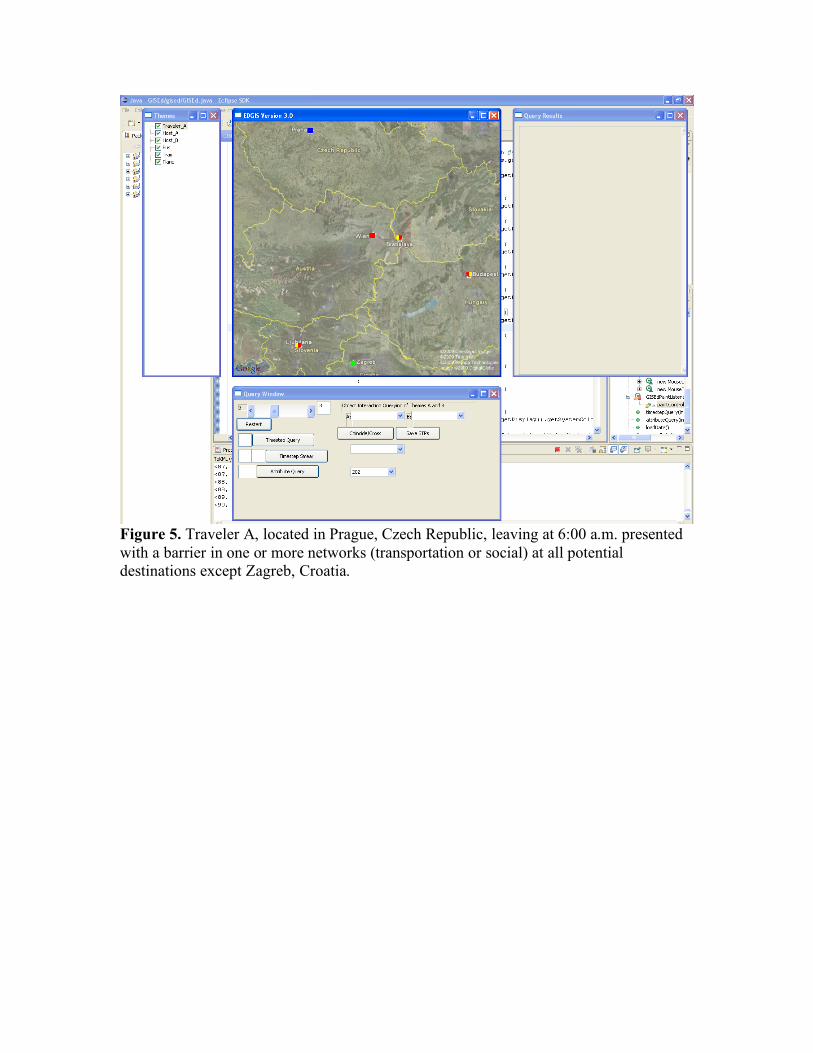
Figure 5. Traveler A, located in Prague, Czech Republic, leaving at 6:00 a.m. presented with a barrier in one or more networks (transportation or social) at all potential destinations except Zagreb, Croatia.
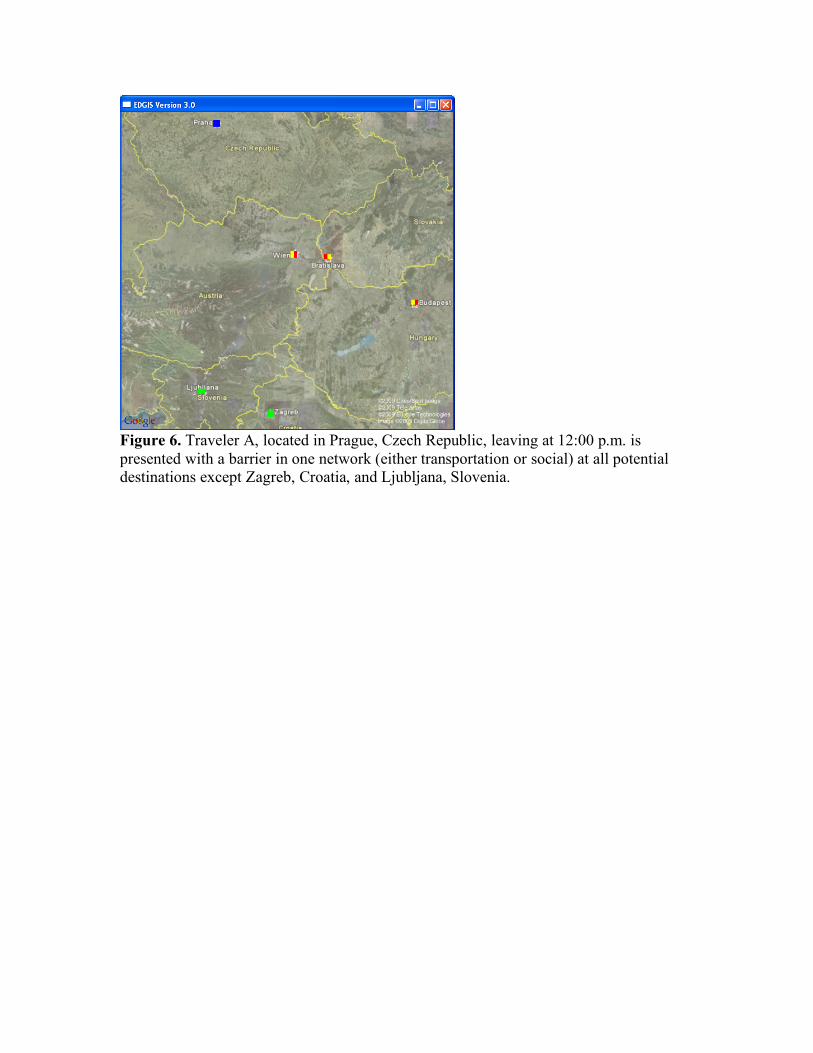
Figure 6. Traveler A, located in Prague, Czech Republic, leaving at 12:00 p.m. is presented with a barrier in one network (either transportation or social) at all potential destinations except Zagreb, Croatia, and Ljubljana, Slovenia.
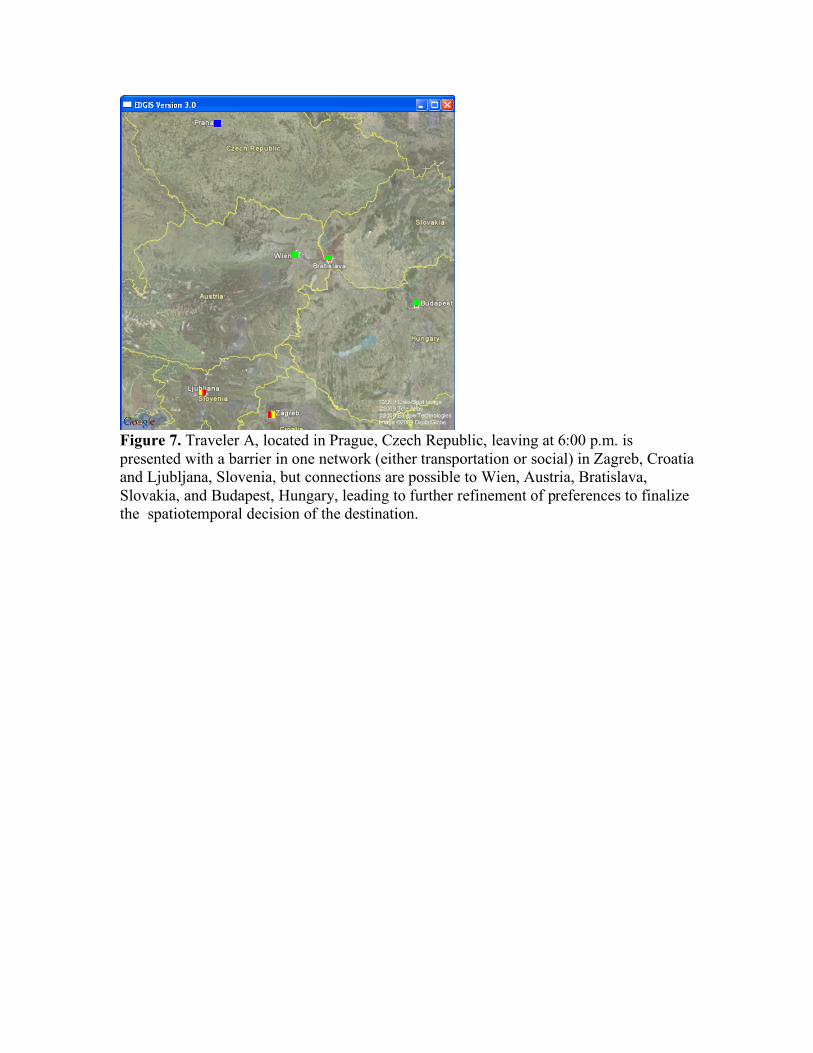
Figure 7. Traveler A, located in Prague, Czech Republic, leaving at 6:00 p.m. is presented with a barrier in one network (either transportation or social) in Zagreb, Croatia and Ljubljana, Slovenia, but connections are possible to Wien, Austria, Bratislava, Slovakia, and Budapest, Hungary, leading to further refinement of preferences to finalize the spatiotemporal decision of the destination.
(a)
(b)
(c)
Figure 8. Composition of Traveler (a), Host (b), and Transportation (b) STPs. Connections between networks using STPs (c) to aid in spatiotemporal decisions.

Table 1. Fire temperature and corresponding shade of grayscale. Table 2. STP, network, color combinations. Figure 1. Space Time Point (STP), Feature, Theme Architecture of EDGIS. Figure 2. Technical descriptions of EDGIS classes in Java™. Figure 3. EDGIS Interface with Alaska fires and evacuation trigger buffer during the morning of June 29, 2004. Figure 4. Alaska fires and evacuation trigger buffers from the evening of June 29, 2004, through the morning of July 1, 2004. Figure 5. Traveler A, located in Prague, Czech Republic, leaving at 6:00 a.m. presented with a barrier in one or more networks (transportation or social) at all potential destinations except Zagreb, Croatia. Figure 6. Traveler A, located in Prague, Czech Republic, leaving at 12:00 p.m. is presented with a barrier in one network (either transportation or social) at all potential destinations except Zagreb, Croatia, and Ljubljana, Slovenia. Figure 7. Traveler A, located in Prague, Czech Republic, leaving at 6:00 p.m. is presented with a barrier in one network (either transportation or social) in Zagreb, Croatia and Ljubljana, Slovenia, but connections are possible to Wien, Austria, Bratislava, Slovakia, and Budapest, Hungary, leading to further refinement of preferences to finalize the spatiotemporal decision of the destination. Figure 8. Composition of Traveler (a), Host (b), and Transportation (b) STPs. Part (c) shows connections between networks using STPs to aid in spatiotemporal decisions.