Embed Size (px)
Citation preview
Ž .Earth and Planetary Science Letters 144 1996 53–74
Dynamics of mantle flow and melting at a ridge-centered hotspot:Iceland and the Mid-Atlantic Ridge
Garrett Ito a,), Jian Lin b,1, Carl W. Gable c,2
a MITrWHOI Joint Program, Department of Geology and Geophysics, Woods Hole Oceanographic Institution, Woods Hole, MA 02543,USA
b Department of Geology and Geophysics, Woods Hole Oceanographic Institution, Woods Hole, MA 02543, USAc Earth and EnÕironmental Sciences, Los Alamos National Laboratories, Los Alamos, NM 87545, USA
Received 24 April 1996; accepted 29 July 1996
Abstract
The dynamics of mantle flow and melting of a ridge-centered plume were investigated with three-dimensionalvariable-viscosity numerical models, focusing on three buoyancy sources: temperature, melt depletion, and melt retention.The width, W, to which a plume spreads along a ridge axis, depends on plume volume flux, Q, full spreading rate, U,buoyancy number, B, and ambientrplume viscosity contrast g . When all melting effects are considered, our numerical
Ž .1r2Ž .0.04results are best parameterized by Ws2.37 QrU Bg . Thermal buoyancy is first-order in controlling along-axisplume spreading while latent heat loss due to melting, and depletion and retention buoyancy forces contribute second-order
Ž .effects. We propose two end-member models for the Iceland plume beneath the Mid-Atlantic Ridge MAR . The first has abroad plume source with temperature anomaly DT of 758C, radius, a, of 300 km, and Q of 1.2=107 km3rmy. The secondp
is of a narrower and hotter plume source with DT of 1708C, a radius of 60 km, and Q of 2.1=106 km3rmy. The broadp
plume source predicts successfully the observed seismic crustal thickness, topographic, and gravity anomalies along theMAR, but predicts an along-axis geochemical plume width substantially broader than that suggested by the observed87Srr 86Sr anomaly. The narrow plume source model predicts successfully the total excess crustal production rate along the
Ž 5 3 . 87 86MAR 2.5=10 km rmy and a geochemical width consistent with that of the Srr Sr anomaly, but it requiressubstantial along-axis melt transport to explain the observed along-axis variations in crustal thickness, bathymetry, andgravity. Calculations suggest that lateral plume dispersion may be radially symmetric rather than channelled along the ridgeaxis and that the topographic swell, which is elongated along the Reykjanes Ridge, may be due to rapid off-axis subsidenceassociated with lithospheric cooling superimposed on a broader hotspot swell. The two plume source models predict seismicP-wave velocity reductions of 0.5–2% in the center of the plume, producing travel time delays of 0.2–1.2 s. PredictedP-wave delay times for the narrow plume source model are more consistent with recent seismic observations beneathIceland, suggesting that this model may be more representative of the Iceland plume.
Keywords: Iceland; Mid-Atlantic Ridge; melting; hot spots; mantle plumes
) Corresponding author. Fax: q1 508 457 2187. E-mail: [email protected] Tel: q1 508 289 2576. Fax: q1 508 457 2187. E-mail: [email protected] Tel: q1 505 665 3533. E-mail: [email protected].
0012-821Xr96r$12.00 Copyright q 1996 Elsevier Science B.V. All rights reserved.Ž .PII S0012-821X 96 00151-3
( )G. Ito et al.rEarth and Planetary Science Letters 144 1996 53–7454
1. Introduction
Ž .Centered on the Mid-Atlantic Ridge MAR , theIceland hotspot is the largest melt anomaly through-out the world’s mid-ocean ridge system and is among
w xthe large oceanic igneous provinces 1 . The idea thatIceland marks a mantle convection plume risingbeneath the MAR has become well established since
Ž w x.its original conception in the early 1970s e.g. 2–4 .Ž .The broad topographic swell Fig. 1 and correlated
along-spreading-axis geochemical anomalies indicatethat the plume rises beneath Iceland and spreads
w xlaterally along the ridge axis 4,5 . Such along-axisspreading of a mantle plume feeding a ridge axismay also explain topographic and geochemicalanomalies affected by other near ridge-axis hotspotsŽ w x.e.g. 6–8 , many of which may have contributedsubstantially to the earth’s heat and magmatic budgetthroughout geologic history.
While the original concept that plumes feed andspread along nearby ridges was proposed two decadesago, only recently have the fluid dynamic aspectsbeen investigated quantitatively. Recent numericaland laboratory tank experiments have shown that thewidth, W, over which a plume spreads along axis,increases with plume volume flux, Q, and decreases
w xwith plate full-spreading rate, U 9–11 . Such studiesare important in revealing the pertinent physicalprocesses governing plume–ridge interactions and inplacing theoretical constraints on properties of man-tle plumes such as temperature anomaly, size andvolume flux.
Two potentially important sources of buoyancy,however, have not been considered in previousplume–ridge studies. These are melt depletion, whichlowers the FerMg ratio in the residual mantle and
w xthus reduces its density 12 , and melt retention inthe mantle, which also reduces mantle bulk densityŽ w x.e.g. 13–15 . It has been proposed that melt deple-tion may be primary in driving spreading of in-
w xtraplate plumes beneath the lithosphere 16 . It hasalso been proposed that both melt retention buoy-ancy and depletion buoyancy may contribute signifi-cantly to along-axis variations in mantle flow andcrustal thickness beneath normal mid-ocean ridgesw x17,18 .
The objectives of this study were two-fold. First,we investigated numerically the effects of thermal
and melting related buoyancy forces on along-axisspreading of ridge-centered plumes. We used three-
Ž .dimensional 3D , variable viscosity, numerical mod-els to simulate a buoyant plume rising beneathspreading plates and systematically test the effects ofthermal, melt depletion, and melt retention buoyancyforces. Our second objective was to constrain thetemperature anomaly, dimension, and volume flux ofthe Iceland plume by comparing theoretical predic-tions with observed variations in seismic crustalthickness, topography, gravity, and geochemistry onIceland and along the Mid-Atlantic Ridge. We pro-pose two end-member models for the mantle plumesource beneath Iceland to explain the observations,and discuss their implications on basalt geochem-istry, melt migration, and seismic velocity variationsalong the Mid-Atlantic Ridge axis.
2. Governing equations
To model mantle flow of a plume–ridge systemin the upper mantle, we treat the mantle as a fluid ofzero Reynolds number and infinite Prandtl number.The 3D stress tensor, t , is defined according to:
ts2h T , p eypI 1Ž . Ž .˙R
where I is the identity matrix and h is viscosity,which depends on real temperature T and hydro-R
static pressure p. The strain rate tensor e depends on˙spatial derivatives of mantle flow rate u according to
Ž .e s1r2 u qu . The equilibrium equations in-˙ i,j j,i
clude conservation of mass:
= Ø us0 2Ž .momentum:
= Ø tsyDr T , X ,f gz 3Ž . Ž .ˆ
and energy:
E T TDS2 ˙sk= Tyu Ø = Ty M 4Ž .
E t cp
Ž . Ž .see Table 1 for definition of variables . Eq. 2satisfies the Boussinesq approximation and neglectsdilational flow due to the extraction of melt, which is
w x Ž .likely to be small 19 . Eq. 3 balances viscousstresses with the body force due to density varia-
( )G. Ito et al.rEarth and Planetary Science Letters 144 1996 53–74 55
ŽFig. 1. Combined shipboard and Etopo5 bathymetry map contour. Ž .interval of 0.5 km showing Iceland 658N, 188W and the Reyk-
Ž . Ž .janes south of Iceland and Kolbeinsey north of Iceland ridges.Bold lines mark the ridge axes. This figure and Fig. 4, Fig. 7, Fig.8 and Fig. 10, were produced using the GMT software packagew x48 .
tions, which depend on potential temperature T , meltdepletion X, and mantle porosity f, according to:
r yro mDrsyr aTqb Xq f 5Ž .o ž /ro
Ž .Eq. 4 balances energy transfer associated withheat conduction, heat advection, and latent heat lossdue to melting. Melt depletion is governed by:
E X˙syu Ø = XqM 6Ž .
E t˙ Ž Ž .. Ž .where M is melt fraction and Ms E M p,T r E t .
To estimate the distribution of porosity f, weassume that melt migrates vertically through the
Ž .mantle at a melt–mantle velocity contrast vyw asgoverned by Darcy’s flow law:
r yr gKŽ .o mf vyw s 7Ž . Ž .
hm
Permeability K depends on grain size b accordingŽ 2 2 . Ž .to Ks b f r 72p . Finally, the rate of melt per-
colation is assumed to be equivalent to the rate atwhich melt is generated such that:
zro ˙f z v z s Md z 8Ž . Ž . Ž .Hr Dm
3. Numerical method and boundary conditions
To solve the above equations, we use a Cartesianw xnumerical code presented by Gable 20,21 . Time
integration is achieved by iterating through discretetime steps, during each of which we solve for mantleflow, mantle potential temperature, and melt deple-tion. In solving the dimensionless forms of the flow
Ž Ž . Ž . Ž . Ž ..equations Eq. 1 Eq. 2 Eq. 3 Eq. 4 , horizontalderivatives are expressed in terms of their Fouriercomponents while vertical derivatives are expressedas finite difference approximations. We then invertfor horizontal and vertical components of velocitiesand stresses using a standard relaxation method.
Ž .The dimensionless form of Eq. 3 is:
r gD3 r yro o mX X= Ø t s aT T qb Xq f 9Ž .ož /kh ro o
where primes denote dimensionless variables. TheŽ Ž ..body force right hand side of Eq. 9 is the sum of
three terms: the first term, which scales with T X, is aRayleigh number:
r gD3o
Ras aTokho
the second term, which scales with X, is a meltdepletion Rayleigh number:
r gD3o
Ra s bXkho
and the third term, which scales with f, is a meltretention Rayleigh number:
r gD3 r yro o mRa sf ž /kh ro o
Ž .Assumed values for b and r yr rr are 0.06o m ow x w x12,16 and 0.121 14,18 , respectively. Conse-
( )G. Ito et al.rEarth and Planetary Science Letters 144 1996 53–7456
quently, depleting the mantle by 25% yields a den-sity reduction equivalent to heating the mantle by4408C, while a melt porosity of 3% yields a densityreduction equivalent to heating the mantle by 1078C.
We assume that mantle viscosity varies with realtemperature, T , and pressure according to:R
EqpV Eqr g 0.5D VŽ .ohsh exp y 10Ž .o ½ 5RT RTR R o
where reference viscosity h is defined as the mantleo
viscosity for TsT and zs0.5D; T in Kelvin iso RŽ .Tq0.6 zq273 , where the term 0.6 z takes intoaccount the adiabatic gradient; and T is the realR o
temperature value of T . To approximate numericallyo
the effects of non-Newtonian rheology, we use re-duced values of activation energy E and activation
w x Ž .volume V 22 Table 1 . Because lateral variationsin viscosity introduce nonlinearity to the above flow
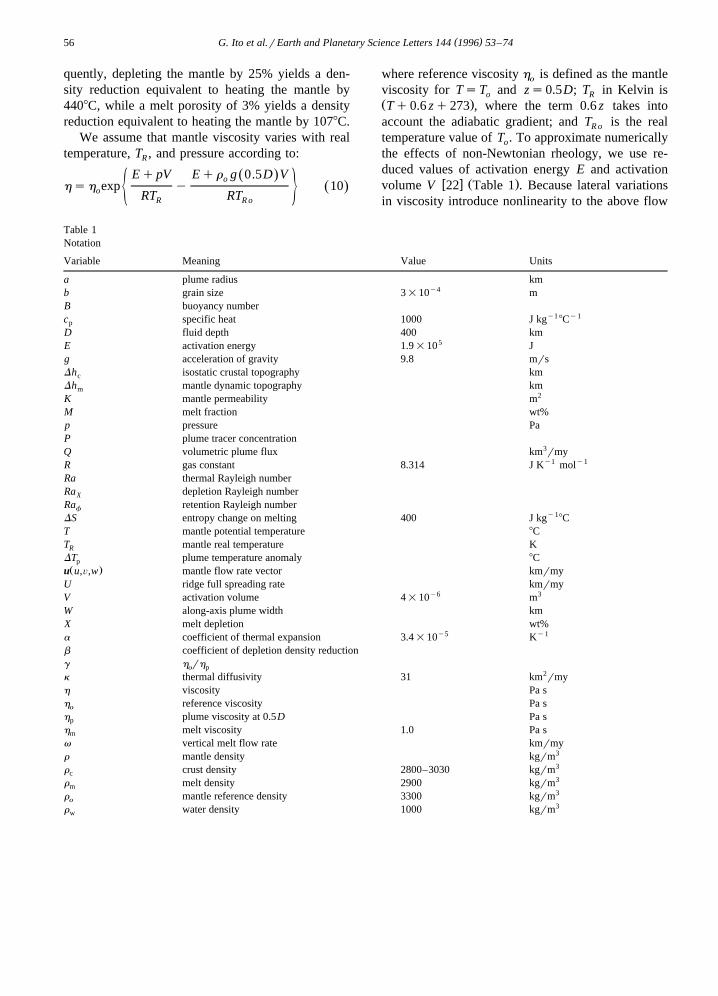
Table 1Notation
Variable Meaning Value Units
a plume radius kmy4b grain size 3=10 m
B buoyancy numbery1 y1c specific heat 1000 J kg 8Cp
D fluid depth 400 km5E activation energy 1.9=10 J
g acceleration of gravity 9.8 mrsDh isostatic crustal topography kmc
Dh mantle dynamic topography kmm2K mantle permeability m
M melt fraction wt%p pressure PaP plume tracer concentration
3Q volumetric plume flux km rmyy1 y1R gas constant 8.314 J K mol
Ra thermal Rayleigh numberRa depletion Rayleigh numberX
Ra retention Rayleigh numberfy1DS entropy change on melting 400 J kg 8C
T mantle potential temperature 8CT mantle real temperature KR
DT plume temperature anomaly 8CpŽ .u u,Õ,w mantle flow rate vector kmrmy
U ridge full spreading rate kmrmyy6 3V activation volume 4=10 m
W along-axis plume width kmX melt depletion wt%
y5 y1a coefficient of thermal expansion 3.4=10 Kb coefficient of depletion density reductiong h rho p
2k thermal diffusivity 31 km rmyh viscosity Pa sh reference viscosity Pa so
h plume viscosity at 0.5D Pa sp
h melt viscosity 1.0 Pa sm
v vertical melt flow rate kmrmy3r mantle density kgrm3r crust density 2800–3030 kgrmc3r melt density 2900 kgrmm3r mantle reference density 3300 kgrmo3r water density 1000 kgrmw
( )G. Ito et al.rEarth and Planetary Science Letters 144 1996 53–74 57
equations, we linearized the equations by introducingw xadditional body force terms 20,23 . The nonlinear
terms and solutions were then updated upon succes-sive iterations until solutions converged to our speci-fied limit. We found that a convergence criterion of0.1–0.5% yielded time-integrated solutions with er-rors of -0.5% while minimizing computing time.This computational method was tested in 2D withindependent finite element solutions, while in 3D itproduced solutions within 2.6% of the best-estimatedextrapolated solutions of a benchmark problem ofw x24 .
The final velocity field is then used in the advec-Ž .tion term in Eq. 4 to solve for a new temperature
field. Our energy solver uses finite differences with atensor diffusion scheme to reduce numerical diffu-sion, which is intrinsic to finite difference methodsw x20,21 . The same tensor diffusion method is used to
Ž .solve Eq. 6 for the depletion field. Vertical flow
determines the rate of decompression melting, com-Ž . Ž .prising the source terms in Eq. 4 and Eq. 6 . The
Ž .melting rate term in Eq. 4 is latent heat loss, whichinhibits buoyant mantle flow by increasing bothmantle density and viscosity, while the melting rate
Ž .term in Eq. 6 generates low density depleted man-˙tle residuum. To calculate melting rate M, we incor-
porate the solidus and liquidus functions of McKen-w xzie and Bickle 25 , as well as their functional depen-
dence of M on homologous temperature for adia-batic batch melting.
The rate of melting also determines the volumefraction of melt retained in the mantle, f, which isthe source of retention buoyancy. To compute poros-
Ž . Ž .ity we combine Eq. 7 and Eq. 8 and solve theŽ . w xintegral in Eq. 8 numerically similar to 18 . The
grain size dependent melt permeability that we incor-porate results in maximum porosities of 1–3%, whichis slightly higher than the 0.1–1% porosity range
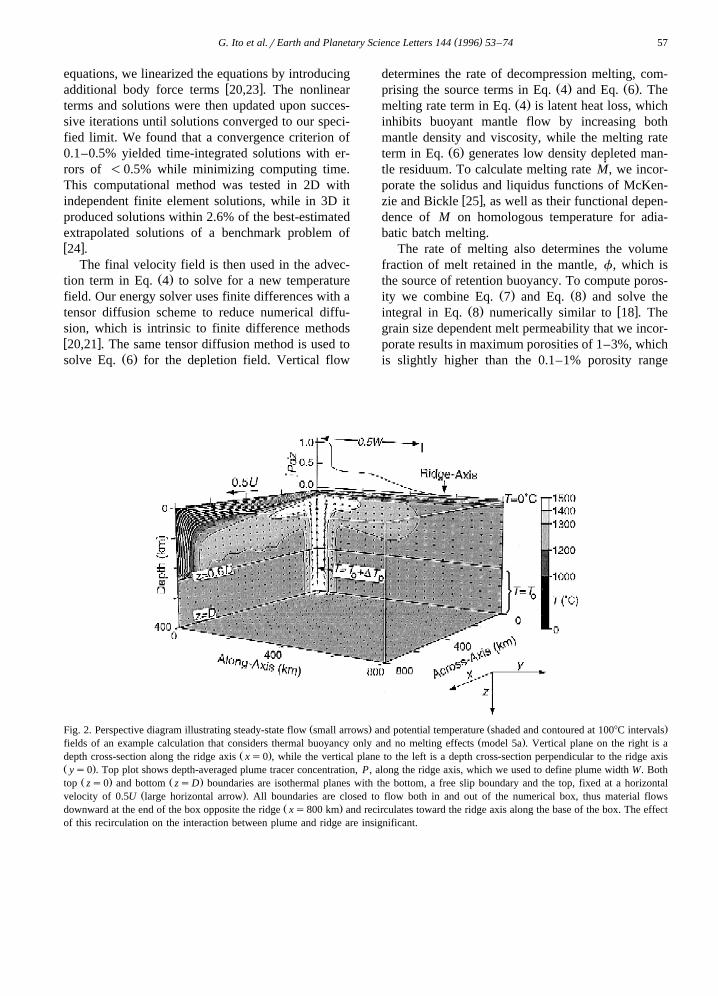
Ž . Ž .Fig. 2. Perspective diagram illustrating steady-state flow small arrows and potential temperature shaded and contoured at 1008C intervalsŽ .fields of an example calculation that considers thermal buoyancy only and no melting effects model 5a . Vertical plane on the right is a
Ž .depth cross-section along the ridge axis xs0 , while the vertical plane to the left is a depth cross-section perpendicular to the ridge axisŽ .ys0 . Top plot shows depth-averaged plume tracer concentration, P, along the ridge axis, which we used to define plume width W. Both
Ž . Ž .top zs0 and bottom zsD boundaries are isothermal planes with the bottom, a free slip boundary and the top, fixed at a horizontalŽ .velocity of 0.5U large horizontal arrow . All boundaries are closed to flow both in and out of the numerical box, thus material flows
Ž .downward at the end of the box opposite the ridge xs800 km and recirculates toward the ridge axis along the base of the box. The effectof this recirculation on the interaction between plume and ridge are insignificant.
( )G. Ito et al.rEarth and Planetary Science Letters 144 1996 53–7458
Tab
le2
Para
met
ers
and
resu
ltsof
expe
rim
enta
lse
tsy
1r
2Ž
.M
odel
Gri
dsi
zed
xy
dy
UD
TB
gQ
WW
Qr
Up
63
Ž.
Ž.
Ž.
kmkm
rm
y10
kmr
my
Set
A:
ther
mal
buoy
ancy
wit
hout
late
nthe
atlo
ss1a
12.5
–12
.520
100
1.72
92.
352
0.97
451
22.
322
2a12
.5–
6.25
120
100
0.05
222.
352
1.05
921
92.
328
3a12
.5–
6.25
6010
00.
195
2.35
20.
987
281
2.19
34a
12.5
–6.
2540
100
0.46
02.
352
1.03
836
22.
251
5a12
.5–
12.5
2020
06.
977
5.05
41.
965
938
2.99
16a
12.5
–6.
2512
020
00.
244
5.05
42.
478
331
2.30
57a
12.5
–6.
2560
200
0.74
65.
054
1.89
241
92.
358
8a12
.5–
12.5
5020
01.
468
5.05
42.
585
662
2.91
4Ic
e1a
12.5
–12
.519
7536
.553
1.84
912
.39
2312
2.86
4Ic
e2a
10.0
–10
.019
170
14.8
663.
757
2.18
683
02.
447
Set
B:
ther
mal
buoy
ancy
wit
hla
tent
heat
loss
1b12
.5–
12.5
2010
01.
720
2.35
20.
969
488
2.21
52b
12.5
–6.
2512
010
00.
0463
2.35
20.
939
206
2.33
13b
12.5
–6.
2560
100
0.16
62.
352
0.84
325
62.
162
4b12
.5–
12.5
4010
00.
389
2.35
20.
876
312
2.11
15b
12.5
–12
.520
200
7.00
15.
054
1.97
283
82.
667
6b12
.5–
6.25
120
200
0.20
35.
054
2.05
928
12.
147
7b12
.5–
6.25
6020
00.
750
5.05
41.
901
369
2.07
28b
12.5
–12
.550
200
1.19
35.
054
2.10
046
22.
257
Ice
1b12
.5–
12.5
1975
34.7
741.
849
11.7
922
122.
809
Ice
2b10
.0–
10.0
1917
014
.857
3.75
72.
185
710
2.09
4
( )G. Ito et al.rEarth and Planetary Science Letters 144 1996 53–74 59
Set
C:
ther
mal
qde
plet
ion
buoy
ancy
wit
hla
tent
heat
loss
1c12
.5–
12.5
2010
01.
427
2.35
20.
804
488
2.43
12c
12.5
–6.
2512
010
00.
0452
2.35
20.
917
206
2.36
03c
12.5
–6.
2560
100
0.16
42.
352
0.83
425
62.
173
4c12
.5–
12.5
4010
00.
385
2.35
20.
868
338
2.29
15c
12.5
–12
.520
200
6.78
85.
054
1.91
298
83.
194
6c12
.5–
6.25
120
200
0.18
85.
054
1.90
228
12.
234
7c12
.5–
6.25
6020
00.
724
5.05
41.
835
406
2.32
38c
12.5
–12
.550
200
1.15
95.
054
2.04
053
82.
661
Ice
1c12
.5–
12.5
1975
34.1
171.
849
11.5
622
882.
932
Ice
2c10
.0–
10.0
1917
014
.597
3.75
72.
147
830
2.46
9
Set
D:
ther
mal
qde
plet
ion
qre
tent
ion
buoy
ancy
wit
hla
tent
heat
loss
1d12
.5–
12.5
2010
01.
433
2.35
20.
808
488
2.42
62d
12.5
–6.
2512
010
00.
0452
2.35
20.
917
206
2.35
93d
12.5
–6.
2560
100
0.16
482.
352
0.83
625
62.
171
4d12
.5–
12.5
4010
00.
358
2.35
20.
868
338
2.29
25d
12.5
–12
.520
200
6.76
45.
054
1.90
591
32.
956
6d12
.5–
6.25
120
200
0.19
35.
054
1.96
128
12.
200
7d12
.5–
6.25
6020
00.
718
5.05
41.
820
419
2.40
48d
12.5
–12
.550
200
1.13
95.
054
2.00
556
32.
809
Ice
1d12
.5–
12.5
1975
34.0
891.
849
11.5
622
882.
933
Ice
2d10
.0–
10.0
1917
014
.501
3.75
72.
133
870
2.59
7
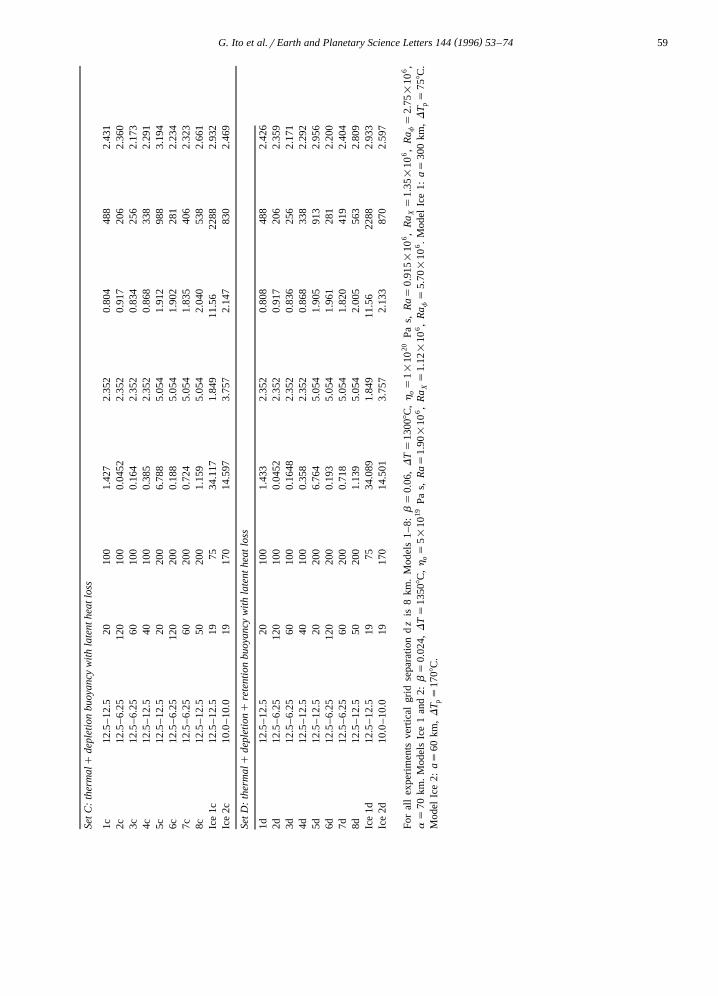
For
all
expe
rim
ents
vert
ical
grid
sepa
ratio
nd
zis
8km
.M
odel
s1
–8:
bs
0.06
,D
Ts
1300
8C,
hs
1=10
20Pa
s,R
as0.
915=
106,
Ra
s1.
35=
106,
Ra
s2.
75=
106,
oX
f
as
70km
.M
odel
sIc
e1
and
2:b
s0.
024,
DT
s13
508C
,h
s5=
1019
Pas,
Ras
1.90
=10
6,
Ra
s1.
12=
106,
Ra
s5.
70=
106.
Mod
elIc
e1:
as30
0km
,D
Ts
758C
.o
Xf
p
Mod
elIc
e2:
as60
km,
DT
s17
08C
.p
( )G. Ito et al.rEarth and Planetary Science Letters 144 1996 53–7460
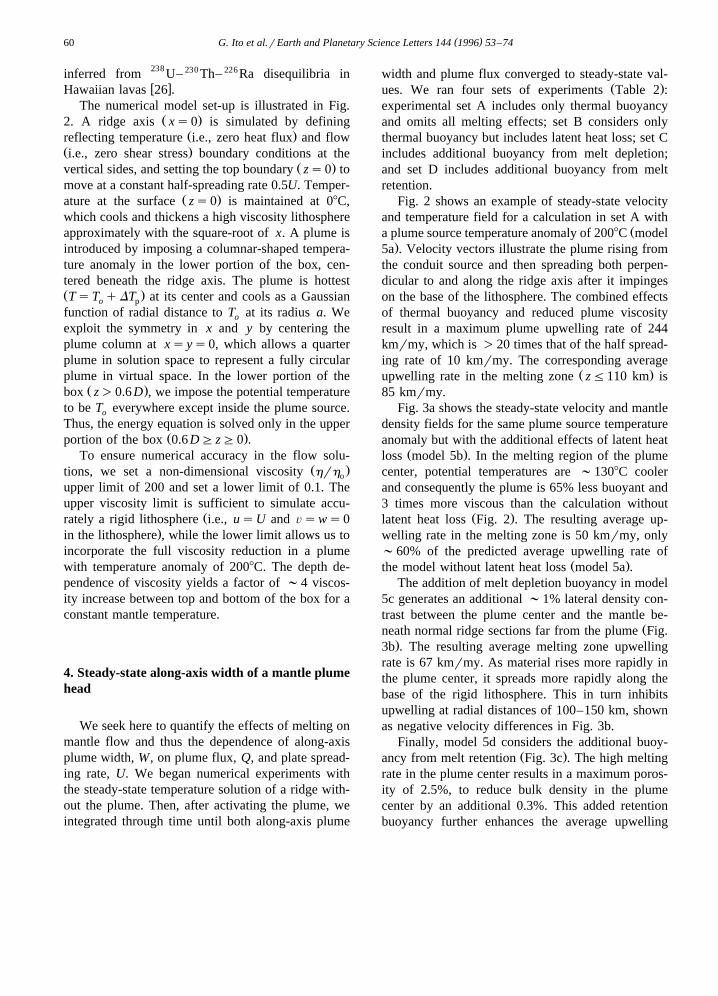
inferred from 238 U– 230 Th– 226Ra disequilibria inw xHawaiian lavas 26 .
The numerical model set-up is illustrated in Fig.Ž .2. A ridge axis xs0 is simulated by defining
Ž .reflecting temperature i.e., zero heat flux and flowŽ .i.e., zero shear stress boundary conditions at the
Ž .vertical sides, and setting the top boundary zs0 tomove at a constant half-spreading rate 0.5U. Temper-
Ž .ature at the surface zs0 is maintained at 08C,which cools and thickens a high viscosity lithosphereapproximately with the square-root of x. A plume isintroduced by imposing a columnar-shaped tempera-ture anomaly in the lower portion of the box, cen-tered beneath the ridge axis. The plume is hottestŽ .TsT qDT at its center and cools as a Gaussiano p
function of radial distance to T at its radius a. Weo
exploit the symmetry in x and y by centering theplume column at xsys0, which allows a quarterplume in solution space to represent a fully circularplume in virtual space. In the lower portion of the
Ž .box z)0.6 D , we impose the potential temperatureto be T everywhere except inside the plume source.o
Thus, the energy equation is solved only in the upperŽ .portion of the box 0.6 DGzG0 .
To ensure numerical accuracy in the flow solu-Ž .tions, we set a non-dimensional viscosity hrho
upper limit of 200 and set a lower limit of 0.1. Theupper viscosity limit is sufficient to simulate accu-
Žrately a rigid lithosphere i.e., usU and Õsws0.in the lithosphere , while the lower limit allows us to
incorporate the full viscosity reduction in a plumewith temperature anomaly of 2008C. The depth de-pendence of viscosity yields a factor of ;4 viscos-ity increase between top and bottom of the box for aconstant mantle temperature.
4. Steady-state along-axis width of a mantle plumehead
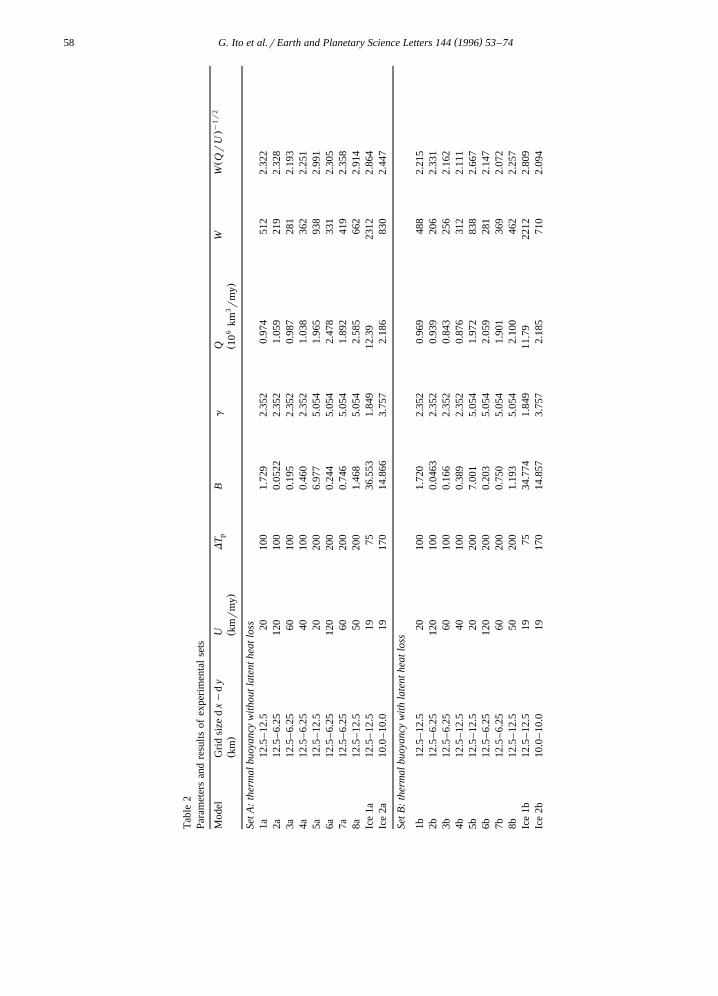
We seek here to quantify the effects of melting onmantle flow and thus the dependence of along-axisplume width, W, on plume flux, Q, and plate spread-ing rate, U. We began numerical experiments withthe steady-state temperature solution of a ridge with-out the plume. Then, after activating the plume, weintegrated through time until both along-axis plume
width and plume flux converged to steady-state val-Ž .ues. We ran four sets of experiments Table 2 :
experimental set A includes only thermal buoyancyand omits all melting effects; set B considers onlythermal buoyancy but includes latent heat loss; set Cincludes additional buoyancy from melt depletion;and set D includes additional buoyancy from meltretention.
Fig. 2 shows an example of steady-state velocityand temperature field for a calculation in set A with
Ža plume source temperature anomaly of 2008C model.5a . Velocity vectors illustrate the plume rising from
the conduit source and then spreading both perpen-dicular to and along the ridge axis after it impingeson the base of the lithosphere. The combined effectsof thermal buoyancy and reduced plume viscosityresult in a maximum plume upwelling rate of 244kmrmy, which is )20 times that of the half spread-ing rate of 10 kmrmy. The corresponding average
Ž .upwelling rate in the melting zone zF110 km is85 kmrmy.
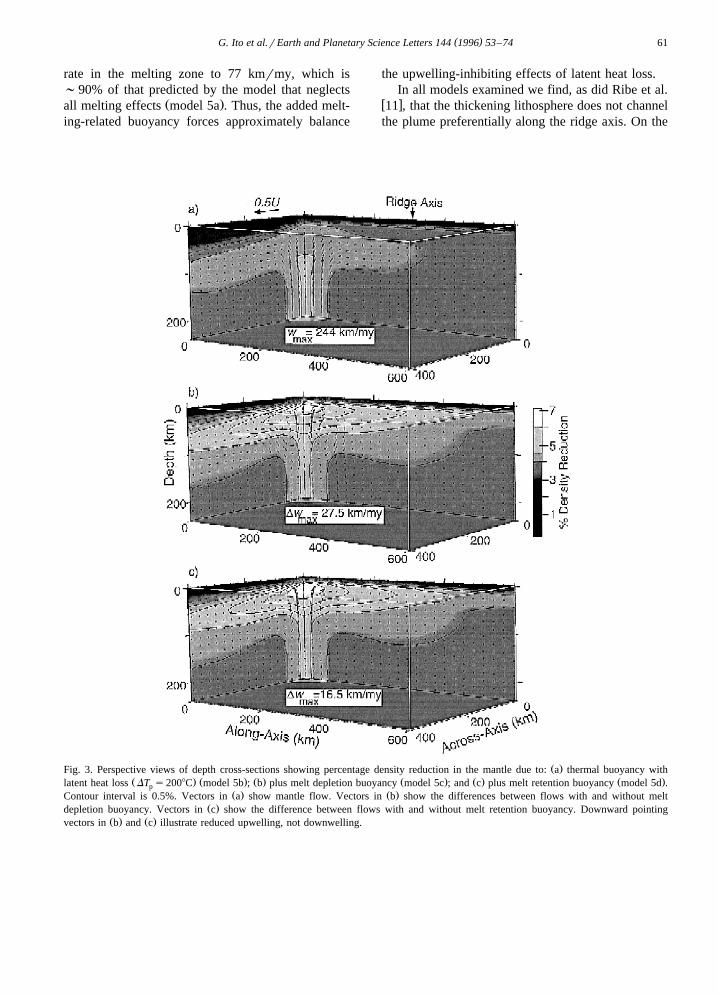
Fig. 3a shows the steady-state velocity and mantledensity fields for the same plume source temperatureanomaly but with the additional effects of latent heat
Ž .loss model 5b . In the melting region of the plumecenter, potential temperatures are ;1308C coolerand consequently the plume is 65% less buoyant and3 times more viscous than the calculation without
Ž .latent heat loss Fig. 2 . The resulting average up-welling rate in the melting zone is 50 kmrmy, only;60% of the predicted average upwelling rate of
Ž .the model without latent heat loss model 5a .The addition of melt depletion buoyancy in model
5c generates an additional ;1% lateral density con-trast between the plume center and the mantle be-
Žneath normal ridge sections far from the plume Fig..3b . The resulting average melting zone upwelling
rate is 67 kmrmy. As material rises more rapidly inthe plume center, it spreads more rapidly along thebase of the rigid lithosphere. This in turn inhibitsupwelling at radial distances of 100–150 km, shownas negative velocity differences in Fig. 3b.
Finally, model 5d considers the additional buoy-Ž .ancy from melt retention Fig. 3c . The high melting
rate in the plume center results in a maximum poros-ity of 2.5%, to reduce bulk density in the plumecenter by an additional 0.3%. This added retentionbuoyancy further enhances the average upwelling
( )G. Ito et al.rEarth and Planetary Science Letters 144 1996 53–74 61
rate in the melting zone to 77 kmrmy, which is;90% of that predicted by the model that neglects
Ž .all melting effects model 5a . Thus, the added melt-ing-related buoyancy forces approximately balance
the upwelling-inhibiting effects of latent heat loss.In all models examined we find, as did Ribe et al.
w x11 , that the thickening lithosphere does not channelthe plume preferentially along the ridge axis. On the
Ž .Fig. 3. Perspective views of depth cross-sections showing percentage density reduction in the mantle due to: a thermal buoyancy withŽ . Ž . Ž . Ž . Ž . Ž .latent heat loss DT s2008C model 5b ; b plus melt depletion buoyancy model 5c ; and c plus melt retention buoyancy model 5d .p
Ž . Ž .Contour interval is 0.5%. Vectors in a show mantle flow. Vectors in b show the differences between flows with and without meltŽ .depletion buoyancy. Vectors in c show the difference between flows with and without melt retention buoyancy. Downward pointing
Ž . Ž .vectors in b and c illustrate reduced upwelling, not downwelling.
( )G. Ito et al.rEarth and Planetary Science Letters 144 1996 53–7462
contrary, the spreading lithosphere enhances ridge-perpendicular flow by pulling plume material awayfrom the ridge-axis, and actually impedes along-axisflow by viscous shear. These effects however aresmall — the total along-axis flux at ys70 km iswithin a few percent of the total ridge-perpendicularflux at xs70 km. Thus, the rate of spreading awayfrom the plume center is approximately equal in allradial directions.
To determine how W depends on Q and U foreach experimental set, we examine spreading ratesbetween 20 and 120 kmrmy and we vary Q by
Ž .changing DT between 1008C and 2008C Table 2 .p
We track the distribution of plume material by intro-ducing a tracer, P, in the plume and using our tensordiffusion scheme to advect P passively with themantle. Ps1 is introduced in the plume sourcecolumn to represent 100% plume material, whilePs0 represents 0% plume material and 100% ambi-ent mantle. We define W as the along-axis extent towhich the depth-integrated tracer concentration:
1 0.6DP 0, y , z d zŽ .Hž /0.6 D 0
Ž .is )0.05 Fig. 2 . The volume flux of the plume ismeasured at zs0.6 D by integrating the verticalflow of the plume source over its cross-sectionalarea.
For calculations that include thermal buoyancyŽ .only without latent heat loss set A , we find, similar
w xto 9,11 , that W depends primarily on the scalingŽ .1r2quantity QrU , and depends secondarily on the
Žp l u m e b u o y a n c y n u m b e r B sŽ . Ž 2 .. w xQ r aDT r 48h U , as defined in 11 , and ono p o
the ambientrplume viscosity ratio gsh rh , ato p
zs0.5D. A modified buoyancy number which de-Ž .pends on plume viscosity is thus Bg . The best-fit
linear regression function obtained by fitting linearŽ .and constant coefficients to ln Bg is:
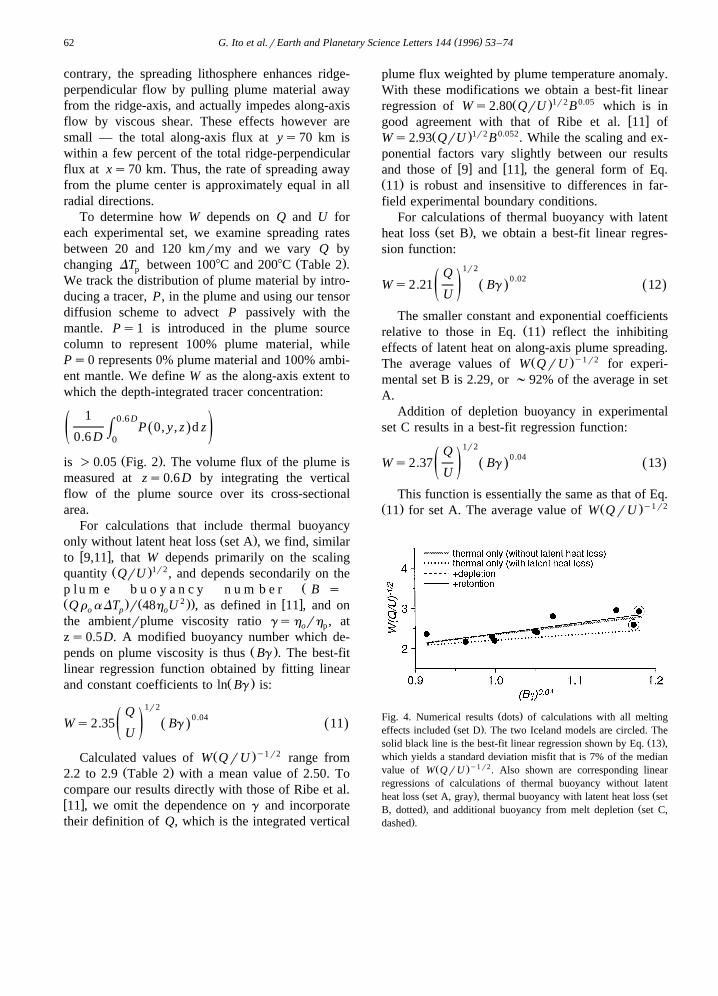
1r2Q 0.04Ws2.35 Bg 11Ž . Ž .ž /U
Ž .y1r2Calculated values of W QrU range fromŽ .2.2 to 2.9 Table 2 with a mean value of 2.50. To
compare our results directly with those of Ribe et al.w x11 , we omit the dependence on g and incorporatetheir definition of Q, which is the integrated vertical
plume flux weighted by plume temperature anomaly.With these modifications we obtain a best-fit linear
Ž .1r2 0.05regression of Ws2.80 QrU B which is inw xgood agreement with that of Ribe et al. 11 of
Ž .1r2 0.052Ws2.93 QrU B . While the scaling and ex-ponential factors vary slightly between our results
w x w xand those of 9 and 11 , the general form of Eq.Ž .11 is robust and insensitive to differences in far-field experimental boundary conditions.
For calculations of thermal buoyancy with latentŽ .heat loss set B , we obtain a best-fit linear regres-
sion function:1r2Q 0.02Ws2.21 Bg 12Ž . Ž .ž /U
The smaller constant and exponential coefficientsŽ .relative to those in Eq. 11 reflect the inhibiting
effects of latent heat on along-axis plume spreading.Ž .y1r2The average values of W QrU for experi-
mental set B is 2.29, or ;92% of the average in setA.
Addition of depletion buoyancy in experimentalset C results in a best-fit regression function:
1r2Q 0.04Ws2.37 Bg 13Ž . Ž .ž /U
This function is essentially the same as that of Eq.Ž . Ž .y1r211 for set A. The average value of W QrU
Ž .Fig. 4. Numerical results dots of calculations with all meltingŽ .effects included set D . The two Iceland models are circled. The
Ž .solid black line is the best-fit linear regression shown by Eq. 13 ,which yields a standard deviation misfit that is 7% of the median
Ž .y1 r2value of W QrU . Also shown are corresponding linearregressions of calculations of thermal buoyancy without latent
Ž . Žheat loss set A, gray , thermal buoyancy with latent heat loss set. ŽB, dotted , and additional buoyancy from melt depletion set C,
.dashed .
( )G. Ito et al.rEarth and Planetary Science Letters 144 1996 53–74 63
of 2.51 is also essentially the same as that in set A.Ž .The further addition of melt retention set D does
not change this relationship significantly, as shownby the similarity in regression lines of set C and set
Ž .D Fig. 4 . Thus, the effects of retention buoyancyoccur at wavelengths too short to affect the fullwidth W. In summary, the effects of latent heat lossto inhibit lateral plume spreading are approximatelybalanced by the added buoyancy of melt depletionwhich enhances plume spreading.
5. Models of Iceland and the Mid-Atlantic Ridge
We next investigate models of mantle flow andmelting beneath Iceland, a relatively well studiedexample of a ridge-centered plume. Our objective isto constrain the temperature anomaly, dimension,and volume flux of the Iceland plume by comparingtheoretical model predictions with observed along-axis variations in seismic crustal thickness, topogra-phy, gravity, and basalt geochemistry. Previous geo-physical studies of the Iceland–MAR system demon-strated that the topographic high at Iceland coincideswith a low in mantle Bouguer gravity anomalyŽ .MBA , and that both MBA and topographic anoma-lies can be explained by the combined effects ofanomalously thick crust and low density mantle gen-
w xerated by the Iceland plume 27,28 . MBA are calcu-lated by subtracting from free-air gravity the attrac-tion of seafloor topography and the crust–mantleinterface, assuming a uniform crustal thickness of 7
Ž w x.km e.g., 29,30 . Because as much as 75% of thealong-axis topographic and MBA variations may arise
w xfrom thickened igneous crust 28,31 , crustal thick-ness calculations are an important link between ourmodels and surface observations.
To predict crustal thickness from mantle meltingcalculations, we assume that all melt generated within200 km of the ridge-axis accretes perpendicularly tothe ridge-axis and take the top of our numerical boxto be the isostatic depth of the seafloor for crust of
Ž .normal thickness 7 km . The crustal thickness as afunction of along-axis coordinate y is therefore:
2 ro ˙Cr y s HM y d xd z 14Ž . Ž . Ž .ž /U rm
We take the top of our model to be the isostaticdepth of the seafloor for a 7 km thick model crust,and assume isostatic compensation of crustal thick-ness variations that deviate from this model crust.Consequently, variations in crustal thickness impartno lithostatic pressure variations in the mantle. Toprevent melting at depths shallower than the isostaticbase of the thickened Icelandic crust we prohibitmelting everywhere at depths -28 km. Meltingmay stop deeper, however, if hydrothermal cooling
w xis important 32 .To calculate isostatic topography of the seafloor,
Ž .we consider contributions from both the crust DhcŽ .and mantle Dh . In calculating Dh , we assumem c
Airy compensation of the crust with a surface den-Ž .sity contrast of r yr for the submarine portionc w
of topography and r for the subaerial portion. Thec
crust along the Reykjanes and Kolbeinsey ridges isassumed to have a density of 2800 kgrm3, exceptwithin 500 km of the plume center, where we in-crease it linearly to a maximum of 3030 kgrm3 atIceland, to account for the higher MgO content of
w xthe Icelandic crust 33 . The mantle contribution totopography, or dynamic topography is calculatedfrom vertical normal stress at the top layer of ourmodel:
tz zDh s 15Ž .m
r yr gŽ .o w
With this definition, our calculations predictseafloor depths to increase approximately with thesquare-root of distance from the ridge-axis, which isconsistent with lithospheric half space cooling mod-
Ž w x.els e.g. 34 . In addition to using Dh to predictm
topography, we also use Dh to estimate crustalm
thickness in a manner independent of our mantlemelting calculations. This ‘isostatic crustal thick-ness’ is defined as the isostatic thickness of crustrequired to account for the difference between theobserved topography and Dh .m
In computing MBA we again consider both crustaland mantle contributions. The crustal contribution isthe gravitational signal due to undulations at thecrust–mantle interface that deviate from the constantcrustal thickness reference model originally assumedin generating MBA. For these calculations we em-
w xploy the method of 35 . The mantle contribution to
( )G. Ito et al.rEarth and Planetary Science Letters 144 1996 53–7464
gravity is calculated by integrating the contributionsfrom lateral density variations at each model layerw x29 .
5.1. Broad plume source model
Our first model of the Iceland–MAR system,w xmuch like that of Ribe et al. 11 , considers a broad
plume source with a relatively small temperatureŽ .anomaly model Ice 1, as300 km, and DT s758Cp
rising beneath a model MAR with a full spreadingw x Ž .rate of 19 kmrmy 36 Fig. 5a . At this spreading
rate, T s13508C is required to produce a ;7 kmo
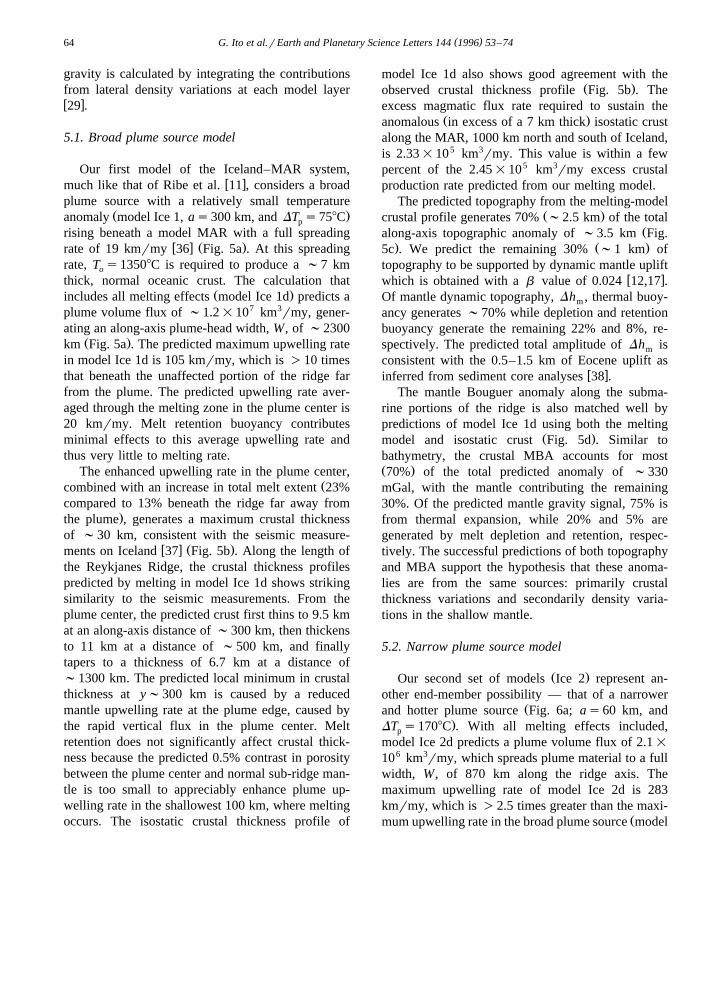
thick, normal oceanic crust. The calculation thatŽ .includes all melting effects model Ice 1d predicts a
plume volume flux of ;1.2=107 km3rmy, gener-ating an along-axis plume-head width, W, of ;2300
Ž .km Fig. 5a . The predicted maximum upwelling ratein model Ice 1d is 105 kmrmy, which is )10 timesthat beneath the unaffected portion of the ridge farfrom the plume. The predicted upwelling rate aver-aged through the melting zone in the plume center is20 kmrmy. Melt retention buoyancy contributesminimal effects to this average upwelling rate andthus very little to melting rate.
The enhanced upwelling rate in the plume center,Žcombined with an increase in total melt extent 23%
compared to 13% beneath the ridge far away from.the plume , generates a maximum crustal thickness
of ;30 km, consistent with the seismic measure-w x Ž .ments on Iceland 37 Fig. 5b . Along the length of
the Reykjanes Ridge, the crustal thickness profilespredicted by melting in model Ice 1d shows strikingsimilarity to the seismic measurements. From theplume center, the predicted crust first thins to 9.5 kmat an along-axis distance of ;300 km, then thickensto 11 km at a distance of ;500 km, and finallytapers to a thickness of 6.7 km at a distance of;1300 km. The predicted local minimum in crustalthickness at y;300 km is caused by a reducedmantle upwelling rate at the plume edge, caused bythe rapid vertical flux in the plume center. Meltretention does not significantly affect crustal thick-ness because the predicted 0.5% contrast in porositybetween the plume center and normal sub-ridge man-tle is too small to appreciably enhance plume up-welling rate in the shallowest 100 km, where meltingoccurs. The isostatic crustal thickness profile of
model Ice 1d also shows good agreement with theŽ .observed crustal thickness profile Fig. 5b . The
excess magmatic flux rate required to sustain theŽ .anomalous in excess of a 7 km thick isostatic crust
along the MAR, 1000 km north and south of Iceland,is 2.33=105 km3rmy. This value is within a fewpercent of the 2.45=105 km3rmy excess crustalproduction rate predicted from our melting model.
The predicted topography from the melting-modelŽ .crustal profile generates 70% ;2.5 km of the total
Žalong-axis topographic anomaly of ;3.5 km Fig.. Ž .5c . We predict the remaining 30% ;1 km of
topography to be supported by dynamic mantle upliftw xwhich is obtained with a b value of 0.024 12,17 .
Of mantle dynamic topography, Dh , thermal buoy-m
ancy generates ;70% while depletion and retentionbuoyancy generate the remaining 22% and 8%, re-spectively. The predicted total amplitude of Dh ism
consistent with the 0.5–1.5 km of Eocene uplift asw xinferred from sediment core analyses 38 .
The mantle Bouguer anomaly along the subma-rine portions of the ridge is also matched well bypredictions of model Ice 1d using both the melting
Ž .model and isostatic crust Fig. 5d . Similar tobathymetry, the crustal MBA accounts for mostŽ .70% of the total predicted anomaly of ;330mGal, with the mantle contributing the remaining30%. Of the predicted mantle gravity signal, 75% isfrom thermal expansion, while 20% and 5% aregenerated by melt depletion and retention, respec-tively. The successful predictions of both topographyand MBA support the hypothesis that these anoma-lies are from the same sources: primarily crustalthickness variations and secondarily density varia-tions in the shallow mantle.
5.2. Narrow plume source model
Ž .Our second set of models Ice 2 represent an-other end-member possibility — that of a narrower
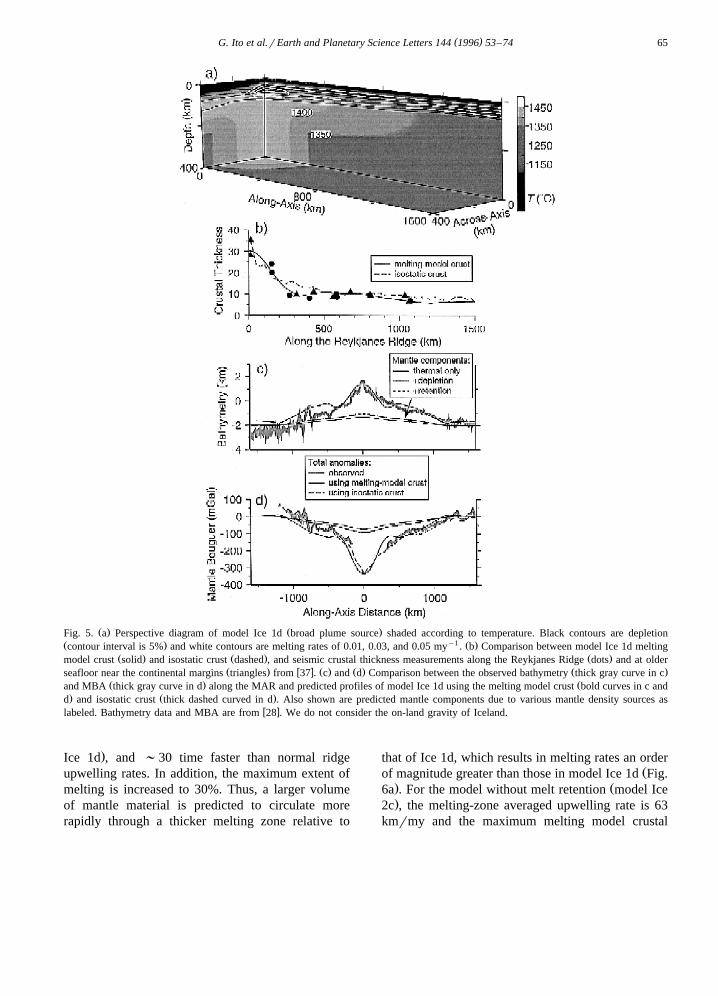
Žand hotter plume source Fig. 6a; as60 km, and.DT s1708C . With all melting effects included,p
model Ice 2d predicts a plume volume flux of 2.1=
106 km3rmy, which spreads plume material to a fullwidth, W, of 870 km along the ridge axis. Themaximum upwelling rate of model Ice 2d is 283kmrmy, which is )2.5 times greater than the maxi-
Žmum upwelling rate in the broad plume source model
( )G. Ito et al.rEarth and Planetary Science Letters 144 1996 53–74 65
Ž . Ž .Fig. 5. a Perspective diagram of model Ice 1d broad plume source shaded according to temperature. Black contours are depletionŽ . y1 Ž .contour interval is 5% and white contours are melting rates of 0.01, 0.03, and 0.05 my . b Comparison between model Ice 1d melting
Ž . Ž . Ž .model crust solid and isostatic crust dashed , and seismic crustal thickness measurements along the Reykjanes Ridge dots and at olderŽ . w x Ž . Ž . Ž .seafloor near the continental margins triangles from 37 . c and d Comparison between the observed bathymetry thick gray curve in c
Ž . Žand MBA thick gray curve in d along the MAR and predicted profiles of model Ice 1d using the melting model crust bold curves in c and. Ž .d and isostatic crust thick dashed curved in d . Also shown are predicted mantle components due to various mantle density sources as
w xlabeled. Bathymetry data and MBA are from 28 . We do not consider the on-land gravity of Iceland.
.Ice 1d , and ;30 time faster than normal ridgeupwelling rates. In addition, the maximum extent ofmelting is increased to 30%. Thus, a larger volumeof mantle material is predicted to circulate morerapidly through a thicker melting zone relative to
that of Ice 1d, which results in melting rates an orderŽof magnitude greater than those in model Ice 1d Fig.
. Ž6a . For the model without melt retention model Ice
.2c , the melting-zone averaged upwelling rate is 63kmrmy and the maximum melting model crustal
( )G. Ito et al.rEarth and Planetary Science Letters 144 1996 53–7466
Ž .Fig. 6. As Fig. 5 but for Ice 2 models narrow plume source .Ž .Symbols as in Fig. 5 except melting rate contours in a are 0.01,
0.03, 0.05, 0.2 and 0.4 myy1.
Žthickness is 147 km. With melt retention model Ice.2d , the 2.9% porosity in the plume is sufficient to
increase the predicted melting-zone-averaged up-welling rate to 80 kmrmy and the maximum melt-
Ž .ing-model crustal thickness to 166 km Fig. 6b . Inmodel Ice 2d, the melting-model crust thins to 3 kmat an along-axis distance of 120 km, where up-welling and thus melting rate is strongly reduced at
Žthe edge of the rapidly upwelling plume center Fig..6a .The high maximum crustal thicknesses predicted
by the narrow plume source melting model drasti-cally exceed calculations of previous studies that
Ž w x.assumed passive mantle upwelling e.g. 28,39 and
drastically exceed the observed crustal thicknessesŽ .Fig. 6b . The resulting topographic and MBA
Žanomalies also fail to match the observations Fig..6c,d . The isostatic crustal profile, on the other hand,
yields predictions in much better agreement with theŽ .observed crustal thicknesses Fig. 6b , topography
Ž . Ž . Ž .by definition Fig. 6c , and MBA Fig. 6d alongthe ridge-axis. Thus, if the Iceland plume is compa-rable in radius and temperature to our narrow plumesource model, a substantial portion of the melt pro-duced beneath Iceland must accrete more uniformlyalong-axis than our melting-model crust, much likeour isostatic crustal profile. This condition suggestsmelt migration andror lower crustal ductile floww x40 occurs over distances of several hundreds ofkilometers away from Iceland, along the Reykjanesand Kolbeinsey ridges.
Because the mechanisms of along-ridge-axis melttransport are poorly understood, we do not attempt tomodel this process in this study. Instead, we assumea priori that along-axis melt redistribution does occurand that the end result of this process leads to theisostatic crustal profile. In arriving at our final Ice 2models, we thus sought values of DT and a suchp
that the total volume rate of melt produced by themelting model matched that required to sustain theisostatic crustal profile. The best solutions of DT sp
1708C and as60 km yield a total excess melt5 3 Žproduction rate of 2.54=10 km rmy model Ice
.2d , which is within 1% of that required of theisostatic crustal profile.
In these narrower, hotter plume source models,the mantle contribution to topography and gravityrelative to the crustal contribution becomes muchlarger than in the broader, cooler source models. Forexample, model Ice 2d predicts a mantle topographic
Ž .uplift that is 51% 1.8 km of the observed along-axisŽ .topographic anomaly Fig. 6c , and a mantle contri-
Ž .bution to MBA that is 48% 158 mGal of theŽ .observed MBA variation Fig. 6d . The crust there-
fore generates only 49% and 52% of the total topo-graphic and MBA variations, respectively. Calcula-tions also predict the importance of melt-relatedbuoyancy to the mantle anomalies to be significantlygreater for these hotter plume source models relativeto the cooler source models. Thermal buoyancy ispredicted to produce 47% of Dh , and 60% of them
mantle MBA variation; melt depletion produces 39%
( )G. Ito et al.rEarth and Planetary Science Letters 144 1996 53–74 67
of Dh and 25% of the mantle MBA; and meltm
retention produces the remaining 14% of Dh andm
15% of the mantle MBA variation.
5.3. Reykjanes Ridge bathymetric swell
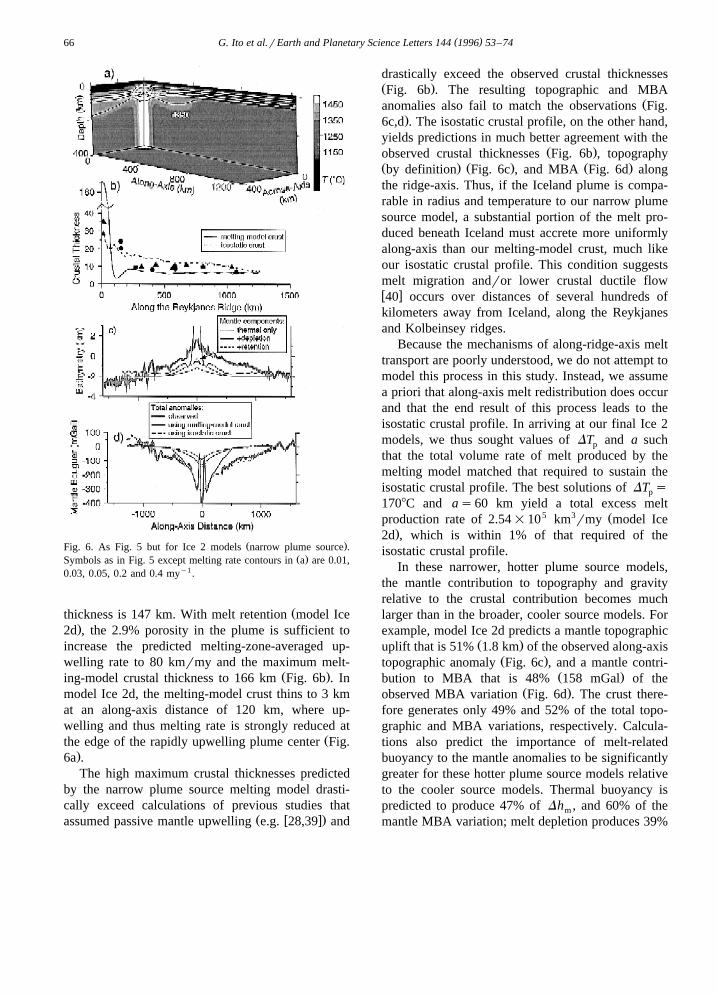
Similar to along-axis topography, we predict mapview topography by adding mantle dynamic topogra-
Ž Ž ..phy Eq. 15 and isostatic topography of the crustconsidering only along-axis variations in crustalthickness. For model Ice 1d, we use the melting-model crust and for model Ice 2d, we use theisostatic crust. Fig. 7 illustrates the observed topog-raphy in map view along the Reykjanes Ridge southof Iceland, and predictions of models Ice 1d and Ice2d. The similarity between the predictions and obser-
Ž .vations at broad wavelengths );500 km arecompelling: both models predict the ;2.0 kmacross-axis decrease in broad wavelength topography
between Iceland and an across-axis distance of 400km away from the ridge-axis, and both predict thesouth-pointing swell, elongated along the ReykjanesRidge. As demonstrated above, the southward deep-ening of the ridge axis reflects crustal thinning andmantle density increase with distance from the Ice-land plume source. But perpendicular to the ridge-axis, seafloor topography is dominated by the subsi-dence of the cooling lithosphere. Thus, contrary to
Ž w x.previous notions e.g. 5,6 , the regional bathymetricswell does not require a pipe-like flow of plumematerial along the ridge axis. Instead, we predict theplume head to spread radially and explain the gen-eral shape of the elongated Icelandic swell as thesuperposition of radial plume spreading and across-axis lithospheric cooling. The models presented inthis study, however, do not consider time-dependentvariations in crustal accretion which may also con-tribute to across-axis topographic variations.
Ž . Ž . Ž .Fig. 7. a Observed topography of Iceland and the Reykjanes Ridge oblique Mercator projection . b Mantleqcrustal topographyŽ .predicted from our broad plume source model Ice 1d using the melting model crust. c Mantleqcrustal topography predicted from our
narrow plume source model Ice 2d using the isostatic crust.
( )G. Ito et al.rEarth and Planetary Science Letters 144 1996 53–7468
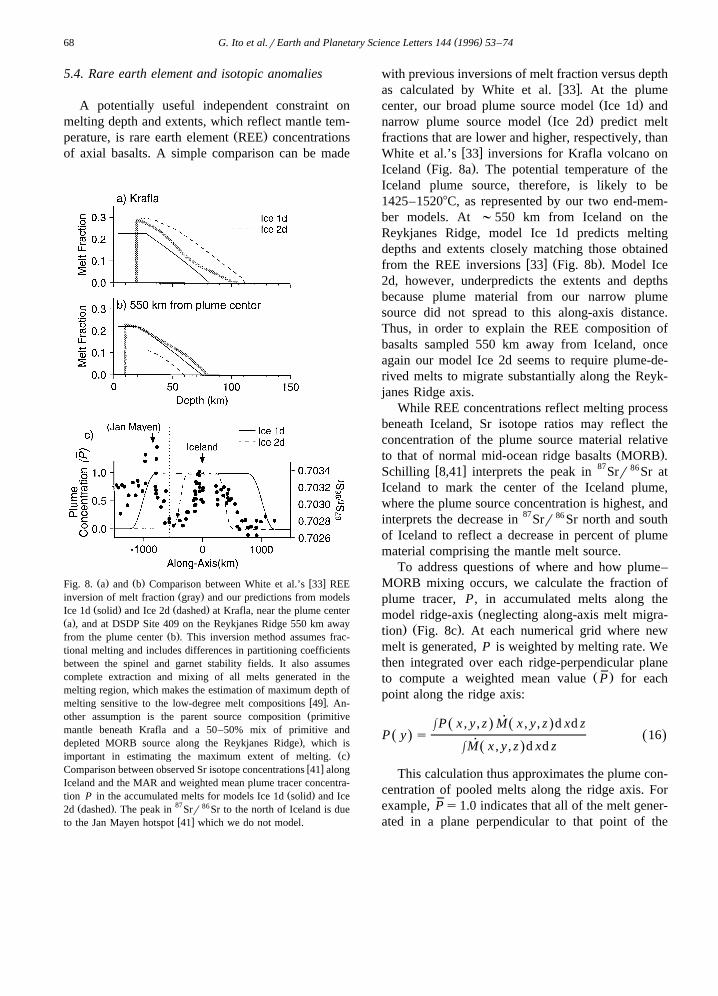
5.4. Rare earth element and isotopic anomalies
A potentially useful independent constraint onmelting depth and extents, which reflect mantle tem-
Ž .perature, is rare earth element REE concentrationsof axial basalts. A simple comparison can be made
Ž . Ž . w xFig. 8. a and b Comparison between White et al.’s 33 REEŽ .inversion of melt fraction gray and our predictions from models
Ž . Ž .Ice 1d solid and Ice 2d dashed at Krafla, near the plume centerŽ .a , and at DSDP Site 409 on the Reykjanes Ridge 550 km away
Ž .from the plume center b . This inversion method assumes frac-tional melting and includes differences in partitioning coefficientsbetween the spinel and garnet stability fields. It also assumescomplete extraction and mixing of all melts generated in themelting region, which makes the estimation of maximum depth of
w xmelting sensitive to the low-degree melt compositions 49 . An-Žother assumption is the parent source composition primitive
mantle beneath Krafla and a 50–50% mix of primitive and.depleted MORB source along the Reykjanes Ridge , which is
Ž .important in estimating the maximum extent of melting. cw xComparison between observed Sr isotope concentrations 41 along
Iceland and the MAR and weighted mean plume tracer concentra-Ž .tion P in the accumulated melts for models Ice 1d solid and Ice
Ž . 87 862d dashed . The peak in Srr Sr to the north of Iceland is duew xto the Jan Mayen hotspot 41 which we do not model.
with previous inversions of melt fraction versus depthw xas calculated by White et al. 33 . At the plume
Ž .center, our broad plume source model Ice 1d andŽ .narrow plume source model Ice 2d predict melt
fractions that are lower and higher, respectively, thanw xWhite et al.’s 33 inversions for Krafla volcano on
Ž .Iceland Fig. 8a . The potential temperature of theIceland plume source, therefore, is likely to be1425–15208C, as represented by our two end-mem-ber models. At ;550 km from Iceland on theReykjanes Ridge, model Ice 1d predicts meltingdepths and extents closely matching those obtained
w x Ž .from the REE inversions 33 Fig. 8b . Model Ice2d, however, underpredicts the extents and depthsbecause plume material from our narrow plumesource did not spread to this along-axis distance.Thus, in order to explain the REE composition ofbasalts sampled 550 km away from Iceland, onceagain our model Ice 2d seems to require plume-de-rived melts to migrate substantially along the Reyk-janes Ridge axis.
While REE concentrations reflect melting processbeneath Iceland, Sr isotope ratios may reflect theconcentration of the plume source material relative
Ž .to that of normal mid-ocean ridge basalts MORB .w x 87 86Schilling 8,41 interprets the peak in Srr Sr at
Iceland to mark the center of the Iceland plume,where the plume source concentration is highest, andinterprets the decrease in 87Srr 86 Sr north and southof Iceland to reflect a decrease in percent of plumematerial comprising the mantle melt source.
To address questions of where and how plume–MORB mixing occurs, we calculate the fraction ofplume tracer, P, in accumulated melts along the
Žmodel ridge-axis neglecting along-axis melt migra-. Ž .tion Fig. 8c . At each numerical grid where new
melt is generated, P is weighted by melting rate. Wethen integrated over each ridge-perpendicular plane
Ž .to compute a weighted mean value P for eachpoint along the ridge axis:
˙HP x , y , z M x , y , z d xd zŽ . Ž .P y s 16Ž . Ž .˙HM x , y , z d xd zŽ .
This calculation thus approximates the plume con-centration of pooled melts along the ridge axis. Forexample, Ps1.0 indicates that all of the melt gener-ated in a plane perpendicular to that point of the
( )G. Ito et al.rEarth and Planetary Science Letters 144 1996 53–74 69
ridge is entirely plume source derived. Likewise,Ps0.0 indicates that none of the melts are plumederived and 0.0-P-1.0 indicates plume–MORBmixing.
Model Ice 1d predicts an along-axis geochemicalplume width of )2000 km, significantly greaterthan that suggested by the 87Srr 86 Sr anomaly. Ice2d, on the other hand, predicts a width of ;1000
km, which is more consistent with that of the87 86Srr Sr anomaly; however, its profile in P wouldlikely be broader if along-axis melt migration wereconsidered. Both model Ice 1d and Ice 2d predict
Ž .that the melts are entirely plume derived Ps1.0over most of the plume width, and become fully
Ž .ambient mantle derived Ps0.0 within 200–300km of the edge of the plume. These results suggest
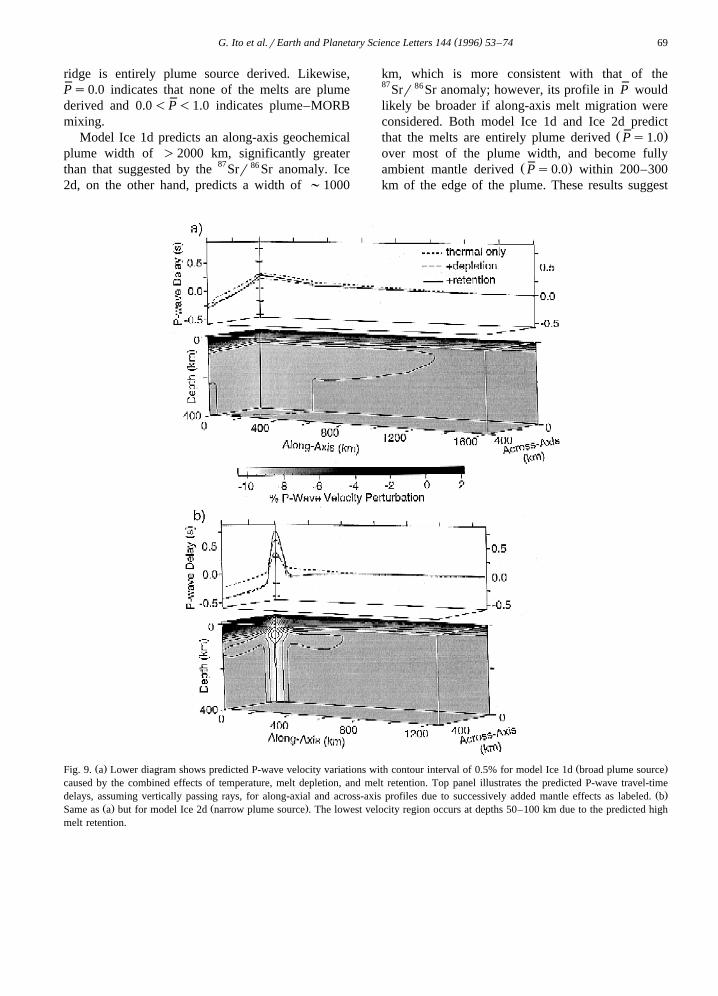
Ž . Ž .Fig. 9. a Lower diagram shows predicted P-wave velocity variations with contour interval of 0.5% for model Ice 1d broad plume sourcecaused by the combined effects of temperature, melt depletion, and melt retention. Top panel illustrates the predicted P-wave travel-time
Ž .delays, assuming vertically passing rays, for along-axial and across-axis profiles due to successively added mantle effects as labeled. bŽ . Ž .Same as a but for model Ice 2d narrow plume source . The lowest velocity region occurs at depths 50–100 km due to the predicted high
melt retention.
( )G. Ito et al.rEarth and Planetary Science Letters 144 1996 53–7470
that, within most of the plume-affected portion of theridge, very little mixing occurs between plume andambient source material in the shallow mantle. Thus,if the gradients in 87Srr 86 Sr away from Icelandreflect plume–MORB mixing, it most likely occursdeeper in the mantle, possibly by ambient mantle
Ž w x.entrainment of the ascending plume e.g. 42 .
5.5. Predictions of P-waÕe seismic Õelocity anoma-lies
Ž .Observations of compressional wave P-waveseismic travel-time variations and associated mantleP-wave velocity variations provide critical con-straints on mantle properties beneath Iceland. Topredict P-wave seismic velocity anomalies, we as-sume a reference P-wave velocity of 8 kmrs, whichdecreases by 6.25=10y3% for each 18C increase inmantle temperature, increases by 0.1% for each 1%increase in depletion, and decreases by 1.25% for
w xeach 1% increase in pore volume 43 . We alsopredict P-wave travel-time residuals by calculatingtravel times of seismic rays passing vertically throughthe 400 km thickness of our mantle models.
Ž .The broad plume source model Ice 1d predicts amaximum decrease in P-wave velocity below themelting region of ;0.5% relative to the surroundingmantle. In the melting region, the predicted P-wavevelocity anomaly diminishes because the velocity-enhancing effects of latent heat loss and melt deple-tion exceed the velocity-reducing effect of melt re-
Ž .tention Fig. 9a . The corresponding travel-time de-lay for vertically passing rays is predicted to beq0.23 s at the plume center and decrease to zero atan along-axis distance of ;1200 km. The contribu-tions to travel-time delay above the plume center areq0.25 s from excess mantle temperature, y0.09 sfrom melt depletion, and q0.07 s from melt reten-tion. Across the ridge-axis, lithospheric cooling dom-inates, resulting in a predicted travel-time differenceof 0.5 s between the plume center and at an across-axis distance of 400 km. The broad plume sourcemodel thus predicts only a gradual decrease intravel-time delay across the ridge axis and evensmaller variations along the ridge-axis.
In contrast, the narrow plume source of model Ice2d predicts significantly larger amplitudes of P-wave
anomalies over a much narrower lateral extent. Be-low the melting zone, the 1708C plume temperatureanomaly reduces calculated P-wave velocities bymore than 1%. In the melt zone, however, the P-wavevelocities are reduced to as much as 2% due to the
Ž .2.9% melt retention Fig. 9b . Along the ridge-axis,the travel-time delay for vertically passing rays ispredicted to be q0.75 s at the plume center and todecrease by 0.85 s within ;80 km. Approximatelyhalf of this travel-time residual is predicted to arisein the high-porosity melt zone in the shallow mantle.Across the ridge-axis, the additional effect of litho-spheric cooling yields a predicted travel-time differ-ence of 1 s within ;80 km of the plume center anda travel-time difference of 1.2 s over an across-axisdistance of 400 km. Preliminary results of the ongo-ing ICEMELT experiment at Iceland have revealedazimuthal variations in P-wave travel times as high
w xas 1 s within 100 km of the ridge axis 44 , suggest-ing that the narrow plume source model better repre-sents Iceland than does the broad plume sourcemodel.
6. Discussion
6.1. Importance of melting effects
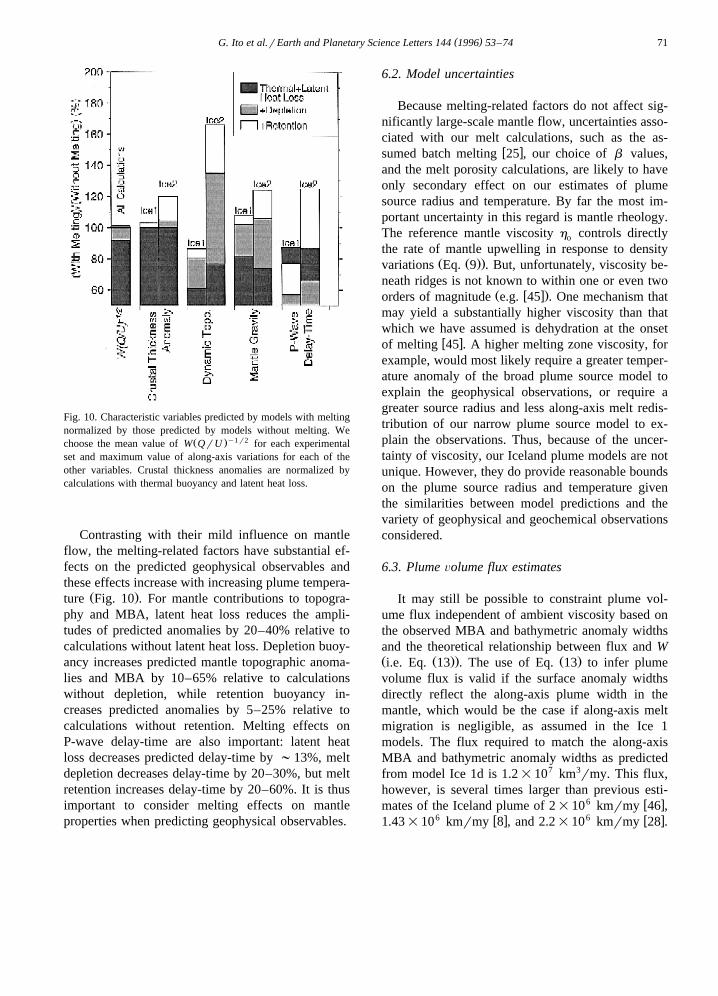
The importance of melting effects on mantle flow,melt production, and surface observables are summa-rized in Fig. 10. Mantle melting generates apprecia-ble effects on mantle properties; however, over therange of plume viscosities considered in our models,the effect of latent heat loss on mantle flow largelycancels the effects of depletion and retention buoy-ancy. As a result, the combined effects of thesefactors on mantle flow are small, as reflected in the
Žsmall changes in the predicted values of W Qr.y1r2 Ž .U Fig. 4 and Fig. 10 . Similarly, when plume
temperature anomalies are mild, as in the Ice 1models, the melting-related factors have only sec-ond-order effects on upwelling rate, as reflected in
Žsmall changes in the predicted crustal thickness Fig..10 . When plume temperature anomalies are larger,
however, as in the Ice 2 models, melt retention mayenhance the predicted crustal thickness by 20% rela-tive to calculations that do not include retention.
( )G. Ito et al.rEarth and Planetary Science Letters 144 1996 53–74 71
Fig. 10. Characteristic variables predicted by models with meltingnormalized by those predicted by models without melting. We
Ž .y1 r2choose the mean value of W QrU for each experimentalset and maximum value of along-axis variations for each of theother variables. Crustal thickness anomalies are normalized bycalculations with thermal buoyancy and latent heat loss.
Contrasting with their mild influence on mantleflow, the melting-related factors have substantial ef-fects on the predicted geophysical observables andthese effects increase with increasing plume tempera-
Ž .ture Fig. 10 . For mantle contributions to topogra-phy and MBA, latent heat loss reduces the ampli-tudes of predicted anomalies by 20–40% relative tocalculations without latent heat loss. Depletion buoy-ancy increases predicted mantle topographic anoma-lies and MBA by 10–65% relative to calculationswithout depletion, while retention buoyancy in-creases predicted anomalies by 5–25% relative tocalculations without retention. Melting effects onP-wave delay-time are also important: latent heatloss decreases predicted delay-time by ;13%, meltdepletion decreases delay-time by 20–30%, but meltretention increases delay-time by 20–60%. It is thusimportant to consider melting effects on mantleproperties when predicting geophysical observables.
6.2. Model uncertainties
Because melting-related factors do not affect sig-nificantly large-scale mantle flow, uncertainties asso-ciated with our melt calculations, such as the as-
w xsumed batch melting 25 , our choice of b values,and the melt porosity calculations, are likely to haveonly secondary effect on our estimates of plumesource radius and temperature. By far the most im-portant uncertainty in this regard is mantle rheology.The reference mantle viscosity h controls directlyo
the rate of mantle upwelling in response to densityŽ Ž ..variations Eq. 9 . But, unfortunately, viscosity be-
neath ridges is not known to within one or even twoŽ w x.orders of magnitude e.g. 45 . One mechanism that
may yield a substantially higher viscosity than thatwhich we have assumed is dehydration at the onset
w xof melting 45 . A higher melting zone viscosity, forexample, would most likely require a greater temper-ature anomaly of the broad plume source model toexplain the geophysical observations, or require agreater source radius and less along-axis melt redis-tribution of our narrow plume source model to ex-plain the observations. Thus, because of the uncer-tainty of viscosity, our Iceland plume models are notunique. However, they do provide reasonable boundson the plume source radius and temperature giventhe similarities between model predictions and thevariety of geophysical and geochemical observationsconsidered.
6.3. Plume Õolume flux estimates
It may still be possible to constraint plume vol-ume flux independent of ambient viscosity based onthe observed MBA and bathymetric anomaly widthsand the theoretical relationship between flux and WŽ Ž .. Ž .i.e. Eq. 13 . The use of Eq. 13 to infer plumevolume flux is valid if the surface anomaly widthsdirectly reflect the along-axis plume width in themantle, which would be the case if along-axis meltmigration is negligible, as assumed in the Ice 1models. The flux required to match the along-axisMBA and bathymetric anomaly widths as predictedfrom model Ice 1d is 1.2=107 km3rmy. This flux,however, is several times larger than previous esti-
6 w xmates of the Iceland plume of 2=10 kmrmy 46 ,6 w x 6 w x1.43=10 kmrmy 8 , and 2.2=10 kmrmy 28 .
( )G. Ito et al.rEarth and Planetary Science Letters 144 1996 53–7472
If, on the other hand, along-axis melt migration isimportant, as suggested for the Ice 2 models, we
Ž .cannot use Eq. 13 to constrain the Iceland plumevolume flux independent of h . We must thereforeo
rely on the fact that our melt production rate esti-mates are consistent with the total volume of ob-served excess crust as we did for the Ice 2 models.Indeed, model Ice 2d predicts a plume volume fluxof 2.1=106 km3rmy which is more consistent withthe above estimates of the previous studies. Anintriguing new question arising from this narrowplume source model is, what specific mechanismsmay allow melt generated beneath Iceland to migratehundreds of kilometers along-axis? Possible evi-dence for such melt transport may include the V-shaped axial bathymetric highs propagating awayfrom Iceland along the Reykjanes Ridge as first
w xnoted by Vogt 47 in 1971.
7. Conclusions
We have investigated the dynamics of mantleflow and melting of a ridge-centered plume usingthree-dimensional, variable-viscosity models with fo-cus on three buoyancy sources: temperature, meltdepletion, and melt retention. When all melting ef-fects are considered, the relationship between along-axis plume width, W, plume volume flux, Q, fullspreading rate, U, buoyancy number, B, and ambi-entrplume viscosity ratio, g , is best parameterized
Ž .1r2Ž .0.04by Ws2.37 QrU Bg . Calculations thatinclude melting yield a similar relationship to thosethat do not include melting because of the competingeffects of latent heat loss and depletion buoyancy.We propose two end-member models for the Icelandplume beneath the MAR. The broad plume source of
Žradiuss300 km represents a low temperature DTp. Ž 7 3 .s758C and high flux Qs1.2=10 km rmy
end-member, while the narrow plume source of ra-Ždiuss60 km represents a high temperature DT sp
. Ž 6 3 .1708C and low flux Qs2.1=10 km rmy end-member. The broad plume source predicts success-fully the observed along-axis variations in seismiccrustal thickness, topography, and mantle Bouguergravity anomalies; whereas the narrow source modelpredicts adequately the total excess crustal produc-
Ž 5 3 .tion rate 2.5=10 km rmy but requires extensive
melt migration andror lower crustal ductile flow tooccur over hundreds of kilometers along the MAR inorder to explain the geophysical and geochemicalobservations. Our calculations predict that plumespreading away from the plume center is radiallysymmetric rather than channelled preferentially alongthe ridge axis. The elongated bathymetric swell alongthe Reykjanes Ridge can be explained by rapidoff-axis subsidence due to lithospheric cooling super-imposed on a broader hotspot swell. Both the broadand narrow plume source models predict very littlemixing between the plume and MORB sources in theshallow mantle; hence, we suggest that mixing mayoccur deeper in the mantle, possibly due to entrain-ment of the isotopically depleted portion of themantle by the rising mantle plume. Our narrowplume source model predicts seismic P-wave veloc-ity variations more consistent with recent seismicobservations beneath Iceland, suggesting that thismodel may better represent the Iceland plume.
Acknowledgements
We gratefully acknowledge N. Ribe, D. Sparks,and C. Wolfe for their constructive and timely re-views. We thank Y. Shen and P. van Keken forsupplying independent finite element solutions usedto test our variable viscosity flow solver. This paperalso benefited from discussions with R. Detrick, J.G.Schilling, and M. Spiegelman. This work was sup-ported by NSF grant OCE-9302915 and benefitedfrom collaborations facilitated through a NSF-sup-ported Mantle Convection Workshop at the LosAlamos National Laboratories and additional fundsgranted through the WHOI Education Office. Contri-bution 9217 of the Woods Hole Oceanographic Insti-
[ ]tution. CL
References
w x1 M.F. Coffin and O. Eldholm, Large igneous provinces:Crustal structure, dimensions, and external consequences,Rev. Geophys. 32, 1–36, 1994.
w x2 W.J. Morgan, Convection plumes in the lower mantle, Na-ture 230, 42–43, 1971.
w x3 P.R. Vogt, Evidence for global synchronism in mantle plumeconvection, and possible significance for geology, Nature240, 338–342, 1972.
( )G. Ito et al.rEarth and Planetary Science Letters 144 1996 53–74 73
w x4 J.-G. Schilling, Iceland mantle plume: Geochemical study ofReykjanes Ridge, Nature 242, 565–571, 1973.
w x5 P.R. Vogt, Plumes, subaxial pipe flow, and topography alongthe mid-ocean ridge, Earth Planet. Sci. Lett. 29, 309–325,1976.
w x6 J.-G. Schilling, Upper mantle heterogeneities and dynamics,Nature 314, 62–67, 1985.
w x7 J.-G. Schilling, G. Thompson, R. Kingsley and S. Humphris,Hotspot-migrating ridge interaction in the South Atlantic,Nature 313, 187–191, 1985.
w x8 J.-G. Schilling, Fluxes and excess temperatures of mantleplumes inferred from their interaction with migrating mid-oc-ean ridges, Nature 352, 397–403, 1991.
w x9 M.A. Feighner and M.A. Richards, The fluid dynamics ofplume–ridge and plume–plate interactions: an experimentalinvestigation, Earth Planet. Sci. Lett. 129, 171–182, 1995.
w x10 M.A. Feighner, L.H. Kellogg and B.J. Travis, Numericalmodeling of chemically buoyant mantle plumes at spreadingridges, Geophys. Res. Lett. 22, 715–718, 1995.
w x11 N. Ribe, U.R. Christensen and J. Theissing, The dynamics ofplume–ridge interaction, 1: Ridge-centered plumes, EarthPlanet. Sci. Lett. 134, 155–168, 1995.
w x12 E.R. Oxburgh and E.M. Parmentier, Compositional and den-sity stratification in oceanic lithosphere—causes and conse-quences, J. Geol. Soc. London 133, 343–355, 1977.
w x13 J.L. Ahern and D.L. Turcotte, Magma migration beneath anocean ridge, Earth Planet. Sci. Lett. 45, 115–122, 1979.
w x14 J. Phipps Morgan, Melt migration beneath mid-ocean spread-ing centers, Geophys. Res. Lett. 14, 1238–1241, 1987.
w x15 D.R. Scott and D.J. Stevenson, A self-consistent model formelting, magma migration and buoyancy-driven circulationbeneath mid-ocean ridges, J. Geophys. Res. 94, 2973–2988,1989.
w x16 J. Phipps Morgan, W.J. Morgan and E. Price, Hotspot melt-ing generates both hotspot volcanism and a hotspot swell?, J.Geophys. Res. 100, 8045–8062, 1995.
w x17 D.W. Sparks, E.M. Parmentier and J. Phipps Morgan,Three-dimensional mantle convection beneath a segmentedspreading center: Implications for along-axis variations incrustal thickness and gravity, J. Geophys. Res. 98, 21,977–21,995, 1993.
w x18 K. Jha, E.M. Parmentier and J. Phipps Morgan, The role ofmantle depletion and melt-retention buoyancy in spreading-center segmentation, Earth Planet. Sci. Lett. 125, 221–234,1994.
w x19 D.L. Turcotte and J. Phipps Morgan, The physics of magmamigration and mantle flow beneath a mid-ocean ridge, in:Mantle Flow and Melt Generation Beneath Mid-OceanRidges, J. Phipps Morgan, D.K. Blackman and J.M. Sinton,eds., pp. 155–182, AGU, Washington, D.C., 1992.
w x20 C.W. Gable, Numerical models of plate tectonics and mantleconvection in three dimensions, Ph.D. Thesis, Harvard Univ.,1989.
w x21 C.W. Gable, R.J. O’Connel and B.J. Travis, Convection inthree dimensions with surface plates: Generation of toroidalflow, J. Geophys. Res. 96, 8391–8405, 1991.
w x22 U. Christensen, Convection with pressure- and temperature-dependent non-Newtonian rheology, Geophys. J.R. Astron.Soc. 77, 343–384, 1984.
w x23 U. Christensen and H. Harder, 3-D convection with variableviscosity, Geophys. J. Int. 104, 213–226, 1991.
w x24 F. Busse, U. Christensen, R. Clever, et al., 3D convection atinfinite Prandtl number in Cartesian geometry — A bench-mark comparison, Geophys. Astrophys. Fluid Dynam. 75,39–59, 1993.
w x25 D. McKenzie and M.J. Bickle, The volume and compositionof melt generated by extension of the lithosphere, J. Petrol.29, 625–679, 1988.
w x26 K.W.W. Sims and D.J. DePaolo, Porosity of the meltingzone beneath Hawaii and mid-ocean ridges: Inferences from238 U– 230 Th– 226Ra disequilibria, in: 6th V.M. GoldschmidtConf., Heidelberg, Germany, 1996.
w x27 G. Ito, J. Lin and R.S. Detrick, The effects of near-ridge hotspots on mid-ocean ridge density and temperature structurefrom analysis of gravity and bathymetry: Results from theGalapagos, Azores, and Iceland, EOS Trans. Am. Geophys.Union Spring Meet. Suppl. 75, 335, 1994.
w x28 G. Ito and J. Lin, Oceanic spreading center–hotspot interac-tions: Constraints from along-isochron bathymetric and grav-ity anomalies, Geology 23, 657–660, 1995.
w x29 B.-Y. Kuo and D.W. Forsyth, Gravity anomalies of theridge–transform system in the South Atlantic between 318
and 34.58S: Upwelling centers and variations in crustal thick-ness, Mar. Geophys. Res. 10, 205–232, 1988.
w x30 J. Lin, G.M. Purdy, H. Schouten, J.-C. Sempere and C.´ ´Zervas, Evidence from gravity data for focused magmaticaccretion along the Mid-Atlantic Ridge, Nature 344, 627–632,1990.
w x31 G. Ito and J. Lin, Mantle temperature anomalies along thepresent and paleoaxes of the Galapagos Spreading Center as´inferred from gravity analyses, J. Geophys. Res. 100, 3733–3745, 1995.
w x32 W. Menke and D. Sparks, Crustal accretion model for Ice-land predicts ‘cold’ crust, Geophys. Res. Lett. 22, 1673–1676,1995.
w x33 R.S. White, J.W. Bown and J.R. Smallwood, The tempera-ture of the Iceland plume and origin of outward propagatingV-shaped ridges, J. Geol. Soc. London 152, 1039–1045,1995.
w x34 B. Parsons and J.G. Sclater, An analysis of the variation ofocean floor bathymetry and heat flow with age, J. Geophys.Res. 82, 803–827, 1977.
w x35 R.L. Parker, The rapid calculation of potential anomalies,Geophys. J.R. Astron. Soc. 31, 447–455, 1973.
w x36 C. DeMets, R.G. Gordon, D.F. Argus and S. Stein, Effect ofrecent revisions to the geomagnetic reversal time scale onestimates of current plate motions, Geophys. Res. Lett. 21,2191–2194, 1994.
w x37 J.R. Smallwood, R.S. White and T.A. Minshull, Seafloorspreading in the presence of the Iceland plume: the structureof the Reykjanes Ridge at 61840X N, J. Geol. Soc. London152, 1023–1029, 1995.
( )G. Ito et al.rEarth and Planetary Science Letters 144 1996 53–7474
w x38 P.D. Clift, J. Turner and ODP Leg 152 Scientific Party,Dynamic support by the Iceland plume and its effect on thesubsidence of the northern Atlantic margins, J. Geol. Soc.London 152, 935–942, 1995.
w x39 D. McKenzie, The generation and compaction of partiallymolten rock, J. Petrol. 25, 713–765, 1984.
w x40 W.R. Buck, Along-axis crustal flow and ridge topographicsegmentation, EOS Trans. Am. Geophys. Union Spring Meet.Suppl. 77, 276, 1996.
w x41 J.-G. Schilling, Geochemical and isotopic variation along theMid-Atlantic Ridge axis from 798N to 08N, in: The Geologyof North America, P.R. Vogt and B.E. Tucholke, eds., pp.137–156, GSA, Boulder, Colo., 1986.
w x42 E.H. Hauri, J.A. Whitehead and S.R. Hart, Fluid dynamicsand geochemical aspects of entrainment in mantle plumes, J.Geophys. Res. 99, 24,275–24,300, 1994.
w x43 E.D. Humphreys and K.G. Dueker, Physical state of thewestern U.S. upper mantle, J. Geophys. Res. 99, 9635–9650,1994.
w x44 I.T. Bjarnason, C.J. Wolfe and S.C. Solomon, Initial resultsfrom the ICEMELT experiment: Body-wave delay times andshear-wave splitting across Iceland, Geophys. Res. Lett. 23,459–462, 1996.
w x45 G. Hirth and D.L. Kohlstedt, Water in the oceanic uppermantle: Implications for rheology, melt extraction, and theevolution of the lithosphere, Earth Planet. Sci. Lett., in press,1996.
w x46 N.H. Sleep, Hotspots and mantle plumes: Some phenomenol-ogy, J. Geophys. Res. 95, 6715–6736, 1990.
w x47 P.R. Vogt, Asthenosphere motion recorded by the by theocean floor south of Iceland, Earth Planet. Sci. Lett. 13,153–160, 1971.
w x48 P. Wessel and W.H.F. Smith, New version of the GenericMapping Tools released, EOS Trans. Am. Geophys. Union76, 329, 1995.
w x49 M. Spiegelman, Geochemical consequences of melt transportin 2-D: The sensitivity of trace elements to mantle dynamics,Earth Planet. Sci. Lett. 139, 115–132, 1996.