Embed Size (px)
Citation preview
Measurement of Fisheries Compliance Outcomes:
A Preliminary National Study FRDC Project No 2014/206
FRDC Final Report E. Price, R. Melville-Smith, D. King, T. Green, W. Dixon,
S. Lambert, T. Spencer
Fisheries Research Report No. 275, 2016
Fisheries Research Division Western Australian Fisheries and Marine Research Laboratories PO Box 20 NORTH BEACH, Western Australia 6920
4901/16
ii Fisheries Research Report [Western Australia] No. 275, 2016
© 2016 Fisheries Research and Development Corporation. All rights reserved.
Measurement of Fisheries Compliance Outcomes: A Preliminary National Study Project No. 2014/206 October 2016 Ownership of Intellectual property rights Unless otherwise noted, copyright (and any other intellectual property rights, if any) in this publication is owned by the Fisheries Research and Development Corporation
This publication (and any information sourced from it) should be attributed to E. Price, R. Melville-Smith, D. King, T. Green, W. Dixon, S. Lambert, T. Spencer (2016), Measurement of Fisheries Compliance Outcomes: A preliminary National Study. Perth, Australia, October 2016.
Creative Commons licence All material in this publication is licensed under a Creative Commons Attribution 3.0 Australia Licence, save for content supplied by third parties, logos and the Commonwealth Coat of Arms.
Creative Commons Attribution 3.0 Australia Licence is a standard form licence agreement that allows you to copy, distribute, transmit and adapt this publication provided you attribute the work. A summary of the licence terms is available from creativecommons.org/licenses/by/3.0/au/deed.en. The full licence terms are available from creativecommons.org/licenses/by/3.0/au/legalcode.
Inquiries regarding the licence and any use of this document should be sent to: [email protected].
Disclaimer The authors do not warrant that the information in this document is free from errors or omissions. The authors do not accept any form of liability, be it contractual, tortious, or otherwise, for the contents of this document or for any consequences arising from its use or any reliance placed upon it. The information, opinions and advice contained in this document may not relate, or be relevant, to a readers particular circumstances. Opinions expressed by the authors are the individual opinions expressed by those persons and are not necessarily those of the publisher, research provider or the FRDC.
The Fisheries Research and Development Corporation plans, invests in and manages fisheries research and development throughout Australia. It is a statutory authority within the portfolio of the federal Minister for Agriculture, Fisheries and Forestry, jointly funded by the Australian Government and the fishing industry.
Researcher Contact Details FRDC Contact Details Name: Address: Phone: Email:
Timothy J Green PO Box 20 North Beach WA 6920 (08) 9203 0234 [email protected]
Address: Phone: Fax: Email: Web:
25 Geils Court Deakin ACT 2600 02 6285 0400 02 6285 0499 [email protected] www.frdc.com.au
In submitting this report, the researcher has agreed to FRDC publishing this material in its edited form.
© Department of Fisheries, Western Australia. October 2016.
ISSN: 1035-4549 (Print) ISBN: 978-1-877098-50-5 (Print) ISSN: 2202-5758 (Online) ISBN: 978-1-877098-51-2 (Online)
.
Fisheries Research Report [Western Australia] No. 275, 2016 iii
Table of Contents Abbreviations .......................................................................................................................................... 1
Acknowledgements ................................................................................................................................. 2
Executive Summary ................................................................................................................................. 4
Overview ......................................................................................................................................... 4
Literature review ............................................................................................................................. 5
Survey .............................................................................................................................................. 7
Workshop ........................................................................................................................................ 7
Conclusions ..................................................................................................................................... 8
1 Introduction .................................................................................................................................. 11
1.1 What are compliance outcomes? .......................................................................................... 11
1.2 What are the functional units that generally make up a fisheries compliance force? ......... 13
1.3 What makes developing compliance outcome measures difficult? ..................................... 14
2 Objectives ...................................................................................................................................... 16
3 Methods ........................................................................................................................................ 16
3.1 Literature review: methodologies to assess effectiveness of compliance programs and
measure compliance outcomes ............................................................................................ 16
3.2 Survey on aspects relating to output and outcome indicators collected by a limited sample
of fisheries compliance agencies ........................................................................................... 18
3.3 Workshop to review findings of the desktop study and add expert input ........................... 18
4 Results/Discussion ......................................................................................................................... 19
4.1 Literature review: methodologies to assess effectiveness of compliance programs and
measure compliance outcomes ............................................................................................ 19
Compliance Theory ................................................................................................... 21 4.1.1
Methods to measure fishing non-compliance and illegal activity ............................ 26 4.1.2
Measuring compliance outcomes............................................................................. 47 4.1.3
Fisheries compliance outcome measurement systems developed or in use ........... 61 4.1.4
iv Fisheries Research Report [Western Australia] No. 275, 2016
4.2 Survey on aspects relating to output and outcome indicators collected by a limited sample
of fisheries compliance agencies ........................................................................................... 68
Survey Section 1: Your agency .................................................................................. 69 4.2.1
Survey Section 2: Your role in your agency .............................................................. 70 4.2.2
Survey Section 3: Working relationships with your law enforcement/compliance 4.2.3
branch or division ..................................................................................................... 71
Survey Section 4: Your agency’s enforcement and its enforcement performance 4.2.4
measurement ........................................................................................................... 73
Survey Section 5: Your agency’s enforcement tools and capabilities ...................... 77 4.2.5
Survey Section 6: Level of interest in compliance outcomes measurement............ 78 4.2.6
Survey Section 7: Measures of successful compliance or enforcement activity ...... 78 4.2.7
4.3 Workshop to review findings of the desktop study and add expert input ........................... 81
4.4 Documenting best practice ................................................................................................... 82
5 Conclusion ..................................................................................................................................... 83
6 Implications ................................................................................................................................... 86
7 Recommendations ........................................................................................................................ 87
8 Extension and Adoption ................................................................................................................ 91
Appendix A: Intellectual Property ......................................................................................................... 93
Appendix B: Staff ................................................................................................................................... 94
Appendix C: Workshop Agenda: Measuring Fisheries Compliance Outcomes ..................................... 95
Appendix D: The Affiliations of Attendees at the workshop: Measuring Fisheries Compliance
Outcomes ...................................................................................................................................... 96
Appendix E: Survey form providing insight into compliance outcomes nationally and
internationally ............................................................................................................................... 97
Appendix F: References ...................................................................................................................... 108
Fisheries Research Report [Western Australia] No. 275, 2016 1
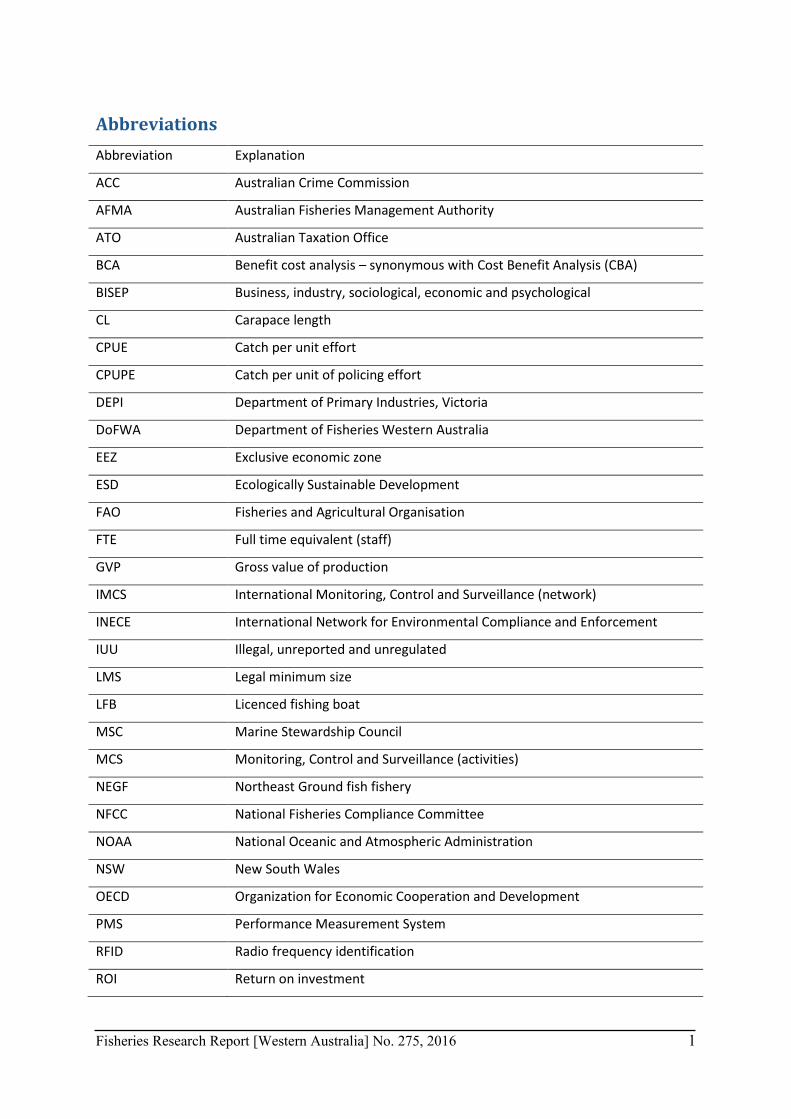
Abbreviations Abbreviation Explanation
ACC Australian Crime Commission
AFMA Australian Fisheries Management Authority
ATO Australian Taxation Office
BCA Benefit cost analysis – synonymous with Cost Benefit Analysis (CBA)
BISEP Business, industry, sociological, economic and psychological
CL Carapace length
CPUE Catch per unit effort
CPUPE Catch per unit of policing effort
DEPI Department of Primary Industries, Victoria
DoFWA Department of Fisheries Western Australia
EEZ Exclusive economic zone
ESD Ecologically Sustainable Development
FAO Fisheries and Agricultural Organisation
FTE Full time equivalent (staff)
GVP Gross value of production
IMCS International Monitoring, Control and Surveillance (network)
INECE International Network for Environmental Compliance and Enforcement
IUU Illegal, unreported and unregulated
LMS Legal minimum size
LFB Licenced fishing boat
MSC Marine Stewardship Council
MCS Monitoring, Control and Surveillance (activities)
NEGF Northeast Ground fish fishery
NFCC National Fisheries Compliance Committee
NOAA National Oceanic and Atmospheric Administration
NSW New South Wales
OECD Organization for Economic Cooperation and Development
PMS Performance Measurement System
RFID Radio frequency identification
ROI Return on investment
2 Fisheries Research Report [Western Australia] No. 275, 2016
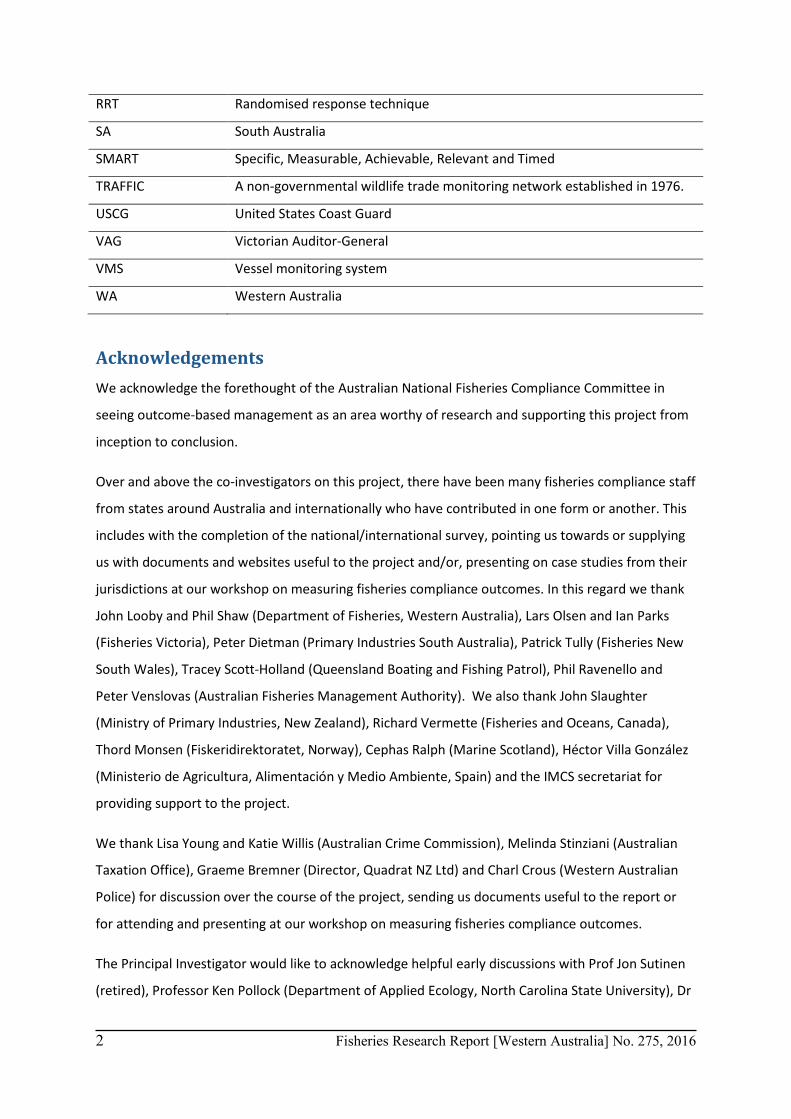
RRT Randomised response technique
SA South Australia
SMART Specific, Measurable, Achievable, Relevant and Timed
TRAFFIC A non-governmental wildlife trade monitoring network established in 1976.
USCG United States Coast Guard
VAG Victorian Auditor-General
VMS Vessel monitoring system
WA Western Australia
Acknowledgements We acknowledge the forethought of the Australian National Fisheries Compliance Committee in
seeing outcome-based management as an area worthy of research and supporting this project from
inception to conclusion.
Over and above the co-investigators on this project, there have been many fisheries compliance staff
from states around Australia and internationally who have contributed in one form or another. This
includes with the completion of the national/international survey, pointing us towards or supplying
us with documents and websites useful to the project and/or, presenting on case studies from their
jurisdictions at our workshop on measuring fisheries compliance outcomes. In this regard we thank
John Looby and Phil Shaw (Department of Fisheries, Western Australia), Lars Olsen and Ian Parks
(Fisheries Victoria), Peter Dietman (Primary Industries South Australia), Patrick Tully (Fisheries New
South Wales), Tracey Scott-Holland (Queensland Boating and Fishing Patrol), Phil Ravenello and
Peter Venslovas (Australian Fisheries Management Authority). We also thank John Slaughter
(Ministry of Primary Industries, New Zealand), Richard Vermette (Fisheries and Oceans, Canada),
Thord Monsen (Fiskeridirektoratet, Norway), Cephas Ralph (Marine Scotland), Héctor Villa González
(Ministerio de Agricultura, Alimentación y Medio Ambiente, Spain) and the IMCS secretariat for
providing support to the project.
We thank Lisa Young and Katie Willis (Australian Crime Commission), Melinda Stinziani (Australian
Taxation Office), Graeme Bremner (Director, Quadrat NZ Ltd) and Charl Crous (Western Australian
Police) for discussion over the course of the project, sending us documents useful to the report or
for attending and presenting at our workshop on measuring fisheries compliance outcomes.
The Principal Investigator would like to acknowledge helpful early discussions with Prof Jon Sutinen
(retired), Professor Ken Pollock (Department of Applied Ecology, North Carolina State University), Dr

Fisheries Research Report [Western Australia] No. 275, 2016 3
Maria Hauck (Department of Environmental and Geographical Sciences, University of Cape Town), Dr
Rachel Baird (Queensland University of Technology) and Dr Samantha Bricknell (Australian Institute
of Criminology).
4 Fisheries Research Report [Western Australia] No. 275, 2016
Executive Summary
Overview This report presents the results of a project undertaken by a group of Australia and United States
based fishery compliance experts to assess and compare methods for measuring fisheries
compliance outcomes that can be used to assess and compare the effectiveness of fishery
enforcement and compliance assistance activities. This eight month project was requested in 2013
by Australia’s National Fisheries Compliance Committee (NFCC) as a way to provide fisheries
compliance groups with improved methods for measuring and tracking the effectiveness of their
activities and for justifying and managing their budgets. Measures of compliance ‘inputs’, such as
patrol hours, and compliance ‘outputs’, such as numbers of contacts or inspections, are used
routinely by compliance groups to manage their activities. On the other hand, ‘outcome’ measures
that can be used to assess and compare the effectiveness and impacts of these activities, such as
changes in observed non-compliance rates, changes in risks to stocks and related changes in fishing
conditions, are not widely used. These outcome measures fall into three general categories:
immediate outcomes (e.g. numbers of violations detected per patrol hour); intermediate outcomes
(e.g. changes in numbers of violations detected per patrol hour); and final or long-term outcomes
(e.g., improvements in biological and economic conditions in fisheries that result from compliance
activities). Long-term outcomes are by far the most important and reflect how compliance activities
contribute to fishery management goals, but they are the most difficult to measure and attribute
specifically to compliance activities. Immediate and intermediate compliance outcome measures,
therefore, are important not only as management tools, but because they serve as leading indicators
of important long-term compliance outcomes that are difficult or impossible to measure directly.
Previous work in Australia and elsewhere to measure compliance outcomes in fisheries have had
limited success. This is primarily because the scope of the task was underestimated and because
‘output’ measures that reflect levels of enforcement and compliance assistance were frequently
conflated with ‘outcome’ measures that reflect the effectiveness of those activities. Changes in some
compliance outcome indicators, such as increases in observed rates of noncompliance, are also very
easy to misinterpret and misuse. For example, they could reflect less effective enforcement
providing less deterrence or more effective targeting of enforcement resulting in higher detection.
This difficulty in interpretation makes the development of outcome indicators less popular among
some compliance agencies than simple input and output measures. The goal of this project was to
identify, assess, and compare methods for measuring and interpreting fishery compliance outcomes
Fisheries Research Report [Western Australia] No. 275, 2016 5
that have been employed or proposed for use; and to make recommendations regarding which
methods should be developed and tested to help manage Australian fisheries.
The project was broken into four parts:
1) A review of the literature related to the development and use of compliance outcome
measures, especially in fisheries. Initial stages of this review revealed that there has been
very little research aimed specifically at measuring fishery compliance outcomes, so the
scope was broadened to examine more general measures of fisheries compliance and illegal
catches (section 4.1.2), how regulators outside of fisheries have undertaken the
measurement of compliance outcomes, and of the use of performance-related
management indicators in fisheries. Results of the review are described in section 4.1.3;
2) A national and international survey of fishery enforcement/compliance experts was
undertaken to collect information about types of enforcement and compliance assistance
activities being employed and about current and planned uses of input, output, and
outcome measures. Responses are documented in section 4.2;
3) A workshop of fishery enforcement/compliance experts from multiple fisheries regulation
agencies as well as representatives from the Australian Taxation Office (ATO) and Australian
Crime Commission (ACC) was convened to review, interpret and draw conclusions from the
literature review and survey results, and to assess the pros and cons of methods and best
practices for developing fishery compliance outcome measures, as described in section 4.3;
and
4) Preparation of this final report which we believe provides the most up-to-date and thorough
review that is available of methods to develop fishery compliance outcome, and provides
defensible and documented recommendations for developing and testing them to improve
management of Australian fisheries.
Literature review The literature review investigated the various theories of compliance that have been developed over
the past several decades, and then focused on methodologies that are being used to assess the
effectiveness of compliance programs and measure compliance outcomes. The theoretical research
section described each of the major methodologies and provided one or more examples of how they
have been used.
Peer-reviewed literature provides little guidance on how to implement fisheries compliance
outcome measures and only a few descriptions of suitable fisheries compliance outcome measures
6 Fisheries Research Report [Western Australia] No. 275, 2016
themselves. Most relevant work described in this literature describes attempts at quantifying the
illegal catch – which is one suitable fisheries compliance outcome measure (section 4.1.2).
Outside the published peer-reviewed literature, we found that some agencies, including Fisheries,
have made progress developing compliance outcome measures (section 4.1.3) as part of their risk-
based approaches to service delivery.
The conclusion from the review of methodologies is that because noncompliance is so difficult to
measure, methods used to measure noncompliance and outcomes of activities aimed at reducing
noncompliance produce, at best, indicators rather than measurements. The reliability of these
indicators and the ability to extrapolate from them to assess fishery-wide conditions depend in
critical ways on the quality of the intelligence and compliance data that are available, and the
assumptions behind the research methods used to analyse the data.
Direct observation methods (e.g., those that use enforcement statistics, observed violations or illegal
catches confiscated), without additional analysis, can only measure a portion of the quantities of
catch that are taken or discarded illegally, and can only provide a partial estimate of tonnages of fish
lost to illegal fishing and related impacts and outcomes. Most fisheries compliance programmes can
only provide oversight to a limited number of potential fishing violations. As a result
enforcement/compliance statistics, by themselves, do not often reflect fishery-wide noncompliance.
Survey-based methods (e.g. stakeholder survey techniques and expert judgement) and those that
infer a value or range of values based on analysis (e.g., modelling and subsampling methods such as
use of observer data and use of enforcement statistics) are not constrained in the same way as
observation based methods. However, these methods rely on opinion and subjective judgement
and/or assumptions which means that their accuracy in estimating illegal landings or discarded
catches is only as good as the information that is available to respondents and the validity of the
assumptions that are used.
The literature review continued by examining the steps or phases that are generally followed in the
development of outcome-based compliance indicators (Section 4.1.3). The four phase strategy used
by the ATO and other published studies dealing with the development of performance measurement
come to some different conclusions about the use of observed data versus the results of surveys and
expert opinion. However, the one consistent conclusion presented in these studies is that the
development and implementation of outcomes-based indicators within an organisation needs a
substantial investment in time and commitment by management.
Fisheries Research Report [Western Australia] No. 275, 2016 7
Survey The second part of the project was the survey of fisheries enforcement agencies which resulted in
useful responses from eight regional and national agencies within Australia and five national fishery
agencies outside of Australia. The purpose of the survey was to collect basic information about the
sizes of the agencies and the scopes of their management capabilities and responsibilities, and to
determine their involvement with, and interest in, enforcement performance indicators. The survey
also requested information about input, output and outcome statistics collected and used by the
agencies . The surveys went to only one contact person within each of the organisations canvassed –
in most cases a senior manager in the enforcement agency with many years of experience. The
information provided about agency activities, experiences, and interests by that person was usually
a collated response prepared after consulting with other enforcement/compliance experts within
the agency.
Survey results, not surprisingly, showed that there are generally high numbers of input and output
statistics collected, but substantially fewer attempts to develop outcome measures related to the
success of fishery enforcement and compliance enhancement activities. All respondents to the
survey indicated a keen overall interest in compliance outcome measurement.
Even where outcome measures were being collected, the underlying methodology for developing
them was not always clear. The most commonly collected outcome measures involve estimates of
total violations; the percent of detected violations being prosecuted, or resulting in convictions or
fines; avoidable acquittals; and estimates of levels of illegal harvest. Most respondents noted the
difficulty of developing compliance outcome measures that reflect important long-term impacts on
fish stocks and fishing economies, and some noted the high potential for enforcement and
compliance measures to be misinterpreted and misused.
Workshop The third part of the project, the workshop of fishery enforcement/compliance experts to review
and interpret results from the literature review and survey, was held on Thursday 13 November
2014. The workshop had several purposes. It provided representatives of the fisheries enforcement
community from Australia and New Zealand with an update on the project and ideas on the way
forward. Just as importantly, it gave opportunity for discussion and contribution by the attendees to
relate useful outcome measures or indicators that they are using, or ones that they believe may
have potential for use in the future.
8 Fisheries Research Report [Western Australia] No. 275, 2016
It was acknowledged that there is a need for outcome-based management, and one agency
expanded on their formal directive to implement outcomes and risk-based regulation.
The workshop highlighted the disparate views amongst those present about what the primary
objectives for fisheries compliance actually are. Although operating under a broad umbrella of
ecologically sustainable development, some compliance actions are considered a high priority and
yet have very little to do with sustainability (for example illegally pulling someone else’s lobster
pots). Other high-priority portfolio responsibilities can result in diversion of compliance resources
away from fisheries compliance responsibilities (e.g. emergency response). Sustainable fisheries are
clearly important, but sustainability is part of a competing mix of business, political, social and
ecological priorities which can differ between stakeholders.
These findings tied into presentations at the workshop from representatives of the Australian
Taxation Office and the Australian Crime Commission. These organisations have invested heavily in
trying to develop compliance outcome measures and the presenters gave participants an insight into
the more extensive process that needs to be followed in developing outcome measures in a logical
and structured way. From the workshop it was clear that further, highly structured work needed to
take place if robust, transparent and meaningful compliance outcome measures are to be developed
for Australian fisheries.
Conclusions At the commencement of this project, it was hoped that it would result in practical fishery
compliance outcome indicators being found or a reliable method for estimating them being
developed. The literature review and survey failed to identify useful sets of fishery compliance
outcome indicators, but did identify and clarify the reasons why previous efforts to develop them
have not been successful. The experiences of others who have sought meaningful fishery
compliance outcome indicators is that it is a significant endeavour that must rely on a combination
of survey and interview results as well as analyses of observed data. The most effective focus of
attention and the need for data and stakeholder consultation will not be the same in all fisheries.
Providing specific recommendations about how such an endeavour should be undertaken would
take more than the eight months of our study and the input of a limited number of compliance
experts. It will require engaging stakeholders and upper level fisheries managers and scientists,
pretesting survey and interview protocols, and testing out the collection of new types of data before
they are used to generate results that are suitable for supporting fishery management decisions.
This report recommends a proposed method to begin the process of developing outcome indicators
Fisheries Research Report [Western Australia] No. 275, 2016 9
that will need to be well structured and be supported by fishery managers, but, need not be
particularly expensive, burdensome, or intrusive.
The difficulty of measuring compliance outcomes and extrapolating limited observations or survey
results to assess fishery-wide conditions was a recurrent theme from the literature review and
workshop. Nonetheless, these are activities that need to be undertaken to judge the effectiveness
of compliance assistance programs. As long as the error and sources of inaccuracy in various
compliance-related outcome measures are understood, these measures can be extremely useful for
interpreting differences or changes in ways that can be used to assess past levels of effectiveness
and improve future levels of performance. One important application of compliance performance
measures is in reducing uncertainty in fishery models which, in turn, affects the fishing regulations
that are based on them. For example, deliberate misreporting and falsification of commercial
records regarding amount of catch, fishing effort, species composition of catches, or rates of by-
catch could lead to inaccurate predictions from stock or quota models that are based only on
reported commercial catch data. The degree to which various performance measures may be useful
for making direct adjustments in fishery models is yet to be determined. However, without some
measure of compliance outcomes, it is not possible to assess potential model prediction errors that
are caused by incomplete data regarding illegal harvests, illegal discards, etc.
Summarized below are some of this study’s key findings and recommendations:
• Fishery compliance outcome measures cannot be interpreted without an analysis of how other
factors that affect conditions and behaviour in the fishery are changing. Assigning causality of
compliance outcomes to compliance activities requires examining potential impacts of these
other factors on compliance outcomes.
• Outcome measures are unlikely to entirely replace the traditional use of input and output
measures in assessing Agency performance. Input and Output measures still have a role to play
in giving context to more subtle, and longer term outcome measures and they are also necessary
for operational monitoring of processes within the organisation. Rather, the development of
outcome measures for fisheries compliance will reduce the reliance on output measures which
often do not stand up under close scrutiny to the performance claims that are being made from
them.
• We did not find any evidence that compliance outcome measures are widely used to guide
fishery compliance management decisions, and given the long time lines likely to be associated
with final outcome indicators, they may have limited practicality in some fisheries decision
making processes.
10 Fisheries Research Report [Western Australia] No. 275, 2016
• There is a clear understanding among fisheries compliance agencies within Australia and New
Zealand about the methods that could be used to develop and use compliance outcome
measures. The project also established the types of data that are being collected by fisheries
compliance agencies that are suitable for implementing outcome-based management and the
extent to which these data are being used (i.e., current best practice) to manage and prioritize
compliance activities.
• We find the discipline of fisheries compliance outcome measurement in a fragile state that
needs nurturing and encouraging if it is to reach its potential and develop measures that
withstand scrutiny from all stakeholders and especially from the spotlight of academic
researchers from such disciplines as governance, risk analysis, sociology, criminology and
economics. Until such time as robust fisheries outcome measures are developed, we suggest
that benchmarking agencies against other Fisheries agencies with similar responsibilities will be
necessary, unless the assessors have a detailed understanding of compliance theory. Such
benchmarking could involve comparison of capability and efficiency (e.g. officer powers and
equipment, organisational structures, planning processes, risk assessment methodologies,
specialist capabilities, inspection and detected offence rates) but will almost always be
qualitative in the absence of robust outcome measures.
• Since we have found little in the way of robust, mature fisheries compliance outcome indictors,
we recommend that suites of indicators be used in a ‘weight of evidence’ approach when trying
to assess compliance performance and attribute outcome changes to compliance activities.
• We suggest national and regional fisheries bodies in Australia should work together in
developing fisheries compliance outcome measures that can be used across agencies,
standardised where possible, but that are flexible enough to be customised to the subtly
different organisational requirements and responsibilities of individual agencies. This process
could be facilitated through the use of existing governance structures, like the NFCC.
• Fisheries managers and fishers themselves need to appreciate that different management
strategies often come with different compliance options. Some of these will be much easier to
enforce and measure compliance with than others
• Finally, we recommend that fisheries agencies prepare for the challenges of measuring
compliance outcomes which will almost certainly require structural change within organisations.
KEYWORDS: Australian, fisheries, performance indicators, recreational, commercial, illegal
fishing, non-compliance rates, survey, risk-based regulation.
Fisheries Research Report [Western Australia] No. 275, 2016 11
1 Introduction This eight month project was requested in 2013 by Australia’s National Fisheries Compliance
Committee (NFCC) as a way to provide fisheries compliance groups with improved methods for
measuring and tracking the effectiveness of their activities and for justifying and managing their
budgets. While there have been attempts to undertake similar work previously in Australia (Green
and McKinlay 2009), the earlier efforts failed to produce a completely satisfactory result. The two
main reasons why previous attempts have failed to develop useful compliance outcome measures
are that the scope of the task was underestimated, and the need for output measures of
performance was conflated with the arguably more important, but more challenging need for robust
indicators of compliance outcomes.
Delivering fisheries compliance through enforcement is expensive, especially at sea, rightly making
such programmes subject to intense scrutiny. While there is near universal agreement between
stakeholders that 'good compliance' is an essential component of achieving management objectives,
there are frequent divisions over the strategies for delivery and over how 'good compliance' should
be defined. There are, therefore, inherent latent conflicts between fisheries managers, those
delivering compliance services, the sectors being regulated and treasury or government.
It is clear that without robust measures of compliance outcomes, it is nearly impossible to evaluate
different compliance strategies which can have very different costs. A 'hit-or-miss' approach to
compliance can result, with the implicit risk of either excessive costs to industry or society from
inappropriate or over-servicing, or adverse stock outcomes from illegal fishing caused by inadequate
compliance. Cost is used in a broad sense here to include both monetary and social costs.
As innovative management approaches seek to increase shared responsibility through co-
management of aquatic resources, it becomes even more important to find measures of compliance
outcomes that are acceptable to all the following groups: those seeking to ensure public
accountability (e.g. public sector auditors), third party accreditors of the resource (e.g., Marine
Stewardship Council), fisheries managers (including those tasked with enforcement and education),
commercial, recreational and customary fishers, and non-fishing special interest groups. They must
also be inclusive of, or at least acceptable to, the wider community which may often fund or
subsidise compliance activities.
1.1 What are compliance outcomes? Prior to commencing the project, the experience of the project team indicated that fishery
regulatory agencies routinely use input indicators (e.g., budgets, patrol hours) and output measures
12 Fisheries Research Report [Western Australia] No. 275, 2016
(e.g., number of inspections, numbers of violations detected) to characterize fishery compliance
activities, but rarely use compliance outcome measures (e.g., changes in compliance rates and
resulting impacts in fisheries) for reasons described below in Section 1.3.
Outcome measures are defined as the “determination and evaluation of the results of an activity,
plan, process, or program and their comparison with the intended or projected results”
(Businessdictionary 2014). They are one of several different indicators used in performance
measurement systems (PMSs).
PMSs are described as “evaluating how well organisations are managed and the value they deliver
for customers and other stakeholders” (Moullin 2002). Accordingly, having good and relevant
outcomes is important in contributing to meaningful PMSs because, as noted by (Moullin 2007),
PMSs are in part reflective of how an organisation is managed.
Outside the specialist field of performance measurement systems, there is often a degree of
confusion in the differences between an output and an outcome. Westcott (2008) suggests the main
differences relate to time and measurability. He suggest that outputs are finalised on completion of
the project or activity, whereas outcomes are documented though evaluative actions taken some
time after completion of the project or activity. Both outputs and outcomes should be measurable,
but outputs are generally tangible and therefore easier to measure than outcomes which may be
measured subjectively by approximation (Westcott 2008). Research at the University of Wisconsin
suggests that outcomes are what difference was made, while outputs are what was done (Taylor-
Powell et al. 2003). Although fisheries compliance will always be an ongoing activity and is not
‘finalised’ in the way that a business project can be, the lag between the completion of ‘output’ work
(for instance a compliance inspection) and the eventual outcome of that inspection (a change in
behaviour and work practices) should be clear.
There are three types of environmental outcome measures: immediate, intermediate, and final
(Mazur 2010). In a fisheries context, immediate compliance outcome measures can be based on
extrapolating observed compliance and recidivism rates and quantities of confiscated illegal catches
to reflect conditions in the overall fishery. Intermediate outcomes from compliance activity can be
measured in terms of changes in behaviour that include reductions in noncompliance and reductions
in the quantity of illegally caught and unreported catches. Final compliance outcome measures
involve improvements in fisheries, in the fishing industry and in fish market conditions that result
due to intermediate compliance outcomes. For example, a final outcome measure is the increase in
the biomass of fish that results from reductions in illegal catches. This increase in biomass will grow
Fisheries Research Report [Western Australia] No. 275, 2016 13
and spawn and improve conditions in fisheries and industries and communities that depend on
them.
1.2 What are the functional units that generally make up a fisheries
compliance force? In the process of developing compliance outcomes, it is necessary to consider the variety of
operational activities covered by fisheries enforcement staff. Some of these activities are
undertaken by specialist staff, often siloed within functional units. While functional units and
activities will differ nationally and internationally for different fisheries departments, compliance
outcomes, if they are to be relevant, need to cover the full array of enforcement responsibilities.
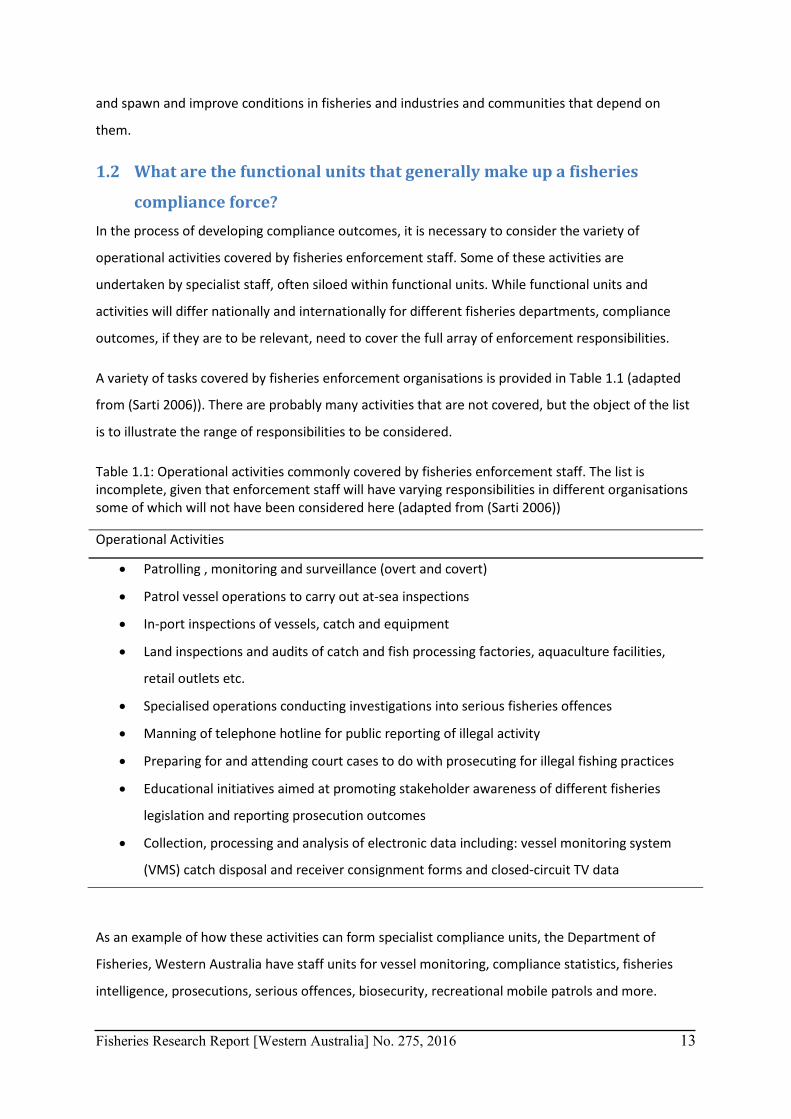
A variety of tasks covered by fisheries enforcement organisations is provided in Table 1.1 (adapted
from (Sarti 2006)). There are probably many activities that are not covered, but the object of the list
is to illustrate the range of responsibilities to be considered.
Table 1.1: Operational activities commonly covered by fisheries enforcement staff. The list is incomplete, given that enforcement staff will have varying responsibilities in different organisations some of which will not have been considered here (adapted from (Sarti 2006))
Operational Activities
• Patrolling , monitoring and surveillance (overt and covert)
• Patrol vessel operations to carry out at-sea inspections
• In-port inspections of vessels, catch and equipment
• Land inspections and audits of catch and fish processing factories, aquaculture facilities,
retail outlets etc.
• Specialised operations conducting investigations into serious fisheries offences
• Manning of telephone hotline for public reporting of illegal activity
• Preparing for and attending court cases to do with prosecuting for illegal fishing practices
• Educational initiatives aimed at promoting stakeholder awareness of different fisheries
legislation and reporting prosecution outcomes
• Collection, processing and analysis of electronic data including: vessel monitoring system
(VMS) catch disposal and receiver consignment forms and closed-circuit TV data
As an example of how these activities can form specialist compliance units, the Department of
Fisheries, Western Australia have staff units for vessel monitoring, compliance statistics, fisheries
intelligence, prosecutions, serious offences, biosecurity, recreational mobile patrols and more.
14 Fisheries Research Report [Western Australia] No. 275, 2016
1.3 What makes developing compliance outcome measures difficult? Compliance activity in each state in Australia is principally governed by Acts of Parliament (Act) that
have adopted the concept of Ecologically Sustainable Development (ESD) as their objective.
Ecologically Sustainable Development is defined in Australia as: 'using, conserving and enhancing the
community's resources so that ecological processes, on which life depends, are maintained, and the
total quality of life, now and in the future, can be increased' (National Strategy for Ecologically
Sustainable Development 1992). Each law, regulation and condition is typically prepared with the
object of the Act in mind.
But further to this, each state Act contains a variety of additional objectives which frame the context
of compliance, rules, regulations and activities. Some common elements include:
• Promotion of viable commercial and aquaculture industries
• Maximizing net economic returns to the Australian community from the management of
Australian fisheries
• Equitable access to aquatic resources that achieves optimum utilisation
• Protection and Conservation of fisheries resources, habitats and ecosystems
• Conducting aquatic resource management in an efficient and cost effective manner, setting
targets for the recovery of management costs
This breadth of operating scope provides significant complexity for defining compliance outcomes,
especially when stakeholders’ views can be diametrically opposed. Further to this complexity, the
notion of successful compliance outcomes is entwined with timely and accurate resource
management decisions which include scientific assessments, regulation, licence conditions and
policy. Successful compliance outcomes are often viewed in the expected light of ESD, and as such,
are only as good as the resource management framework provided to govern the utilisation of fully
exploited aquatic resources.
The object of each Act, stakeholder diversity and complex operating scope, are significant factors
that challenge the definitions of compliance outcomes that will withstand stakeholder scrutiny.
As has been shown, fisheries compliance responsibilities cover a wide range of activities and deliver
service to an array of different stakeholder groups. The starting point when measuring the
performance of fisheries compliance against these activities is, as in most other professions, to use
output measures. The benefit of output measures is that they are easy to collect and display, but
their downside is that they are extremely unlikely to allow rigorous analysis of the extent to which a
program has achieved its goals in the way that should be possible from outcome measures.
Fisheries Research Report [Western Australia] No. 275, 2016 15
Typical output measures for fisheries enforcement include: field contacts by fisheries officers,
number of vessels checked, proportion of the total catch inspected. In the case of the Western
Australian Fisheries Department, as with many other fisheries departments, these figures are
regularly collected (Green and McKinlay 2009) and subsets are published annually (see Department
of Fisheries 2010; 2011). As a measure of performance for accountability purposes, these statistics
have their place; however, because of their focus on illegal fishing, they fail to adequately pick up on
other aspects of fisheries enforcement activity, such as the prevention of criminal offences occurring
in the first place. Measuring outputs can also result in unforeseen consequences, such as an
organisation’s activities focussing on ‘easy’ performance targets which give a false sense of efficiency
without being effective in achieving their goal. The fundamental problem with measures such as
these is that they say nothing about whether the activities were the right ones to undertake to
achieve the organisations strategic goals.
There are four reasons why developing good measures of these outcomes for compliance activities
is complicated.
(1) Compliance outcomes in fisheries (e.g., reductions in illegal fishing and resulting improvements
in fisheries) can reflect changes in conditions at sea or changes in illegal fish being landed,
which are both difficult to measure.
(2) These outcomes, even when they can be measured, are difficult to causally attribute to
compliance activities without assessing them within the context of other changes in the fishery
(Sparrow, 2008).
(3) Compliance outcomes are often “counterfactual”; they involve behaviour that did not take
place (e.g., reduction in illegal fishing) that would have taken place in the absence of
compliance activity.
(4) Compliance outcomes are confounded by detection and effort bias issues which are often not
accounted for when reporting or evaluating data.
Increases in observed compliance rates, for example, may reflect more effective enforcement
detecting more violations, less effective enforcement deterring fewer violations, the result of poor
fishing conditions, or more effective enforcement in other fishing areas resulting in more illegal
fishing relocating to the area. Changes in fishery and seafood market conditions that could also be
viewed as compliance outcome measures are also influenced by many factors other than
enforcement/compliance activities, including changes in weather, ocean, market, and political
conditions.
16 Fisheries Research Report [Western Australia] No. 275, 2016
Finally, all compliance problems may involve ‘invisible’ harms and/or active opponents. Invisible
harms are those which are difficult to quantify to those who have an interest in them because they
have low reporting or detection rates. Active opponents monitor regulatory intent and consciously
alter their behaviour to subvert it. These sorts of problems are inherently difficult to measure or
understand (Sparrow, 2008).
2 Objectives 1. A desktop study of methodologies and/or assessment and reporting frameworks, both nationally
and internationally, that assess the effectiveness of compliance programmes and measure
compliance outcomes.
2. A workshop to review the findings of the desktop study and seek further expert input on
measuring fisheries compliance effectiveness.
3. Write up of results of the desktop study and workshop with a view to documenting current best-
practice, determining the way forward and possible future work.
3 Methods
3.1 Literature review: methodologies to assess effectiveness of
compliance programs and measure compliance outcomes The literature review examined research dealing with the development and use of performance and
outcome measures related to environmental enforcement and assisted compliance, with a focus on
fisheries. Particular emphasis was placed on identifying what has been published in peer-reviewed
literature on the development and use of outcome indicators. The review also covered published
and publicly available documents and, to the extent possible, unpublished documents and internal
reviews that were available from fishery and environmental enforcement offices outside of
Australia.
The literature review quickly showed that measures of fisheries conditions and outcomes are
affected by many factors besides compliance and that there are many confounding factors that can
drive indicator measures in either direction, making attribution of a good outcome to the efforts of
compliance very difficult. There was also a significant lack of published literature relating to the
development and use of compliance outcome measures. Consequently, the literature review was
broadened beyond studies of compliance outcomes to examine the development and use of
Fisheries Research Report [Western Australia] No. 275, 2016 17
indicators that combine measures of changing compliance inputs and outputs and other factors to
determine the relative influence of compliance activities on particular outcomes.
The literature review is divided into four parts. Each addressed separate areas of research that
contribute to an understanding of how fishery compliance outcomes should be measured and
interpreted in different types of fisheries based on what is known about how noncompliant
behaviour is likely to be affected by compliance activities aimed at detecting and prosecuting
violators and compliance activities aimed at encouraging compliance.
The first part of the literature review (Section 4.1.1) included an examination of four general
theories of compliance that tend to be reflected in the types of compliance activities employed in
various fisheries. The types of target outcomes and related outcome measures will differ from
fishery to fishery depending on which compliance theory seems to form the basis of compliance
strategies and activities which, in turn, tend to reflect differences in the factors that are thought to
influence noncompliance and regulatory decisions that are aimed at affecting them.
The second part of the review (Section 4.1.2) focused on specific methods that have been used to
collect data, perform shore-based and at-sea inspections, monitor fishing activity, and conduct
surveys in order to provide a quantitative basis for developing and interpreting fishery compliance
outcome measures. This part of the review provides a basis for determining which combinations of
tools and sources of data can be used to measure compliance, confirm or support the accuracy and
validity of those measurements, and help attribute changes in these measurements to compliance
activities.
Part three of the review (Section 4.1.3) dealt with specific examples and case studies of attempts to
develop and use fishery compliance outcome measures. The reason for this focus was that good
information on non-compliance and illegal catch would make ideal outcome indicators (indeed as
will be seen later into this document, many agencies claim to use this information for that purpose).
It was therefore considered worthwhile to examine what methods are available and whether their
level of accuracy makes them suitable as indicators. This included a review of specific applications
within Australia and elsewhere, and a review of related studies undertaken recently by others.
The final part of the review (Section 4.1.4) focused on the development of indicators in general,
guidance that has been developed to develop regulatory performance indicators, and studies that
have focused specifically on the special problems associated with developing and justifying the
accuracy of compliance outcome measures in fisheries.
18 Fisheries Research Report [Western Australia] No. 275, 2016
3.2 Survey on aspects relating to output and outcome indicators collected
by a limited sample of fisheries compliance agencies The object of this survey was to get basic information on the size of the agencies and the scope of
their management capabilities and responsibilities and to explore their interest/involvement in
fisheries compliance outcome indicators.
An electronic survey was dispatched to a selected group of fisheries compliance agencies, both
national and international. Within Australia, all fisheries compliance agencies were canvassed. In the
case of the international agencies that we selected to survey, our targets were developed countries,
comparable with Australian enforcement agencies. A list of contact persons was provided by the
secretariat of the IMCS network (http://www.imcsnet.org), an International Monitoring, Control and
Surveillance (MCS) Network for Fisheries-related Activities. In some cases, the initial contact point
led to referrals to other people within the agency.
Once a list of contact names and e-mail addresses had been compiled, those organisations/people
were sent a “warm-up” letter explaining the reason for the survey, what it hoped to achieve and to
generally prime them for receipt of the survey.
The survey went to only one person in each organisation canvassed – in most cases a senior
manager in the enforcement agency with many years of experience. In some cases the opinions of
other areas of an agency were provided through the single respondent, but the information
provided by that person on their organisation is a personal opinion. Their responses have been
collated together with other recipients. A copy of the survey form is shown in Appendix E.
3.3 Workshop to review findings of the desktop study and add expert
input This workshop was held on Thursday 13 November 2014 at the Metropole Hotel, Melbourne,
Victoria. On the following day, a post-workshop wrap-up was held with a small subset of
participants.
The workshop provided an opportunity for the project team to explain the findings of the survey and
literature review to a broad audience of compliance experts and get their insights about how they
should be interpreted. Each attending agency presented a short summary of their experiences with
outcome measures within their agency while experts from outside of fisheries compliance identified
through the literature phase of the project were invited to speak on their experiences with outcome
measures.
Fisheries Research Report [Western Australia] No. 275, 2016 19
Finally, the workshop provided an opportunity for a broad audience of compliance experts to
highlight differing viewpoints, debate the challenges and opportunities, and discuss possible next
steps.
4 Results/Discussion
4.1 Literature review: methodologies to assess effectiveness of
compliance programs and measure compliance outcomes The development of outcome indicators in the public sector has been a focus of activity for well over
two decades. This form of business planning has been particularly active in government departments
such as treasury, health, education and police, and a large amount of literature is available
documenting developments in those areas both locally and internationally (Dadds and Scheide 2000;
United Nations Development Program 2009; Alach and Crous 2012). The same is not true for
fisheries and in particular for fisheries compliance.
The need for indicators of performance measurement to be developed for environmental
compliance practitioners has not been unnoticed. The International Network for Environmental
Compliance and Enforcement (INECE) first proposed a compliance and enforcement indicator project
at the 6th International Conference of that organisation in 2002. Since then, papers dealing with this
subject have been presented at periodic international conferences held by INECE (e.g., the
presentations available at http://inece.org/resource/inece-conference-proceedings-directory/), and
the organisation has produced a guide on the subject (INECE 2008) specifically for compliance and
enforcement practitioners.
While the INECE (2008) guide is a useful and relevant document, it is aimed at the broadest sense of
environmental compliance (typically water, air and soil pollution) rather than specifically fisheries
compliance and enforcement. Some of the criminal elements are similar, in that both fisheries and
environmental pollution involve the offenders either undertaking illegal activities or failing to
adequately report them. The difference is that illegal fishing, like the illegal exploitation of forest and
wildlife resources, can involve a product that gets on-sold. This makes the law enforcement of
fisheries and other fauna and flora products to be more akin to theft and drug trafficking, in that
there are generally accomplices involved in obtaining and distributing the product, as well as
informed or unwitting purchasers of the merchandise. Fisheries crime differs again from many other
forms of crime, in that the product’s value is in consumption, which usually destroys all traces of the
product’s existence – unlike say a stolen motor vehicle or a ‘trophy’ species of wildlife. This
20 Fisheries Research Report [Western Australia] No. 275, 2016
difference is relevant when reviewing indicators of performance and the development of outcomes
across different professions. The INECE (2008) guide also addresses performance-based
management in its broadest context, covering both input and output indicators and while it is to be
lauded for addressing outcome indicators, it does not provide a definitive reference source for them.
In fact, after failing to find any published literature devoted solely to the challenge of measuring
fisheries compliance outcomes we were forced to broaden our focus to consider similar efforts
outside of fisheries.
Since the principal function of a law enforcement branch of any fisheries agency is the observance of
laws surrounding the harvesting of aquatic fauna and sometimes flora, some method of measuring
the levels of compliance with those laws is needed. Such measurements would ideally be based on
data gathered independently of those undertaking the law enforcement role and involve an
appropriate sampling regime. That could be achieved directly, (for example, by surveying
stakeholders about their perception of the rate of success achieved by enforcement staff in
apprehending illegal fishing activity), or it could be achieved indirectly (such as by estimating the
quantity or value of seafood harvested illegally using stock assessment methods).
This review summarises the literature relating to methods used to establish and measure fishing
non-compliance and assess the scale of illegal activities. The documentation of the literature search
is by no means exhaustive. The object has been to consider a range of methods and to provide just a
few published studies documenting their application of the techniques. In the discussion of each and
the Table that follows (Table 4.1), we have attempted to document some of the main advantages
and disadvantages of the different methods in terms of their simplicity and accuracy.
It needs to be made clear at the outset, that assessing the scale of illegal fisheries activity with any
accuracy is made difficult by a number of factors:
• There is a confounding of prevalence and detection (discovery rate) – that is, it is generally
unknown whether observed increases in crime (prevalence) are due to a real increase or an
increase in ‘discovering’ the crime (detection probability), or vice versa (Sparrow 2000; 2008);
• So-called invisible ‘harms’ and active opponents (Sparrow, 2008). The effect of illegal fishing,
unless it is at very high levels, is not usually obvious or measurable from biological
measurements or intermittent surveillance. Most serious illegal fishers employ counter-
surveillance to ensure they are compliant when, or if, inspected;
• Many of the procedures used to estimate illegal fishing have significant assumptions behind the
methods;
Fisheries Research Report [Western Australia] No. 275, 2016 21
• The opportunities for offending are far greater than the likelihood of being detected; and
• The need to tease apart environmental and biological influences from human influences.
Compliance Theory 4.1.1
Public policy literature includes four general theories of compliance:
1. The Conventional Theory of Compliance – a purely economic theory under which a fisher’s
decision to comply or not is based purely on short-term self-interest (Becker 1968).
2. The Enriched Theory of Compliance – based primarily on sociology and assumes that
normative factors, such as respect for the law and peer pressure, also affect compliance
decisions (Kuperan and Sutinen 1998 and Nøstbakken 2008).
3. The Cumulative Prospect Theory – based on psychology and individual perceptions of risk
and has been used to challenge conventional theories of compliance that are based on
economic and sociological considerations (Tversky and Kahneman 1992).
4. The Socio-ecological Theory of Compliance – based on research stemming from
observations that in some situations, acceptable compliance outcomes can be achieved by
encouraging and supporting a sense of community and individual involvement in collective
management for the overall good of a social group (Ostrom 1990 and Ostrom 2009).
Each theory was developed by Nobel Prize winning economists and social science researchers, and
each could form the conceptual basis for developing fishery compliance outcome measures in some
fisheries. Choosing which theory or mix of theories and related outcome measures to use depends in
critical ways on research to determine if and when decisions to comply or not with fishing
regulations are influenced purely by economic considerations, by economic and normative
influences, by fear of penalties, or by a sense of what is in the best interest of some particular social
group. Each theory and its potential influence on the development of fishery compliance outcome
measures is summarized below.
Conventional Theory of Compliance 4.1.1.1
This theory focuses on economic incentives and how potential violators compare the relative costs
and benefits of violating the law (Becker 1968). In fisheries, this implies that fishers will compare
expected increases in earnings (commercial) or enjoyment (recreational) from fishing illegally with
the potential costs, where potential costs are based on their assessment of the probability of their
illegal fishing being detected and prosecuted and the size of the expected penalty. This is the basis of
the classic “deterrence model” developed by Becker (who won the Nobel Prize in economics in
1992). The theory has been the basis for developing fishery enforcement and compliance indicators
in many fisheries (Sutinen and Kuperan 1999, King and Sutinen 2010). Intermediate compliance
22 Fisheries Research Report [Western Australia] No. 275, 2016
outcomes under this theory would be based strictly on measures of deterrence (e.g., the probability
of detection and prosecution, levels of fines, etc.).
We were provided with anecdotal evidence of minor offending being actively enjoyed in the past by
licenced commercial lobster fishers in WA as a ‘game’ played against Fisheries inspectors.
Commercial fishers are in a position to test the probability of detection by consigning very small
numbers of sub-legal sized lobsters in their catch, knowing that the offence if these animals are
detected carries a simple, small monetary penalty if the fishers opt not to contest it. The fishers, on
receiving the infringement notice after having this practice detected, have been known to contact
the issuing officer and jovially allude to other occasions they have consigned illegal animals without
being caught. With typical inspection coverage of 3% to 7% of the total number of consignments,
the cost of non-compliance can be rationally offset against the so-called ‘bait money’ that can be
gained from the practice (T. Green, personal communication).
Enriched Theory of Compliance 4.1.1.2
The “enriched” theory of compliance includes the economic incentives specified in the conventional
theory of compliance plus “normative” factors that are associated with moral convictions, peer
pressure, attitudes regarding the legitimacy and fairness of regulations, and other factors that result
in most individuals complying with regulations even though there are economic gains from not
complying.
It was developed and applied in fisheries by Kuperan and Sutinen (1998) and Nostbakken (2008) to
explain why many fishers act “irrationally” in purely economic terms by complying with fishing
regulations even though it is not in their self-interest. This theory can be used as a basis for
comparing measures of compliance outcomes based on “harder” deterrent-based approaches to
compliance with those of “softer” approaches that are based on measures of improved relationships
between fishers, regulators, and enforcement staff, and community or industry contacts by
regulators to explain regulations and promote compliance.
Cumulative Prospect Theory 4.1.1.3
Prospect theory was developed in the late 1970s by Tversky and Kahneman (1992) to explain
seemingly illogical outcomes that are observed because individuals make decisions based on
perceived risks, not strict comparisons of potential gains and losses, and prefer avoiding risks of loss
more than they prefer taking a chance on achieving gain. This theory is based on observations of a
very strong and widespread “cognitive tendency to over-weight extreme possibilities.” In fisheries,
this theory is likely to support compliance activities and outcome measures that involve increasing
perceptions of significant risks associated with noncompliance (i.e., increasing risk of loss). However,
Fisheries Research Report [Western Australia] No. 275, 2016 23
the theory is also likely to become more relevant in fisheries where declines in fish abundance and
associated reductions in the legal allowable harvest impose extreme risks of economic hardship on
fishers and their families and communities if they decide to comply with fishing regulations. The risk
of experiencing economic losses by complying with increasingly stringent fishing regulations may be
perceived as being far more significant than the perceived risk of being detected to be out of
compliance.
Socio-Ecological Compliance Theory 4.1.1.4
This modern theory of compliance extends the “enriched” theory of compliance to consider how
individuals in some situations can be motivated by public policies to work together, even outside of a
regulatory context, to take action that maximizes the welfare of social groups. It was developed
specifically to address perceived inadequacies in how conventional compliance theories have been
used to guide collective management of common property resources, such as fisheries, and won
Elinor Ostrom the Nobel Prize in Economics in 2009 (Ostrom 1990, 2009). This theory is based on
observations in fisheries and other natural resource systems that individuals “have a more complex
motivational structure and more capacity to solve social dilemmas than posited in earlier rational-
choice theory.”
Based on this theory, individuals (e.g., fishers) may make decisions to comply or not based on their
assessment of how it will affect the welfare of social groups (e.g., fishing communities) and their
sustained acceptance and reputations within these groups. According to this theory, positive
compliance outcomes in fisheries would include the results of institutional activities that promote
“innovativeness, learning, adapting, trustworthiness, levels of cooperation of participants and the
achievement of more effective, equitable, and sustainable outcomes at multiple scales.”
Additionally, this theory suggests that there are situations where traditional fishery management
approaches (i.e., having regulators and a regulated community) may be counter-productive
regardless of what compliance strategy is employed because they inhibit communities from
establishing relationships that allow self-regulation of fisheries (Ostrom 2007). This theory is highly
relevant to situations where co-management is being contemplated.
Criminology and Social Science 4.1.1.5
It is important to acknowledge the decades of academic study that have gone into the field of
Criminology and social science more generally and it is impossible to do them justice in a preliminary
study such as this. Our observation is that there seems to have been little influence from modern
criminological theories on mainstream fisheries management. There is certainly some published
literature directly relevant to fisheries, e.g.: Tailby and Gant (2002), Gezelius (2003), Putt and
24 Fisheries Research Report [Western Australia] No. 275, 2016
Anderson (2007), Hauck (2008), Gezelius and Hauck (2011) but even in the wider field of
environmental crime, Bricknell (2010) points out that environmental crime has for the most part
been somewhat overlooked in Australia, receiving, at best, episodic attention in the published
literature. There is clear evidence for very serious crimes being committed in a fisheries context,
both in the multitude of more serious crimes prosecuted by fisheries compliance agencies and, at
the more extreme end of the scale, highlighted in reports such as Transnational Organized Crime in
the Fishing Industry (United Nations Office on Drugs and Crime 2011). The attractiveness of fishing
to organised crime has also been regularly identified by fisheries compliance groups.
Perhaps one reason for the relative scarcity of work in this area is that there is often a desire to react
to illegal activity without understanding the behaviour that drives it. Criminologists and other social
scientists are interested in questions such as: What is driving behaviour, are current laws legitimate
and effective, what regulatory measures are having an impact on fishers’ decision-making? And
importantly, ask ‘what governance measures need to be put in place to enhance compliance?’ – as
opposed to – ‘how do we enforce laws better?’. This kind of different perspective on the needed
research may not be seen favourably when there is a perceived urgent need to ‘do something about
illegal fishing’ and a desire to use traditional enforcement metrics (arrests, prosecutions and
infringements) as a means of measuring compliance.
In general, ecological crime has only received increased attention in the criminological field over the
past two decades, with areas of study that have been termed ‘green criminology’ and ‘conservation
criminology’ to name a few. It would be beneficial to provide opportunities to conduct fisheries
specific research in partnership between government institutions and criminologists. Many
criminologists and sociologists clearly have the research skills and methodology, as well as
theoretical perspectives, to make a positive contribution.
It is the opinion of the project team that the field of Criminology could contribute to fisheries
compliance in the areas of crime reporting, measuring non-compliance, understanding motivations
for fisher behaviour and identifying strategies to enhance compliance and opportunities for
collaboration should be actively pursued.
Theory put into Practice 4.1.1.6
As a practical matter, the theories described above are used in various fishery management
situations to support arguments for and against shifting public resources from efforts to achieve
acceptable levels of compliance in three ways:
Fisheries Research Report [Western Australia] No. 275, 2016 25
1. By encouraging compliance – through education, outreach, and establishing
scientifically credible and understandable fishing regulations that are administered
fairly and equitably.
2. By monitoring and responding to non-compliance – through regular, random and
targeted inspections of landings and related logbooks and receipts, conducting shore-
based and at-sea patrols, and information and intelligence gathering and by dealing
with detected violations, imposing penalties that are certain and meaningful.
3. By deterring noncompliance – through publicising compliance capability, significant
detected offences and the penalties for noncompliance.
In fisheries or communities where it is can be assumed that compliance decisions are based purely
on economic self-interest, it is reasonable to focus on intermediate compliance outcomes related
only to (2) and (3). In fisheries where it is reasonable to assume that normative factors are also
important, it is reasonable to also focus on compliance outcomes related to (1).
The review of the theoretical compliance literature suggests that compliance outcome measures
may differ from fishery to fishery based on the management framework employed, the availability of
data and intelligence, the extent of noncompliance problems, and the causes of noncompliance.
Development of Outcome Indicators 4.1.1.7
The development of outcome indicators to illustrate, trace, and measure the payoffs from the use of
tax dollars by the public sector has been a focus of dedicated research for well over two decades. A
professor at the Harvard School of Public policy organized the results of this research in a popular
public policy text titled “Creating Public Value” (Moore 1995). That book helped focus attention on
ways that government agencies can use performance-based management tools similar to those
being developed and used by businesses even though conventional measures of returns on
investment (ROI) and benefit cost analysis (BCA) would not be possible. In 2013, Moore published a
companion textbook titled “Recognizing Public Value” which focused directly on methods of
measuring and tracing the value of public investments. This text included a set of case studies
showing how outcome measures related to public sector investment decisions can be used internally
by government agencies to improve and help prioritize public investments, and externally by
reviewers and auditors to assess and compare agency decisions (Moore 2013). Moore advances the
idea of a public value scorecard, balanced and representative of an agency’s work across its entire
range of responsibilities. Case studies are used to show that bad outcomes result from agencies
focussing narrowly on one or two ‘high priority’ areas and so fail to spread their performance
reporting across their entire range of responsibilities.
26 Fisheries Research Report [Western Australia] No. 275, 2016
A chapter of Moore’s 2013 book deals specifically with “bottom line” and “public value account”
information related to the outcomes of policing and identifies seven “dimensions of public value in
policing.” These include: reduce crime; call offenders to account; reduce fear; ensure civility; fair,
effective and efficient use of force and authority; fair, effective, and efficient use of financial
resources; and customer satisfaction. Priority investments in policing information were identified
that draw on three sources of data: administrative records, surveys, and programmatic initiatives.
These included measures of reported crime rates, arrest rates, response times, repeat offenders,
expenditures per capita, numbers of sworn officers, civilian complaints, civilian casualties, number of
calls, and people cited or arrested. Investments in policing information that can be used to show
changes in measures of these factors were recommended as a way to measure the “public value” of
policing.
These broad concepts are ones that could potentially be applied to fisheries compliance outcomes,
something that will be discussed in more detail in section 4.1.3.
Methods to measure fishing non-compliance and illegal activity 4.1.2
The above-mentioned literature related to measuring outcomes from “policing” recommend that
investments be made in maintaining and using data from both administrative records and surveys.
These same two sources of data can be used to measure outcomes of enforcement and compliance
support activities in fisheries. However, there are many reasons why collecting and interpreting
these types of data are more difficult in the case of fisheries. For example, violations of fishing
regulations often take place offshore where there are no witnesses or victims to report violations,
and few opportunities for enforcement agents to detect them. Additionally, the public value from
improving compliance in fisheries is associated with improvements in fisheries that are more difficult
to directly measure or attribute to compliance activities than the outcomes of more traditional
“policing” which include reductions in reports of robberies, violence, and street crime. This section
describes methods that are being used to collect fishery-related data that may be used directly or
indirectly to measure and trace the outcomes of fishery compliance activities. The information has
been drawn from peer-reviewed literature wherever possible.
Stakeholder surveys 4.1.2.1
Many empirical studies (Sutinen et al. 1990; Furlong 1991; Akpalu 2008) have utilised stakeholder
surveys for at least one of the data streams used in estimating illegal fishing activity to reduce
reliance on official statistics as a measure of illegal fishing activity (i.e. numbers of apprehensions,
warnings, convictions etc.), which are so fundamentally driven by the amount of enforcement effort
and its capability and expertise. There are several different stakeholder groups that can be surveyed,
Fisheries Research Report [Western Australia] No. 275, 2016 27
and since in many cases the questions asked in the survey are for an opinion (e.g. “what is the extent
of illegal activity in the fleet?” or “what do you consider the probability of being caught and
prosecuted for a particular crime?”), the answers are likely to vary according to whether the group
being surveyed are fishermen, managers, compliance staff, or from some other background. While
not being an accurate measure, it is generally accepted that surveys of one or more stakeholder
groups could at least provide an indication of the extent of noncompliance. If repeated at intervals,
surveys could provide trends in noncompliance which could be benchmarked against other
independent measures.
For instance, King and Sutinen (2010) used National Oceanic and Atmospheric Administration
(NOAA) official statistics for the North Eastern Groundfish Fishery over a five year period to estimate
the percentage of detected violations that result in a penalty, and survey estimates from fishermen
and enforcement staff to estimate the likelihood of a violation being detected.
Surveys that ask stakeholders to estimate fishery characteristics such as the extent of
noncompliance, or the percentage of fishers who occasionally violate laws compared with those that
routinely do so are prone to considerable uncertainty. For example in King and Sutinen’s (2010)
survey, fishermen estimated noncompliance rates to be approximately half of those estimated by
enforcement officers (12.5% compared with 24.4%). Even within a stakeholder group there is a wide
range of opinion, for example, in the survey of Sutinen et al. (1990), commercial fishermen
estimated that 10-24%, 25-49% and 10-24% of fishermen in the Southern New England, Georges
Bank and Gulf of Maine fisheries, respectively, were frequently violating conservation regulations. It
is clear, therefore, that while these types of surveys may provide useful indices that can be tracked
over time, their use for anything more rigorous is probably limited.
In another study, of the United States Coast Guard (USCG), (Palin et al. 2012), the authors
acknowledge that “Metrics such as probability of detection, levels of penalties, and anticipated gains
may be easier to quantify than legitimacy, morality, justice, social pressure, equity, and behaviour of
others…Thus defining and quantifying observed metrics (or indicators) remains a challenge.” The
study includes a list of fifteen survey questions that can be used to assess and compare changes in
stakeholder perceptions of compliance factors that cannot be observed directly, such as legitimacy
and behaviour of others. Changes in answers to these questions can be treated as intermediate
outcome measures that may be linked to specific compliance activities.
28 Fisheries Research Report [Western Australia] No. 275, 2016
Surveys of opinion seeking to establish the extent of a practice, or the frequency of its occurrence,
will miss illegal activity if the response group is unaware of its occurrence, or if the activity is
deliberately hidden from them, as will be the case for most serious fisheries crimes.
(Blank and Gavin 2009) have attempted to minimise the biases associated with methodologies that
measure noncompliance rates by using a randomised response technique (RRT) to estimate
noncompliance in the Northern Californian recreational fishery for red abalone (Haliotis rufescens).
RRTs are considered to be a more reliable estimator of sensitive behaviour than conventional survey
and interview methods because the technique minimises evasive answer (i.e. incorrect or no answer
at all) bias (Warner 1965; Horvitz et al. 1976). There are disadvantages with RRTs. It is
acknowledged by Blank and Gavin (2009) that there are always likely to be survey participants that
give evasive responses regardless of the survey method used and that therefore RRTs are likely to
still be underestimates of noncompliant behaviour, albeit better than conventional surveys.
Creel surveys as well as dock-side and roadblock interviews of fishermen have been used in
numerous studies for measuring noncompliance rates (Martin 1995; Wilberg 2009). Water-side
surveys (or inspections) can only provide estimates of certain types of illegal activity revealed by the
inspection at the time, such as licence, bag and size limit offences. On-water offences such as fishing
in closed waters, gear-related offences etc. cannot be estimated using land-based surveys.
However, as has already been discussed, fishermen do not generally cooperate well with surveys if
they are involved in illegal activity, and results are therefore prone to varying degrees of bias. Any
data on noncompliance gathered by creel-surveys will be an underestimate for anything other than
ignorance of the law unless you grant statutory powers to search fishers to those undertaking the
surveys. The Occupational Health and Safety risks, costs, training implications and reputational risks
of doing this may be significant, but it would be possible to undertake such surveys using staff with
the necessary powers if getting a measure of illegal catch was deemed to have a high enough
priority.
In WA, the possibility of using formal inspections to complement creel surveys in order to determine
the quantity of illegally caught recreational lobster catch was discussed as long ago as 1978
(Department of Fisheries and Wildlife, WA, 1978).
One method that is commonly used to increase the numbers of interviewees from populations that
are difficult to sample, such as criminal elements, is through the use of snowball sampling. The
method relies on subjects nominating other potential participants to be surveyed. The main
advantage of the method is that it can quickly build up a group of potential survey respondents
Fisheries Research Report [Western Australia] No. 275, 2016 29
through this process of referral. However, one obvious disadvantage of this approach is the potential
for introducing biases because of the non-random process of selecting survey participants. It is most
useful when the potential for harm is very great, but from a small number of hard to identify people.
The technique will give useful information about the problem, but is unlikely to give reliable
indications of the scale of the problem.
Expert judgement 4.1.2.2
A different approach (Pitcher et al. 2002; Agnew et al. 2009) has been to adjust reported catches
over different time periods according to management changes that might have influenced incentives
or disincentives to misreport catches in the fishery. Values (termed influence values or influence
incentives) are assigned to indicate the incentive to misreport catch in each time period. Estimates
of the level of illegal fishing in the different fisheries under consideration are then established from
surveillance data, trade data, fishery independent survey data and expert opinion, and these
estimates are used as ‘anchor points’ for each incentive rating. These figures are then used to
estimate the total catch over time for the fishery in question. Monte Carlo simulation techniques are
applied to address uncertainty and provide upper and lower estimates of total misreporting over the
different time periods being assessed.
The method is acknowledged in Pitcher et al. (2002) to be subjective, particularly in assigning values
to the influence factors. In the fisheries they examined, there were periods when the influence
factors did not agree with the anchor points. That required a decision to be made as to the reliability
of the anchor points and depending on that, to select whether or not to modify the influence factors
over the time period under consideration.
Ainsworth and Pitcher (2005) used a modified version of the above method to provide estimates of
IUU catches made by the salmon and groundfish fleets in British Columbia between 1950 and 2003.
Instead of using a single quantity that represents IUU catch, their modified method has considered
the illegal, unreported and unregulated components of IUU separately, before combining them later
in the analysis to provide an estimated sum of IUU. These authors have also introduced a more
precise method of assigning influence factors. The overall result is considered by Ainsworth and
Pitcher (2005) to produce a more accurate estimate of the rate of misreporting.
Mark-recapture sampling 4.1.2.3
The use of tags holds several possibilities for detecting illegal activity. Tags, whether they be
commercially manufactured items or simply some physical alteration made to an appendage on the
animal, provide a very commonly used method for detecting offences such as the illegal hauling of
lobster pots belonging to one fisherman by another. In cases, where someone is suspected of this
30 Fisheries Research Report [Western Australia] No. 275, 2016
activity, the pots of other fishers are seeded with tagged lobsters that are readily recognisable by
enforcement officials. The catch of the fisherman suspected of stealing from others is monitored for
the tagged animals, and if found, follow up of the offence is a relatively simple matter.
Obviously when there is a possibility that tagged fish may be cooked or eaten without the tag being
removed first, the tag must satisfy stringent consumer safety standards which impact on the
materials and technologies suitable for tag use.
Tags have also been used in an indirect way for determining noncompliance rates of size regulations
(minimum, maximum, slot length) by fishermen (Pierce and Tomcko 1998; Henderson and Fabrizio
2013). These authors used the predicted sizes at recapture of previously tagged fish, to gain insight
into the compliance levels of anglers and how that related to management measures in the fishery
which changed over the duration (Henderson and Fabrizio 2013) or a few years prior (Pierce and
Tomcko 1998) to their studies.
As with other methods, conclusions about noncompliance rates based on the predicted sizes of
tagged fish at recapture can be prone to numerous biases. Anglers who were consciously violating
the law would most likely not be returning their tags, biasing compliance rates upwards. Conversely,
a far greater proportion of the fish tagged in the Henderson and Fabrizio (2013) study were under-
size than legal sized, which has led them to believe that compliance estimates of the sublegal
proportion of fish harvested in their study was negatively biased.
Radio Frequency Identification (RFID) systems have potential for use in fisheries compliance work,
but at the moment, most interest seems to be focussed on their potential for reducing the
mislabelling of seafood products. In the food industry, the misnaming of fish products is generally
designed to confuse, and misnaming can do this from the point at which the fish is captured, all the
way through to the point that it lands up on the plate of consumers in a restaurant. From an
enforcement perspective, this is of concern because illegal product can be passed off as legitimate.
The extent of mislabelling is widespread; for example, the United States imports 80% of all fish
consumed in the country and of those imports, one third are believed to be mislabelled (Jacquet and
Pauly 2008).
The need to address mislabelling is receiving increasing attention at the government and industry
level, but also at the retailer and consumer level as Eco labelling becomes more widespread. The
Marine Stewardship Council is one of the forerunners in this space. They have implemented a Chain
of Custody Certification standard that is aimed at ensuring that the origin of seafood can be traced
through the supply chain.
Fisheries Research Report [Western Australia] No. 275, 2016 31
Food Innovation Partners and Allan Bremner & Associates (2007) have reviewed traceability systems
from paper-based through to Radio Frequency Identification (RFID) systems and specialist markers
other than RFIDs. Their view is that electronic technology, particularly RFID systems, are likely to
become increasingly important in the development of product traceability methods into the future,
At the time of writing, Food Innovation Partners and Allan Bremner & Associates (2007) did state
that the high cost of RFID tags made them unsuitable for low cost food products. However,
Ringsberg and Mirzabeiki (2013) noted that over the last decade, RFID technology and price have
decreased and that they are now half the price that they were five years ago.
In what may be a glimpse of where the seafood industry might head in the future, part of the
Australian southern rock lobster catch is marketed with full traceability. The animals are tagged with
a barcode at point of capture that allows end-users – restaurants and customers – to establish via
the Southern Rocklobster Limited website, where the lobster was caught and by whom (Southern
Rocklobster Limited 2014).
Modelling 4.1.2.4
Stock assessment models usually assume that catch-at-age, catch per unit effort (CPUE) and other
information is precise. Where this assumption is not made, authors have used statistical methods to
correct or standardise data before using it in an assessment model (e.g. Bousquet et al. 2010). Few
studies have used the models to quantify the extent of under-reporting catch or taking it illegally.
Plagányi et al. (2010) used an age-structured production model developed for the South African
abalone fishery to, amongst other things, estimate the impact of illegal fishing on the resource. The
model is fitted to commercial CPUE, fishery independent survey and catch-at-age data. Within the
model, the illegal and unreported part of the catch has been quantified using an index developed
from records of the quantities of abalone confiscated from poachers by law enforcement officials.
Model outputs were cross checked against international trade data compiled by TRAFFIC
East/Southern Africa.
An interesting aspect of the model, and one that could be considered for other aspects of
compliance monitoring (not only for modelling purposes), has been the use of an unusual fisheries
index termed confiscations per unit of policing effort (CPUPE). This index (Plagányi et al. 2010) tracks
the number of confiscated abalone per fishing zone, but also recognises that policing effort has not
remained constant over time. To adjust for different levels of policing, a policing index was
established based on the level of resourcing provided to the enforcement officials each year. The
CPUPE index allows the confiscation amounts to be adjusted by the policing effort. After
standardisation, the result allows estimation across years of the level of poaching.
32 Fisheries Research Report [Western Australia] No. 275, 2016
The illegal and unreported catch is estimated using the model to compute the “additional” catch (i.e.
in excess of the recorded commercial and recreational catches) that would be required to account
for the decrease in stock as indicated by CPUE and fishery independent survey trends (Plagányi and
Butterworth 2011). The model has been subjected to extensive sensitivity testing and as a part of
those tests the authors have examined alternative poaching trends. These were not found to make
much difference to the result (Plagányi and Butterworth 2011).
Modelling has some scope to assist with developing the final outcomes of compliance activities that
are most directly associated with the achievement of public benefits. Reductions in illegal catches
increase the biomass of fish that remains in the ocean to grow and spawn and improve conditions in
fisheries and industries and communities that depend on them.
Measuring, or at least illustrating, these long-term beneficial outcomes of compliance activities
requires a few simple research tasks that involve using estimates of reductions in illegal harvests
that result from compliance activities as increases in measures of fish abundance in conventional
and widely available fishery models. Intermediate compliance outcomes associated with reductions
in illegal catches, when treated in conventional bio-economic fishery models as increases in the
biomass of fish left in the ocean to grow and spawn, can be shown to generate measurable long-
term beneficial outcomes in terms of improved conditions in fisheries, fishing communities, and
seafood markets.
In one case study of the U.S. Northeast groundfish fishery, for example, researchers estimated the
size of the annual illegal harvest at 5,200 metric tons ($13 million) and used estimates of typical
annual biomass growth rates (2% to 5%) to determine that eliminating this illegal harvest each year
would result in increases in fish abundance that over ten years would increase available fish stocks
by 60,000-70,000 metric tons (King and Sutinen 2010).
Such modelling has the attraction that it can produce estimates of values that could be considered
outcome measures and directly compared with equivalent empirical information from the fishery
over time. These estimates of values include:
• Increases in the expected allowable harvests;
• Less need for stringent fishing restrictions;
• Improvements in reliability of catch statistics used in fishery science;
• Higher catch rates and earnings for law-abiding fishermen;
• Higher legal harvest resulting in lower seafood prices for consumers; and
• Reduced economic incentives for illegal fishing.
Fisheries Research Report [Western Australia] No. 275, 2016 33
Use of observer data 4.1.2.5
Comparisons of data obtained with an observer present compared to without one can be a very
useful and cost efficient method of getting insight into possible occurrences of illegal activity. Data
collected in this way may provide indicators of criminal activity in a way not dissimilar to what might
be obtained from covert surveillance operations. Burns and Kerr (2008) report evidence illustrating
that misreporting of bycatch is common in the New Zealand ling bottom longlining fishery. Such
misreporting has serious implications in a multi species fishery where the accuracy of total catch
estimation is important for ensuring fishery sustainability.
Observer catch rates were compared to reported catch rates from Japanese tuna boats operating in
the AFZ off WA in the 1970s and this data was valuable in apprehending vessels that were
misreporting. The vessels were required by statute to carry observers, the main purpose being
research, but with a secondary compliance benefit (John Looby, DoFWA, personal communication).
Bremner et al. (2009) have used observer comparisons to draw conclusions about the level of
compliance of by-catch discarding in one of the New Zealand hoki fishery management zones. The
completion of logbooks is a compulsory requirement in that fishery. Their analysis showed
differences between observed and non-observed catches that were highly suggestive of
misreporting in the fishery. Indications for estimates compared to reported catches on unobserved
vessels, were that there was an underreporting of both quota and non-quota managed species.
As with most methods, there are potential biases that can be introduced in the sampling process.
Comparisons of observer-collected and unobserved data sources assume that the observed activities
directly or conditionally approximate a random sample of all activities (Benoit and Allard 2009). This
is not always the case. Benoit and Allard (2009) point to two potential sources of bias. The first is
what is termed deployment effect, resulting from the non-random assignment of observers among
sampling units. In the at-sea example provided above, this might be where certain vessels in the
fleet are used either more, or less frequently by the observers and therefore contribute
disproportionately to the observer dataset. The second is termed an observer effect and is where the
behaviour of the operation is modified by the presence of an observer. Once again using the above
example, if skippers were to fish at unusual fishing locations when there is an observer on board,
this could potentially influence comparisons between observer collected and unobserved data sets.
The worst case of bias would be for observers to collude with an illegal fishing operation to give an
illusion of compliance, as was hypothesised in the case of the official observer on board the
Patagonian Toothfish vessel, Viarsa, apprehended fishing in Australian waters in August 2003
(Knecht 2006).
34 Fisheries Research Report [Western Australia] No. 275, 2016
Human observer programmes, especially in smaller fishing vessels and fleets, are increasingly
becoming likely candidates for replacement by Remote Electronic Monitoring (REM) techniques (see
4.1.2.7 Video monitoring techniques).
Independent data sources 4.1.2.6
Trade and export figures have the potential to provide estimates of landings independent of catch
records supplied by the fishery which in turn may provide an indication of illegal or unreported,
shipments of catch. Examples where these methods have been used are in the estimation of
worldwide bêche-de mer-catches (Conand and Byrne 1993), shark catches (Clarke et al. 2006) and
South African lobster catches (Melville-Smith and van Sittert 2005).
Conand and Byrne used a combination of Fisheries and Agricultural Organisation (FAO) and import
and export statistics to estimate regional and world catches of bêche-de mer (Conand and Byrne
1993). Their export figures should in theory be reasonably reliable because countries that export
bêche-de mer (e.g. the South Pacific Islands) are not big consumers of the product, and, therefore,
non-reported product sold locally is expected to be limited. In terms of imports, most of the product
flows through just a few countries, principally Singapore, Hong Kong and Taiwan which simplifies the
compilation of these figures.
In the case of estimating illegal shark catches, (Clarke et al. 2006) used quantities of shark fins traded
through the major markets of Hong Kong, Mainland China, Singapore, Taiwan and Japan. However,
both in the case of bêche-de mer and shark fins, the end product is dried and needs to be converted
to a wet weight, which introduces potential errors. Further potential for inaccuracy in the estimated
biomass of bêche-de mer and sharks is that one is dealing with a multitude of species and in the case
of sharks, conversions need to take into account the variation in sizes and weights of fins for
different species and for different sizes of the same species. Clarke et al. (2006) adjusted their data
for under-reporting and double-counting in order to derive a global catch estimate. However, even
with those corrections, there is still potential unknown error resulting from the inability to account
for domestic production and consumption in the biomass estimates.
It is simpler to estimate catches from data where only a single species is involved. Melville-Smith and
van Sittert (2005) used published export figures from South African Customs Departments combined
with actual catch figures as reported by Industry to the Division of Sea Fisheries and its successors,
to estimate landings of West Coast rock lobster in South Africa from 1891 to recent times. Once
again, there was a need to apply conversion factors to the various ways that the product was
exported because early catches were canned. Later production changed to frozen whole and tailed
lobsters, which is a packaging method still in use today.
Fisheries Research Report [Western Australia] No. 275, 2016 35
Even though the estimates made by (Melville-Smith and van Sittert 2005) were for only a single
species and used what might be considered to be reasonably reliable export figures, they had many
sources of potential inaccuracy – most of which would have led to the catches being
underestimated. For example, in the earlier years the canning process was unsatisfactory and many
cans were rejected. There were also domestic sales and illegal activities that were unaccounted for.
While methods relying on trade figures may be useful broad-scale indicators of trends in landings,
they lack the accuracy necessary for establishing fine-scale levels of compliance in a fishery.
There are other possibilities that could be considered as a way of validating landings for compliance
purposes using freighting data. Some fisheries (e.g., lobster and blue fin tuna) have only small
domestic markets and are highly reliant on airline companies to reach their export markets. In these
cases it may be possible to use airline waybills, a method used by the New Zealand authorities. All
goods exported from New Zealand for commercial purposes need to be cleared by Customs and the
relevant forms for declarations provide useful information on total exported weight of product
which can then be compared to total landings (John Slaughter, Ministry for Primary Industries, New
Zealand, personal communication).
Remote Electronic Monitoring techniques 4.1.2.7
Remote Electronic Monitoring (REM) offers great potential to independently monitor fishing activity.
REM utilises the increasing capability and reliability of digital still and video cameras, coupled to GPS
or VMS and fishing gear sensors and using secure data storage and wireless transmission. Although
much work is underway in various fisheries agencies, fishing companies and specialist marine
technology companies, the techniques have yet to evolve to the extent of providing reliable
estimates of non-compliance that could be considered to be robust compliance outcome measures.
By deploying REM using statistical sampling processes, costs of equipment and data analysis would
be minimised and some common biases associated with observer coverage could be eliminated.
In the Alaskan groundfish fishery, video monitoring has been used to improve the ability of
observers to monitor the catch on factory trawlers (McElderry et al. 2008).
Kindt-Larsen et al. (2011) have reported on the use of closed-circuit television camera images of
trawling operations on board six vessels in a quota-controlled cod fishery. The objective in this
instance was to monitor discard estimates made by the skipper compared to video records. The
same method has far reaching opportunities for monitoring in a fisheries surveillance and
enforcement capacity although it should be noted that implicit in requiring video technology is a lack
of trust between those doing the monitoring and those being monitored. There are frequent
36 Fisheries Research Report [Western Australia] No. 275, 2016
complaints from Fishers that regulators do not trust them and the introduction of video surveillance
into fishing operations could easily strain this relationship further. Researchers have shown that the
relationship between regulator and fisher is important in maximising voluntary compliance (see
Gezelius 2003 and references therein).
Genetic and chemical techniques 4.1.2.8
Genetic techniques have been used for well over two decades to identify species for law
enforcement purposes (see reviews in Ward and Grewe (1994) and Sweijd et al. (2000)) and this
work has now become routine. As techniques have become more powerful, the potential has
become greater to use genetic methods at the stock level. This, together with an array of chemical
techniques (microchemistry, fatty acid and isotope analyses), provides more application for these
methods to be used as a tool in fighting fisheries crime. An excellent review of these methods and
their application in supporting fisheries law enforcement is available in Martinsohn (2011), including
international examples of where this technology has been applied in practice.
From a fisheries enforcement perspective, the key questions that chemical methods and molecular
and population techniques need to address are: what species are we dealing with and where was it
caught? Genetic techniques can answer the first question accurately, but the second question is
more accurately answered by using naturally occurring chemical markers identified through isotope
analyses (or similar), since genetic techniques point to its population origin at spawning rather than
where it was caught.
The future of genetic tools in fisheries traceability will entail the continued development of global
DNA databases containing authenticated reference sequences, to ultimately provide the tools to
enable almost all fish products to be identified down to taxa (Ogden 2008). As an example, the
European Union established fish the FishPopTrace project to undertake this sort of work together
with complementary technologies such as otolith microchemistry and fatty acid analysis for several
commercially important European species (Martinsohn and Ogden 2009). There are now numerous
similar projects in other parts of the world (see:
https://fishpoptrace.jrc.ec.europa.eu/tools/projects).
A database of shark mitochondrial DNA has been established in Western Australia and the Northern
Territory which permits compliance staff to match seized tissue samples, such as fins, against a suite
of reference species, McAuley et al. (2005).
Fisheries Research Report [Western Australia] No. 275, 2016 37
Vessel Monitoring Systems (VMS) 4.1.2.9
Vessel monitoring systems are a key component of monitoring control and surveillance programs in
many countries. The most basic use of the equipment is for monitoring the movement of vessels and
depending on polling rates, this can provide details on movements to and from fishing grounds, days
spent at sea and potential transgressions into restricted areas such as sanctuary zones. By coupling
position recording data with additional hardware such as winch sensors, quite detailed records of
fishing effort can be obtained with no real reporting impost on the crew. With additional hardware
and software, there is the potential to record and transmit catch reports at sea.
The use of VMS for monitoring fishing vessels for compliance with spatial and temporal fishing
regulations is widespread in Australia and elsewhere and needs little clarification. Less common is its
use for developing indices of fishing effort that are independent of human error, and using those
estimates of fishing effort to validate logbook indices (Mullowney and Dawe 2009). Such use does
not only have a function for research purposes; it could be used for compliance management as a
way of flagging irregular catch disposal, fishing location and intention to fish/offload records. The
isolation of unusual records is a commonly used method of identifying suspicious behaviour that is
worthy of further investigation (see Transactional Data Analysis in 4.1.2.12).
Statistically designed compliance operations 4.1.2.10
The use of covert powers to counter illegal activity is widespread amongst enforcement agencies in
countries where these operations are permitted. Traditionally these are intelligence-led operations
that focus on known problems and are designed to maximise the chance of catching offenders ‘in
the act’, removing key illegal operatives, and, by deterring others, reducing total offending.
Covert investigation powers are typically granted with equally strong accountability responsibilities,
but reporting processes are rarely open to full public scrutiny. Covert operations are usually run on
the basis of prior intelligence and so, in a statistical sense, are biased and non-random and very
unlikely to be representative of illegal fishing activities in the wider community. However, if a
statistically designed sampling frame is used as a basis for mounting these operations, results do
have the potential to provide robust data about a significant component of illegal activity. Although
we received anecdotal information on this type of deployment of compliance resources, we were
not able to find any instances documenting this practice in the peer-reviewed literature.
Use of enforcement statistics 4.1.2.11
The interpretation of official compliance statistics, where they have been used as measures of
noncompliance (Sutinen et al. 1990), can be ambiguous as the probability of illegal activity being
detected may also vary with changing levels of fishing and surveillance effort (i.e. detection may
38 Fisheries Research Report [Western Australia] No. 275, 2016
change with respect to compliance effort, location, etc.). In addition, the ability of non-compliant
fishers to avoid detection, or the enforcement capabilities of the regulator, may change through
time and space. The probability of detection is an important, usually unknown, factor that
contributes to uncertainty and confounding in interpreting compliance data. If these uncertainties
can be adequately addressed, official statistics can provide a quantitative indication of trends over
time and through space.
A number of studies have used the quantity of illegal products that have been seized during the
course of operations as one of the parameters used to calculate the scale of illegal fishing (e.g.
Gorfine et al. (2002)). Figures from these sources need to be used with caution (a fact acknowledged
by these studies) because often a seizure is the result of months and even years of undercover
surveillance. This means that the amount of illegal product seized at the time of apprehending of
offenders is likely to only be a fraction of what was illegally taken and therefore any upscaling of
these quantities would be likely to result in serious underestimation of actual quantities.
The report by Gorfine et al. (2002) concluded that the quantified amounts of illegal abalone in the
intelligence and compliance databases for different fisheries agencies across Australia over a five-
year period in the late 1990s to early 2000, ranged from only 0.06 -1.31% of the legal commercial
catch for the same period. However the data included in that report was for ‘known’ or detected
amounts only, and sampling/extrapolation issues were not considered as it was unknown what
proportion of the total true illegal catch the documented illegal quantities represented.
A simpler approach that is applied to evaluating the effectiveness of compliance measures using
enforcement statistics is through the use of comprehensive records relating to breaches of fisheries
rules combined with detailed records of levels of enforcement activity levels (i.e., hours spent
patrolling; number of fishers interviewed; quantity of catch examined etc.). This topic has been
investigated in research undertaken by (McKinlay 2002; Green and McKinlay 2009).
McKinlay’s (2002) work on the western rock lobster fishery showed that increasing levels of
inspection produce decreasing levels of benefit – i.e., non-compliance rates are inversely
proportional to levels of inspection effort. This and later work on other western Australian fisheries
(Green and McKinlay 2009) has given the systems and means for improved management of available
resources, directing them in the best possible way so as to optimise the trade-off between
inspections and varying levels of non-compliance. When linking offences to inspections, it must be
recognised that not all inspections are able to detect certain modes of offending, and this may result
in a biased estimate of non-compliance.
Fisheries Research Report [Western Australia] No. 275, 2016 39
In a fisheries context, it is important to distinguish between observed, or ‘crude’ non-compliance
rates (detected offences as a fraction of inspections) and a ‘true’ overall non-compliance rate which
is (an estimate of) the overall rate of offending. This important distinction is widely understood with
regard to police crime statistics as seen in the difference between reported crime and true crime
rates as estimated from victim studies (Catalano 2006). When a regulator does not have to ability to
undertake inspections across a statistically valid sample of total opportunities for an offence, it is
most unlikely that the overall non-compliance rate will be known. Given the typically targeted
nature of fisheries compliance work and low rates of inspection coverage, the biases in an observed
non-compliance rate could be significant (see King et al. 2009). This is borne out by DoFWA’s
experience that observed non-compliance rates can exhibit considerable variation. Making
inferences about overall non-compliance rates from measures of observed non-compliance rates is
impossible without comprehensive data sets that record such variables as: compliance effort that
does not result in any inspections or offences being undertaken, whether inspections and any
offences resulting were targeted, and whether significant management changes took place over the
comparison period. There is a need for related fishery data to determine what fraction of total
opportunities for offending were covered by an inspection, these data may be readily available for a
commercial fishery where effort is well known, but may be unavailable, or poorly estimated for
many recreational fisheries. DoFWA has been able to estimate an overall non-compliance rate for a
few fisheries and in them, the expected patterns of declining overall non-compliance as a result of
increasing compliance effort are observed and publications are planned.
One of the issues that need to be considered when using non-compliance rates as a measure of
performance is whether the data relating to enforcement duties are targeted or random.
Compliance inspections often focus on fishing activities (and times) where it is expected that non-
compliance rates may be high, which has the potential to artificially inflate observed non-compliance
indices. One of the unique features of the data collection system described in Green and McKinlay
(2009) is that it keeps track of whether inspections are random or targeted, so that it is possible to
generate indices of non-compliance that are unbiased, at least by that issue.
Rates of compliance with fishing regulations are generally understood to be associated with factors
such as – the potential economic gain from violating them, the probability of violations being
detected, the penalty for the offence, and also social and community norms that result in most
fishermen complying regardless of potential economic gains and losses (Kuperan and Sutinen (1998),
and references therein). In considering the Northeast Groundfish Fishery (NEGF), King and Sutinen
(2010) point out that within their models for that fishery, fishers considering violating a regulation
40 Fisheries Research Report [Western Australia] No. 275, 2016
decide on that course by weighing up the probability of being detected and the probability of facing
a penalty if they are detected. They used National Oceanic and Atmospheric Administration (NOAA)
official statistics for the NEGF fishery over a five year period to estimate the percentage of detected
violations that result in a penalty, and survey estimates from fishermen and enforcement staff to
estimate the likelihood of a violation being detected. Multiplication of the two percentages has been
used by King and Sutinen (2010) as an estimate of the likelihood of a violation resulting in a penalty.
King et al. (2009) believe that there are three reasons why there are so few studies that report on
illegal and unreported fishing in the United States:
(i) difficulties for researchers to obtain data on violations of fishing regulations because of
the offshore nature of the operations
(ii) the quality of data on fisheries violations that are available is questionable because of
the way that it is collected by the different fisheries law enforcement agencies and
(iii) data published by the U.S. Coast Guard indicates that fisheries compliance in the United
States is generally high which does not provide incentive to research illegal fishing in
that country.
In addition to those, it is probably also true that compared to many other crimes, the level of
societal harm from illegal fishing is low, making reporting on this topic less worthy than on many
other forms of crime.
(King 2010) used official statistics regarding the enforcement and prosecution of fishing violations
and resulting penalties along with results from surveys of fishers, enforcement staff, and others to
examine the performance of fisheries compliance bodies in the United States. The study presented
evidence that rates of noncompliance were relatively high in some fisheries, in the range of 12% to
24%, and showed that the low probability of fishing violations being detected and the low
probability of detected violations being successfully prosecuted and resulting in meaningful fines
resulted in expected costs of noncompliance being relatively low, and significantly less than
expected economic gains. In the fisheries studied, in other words, the study concluded that levels of
enforcement were not adequate to deter relatively high rates of noncompliance. Although similar
studies have not been conducted outside the U.S. it is reasonable to expect that they would reach
similar conclusions. This is especially true in places where social norms that promote compliance
regardless of economic gain and fishery enforcement budgets are lower than they are in the U.S..
When considering non-compliance rates it is important to realise that 100% compliance with
fisheries rules is practically unattainable without either incurring excessive compliance costs or
Fisheries Research Report [Western Australia] No. 275, 2016 41
creating ineffectual legislative frameworks. Indeed, perfect compliance has been shown to be
undesirable from an economic perspective (Arnason 2010).
The out of sight, out of mind nature of fisheries enforcement on the high seas means that unless
inshore resources are affected, the general public can be completely unaware of the extent of any
problem. This is likely to change in the future as third party certification of fish products becomes
more commonplace, because at least for those fisheries being assessed, the accreditation process
probes how well laws in a fishery are enforced.
Finally it should be mentioned that the risk in making official statistics part of a performance
measurement system is well documented (Campbell 1976). This risk has been highlighted in more
recent times by both a review of the New York CompStat program (Kelly and McCarthy 2013) and by
the UK House of Commons Public Administration Select Committee (House of Commons Public
Administration Select Committee 2014). The UK review found amongst other things that:
• Numerical targets drive perverse incentives to mis-record crime.
• This presents officers with “a conflict between achievement of targets and core policing
values.”
As a result of the Committee’s inquiry and the evidence it found, the UK Statistics Authority decided
in January 2014 to strip Police Recorded Crime data of its designation as National Statistics.
Both reviews reveal classic examples of data corruption as expounded by Donald Campbell
(Campbell, 1976) and reinforce the need for independent audits of work practices and statistical
reporting when there are financial and political ramifications to the use (and misuse) of official data.
Transactional data analysis 4.1.2.12
The use of transactional data for detecting fraudulent activity is standard practice in many areas of
commerce (e.g., the insurance, banking and gaming industries). The potential exists to use
transactional data for this purpose in fisheries enforcement, but indications from what is available in
the published literature is that the opportunity is yet to be fully appreciated.
Generally, one of the minimal requirements for commercial fishing licence holders is submission of
log book information recording where the gear was set, what equipment was used, the length of
time that was fished, how much was caught, etc. In addition to this, many fisheries departments in
Australia and elsewhere are now moving to systems that record, often in real time, a wealth of
additional data. For example, it is now commonplace for fishers to be required to report when and
where they are going to sea, when and where they return, when they offload the catch and the
42 Fisheries Research Report [Western Australia] No. 275, 2016
weight of the catch at offloading. It is equally commonplace for processors to be reporting on when
they receive the catch, the weight of the consignment and more.
All these data sources, if properly utilised, provide enormous possibilities for identifying illegal
fishing in commercial fisheries. Identifying falsified fisheries transactional data is no different than
identifying fraudulent transactional data in other industries. The first task is to profile participants –
in a fisheries context this would be boats in the fleet or companies in the fishery. These analyses are
then used to identify inconsistencies. It is these areas of inconsistency which become the focus of
further investigation because they may be indicators of illegal activity.
While no doubt this sort of data exploration does occur to varying degrees in fisheries compliance
groups all over the world, our belief is that in a fisheries context, forensic data analytics capability is
an area that is seriously neglected. Published examples of the use of this type of analysis are rare,
perhaps because there is a belief that publically disclosing any detail could compromise the benefits
of such work in the future.
One published case of illegal fishing reported by Groeneveld (2003) outlined the under-reporting of
catches in a South African lobster fishery. The case involved a large quota holder in the fishery
exporting very significant quantities of undeclared catch together with their legally declared
landings. The illegal activity had been taking place for several years and was uncovered through a
tip-off, not through catch and effort data analysis. However, of relevance to this discussion is the
analysis of catch and effort data after the event (Groeneveld 2003), which showed that the company
operating illegally had very different catch rates than the rest of the fleet. Had this data been used
for enforcement purposes, it is highly likely that the case would have been flagged and investigated
much earlier.
McKinlay (2002) has described a variation of a transactional experiment which instead of using
logbook information, utilised the size composition of the catch. Lobsters grow in steps, each time
they moult and are of fixed size between moults. At the time of the experiment, the western rock
lobster fishery in Western Australia had an annual change in the legal minimum size (LMS) mid-way
through the commercial fishing season and outside of the moulting period of the lobsters. At the
start of the fishing season, the LMS was 77 mm carapace length (CL), but mid-way through the LMS
decreased to 76 mm. There were suspicions that some fishermen were illegally stockpiling lobsters
in the 76-77 mm LMS range in days and weeks prior to the mid-season change in minimum size. The
suspicion was that they were being held at sea in holding containers and then being landed with the
rest of their catch on the day that the smaller LMS became legal.
Fisheries Research Report [Western Australia] No. 275, 2016 43
McKinlay’s (2002) experiment involved at-sea sampling of lobsters above the LMS as well as
collecting information on the proportion of catch in the 76-77 mm LMS range. Sampling was
conducted at sea on several boats fishing in one area of the fishery over a number of days prior to
the change in LMS. Landings of boats that had been fishing in the same area that had been sampled
at sea, were then sampled for two days after the change in LMS.
Results showed that on the first day of the changed legal size, the proportion of 76:77+ lobsters was
approximately equal, but on the second day the ratio was similar to what had been recorded during
the at-sea sampling, i.e., around 0.7. McKinlay (2002) was able to use the ratios to show that around
27% of the lobsters consigned by sampled fishers on the first day after the change in LMS, had been
held over from prior to the date of the LMS change. One boat in particular, landed a catch on the
date that the LMS changed in which almost 80% of the total catch comprised lobsters in the 76-77
mm LMS range. One basket in the catch had a 100% consignment of 76-77 mm LMS lobsters!
As with any kind of data used for any kind of analytics, the quality of the information being used is
paramount. Obviously this means that appropriate resources need to be directed at optimising the
quality of the data. This may not be appreciated in agencies where compliance has traditionally
focused on intelligence gathering, rather than analysing large amounts of data. These methods do
not lend themselves to use in data-poor fisheries such as most recreational fisheries where
information relating to fishing activity is more likely to have to be sourced from the fisher using
survey or creel techniques, rather than provided by the fisher as part of a licence condition.
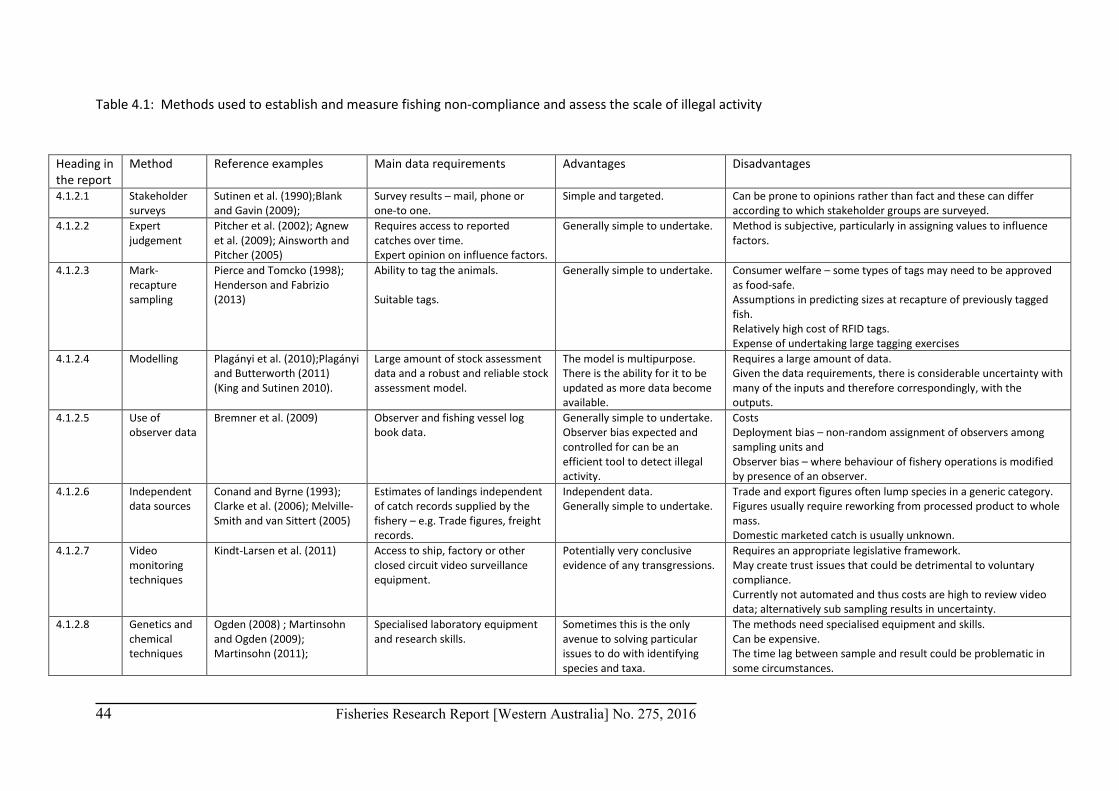
44 Fisheries Research Report [Western Australia] No. 275, 2016
Table 4.1: Methods used to establish and measure fishing non-compliance and assess the scale of illegal activity
Heading in the report
Method Reference examples Main data requirements Advantages Disadvantages
4.1.2.1 Stakeholder surveys
Sutinen et al. (1990);Blank and Gavin (2009);
Survey results – mail, phone or one-to one.
Simple and targeted. Can be prone to opinions rather than fact and these can differ according to which stakeholder groups are surveyed.
4.1.2.2 Expert judgement
Pitcher et al. (2002); Agnew et al. (2009); Ainsworth and Pitcher (2005)
Requires access to reported catches over time. Expert opinion on influence factors.
Generally simple to undertake. Method is subjective, particularly in assigning values to influence factors.
4.1.2.3 Mark-recapture sampling
Pierce and Tomcko (1998); Henderson and Fabrizio (2013)
Ability to tag the animals. Suitable tags.
Generally simple to undertake. Consumer welfare – some types of tags may need to be approved as food-safe. Assumptions in predicting sizes at recapture of previously tagged fish. Relatively high cost of RFID tags. Expense of undertaking large tagging exercises
4.1.2.4 Modelling Plagányi et al. (2010);Plagányi and Butterworth (2011) (King and Sutinen 2010).
Large amount of stock assessment data and a robust and reliable stock assessment model.
The model is multipurpose. There is the ability for it to be updated as more data become available.
Requires a large amount of data. Given the data requirements, there is considerable uncertainty with many of the inputs and therefore correspondingly, with the outputs.
4.1.2.5 Use of observer data
Bremner et al. (2009) Observer and fishing vessel log book data.
Generally simple to undertake. Observer bias expected and controlled for can be an efficient tool to detect illegal activity.
Costs Deployment bias – non-random assignment of observers among sampling units and Observer bias – where behaviour of fishery operations is modified by presence of an observer.
4.1.2.6 Independent data sources
Conand and Byrne (1993); Clarke et al. (2006); Melville-Smith and van Sittert (2005)
Estimates of landings independent of catch records supplied by the fishery – e.g. Trade figures, freight records.
Independent data. Generally simple to undertake.
Trade and export figures often lump species in a generic category. Figures usually require reworking from processed product to whole mass. Domestic marketed catch is usually unknown.
4.1.2.7 Video monitoring techniques
Kindt-Larsen et al. (2011) Access to ship, factory or other closed circuit video surveillance equipment.
Potentially very conclusive evidence of any transgressions.
Requires an appropriate legislative framework. May create trust issues that could be detrimental to voluntary compliance. Currently not automated and thus costs are high to review video data; alternatively sub sampling results in uncertainty.
4.1.2.8 Genetics and chemical techniques
Ogden (2008) ; Martinsohn and Ogden (2009); Martinsohn (2011);
Specialised laboratory equipment and research skills.
Sometimes this is the only avenue to solving particular issues to do with identifying species and taxa.
The methods need specialised equipment and skills. Can be expensive. The time lag between sample and result could be problematic in some circumstances.
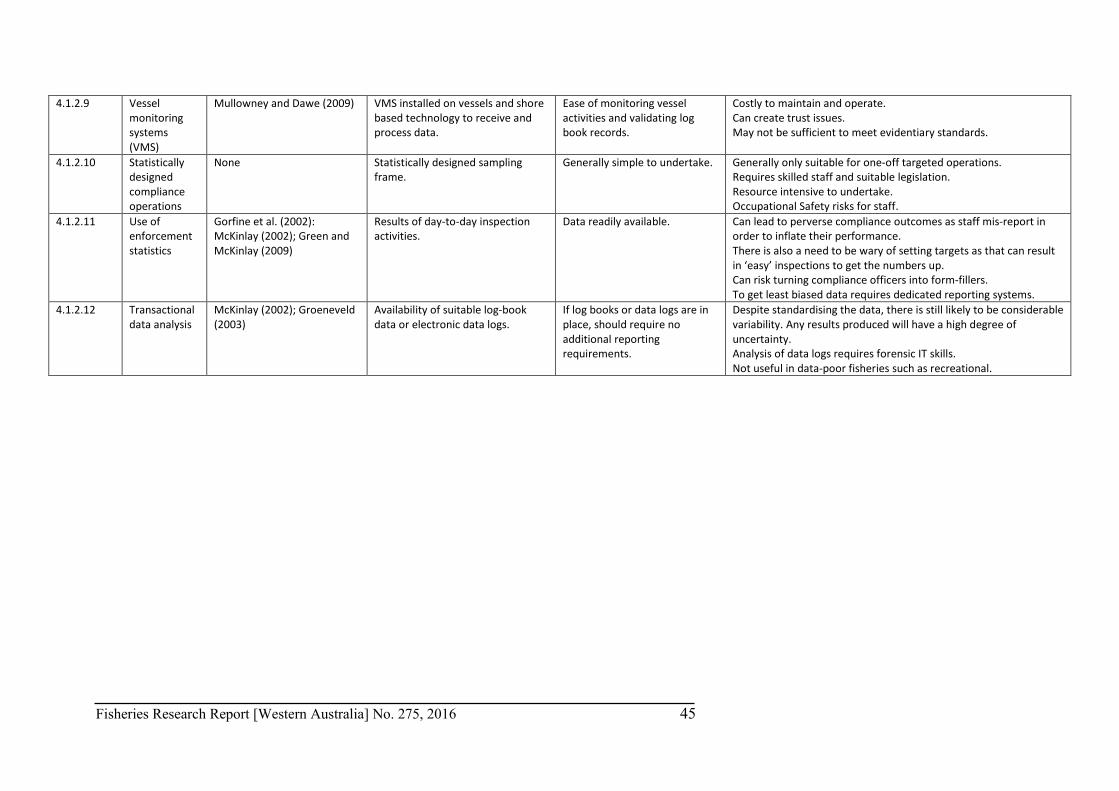
Fisheries Research Report [Western Australia] No. 275, 2016 45
4.1.2.9 Vessel monitoring systems (VMS)
Mullowney and Dawe (2009) VMS installed on vessels and shore based technology to receive and process data.
Ease of monitoring vessel activities and validating log book records.
Costly to maintain and operate. Can create trust issues. May not be sufficient to meet evidentiary standards.
4.1.2.10 Statistically designed compliance operations
None Statistically designed sampling frame.
Generally simple to undertake. Generally only suitable for one-off targeted operations. Requires skilled staff and suitable legislation. Resource intensive to undertake. Occupational Safety risks for staff.
4.1.2.11 Use of enforcement statistics
Gorfine et al. (2002): McKinlay (2002); Green and McKinlay (2009)
Results of day-to-day inspection activities.
Data readily available. Can lead to perverse compliance outcomes as staff mis-report in order to inflate their performance. There is also a need to be wary of setting targets as that can result in ‘easy’ inspections to get the numbers up. Can risk turning compliance officers into form-fillers. To get least biased data requires dedicated reporting systems.
4.1.2.12 Transactional data analysis
McKinlay (2002); Groeneveld (2003)
Availability of suitable log-book data or electronic data logs.
If log books or data logs are in place, should require no additional reporting requirements.
Despite standardising the data, there is still likely to be considerable variability. Any results produced will have a high degree of uncertainty. Analysis of data logs requires forensic IT skills. Not useful in data-poor fisheries such as recreational.
46 Fisheries Research Report [Western Australia] No. 275, 2016
Summary of the literature survey dealing with methods to measure levels of 4.1.2.13
compliance
A number of methods have been described that have been used to measure how compliant various
fishers are within the sectors in which they are operating. Measuring levels of non-compliance is, at
best, difficult and all the methods that have been outlined provide indicators that are highly
dependent on the quality of the intelligence, compliance data, or research methods used. However,
it is the degree to which the uncertainty affects decision making that is the important factor in
determining the suitability of an indicator.
Methods relying on intelligence and compliance data without additional analysis will only ever
describe a proportion of the quantities of catch that are discarded illegally or that are taken through
illegal harvesting (e.g., Table 4.1, methods 6, 7, 8) and likely only provide a minimum figure of
tonnages of stock lost to illegal fishing activities. However, they could indicate the shape of the
distribution of illegal catch and provide indications of changes over time. Most fisheries compliance
programmes can only give comprehensive oversight to a very limited number of opportunities for
offending.
Opinion-based methods (e.g. stakeholder survey techniques and expert judgement, Table 4.1
methods 1 and 2) and those that infer a value or range of values based on analysis (e.g. modelling,
and subsampling methods such as use of observer data and use of enforcement statistics, Table 4.1
methods 4, 5, 11) are not constrained in the same way. These methods do however rely on
subjective judgment and a number of assumptions. This means that their accuracy in estimating
illegal landings or discarding of catch is only as good as the assumptions that are used, although this
may be adequate for decision making purposes in a well-designed risk management framework.
In spite of their inadequacies, estimates of levels of compliance are likely to remain the cornerstone
when judging the effectiveness of many compliance programs. Inexactitude alone will not prevent
them being used to monitor past levels of effectiveness or to improve future levels of performance,
at least until clearly better, more exact measures can be developed. The challenge is how much
reliance to place on indicators of unknown accuracy when seeking to produce sensible outcomes.
While some studies have used estimates of the amount of catch that is landed or discarded illegally
in a fishery, it is not necessarily assessing the effectiveness of a compliance program. They could be
considered useful immediate outcome indicators and monitoring them over time may give useful
intermediate outcome indicators. The errors and uncertainties inherent in these methods make
them unsuitable as accurate final outcome indicators when those uncertainties and inaccuracies are
Fisheries Research Report [Western Australia] No. 275, 2016 47
poorly quantified but it must be pointed out that they are the best and most practical outcome
indicators we have found in this study.
Measuring compliance outcomes 4.1.3
To fundamentally assess the effectiveness of a compliance program, it is necessary to understand
the drivers and motivators behind an individual’s decision as to whether they will become involved
in one or more of the different facets of illegal fishing. We have referred to different facets of illegal
fishing because an individual who discards a few fish illegally or keeps a few undersize abalone in his
or her catch has different drivers and motivators to an individual that is illegally exporting high
volumes (e.g. container loads) of fish. Knowledge of these motivations allows effective strategies to
be put in place to prevent unacceptable risks to the sustainability of the fishery.
The primary reasons for measuring compliance outcomes are so that they can:
1. be used to inform the service provider of the effectiveness of the service that they are delivering
so that it can be monitored and if necessary, improved over time;
2. be used to give stakeholders the means to gauge what has been achieved by the service
provider;
3. in the public sector, allow governments to be able to determine the costs and benefits of the
service; and
4. demonstrate good stewardship in a co-managed environment.
To get to the point of being able to use outcomes for this purpose, there are a number of steps or
phases that are generally followed, but there is no prescriptive process. The Australian Taxation
Office (2007) has outlined eleven different frameworks and models used either in whole or in part to
gauge the effectiveness of a program: The OECD risk model, Australian Taxation Office (ATO)
compliance model, ATO business model, standard cost model, program logic model, public sector
value model, balanced scorecard, performance indicators for government framework, National
Association of Councils for Voluntary Service’s self-evaluation process, Canada Revenue Agency’s
compliance measurement framework and a program assessment rating tool developed by the US
Office of Management and Budget.
Australia Taxation Office Framework 4.1.3.1
The ATO has developed their own framework (the ATO compliance model) (Australian Taxation
Office 2012a) which works through four phases: Phase 1 articulates the risk and aligns it with their
business intent; Phase 2 defines outcomes and develops strategies; Phase 3 designs indicators; and
Phase 4 validates the indicators and determines the extent of their effectiveness. Other published
48 Fisheries Research Report [Western Australia] No. 275, 2016
studies dealing with the development of performance measurement identify more (Willis et al.
2010) or fewer phases (INECE 2008) in their models. The one constant that all authors are agreed on
is that the development and implementation of outcomes-based indicators in an organisation needs
a substantial investment in time and commitment by management.
In this preliminary study into the measurement of fisheries compliance outcomes, we have
attempted to draw on the steps that have been followed by other authors in developing outcome
indicators. Because of the lack of published studies dealing with this topic in fisheries compliance,
we have concentrated on methods used to develop outcome indicators for other law enforcement
and compliance organisations, in particular the ATO compliance model. In the proceeding headings,
we have documented a generalised process of how outcome indicators might be developed in
fisheries compliance.
The steps or phases that we will be discussing broadly follow those outlined in Australian Taxation
Office documents (2008; 2012b; 2012a). Details would be expected to vary for different fisheries
agencies because while all fisheries compliance organisations have similar overall goals and
responsibilities, they are not necessarily responding to the same risk profiles. Obviously this would
impact their choice of outcome indicators.
4.1.3.1.1 Phase 1: Articulating risk or goals and aligning these with fisheries business intent
As pointed out in section 1.3, Australian fisheries regulators share a common goal of ESD. Many
fisheries compliance groups share a similar mission statement or business intent to at least the first
part of the one outlined for the Australian Taxation Office (2008) (i.e., “to optimise voluntary
compliance”). The mission statement that has been adopted by the Australian National Fisheries
Compliance Committee in their compliance strategy for 2010-2015, is that the optimal level of
compliance ”… is that which holds the level of non-compliance at an acceptable level, which can be
maintained at a reasonable cost while not compromising the integrity and sustainability of the
resource” (National Fisheries Compliance Committee undated).
The wording in the statement in the previous paragraph is important in forming the reason for
developing the indicators. As noted in Willis et al. (2010), staff should never have to be in the
position of asking “why are we doing this?”. The reason for developing the indicators can be
couched as addressing one or more compliance risks emanating from the statement, or as
addressing specific goals drawn from the statement. If it is risks, the Australian Taxation Office
(2008) note that these should be expressed as a threat posed to achieving what is in the statement,
not in terms of risks associated with observed behaviours. Willis et al. (2010) consider it to be critical
Fisheries Research Report [Western Australia] No. 275, 2016 49
for staff to be involved at this juncture of the process to ensure validity in approach and a degree of
ownership by all.
The Australian Taxation Office (2008), in common with the socio-ecological theory of compliance,
consider it important to identify the behaviours and drivers of the risk. They use the BISEP (business,
industry, sociological, economic and psychological) factors to establish what is driving client
behaviour. In the case of fisheries compliance, these behaviours and drivers would at least in part,
be similar to the motivators and drivers of compliance behaviour outlined in section 4.1.1.4 Socio-
Ecological Compliance Theory. The purpose of this is to identify leverage points so that the drivers of
risks are treated rather than the behaviours (Australian Taxation Office 2008).
There is a wide field of literature covering factors that drive fishers to either be compliant or non-
compliant. These studies show that in general the majority of individuals are law-abiding and
conform to regulations, but that there is usually a small component of what Kuperan and Sutinen
(1998) term “flagrant violators.” This group, they suggest, behave in a way devoid of moral
obligation or social influence and are driven only by the direct tangible consequences of their
actions.
The attitude towards compliance by the majority of fishers tends to be swayed by circumstances in a
dynamic and evolving way. King et al. (2009) suggest that deteriorating economic conditions
combined with the imposition of highly restrictive, sometimes controversial and often ineffective
fisheries regulations, have negatively impacted attitudes to compliance by U.S. fishers. In their view,
these circumstances have on one hand strengthened economic incentives for non-compliance and
on the other have weakened normative factors favouring compliance. These are examples of the
type of drivers of risk that need to be addressed by actions resulting from this phase in the
development of compliance outcomes.
4.1.3.1.2 Phase 2: Defining outcomes and developing strategies
The object of this phase is to clearly express the broad, aspirational desired outcomes and explain
what would be different if the organisation is being successful. Defining outcomes is a critical step,
because the outcomes determine all the actions that will be directed towards achieving them. In the
previous phase, motivators and drivers of non-compliant behaviour were identified. In this phase,
the right mix of treatment strategies will also be identified to treat the drivers of noncompliance, not
just the observed behaviours. As part of this process the ATO recommends defining success in terms
of specific goals (intermediate outcomes to use the terminology of this project) that are linked to
positive, sustainable changes in behaviour and or community confidence and hence also to the
desired final outcomes. This phase is also about identifying target groups who will be subject to
50 Fisheries Research Report [Western Australia] No. 275, 2016
specific compliance strategies; however, this phase is not the point at which performance measures
and indicators are developed – that is covered in phase 3.
Logic models explicitly recognise that not all outcomes can occur at the same time (Innovation
Network Inc. anon.) which is why they are referred to as a “chain of outcomes”. As we have
identified in section 1.1, outcomes need to be considered across different timeframes. INECE (2008)
considers intermediate outcome measures to be those measuring progress toward a final outcome,
for example a change in behaviour. By comparison, final outcome measures should allow
measurement of the final end product that the program was designed to achieve.
The Australian Taxation Office (2008) have used a variation of the pyramidal responsive compliance
model concept described by (Ayres and Braithwaite 1992) (Figure 4.1). That model diagrammatically
compares public attitude to compliance against the strategy they employ to change behaviour. The
model assumes that the vast majority of the public, taxpayers in their case, are law abiding and so
require little in the way of compliance costs. These law-abiding individuals form the base of the
pyramid in their model. Moving up the pyramid, there are decreasing numbers of increasingly non-
compliant individuals who consume increasing amounts of compliance resources through detection,
investigation and sanctions. At the top of the pyramid are a small group of habitual violators.
Compliance costs are highest at the top of the pyramid, because that is where they focus their law
enforcement efforts. Implicit in this simple model is the idea that the shape of the pyramid is
dynamic, a result of many contributing factors. At least some of these factors can be influenced by
the regulator whose strategy is to flatten the pyramid by increasing the number of those who
regularly comply voluntarily and decreasing the number of people who require more extensive
efforts from the regulator to get them to comply. This obviously decreases compliance costs and
increases the amount of compliance.
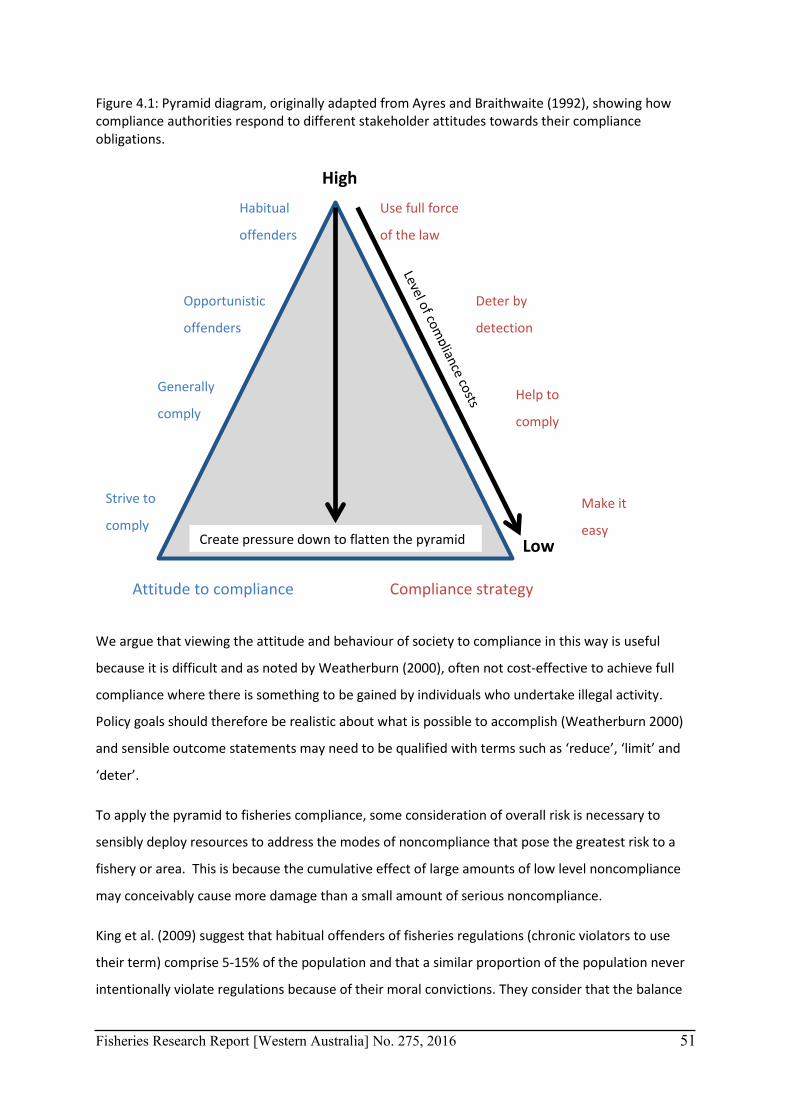
Fisheries Research Report [Western Australia] No. 275, 2016 51
Figure 4.1: Pyramid diagram, originally adapted from Ayres and Braithwaite (1992), showing how compliance authorities respond to different stakeholder attitudes towards their compliance obligations.
We argue that viewing the attitude and behaviour of society to compliance in this way is useful
because it is difficult and as noted by Weatherburn (2000), often not cost-effective to achieve full
compliance where there is something to be gained by individuals who undertake illegal activity.
Policy goals should therefore be realistic about what is possible to accomplish (Weatherburn 2000)
and sensible outcome statements may need to be qualified with terms such as ‘reduce’, ‘limit’ and
‘deter’.
To apply the pyramid to fisheries compliance, some consideration of overall risk is necessary to
sensibly deploy resources to address the modes of noncompliance that pose the greatest risk to a
fishery or area. This is because the cumulative effect of large amounts of low level noncompliance
may conceivably cause more damage than a small amount of serious noncompliance.
King et al. (2009) suggest that habitual offenders of fisheries regulations (chronic violators to use
their term) comprise 5-15% of the population and that a similar proportion of the population never
intentionally violate regulations because of their moral convictions. They consider that the balance
Habitual
offenders
Opportunistic
offenders
Generally
comply
Strive to
comply Create pressure down to flatten the pyramid
Use full force
of the law
High
Low
Deter by
detection
Help to
comply
Make it
easy
Attitude to compliance Compliance strategy
52 Fisheries Research Report [Western Australia] No. 275, 2016
of the population (70-90%) occasionally violate regulations. Presumably within this group of
‘occasional violators,’ there are varying degrees of violation in keeping with the pyramidal
representation of attitudes to compliance in Figure 4.1.
Offenders represented by the top end of the pyramid are unlikely to ever adopt a normalised
behaviour towards compliance. For them incarceration or removal from the fishery, reducing the
illegal gain or increasing the expected penalty is the only mechanism for controlling their non-
compliant behaviour (Kuperan and Sutinen 1998). These habitual violators can account for a
disproportionately high percentage of the illegal harvest, and their behaviour, if unchecked, can
result in alteration of social norms to favour noncompliance (Nielsen and Mathiesen 2003). It is
therefore crucial that those potential offenders should be kept in check.
There is additional motivation for this sub-group to be restrained; Kuperan and Sutinen (1998) note
that if those that occasionally violate regulations see habitual, flagrant violators getting away with
their crimes, they will come to regard regulatory procedures as unfair and the regulatory practices as
failing to protect the fishery and the fishermen. This will erode the moral obligation and social
influence within this group, leading ultimately to a breakdown in compliance behaviour in the
fishery.
The end goal should be for compliant behaviour to be normalised and voluntary, or for stocks to be
managed such that noncompliance is not a risk to the fishery. The Australian Taxation Office (2008)
consider that changing behaviour generally requires a mix of strategies: help and education to assist
their clients in complying, combined with verification and enforcement to deter, detect and deal
with non-compliance.
This is similar to a fisheries enforcement context. Any compliance strategy has to target both the top
and base of the pyramid that reflects fishers’ attitudes to compliance (Figure 4.1) using intensities of
law enforcement appropriate to the level of risk posed. Strategies also need continual review ˗
fisheries enforcement resources that were once adequate can cease to be adequate and when
combined with limited prosecution of infringements and inadequate penalties, can fail to deter
fishing violations (King et al. 2009).
One factor that also needs to be considered during this part of the planning process is that the
strategies to change non-compliant behaviour sometimes have unintended consequences. For
example changing non-compliant behaviour in one aspect of policing might result in a shift in risk to
a different policing task (Australian Taxation Office 2008).
Fisheries Research Report [Western Australia] No. 275, 2016 53
A particular problem in policing situations is the difficulty of identifying outcome measures for
specialist units within the police. Alach and Crous (2012) state that even simple outcome measures
such as crime rates, are usually irrelevant for technical units and difficult to allocate to specialist
units. This is in part because these groups tend to be very dependent on other agencies or parts of
the organisation (Mackenzie and Hamilton-Smith 2011), but also because some of these units (e.g.
counter-terrorist units) only record a few incidents a year. Such difficulties in identifying outcome
measures could equally be applied in some fisheries enforcement activities (e.g., special
investigations branches). Alach and Crous (2012) believe that a way around this is for specialist
policing performance measurements to focus primarily (but not solely) on outputs rather than
outcomes. For example: an Intelligence Unit may simply count the number of intelligence reports by
type produced during a reporting period; or the number of investigative operations that provided
organic intelligence support, where an intelligence analyst brings their specific skillset into the
investigation team.
4.1.3.1.3 Phase 3: Designing indicators
Indicators are characteristics that can be used to measure the progress a program is making towards
achieving a specific outcome and are therefore linked to the intermediate outcomes that were
developed in Phase 2. It was noted at the start that one of the key reasons for measuring compliance
outcomes is to give stakeholders the means to assess the performance of a service provider in terms
of achieving meaningful end goals. In this phase, therefore, there is a need for interaction with
operational staff and stakeholders, to discuss and, if necessary, to modify the goals and associated
indicators. Issues to be dealt with are suggested by Willis et al. (2010) as determining:
• Relevance of selected measures and indicators to goals
• How well defined selected measures and indicators are
• The reliability of indicator data
• Comparability of indicator data
• Understanding the limitations of indicator data
In developing indicators, it is important to focus on just a few key measures, but the breadth and
complexity of fisheries may hamper this aspiration. A distinction needs to be made between
measures and indicators. As their name implies, one measures something and is therefore usually a
single quantitative value; the other indicates something and is therefore a qualitative value that
compares one value with another or indicates trends in data. Australian Taxation Office (2008) state
that indicators are generally quantitative but that they can be based on both quantitative and
qualitative sources.
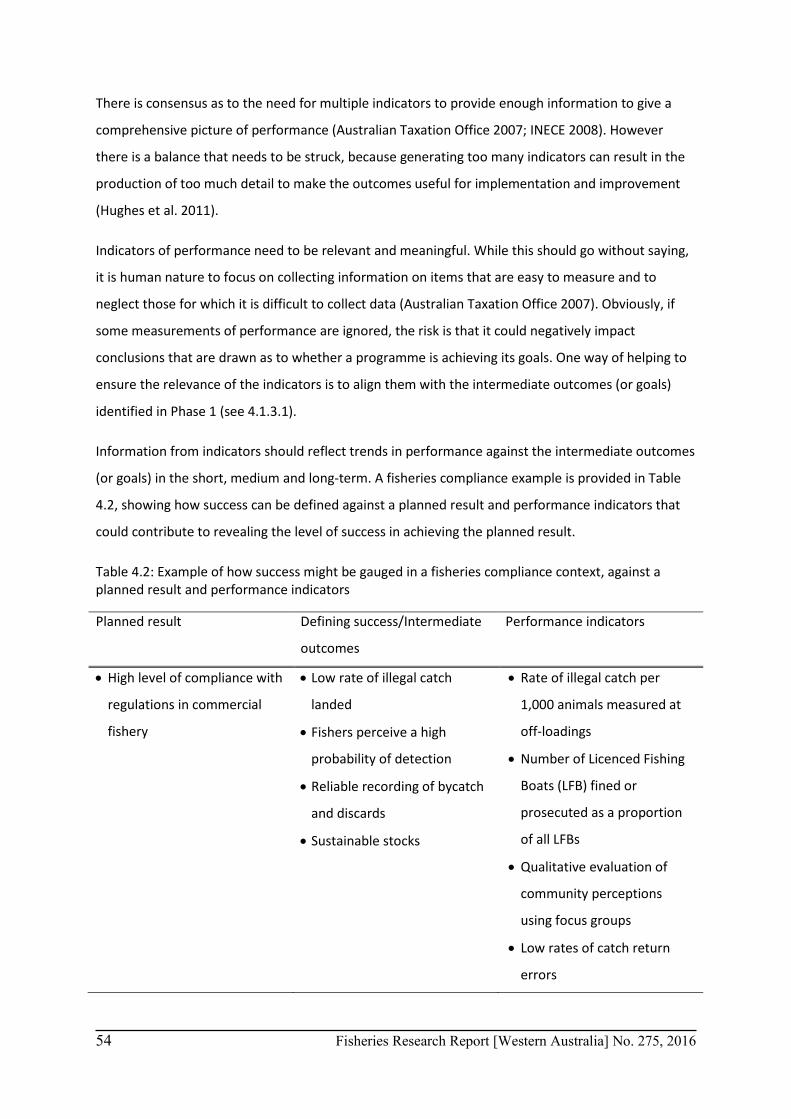
54 Fisheries Research Report [Western Australia] No. 275, 2016
There is consensus as to the need for multiple indicators to provide enough information to give a
comprehensive picture of performance (Australian Taxation Office 2007; INECE 2008). However
there is a balance that needs to be struck, because generating too many indicators can result in the
production of too much detail to make the outcomes useful for implementation and improvement
(Hughes et al. 2011).
Indicators of performance need to be relevant and meaningful. While this should go without saying,
it is human nature to focus on collecting information on items that are easy to measure and to
neglect those for which it is difficult to collect data (Australian Taxation Office 2007). Obviously, if
some measurements of performance are ignored, the risk is that it could negatively impact
conclusions that are drawn as to whether a programme is achieving its goals. One way of helping to
ensure the relevance of the indicators is to align them with the intermediate outcomes (or goals)
identified in Phase 1 (see 4.1.3.1).
Information from indicators should reflect trends in performance against the intermediate outcomes
(or goals) in the short, medium and long-term. A fisheries compliance example is provided in Table
4.2, showing how success can be defined against a planned result and performance indicators that
could contribute to revealing the level of success in achieving the planned result.
Table 4.2: Example of how success might be gauged in a fisheries compliance context, against a planned result and performance indicators
Planned result Defining success/Intermediate
outcomes
Performance indicators
• High level of compliance with
regulations in commercial
fishery
• Low rate of illegal catch
landed
• Fishers perceive a high
probability of detection
• Reliable recording of bycatch
and discards
• Sustainable stocks
• Rate of illegal catch per
1,000 animals measured at
off-loadings
• Number of Licenced Fishing
Boats (LFB) fined or
prosecuted as a proportion
of all LFBs
• Qualitative evaluation of
community perceptions
using focus groups
• Low rates of catch return
errors
Fisheries Research Report [Western Australia] No. 275, 2016 55
Diamond (2005) points to the importance of not neglecting process indicators of workload,
throughput and work rate, which together measure technical efficiency of an agency’s operations.
He views workload as an input that can be used to produce quality of service output data (e.g., the
amount of work not completed as a proxy for delays in service to customers). Quality of service,
which includes services such as adequacy of dissemination to potential users, timeliness in service
provision and so forth, is a difficult output to measure. However, if properly tracked it can provide
an indicator of efficiency (Diamond 2005).
4.1.3.1.4 Phase 4: Validating indicators and determining the extent of effectiveness
This phase involves the analysis of data that have been collected so that the effectiveness of the
compliance strategies can be assessed. The questions that Australian Taxation Office (2012b)
consider need to be addressed when evaluating compliance effectiveness are:
• Is there a change in compliance behaviour and/or community confidence?
• If there is a change, did we cause it?
To be clear about what interventions have led to a change in the indicators, one should ideally
compare what would have happened in the absence of the intervention against what happened with
intervention (Australian Taxation Office 2007) although the gold-standard evaluation method of a
controlled experiment is rarely possible in the public policy sphere in which most regulators operate.
Australian Taxation Office (2008) have summarised a number of different methods that can be used
to determine how effective the strategies have been at achieving the desired outcomes. These range
from baseline comparisons – a comparison of performance before and after the strategy, to
benchmarking against other areas or organisations with similar characteristics and other methods.
One of the complexities in analysing and interpreting performance against outcomes, is that while
agencies or programs can influence outcomes, they do not always control them (INECE 2008). Often
factors external to the agency play a significant role in determining the success or otherwise of
performance against particular outcomes. This requires consideration in the interpretation of the
results and in the explanation in the reporting of the conclusions. INECE (2008) advises that because
of these external factors, agencies need to be mindful of not always taking too much credit for
successful achievement of outcomes; nor necessarily taking too much blame when outcomes are not
achieved.
Professor Malcolm Sparrow has very clearly highlighted the difficulties for regulators in trying to
prove causality since, scientifically speaking, that can be impossible. His recommendations for
56 Fisheries Research Report [Western Australia] No. 275, 2016
measuring progress against outcomes are broadly in line with those advocated by the ATO whereby
the aggregate performance of a regulator is best described by breaking its operations into specific
projects, each designed to address specific problems, identified using verifiable information and
tracked using indicators chosen at the commencement of the project to show whether change is
taking place. By taking such an open and transparent approach, continuously monitoring progress
and being prepared to actively seek out new approaches if the first does not have the desired effect,
he argues that correlation should be sufficient for a regulator to take credit for an observed change
in behaviour (Sparrow 2008). Indeed he goes further to argue that by seeking academic levels of
proof of causality, a regulator may actually restrict their ability to try new approaches and so fail to
achieve good outcomes (Sparrow 2011).
Further complicating the matter is that where there is more than one program or agency
contributing to an outcome, there is the option for them to share responsibility in reporting against
that outcome. Indicators measuring the collective performance of several programs or agencies are
referred to as cross-cutting indicators (Audit Commission quoted by Australian Taxation Office
(2007)).
The end result of this process of validating indicators and determining the extent of their
effectiveness in achieving success goals and desired outcomes is to use this information to improve
services, allocation of resources and increased accountability. It needs to be possible to answer the
question “how are we doing?” in terms of both efficiency and effectiveness in achieving
organisational goals and objectives.
Diamond (2005) has outlined several additional complications about measuring performance against
outcomes. He points to:
(i) The danger of overreliance on performance measures and the fact that it usually
involves considerable evaluation to determine the reasons behind either the success or
failure of a program’s activities and its resulting outcomes. A thorough evaluation of this
is an expensive exercise that does not necessarily provide all the information required
for resource allocation decisions.
(ii) The danger of inappropriate measures - with the move from outputs to outcomes the
technical problems of measurement have increased and made the task of interpreting
performance indicators substantially more difficult. A particular problem he identifies
has been already noted in section 4.1.2.11 (Use of enforcement statistics), that the use
of performance measures can end up displacing the actual outcomes as an agency’s
Fisheries Research Report [Western Australia] No. 275, 2016 57
objectives. This could result in an Agency’s energies being focussed on improving the
performance measure results without necessarily improving actual outcomes.
(iii) The danger of misuse, because different people interpret performance indicators in
different ways. Inevitably, there is a tendency for the interpretations to be used in a way
that is most favourable to the Agency that is generating them. This can even filter down
through the Agency to the staff, where there may be incentives to identify performance
measures that can be used for self-serving purposes resulting in the reporting of
misleading performance data and finally,
(iv) The danger of information overload if too many performance indicators are used, or if
they are inappropriate for decision making.
The important part of thoroughly evaluating outcomes is that the process provides the opportunity
to examine causes of success or failure and to use these judgements to improve service delivery.
Good communication channels are particularly important in the early stages of changing from a
framework that measures efficacy to one that measures effectiveness, because as noted by
Australian Taxation Office (2007), such a change is a cultural shift in any organisation.
A summary of the four phases is provided in Figure 4.2.
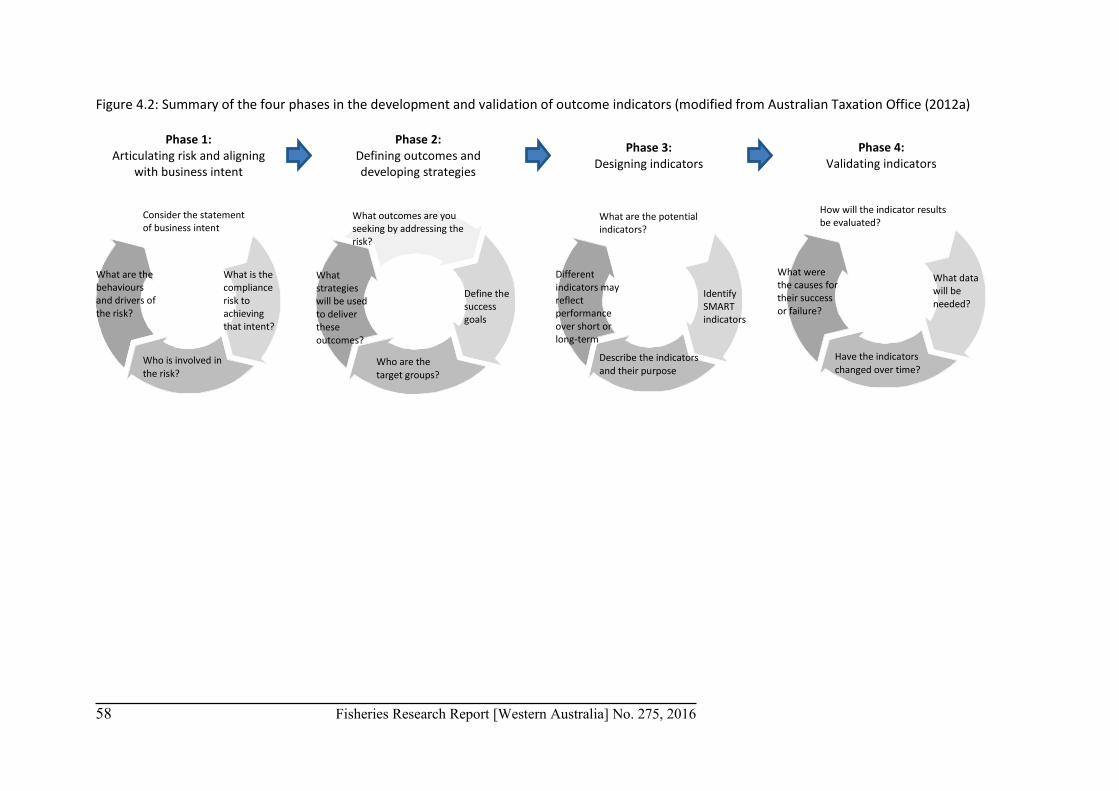
58 Fisheries Research Report [Western Australia] No. 275, 2016
Figure 4.2: Summary of the four phases in the development and validation of outcome indicators (modified from Australian Taxation Office (2012a)
How will the indicator results be evaluated?
Have the indicators changed over time?
What were the causes for their success or failure?
What data will be needed?
What are the potential indicators?
Describe the indicators and their purpose
Different indicators may reflect performance over short or long-term
Identify SMART indicators
Phase 3: Designing indicators
Consider the statement of business intent
Who is involved in the risk?
What are the behaviours and drivers of the risk?
What is the compliance risk to achieving that intent?
Phase 1: Articulating risk and aligning
with business intent
What outcomes are you seeking by addressing the risk?
Who are the target groups?
What strategies will be used to deliver these outcomes?
Define the success goals
Phase 2: Defining outcomes and developing strategies
Phase 4: Validating indicators
Fisheries Research Report [Western Australia] No. 275, 2016 59
Organization for Economic and Cooperative Development 4.1.3.2
The Organization for Economic and Cooperative Development (OECD) published a report that
analyses the experiences of ten OECD countries in the design and implementation of indicators used
to assess the outcomes of environmental enforcement authorities’ efforts to ensure compliance
with pollution prevention and control regulations (Mazur 2010). The report notes that regulatory
agencies’ performance has typically been evaluated through measures of level of activity (i.e., input
and output measures) rather than outcomes. The objective of the study is to help environmental
enforcement authorities to measure the effectiveness of their efforts.
OECD countries included in the study review reported using one or more measures of compliance
rates as intermediate compliance outcome measures, and agencies in England and Wales reported
using some weighted compliance indexes. Reported measures of rates of compliance included:
• Percent of noncompliant facilities out of the number of inspected facilities. (USA, various states)
• Percent of violation-free facilities during initial routine inspections out of the number of initial routine inspections. (USA, state of North Carolina)
• Ratio of the number of inspections that did not identify violations and the total number of inspections. (USA, state of Pennsylvania)
• Hundred percent minus the number of facilities in noncompliance divided by the number of performed inspections. (Australia, state of Victoria)
• Hundred percent minus the number of facilities with significant violations divide by the number of inspected facilities.( USA, various states)
• Hundred percent minus the number of facilities with significant violations divided by the number of inspected facilities (USA, state of Maryland)
• Number of facilities with documented noncompliance (inspection-based) divided by the total number of known regulated facilities. (USA, states of Massachusetts and North Dakota)
• Number of violations of core license conditions over a number of institutions inspected. (Netherlands)
• Number of facilities in compliance with requirements of “best available techniques” under specific environmental regulations. (Netherlands)
• Number of breaches of categories 1 and 2 (levels of significance in an index-based compliance classification scheme), based on targeted inspections. (England and Wales)
Given the challenges associated with the design of compliance assurance outcome indicators, the
author acknowledges that it is not possible to identify a “best practice” approach or a set of
“flawless” indicators. However, several key principles are identified:
• Outcome indicators should only be developed following the identification of a clear
management need, and a plan for how, and by whom, they would be used.
60 Fisheries Research Report [Western Australia] No. 275, 2016
• Outcome indicators should be associated with time-specific targets to integrate strategic
planning and performance management processes.
• Targeting outcome indicators on specific regulatory priorities (e.g., pollutants) improves
analytical rigor, but reduces comparability between enforcement agencies that may have
different priorities.
• Trends analysis of outcome indicators, when conducted in conjunction with an agency’s
input and output indicators, increases their policy relevance.
• Outcome indicators must be regularly reviewed and revised to maintain their objectivity and
relevance.
Industrial Economics, Inc. for U.S. Environmental Protection Agency 4.1.3.3
In 2010, Industrial Economics, Inc. prepared a compliance indexing project for the U.S.
Environmental Protection Agency. This study examined the potential benefits of replacing
conventional measures of compliance, such as compliance rates, with compliance indexes, and
reviewed case studies where this is being done. The paper states that “compliance rates are not
flexible instruments (and) do not provide subtle measures of (compliance) performance…that are
possible with compliance indexing.” Binary measures of whether an inspected vessel or facility was
found to be in or out of compliance, in other words, are less useful for measuring performance than
compliance indices which are expressed in the form of a number (e.g., 7.5 out of 10) representing
the extent to which the vessel or facility is complying with “a pre-identified subset of the facility’s
overall set of compliance obligations”.
The authors examined the use of systems of weights assigned to specific compliance indicators that
make up the compliance index to reflect their relative importance. “Such indicator weights can have
a profound effect on the results of an index and reflect underlying priorities and value judgments
concerning …performance.” The use of weights in a fishery compliance indexing system can help
guide compliance activities (facility and vessel inspections) to address more important types of
violations in order to improve index-based measures of success.
Based on the review of case studies, this report identified four major categories of consideration
when considering the use of compliance indexes rather than overall or regulation-specific binary
measures of compliance rates:
1) Use of Indexes 2) Selection of Indicators that make up Indexes 3) Data collection 4) Weighting of indicators
Fisheries Research Report [Western Australia] No. 275, 2016 61
Based on case study results, the report concludes that key factors that affect the success of
developing and using a compliance indexing system include:
• Selection of whether indicators that make up the index focus on all or a subset of regulatory requirements
• Keeping indicators up to date • Selecting facilities to include in data collection • Streamlining and managing data collection efforts • Maintaining objectivity in the data collection process • Importance of transparency in the weighting scheme • Role of stakeholder outreach in developing the weighting scheme
The use of indices for fisheries compliance measurement is intuitively relevant since implicit in the risk assessment frameworks that underpin most fisheries management regimes is the reality that not all regulations are enforced equally.
Fisheries compliance outcome measurement systems developed or in use 4.1.4
There are large volumes of literature that have been written on the methodologies and assessment
and reporting frameworks for evaluating the effectiveness of programmes using outcome measures.
Health and finance have been a particular focus of attention. Literature relating to policing is less
conspicuous, but not uncommon. The published literature specifically relating to fisheries
compliance and enforcement however, is negligible. Of course, this is not to say that fisheries
enforcement agencies have not engaged in this process, but if they have, their work in this area is
not sufficiently mature to be publically accessible. The following sections describe the efforts of
various enforcement agencies and accreditation bodies with respect to developing outcome
measures.
U.S. Coast Guard 4.1.4.1
The US Coast Guard (USCG) has a publically available outline of performance measures, metrics and
targets for their activities (United States Coast Guard 2004). They have three goals:
Goal 1: To prevent illegal encroachment of the U.S. Exclusive Economic Zone by foreign fishing
vessels, with the performance measurement being to reduce detected incursions by foreign fishing
vessels illegally fishing inside the U.S. Exclusive Economic Zone (EEZ), to 185 or less by 2014;
Goal 2: To effectively enforce federal regulations that provide stewardship of living marine resources
and their environments, with performance measurement being to maintain a 97% or better
observed compliance rate in U.S. domestic fisheries; and
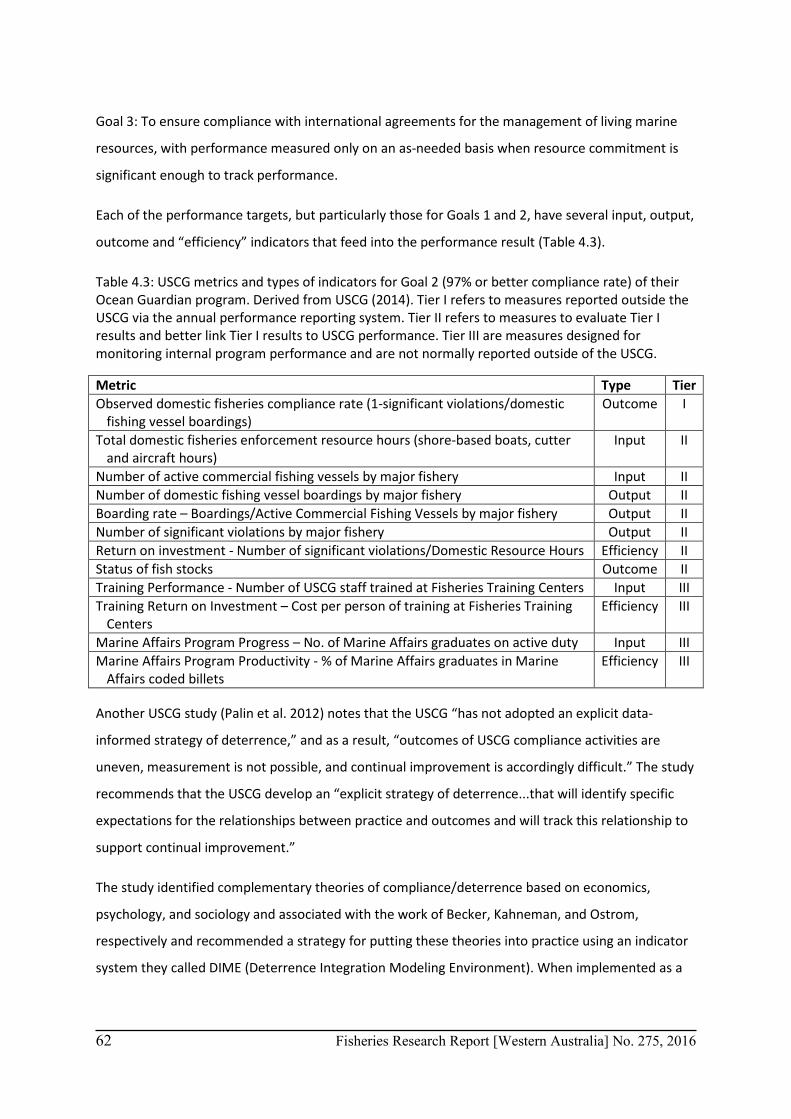
62 Fisheries Research Report [Western Australia] No. 275, 2016
Goal 3: To ensure compliance with international agreements for the management of living marine
resources, with performance measured only on an as-needed basis when resource commitment is
significant enough to track performance.
Each of the performance targets, but particularly those for Goals 1 and 2, have several input, output,
outcome and “efficiency” indicators that feed into the performance result (Table 4.3).
Table 4.3: USCG metrics and types of indicators for Goal 2 (97% or better compliance rate) of their Ocean Guardian program. Derived from USCG (2014). Tier I refers to measures reported outside the USCG via the annual performance reporting system. Tier II refers to measures to evaluate Tier I results and better link Tier I results to USCG performance. Tier III are measures designed for monitoring internal program performance and are not normally reported outside of the USCG.
Metric Type Tier Observed domestic fisheries compliance rate (1-significant violations/domestic
fishing vessel boardings) Outcome I
Total domestic fisheries enforcement resource hours (shore-based boats, cutter and aircraft hours)
Input II
Number of active commercial fishing vessels by major fishery Input II Number of domestic fishing vessel boardings by major fishery Output II Boarding rate – Boardings/Active Commercial Fishing Vessels by major fishery Output II Number of significant violations by major fishery Output II Return on investment - Number of significant violations/Domestic Resource Hours Efficiency II Status of fish stocks Outcome II Training Performance - Number of USCG staff trained at Fisheries Training Centers Input III Training Return on Investment – Cost per person of training at Fisheries Training
Centers Efficiency III
Marine Affairs Program Progress – No. of Marine Affairs graduates on active duty Input III Marine Affairs Program Productivity - % of Marine Affairs graduates in Marine
Affairs coded billets Efficiency III
Another USCG study (Palin et al. 2012) notes that the USCG “has not adopted an explicit data-
informed strategy of deterrence,” and as a result, “outcomes of USCG compliance activities are
uneven, measurement is not possible, and continual improvement is accordingly difficult.” The study
recommends that the USCG develop an “explicit strategy of deterrence...that will identify specific
expectations for the relationships between practice and outcomes and will track this relationship to
support continual improvement.”
The study identified complementary theories of compliance/deterrence based on economics,
psychology, and sociology and associated with the work of Becker, Kahneman, and Ostrom,
respectively and recommended a strategy for putting these theories into practice using an indicator
system they called DIME (Deterrence Integration Modeling Environment). When implemented as a
Fisheries Research Report [Western Australia] No. 275, 2016 63
computer program, DIME becomes part of a continuous improvement feedback loop whereby USCG
actions are performed, influences recorded, deterrence measured, and future actions informed.
The recommended indicators fell into three general categories:
• Instrumental – Probability of Detection, Level of Penalties, Anticipated gain • Normative – Legitimacy, Procedural Justice, Equity • Social – Morality, Social Pressure, Behaviour of others
The authors acknowledge that quantitative measures of legitimacy, morality, justice, social pressure,
equity, and behaviour of others are difficult to define but included a list of fifteen survey questions
that can be used to assess and compare changes in stakeholder perceptions of compliance factors
that cannot be observed directly, such as legitimacy and behaviour of others. Changes in answers to
these questions can be treated as intermediate outcome measures that may be linked to specific
compliance activities.
U.S. National Oceanic and Atmospheric Administration 4.1.4.2
In 2013, the U.S. National Oceanic and Atmospheric Administration (NOAA), Office of Law
Enforcement (OLE) undertook a project titled "Establishing Meaningful Metrics" which was designed
to help NOAA respond to Executive Branch requests for all federal agencies to illustrate how they
planned to undertake "performance based management." Although, that project never resulted in a
publicly released final project, it did result in a publicly released list of preliminary measures related
to enforcement, primarily fishery enforcement, that project team members identified as being
potentially meaningful for purposes of prioritizing and managing enforcement activities. The draft
set of measures to help prioritize and track NOAA’s fishery enforcement efforts was organized as
follows:
• Fishery enforcement “Activities” were grouped into five major categories: Patrol,
Monitoring, Inspection, Investigation, and Compliance Assistance.
• The same four categories of Possible Outcomes/Impacts were identified for each activity:
Sustainable Fisheries Impacts, Protected Resources Impacts, Economic Impacts, and
Compliance Rate Impacts. Specific metrics of Possible Outcomes/Impacts were not
identified.
• Sets of possible metrics associated with inputs and outputs were specified for each activity
and include such measures as:
• Total number of air patrols; results of air patrols. • Total number of sea patrols; number of vessels inspected. • Total number of land patrols; number of vessels and other entities inspected.

64 Fisheries Research Report [Western Australia] No. 275, 2016
• Number of complaints generated from VMS and other monitoring. • Number of interventions that help industry comply with regulations (e.g., warnings). • Compliance Assistance, including formal outreach events and education (e.g., avoiding
gear conflicts, complying with VMS regulations) and participating in council/industry meetings.
• Numbers and types of inspections related to: Gear, Area, Prohibited species, Undersize, Over limit, Condition of fish, Permits, Recordkeeping, False statement, Observer issues, VMS, Sanctuary/ violations.
• Numbers and types of violations detected and regulations cited. • Total number of vessel boardings (VB). • Total number resulting in violation detection (VBV). • VBV/VB = Observed compliance rate for vessels. • Total number of dealer inspections (DI). • Total number resulting in violation detection (DIV). • DIV/DI = observed compliance rate for dealers. • Total number of Civil/Administrative and Criminal investigations initiated. • Total number of investigations forwarded to NOAA OLE for prosecution. • Total number of investigations closed by OLE. • Total number of investigations declined by prosecution. • Total Summary Settlements issued by OLE. • Total Notices of Violation and Assessment issued by the General Counsel. • Total indictments. • Total number of arrests. • Total number of search or admin warrants executed.
It is noteworthy that although the project identified four categories of potential outcomes/impacts
(Sustainable Fisheries Impacts, Protected Resources Impacts, Economic Impacts, Compliance Rate
Impacts), all of the specific metrics identified as being meaningful are inputs and outputs, not
outcomes/impacts. Discussions with NOAA enforcement staff involved in this project indicate that
the project team did not recommend using metrics of enforcement outcomes primarily because they
were either not measurable or not clearly attributable to enforcement activities (e.g., protected
resource, sustainable fisheries impacts, economic impacts).
DGR Consulting Report 4.1.4.3
The firm ‘DGR Consulting’ was engaged in the development of fisheries compliance performance
indicators for all Australian fisheries jurisdictions (DGR Consulting 1996). Their report outlines a
number of draft performance indicators that were formulated during the course of a workshop and
which were deemed by the participants to be suitable for use nationally. The workshop identified
nine goals (termed ‘success’ in the document), each with their own indicators/evaluators of
performance (Table 4.4). Although some elements or close derivatives of these performance
indicators have been used in some Australian jurisdictions, many of the indicators placed heavy
reliance on focus groups and these have not been taken up by any jurisdiction.
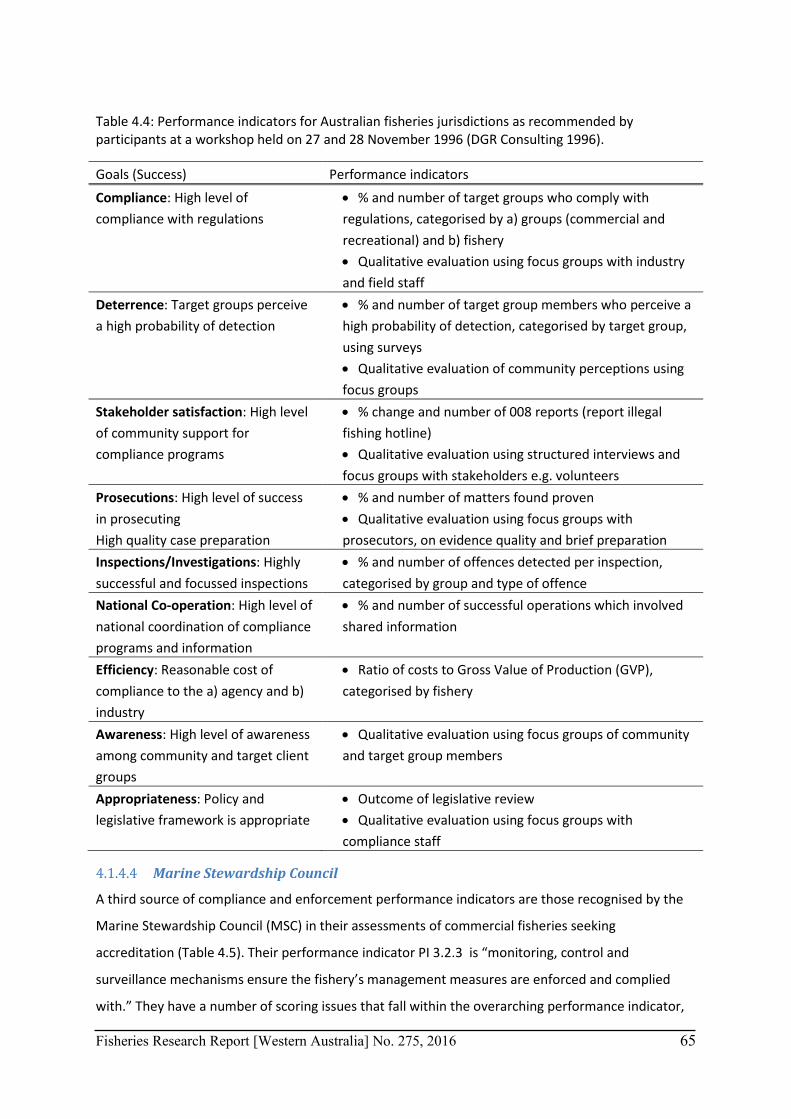
Fisheries Research Report [Western Australia] No. 275, 2016 65
Table 4.4: Performance indicators for Australian fisheries jurisdictions as recommended by participants at a workshop held on 27 and 28 November 1996 (DGR Consulting 1996).
Goals (Success) Performance indicators
Compliance: High level of compliance with regulations
• % and number of target groups who comply with regulations, categorised by a) groups (commercial and recreational) and b) fishery • Qualitative evaluation using focus groups with industry and field staff
Deterrence: Target groups perceive a high probability of detection
• % and number of target group members who perceive a high probability of detection, categorised by target group, using surveys • Qualitative evaluation of community perceptions using focus groups
Stakeholder satisfaction: High level of community support for compliance programs
• % change and number of 008 reports (report illegal fishing hotline) • Qualitative evaluation using structured interviews and focus groups with stakeholders e.g. volunteers
Prosecutions: High level of success in prosecuting High quality case preparation
• % and number of matters found proven • Qualitative evaluation using focus groups with prosecutors, on evidence quality and brief preparation
Inspections/Investigations: Highly successful and focussed inspections
• % and number of offences detected per inspection, categorised by group and type of offence
National Co-operation: High level of national coordination of compliance programs and information
• % and number of successful operations which involved shared information
Efficiency: Reasonable cost of compliance to the a) agency and b) industry
• Ratio of costs to Gross Value of Production (GVP), categorised by fishery
Awareness: High level of awareness among community and target client groups
• Qualitative evaluation using focus groups of community and target group members
Appropriateness: Policy and legislative framework is appropriate
• Outcome of legislative review • Qualitative evaluation using focus groups with compliance staff
Marine Stewardship Council 4.1.4.4
A third source of compliance and enforcement performance indicators are those recognised by the
Marine Stewardship Council (MSC) in their assessments of commercial fisheries seeking
accreditation (Table 4.5). Their performance indicator PI 3.2.3 is “monitoring, control and
surveillance mechanisms ensure the fishery’s management measures are enforced and complied
with.” They have a number of scoring issues that fall within the overarching performance indicator,
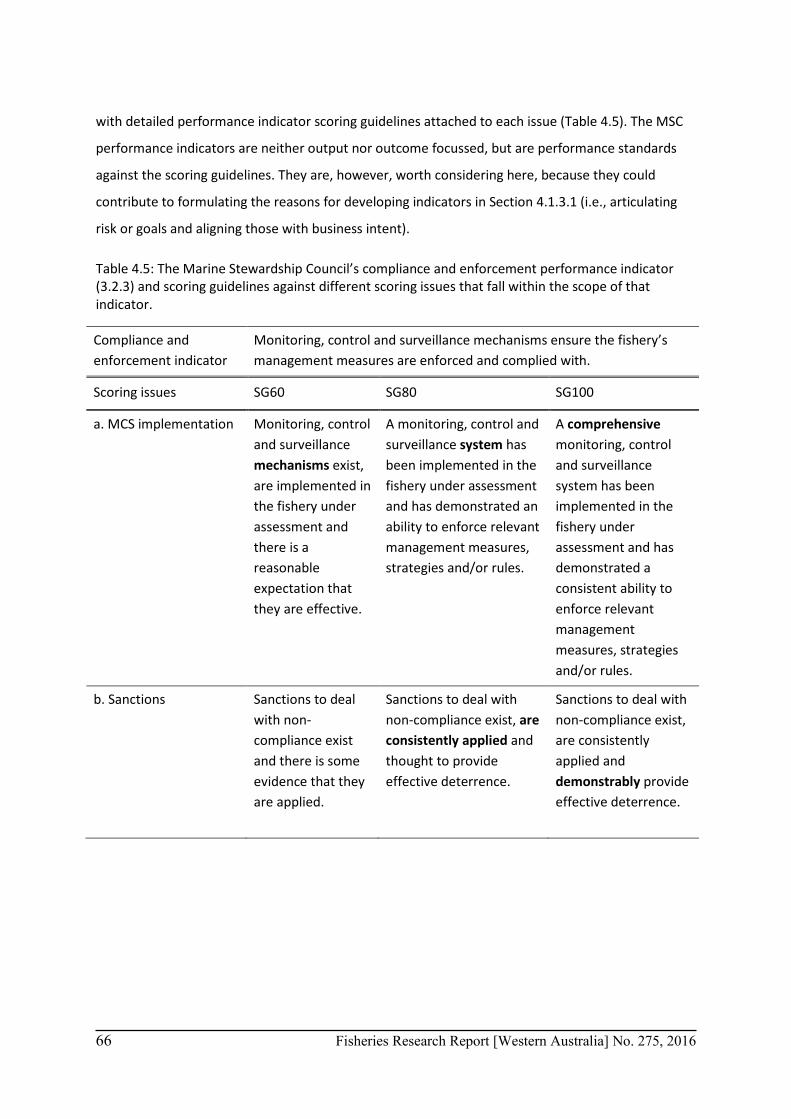
66 Fisheries Research Report [Western Australia] No. 275, 2016
with detailed performance indicator scoring guidelines attached to each issue (Table 4.5). The MSC
performance indicators are neither output nor outcome focussed, but are performance standards
against the scoring guidelines. They are, however, worth considering here, because they could
contribute to formulating the reasons for developing indicators in Section 4.1.3.1 (i.e., articulating
risk or goals and aligning those with business intent).
Table 4.5: The Marine Stewardship Council’s compliance and enforcement performance indicator (3.2.3) and scoring guidelines against different scoring issues that fall within the scope of that indicator.
Compliance and enforcement indicator
Monitoring, control and surveillance mechanisms ensure the fishery’s management measures are enforced and complied with.
Scoring issues SG60 SG80 SG100
a. MCS implementation Monitoring, control and surveillance mechanisms exist, are implemented in the fishery under assessment and there is a reasonable expectation that they are effective.
A monitoring, control and surveillance system has been implemented in the fishery under assessment and has demonstrated an ability to enforce relevant management measures, strategies and/or rules.
A comprehensive monitoring, control and surveillance system has been implemented in the fishery under assessment and has demonstrated a consistent ability to enforce relevant management measures, strategies and/or rules.
b. Sanctions Sanctions to deal with non-compliance exist and there is some evidence that they are applied.
Sanctions to deal with non-compliance exist, are consistently applied and thought to provide effective deterrence.
Sanctions to deal with non-compliance exist, are consistently applied and demonstrably provide effective deterrence.
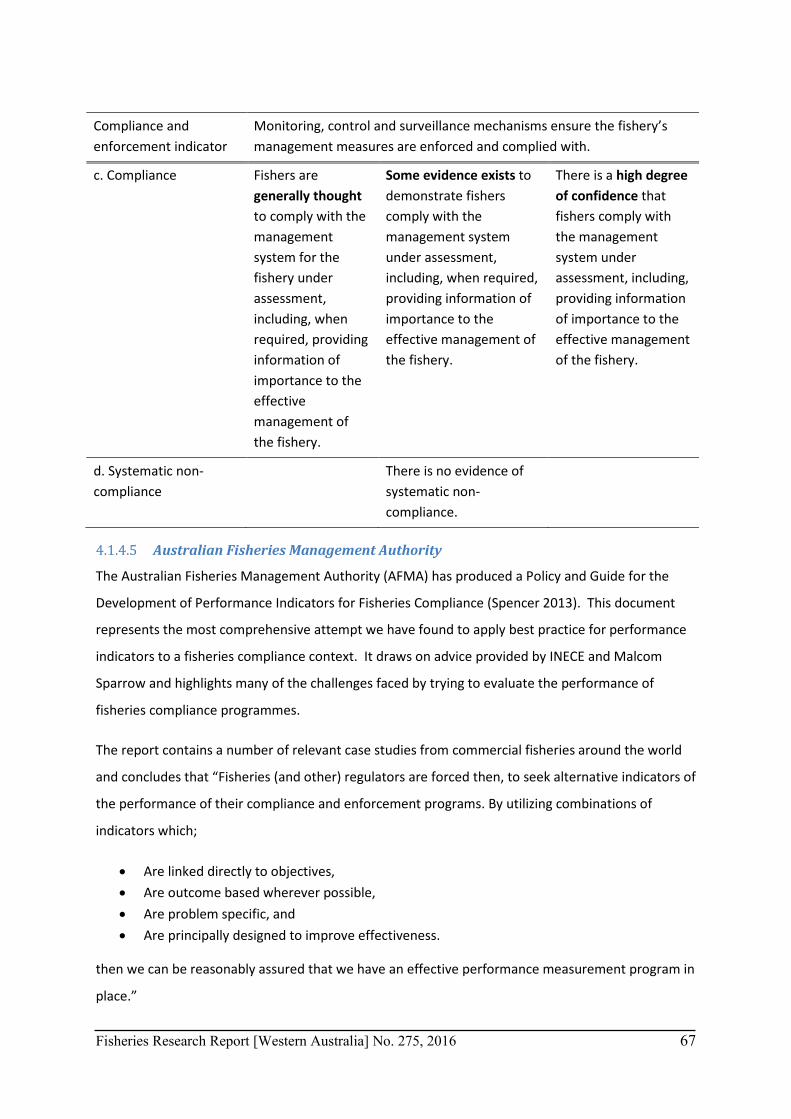
Fisheries Research Report [Western Australia] No. 275, 2016 67
Compliance and enforcement indicator
Monitoring, control and surveillance mechanisms ensure the fishery’s management measures are enforced and complied with.
c. Compliance Fishers are generally thought to comply with the management system for the fishery under assessment, including, when required, providing information of importance to the effective management of the fishery.
Some evidence exists to demonstrate fishers comply with the management system under assessment, including, when required, providing information of importance to the effective management of the fishery.
There is a high degree of confidence that fishers comply with the management system under assessment, including, providing information of importance to the effective management of the fishery.
d. Systematic non-compliance
There is no evidence of systematic non-compliance.
Australian Fisheries Management Authority 4.1.4.5
The Australian Fisheries Management Authority (AFMA) has produced a Policy and Guide for the
Development of Performance Indicators for Fisheries Compliance (Spencer 2013). This document
represents the most comprehensive attempt we have found to apply best practice for performance
indicators to a fisheries compliance context. It draws on advice provided by INECE and Malcom
Sparrow and highlights many of the challenges faced by trying to evaluate the performance of
fisheries compliance programmes.
The report contains a number of relevant case studies from commercial fisheries around the world
and concludes that “Fisheries (and other) regulators are forced then, to seek alternative indicators of
the performance of their compliance and enforcement programs. By utilizing combinations of
indicators which;
• Are linked directly to objectives, • Are outcome based wherever possible, • Are problem specific, and • Are principally designed to improve effectiveness.
then we can be reasonably assured that we have an effective performance measurement program in
place.”
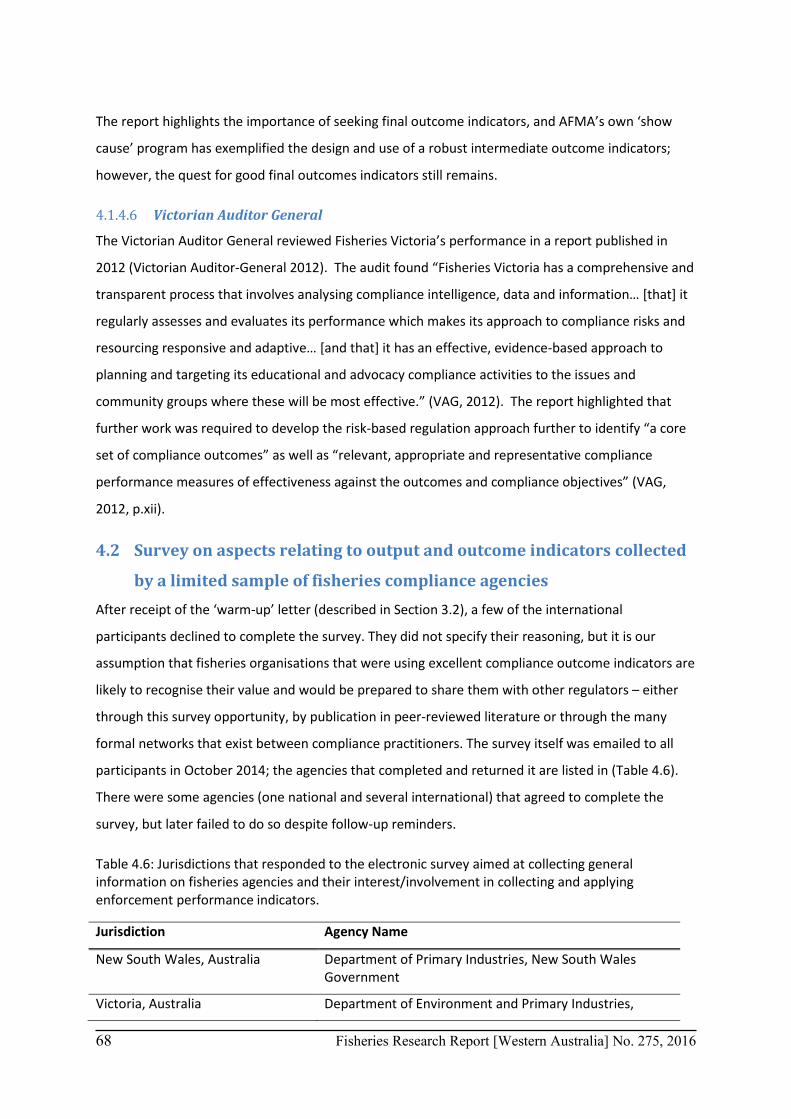
68 Fisheries Research Report [Western Australia] No. 275, 2016
The report highlights the importance of seeking final outcome indicators, and AFMA’s own ‘show
cause’ program has exemplified the design and use of a robust intermediate outcome indicators;
however, the quest for good final outcomes indicators still remains.
Victorian Auditor General 4.1.4.6
The Victorian Auditor General reviewed Fisheries Victoria’s performance in a report published in
2012 (Victorian Auditor-General 2012). The audit found “Fisheries Victoria has a comprehensive and
transparent process that involves analysing compliance intelligence, data and information… [that] it
regularly assesses and evaluates its performance which makes its approach to compliance risks and
resourcing responsive and adaptive… [and that] it has an effective, evidence-based approach to
planning and targeting its educational and advocacy compliance activities to the issues and
community groups where these will be most effective.” (VAG, 2012). The report highlighted that
further work was required to develop the risk-based regulation approach further to identify “a core
set of compliance outcomes” as well as “relevant, appropriate and representative compliance
performance measures of effectiveness against the outcomes and compliance objectives” (VAG,
2012, p.xii).
4.2 Survey on aspects relating to output and outcome indicators collected
by a limited sample of fisheries compliance agencies After receipt of the ‘warm-up’ letter (described in Section 3.2), a few of the international
participants declined to complete the survey. They did not specify their reasoning, but it is our
assumption that fisheries organisations that were using excellent compliance outcome indicators are
likely to recognise their value and would be prepared to share them with other regulators – either
through this survey opportunity, by publication in peer-reviewed literature or through the many
formal networks that exist between compliance practitioners. The survey itself was emailed to all
participants in October 2014; the agencies that completed and returned it are listed in (Table 4.6).
There were some agencies (one national and several international) that agreed to complete the
survey, but later failed to do so despite follow-up reminders.
Table 4.6: Jurisdictions that responded to the electronic survey aimed at collecting general information on fisheries agencies and their interest/involvement in collecting and applying enforcement performance indicators.
Jurisdiction Agency Name
New South Wales, Australia Department of Primary Industries, New South Wales Government
Victoria, Australia Department of Environment and Primary Industries,
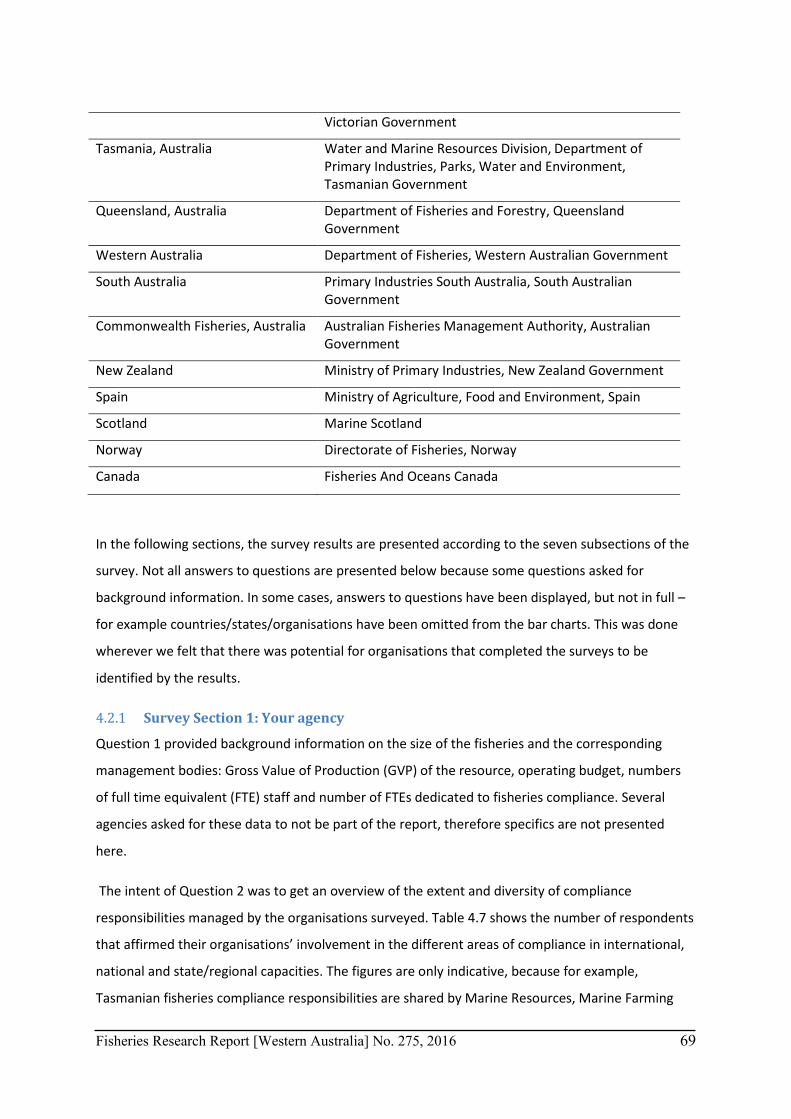
Fisheries Research Report [Western Australia] No. 275, 2016 69
Victorian Government
Tasmania, Australia Water and Marine Resources Division, Department of Primary Industries, Parks, Water and Environment, Tasmanian Government
Queensland, Australia Department of Fisheries and Forestry, Queensland Government
Western Australia Department of Fisheries, Western Australian Government
South Australia Primary Industries South Australia, South Australian Government
Commonwealth Fisheries, Australia Australian Fisheries Management Authority, Australian Government
New Zealand Ministry of Primary Industries, New Zealand Government
Spain Ministry of Agriculture, Food and Environment, Spain
Scotland Marine Scotland
Norway Directorate of Fisheries, Norway
Canada Fisheries And Oceans Canada
In the following sections, the survey results are presented according to the seven subsections of the
survey. Not all answers to questions are presented below because some questions asked for
background information. In some cases, answers to questions have been displayed, but not in full –
for example countries/states/organisations have been omitted from the bar charts. This was done
wherever we felt that there was potential for organisations that completed the surveys to be
identified by the results.
Survey Section 1: Your agency 4.2.1
Question 1 provided background information on the size of the fisheries and the corresponding
management bodies: Gross Value of Production (GVP) of the resource, operating budget, numbers
of full time equivalent (FTE) staff and number of FTEs dedicated to fisheries compliance. Several
agencies asked for these data to not be part of the report, therefore specifics are not presented
here.
The intent of Question 2 was to get an overview of the extent and diversity of compliance
responsibilities managed by the organisations surveyed. Table 4.7 shows the number of respondents
that affirmed their organisations’ involvement in the different areas of compliance in international,
national and state/regional capacities. The figures are only indicative, because for example,
Tasmanian fisheries compliance responsibilities are shared by Marine Resources, Marine Farming
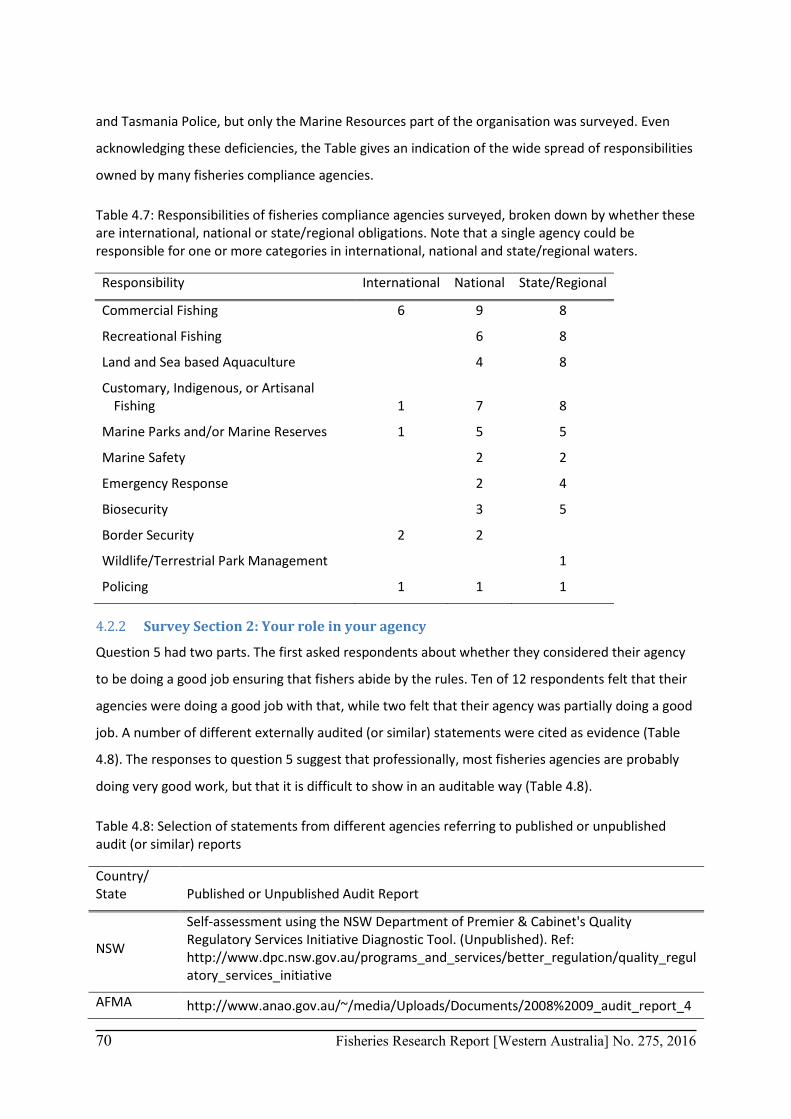
70 Fisheries Research Report [Western Australia] No. 275, 2016
and Tasmania Police, but only the Marine Resources part of the organisation was surveyed. Even
acknowledging these deficiencies, the Table gives an indication of the wide spread of responsibilities
owned by many fisheries compliance agencies.
Table 4.7: Responsibilities of fisheries compliance agencies surveyed, broken down by whether these are international, national or state/regional obligations. Note that a single agency could be responsible for one or more categories in international, national and state/regional waters.
Responsibility International National State/Regional
Commercial Fishing 6 9 8
Recreational Fishing 6 8
Land and Sea based Aquaculture 4 8
Customary, Indigenous, or Artisanal Fishing 1 7 8
Marine Parks and/or Marine Reserves 1 5 5
Marine Safety
2 2
Emergency Response 2 4
Biosecurity
3 5
Border Security 2 2
Wildlife/Terrestrial Park Management 1
Policing 1 1 1
Survey Section 2: Your role in your agency 4.2.2
Question 5 had two parts. The first asked respondents about whether they considered their agency
to be doing a good job ensuring that fishers abide by the rules. Ten of 12 respondents felt that their
agencies were doing a good job with that, while two felt that their agency was partially doing a good
job. A number of different externally audited (or similar) statements were cited as evidence (Table
4.8). The responses to question 5 suggest that professionally, most fisheries agencies are probably
doing very good work, but that it is difficult to show in an auditable way (Table 4.8).
Table 4.8: Selection of statements from different agencies referring to published or unpublished audit (or similar) reports
Country/ State Published or Unpublished Audit Report
NSW
Self-assessment using the NSW Department of Premier & Cabinet's Quality Regulatory Services Initiative Diagnostic Tool. (Unpublished). Ref: http://www.dpc.nsw.gov.au/programs_and_services/better_regulation/quality_regulatory_services_initiative
AFMA http://www.anao.gov.au/~/media/Uploads/Documents/2008%2009_audit_report_4
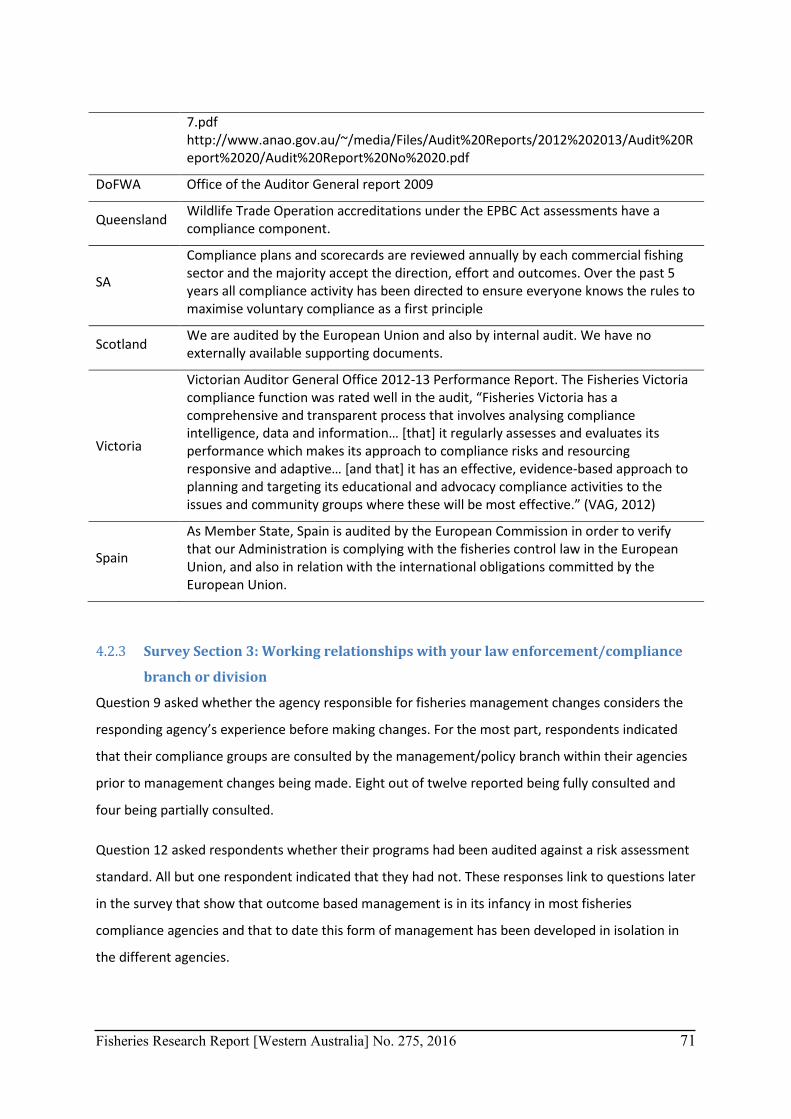
Fisheries Research Report [Western Australia] No. 275, 2016 71
7.pdf http://www.anao.gov.au/~/media/Files/Audit%20Reports/2012%202013/Audit%20Report%2020/Audit%20Report%20No%2020.pdf
DoFWA Office of the Auditor General report 2009
Queensland Wildlife Trade Operation accreditations under the EPBC Act assessments have a compliance component.
SA
Compliance plans and scorecards are reviewed annually by each commercial fishing sector and the majority accept the direction, effort and outcomes. Over the past 5 years all compliance activity has been directed to ensure everyone knows the rules to maximise voluntary compliance as a first principle
Scotland We are audited by the European Union and also by internal audit. We have no externally available supporting documents.
Victoria
Victorian Auditor General Office 2012-13 Performance Report. The Fisheries Victoria compliance function was rated well in the audit, “Fisheries Victoria has a comprehensive and transparent process that involves analysing compliance intelligence, data and information… [that] it regularly assesses and evaluates its performance which makes its approach to compliance risks and resourcing responsive and adaptive… [and that] it has an effective, evidence-based approach to planning and targeting its educational and advocacy compliance activities to the issues and community groups where these will be most effective.” (VAG, 2012)
Spain
As Member State, Spain is audited by the European Commission in order to verify that our Administration is complying with the fisheries control law in the European Union, and also in relation with the international obligations committed by the European Union.
Survey Section 3: Working relationships with your law enforcement/compliance 4.2.3
branch or division
Question 9 asked whether the agency responsible for fisheries management changes considers the
responding agency’s experience before making changes. For the most part, respondents indicated
that their compliance groups are consulted by the management/policy branch within their agencies
prior to management changes being made. Eight out of twelve reported being fully consulted and
four being partially consulted.
Question 12 asked respondents whether their programs had been audited against a risk assessment
standard. All but one respondent indicated that they had not. These responses link to questions later
in the survey that show that outcome based management is in its infancy in most fisheries
compliance agencies and that to date this form of management has been developed in isolation in
the different agencies.
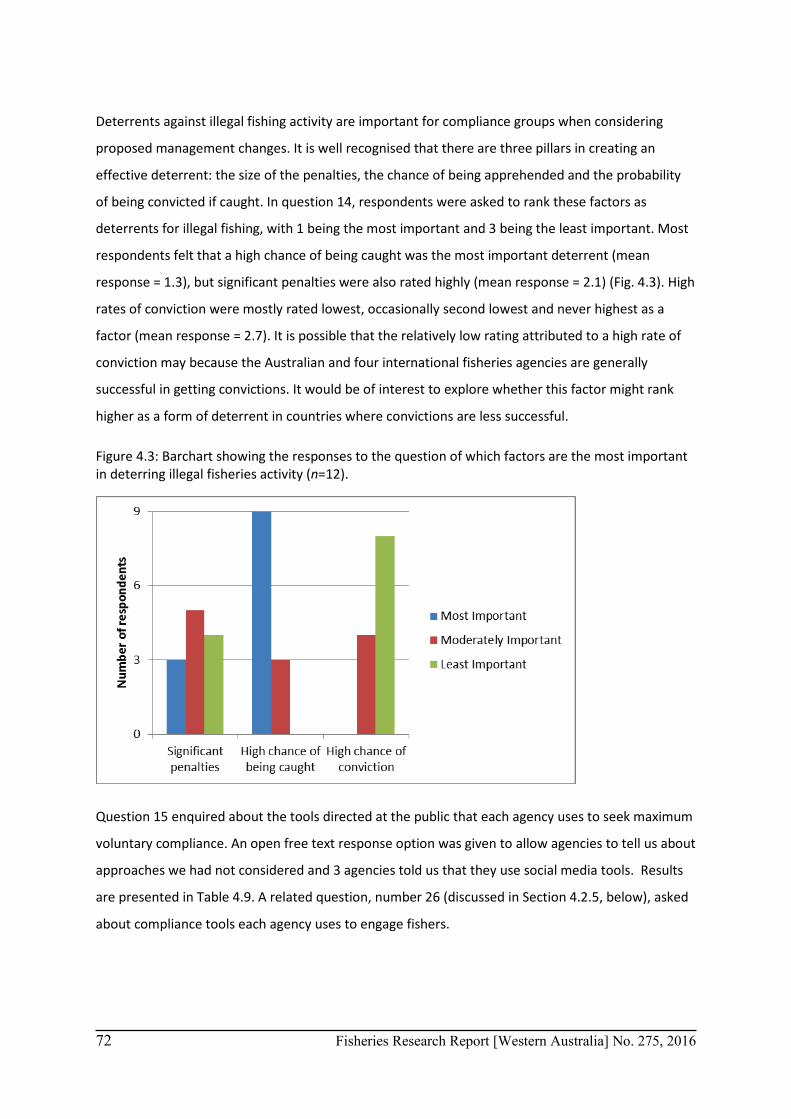
72 Fisheries Research Report [Western Australia] No. 275, 2016
Deterrents against illegal fishing activity are important for compliance groups when considering
proposed management changes. It is well recognised that there are three pillars in creating an
effective deterrent: the size of the penalties, the chance of being apprehended and the probability
of being convicted if caught. In question 14, respondents were asked to rank these factors as
deterrents for illegal fishing, with 1 being the most important and 3 being the least important. Most
respondents felt that a high chance of being caught was the most important deterrent (mean
response = 1.3), but significant penalties were also rated highly (mean response = 2.1) (Fig. 4.3). High
rates of conviction were mostly rated lowest, occasionally second lowest and never highest as a
factor (mean response = 2.7). It is possible that the relatively low rating attributed to a high rate of
conviction may because the Australian and four international fisheries agencies are generally
successful in getting convictions. It would be of interest to explore whether this factor might rank
higher as a form of deterrent in countries where convictions are less successful.
Figure 4.3: Barchart showing the responses to the question of which factors are the most important in deterring illegal fisheries activity (n=12).
Question 15 enquired about the tools directed at the public that each agency uses to seek maximum
voluntary compliance. An open free text response option was given to allow agencies to tell us about
approaches we had not considered and 3 agencies told us that they use social media tools. Results
are presented in Table 4.9. A related question, number 26 (discussed in Section 4.2.5, below), asked
about compliance tools each agency uses to engage fishers.
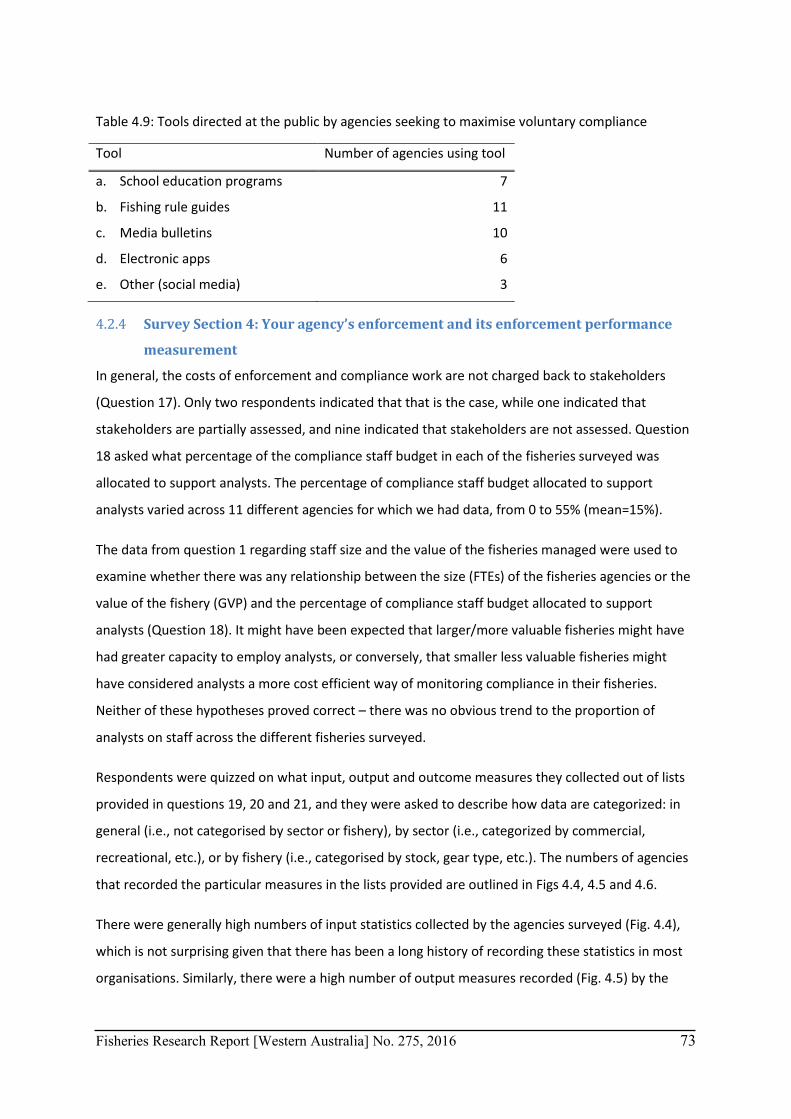
Fisheries Research Report [Western Australia] No. 275, 2016 73
Table 4.9: Tools directed at the public by agencies seeking to maximise voluntary compliance
Tool Number of agencies using tool
a. School education programs 7
b. Fishing rule guides 11
c. Media bulletins 10
d. Electronic apps 6
e. Other (social media) 3
Survey Section 4: Your agency’s enforcement and its enforcement performance 4.2.4
measurement
In general, the costs of enforcement and compliance work are not charged back to stakeholders
(Question 17). Only two respondents indicated that that is the case, while one indicated that
stakeholders are partially assessed, and nine indicated that stakeholders are not assessed. Question
18 asked what percentage of the compliance staff budget in each of the fisheries surveyed was
allocated to support analysts. The percentage of compliance staff budget allocated to support
analysts varied across 11 different agencies for which we had data, from 0 to 55% (mean=15%).
The data from question 1 regarding staff size and the value of the fisheries managed were used to
examine whether there was any relationship between the size (FTEs) of the fisheries agencies or the
value of the fishery (GVP) and the percentage of compliance staff budget allocated to support
analysts (Question 18). It might have been expected that larger/more valuable fisheries might have
had greater capacity to employ analysts, or conversely, that smaller less valuable fisheries might
have considered analysts a more cost efficient way of monitoring compliance in their fisheries.
Neither of these hypotheses proved correct – there was no obvious trend to the proportion of
analysts on staff across the different fisheries surveyed.
Respondents were quizzed on what input, output and outcome measures they collected out of lists
provided in questions 19, 20 and 21, and they were asked to describe how data are categorized: in
general (i.e., not categorised by sector or fishery), by sector (i.e., categorized by commercial,
recreational, etc.), or by fishery (i.e., categorised by stock, gear type, etc.). The numbers of agencies
that recorded the particular measures in the lists provided are outlined in Figs 4.4, 4.5 and 4.6.
There were generally high numbers of input statistics collected by the agencies surveyed (Fig. 4.4),
which is not surprising given that there has been a long history of recording these statistics in most
organisations. Similarly, there were a high number of output measures recorded (Fig. 4.5) by the
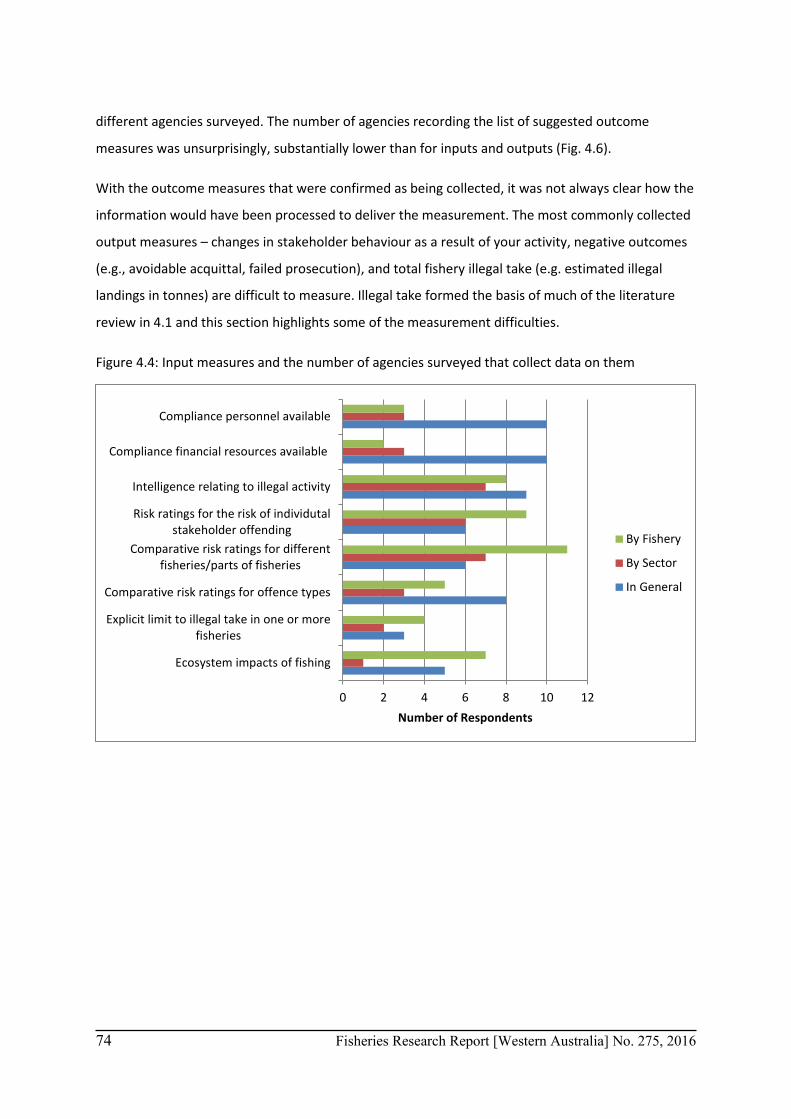
74 Fisheries Research Report [Western Australia] No. 275, 2016
different agencies surveyed. The number of agencies recording the list of suggested outcome
measures was unsurprisingly, substantially lower than for inputs and outputs (Fig. 4.6).
With the outcome measures that were confirmed as being collected, it was not always clear how the
information would have been processed to deliver the measurement. The most commonly collected
output measures – changes in stakeholder behaviour as a result of your activity, negative outcomes
(e.g., avoidable acquittal, failed prosecution), and total fishery illegal take (e.g. estimated illegal
landings in tonnes) are difficult to measure. Illegal take formed the basis of much of the literature
review in 4.1 and this section highlights some of the measurement difficulties.
Figure 4.4: Input measures and the number of agencies surveyed that collect data on them
0 2 4 6 8 10 12
Ecosystem impacts of fishing
Explicit limit to illegal take in one or morefisheries
Comparative risk ratings for offence types
Comparative risk ratings for differentfisheries/parts of fisheries
Risk ratings for the risk of individutalstakeholder offending
Intelligence relating to illegal activity
Compliance financial resources available
Compliance personnel available
Number of Respondents
By Fishery
By Sector
In General
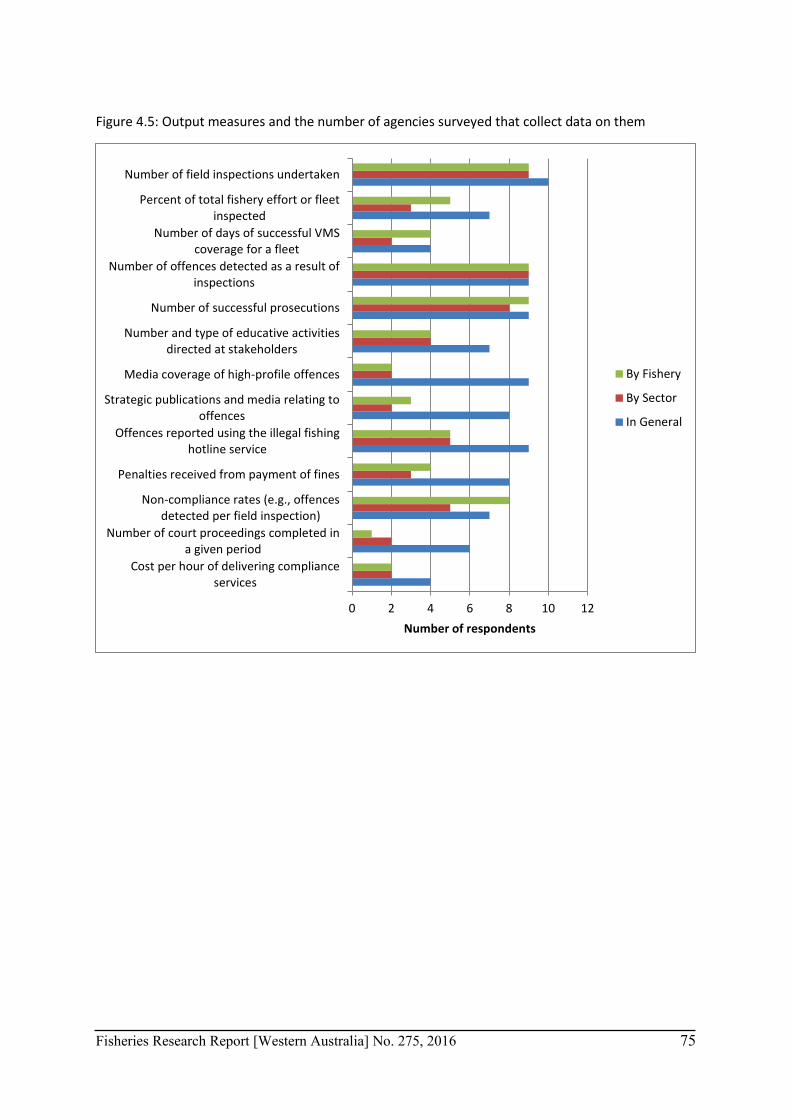
Fisheries Research Report [Western Australia] No. 275, 2016 75
Figure 4.5: Output measures and the number of agencies surveyed that collect data on them
0 2 4 6 8 10 12
Cost per hour of delivering complianceservices
Number of court proceedings completed ina given period
Non-compliance rates (e.g., offencesdetected per field inspection)
Penalties received from payment of fines
Offences reported using the illegal fishinghotline service
Strategic publications and media relating tooffences
Media coverage of high-profile offences
Number and type of educative activitiesdirected at stakeholders
Number of successful prosecutions
Number of offences detected as a result ofinspections
Number of days of successful VMScoverage for a fleet
Percent of total fishery effort or fleetinspected
Number of field inspections undertaken
Number of respondents
By Fishery
By Sector
In General
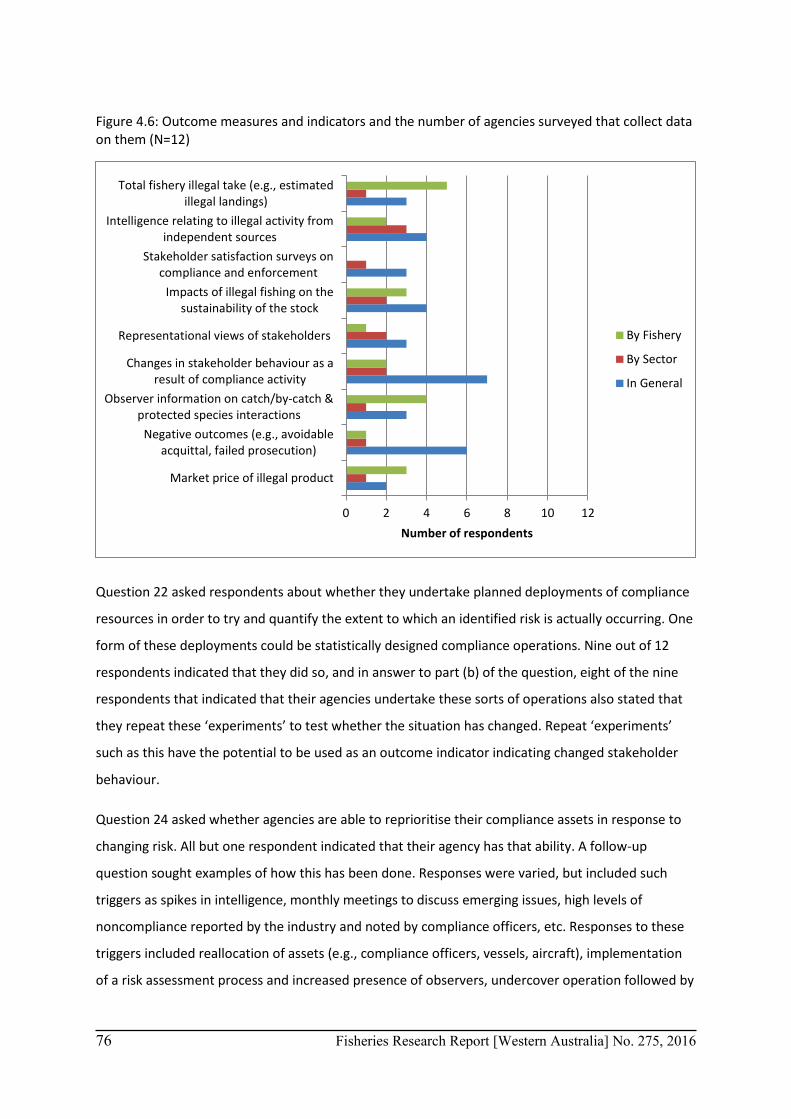
76 Fisheries Research Report [Western Australia] No. 275, 2016
Figure 4.6: Outcome measures and indicators and the number of agencies surveyed that collect data on them (N=12)
Question 22 asked respondents about whether they undertake planned deployments of compliance
resources in order to try and quantify the extent to which an identified risk is actually occurring. One
form of these deployments could be statistically designed compliance operations. Nine out of 12
respondents indicated that they did so, and in answer to part (b) of the question, eight of the nine
respondents that indicated that their agencies undertake these sorts of operations also stated that
they repeat these ‘experiments’ to test whether the situation has changed. Repeat ‘experiments’
such as this have the potential to be used as an outcome indicator indicating changed stakeholder
behaviour.
Question 24 asked whether agencies are able to reprioritise their compliance assets in response to
changing risk. All but one respondent indicated that their agency has that ability. A follow-up
question sought examples of how this has been done. Responses were varied, but included such
triggers as spikes in intelligence, monthly meetings to discuss emerging issues, high levels of
noncompliance reported by the industry and noted by compliance officers, etc. Responses to these
triggers included reallocation of assets (e.g., compliance officers, vessels, aircraft), implementation
of a risk assessment process and increased presence of observers, undercover operation followed by
0 2 4 6 8 10 12
Market price of illegal product
Negative outcomes (e.g., avoidableacquittal, failed prosecution)
Observer information on catch/by-catch &protected species interactions
Changes in stakeholder behaviour as aresult of compliance activity
Representational views of stakeholders
Impacts of illegal fishing on thesustainability of the stock
Stakeholder satisfaction surveys oncompliance and enforcement
Intelligence relating to illegal activity fromindependent sources
Total fishery illegal take (e.g., estimatedillegal landings)
Number of respondents
By Fishery
By Sector
In General
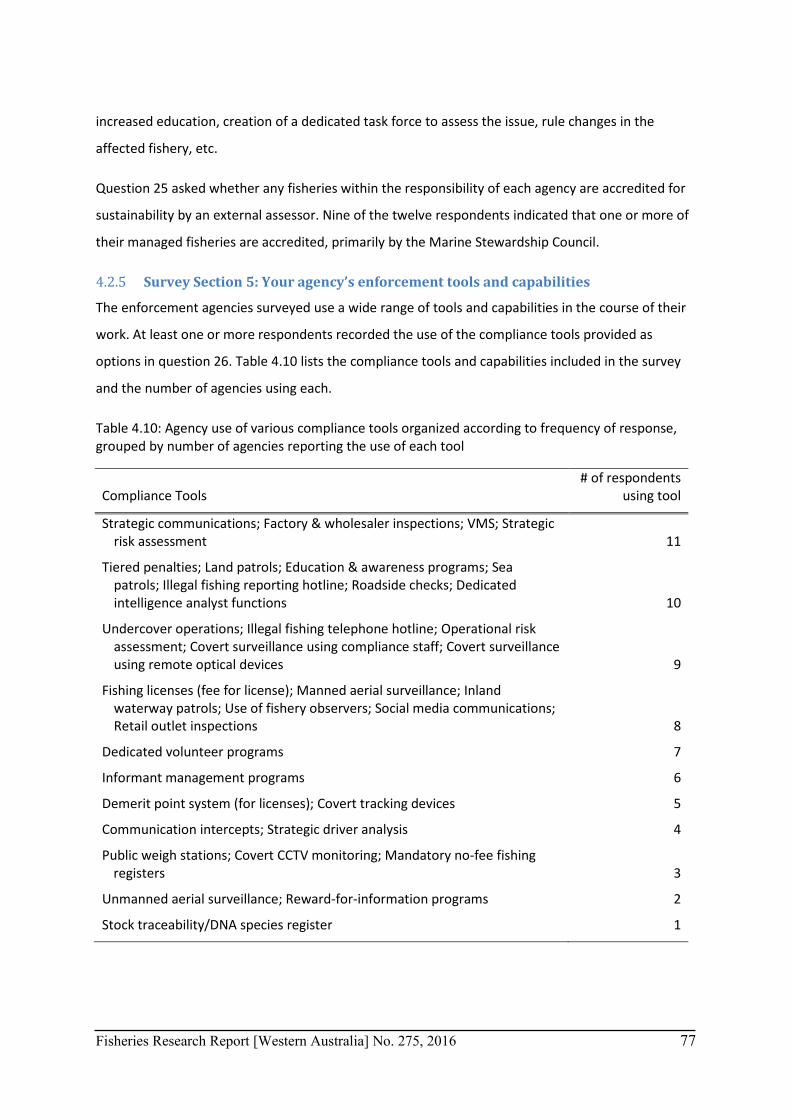
Fisheries Research Report [Western Australia] No. 275, 2016 77
increased education, creation of a dedicated task force to assess the issue, rule changes in the
affected fishery, etc.
Question 25 asked whether any fisheries within the responsibility of each agency are accredited for
sustainability by an external assessor. Nine of the twelve respondents indicated that one or more of
their managed fisheries are accredited, primarily by the Marine Stewardship Council.
Survey Section 5: Your agency’s enforcement tools and capabilities 4.2.5
The enforcement agencies surveyed use a wide range of tools and capabilities in the course of their
work. At least one or more respondents recorded the use of the compliance tools provided as
options in question 26. Table 4.10 lists the compliance tools and capabilities included in the survey
and the number of agencies using each.
Table 4.10: Agency use of various compliance tools organized according to frequency of response, grouped by number of agencies reporting the use of each tool
Compliance Tools # of respondents
using tool
Strategic communications; Factory & wholesaler inspections; VMS; Strategic risk assessment 11
Tiered penalties; Land patrols; Education & awareness programs; Sea patrols; Illegal fishing reporting hotline; Roadside checks; Dedicated intelligence analyst functions 10
Undercover operations; Illegal fishing telephone hotline; Operational risk assessment; Covert surveillance using compliance staff; Covert surveillance using remote optical devices 9
Fishing licenses (fee for license); Manned aerial surveillance; Inland waterway patrols; Use of fishery observers; Social media communications; Retail outlet inspections 8
Dedicated volunteer programs 7
Informant management programs 6
Demerit point system (for licenses); Covert tracking devices 5
Communication intercepts; Strategic driver analysis 4
Public weigh stations; Covert CCTV monitoring; Mandatory no-fee fishing registers 3
Unmanned aerial surveillance; Reward-for-information programs 2
Stock traceability/DNA species register 1
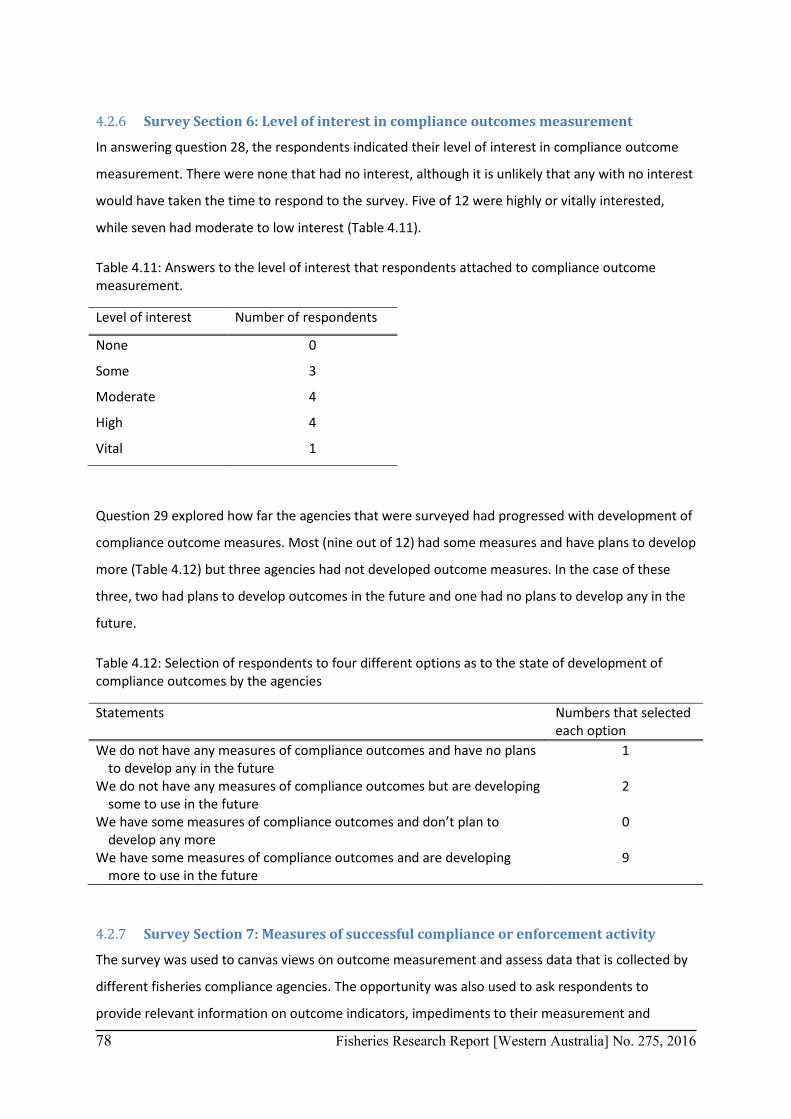
78 Fisheries Research Report [Western Australia] No. 275, 2016
Survey Section 6: Level of interest in compliance outcomes measurement 4.2.6
In answering question 28, the respondents indicated their level of interest in compliance outcome
measurement. There were none that had no interest, although it is unlikely that any with no interest
would have taken the time to respond to the survey. Five of 12 were highly or vitally interested,
while seven had moderate to low interest (Table 4.11).
Table 4.11: Answers to the level of interest that respondents attached to compliance outcome measurement.
Level of interest Number of respondents
None 0
Some 3
Moderate 4
High 4
Vital 1
Question 29 explored how far the agencies that were surveyed had progressed with development of
compliance outcome measures. Most (nine out of 12) had some measures and have plans to develop
more (Table 4.12) but three agencies had not developed outcome measures. In the case of these
three, two had plans to develop outcomes in the future and one had no plans to develop any in the
future.
Table 4.12: Selection of respondents to four different options as to the state of development of compliance outcomes by the agencies
Statements Numbers that selected each option
We do not have any measures of compliance outcomes and have no plans to develop any in the future
1
We do not have any measures of compliance outcomes but are developing some to use in the future
2
We have some measures of compliance outcomes and don’t plan to develop any more
0
We have some measures of compliance outcomes and are developing more to use in the future
9
Survey Section 7: Measures of successful compliance or enforcement activity 4.2.7
The survey was used to canvas views on outcome measurement and assess data that is collected by
different fisheries compliance agencies. The opportunity was also used to ask respondents to
provide relevant information on outcome indicators, impediments to their measurement and
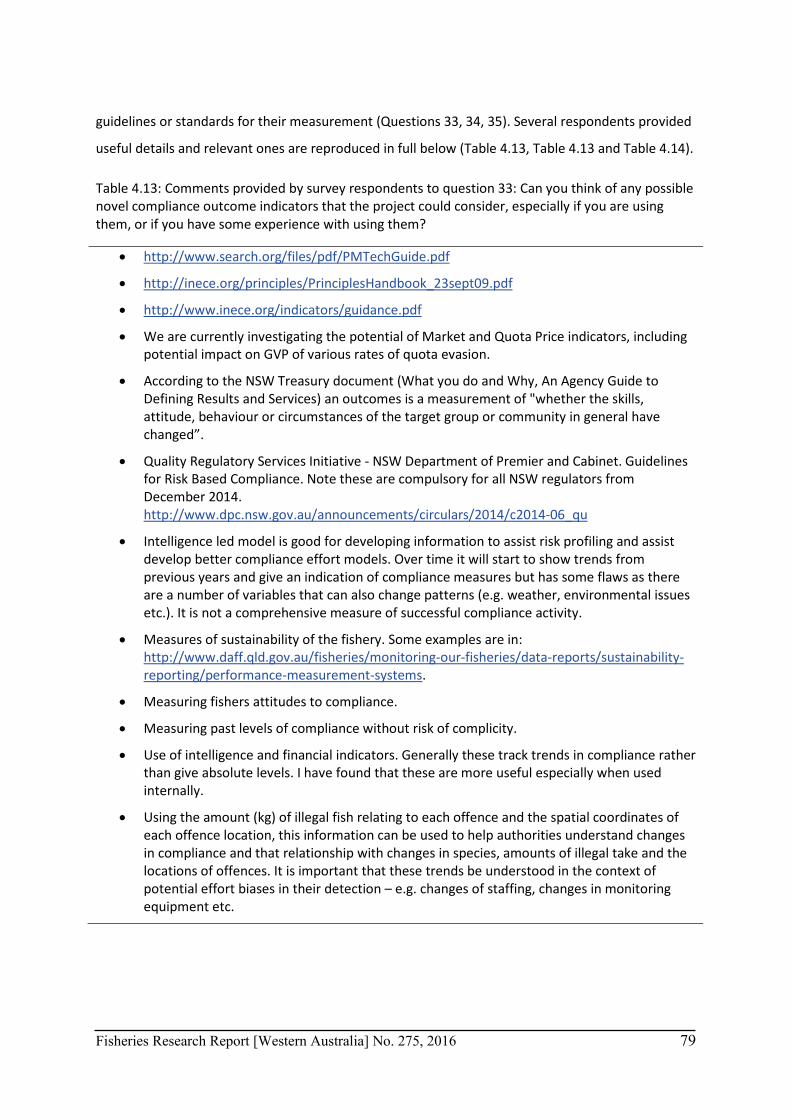
Fisheries Research Report [Western Australia] No. 275, 2016 79
guidelines or standards for their measurement (Questions 33, 34, 35). Several respondents provided
useful details and relevant ones are reproduced in full below (Table 4.13, Table 4.13 and Table 4.14).
Table 4.13: Comments provided by survey respondents to question 33: Can you think of any possible novel compliance outcome indicators that the project could consider, especially if you are using them, or if you have some experience with using them?
• http://www.search.org/files/pdf/PMTechGuide.pdf
• http://inece.org/principles/PrinciplesHandbook_23sept09.pdf
• http://www.inece.org/indicators/guidance.pdf
• We are currently investigating the potential of Market and Quota Price indicators, including potential impact on GVP of various rates of quota evasion.
• According to the NSW Treasury document (What you do and Why, An Agency Guide to Defining Results and Services) an outcomes is a measurement of "whether the skills, attitude, behaviour or circumstances of the target group or community in general have changed”.
• Quality Regulatory Services Initiative - NSW Department of Premier and Cabinet. Guidelines for Risk Based Compliance. Note these are compulsory for all NSW regulators from December 2014. http://www.dpc.nsw.gov.au/announcements/circulars/2014/c2014-06_qu
• Intelligence led model is good for developing information to assist risk profiling and assist develop better compliance effort models. Over time it will start to show trends from previous years and give an indication of compliance measures but has some flaws as there are a number of variables that can also change patterns (e.g. weather, environmental issues etc.). It is not a comprehensive measure of successful compliance activity.
• Measures of sustainability of the fishery. Some examples are in: http://www.daff.qld.gov.au/fisheries/monitoring-our-fisheries/data-reports/sustainability-reporting/performance-measurement-systems.
• Measuring fishers attitudes to compliance.
• Measuring past levels of compliance without risk of complicity.
• Use of intelligence and financial indicators. Generally these track trends in compliance rather than give absolute levels. I have found that these are more useful especially when used internally.
• Using the amount (kg) of illegal fish relating to each offence and the spatial coordinates of each offence location, this information can be used to help authorities understand changes in compliance and that relationship with changes in species, amounts of illegal take and the locations of offences. It is important that these trends be understood in the context of potential effort biases in their detection – e.g. changes of staffing, changes in monitoring equipment etc.
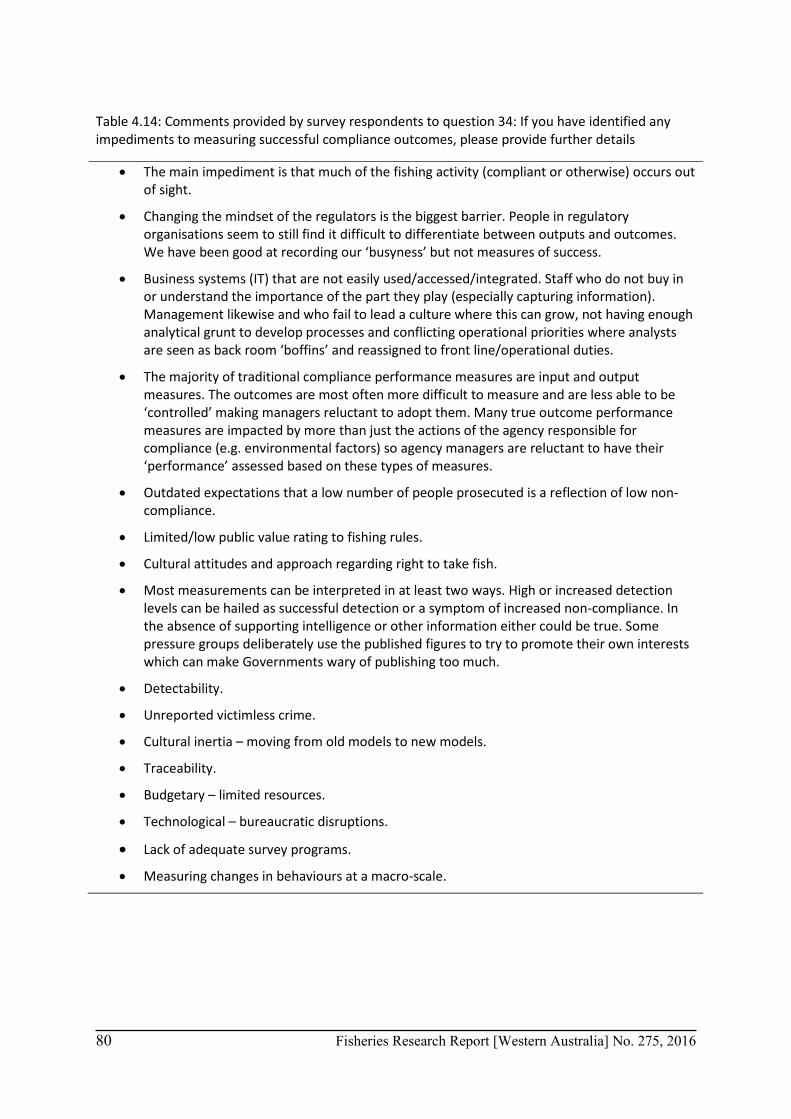
80 Fisheries Research Report [Western Australia] No. 275, 2016
Table 4.14: Comments provided by survey respondents to question 34: If you have identified any impediments to measuring successful compliance outcomes, please provide further details
• The main impediment is that much of the fishing activity (compliant or otherwise) occurs out of sight.
• Changing the mindset of the regulators is the biggest barrier. People in regulatory organisations seem to still find it difficult to differentiate between outputs and outcomes. We have been good at recording our ‘busyness’ but not measures of success.
• Business systems (IT) that are not easily used/accessed/integrated. Staff who do not buy in or understand the importance of the part they play (especially capturing information). Management likewise and who fail to lead a culture where this can grow, not having enough analytical grunt to develop processes and conflicting operational priorities where analysts are seen as back room ‘boffins’ and reassigned to front line/operational duties.
• The majority of traditional compliance performance measures are input and output measures. The outcomes are most often more difficult to measure and are less able to be ‘controlled’ making managers reluctant to adopt them. Many true outcome performance measures are impacted by more than just the actions of the agency responsible for compliance (e.g. environmental factors) so agency managers are reluctant to have their ‘performance’ assessed based on these types of measures.
• Outdated expectations that a low number of people prosecuted is a reflection of low non-compliance.
• Limited/low public value rating to fishing rules.
• Cultural attitudes and approach regarding right to take fish.
• Most measurements can be interpreted in at least two ways. High or increased detection levels can be hailed as successful detection or a symptom of increased non-compliance. In the absence of supporting intelligence or other information either could be true. Some pressure groups deliberately use the published figures to try to promote their own interests which can make Governments wary of publishing too much.
• Detectability.
• Unreported victimless crime.
• Cultural inertia – moving from old models to new models.
• Traceability.
• Budgetary – limited resources.
• Technological – bureaucratic disruptions.
• Lack of adequate survey programs.
• Measuring changes in behaviours at a macro-scale.
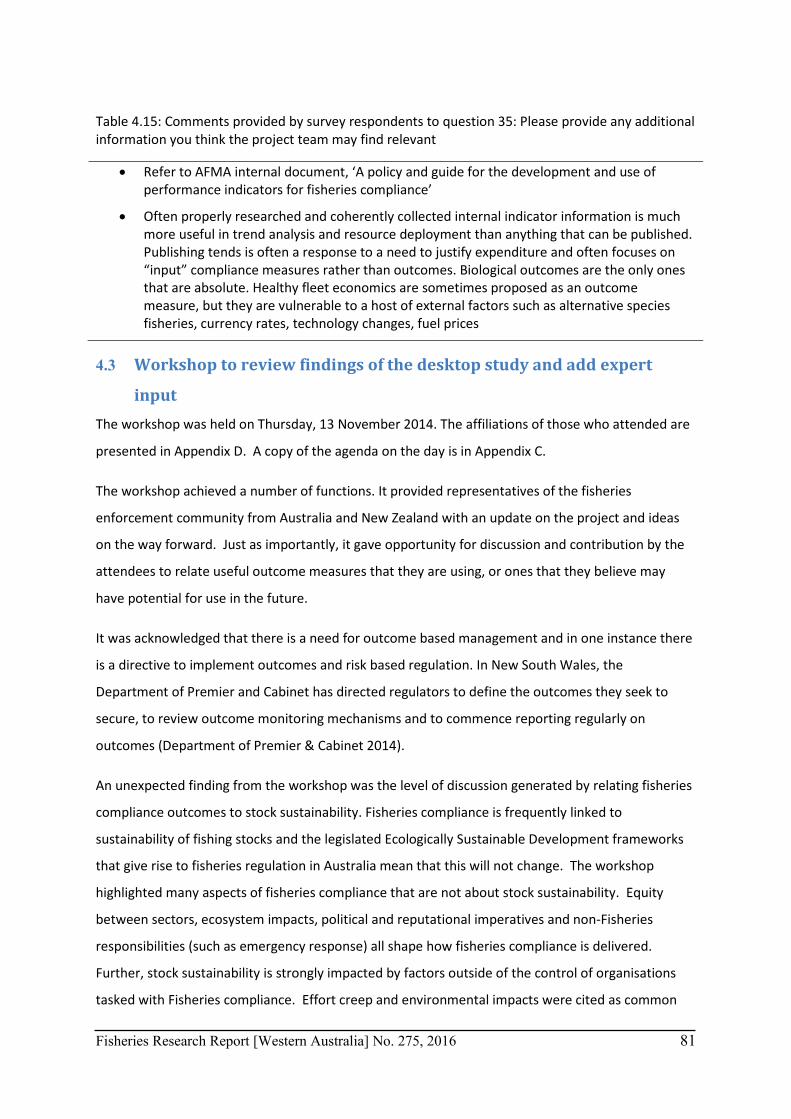
Fisheries Research Report [Western Australia] No. 275, 2016 81
Table 4.15: Comments provided by survey respondents to question 35: Please provide any additional information you think the project team may find relevant
• Refer to AFMA internal document, ‘A policy and guide for the development and use of performance indicators for fisheries compliance’
• Often properly researched and coherently collected internal indicator information is much more useful in trend analysis and resource deployment than anything that can be published. Publishing tends is often a response to a need to justify expenditure and often focuses on “input” compliance measures rather than outcomes. Biological outcomes are the only ones that are absolute. Healthy fleet economics are sometimes proposed as an outcome measure, but they are vulnerable to a host of external factors such as alternative species fisheries, currency rates, technology changes, fuel prices
4.3 Workshop to review findings of the desktop study and add expert
input
The workshop was held on Thursday, 13 November 2014. The affiliations of those who attended are
presented in Appendix D. A copy of the agenda on the day is in Appendix C.
The workshop achieved a number of functions. It provided representatives of the fisheries
enforcement community from Australia and New Zealand with an update on the project and ideas
on the way forward. Just as importantly, it gave opportunity for discussion and contribution by the
attendees to relate useful outcome measures that they are using, or ones that they believe may
have potential for use in the future.
It was acknowledged that there is a need for outcome based management and in one instance there
is a directive to implement outcomes and risk based regulation. In New South Wales, the
Department of Premier and Cabinet has directed regulators to define the outcomes they seek to
secure, to review outcome monitoring mechanisms and to commence reporting regularly on
outcomes (Department of Premier & Cabinet 2014).
An unexpected finding from the workshop was the level of discussion generated by relating fisheries
compliance outcomes to stock sustainability. Fisheries compliance is frequently linked to
sustainability of fishing stocks and the legislated Ecologically Sustainable Development frameworks
that give rise to fisheries regulation in Australia mean that this will not change. The workshop
highlighted many aspects of fisheries compliance that are not about stock sustainability. Equity
between sectors, ecosystem impacts, political and reputational imperatives and non-Fisheries
responsibilities (such as emergency response) all shape how fisheries compliance is delivered.
Further, stock sustainability is strongly impacted by factors outside of the control of organisations
tasked with Fisheries compliance. Effort creep and environmental impacts were cited as common
82 Fisheries Research Report [Western Australia] No. 275, 2016
reasons for sustainability pressures, and while excessive illegal fishing would undoubtedly be a bad
outcome – both for fish stocks and regulator reputation, it was not immediately obvious how stock
sustainability could be used as a robust, transparent measure of fisheries compliance outcomes.
Presentations by representatives of the Australian Taxation Office and the Australian Crime
Commission gave participants an insight into more extensive process that needs to be followed in
developing outcomes in a logical and structured way. The need for this structured, ordered process
was highlighted in group discussions which revealed the diverse views about what good compliance
outcomes would look like in practice.
4.4 Documenting best practice Outcomes from discussions at the workshop (4.3) and from the survey of output and outcome
indicators collected by national and some international fisheries compliance agencies (4.2) have
provided this project with the status of outcome indicators across a selection of forward thinking
compliance agencies. It has also allowed the status of outcome – based management in these
organisations to be contrasted against work that has been done in this field in the Australian
Taxation Office (ATO) and the Australian Crime Commission (ACC). Those two organisations have
been active in the field of development of outcome based management for several years and have
achieved a high level of practice that can be used as a benchmark for those newer to this subject.
To summarise previous sections (4.2 and 4.3), there are different levels of development of outcome
indicators across compliance agencies within Australia and New Zealand. Several have outcome
indicators and are developing more, while others have none but have plans to develop them. None
have a comprehensive suite of compliance outcome indicators currently in place.
The experience of the ATO and ACC with the development of outcome indicators is that it is a task
that needs to follow a comprehensive progression from conceptualisation through different
iterations of refinement, all the way including consultation with staff/co-workers and stakeholders.
This depth of representation required is also highlighted by the case studies covered in the work of
Moore (2013) to ensure that outcome reporting remains balanced.
The lack of documentation on Departmental websites shows that agencies surveyed by this study
that have outcome indicators are using them internally. They have yet to be used for reporting to
stakeholders and for benchmarking against other organisations. Documenting best-practice is not
possible until a speciality reaches a certain level of maturity and visibility. Only then can the
generalisation, comparison and review processes begin that result in the formulation of best-
Fisheries Research Report [Western Australia] No. 275, 2016 83
practice. In our opinion, Fisheries Outcome Measurement has not yet reached that level of
maturity.
5 Conclusion This report reviews work done to date on fisheries compliance outcome measurement. A review of
published peer-reviewed academic literature found little guidance on how to implement fisheries
compliance outcome measures, nor descriptions of suitable fisheries compliance outcome measures
themselves. There has been some considerable work on quantifying illegal catch – which is one
fisheries compliance outcome measure (section 4.1.2).
Outside the literature, we found that some compliance agencies, including fisheries, have made
varying progress in developing compliance outcome measures, but that fisheries compliance has so
far lacked the structure and rigour that has been applied to trying to measure policing outcomes
using a public value approach (section 4.1.3).
In order to benchmark current practice with regards to fisheries compliance outcome measurement,
a survey of fisheries organisations was conducted and their responses documented in section 4.2.
Finally a workshop was held with multiple fisheries regulation agencies as well as representatives
from ATO and ACC in order to discuss development of outcome measures and explore best practice,
as described in section 4.3.
Overall we find:
• For purposes of measurement and tracking compliance, outcomes fall into three general
categories:
o immediate (e.g., observed compliance rates),
o intermediate (e.g., changes in behaviour such as increases in compliance rates), and
o final (e.g., improvements in fisheries that result from increases in compliance rates).
• Measuring fisheries compliance outcomes is intrinsically difficult because fisheries
compliance tackles harms that are invisible, can involve a conscious opponent and many of
the harms only manifest themselves slowly.
• The survey conducted on local and international fisheries compliance agencies suggested
that outcome-based management is in its infancy in most fisheries compliance agencies, but
that most agencies had a high degree of interest in outcome-based compliance
84 Fisheries Research Report [Western Australia] No. 275, 2016
management, and most (but not all) have developed or are attempting to develop
compliance outcome measures.
• Compliance input and output measures reflect levels of effort aimed at achieving
compliance outcomes, but do not reflect the extent to which those efforts are succeeding.
However, they are important for interpreting changes in outcomes that may be influenced
by changes in compliance inputs and outputs and many other factors, and for understanding
biases in data collected.
• Fishery compliance outcome measures cannot be interpreted without an analysis of how
other factors that affect conditions and behaviour in the fishery are changing. Increases in
the observed non-compliance rate, for example, could reflect compliance activities being
less effective at deterring violations, more effective at detecting violations, or it may reflect
changes in other measurable economic, environmental, weather, or political factors that
favour noncompliance regardless of compliance activity. Assigning causality of compliance
outcomes to compliance activities requires examining potential impacts of these other
factors on compliance outcomes.
• The workshop found that a comprehensive fisheries compliance outcome measurement
framework needs to encompass more than just stock sustainability. Equity between sectors,
ecosystem impacts, political and reputational imperatives and non-Fisheries responsibilities
(such as emergency response) are all also important aspects of service delivery for fisheries
compliance agencies.
• While the principles for developing useful fishery compliance outcome measures are the
same across fisheries, the development and use of specific outcome measures in any
particular fishery must depend on the factors that influence noncompliance, the ways
compliance activities are attempting to affect them, and the particular regulatory regime for
that fishery.
• The literature review, survey results and related discussions with, and presentations, by
representatives of the ACC and ATO regarding outcome-based management provided
essential insight and perspectives about productive next steps. These are described under
the recommendations heading (see 7.0 below).
• Although ongoing work is being undertaken by fisheries compliance agencies both in
Australia and internationally, much of it is in relative isolation. There is considerable
potential for shared learning in this area, especially in the recruitment of external expertise
to assist with developing performance measurement programs that focus on outcome
measures.
Fisheries Research Report [Western Australia] No. 275, 2016 85
• The quest for informative outcome measures is unlikely to replace the traditional use of
input and output measures in assessing Agency performance. Input and Output measures
still have a role to play in giving context to more subtle, and longer term outcome measures.
They are also necessary for operational monitoring of processes within the organisation.
Rather, the development of outcome measures for fisheries compliance will reduce the
reliance on output measures which often do not stand up under close scrutiny to the
performance claims that are being made from them.
• We did not find any evidence that compliance outcome measures are widely used to guide
fishery compliance management decisions, and given the long timelines likely to be
associated with final outcome indicators, they may have limited practicality in some fisheries
decision-making processes.
• The project has clarified the methods that could be used to develop compliance outcome
measures. The project also established the types of data that are being collected by fisheries
compliance agencies that are suitable for implementing outcome-based management and
the extent to which these data are being used (i.e., current best practice) to manage and
prioritize compliance activities.
• There is common interest among fisheries compliance agencies in working together to
improve and standardize the use of outcome measures so they can become a reliable and
integral part of fishery compliance management. Results from the literature review and
survey that were conducted as part of the project assured project participants from various
agencies that “lessons learned” from similar efforts in Australia and elsewhere around the
world provide a solid basis for moving ahead.
• Although statistical modelling has been used to estimate illegal catch and uncertainties
around the estimates, there is also some promise in using modelling to simulate the long-
term beneficial outcomes of compliance activities using estimates of reductions in illegal
harvests that result from compliance activities as increases in measures of fish abundance in
conventional and widely available fishery models. Intermediate compliance outcomes
associated with reductions in illegal catches, when treated in conventional bio-economic
fishery models as increases in the biomass of fish left in the ocean to grow and spawn, can
be shown to generate measurable long-term beneficial outcomes in terms of improved
conditions in fisheries, fishing communities, and seafood markets.
86 Fisheries Research Report [Western Australia] No. 275, 2016
Specifically, improved compliance in fisheries that results in reductions in illegal catches and
associated increases in the abundance of fish in future years can be expected to result in the
following long-term beneficial and measurable outcomes:
• Increases in the expected allowable harvests; • Less need for stringent fishing restrictions; • Reductions in the uncertainty of catch statistics used in fishery monitoring and stock
assessments; • Higher catch rates and earnings for law-abiding fishermen; • Higher sustainable legal harvests resulting in lower seafood prices for consumers; • Reduced economic incentives for illegal fishing; and • Reduced numbers and severity of convictions.
• We find the discipline of fisheries compliance outcome measurement in a fragile state. It
needs nurturing and encouraging if it is to reach its potential and develop measures that
withstand scrutiny from all stakeholders and especially from the spotlight of academic
researchers from such disciplines as governance, risk analysis, sociology, criminology and
economics. While it is tempting to interpret non-response to our surveys from some
international jurisdictions as evidence of limited interest in developing fisheries outcome
measures, we find sufficient evidence from other disciplines to indicate that this is
incorrect: fisheries compliance outcome measurement is necessary and possible, although
certainly not easy. We hope that those who are indifferent to the way fisheries compliance
might be currently delivered by an agency can look to this report to support development of
measures of fisheries compliance outcomes that all agree are valid, because then it is in
everyone’s best interests to see that such measures demonstrate consistently good
performance. Until such time as robust fisheries outcome measures are developed, we
suggest that benchmarking agencies by comparing reputation, capability and efficiency
against other Fisheries agencies with similar responsibilities will be necessary, unless the
assessors have a detailed understanding of compliance theory.
6 Implications It is too early in the development of Fisheries compliance outcome measures to be able to document
best practice.
Fisheries compliance agencies cannot currently assure all their stakeholders that they are being
effective in their mission because of a lack of established, visible, best-practice in compliance
Fisheries Research Report [Western Australia] No. 275, 2016 87
outcome measurement for fisheries. In lieu of such best-practice, the best that can be done is to
benchmark against what other fisheries compliance agencies are doing. Equally, fisheries
compliance agencies should not seek to overstate their achievements on the basis of inconclusive
data.
Specialised measurement programs and methodologies such as quantitative risk management,
stakeholder surveys and program logic models would be helpful in developing useful outcome
indicators. Expertise in these areas may not reside within agencies responsible for fisheries
compliance so some external assistance could be required.
From the evidence found by this project, Australia does not seem to be lagging in the area of
fisheries compliance outcome indicators and could even be seen as leading a developing field.
The cost and complexity of measuring compliance outcomes will almost certainly prove to be
barriers to developing useful measures for some fisheries.
The challenge of ‘measuring the unmeasurable’ is shared by other areas of regulation (especially
policing) and future work should seek assistance from the academic community in areas such as
public value, uncertainty, quantitative risk assessment and decision theory to ensure that the best
tools available are being used when designing and evaluating compliance programs.
Any area of regulation that shares:
• Low inspection rates (compared to total opportunities for offending) • Remote locations which are hard for regulators to access • High opportunity benefit from offending • Lack of ready quantification of illegal activity or harm • Variable or unknown offence detection rates
will likely benefit from some consideration of the issues covered in this report.
7 Recommendations 1. Weight of Evidence Approach
Since we have found little in the way of robust, mature fisheries compliance outcome indicators,
until such indicators exist, we recommend that suites of indicators be used in a ‘weight of
evidence’ approach when trying to assess compliance performance and attribute outcome
changes to compliance activities. For example, it may be impossible to calculate the illegal take
from a fishery with any degree of certainty, but if fishers are reporting large numbers of illegal

88 Fisheries Research Report [Western Australia] No. 275, 2016
fishing incidents, the observed non-compliance rates and offence types suggest large quantities
of fish are being taken illegally, and if compliance officers are not focussing on small pockets of
isolated noncompliance, then it should be reasonable to assume that there is a problem with
non-compliance in the fishery. By considering these multiple strands of evidence some degree
of confidence could be placed on whether or not the situation warrants intervention, especially
if viewed in conjunction with biological information such as stock abundance and accessibility.
On re-evaluation of the situation after time, a judgement could be made on whether an
intervention has improved the situation.
2. Collaboration and Sharing
We believe national and regional fisheries bodies in Australia should work together in
developing fisheries compliance outcome measures that can be used across agencies,
standardised where possible, but that are flexible enough to be customised to the subtly
different organisational requirements and responsibilities of individual agencies. This process
could be facilitated through the use of existing governance structures, like the NFCC.
3. Structure and Governance
There are structured ways of developing and interpreting outcome measures and attributing
them to specific activities. Examples of the way this has been done by the ATO and ACC were
shown to representatives of the compliance agencies who attended the workshop on this
project. We believe the next phase of this project should be to use those methods to develop a
suitable framework to assess and compare expected and actual outcomes of various fishery
compliance activities in some selected fisheries.
The work will require facilitation by a professional skilled in the area of outcome measures and
using them with other fisheries data to correctly interpret the impacts of compliance activities.
The project would need to have executive support and involvement from the participating
agencies and be run over a period long enough to allow time for agencies to be able to involve
their staff and stakeholders in the process.
To make this project manageable, we suggest an initial pilot effort that involves just a few
fisheries nominated from across the country. It would be useful for these pilot studies to
include examples of:
• recreational, commercial and customary fisheries.
Fisheries Research Report [Western Australia] No. 275, 2016 89
• different management objectives (e.g., maximum sustainable yield/maximum
economic yield, equitable allocation of fishing rights).
• different management targets (e.g., reduce illegal fishing vs reduce unreported
landings vs reduce closed area or closed season violations).
• the use of different fishery management methods (e.g., input vs output controls,
sector management and tradable fishing permits).
• the application of different compliance delivery strategies (e.g., focus on
enforcement/deterrence vs compliance assistance).
4. Benchmarking
When assessing the performance of a fisheries compliance agency, benchmarking their
compliance capabilities and governance framework against those of other Fisheries agencies
with similar responsibilities will be necessary, unless an assessor has a detailed understanding of
compliance theory and is prepared to apply that to the specific fisheries context of the agency
being assessed.
5. Compliance Input to Management Frameworks
Fisheries managers and fishers themselves need to appreciate that different management
strategies often come with different compliance options and resourcing (cost) implications.
Some of these will be much easier or cheaper (and ideally both) to enforce and measure
compliance with than others. If it is vital that fisheries compliance agencies are held
accountable to stakeholders through suitable final outcome measures, it makes sense that the
advice of fisheries compliance experts is sought and taken into consideration when deciding on
suitable management frameworks. It was clear from the survey results that this advice is not
universally sought, meaning that there will undoubtedly be inefficiencies intrinsically built into
many fisheries management frameworks. The measurement of fisheries compliance outcomes
will undoubtedly be easier if measurement of compliance outcomes resulting from any
management framework is considered from the start.
6. Modelling
Fisheries compliance agencies should investigate the use of modelling to simulate the long-term
beneficial outcomes of compliance activities using estimates of reductions in illegal harvests that
result from compliance activities as increases in measures of fish abundance in conventional and
widely available fishery models.
90 Fisheries Research Report [Western Australia] No. 275, 2016
7. Beyond Sustainability
A comprehensive fisheries compliance outcome measurement framework needs to encompass
more than ‘just’ stock sustainability. Fisheries compliance agencies give effect to regulation
concerned with equity within and between sectors, ecosystem impacts, political and
reputational imperatives and non-Fisheries responsibilities (such as emergency response). Since
these may all be considered important, they need to be considered in a comprehensive
measurement framework. Stock sustainability may also be coincidentally impacted by factors
entirely outside of the control of organisations tasked with fisheries compliance such as effort
creep and environmental impacts.
8. Preparing for the Future
Finally, we recommend that fisheries agencies prepare for the challenges of measuring
compliance outcomes which will almost certainly require structural change within organisations
to address the challenges of:
• Identifying suitable outcome measures
• Sourcing existing and novel data sources
• Investing in the data collection and analytical capability to discern patterns of
behaviour and underlying issues
• Reacting to emerging trends in a timely fashion
• Designing measurement into their compliance programs from the start
• Being prepared to try new approaches when faced with results that show they are
not making a measurable difference, or are making the problem worse.
• Ensuring the inclusiveness of all staff (compliance practitioners, fisheries managers,
and monitoring and assessment scientists) and stakeholders in the development
and implementation of outcome measures.
Fisheries Research Report [Western Australia] No. 275, 2016 91
8 Extension and Adoption We know from this project that there is a high degree of interest amongst fisheries agencies in
developing outcome measures. Of those that completed the questionnaire distributed by this
project (Appendix D), most ranked compliance outcome measurement as high or vital. Furthermore,
all those that completed the survey indicated that they would like to receive further information on
the progress of the project and so will be sent a copy of this final report.
In the last few years the European Fisheries Control Agency has held annual seminars on the subject
of compliance. We have contacted that organisation to get information on compliance outcomes
work undertaken by their member states and some exchange of information and sharing of views is
underway. That organisation has requested a copy of this final report.
The National Fisheries Compliance Committee has been presented with a copy of this report at the
final draft stage. This committee is the peak body for fisheries compliance agencies in Australia and
was instrumental in commissioning the work undertaken in this project. Representatives from the
project team have briefed the NFCC on the project and its findings. The NFCC is keen to use
structured methods to begin the task of translating the findings of this project into useful outcome
indicator measures.
An overview of the work done during this project was given at the 5th Global Fisheries Enforcement
Training Workshop in Auckland in March 2016 (facilitated by the International Monitoring, Control
and Surveillance Network) and that network will be used to advertise the availability of the final
report. Over 200 delegates from 60 different countries attended and valuable contacts were made
with key jurisdictions which will allow future collaboration on the topic of fisheries compliance
outcome measurement. The workshop provided further confirmation of the International Survey
findings, that no jurisdiction has yet solved the problem of measuring fisheries compliance
outcomes.
Distribution and publication of this report will take place using the contact points established during
the project. At this stage at least three peer-reviewed publications are envisaged, having been
motivated by the work completed. The first would be a ‘primer’ paper on the current state of
Fisheries Outcomes Measurement outlining the difficulties faced. The second would be based on
the use (and misuse) of official compliance statistics and the third would be on the experiences of
trying to develop measurement methods from within a changing government policy environment.
As the literature review has highlighted, there is little visibility of much of the good work being done

92 Fisheries Research Report [Western Australia] No. 275, 2016
by fisheries compliance agencies across Australia and Internationally. Publishing work in peer-
reviewed literature is one route to helping other disciplines appreciate the challenges that fisheries
compliance agencies currently face and showcase their successes. Another route is through informal
networks such as IMCS and INECE and those groups will be approached to publicise this report and
its findings.
Fisheries Research Report [Western Australia] No. 275, 2016 93
Appendix A: Intellectual Property Ownership of any intellectual property (IP) arising from this project has been waived.
94 Fisheries Research Report [Western Australia] No. 275, 2016
Appendix B: Staff Timothy Green Principal Investigator Department of Fisheries, WA
William Dixon Co-investigator Fisheries Victoria, Department of Environment
and Primary Industries
Sebastian Lambert Co-investigator Primary Industries and Regions, South Australia
Tod Spencer Co-investigator Australian Fisheries Management Authority
Roy Melville-Smith Researcher Private Consultant
Dennis King Visiting Professor University of Maryland Center for
Environmental Science, and King and
Associates, Inc.
Elizabeth Price Research Associate University of Maryland Center for
Environmental Science, and King and
Associates, Inc.
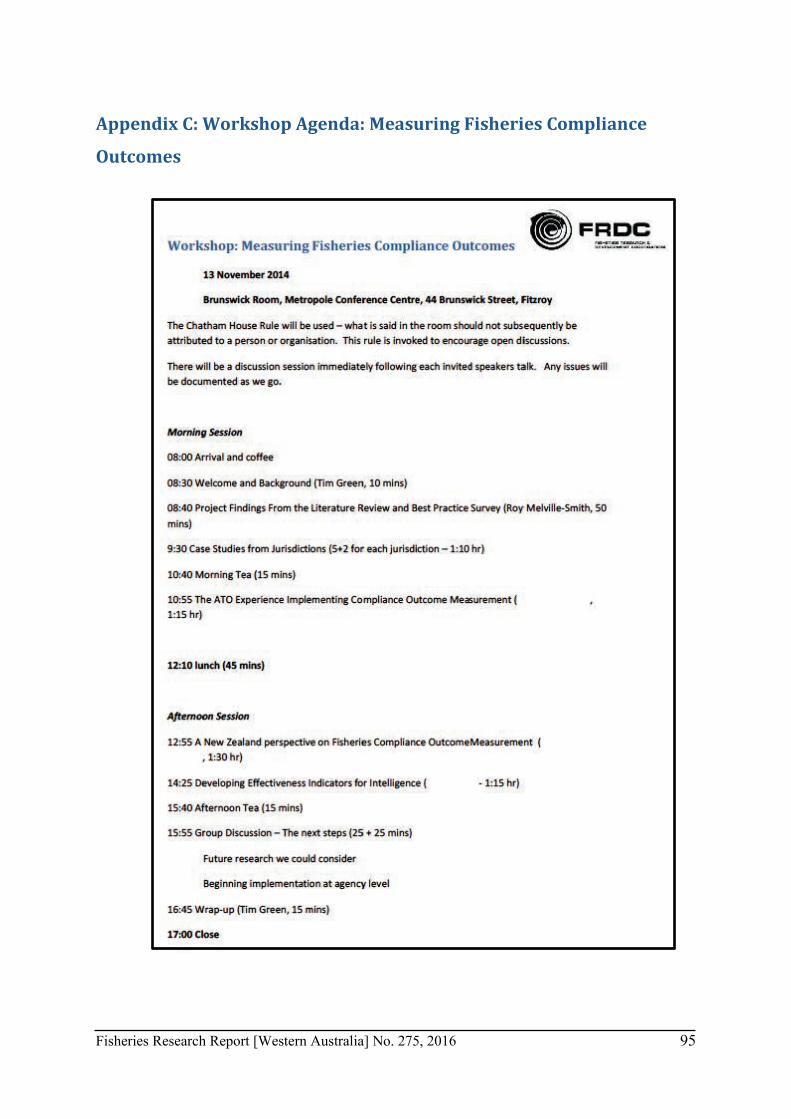
Fisheries Research Report [Western Australia] No. 275, 2016 95
Appendix C: Workshop Agenda: Measuring Fisheries Compliance
Outcomes
96 Fisheries Research Report [Western Australia] No. 275, 2016
Appendix D: The Affiliations of Attendees at the workshop: Measuring
Fisheries Compliance Outcomes Affiliation Quadrat Ltd, New Zealand Department of Primary Industries and Regions, South Australian Government Department of Environment and Primary Industries Victorian Government Department of Fisheries, Western Australian Government Department of Fisheries and Forestry, Queensland Government Australian Fisheries Management Authority Ministry of Primary Industries, New Zealand Government Australian Taxation Office Department of Primary Industries, New South Wales Government Australian Crime Commission
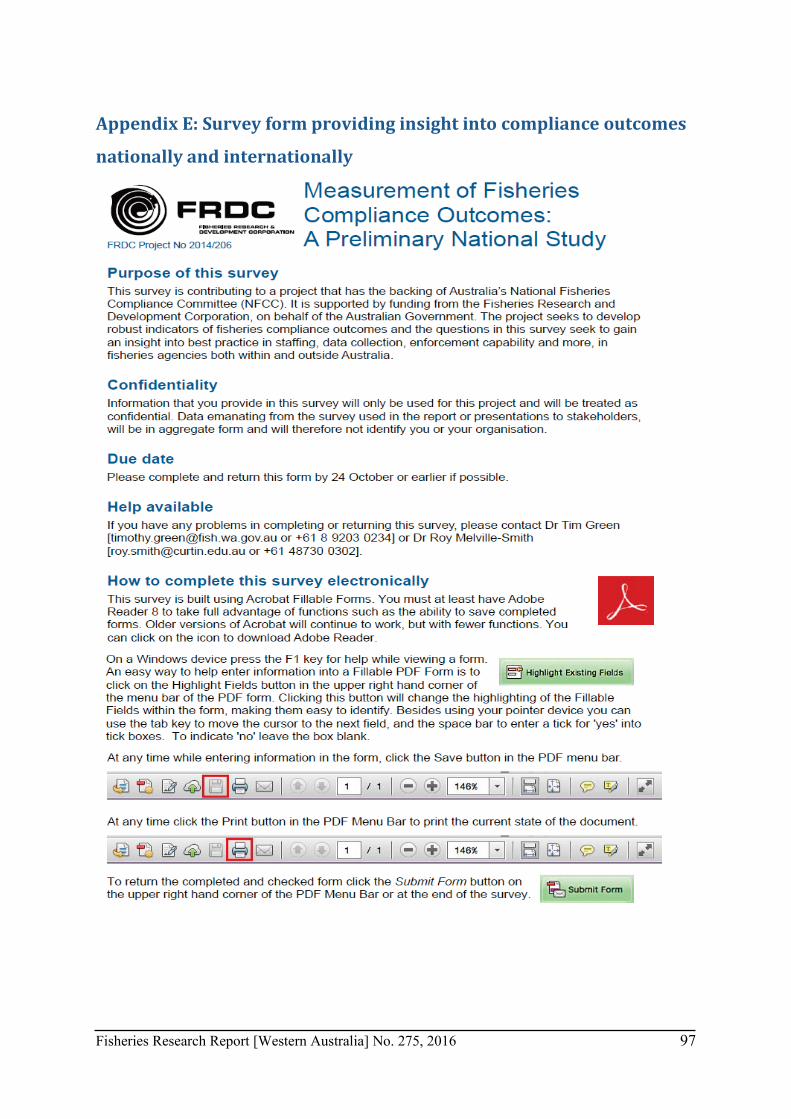
Fisheries Research Report [Western Australia] No. 275, 2016 97
Appendix E: Survey form providing insight into compliance outcomes
nationally and internationally
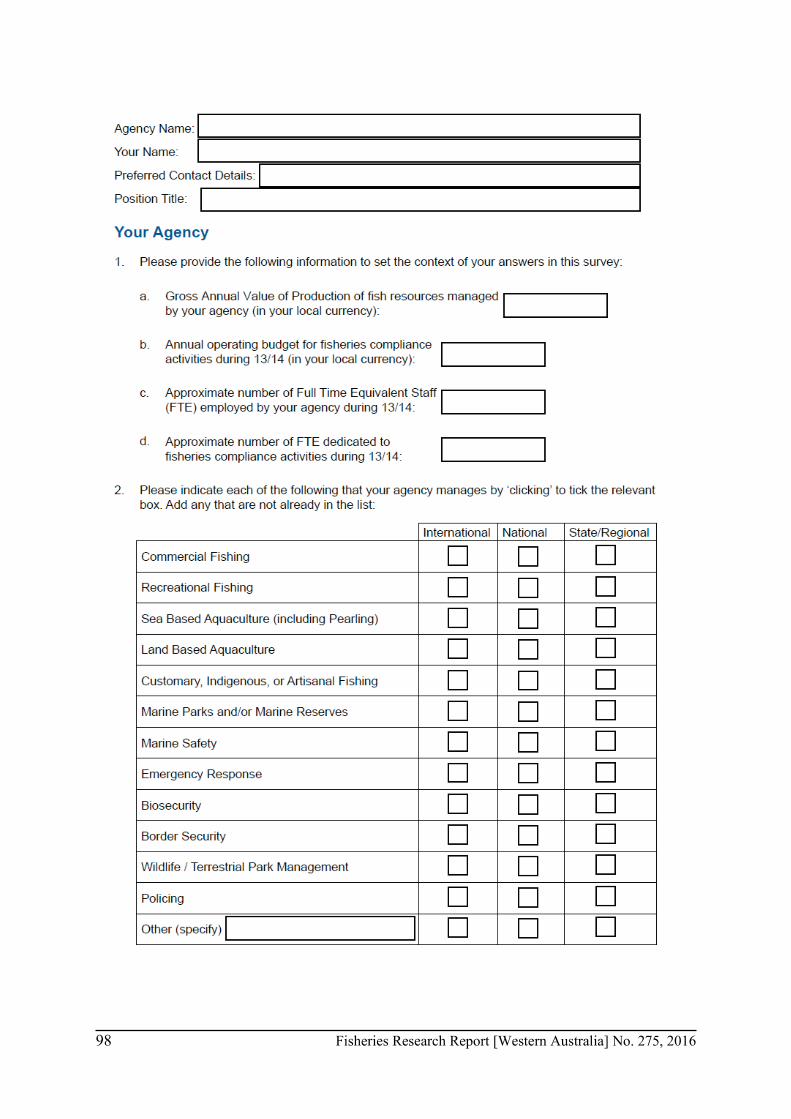
98 Fisheries Research Report [Western Australia] No. 275, 2016
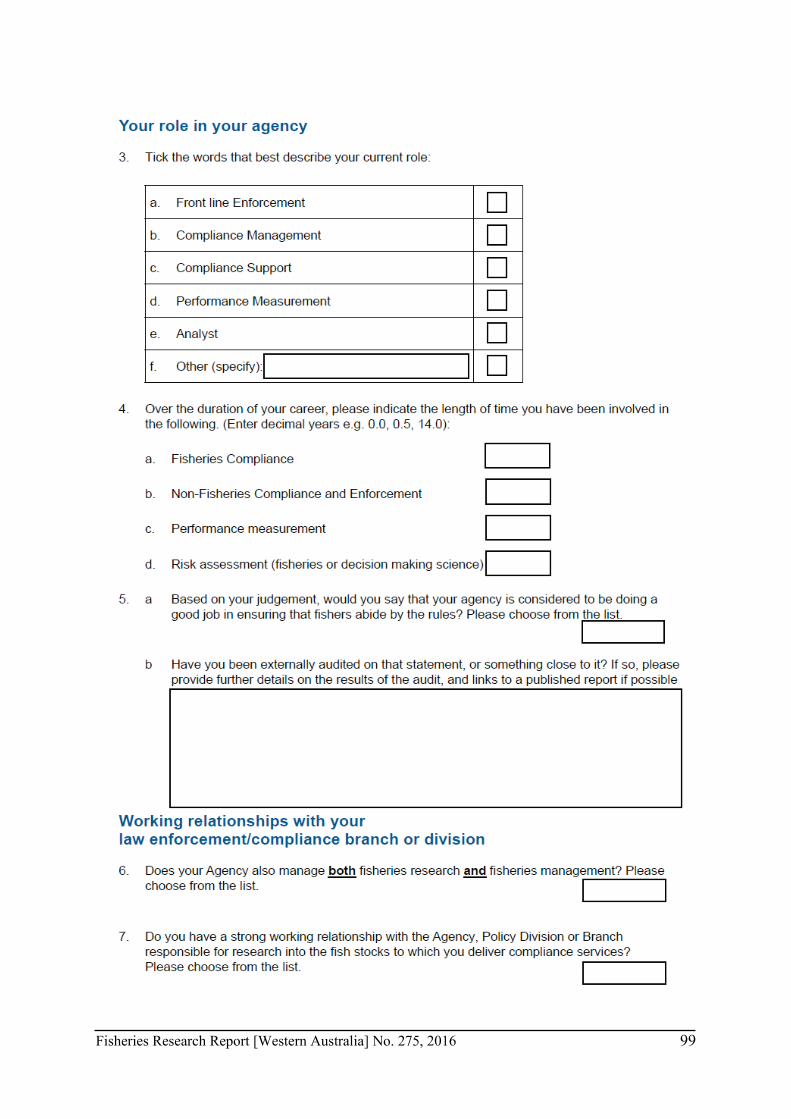
Fisheries Research Report [Western Australia] No. 275, 2016 99
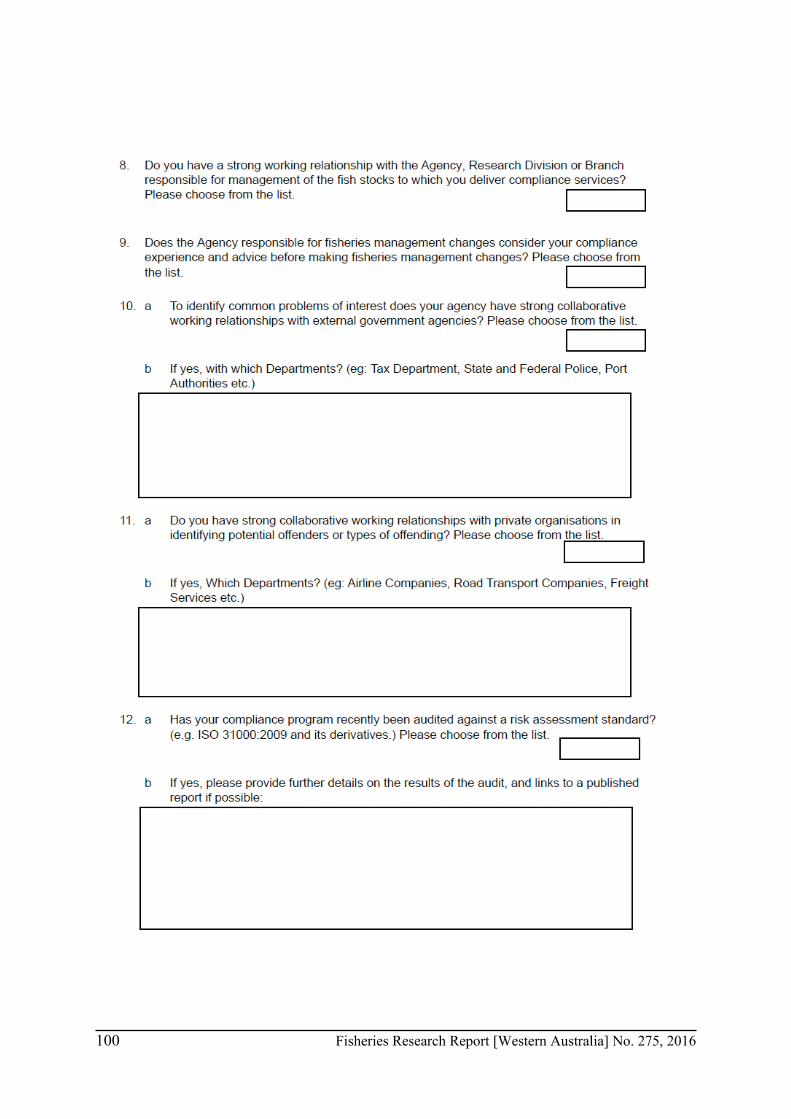
100 Fisheries Research Report [Western Australia] No. 275, 2016
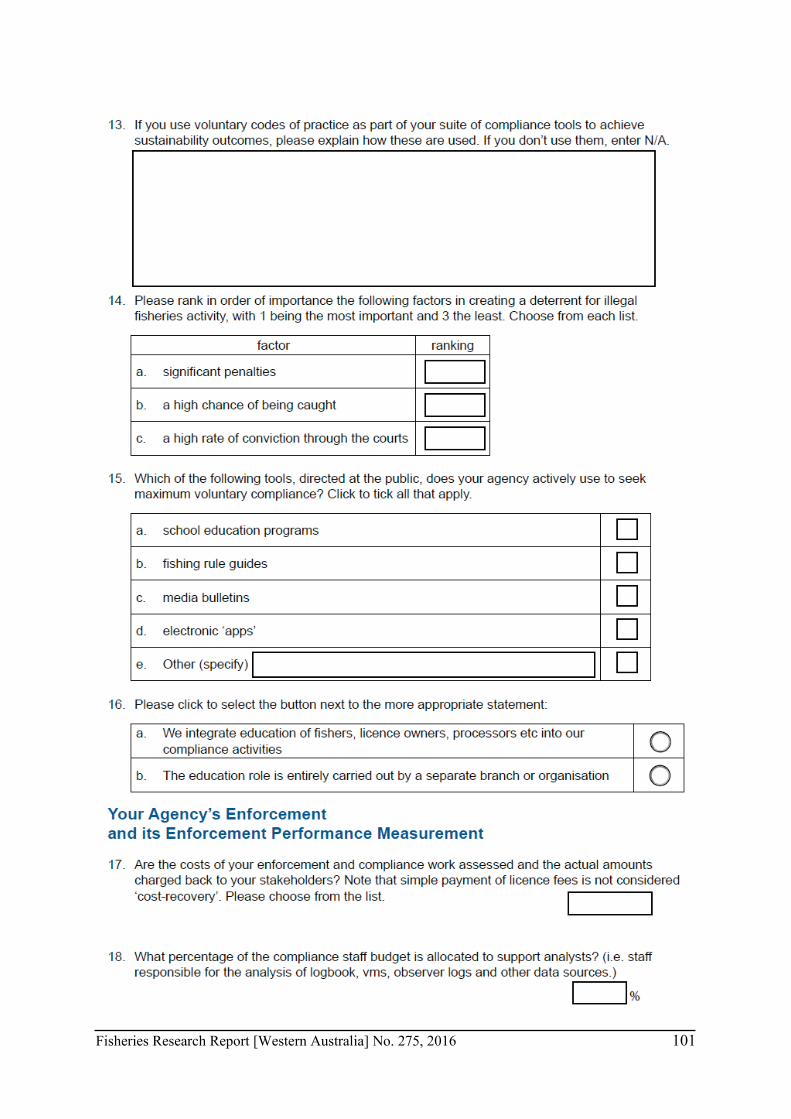
Fisheries Research Report [Western Australia] No. 275, 2016 101
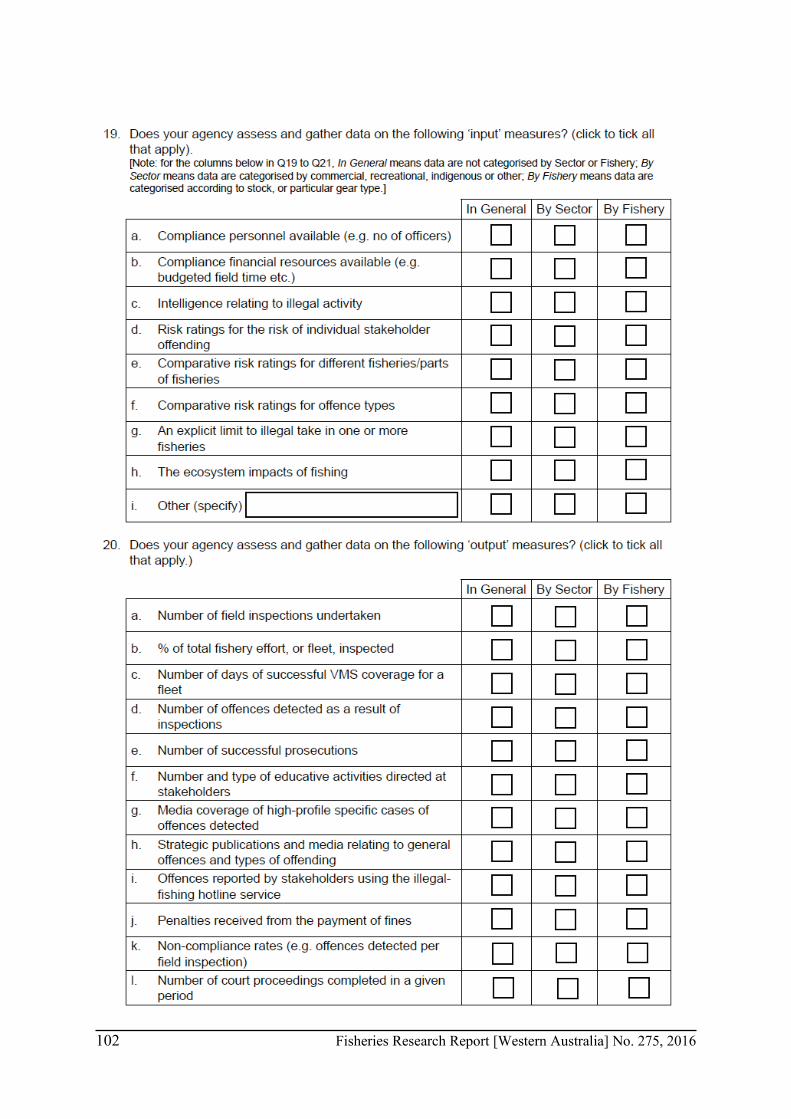
102 Fisheries Research Report [Western Australia] No. 275, 2016
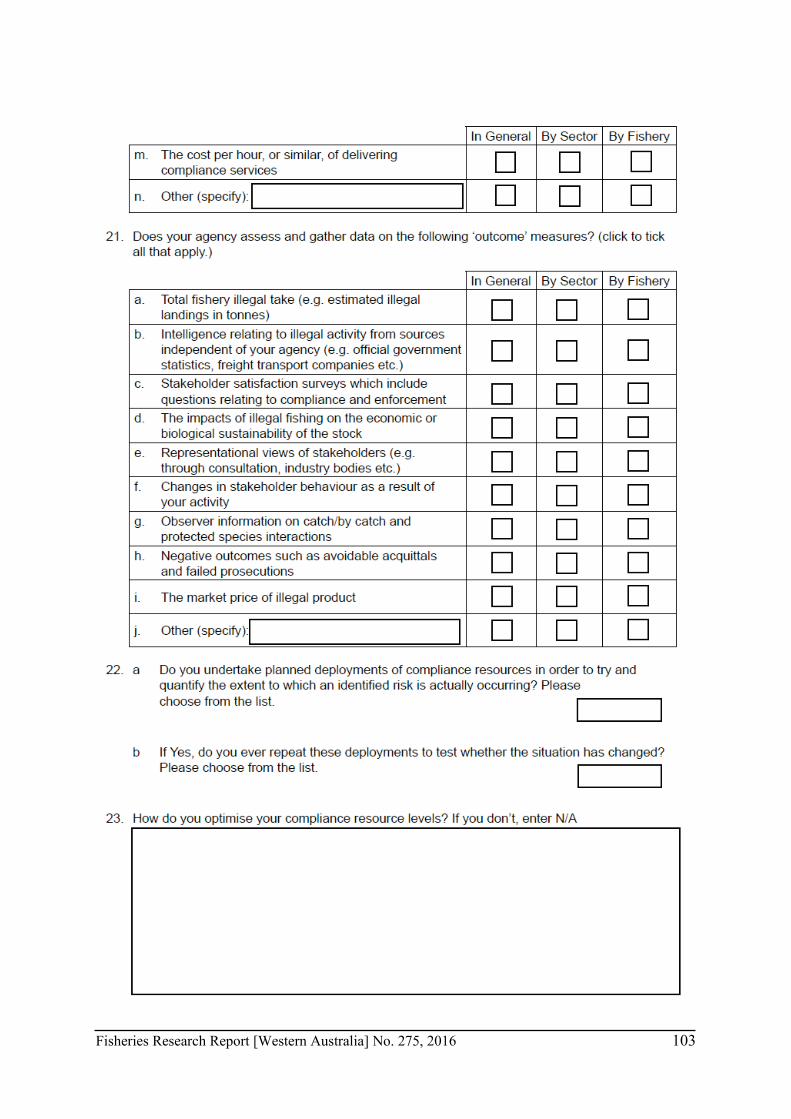
Fisheries Research Report [Western Australia] No. 275, 2016 103
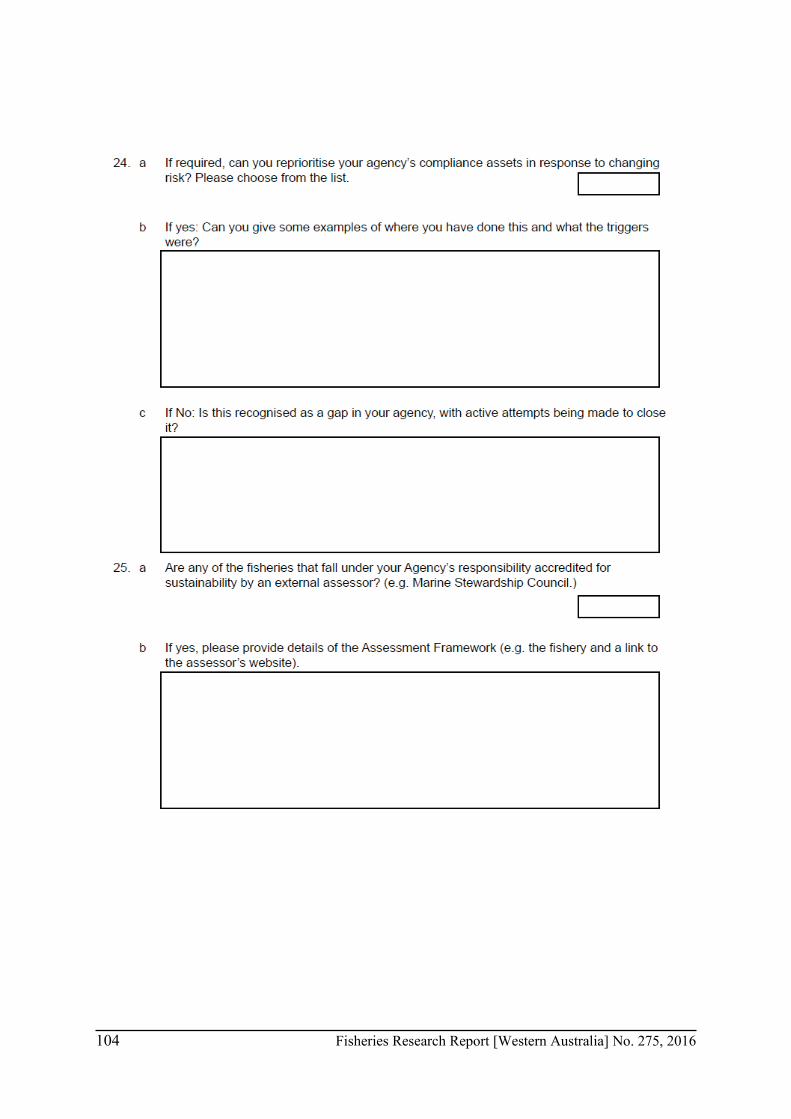
104 Fisheries Research Report [Western Australia] No. 275, 2016
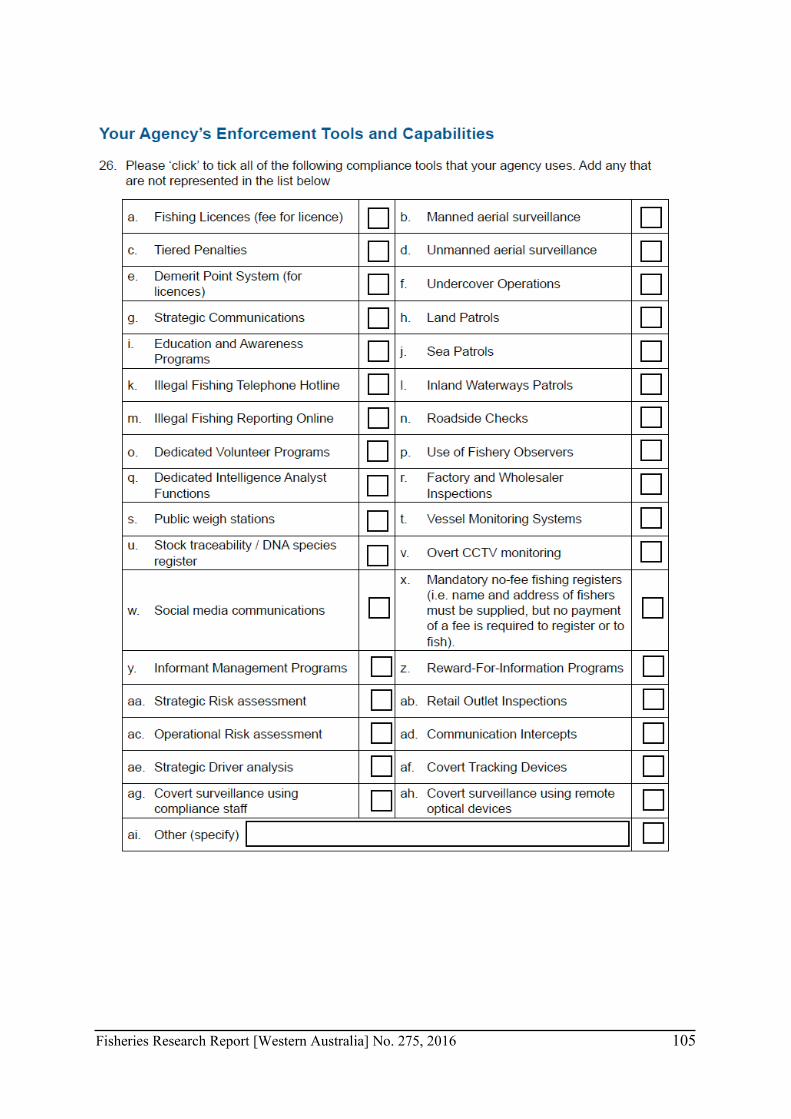
Fisheries Research Report [Western Australia] No. 275, 2016 105
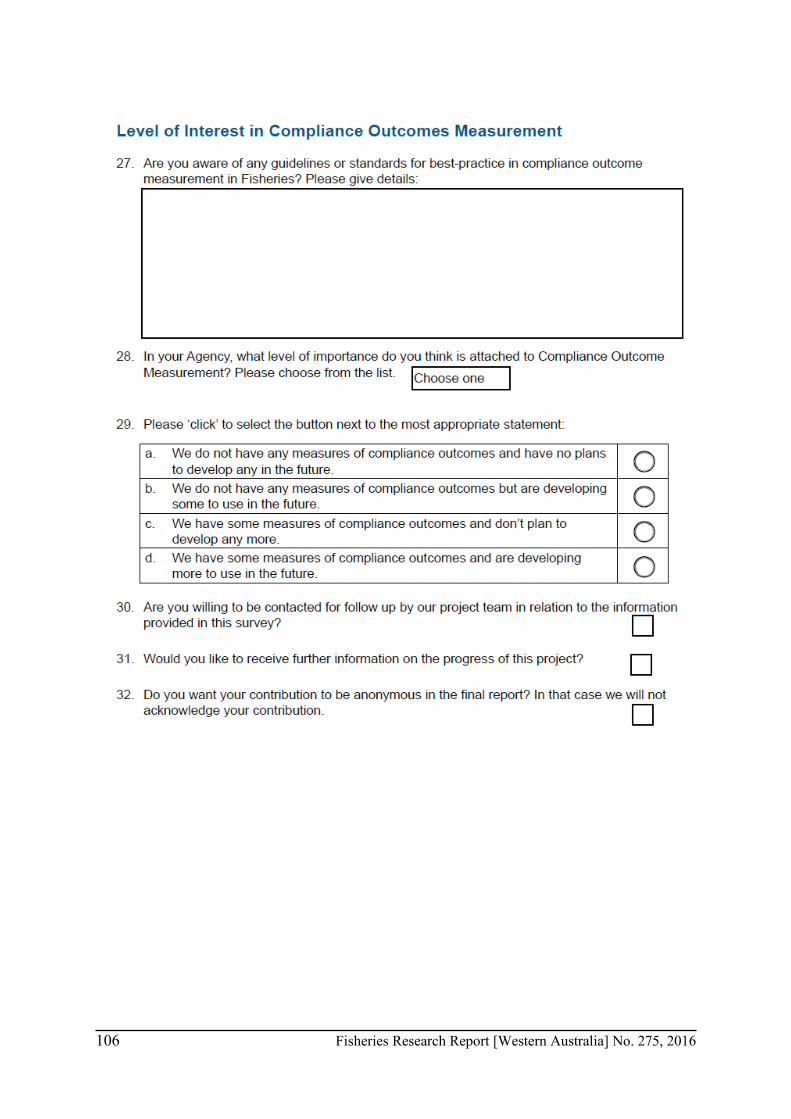
106 Fisheries Research Report [Western Australia] No. 275, 2016
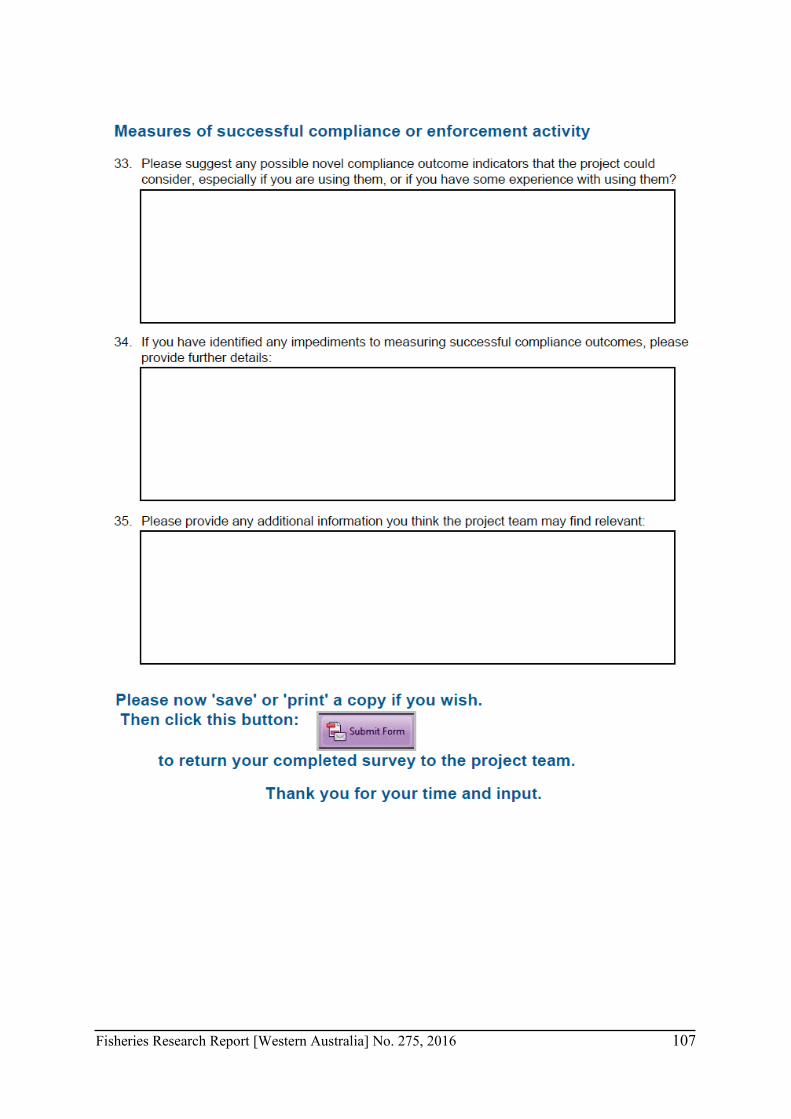
Fisheries Research Report [Western Australia] No. 275, 2016 107
108 Fisheries Research Report [Western Australia] No. 275, 2016
Appendix F: References Agnew DJ, Pearce J, Pramod G, Peatman T, Watson R, Beddington JR, Pitcher T (2009) Estimating the
worldwide extent of illegal fishing. PLoS ONE 4(2): e4570 doi:101371/journalpone0004570 Ainsworth CH, Pitcher TJ (2005) Estimating illegal, unreported and unregulated catch in British
Columbia’s marine fisheries. Fisheries Research 75: 40-55 Akpalu W (2008) Fishing regulations, individual discount rate, and fisherman behaviour in a
developing country fishery. Environment and Development Economics 13: 591-606 Alach Z, Crous C (2012) A tough nut to crack: Performance measurement in specialist policing. AIC
Reports Technical and Background Paper 53: 38 pp. Arnason R (2010) Optimal dynamic fisheries enforcement. In: Proceedings of the Fifteenth Biennial
Conference of the International Institute of Fisheries Economics & Trade, July 13-16, 2010, Montpellier, France: Economics of Fish Resources and Aquatic Ecosystems: Balancing Uses, Balancing Costs. . accessed 17 November 2014, URL: http://irlibraryoregonstateedu/xmlui/bitstream/handle/1957/39243/168pdf?sequence=1
Australian Taxation Office (2007) Literature review: Measuring compliance effectiveness. Australian Taxation Office, Canberrra, 72 pp
Australian Taxation Office (2008) Measuring compliance effectiveness: Applying our methodology. australian Taxation Office, Canberrra, 20 pp
Australian Taxation Office (2012a) Measuring compliance effectiveness - our methodology. Australian Taxation Office, Canberrra, 19 pp
Australian Taxation Office (2012b) Measuring compliance effectiveness: Evaluating effectiveness. Australian Taxation Office, Canberrra, 32 pp
Ayres I, Braithwaite J (1992) Responsive Regulation: Transcending the deregulation debate. New York: Oxford University Press
Becker GS (1968) Crime and punishment: an economic approach. Journal of Political Economy 76: 169-217
Benoit HP, Allard J (2009) Can the data from at-sea observer surveys be used to make general inferences about catch composition and discards? Canadian Journal of Fisheries and Aquatic Sciences 66: 2025-2039
Blank SG, Gavin MC (2009) The randomized response technique as a tool for estimating non-compliance rates in fisheries: a case study of illegal red abalone (Haliotis rufescens) fishing in Northern California. Environmental Conservation 36: 112-119
Bousquet N, Cadegan M, Duchesne T, Roivest L-P (2010) Detecting and correcting underreported catches in fish stock assessment: Trial of a new method. Canadian Journal of Fisheries and Aquatic Sciences 67: 1247-1261
Bremner G, Johnstone P, Bateson T, Clarke P (2009) Unreported bycatch in the New Zealand West Coast South Island hoki fishery. Marine Policy 33: 504-512
Bricknell S (2010) Environmental crime in Australia. AIC Research and Public Policy Series 109, 132 pp Accessed 11 August 2014, URL: http://wwwaicgovau/documents/2/1/1/%7B211B5EB9-E888-4D26-AED4-1D4E76646E4B%7Drpp109pdf
Burns RJ, Kerr GN (2008) Observer effect on fisher bycatch reports in the New Zealand ling (Genypterus blacodes) bottom longline fishery. New Zealand Journal of Marine and Freshwater Research 42: 23-32
Businessdictionary (2014) Outcomes measurement. Accessed 20 August 2014, URL: http://wwwbusinessdictionarycom/definition/outcome-measurehtml
Campbell DT (1976) Assessing the impact of planned social change. The Public Affairs Center, Dartmouth College Occasional Paper 8: : 70 pp.
Catalano SM (2006) The measurement of crime: victim reporting and police recording. New York: LFB Scholarly Pub ISBN 1-59332-155-4
Fisheries Research Report [Western Australia] No. 275, 2016 109
Clarke SC, McAllister M, Milner Gulland EJ, Kirkwood GP, Michielsens CGJ, Agnew DJ, Pikitch EK, Nakano H, Shivji MS (2006) Global estimates of shark catches using trade records from commercial markets. Ecology Letters 9: 1115-1126
Conand C, Byrne M (1993) A review of recent developments in the world sea cucumber fisheries. Marine Fisheries Review 55: 1-13
Dadds V, Scheide T (2000) Police performance and activity measurement Trends & Issues in crime and criminal justice No 180 Australian Institute of Criminology, Canberra Accessed on line 11 October 2014 URL: http://aicgovau/media_library/publications/tandi_pdf/tandi180pdf
Department of Fisheries WA (2010) State of the Fisheries and Aquatic Resources Report 2009/10. Fletcher, W.J. and Santoro, K. (Eds). Department of Fisheries, Western Australia
Department of Fisheries WA (2011) State of the Fisheries and Aquatic Resources Report 2010/11. Fletcher, W.J. and Santoro, K. (eds). Department of Fisheries, Western Australia
Department of Premier & Cabinet NSW (2014) C2014-06 Quality Regulatory Services initiative – Guidance for NSW regulators to implement outcomes and risk-based regulation. accessed 25 November 2014, URL: nsw_regulators_to_implement_outcomes_and_risk-based_regulation
DGR Consulting (1996) Performance indicators for fisheries compliance. Unpublished Report, 11 pp Diamond J (2005) Establishing a performance management framework for government.
International Monetary Fund WP/05/50, 28 pp Food Innovation Partners and Allan Bremner & Associates (2007) Review of traceability and product
sensor technologies relevant to the seafood industry. Australian Seafood Cooperative Research Centre Accessed online on 8 September 2014 URL: http://wwwyooyahcloudcom/SEAFOODCOOPERATIVERESEARCHCENTRE/EpjQdc/Traceability_and_Product_Technologies_Reportpdf 48 pp
Furlong WJ (1991) The deterrent effect of regulatory enforcement in the fishery. Land Economics 67: 116-129
Gezelius SS (2003). Regulation and compliance in the Atlantic Fisheries: state/society relations in the management of natural resources Dordrecht: Kluwer Academic Publishers
Gezelius SS, Hauck M (2011) A comparative study of compliance motivations in developed and developing world fisheries. Law & Society Review 45: 435-470
Gorfine H, Tailby R, Gant F, Bruce I, Donaldson M (2002) Assessment of illegal catches of Australian abalone: Development of desk-based survey methods. Fisheries Research and Development Corporation Final Report, Project 2000/112: : 25 pp.
Green TJ, McKinlay JP (2009) Compliance program evaluation and optimisation in commercial and recreational Western Australian fisheries. Fisheries Research and Development Corporation Final Report, Project 2001/069: : 77 pp.
Groeneveld JC (2003) Under-reporting of catches of south coast rock lobster Palinurus gilchristi, with implications for the assessment and management of the fishery. African Journal of Marine Science 25: 407-411 doi 10.2989/18142320309504030
Hauck M (2008) Rethinking small-scale fisheries compliance. Marine Policy 32: 635-642 Henderson MJ, Fabrizio MC (2013) Detecting noncompliance in the summer flounder recreational
fishery using a mark–recapture growth model. North American Journal of Fisheries Management 33: 1039-1048
Horvitz DG, Greenberg BG, Abernathy JR (1976) Randomized response: a data-gathering device for sensitive questions. International Statistical Review 44: 181-196
House of Commons Public Administration Select Committee (2014) Caught red-handed: why we can’t count on police recorded crime statistics. accessed 25 March 2015, URL: http://wwwpublicationsparliamentuk/pa/cm201314/cmselect/cmpubadm/760/760pdf
110 Fisheries Research Report [Western Australia] No. 275, 2016
Hughes BP, Newstead S, D'Elia A (2011) Outcomes-based national road safety performance measures. in Proceedings of the Australasian College of Road Safety Conference: A Safe System: Making it Happen!, Melbourne, Australia
INECE (2008) Performance measurement guidence for compliance and enforcement practitioners. Guidence Document, Accessed on line 11 August 2014, URL: http://ineceorg/indicators/guidancepdf
Innovation Network Inc. (anon.) Logic model workbook. Accessed on line 1 October 2014, URL: http://wwwinnonetorg/client_docs/File/logic_model_workbookpdf
Jacquet JL, Pauly D (2008) Trade secrets: renaming and mislabeling of seafood. Marine Policy 32: 309-318
Kelly DN, McCarthy SL (2013) The report of the Crime Reporting Committee to Commissioner Raymond W. Kelly concerning CompStat Auditing. Accessed on line 27 June 2016, URL: http://wwwnycgov/html/nypd/downloads/pdf/public_information/crime_reporting_review_committee_final_report_2013pdf
Kindt-Larsen L, Kirkegaard E, Dalskov J (2011) Fully documented fishery: a tool to support a catch quota management system. ICES J Mar Sci 68: 1606-1610
King DM (2010) Enforcement and compliance in U.S. commercial fisheries: results from two recent studies. Lenfest Ocean Program Report, 15 pp Accessed 11 August 2014, URL: http://wwwlenfestoceanorg/~/media/legacy/Lenfest/PDFs/king_enforcement_comparison_paper_2010pdf?la=en
King DM, Porter RD, Price EW (2009) Reassessing the value of U.S. coast guard at-sea fishery enforcement. Ocean Development & International Law 40: 350-372
King DM, Sutinen JG (2010) Rational noncompliance and the liquidation of Northeast groundfish resources. Marine Policy 34: 7-21
Knecht GB (2006) Hooked: pirates, poaching, and the perfect fish. Allen and Unwin, NSW, Australia Kuperan K, Sutinen JG (1998) Deterrence, legitimacy, and compliance in fisheries. Law & Society
Review: 309-337 Mackenzie S, Hamilton-Smith N (2011) Measuring police impact on organised crime: Performance
management and harm reduction. Policing: An international Journal of Police Strategies and Management 34: 7-30
Martin CC (1995) Evaluation of slot length limits for largemouth bass in two Delaware ponds. North American Journal of Fisheries Management, 15: 713-719
Martinsohn JT (2011) Deterring illegal activities in the fisheries sector. JCR Reference Reports Publications Office of the European Union, Luxembourg, Belgium 72 pp
Martinsohn JT, Ogden R (2009) FishPopTrace - Developing SNP-based population genetic assignment methods to investigate illegal fishing. Forensic Science International Genetics Supplement Series 2: 294-296
Mazur E (2010) Outcome performance measures of environmental compliance assurance: current practices, constraints and ways forward, OECD Environment Working Papers, No. 18, OECD Publishing. Accessed 25 March 2015, URL: http://www.oecd-ilibrary.org/docserver/download/5kmd9j75cf44.pdf?expires=1427351670&id=id&accname=guest&checksum=78353C7D329EE92DDD1C40943ABB1DF1. OECD Publishing
McAuley R, Ho K, Thomas R (2005) Development of a DNA database for compliance and management of Western Australian sharks. Fisheries Research and Development Corporation Final Report, Project 2003/067: Fisheries Research Report No 152, Department of Fisheries, Western Australia, 24 p
McElderry HI, Reidy RD, Pahti DF (2008) A pilot study to evaluate the use of electronic monitoring on a Bering Sea groundfi sh factory trawler. International Pacific Halibut Commission Technical Report 51: 32 pp.
Fisheries Research Report [Western Australia] No. 275, 2016 111
McKinlay JP (2002) Optimising the efficiency and effectiveness of enforcement to achieve compliance in the western rock lobster fishery. Fisheries Research and Development Corporation Final Report, Project 1998/156:
Melville-Smith R, van Sittert L (2005) Historical commercial West Coast rock lobster Jasus lalandii landings in South African waters. African Journal of Marine Science 27: 33-44
Moore MH (1995) Creating public value: strategic management in government. Harvard University Press, Cambridge, MA, U.S.A
Moore MH (2013) Recognizing public value. Harvard University Press, Cambridge, MA, U.S.A Moullin M (2002) Delivering excellence in health and social care. Open University Press, Buckingham,
UK Moullin M (2007) Performance measurement definitions: linking performance measurement and
organisational excellence. International Journal of Health Care Quality Assurance 20: 181-183
Mullowney DR, Dawe EG (2009) Development of performance indices for the Newfoundland and Labrador snow crab (Chionoecetes opilio) fishery using data from a vessel monitoring system. Fisheries Research 100: 248-254
National Fisheries Compliance Committee (undated) Australian fisheries national compliance strategy 2010-2015. accessed 22 October 2014, URL: http://wwwafmagovau/wp-content/uploads/2010/06/Australian-Fisheries-National-Compliance-Strategy-2010-2015pdf
National Strategy for Ecologically Sustainable Development (1992) Ecologically Sustainable Development Steering Committee, Endorsed by the Council of Australian Governments, December 1992.
Nielsen JR, Mathiesen C (2003) Important factors influencing rule compliance in fisheries - lessons from Denmark. Marine Policy 27: 409-416
Nøstbakken L (2008) Fisheries law enforcement—A survey of the economic literature. Marine Policy 32: 293-300
Ogden R (2008) Fisheries forensics: the use of DNA tools for improving compliance, traceability and enforcement in the fishing industry. Fish and Fisheries 9: 262-272
Ostrom E (1990) Governing the commons: the evolution of institutions for collective action. Cambridge University Press, Cambridge, UK
Ostrom E (2007) Sustainable social-ecological systems: an impossibility? Proceedings of the National Academy of Science, Washington D.C., U.S.A
Ostrom E (2009) A general framework for analyzing sustainability of social-ecological systems. Science 325: 419-422
Palin P, Hall S, Lewis T, Baldwin C (2012) Deterrence and the United States Coast Guard: enhancing current practices with performance measures. Center for Homeland Defense and Security, Naval Postgraduate School, Monterey, CA
Pierce RB, Tomcko CM (1998) Angler noncompliance with slot Length limits for northern pike in five small Minnesota lakes. North American Journal of Fisheries Management 18: 720-724
Pitcher TJ, Watson R, Forrest R, Valtysson H, Guenette S (2002) Estimating illegal and unreported catches from marine ecosystems: a basis for change. Fish and Fisheries 3: 317-339
Plagányi É, Butterworth D (2011) A spatial-and-age-structured assessment model to estimate the impact of illegal fishing and ecosystem change on the South African abalone Haliotis midae resource. African Journal of Marine Science 32: 207-236
Plagányi É, Butterworth D, Burgener M (2010) Illegal and unreported fishing on abalone - Quantifying the extent using a fully integrated assessment model. Fisheries Research 107: 221-232
Putt J, Anderson K (2007) A national study of crime in the Australian fishing industry. Australian Institute of Criminology Research and Public Policy Series 76: 120 pp.
112 Fisheries Research Report [Western Australia] No. 275, 2016
Ringsberg HA, Mirzabeiki V (2013) Effects on logistic operations from RFID-and EPCIS-enabled traceability. British Food Journal 116: 104-124
Sarti NL (2006) Development of risk assessment proceedures in national fisheries complaince programs. Fisheries Research and Development Corporation Final Report, Project 2002/085: : 33 pp.
Southern Rocklobster Limited (2014) The finest in the world. accessed on 8 September 2014 URL: http://wwwsouthernrocklobstercom/lib/pdf/mf1093pdf
Sparrow MK (2000) The regulatory craft: controlling risks, solving problems and managing compliance. Brookings Institution Press, Washington DC, USA
Sparrow MK (2008) The character of harms: operational challenges in control. Cambridge University Press, Cambridge, UK
Sparrow MK (2011) New perspectives in policing: governing science. accessed 25 March 2015, URL: https://wwwncjrsgov/pdffiles1/nij/232179pdf
Spencer T (2013) Performance indicators: a policy and guide for the development and use of performance indicators for fisheries compliance. Australian Fisheries Management Authority, Canberra, Australia, 15 pp
Sutinen JG, Kuperan K (1999) A socio-economic theory of regulatory compliance. International Journal of Social Economics 26: 174-193
Sutinen JG, Rieser A, Gauvin JR (1990) Measuring and explaining noncompliance in federally managed fisheries. Ocean Development & International Law 21: 335-372
Sweijd NA, Bowie RCK, Evans BS, Lopata AL (2000) Molecular genetics and the management and conservation of marine organisms. Hydrobiologia 420: 153-164
Tailby R, Gant F (2002) The illegal market in Australian abalone. Trends and Issues in Crime and Criminal Justice 225: 1-6
Taylor-Powell E, Jones L, Henert E (2003) Enhancing Program Performance with Logic Models,. Accessed on line 25 March 2014, URL: http://wwwuwexedu/ces/lmcourse/
Tversky A, Kahneman D (1992) Advances in prospect theory: cumulative representation of uncertainty. Journal of Risk and Uncertainty 5: 297-323
United Nations Development Program (2009) Handbook on planning, monitoring and evaluating for development results. UNDP, Accessed on line 1 October 2014, URL: http://wwwundporg/eo/handbook
United Nations Office on Drugs and Crime (2011) Transnational organised crime in the fishing industry. Focus on: trafficking in persons smuggling of migrants illicit drugs trafficking. accessed 25 March 2015, URL: http://wwwunodcorg/documents/human-trafficking/Issue_Paper_-_TOC_in_the_Fishing_Industrypdf
United States Coast Guard (2004) Appendix D - performance measures and targets. Accessed on line 18 August 2014 URL: http://wwwuscgmil/hq/cg5/cg531/LMR/OceanG/OG_AppDpdf
Victorian Auditor-General (2012) Victorian Auditor-General’s Report. Effectiveness of compliance activities: Departments of Primary Industries and Sustainability and Environment. Victorian Government Printer, Melbourne, Victoria, Australia
Ward RD, Grewe PM (1994) Appraisal of molecular genetic techniques in fisheries. Reviews in Fish Biology and Fisheries 4: 300-325
Warner SL (1965) Randomized response: A survey technique for eliminating evasive answer bias. Journal of the American Statistical Association 60: 63-39
Weatherburn D (2000) Performance indicators for drug law enforcement. Crime and Justice Bulletin 48: 1-10
Westcott R (2008) Outputs and Outcomes: defining distinguishing and differentiating deliverables. Quality Progress 41: 72
Wilberg MJ (2009) Estimation of recreational bag limit noncompliance using contact creel survey data. Fisheries Research 99: 239-243

Fisheries Research Report [Western Australia] No. 275, 2016 113
Willis K, Homel P, Anderson J (2010) Developing the capacity and skills for national implementation of a drug law enforcement performance measurement framework. Report funded by the National Drug Law Enforcement Research Fund, Monograph Series 34, Accessed on line 11 August 2014, URL: http://wwwndlerfgovau/sites/default/files/publication-documents/monographs/monograph34pdf