Embed Size (px)
Citation preview
BUILDING A RISK TOLERANT IMS
Informing the Program Performance with Risk to Increase the Probability of Program Success (PoPS)
1
Niwot Ridge, LLC
Safran RiskRoadshowMcClean, VAJune 23, 2015
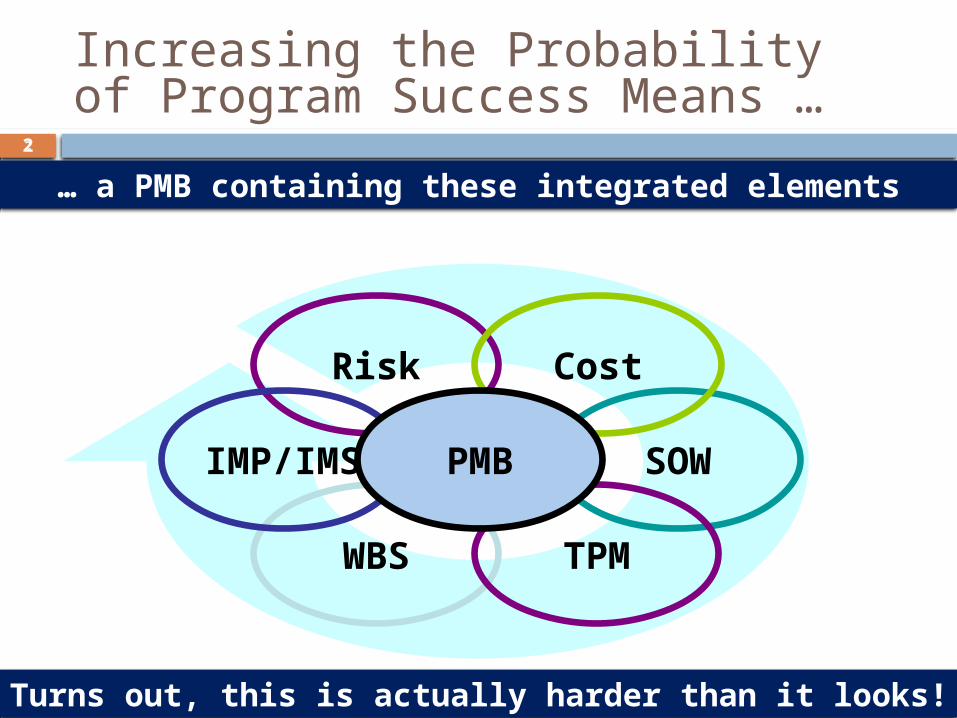
Increasing the Probability of Program Success Means …
Risk
SOW
Cost
WBS
IMP/IMS
TPM
PMB
… a PMB containing these integrated elements
Turns out, this is actually harder than it looks!
22
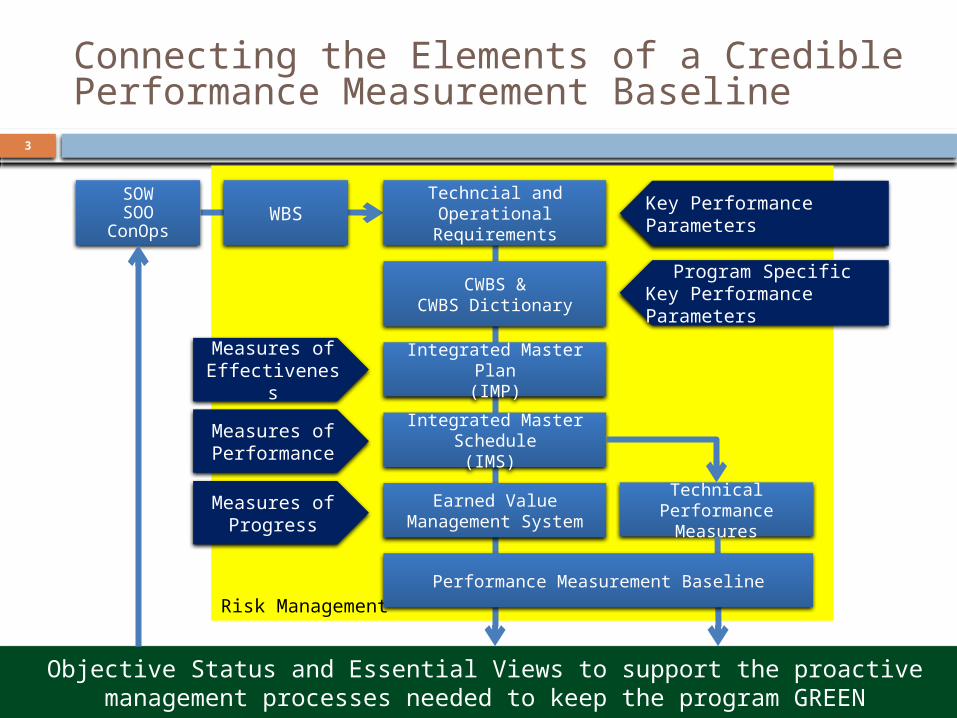
Connecting the Elements of a Credible Performance Measurement Baseline
3
Objective Status and Essential Views to support the proactive management processes needed to keep the program GREEN
Risk Management
SOWSOO
ConOpsWBS Techncial and Operational
Requirements
CWBS &CWBS Dictionary
Integrated Master Plan(IMP)
Integrated Master Schedule(IMS)
Measures of Effectiveness
Measures of Performance
Measures of Progress
Key Performance Parameters
Program SpecificKey Performance Parameters
Technical Performance Measures
Earned Value Management System
Performance Measurement Baseline
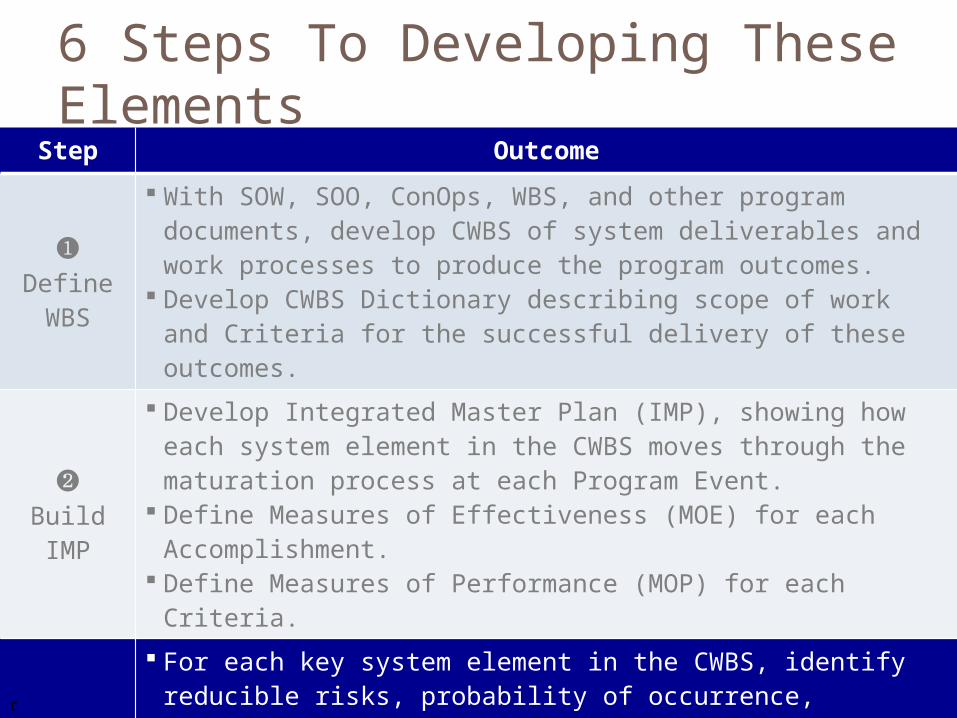
6 Steps To Developing These Elements
Step Outcome
❶Define WBS
With SOW, SOO, ConOps, WBS, and other program documents, develop CWBS of system deliverables and work processes to produce the program outcomes.
Develop CWBS Dictionary describing scope of work and Criteria for the successful delivery of these outcomes.
❷Build IMP
Develop Integrated Master Plan (IMP), showing how each system element in the CWBS moves through the maturation process at each Program Event.
Define Measures of Effectiveness (MOE) for each Accomplishment.
Define Measures of Performance (MOP) for each Criteria.
❸Identify Reducible Risks
For each key system element in the CWBS, identify reducible risks, probability of occurrence, mitigation plan, and residual risk in the Risk Register.
Risk mitigation activities placed in IMS and PMB to assure probability of occurrence and probability of impact reduced.
For risks without mitigation plans, place budget for risk in Management Reserve (MR) to be used to handle risk when it becomes an Issue.
C
Step Outcome
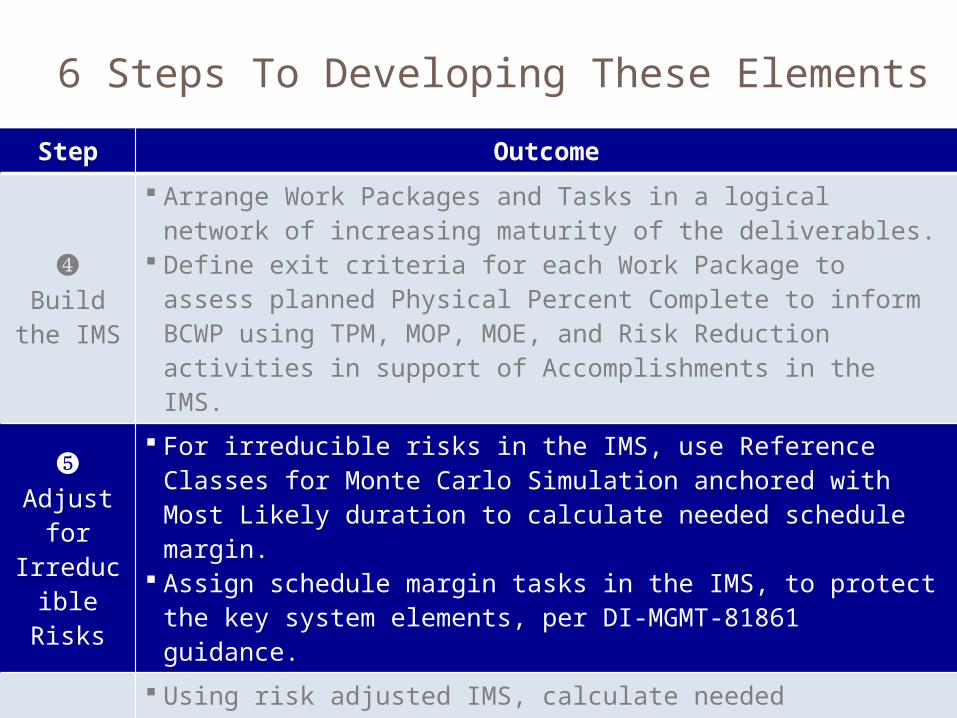
❹Build the
IMS
Arrange Work Packages and Tasks in a logical network of increasing maturity of the deliverables.
Define exit criteria for each Work Package to assess planned Physical Percent Complete to inform BCWP using TPM, MOP, MOE, and Risk Reduction activities in support of Accomplishments in the IMS.
❺Adjust
for Irreducible Risks
For irreducible risks in the IMS, use Reference Classes for Monte Carlo Simulation anchored with Most Likely duration to calculate needed schedule margin.
Assign schedule margin tasks in the IMS, to protect the key system elements, per DI-MGMT-81861 guidance.
❻Establish
PMB
Using risk adjusted IMS, calculate needed Management Reserve (MR) to account for the latent risks in the Risk Register.
With deterministic IMS and its embedded Schedule Margin and Management Reserve for latent risk, determine the resulting confidence level of the PMB.
6 Steps To Developing These Elements
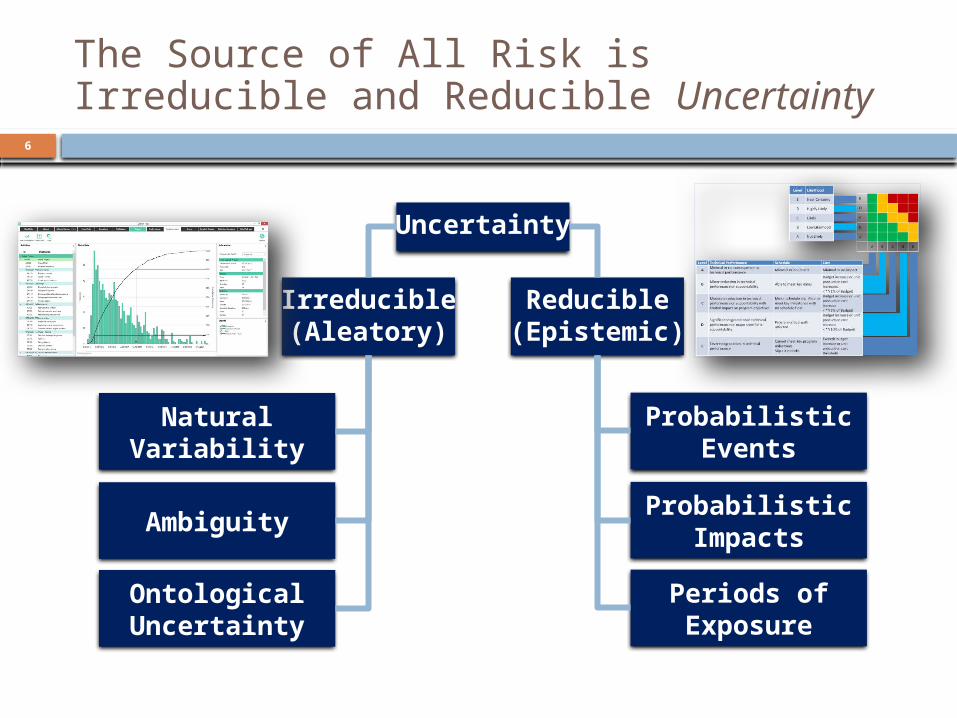
The Source of All Risk is Irreducible and Reducible Uncertainty
Uncertainty
Irreducible(Aleatory)
Reducible(Epistemic)
Natural Variability
Ambiguity
Ontological Uncertainty
Probabilistic Events
Probabilistic Impacts
Periods of Exposure
6
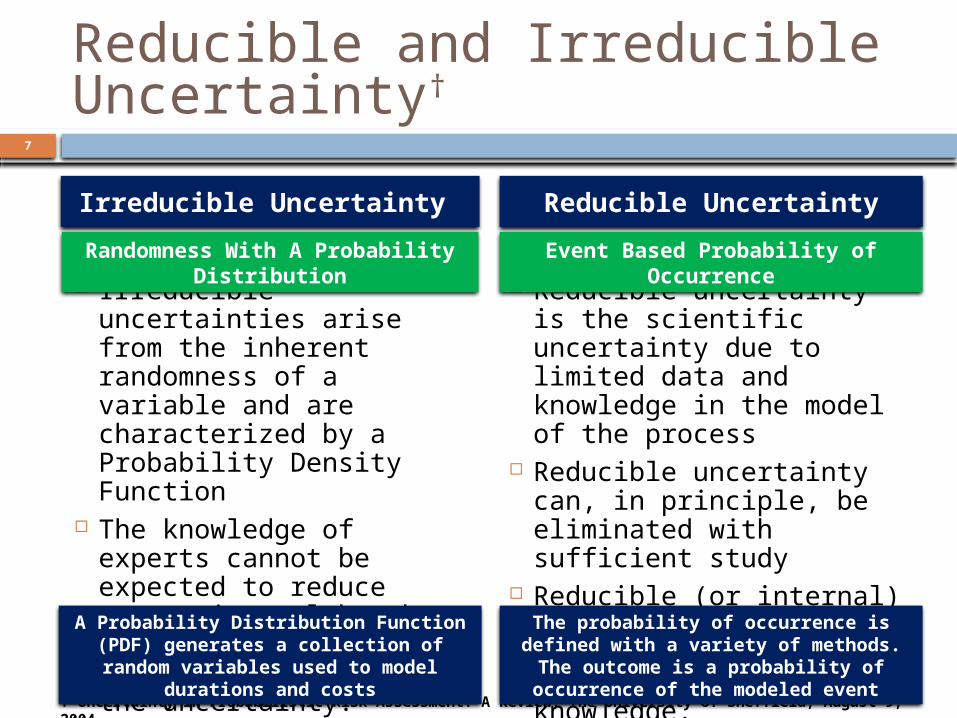
Reducible and Irreducible Uncertainty†
Reducible Uncertainty
Reducible uncertainty is the scientific uncertainty due to limited data and knowledge in the model of the process
Reducible uncertainty can, in principle, be eliminated with sufficient study
Reducible (or internal) uncertainty reflects the possibility of errors in our general knowledge.
Irreducible Uncertainty
Irreducible uncertainties arise from the inherent randomness of a variable and are characterized by a Probability Density Function
The knowledge of experts cannot be expected to reduce uncertainty although their knowledge may be useful in quantifying the uncertainty.
† Uncertainty in Probabilistic Risk Assessment: A Review, The University of Sheffield, August 9, 2004
Event Based Probability of OccurrenceRandomness With A Probability Distribution
The probability of occurrence is defined with a variety of methods. The outcome is a probability of
occurrence of the modeled event
A Probability Distribution Function (PDF) generates a collection of random variables used to model
durations and costs
7
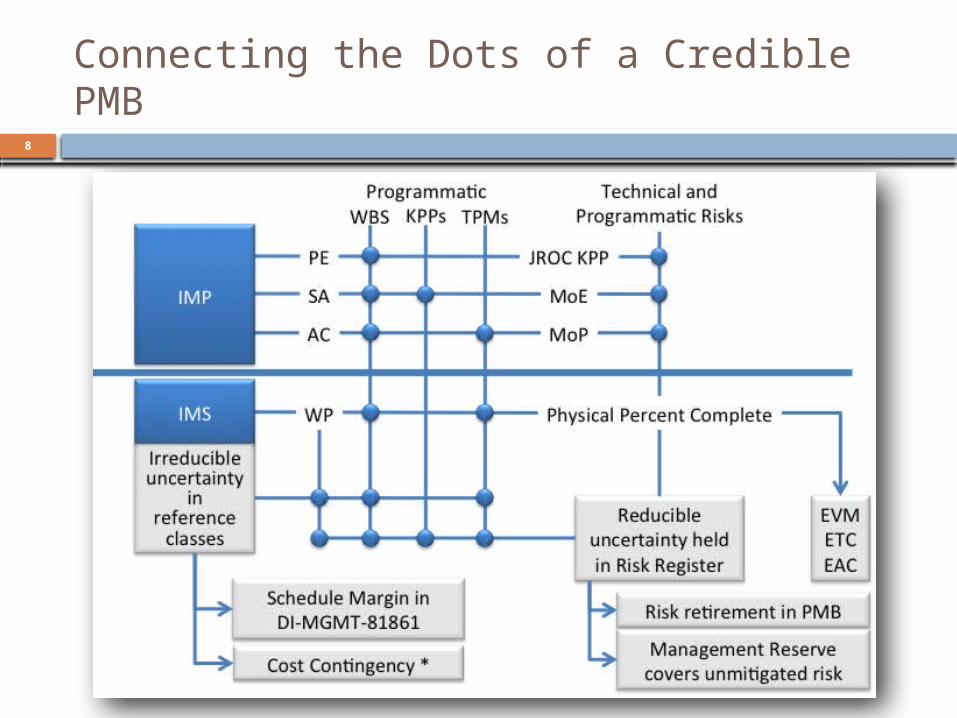
Connecting the Dots of a Credible PMB8
9
Risk Management is How Adults Manage Projects
– Tim Lister
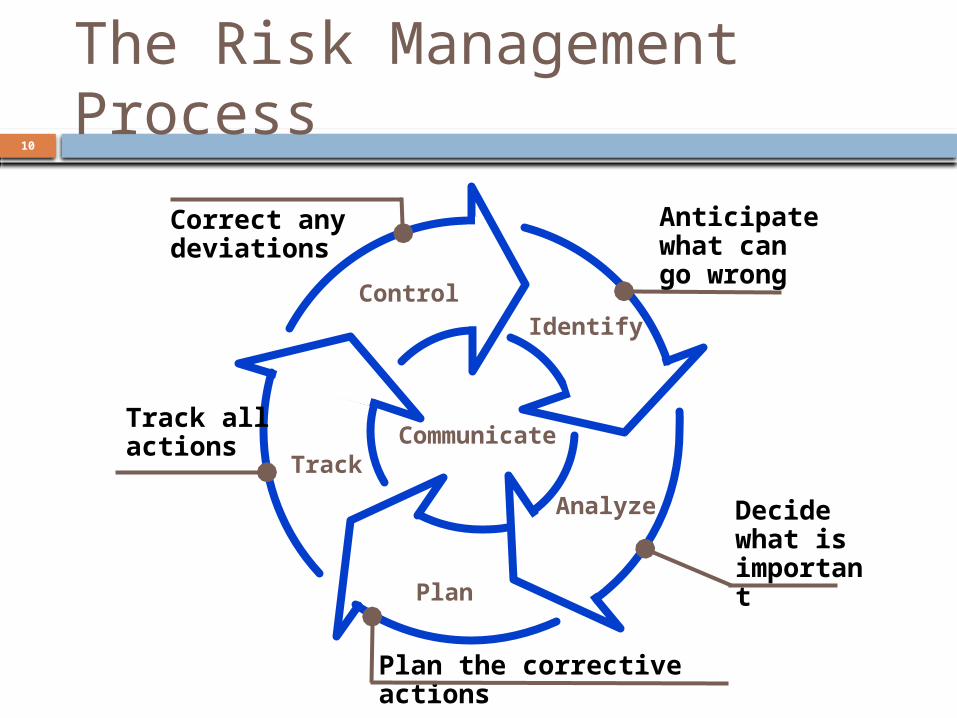
The Risk Management Process
Anticipate what can go wrong
Communicate
Identify
Plan
Track
Control
Decidewhat is important
Plan the corrective actions
Correct any deviations
Track all actions
Analyze
10
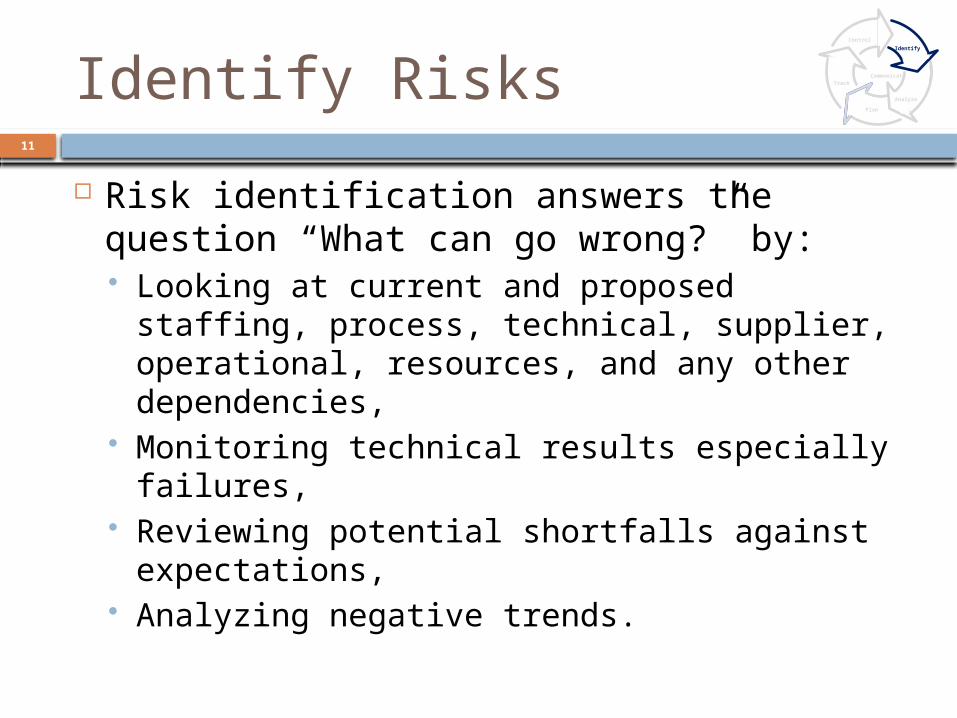
Identify Risks
Risk identification answers the question “What can go wrong?” by: Looking at current and proposed staffing,
process, technical, supplier, operational, resources, and any other dependencies,
Monitoring technical results especially failures,
Reviewing potential shortfalls against expectations,
Analyzing negative trends.
11
Communicate
Identify
Plan
Track
Control
Analyze
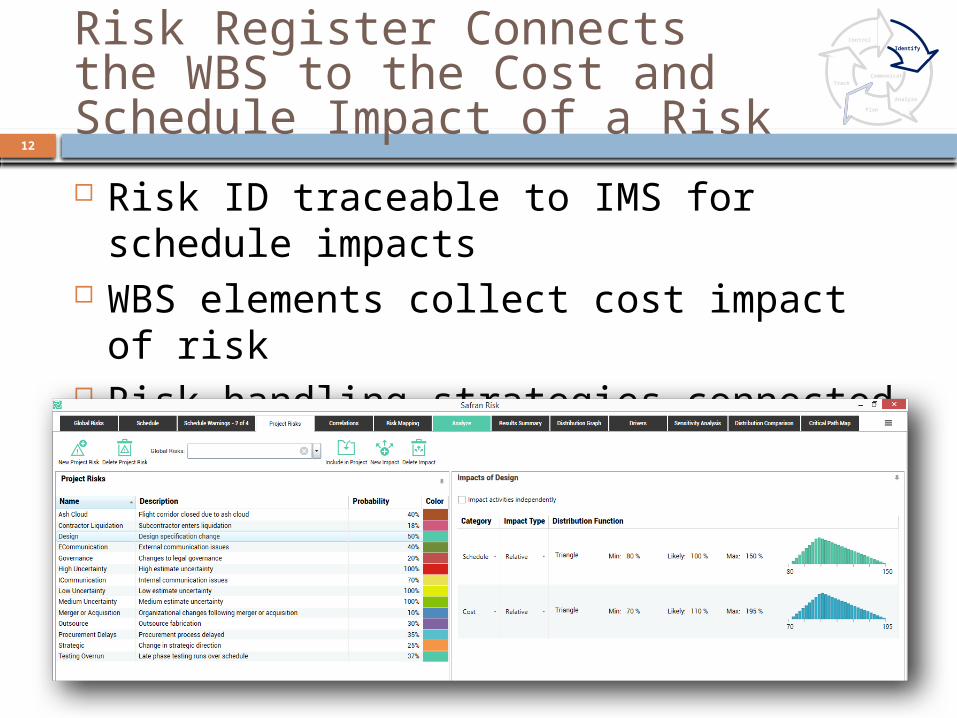
Risk Register Connects the WBS to the Cost and Schedule Impact of a Risk Risk ID traceable to IMS for schedule
impacts WBS elements collect cost impact of risk Risk handling strategies connected to
IMP, IMS, WBS, SOW, and TPM measures
Communicate
Identify
Plan
Track
Control
Analyze
12
Programmatic and Technical Compliance Measures of Risk
13
Key Performance Parameters (KPPs) – represent a critical subset of the performance parameters so significant that failure to meet the threshold value of performance can be cause for the concept or system selected to be reevaluated or the project to be reassessed or terminated.
Measures of Effectiveness (MOEs) – operational measures of success closely related to the achievements of the mission or operational objectives evaluated in the intended operational environment, under a specific set of conditions (i.e., how well the solution achieves the intended purpose).
Measures of Performance (MOPs) – characterize physical or functional attributes relating to the system operation, measured or estimated under specified testing and/or operational environment conditions.
Technical Performance Measures (TPMs) – measure attributes that determine how well a system or system element is satisfying or expected to satisfy a technical requirement or goal.
Communicate
Identify
Plan
Track
Control
Analyze
Analyze Reducible and Irreducible Risks
Risk analysis answers the question “How big is the risk?” by: Considering the likelihood of the root cause
occurrence; Identifying the possible consequences in
terms of performance, schedule, and cost; and
Identifying the risk level using the “Risk Reporting Matrix”
14
Communicate
Identify
Plan
Track
Control
Analyze
Planning Reducible and Irreducible Risk Response
Risk mitigation planning answers the question “What is the program’s approach for addressing this potential unfavorable consequence?”
One or more of these mitigation options may apply: Avoiding risk by eliminating the root cause and/or
the consequence, Controlling the cause or consequence, Transferring the risk, Assuming the level of risk and continuing on the
current program plan. Provide margin to cover the impact of the risk.
15
Communicate
Identify
Plan
Track
Control
Analyze
Implementing the Risk Plan
Risk mitigation (plan) execution ensures successful risk mitigation occurs.
It answers the question – How can the planned risk mitigation be implemented? Determining what planning, budget, and
requirements and contractual changes are needed, Providing a coordination vehicle for management
and other stakeholders, Directing the teams to execute the defined and
approved risk mitigation plans, Outlining the risk reporting requirements for on-
going monitoring, and Documenting the change history.
16
Communicate
Identify
Plan
Track
Control
Analyze
Time Phased Reducible Risks Impact Future Performance
17
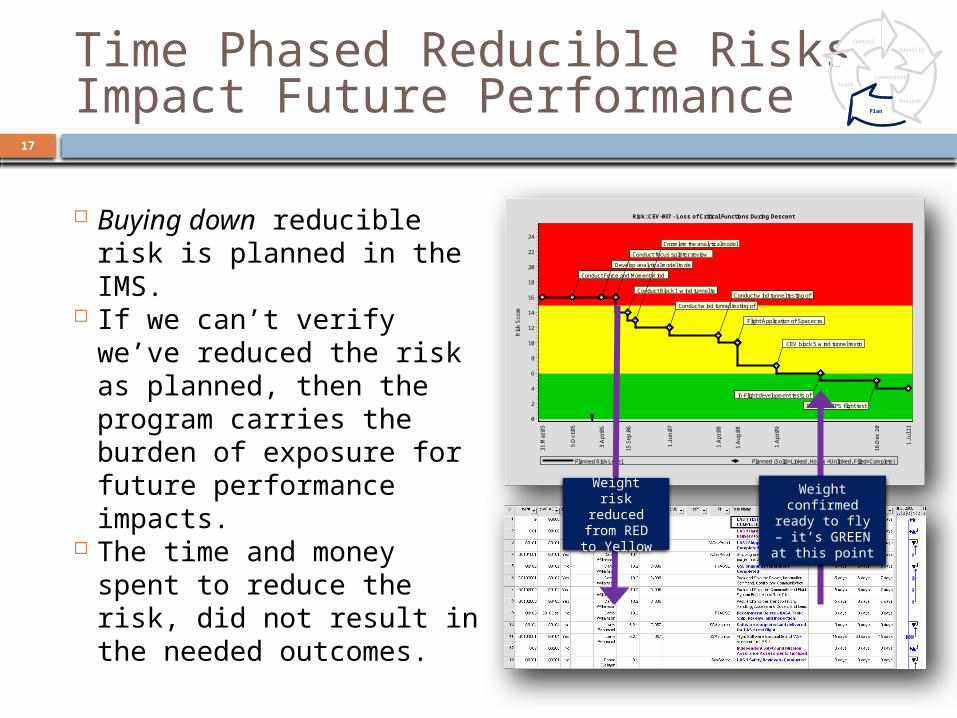
Buying down reducible risk is planned in the IMS.
If we can’t verify we’ve reduced the risk as planned, then the program carries the burden of exposure for future performance impacts.
The time and money spent to reduce the risk, did not result in the needed outcomes.
Risk: CEV-037 - Loss of Critical Functions During Descent
Planned Risk Level Planned (Solid=Linked, Hollow =Unlinked, Filled=Complete)
Ris
k S
core
24
22
20
18
16
14
12
10
8
6
4
2
0
Conduct Force and Moment Wind
Develop analytical model to de
Conduct focus splinter review
Conduct Block 1 w ind tunnel te
Correlate the analytical model
Conduct w ind tunnel testing of
Conduct w ind tunnel testing of
Flight Application of Spacecra
CEV block 5 w ind tunnel testin
In-Flight development tests of
Damaged TPS flight test
31.M
ar.0
5
5.O
ct.0
5
3.A
pr.0
6
3.Ju
l.06
15.S
ep.0
6
1.Ju
n.07
1.A
pr.0
8
1.A
ug.0
8
1.A
pr.0
9
1.Ja
n.10
16.D
ec.1
0
1.Ju
l.11
Weight risk reduced
from RED to Yellow
Weight confirmed
ready to fly – it’s GREEN at
this point
Communicate
Identify
Plan
Track
Control
Analyze
Tracking the Risk
Risk tracking ensures successful risk mitigation. It answers the question “How are things going?” by: Communicating risks to all affected stakeholders, Monitoring risk mitigation plans Reviewing regular status updates Displaying risk management dynamics by
tracking risk status within the Risk Reporting Matrix
Alerting management as to when risk mitigation plans should be implemented or adjusted.
18
Communicate
Identify
Plan
Track
Control
Analyze
19
Risk Control Processes
The Risk Control function takes tracking status reports for the watched and mitigated program risk and decides what to do with them based on the reported data. The general process of controlling risks includes: Analyzing the status reports Deciding how to proceed Executing the decisions
Communicate
Identify
Plan
Track
Control
Analyze
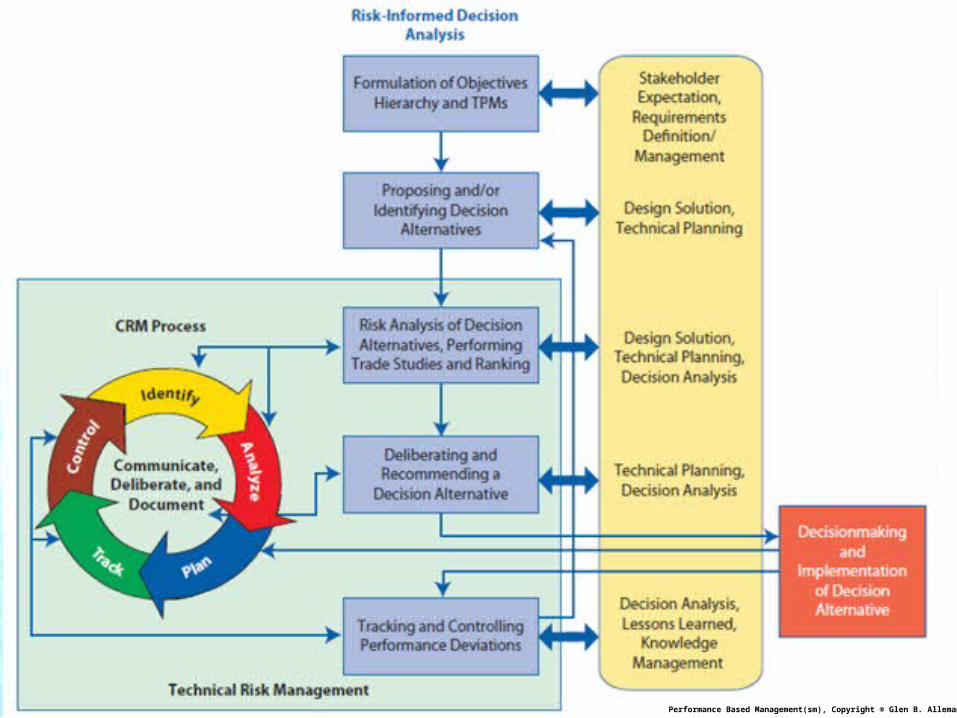
The End Use of a Risk Informed Performance Measurement Baseline
20
Provide the program manager with a credible Estimate At Completion (EAC) based on: Mitigation for reducible risks using work
activities in the PMB Management Reserve for reducible risks
with no mitigation plans Schedule margin for irreducible risks,
placed in front of at key program deliverables
Communicate
Identify
Plan
Track
Control
Analyze
21 Performance Based Management(sm), Copyright ® Glen B. Alleman, 2012
Risk informing the PMB means have cost and schedule margin to cover irreducible risks. And having risk buy down activities to cover reducible risks.Any cost or schedule plan without Margin or Reserve is late and over budget before you start
Cost and Schedule Margin22
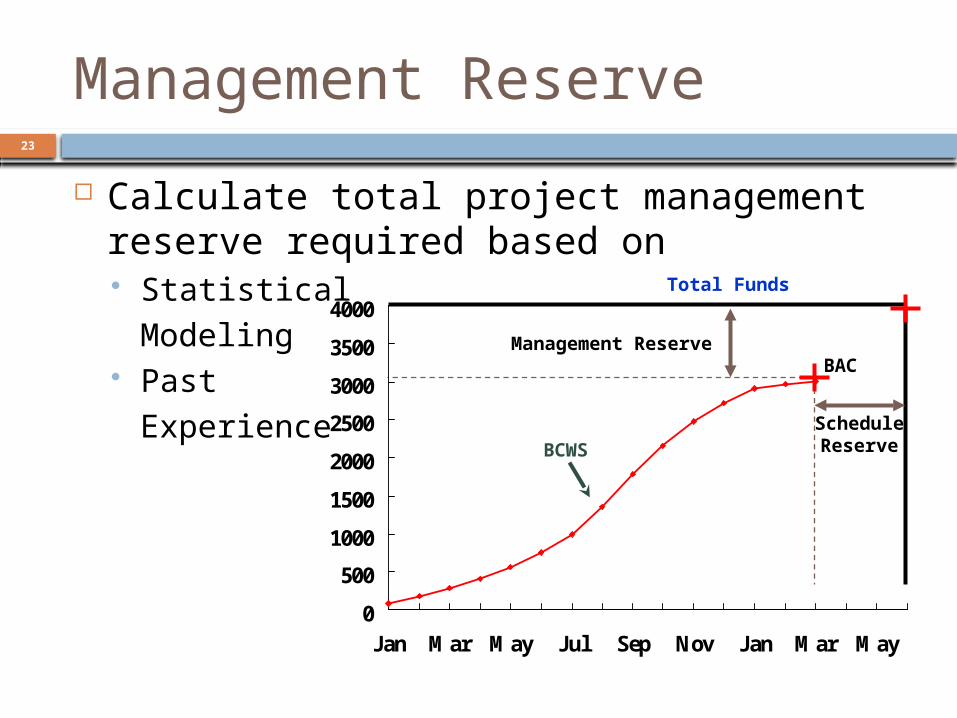
Management Reserve
Calculate total project management reserve required based on Statistical
Modeling Past
Experience
0
500
1000
1500
2000
2500
3000
3500
4000
Jan Mar May Jul Sep Nov Jan Mar May
BCWS
Management Reserve
ScheduleReserve
BAC
Total Funds
23
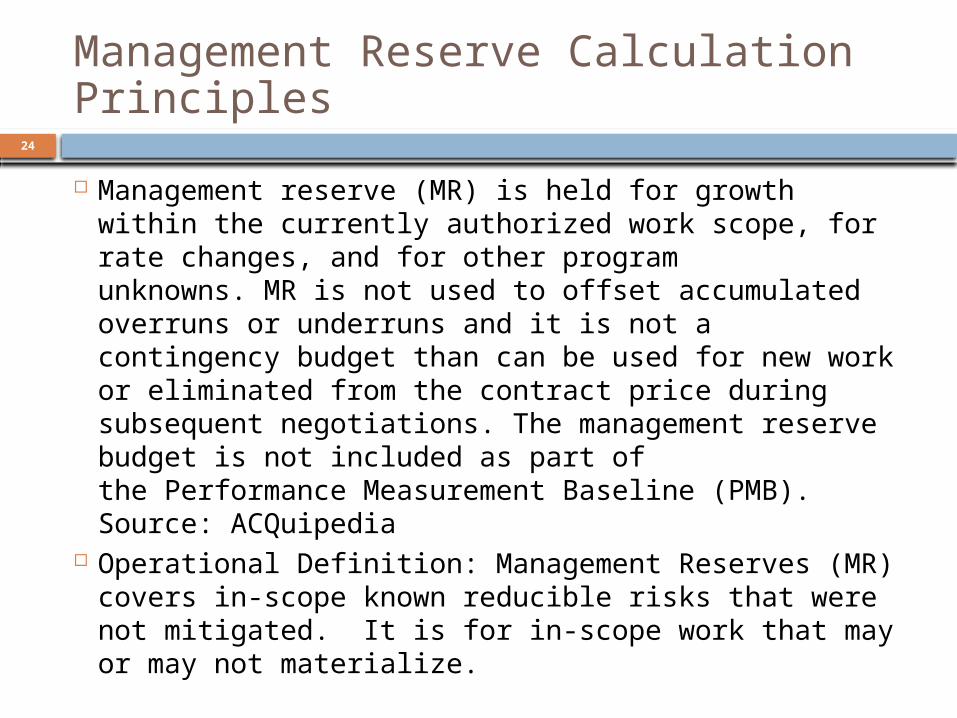
Management Reserve Calculation Principles
Management reserve (MR) is held for growth within the currently authorized work scope, for rate changes, and for other program unknowns. MR is not used to offset accumulated overruns or underruns and it is not a contingency budget than can be used for new work or eliminated from the contract price during subsequent negotiations. The management reserve budget is not included as part of the Performance Measurement Baseline (PMB). Source: ACQuipedia
Operational Definition: Management Reserves (MR) covers in-scope known reducible risks that were not mitigated. It is for in-scope work that may or may not materialize.
24
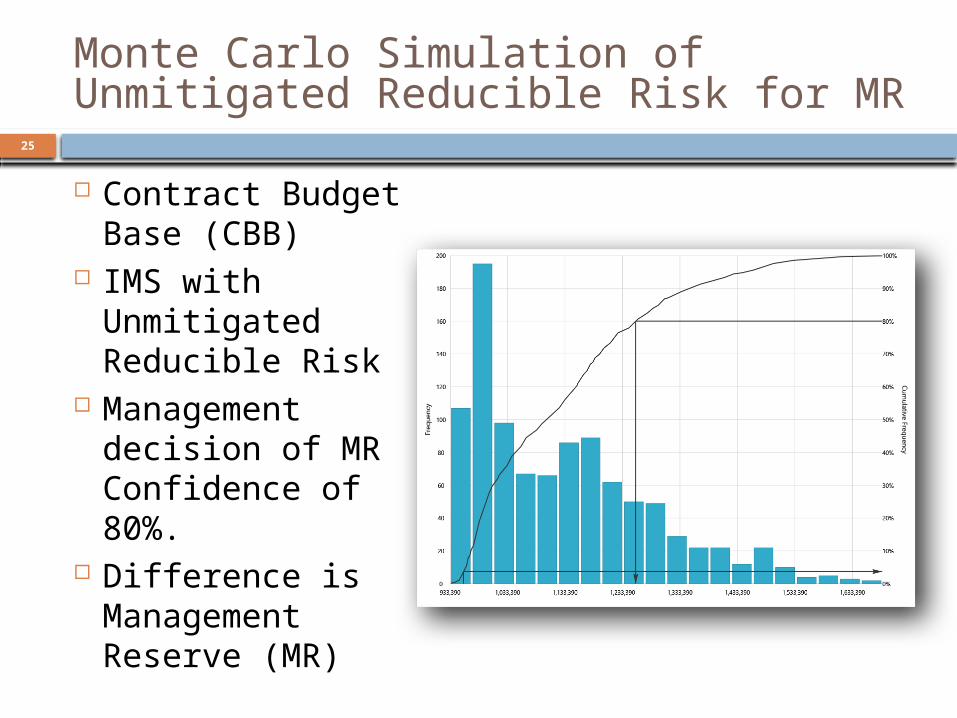
Monte Carlo Simulation of Unmitigated Reducible Risk for MR
25
Contract Budget Base (CBB)
IMS with Unmitigated Reducible Risk
Management decision of MR Confidence of 80%.
Difference is Management Reserve (MR)
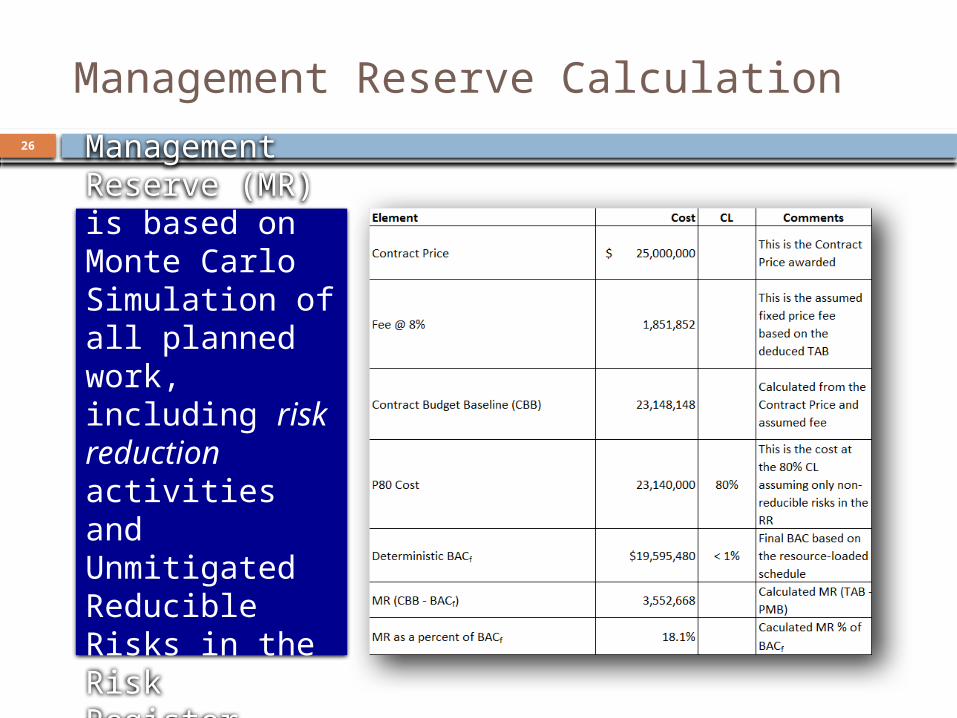
Management Reserve Calculation
Management Reserve (MR) is based on Monte Carlo Simulation of all planned work, including risk reduction activities and Unmitigated Reducible Risks in the Risk Register.
26
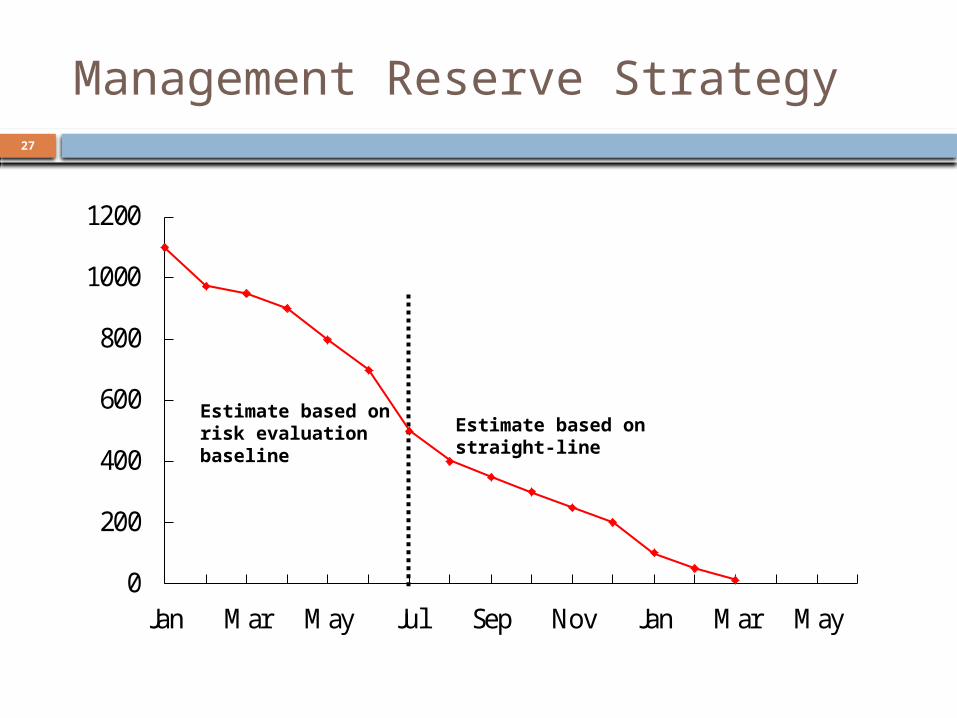
Management Reserve Strategy
0
200
400
600
800
1000
1200
Jan Mar May Jul Sep Nov Jan Mar May
Estimate based onrisk evaluationbaseline
Estimate based onstraight-line
27
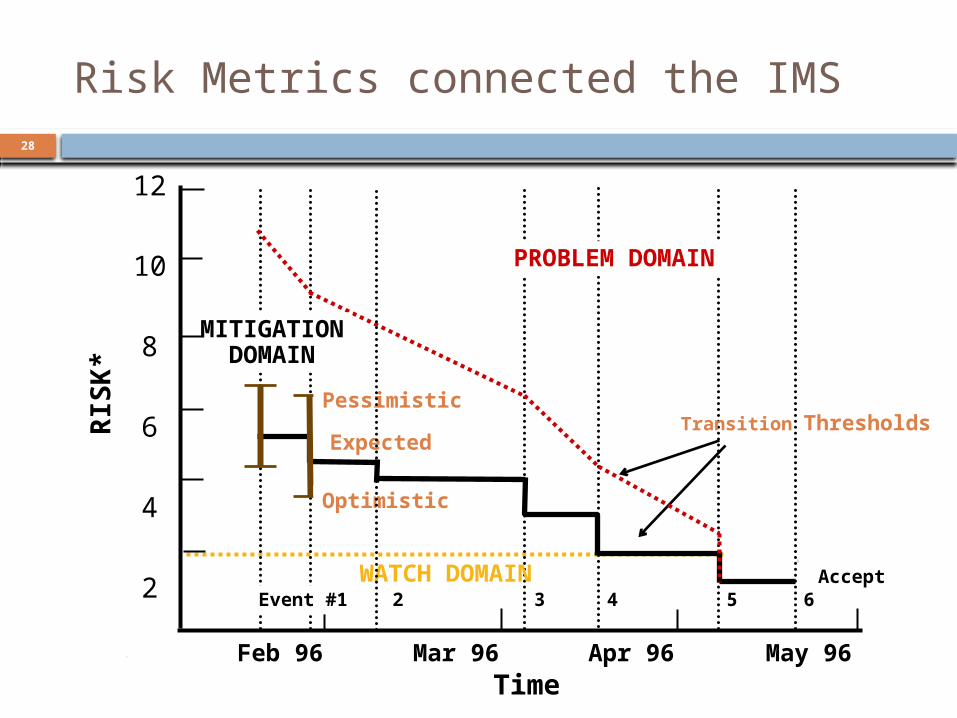
Risk Metrics connected the IMS
WATCH DOMAIN
RIS
K*
Transition Thresholds
PROBLEM DOMAIN
Feb 96 Mar 96 Apr 96Time
Pessimistic
Expected
Optimistic
MITIGATIONDOMAIN
Accept
12
10
8
6
4
2
May 96
Event #1 2 3 4 65
28
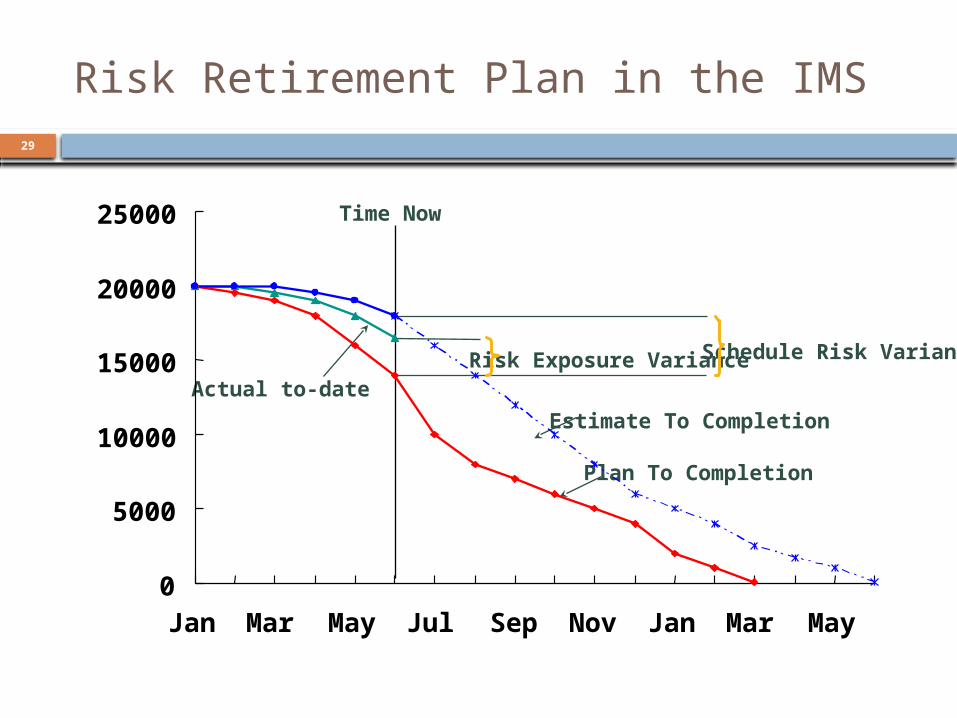
Risk Retirement Plan in the IMS
Time Now
Estimate To Completion
Risk Exposure Variance Schedule Risk Variance
Plan To Completion
Actual to-date
0
5000
10000
15000
20000
25000
Jan Mar May Jul Sep Nov Jan Mar May
29
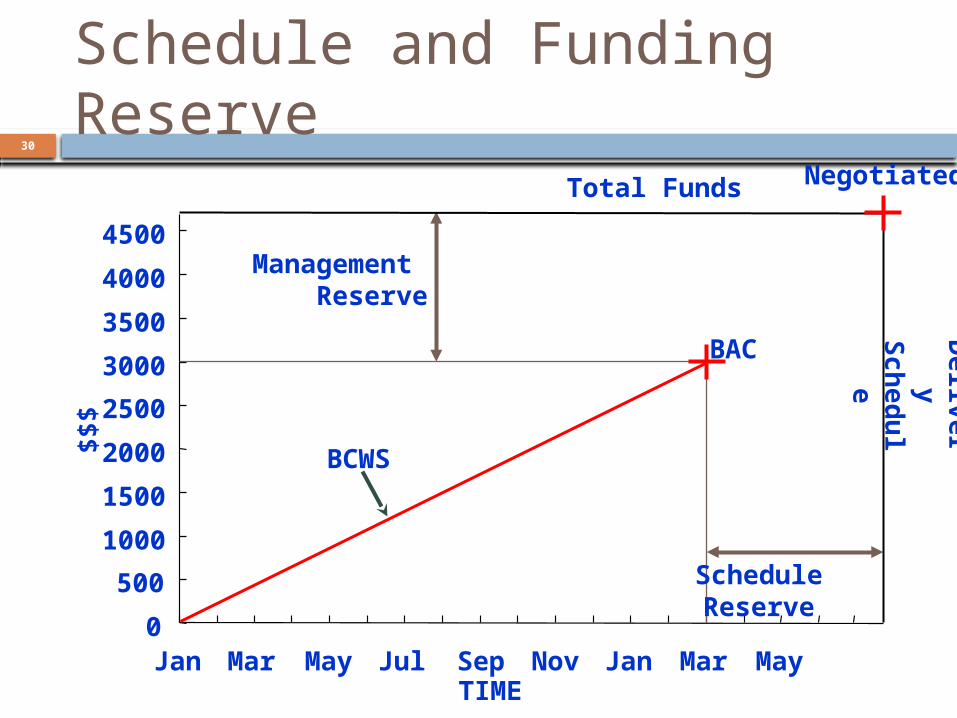
Schedule and Funding Reserve
0
500
1000
1500
2000
2500
3000
3500
4000
Jan Mar May Jul Sep Nov Jan Mar May
BCWS
Management Reserve
ScheduleReserve
BAC
Total Funds
Delivery
Sch edul e
TIME
$$$
4500
Negotiated30
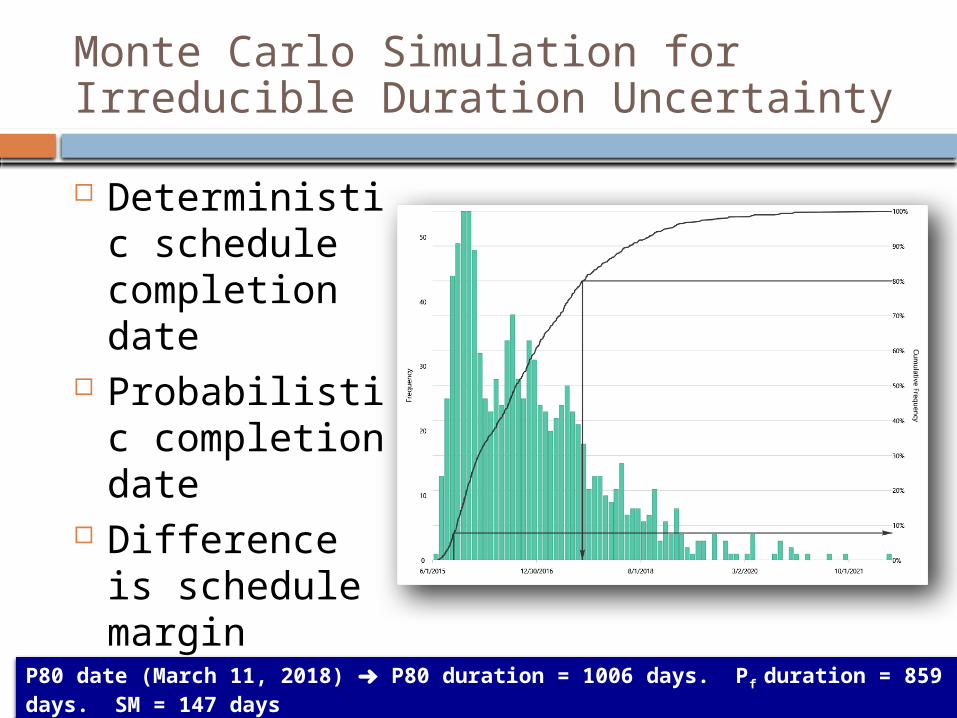
Monte Carlo Simulation for Irreducible Duration Uncertainty
Deterministic schedule completion date
Probabilistic completion date
Difference is schedule margin
P80 date (March 11, 2018) ➜ P80 duration = 1006 days. Pf duration = 859 days. SM = 147 days
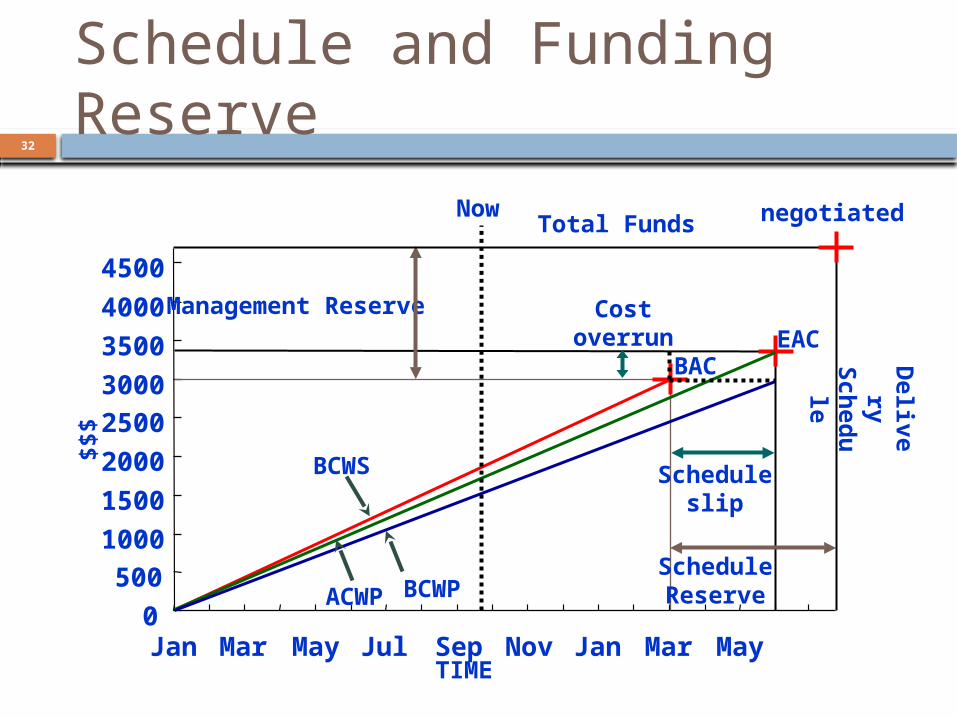
Schedule and Funding Reserve
0500
1000150020002500300035004000
Jan Mar May Jul Sep Nov Jan Mar May
BCWS
Management Reserve
ScheduleReserve
BAC
Total Funds
Delivery
Schedu le
TIME
$$$
4500
EAC
negotiated
ACWP BCWP
Now
Scheduleslip
Costoverrun
32
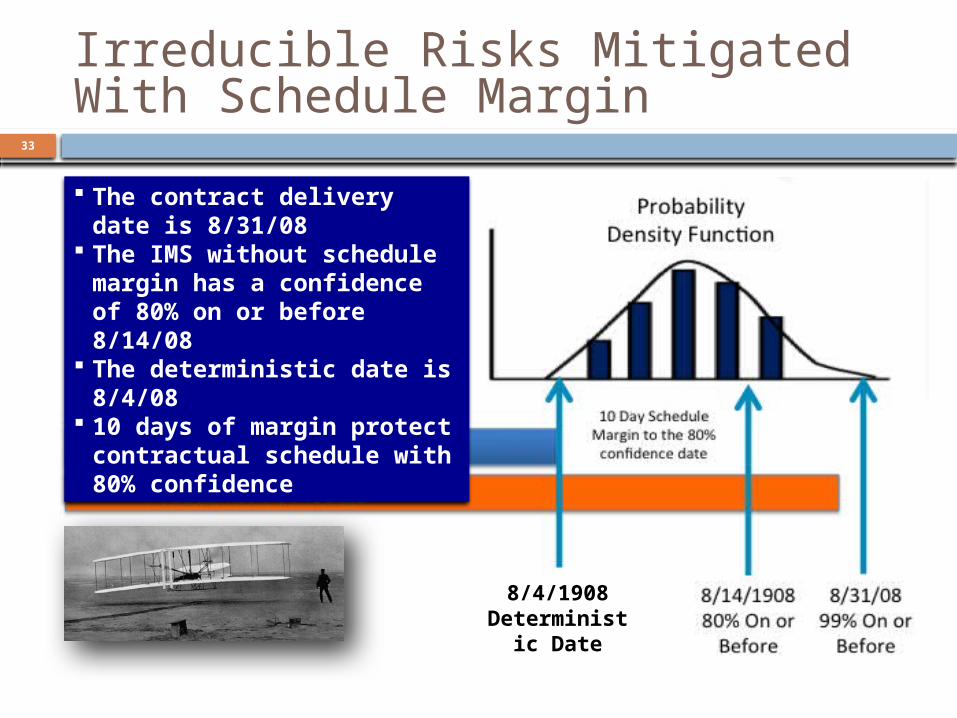
The contract delivery date is 8/31/08
The IMS without schedule margin has a confidence of 80% on or before 8/14/08
The deterministic date is 8/4/08
10 days of margin protect contractual schedule with 80% confidence
8/4/1908Deterministic
Date
GA/RP
Irreducible Risks Mitigated With Schedule Margin
33
34
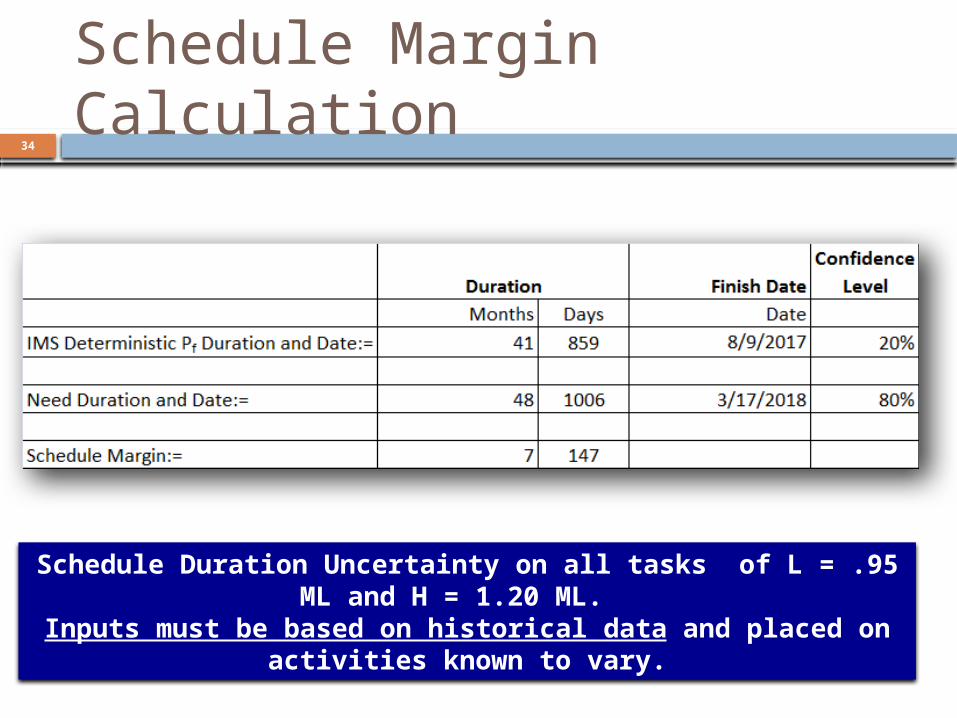
Schedule Margin Calculation
Schedule Duration Uncertainty on all tasks of L = .95 ML and H = 1.20 ML.
Inputs must be based on historical data and placed on activities known to vary.
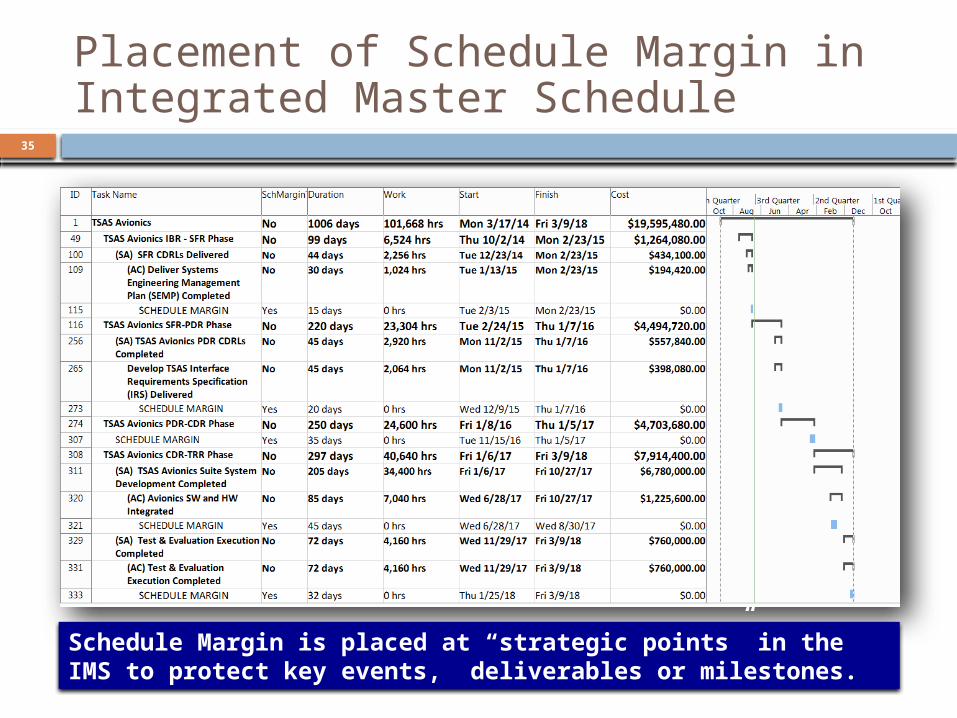
Placement of Schedule Margin in Integrated Master Schedule
Schedule Margin is placed at “strategic points” in the IMS to protect key events, deliverables or milestones.
35
36
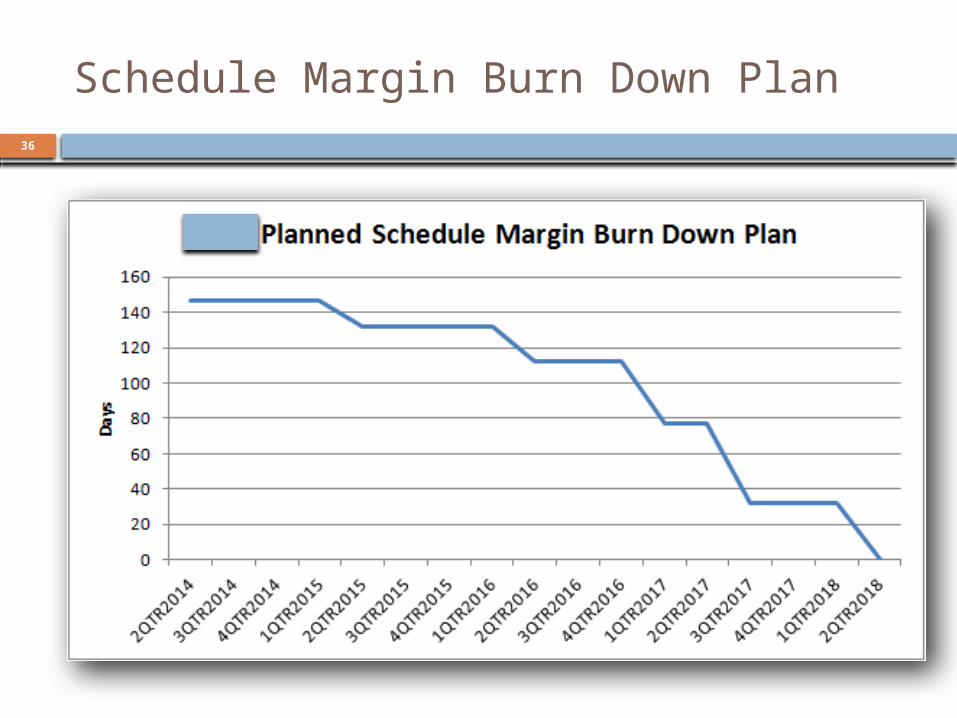
Schedule Margin Burn Down Plan
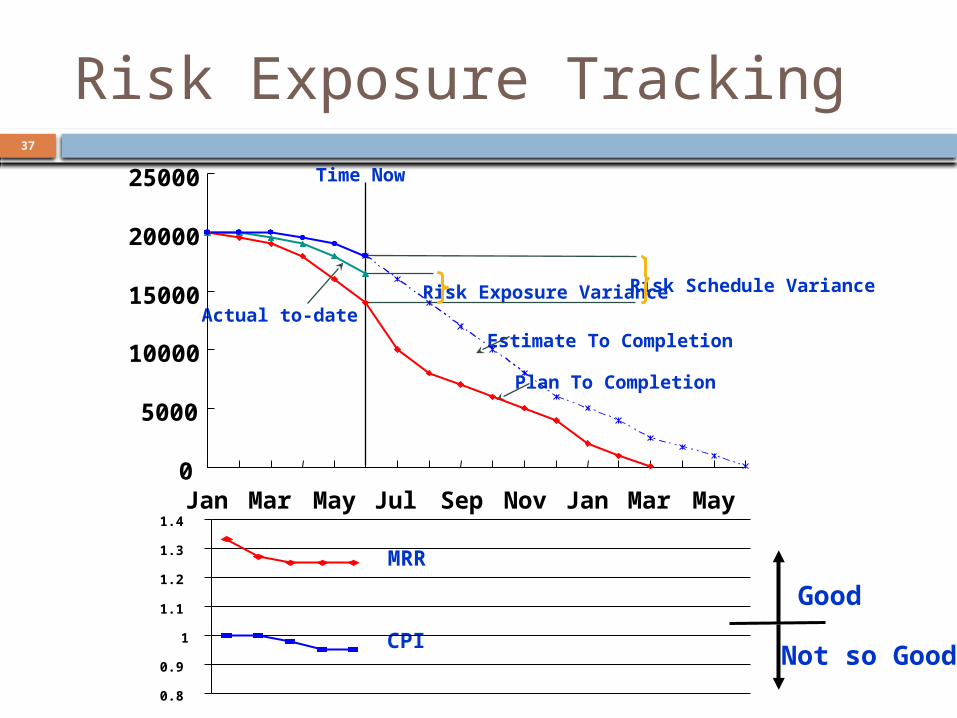
Risk Exposure TrackingTime Now
Estimate To Completion
Risk Exposure Variance Risk Schedule Variance
Plan To Completion
Actual to-date
MRR
CPI
Good
Not so Good0.8
0.9
1
1.1
1.2
1.3
1.4
0
5000
10000
15000
20000
25000
Jan Mar May Jul Sep Nov Jan Mar May
37
Reference class forecasting, or comparison class forecasting, is the method of predicting the future, through looking at similar past situations and their outcomes.
Reference Class Forecasting
38

39

Reference Class Step By StepFrom Nobel Prize to Project Management, Flyvbjerg, 2006
40
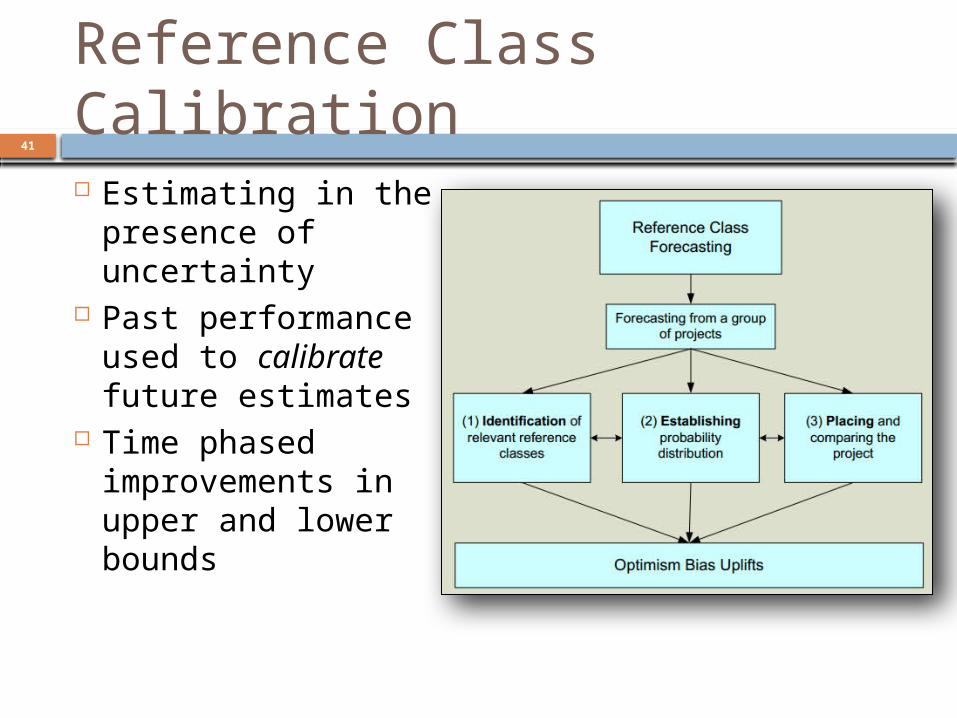
Reference Class Calibration41
Estimating in the presence of uncertainty
Past performance used to calibrate future estimates
Time phased improvements in upper and lower bounds
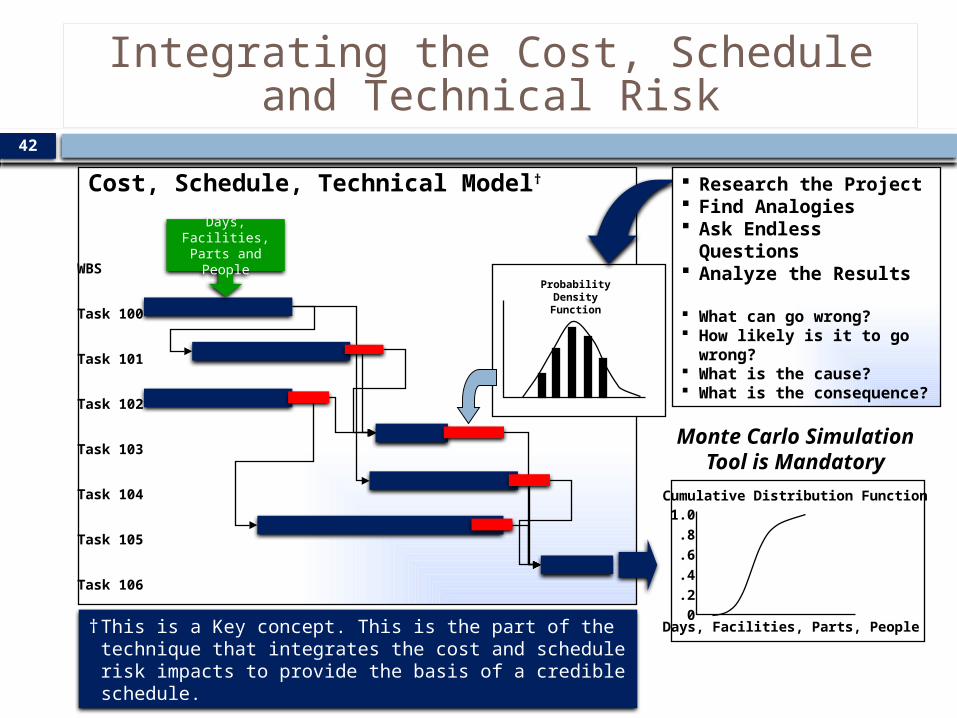
Integrating the Cost, Schedule and Technical Risk
Cost, Schedule, Technical Model†
WBS
Task 100
Task 101
Task 102
Task 103
Task 104
Task 105
Task 106
† This is a Key concept. This is the part of the technique that integrates the cost and schedule risk impacts to provide the basis of a credible schedule.
Probability Density
Function
Research the Project Find Analogies Ask Endless Questions Analyze the Results
What can go wrong? How likely is it to go wrong? What is the cause? What is the consequence?
Monte Carlo Simulation Tool is Mandatory
1.0
.8
.6
.4
.2
0Days, Facilities, Parts, People
Cumulative Distribution Function
Days, Facilities, Parts
and People
42
With the Risk Adjusted PMB, we now need to inform program performance (Earned Value) comes next.With reducible risk, the planned reduction of risk, on the planned date, informs program performance.With irreducible risk, the schedule margin reduction as planned informs program performance
Connecting Risk and EV43
EV Data
EV Data EV Data
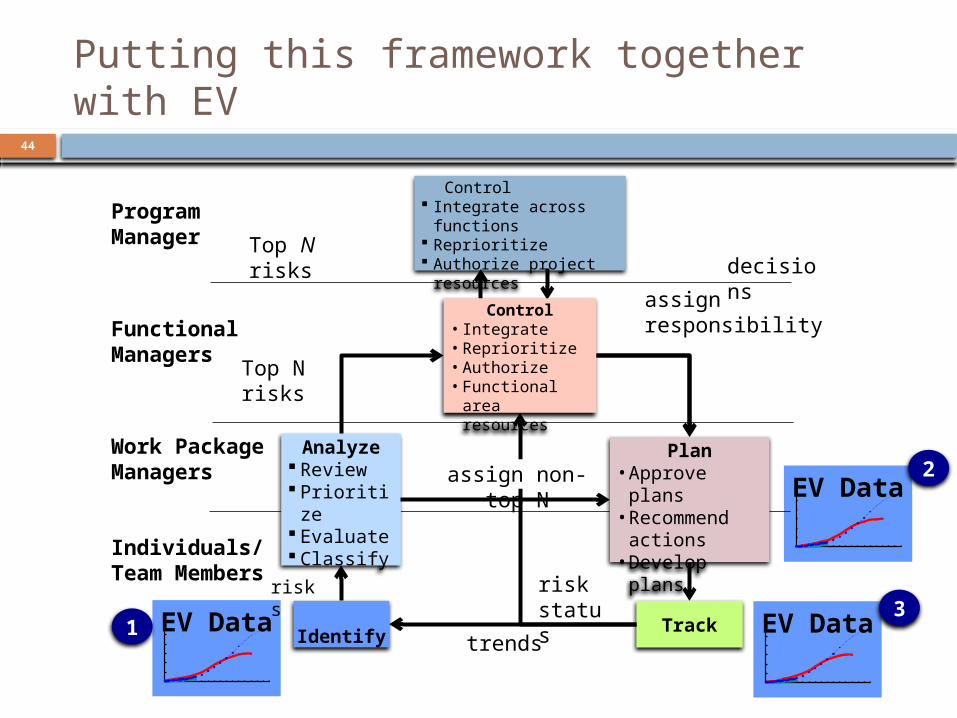
Putting this framework together with EV
Program Manager
FunctionalManagers
Work Package Managers
Individuals/Team Members
Identify
Analyze Review Prioritize Evaluate Classify
Track
Plan• Approve plans• Recommend
actions• Develop plans
Control Integrate across functions Reprioritize Authorize project resources
risks
Top N risks
Top N risks decisions
assign responsibility
trends
risk status
Control• Integrate • Reprioritize• Authorize • Functional area
resources
13
2assign non-top N
44
Connecting EV and Risk Management45
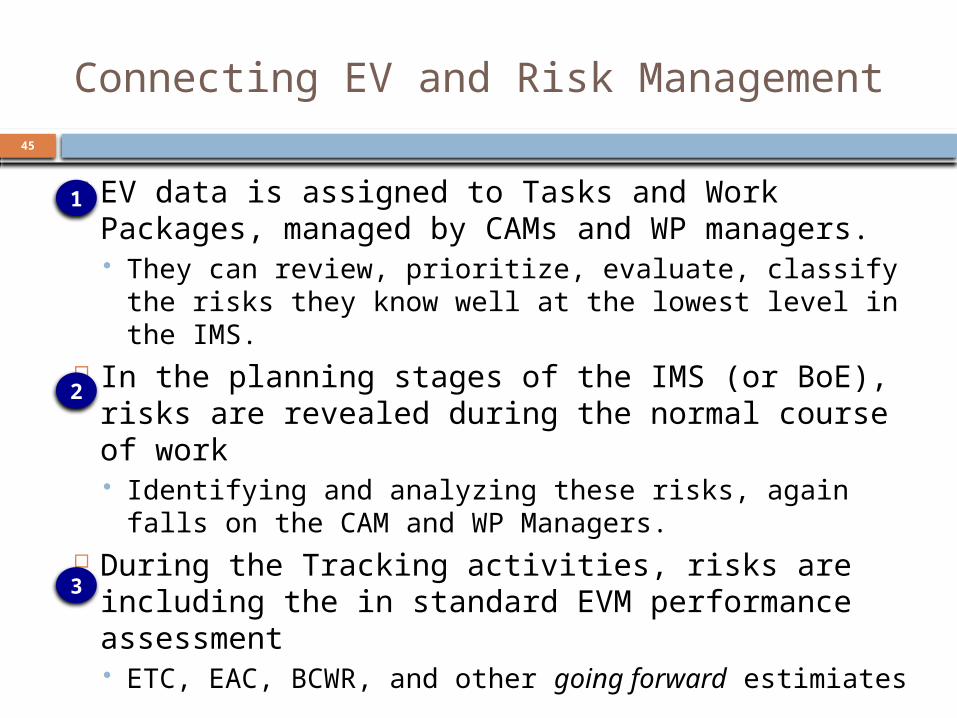
EV data is assigned to Tasks and Work Packages, managed by CAMs and WP managers. They can review, prioritize, evaluate, classify the
risks they know well at the lowest level in the IMS. In the planning stages of the IMS (or BoE), risks
are revealed during the normal course of work Identifying and analyzing these risks, again falls on
the CAM and WP Managers. During the Tracking activities, risks are including
the in standard EVM performance assessment ETC, EAC, BCWR, and other going forward
estimiates
1
2
3
Using Risk to Inform Current Performance
46
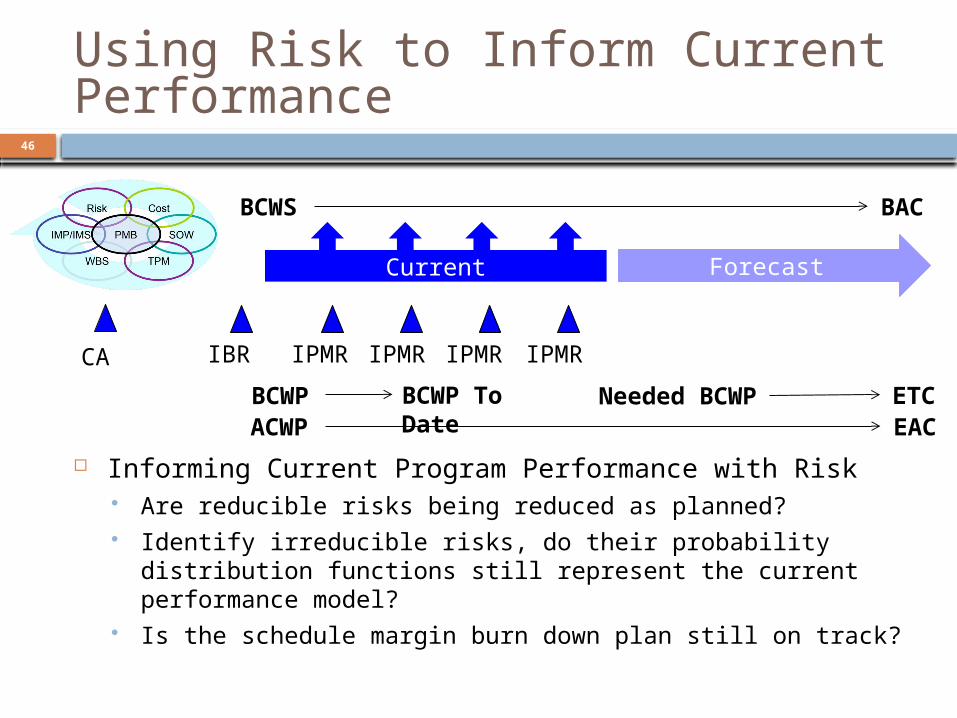
Informing Current Program Performance with Risk Are reducible risks being reduced as planned? Identify irreducible risks, do their probability distribution
functions still represent the current performance model? Is the schedule margin burn down plan still on track?
CA IBR IPMR IPMR IPMR IPMR
BAC
Needed BCWPACWP
BCWS
EACETCBCWP BCWP To Date
Current Forecast
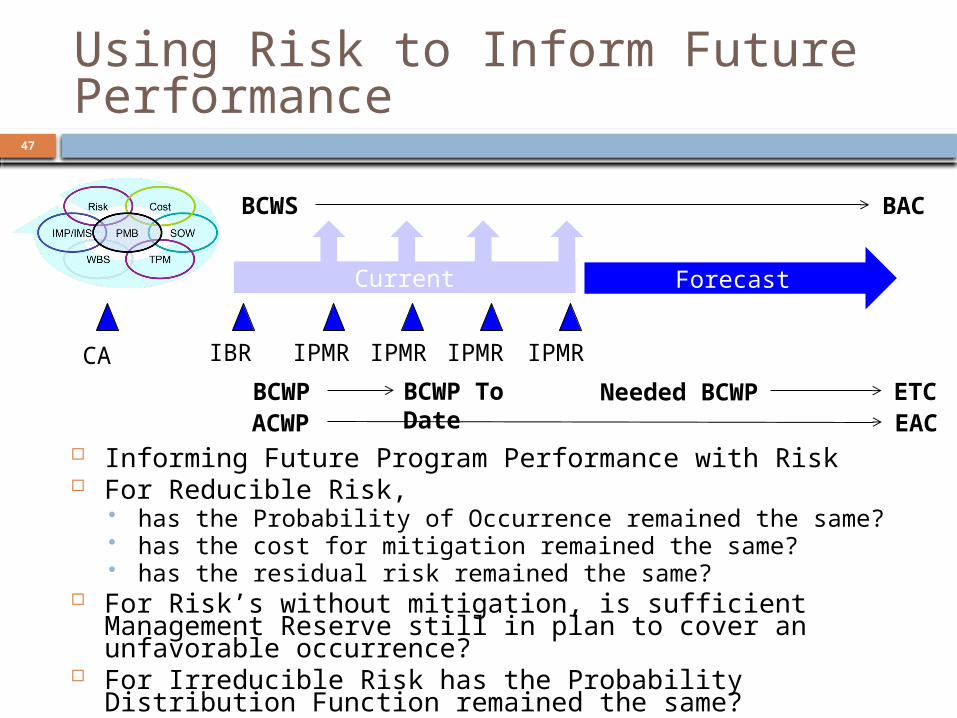
Using Risk to Inform Future Performance
47
Informing Future Program Performance with Risk For Reducible Risk,
has the Probability of Occurrence remained the same? has the cost for mitigation remained the same? has the residual risk remained the same?
For Risk’s without mitigation, is sufficient Management Reserve still in plan to cover an unfavorable occurrence?
For Irreducible Risk has the Probability Distribution Function remained the same?
CA IBR IPMR IPMR IPMR IPMR
BAC
Needed BCWPACWP
BCWS
EACETCBCWP BCWP To Date
Current Forecast
With the Reducible and Irreducible risks identified, analyzed, planned, tracked, and controlled, we can now construct the picture needed by the Program Manager to increase the Probability of Success by producing the …
The Final Picture We Are Looking For48
Communicate
Identify
Plan
Track
Control
Analyze
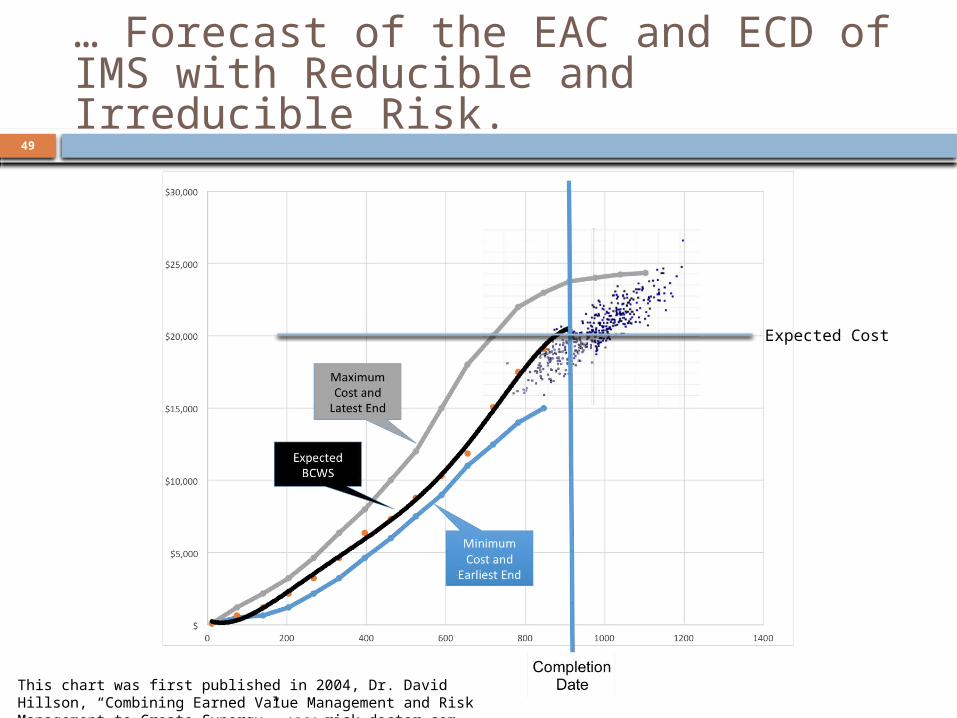
This chart was first published in 2004, Dr. David Hillson, “Combining Earned Value Management and Risk Management to Create Synergy”, www.risk-doctor.com
… Forecast of the EAC and ECD of IMS with Reducible and Irreducible Risk.
Expected Cost
49
50
IMP/IMS Development and Execution Earned Value Management Systems Programmatic and Technical Risk Management Proposal Management DFARS Six Business Systems Integration DCMA/DCAA Validation and Surveillance
[email protected]+1 303 241 9633
Increasing the Probability of Program Success