Embed Size (px)
Citation preview
Earnings Presentation Fourth Quarter 2011 CEO – Terje Sorensen
BD Director – Rune Juliussen
23 February 2012 1
Siem Offshore – Vision, Values and Focus
Vision:
“The Leading Provider and the Most Attractive Employer”
Values:
• Caring – Committed – Competitive
Focus:
• Provide cost efficient and high quality solutions for clients, through:
• High Competence Employees
• First Class Procedures
• High Quality Assets
• No Compromise on Safety
2
Siem Offshore - Organisation
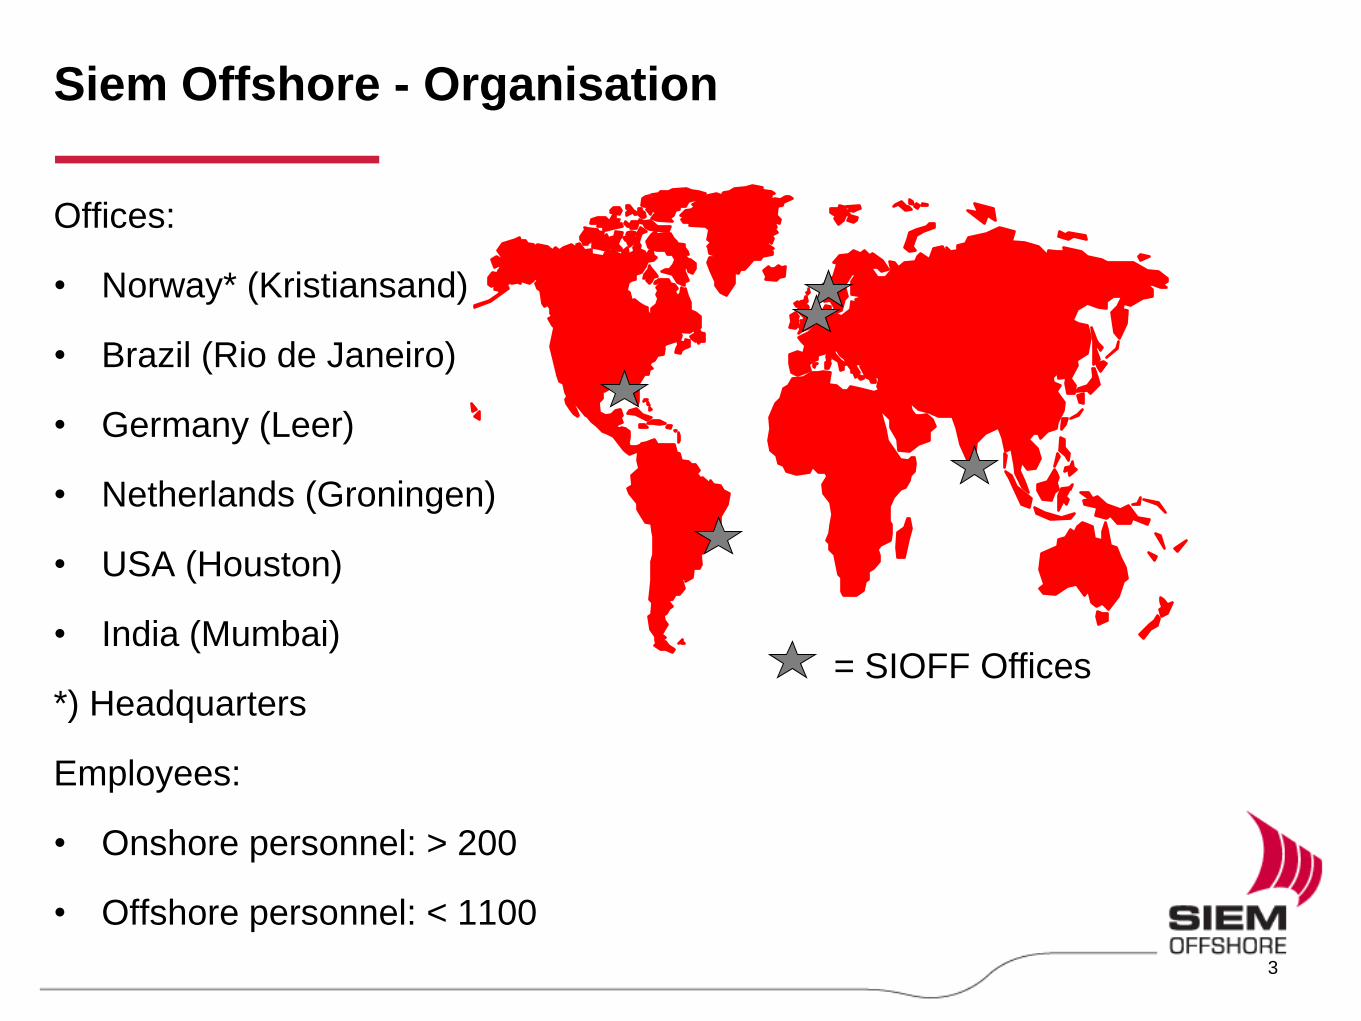
Offices:
• Norway* (Kristiansand)
• Brazil (Rio de Janeiro)
• Germany (Leer)
• Netherlands (Groningen)
• USA (Houston)
• India (Mumbai)
*) Headquarters
Employees:
• Onshore personnel: > 200
• Offshore personnel: < 1100
= SIOFF Offices
3
Highlights Fourth Quarter 2011
• Highest historical quarterly operating margin (nominal and percentage)
• Highest fixture rates for North Sea AHTS vessels during 2011, but still
volatile
• High utilisation in all three main segments (AHTS, PSV and MRSV)
• Cash position increased to USD 137 million from operations and
renegotiated debt facility
• Sale of the mid-size PSV "Siem Danis" at a price of USD 34 million with
delivery scheduled for first quarter 2012
4
Subsequent Events
• Entered into contracts for the two PSVs “Siem Louisa” and “Sophie Siem”
for 100 days and 180 days respectively, with options, for operations
offshore Ghana
• Extended the contract for the MRSV “Siem Marlin” until April 2013, with
options, for operations offshore Nigeria
5
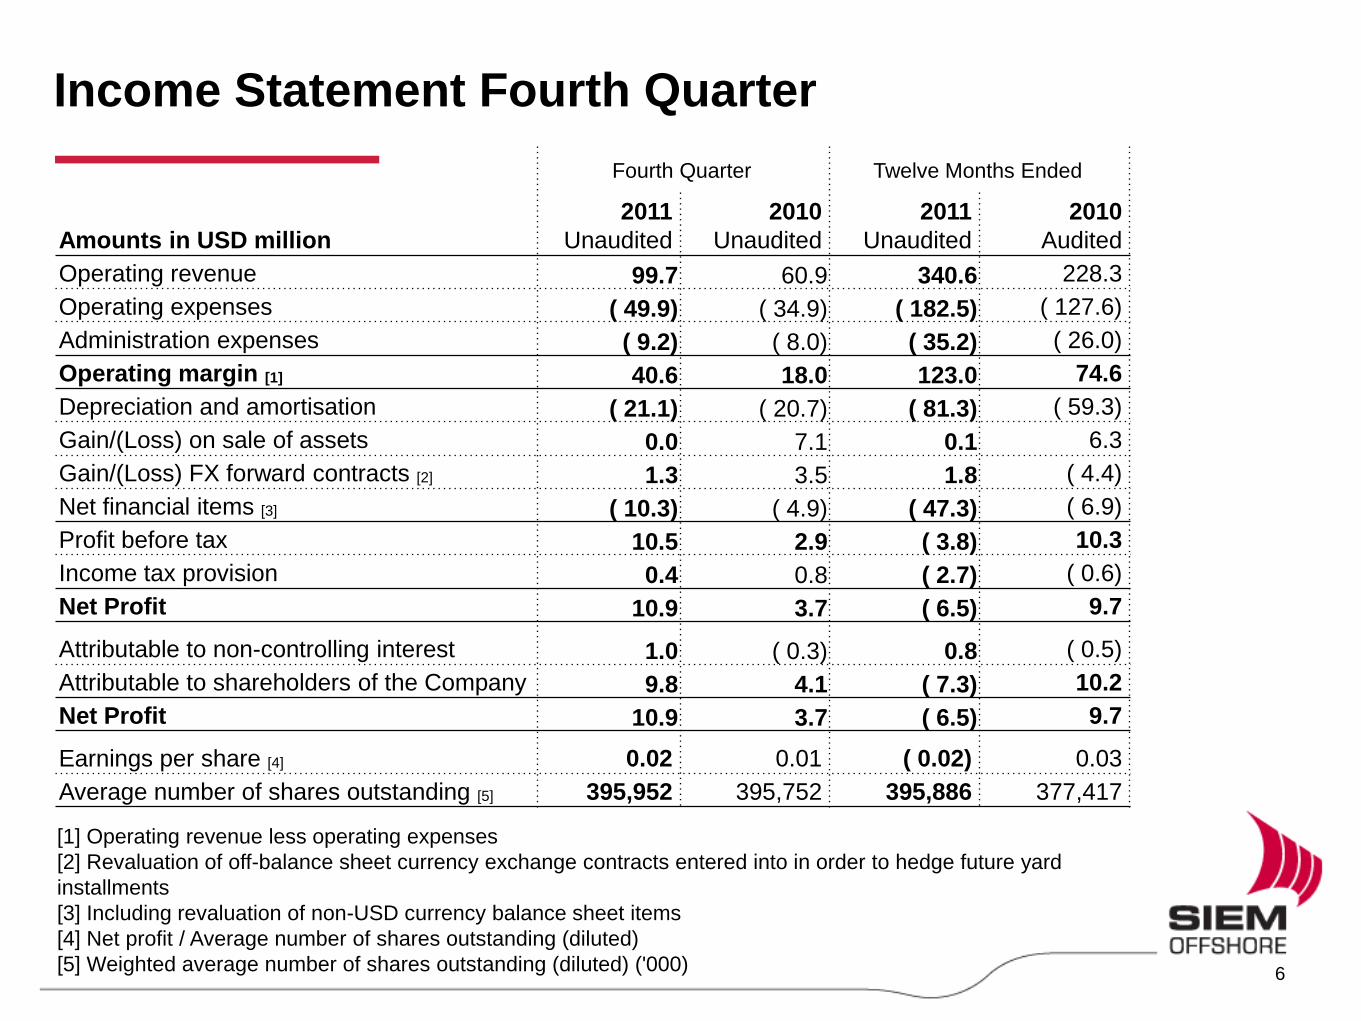
Income Statement Fourth Quarter
Fourth Quarter Twelve Months Ended
Amounts in USD million
2011
Unaudited
2010
Unaudited
2011
Unaudited
2010
Audited
Operating revenue 99.7 60.9 340.6 228.3
Operating expenses ( 49.9) ( 34.9) ( 182.5) ( 127.6)
Administration expenses ( 9.2) ( 8.0) ( 35.2) ( 26.0)
Operating margin [1] 40.6 18.0 123.0 74.6
Depreciation and amortisation ( 21.1) ( 20.7) ( 81.3) ( 59.3)
Gain/(Loss) on sale of assets 0.0 7.1 0.1 6.3
Gain/(Loss) FX forward contracts [2] 1.3 3.5 1.8 ( 4.4)
Net financial items [3] ( 10.3) ( 4.9) ( 47.3) ( 6.9)
Profit before tax 10.5 2.9 ( 3.8) 10.3
Income tax provision 0.4 0.8 ( 2.7) ( 0.6)
Net Profit 10.9 3.7 ( 6.5) 9.7
Attributable to non-controlling interest 1.0 ( 0.3) 0.8 ( 0.5)
Attributable to shareholders of the Company 9.8 4.1 ( 7.3) 10.2
Net Profit 10.9 3.7 ( 6.5) 9.7
Earnings per share [4] 0.02 0.01 ( 0.02) 0.03
Average number of shares outstanding [5] 395,952 395,752 395,886 377,417
[1] Operating revenue less operating expenses
[2] Revaluation of off-balance sheet currency exchange contracts entered into in order to hedge future yard
installments
[3] Including revaluation of non-USD currency balance sheet items
[4] Net profit / Average number of shares outstanding (diluted)
[5] Weighted average number of shares outstanding (diluted) ('000)
6
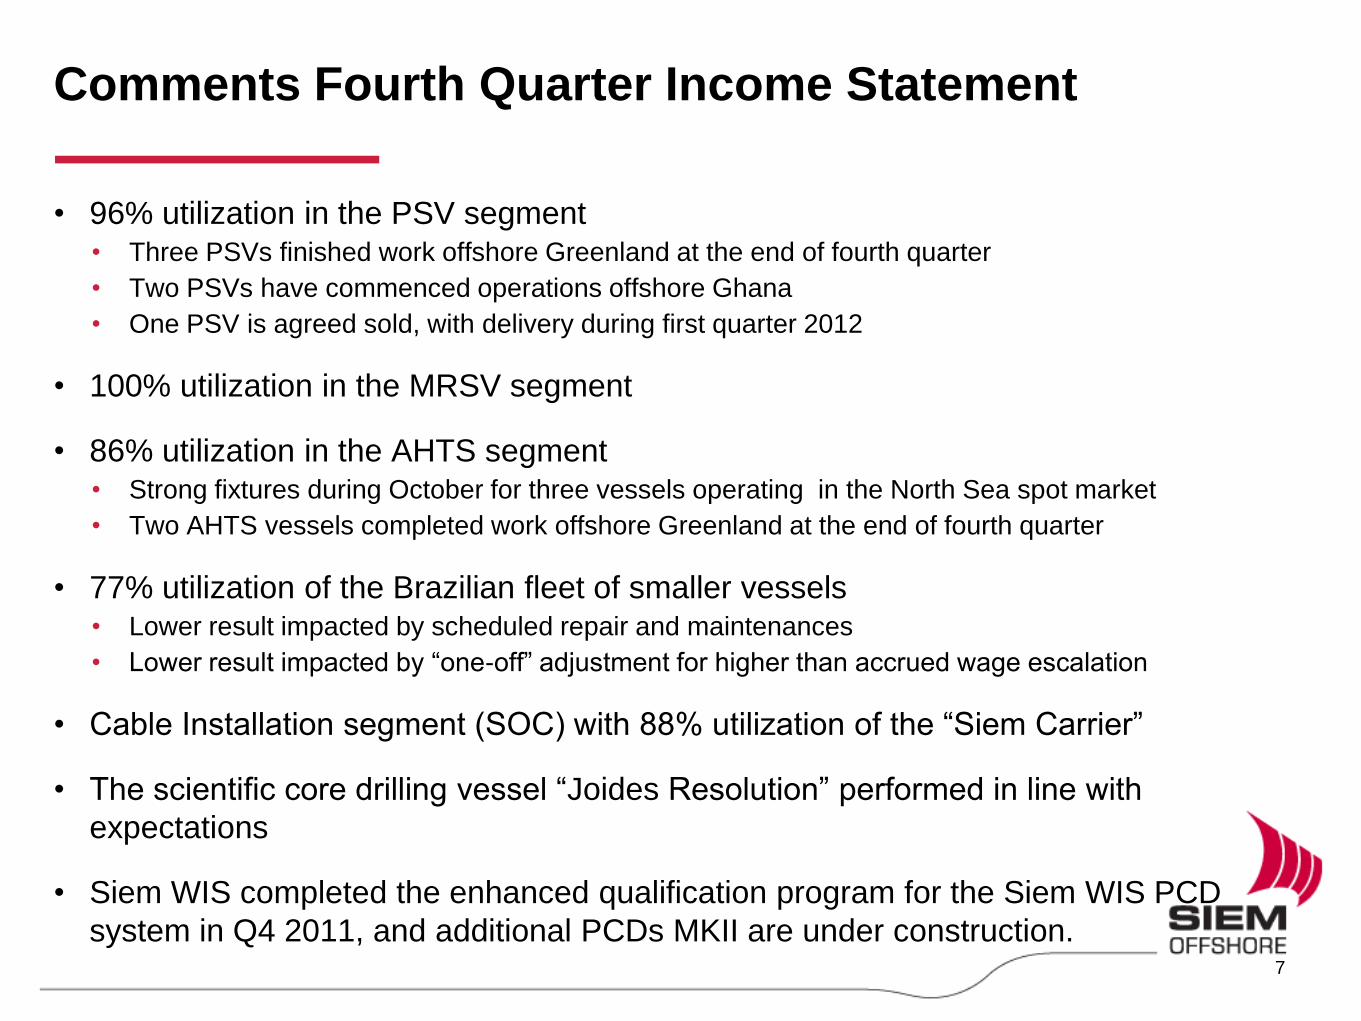
Comments Fourth Quarter Income Statement
• 96% utilization in the PSV segment • Three PSVs finished work offshore Greenland at the end of fourth quarter
• Two PSVs have commenced operations offshore Ghana
• One PSV is agreed sold, with delivery during first quarter 2012
• 100% utilization in the MRSV segment
• 86% utilization in the AHTS segment • Strong fixtures during October for three vessels operating in the North Sea spot market
• Two AHTS vessels completed work offshore Greenland at the end of fourth quarter
• 77% utilization of the Brazilian fleet of smaller vessels • Lower result impacted by scheduled repair and maintenances
• Lower result impacted by “one-off” adjustment for higher than accrued wage escalation
• Cable Installation segment (SOC) with 88% utilization of the “Siem Carrier”
• The scientific core drilling vessel “Joides Resolution” performed in line with
expectations
• Siem WIS completed the enhanced qualification program for the Siem WIS PCD
system in Q4 2011, and additional PCDs MKII are under construction.
7
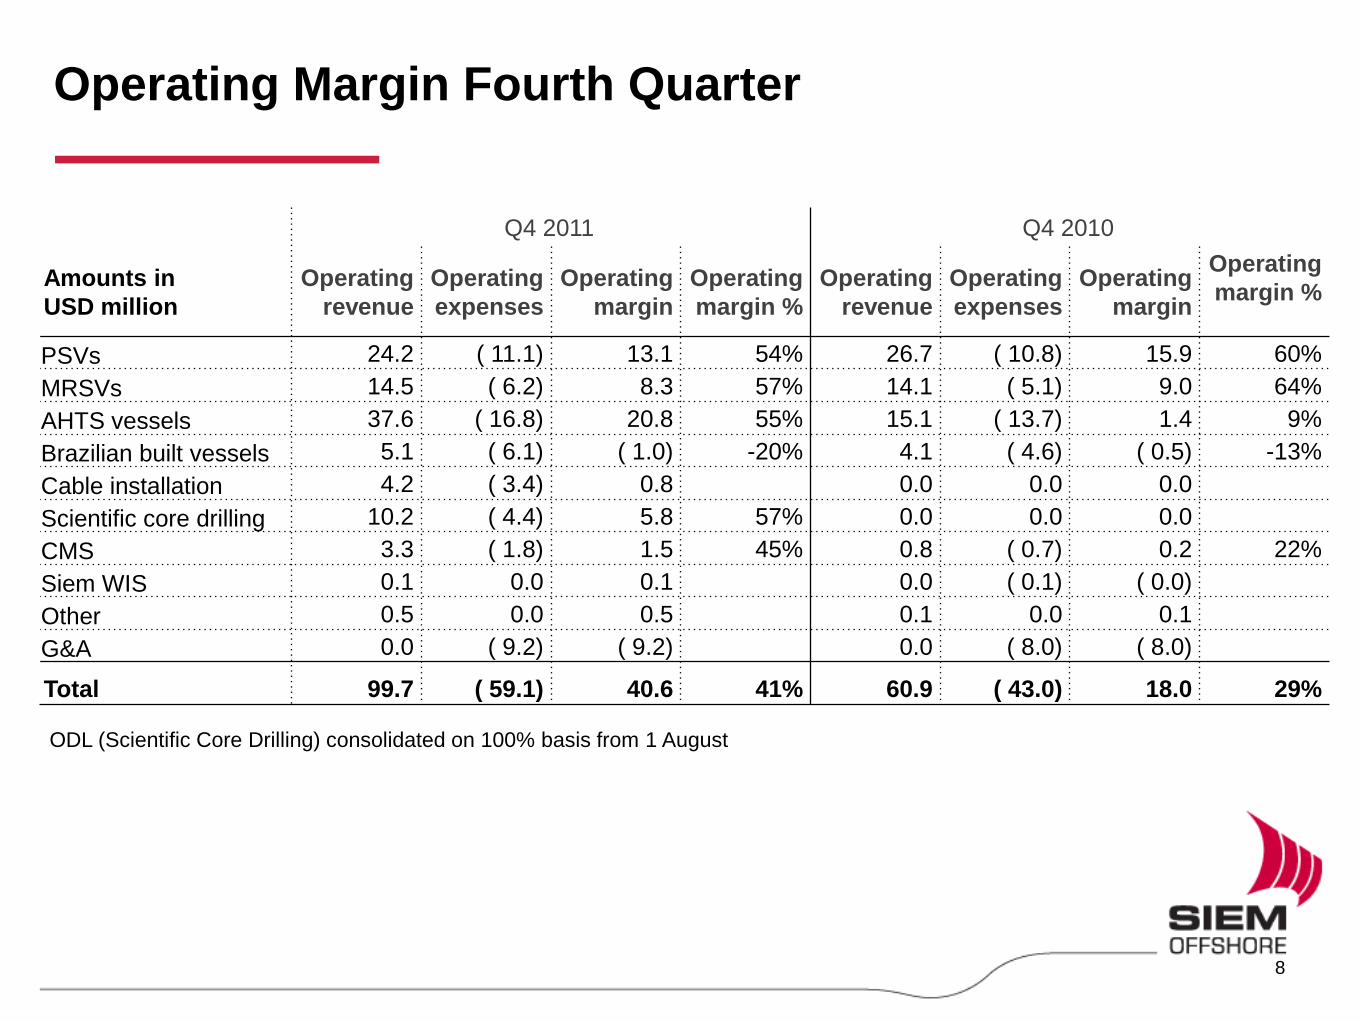
Operating Margin Fourth Quarter
Q4 2011 Q4 2010
Amounts in
USD million
Operating
revenue
Operating
expenses
Operating
margin
Operating
margin %
Operating
revenue
Operating
expenses
Operating
margin
Operating
margin %
PSVs 24.2 ( 11.1) 13.1 54% 26.7 ( 10.8) 15.9 60%
MRSVs 14.5 ( 6.2) 8.3 57% 14.1 ( 5.1) 9.0 64%
AHTS vessels 37.6 ( 16.8) 20.8 55% 15.1 ( 13.7) 1.4 9%
Brazilian built vessels 5.1 ( 6.1) ( 1.0) -20% 4.1 ( 4.6) ( 0.5) -13%
Cable installation 4.2 ( 3.4) 0.8 0.0 0.0 0.0
Scientific core drilling 10.2 ( 4.4) 5.8 57% 0.0 0.0 0.0
CMS 3.3 ( 1.8) 1.5 45% 0.8 ( 0.7) 0.2 22%
Siem WIS 0.1 0.0 0.1 0.0 ( 0.1) ( 0.0)
Other 0.5 0.0 0.5 0.1 0.0 0.1
G&A 0.0 ( 9.2) ( 9.2) 0.0 ( 8.0) ( 8.0)
Total 99.7 ( 59.1) 40.6 41% 60.9 ( 43.0) 18.0 29%
ODL (Scientific Core Drilling) consolidated on 100% basis from 1 August
8
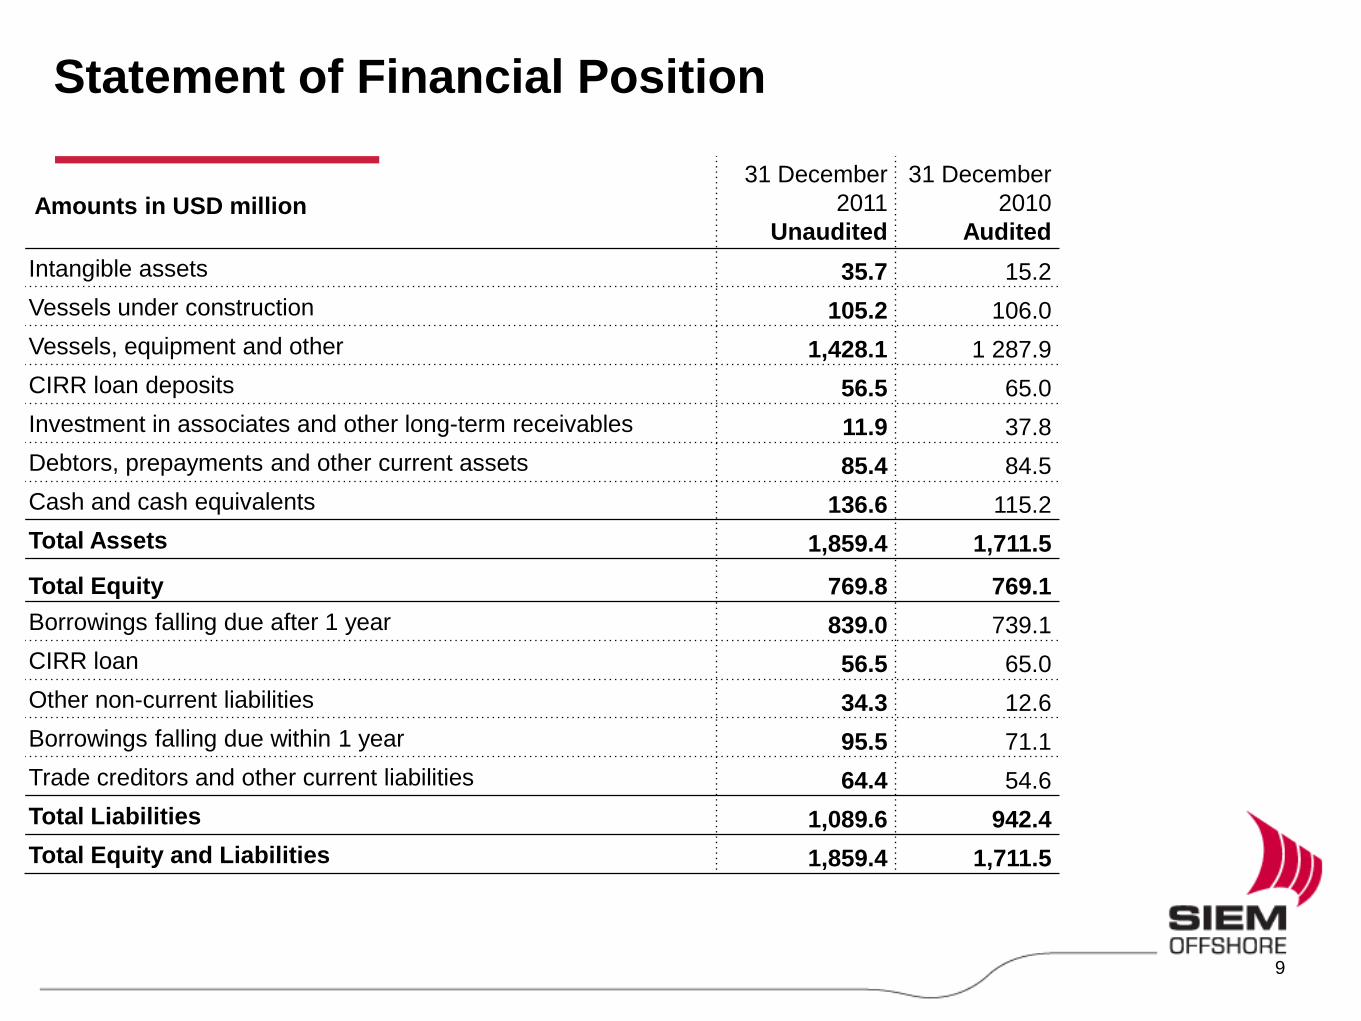
Statement of Financial Position
31 December
2011
Unaudited
31 December
2010
Audited
Intangible assets 35.7 15.2
Vessels under construction 105.2 106.0
Vessels, equipment and other 1,428.1 1 287.9
CIRR loan deposits 56.5 65.0
Investment in associates and other long-term receivables 11.9 37.8
Debtors, prepayments and other current assets 85.4 84.5
Cash and cash equivalents 136.6 115.2
Total Assets 1,859.4 1,711.5
Total Equity 769.8 769.1
Borrowings falling due after 1 year 839.0 739.1
CIRR loan 56.5 65.0
Other non-current liabilities 34.3 12.6
Borrowings falling due within 1 year 95.5 71.1
Trade creditors and other current liabilities 64.4 54.6
Total Liabilities 1,089.6 942.4
Total Equity and Liabilities 1,859.4 1,711.5
Amounts in USD million
9
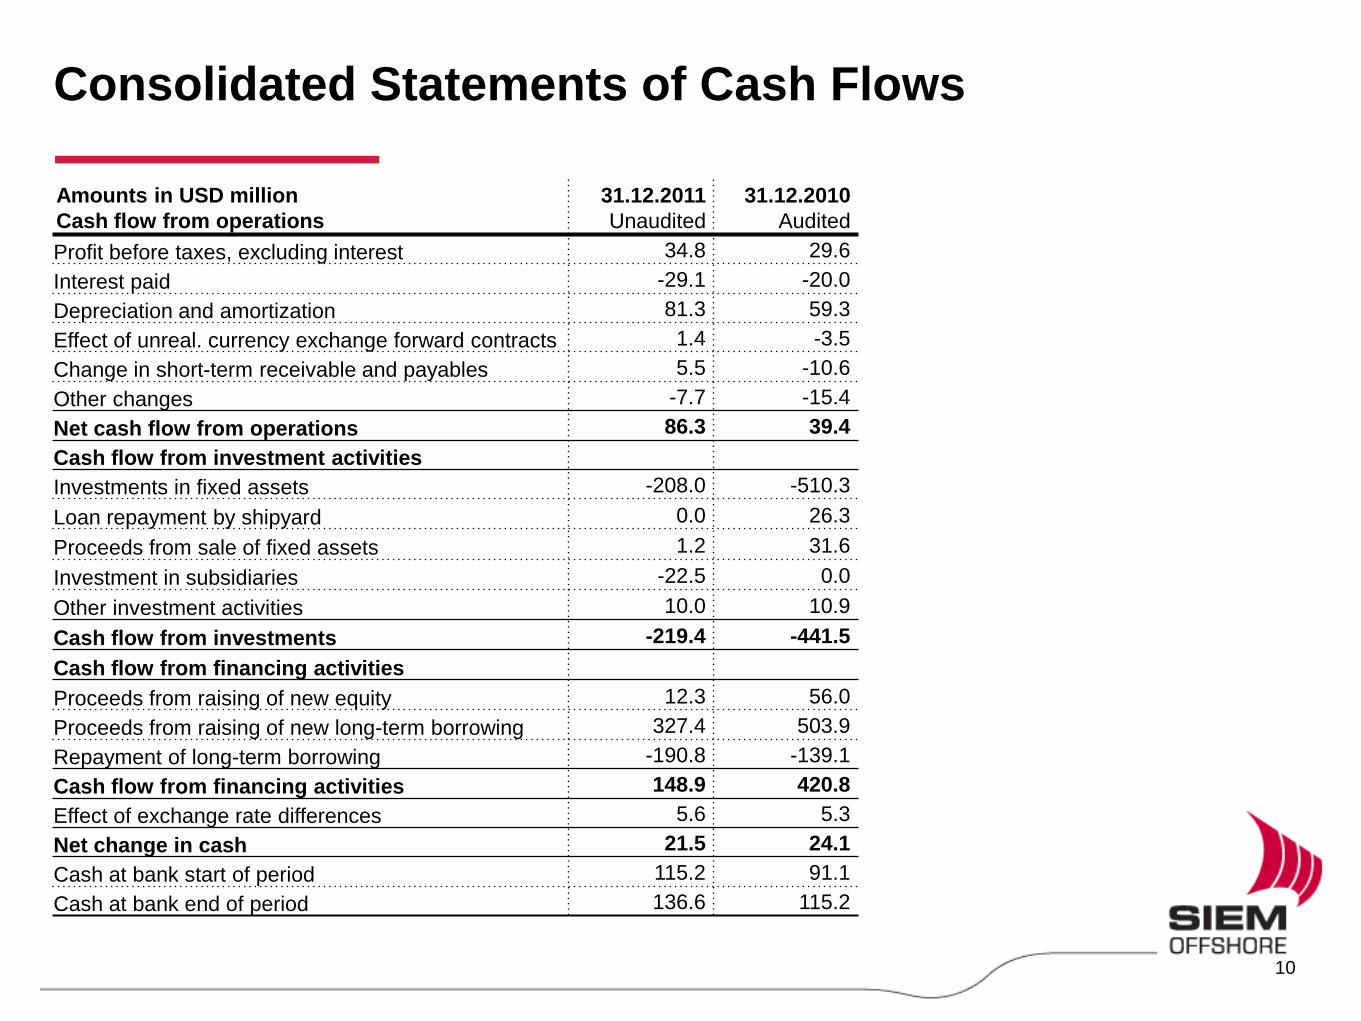
Consolidated Statements of Cash Flows
Amounts in USD million
Cash flow from operations
31.12.2011
Unaudited
31.12.2010
Audited
Profit before taxes, excluding interest 34.8 29.6
Interest paid -29.1 -20.0
Depreciation and amortization 81.3 59.3
Effect of unreal. currency exchange forward contracts 1.4 -3.5
Change in short-term receivable and payables 5.5 -10.6
Other changes -7.7 -15.4
Net cash flow from operations 86.3 39.4
Cash flow from investment activities
Investments in fixed assets -208.0 -510.3
Loan repayment by shipyard 0.0 26.3
Proceeds from sale of fixed assets 1.2 31.6
Investment in subsidiaries -22.5 0.0
Other investment activities 10.0 10.9
Cash flow from investments -219.4 -441.5
Cash flow from financing activities
Proceeds from raising of new equity 12.3 56.0
Proceeds from raising of new long-term borrowing 327.4 503.9
Repayment of long-term borrowing -190.8 -139.1
Cash flow from financing activities 148.9 420.8
Effect of exchange rate differences 5.6 5.3
Net change in cash 21.5 24.1
Cash at bank start of period 115.2 91.1
Cash at bank end of period 136.6 115.2
10
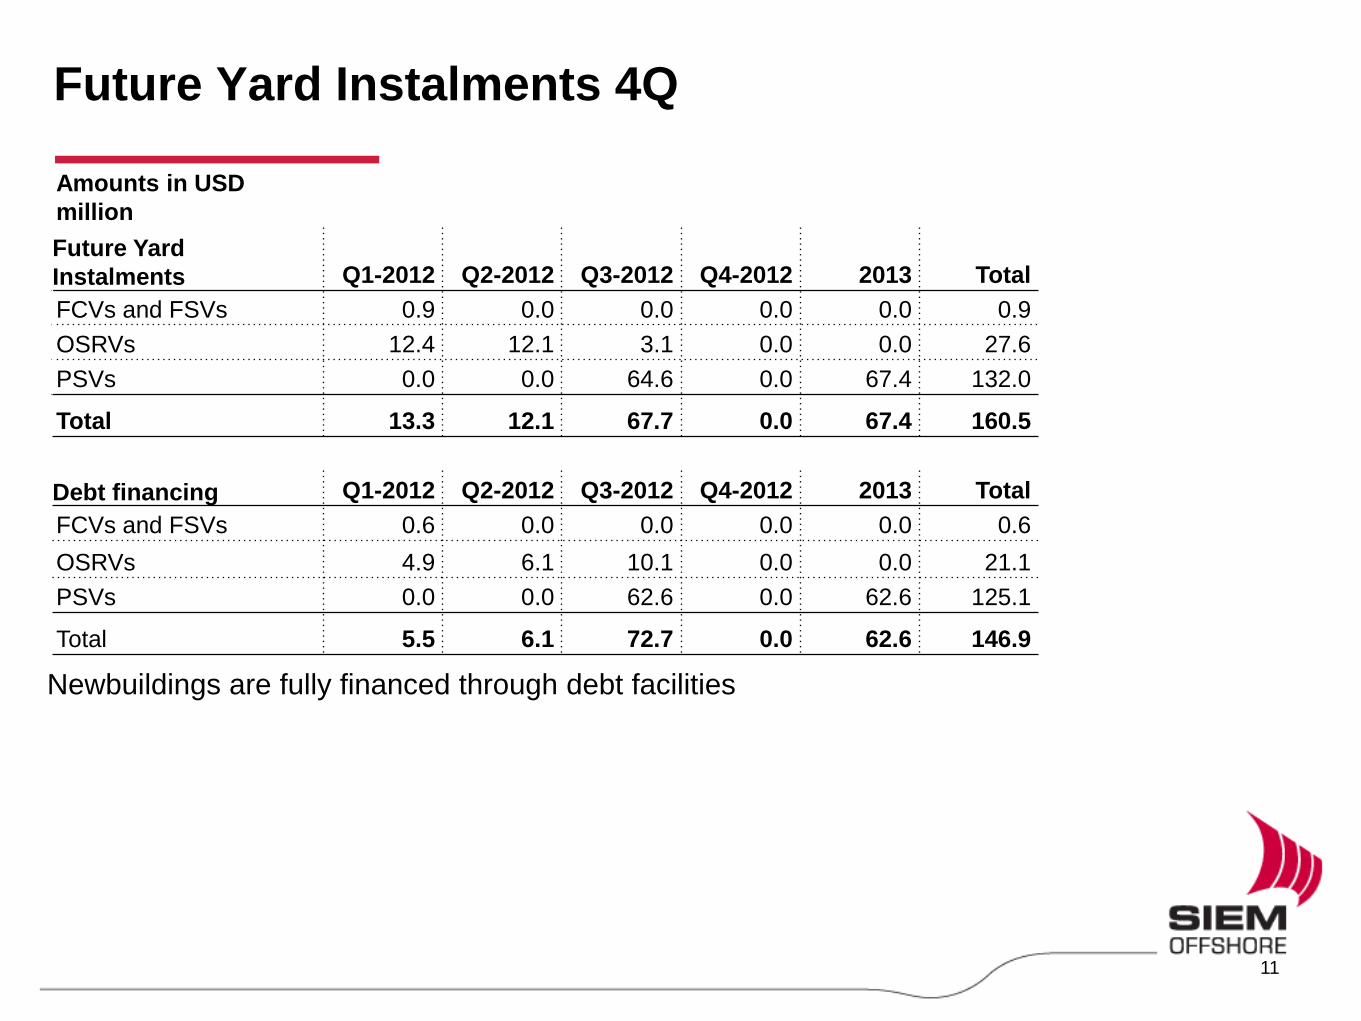
Future Yard Instalments 4Q
Amounts in USD
million
Future Yard
Instalments Q1-2012 Q2-2012 Q3-2012 Q4-2012 2013 Total
FCVs and FSVs 0.9 0.0 0.0 0.0 0.0 0.9
OSRVs 12.4 12.1 3.1 0.0 0.0 27.6
PSVs 0.0 0.0 64.6 0.0 67.4 132.0
Total 13.3 12.1 67.7 0.0 67.4 160.5
Debt financing Q1-2012 Q2-2012 Q3-2012 Q4-2012 2013 Total
FCVs and FSVs 0.6 0.0 0.0 0.0 0.0 0.6
OSRVs 4.9 6.1 10.1 0.0 0.0 21.1
PSVs 0.0 0.0 62.6 0.0 62.6 125.1
Total 5.5 6.1 72.7 0.0 62.6 146.9
Newbuildings are fully financed through debt facilities
11
Employment and Deliveries Vessels in Operation and Shipbuilding Contracts
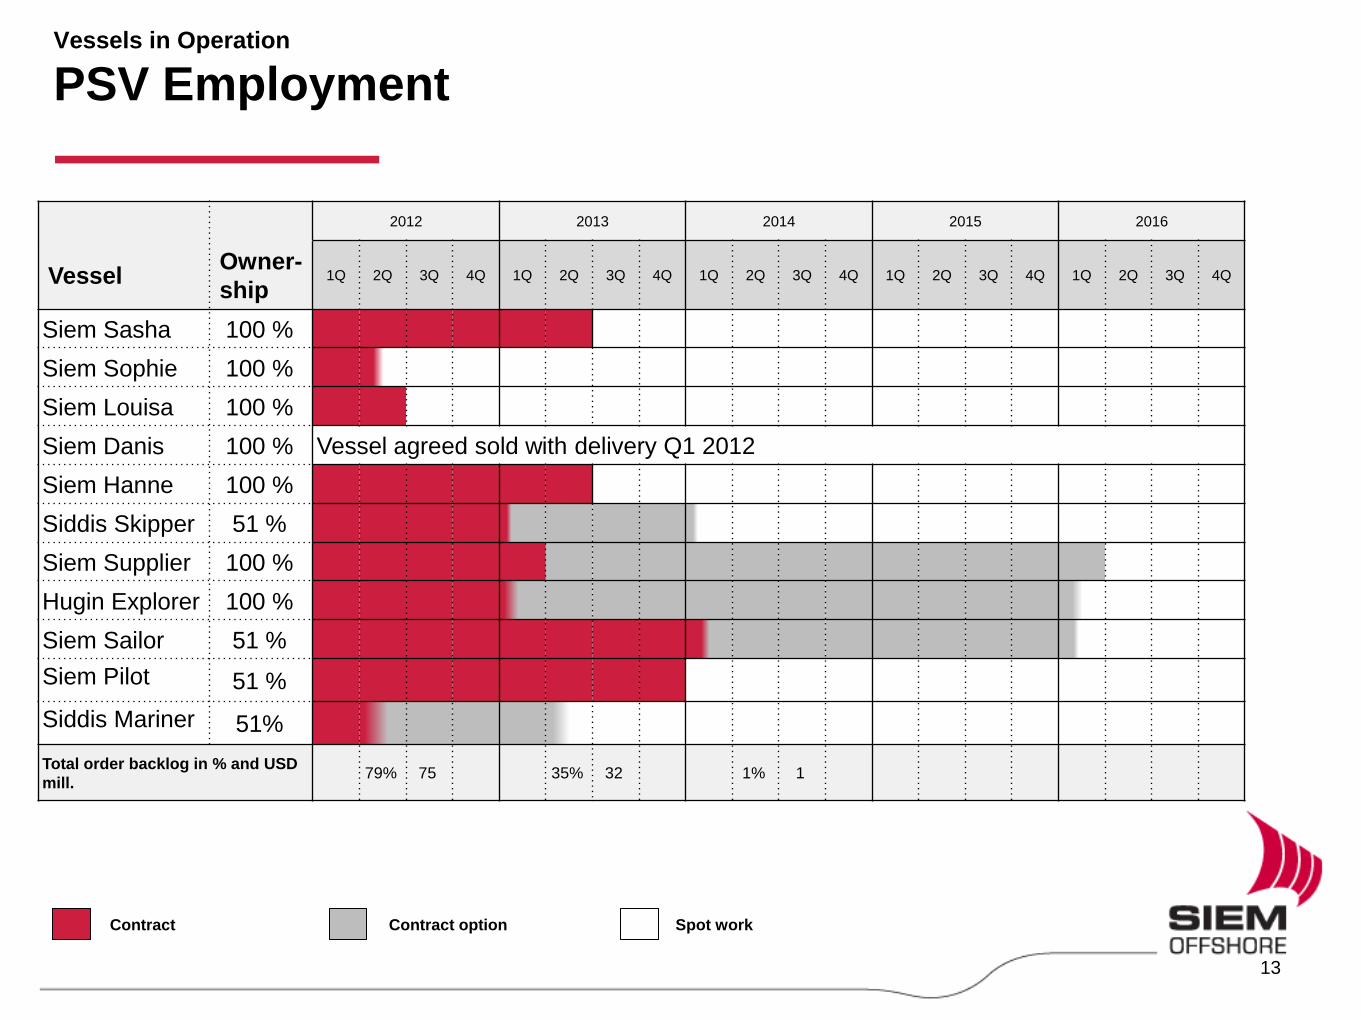
Vessels in Operation
PSV Employment
2012 2013 2014 2015 2016
Vessel Owner-
ship 1Q 2Q 3Q 4Q 1Q 2Q 3Q 4Q 1Q 2Q 3Q 4Q 1Q 2Q 3Q 4Q 1Q 2Q 3Q 4Q
Siem Sasha 100 %
Siem Sophie 100 %
Siem Louisa 100 %
Siem Danis 100 % Vessel agreed sold with delivery Q1 2012
Siem Hanne 100 %
Siddis Skipper 51 %
Siem Supplier 100 %
Hugin Explorer 100 %
Siem Sailor 51 %
Siem Pilot 51 %
Siddis Mariner 51%
Total order backlog in % and USD
mill. 79% 75 35% 32 1% 1
Contract Contract option Spot work
13
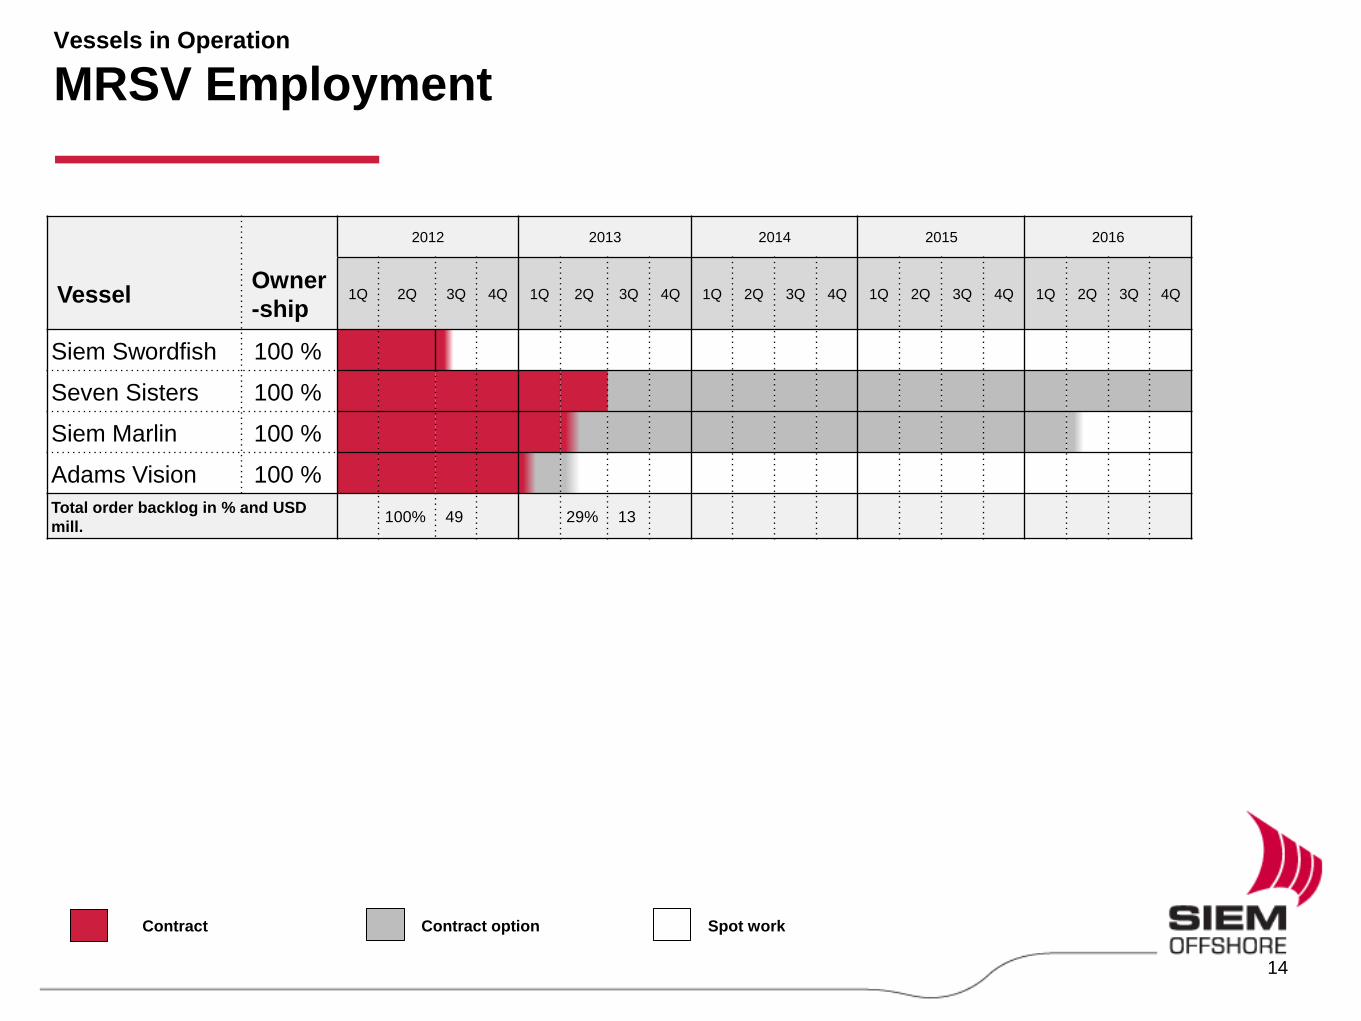
Vessels in Operation
MRSV Employment
2012 2013 2014 2015 2016
Vessel Owner
-ship 1Q 2Q 3Q 4Q 1Q 2Q 3Q 4Q 1Q 2Q 3Q 4Q 1Q 2Q 3Q 4Q 1Q 2Q 3Q 4Q
Siem Swordfish 100 %
Seven Sisters 100 %
Siem Marlin 100 %
Adams Vision 100 %
Total order backlog in % and USD
mill. 100% 49 29% 13
Contract Contract option Spot work
14
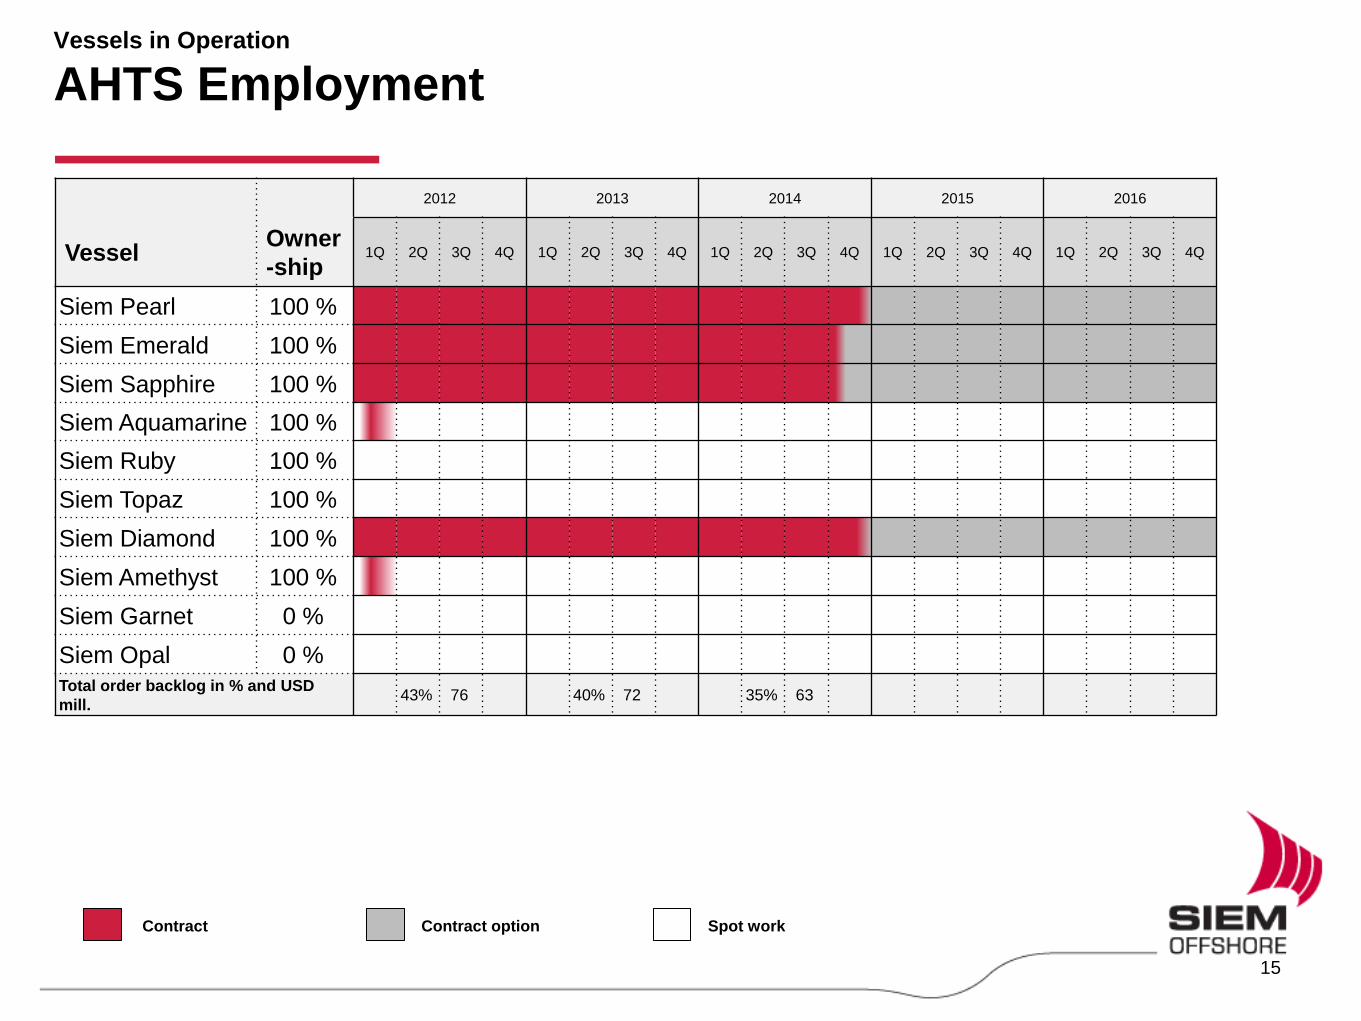
Vessels in Operation
AHTS Employment
2012 2013 2014 2015 2016
Vessel Owner
-ship 1Q 2Q 3Q 4Q 1Q 2Q 3Q 4Q 1Q 2Q 3Q 4Q 1Q 2Q 3Q 4Q 1Q 2Q 3Q 4Q
Siem Pearl 100 %
Siem Emerald 100 %
Siem Sapphire 100 %
Siem Aquamarine 100 %
Siem Ruby 100 %
Siem Topaz 100 %
Siem Diamond 100 %
Siem Amethyst 100 %
Siem Garnet 0 %
Siem Opal 0 % Total order backlog in % and USD
mill. 43% 76 40% 72 35% 63
Contract Contract option Spot work
15
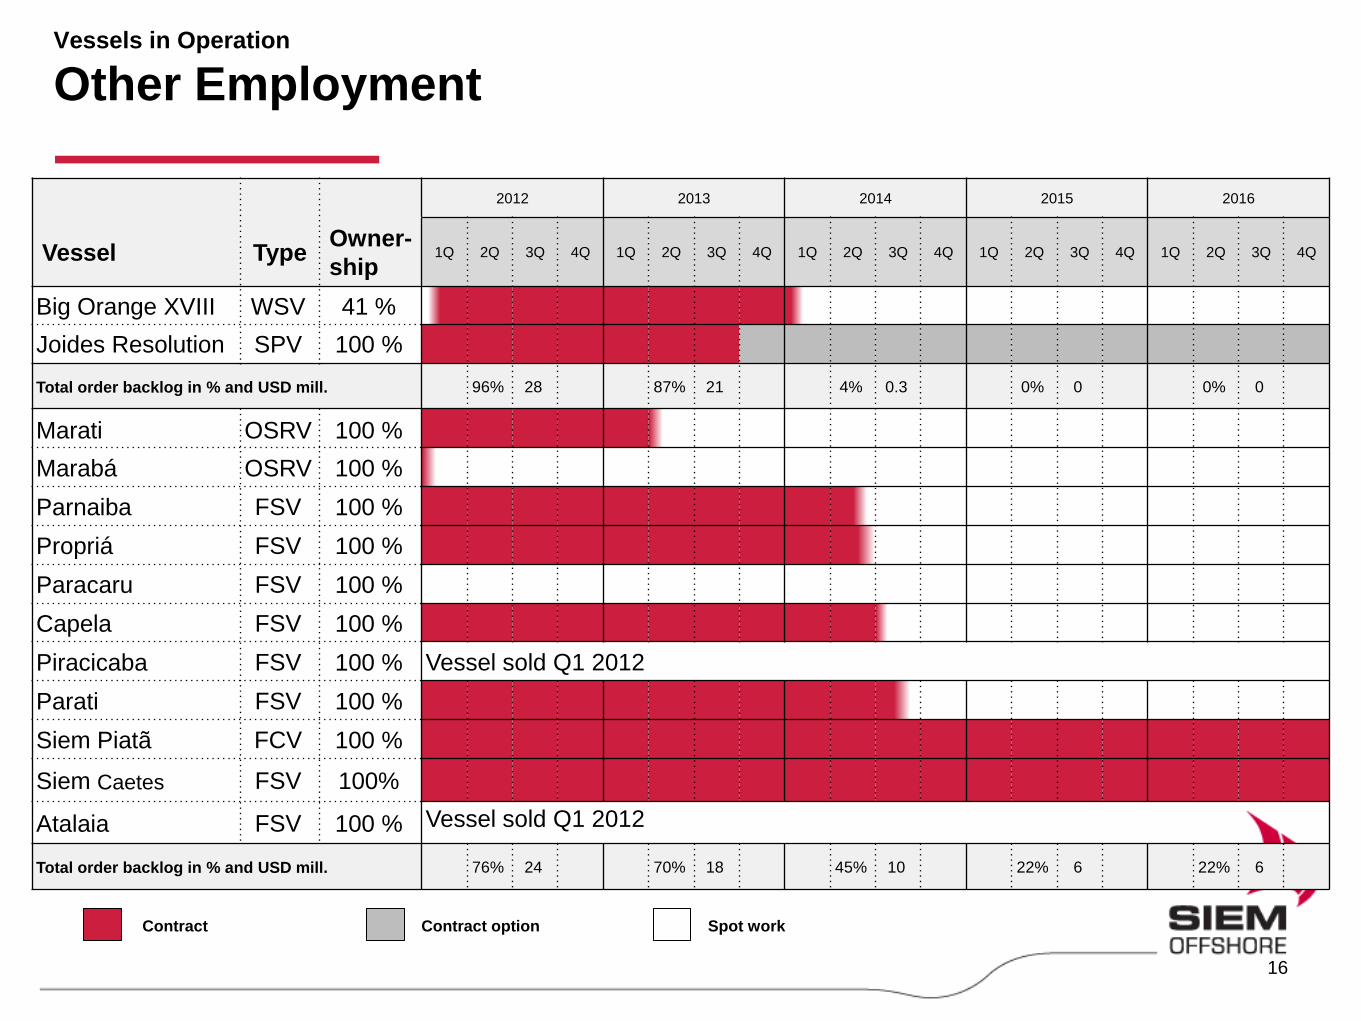
Vessels in Operation
Other Employment
2012 2013 2014 2015 2016
Vessel Type Owner-
ship 1Q 2Q 3Q 4Q 1Q 2Q 3Q 4Q 1Q 2Q 3Q 4Q 1Q 2Q 3Q 4Q 1Q 2Q 3Q 4Q
Big Orange XVIII WSV 41 %
Joides Resolution SPV 100 %
Total order backlog in % and USD mill. 96% 28 87% 21 4% 0.3 0% 0 0% 0
Marati OSRV 100 %
Marabá OSRV 100 %
Parnaiba FSV 100 %
Propriá FSV 100 %
Paracaru FSV 100 %
Capela FSV 100 %
Piracicaba FSV 100 % Vessel sold Q1 2012
Parati FSV 100 %
Siem Piatã FCV 100 %
Siem Caetes FSV 100%
Atalaia FSV 100 % Vessel sold Q1 2012
Total order backlog in % and USD mill. 76% 24 70% 18 45% 10 22% 6 22% 6
Contract Contract option Spot work
16
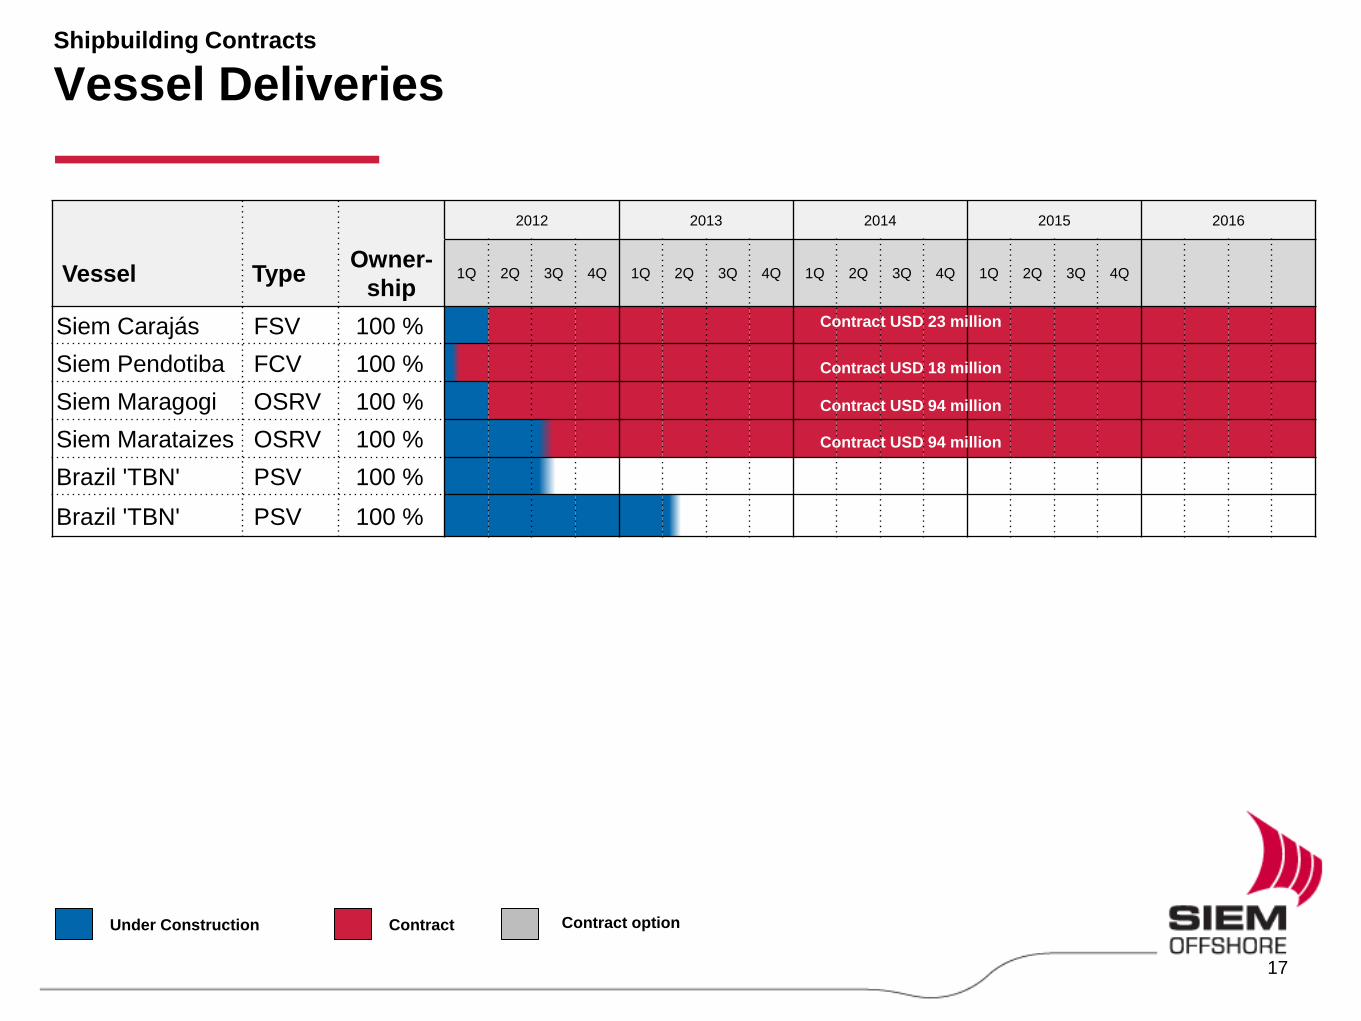
Shipbuilding Contracts
Vessel Deliveries
2012 2013 2014 2015 2016
Vessel Type Owner-
ship 1Q 2Q 3Q 4Q 1Q 2Q 3Q 4Q 1Q 2Q 3Q 4Q 1Q 2Q 3Q 4Q
Siem Carajás FSV 100 %
Siem Pendotiba FCV 100 %
Siem Maragogi OSRV 100 %
Siem Marataizes OSRV 100 %
Brazil 'TBN' PSV 100 %
Brazil 'TBN' PSV 100 %
Under Construction Contract
Contract USD 23 million
Contract USD 18 million
Contract USD 94 million
Contract USD 94 million
Contract USD 94 million
Contract USD 94 million
Contract option
17

Market Outlook
Market Outlook Summary
• North Sea summer season looks promising:
• Stable/decreasing AHTS fleet
• Increased rig activity: UK up seasonally from late Q1, and several rigs entering
Norway during 2012
• PSV segment somewhat more uncertain - 30 vessels to be delivered from yards in
the region in 2012
• Global Demand continue to increase:
• Brazil continues to be strong based on firm contracts for Rigs, FPSO and Subsea
• US GoM and West Africa turning up, especially on PSVs
• Some prospects in Mediterranean and parts of Asia/Australia in AHTS segment
• Prospects for remote and harsh areas (Barents Sea, Greenland, Santos Basin
Brazil)
• Still some uncertainty with regards to the relatively large number of OSV newbuilds to
be delivered in certain segments, especially PSVs, and how it will impact the market
in 2012-13
19
Global Rig and FPSO Market
© Siem Offshore, ODS Petrodata
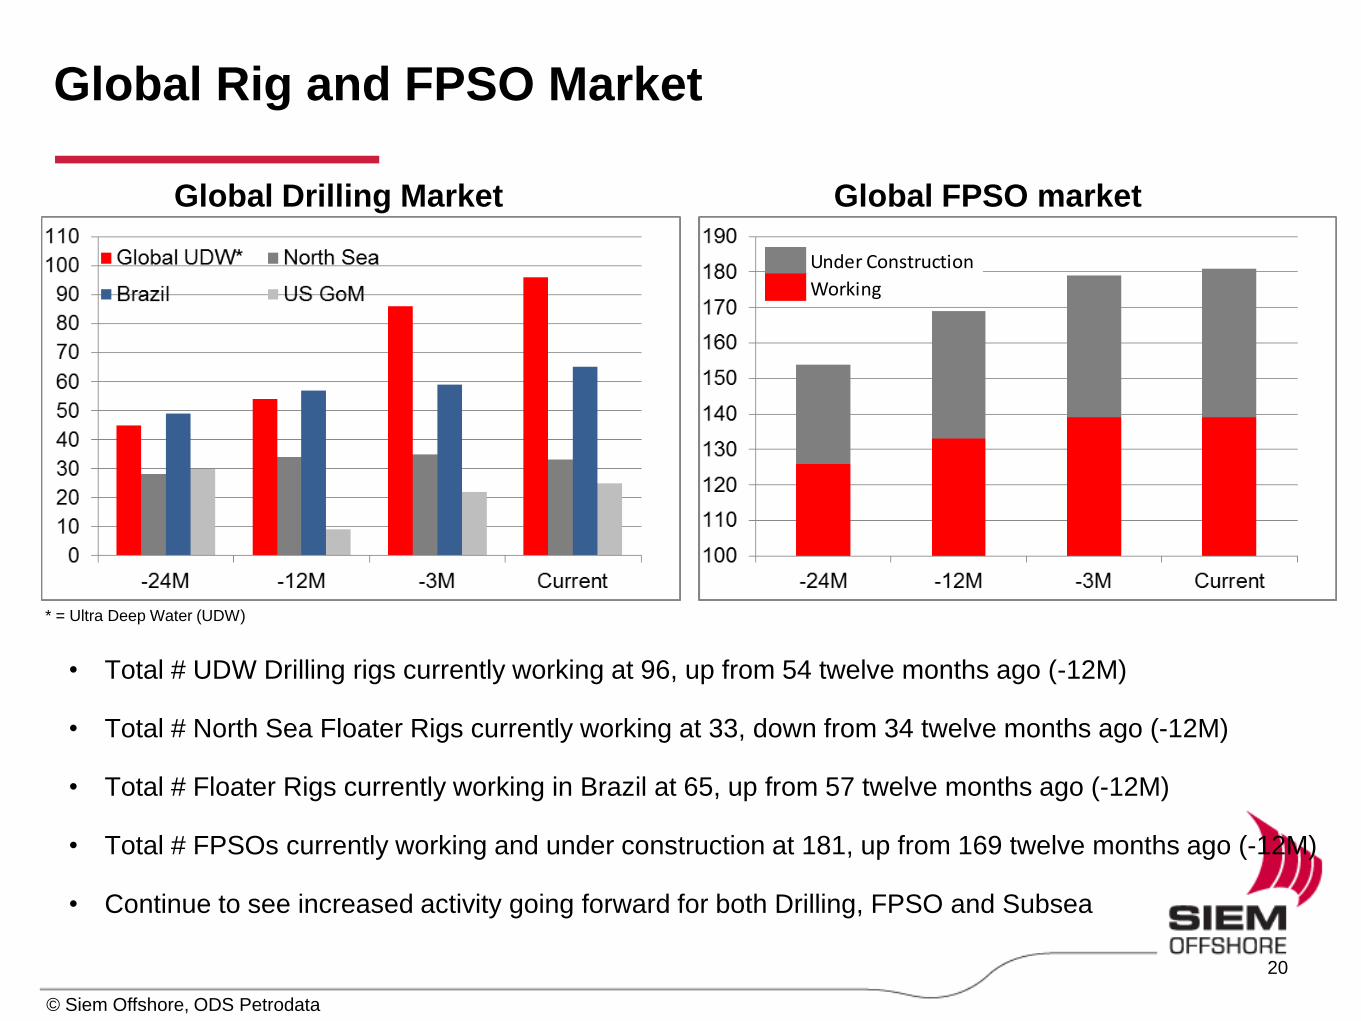
• Total # UDW Drilling rigs currently working at 96, up from 54 twelve months ago (-12M)
• Total # North Sea Floater Rigs currently working at 33, down from 34 twelve months ago (-12M)
• Total # Floater Rigs currently working in Brazil at 65, up from 57 twelve months ago (-12M)
• Total # FPSOs currently working and under construction at 181, up from 169 twelve months ago (-12M)
• Continue to see increased activity going forward for both Drilling, FPSO and Subsea
Global Drilling Market Global FPSO market
* = Ultra Deep Water (UDW)
Under Construction
Working
20
Rig market Y/Y change
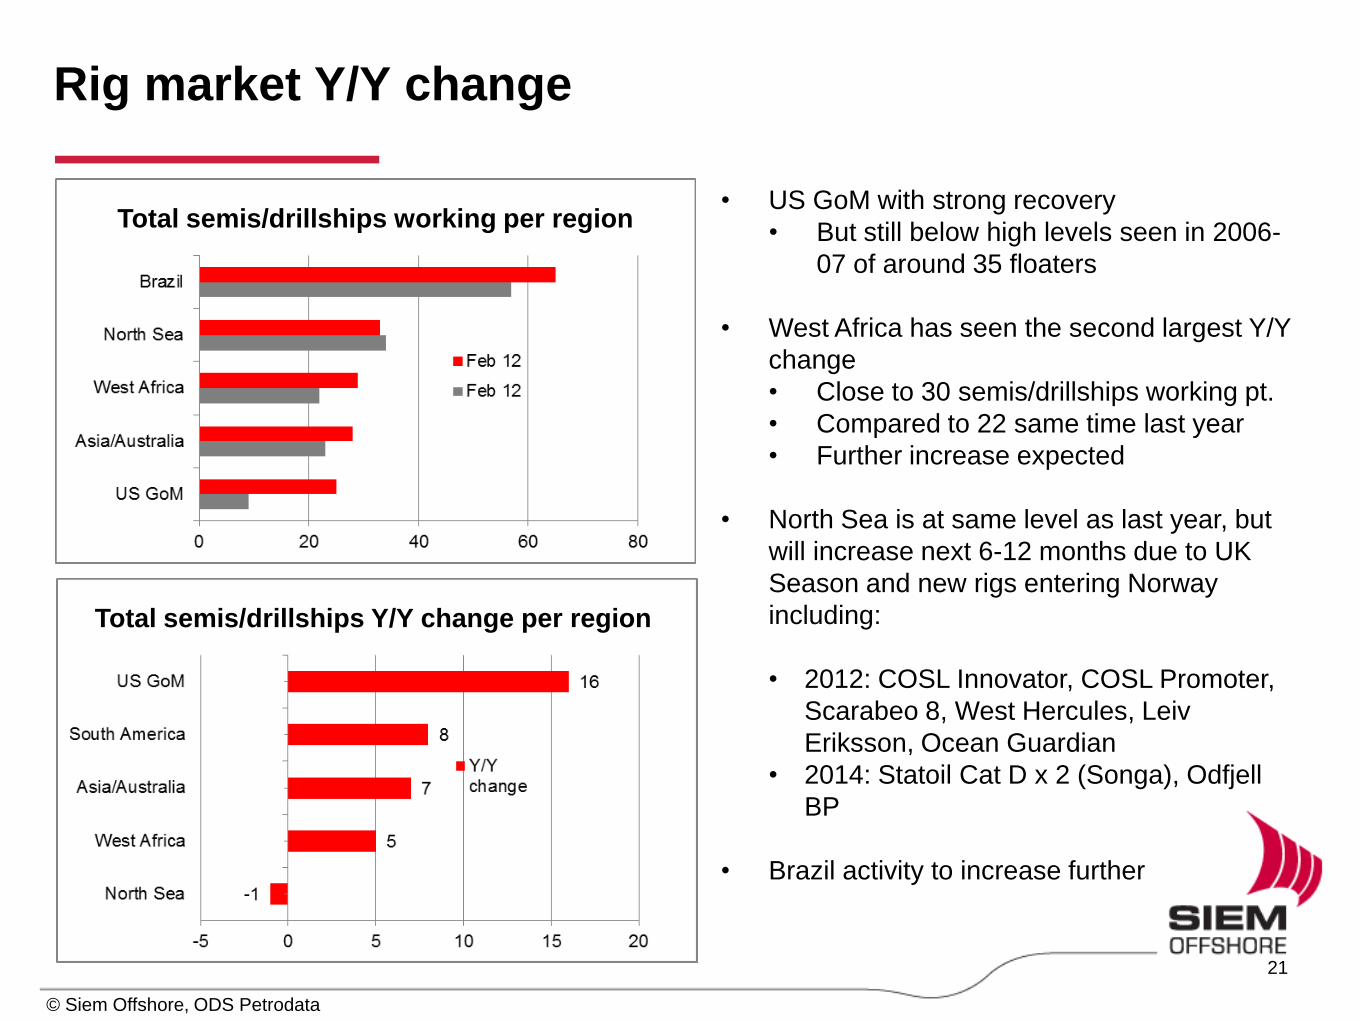
Total semis/drillships working per region
Total semis/drillships Y/Y change per region
• US GoM with strong recovery
• But still below high levels seen in 2006-
07 of around 35 floaters
• West Africa has seen the second largest Y/Y
change
• Close to 30 semis/drillships working pt.
• Compared to 22 same time last year
• Further increase expected
• North Sea is at same level as last year, but
will increase next 6-12 months due to UK
Season and new rigs entering Norway
including:
• 2012: COSL Innovator, COSL Promoter,
Scarabeo 8, West Hercules, Leiv
Eriksson, Ocean Guardian
• 2014: Statoil Cat D x 2 (Songa), Odfjell
BP
• Brazil activity to increase further
21
© Siem Offshore, ODS Petrodata
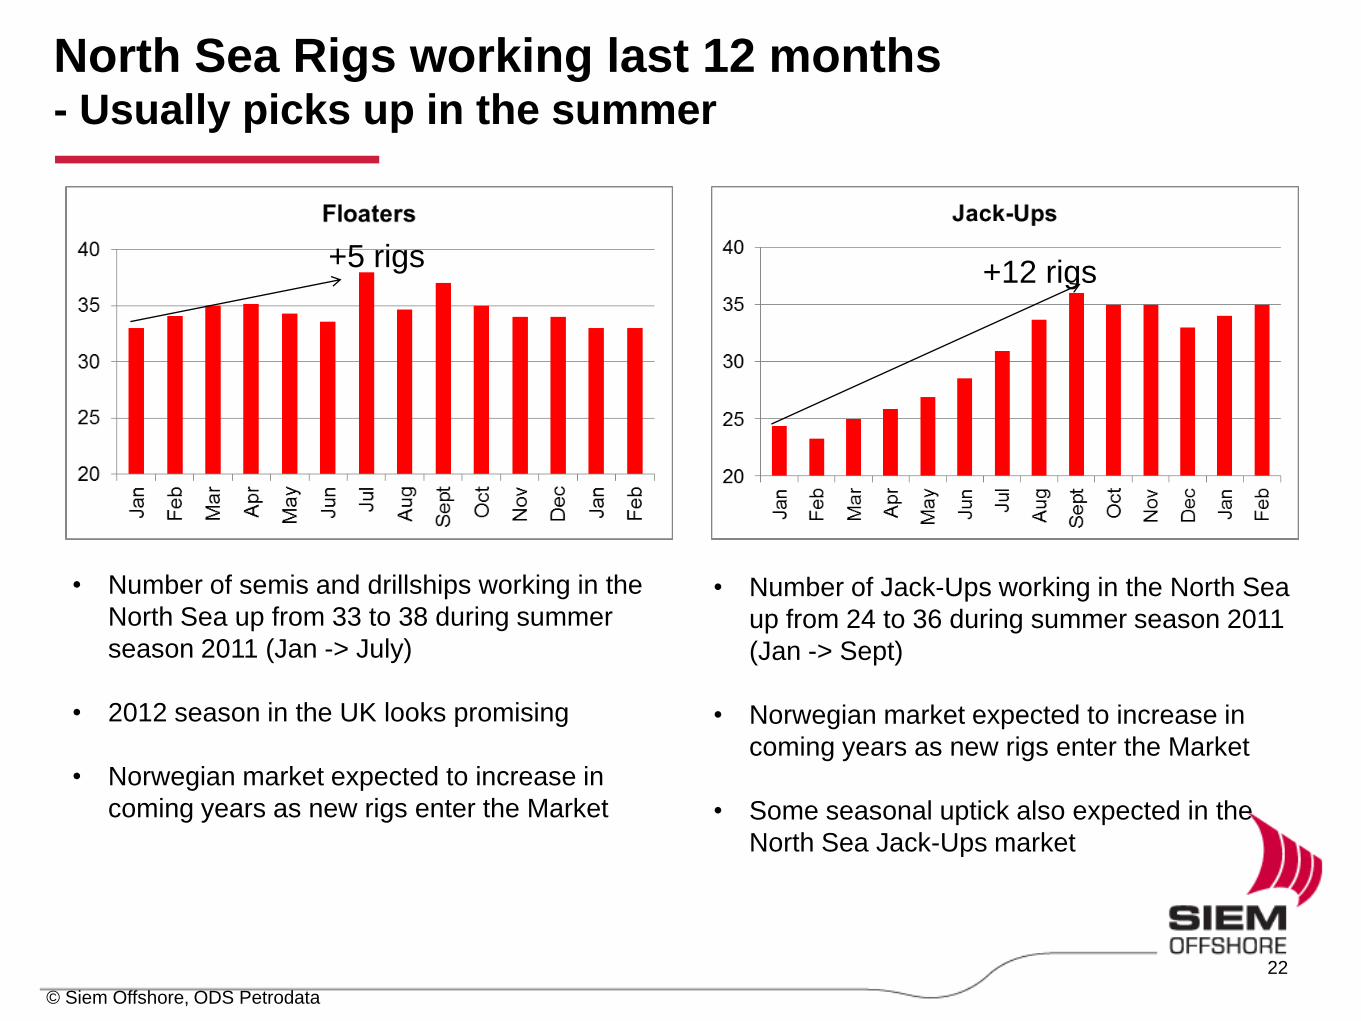
• Number of semis and drillships working in the
North Sea up from 33 to 38 during summer
season 2011 (Jan -> July)
• 2012 season in the UK looks promising
• Norwegian market expected to increase in
coming years as new rigs enter the Market
+5 rigs +12 rigs
• Number of Jack-Ups working in the North Sea
up from 24 to 36 during summer season 2011
(Jan -> Sept)
• Norwegian market expected to increase in
coming years as new rigs enter the Market
• Some seasonal uptick also expected in the
North Sea Jack-Ups market
© Siem Offshore, ODS Petrodata
North Sea Rigs working last 12 months - Usually picks up in the summer
22
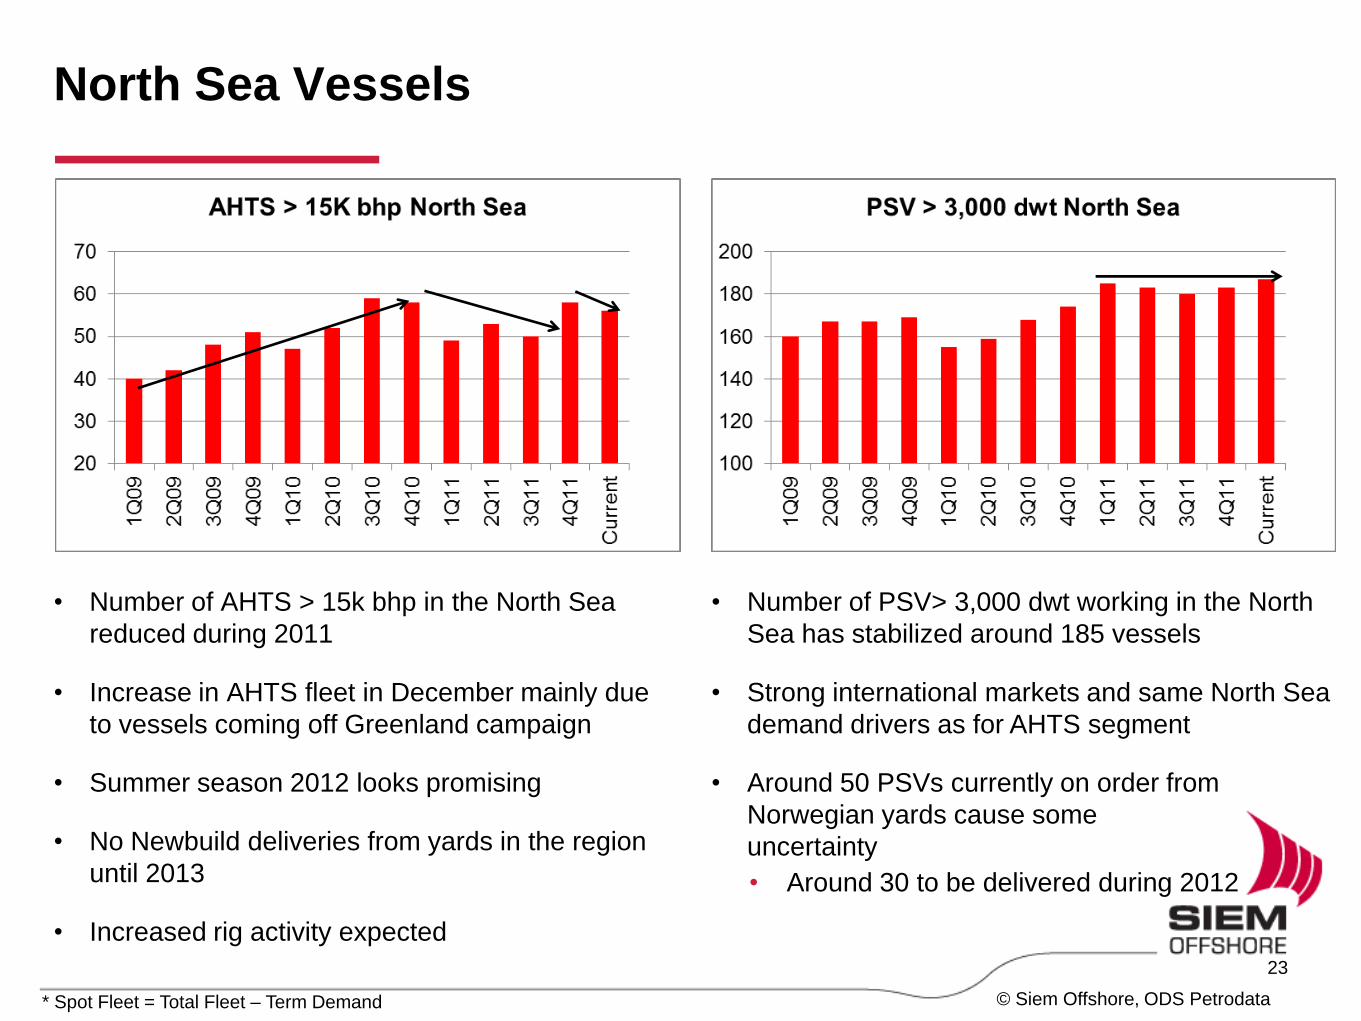
North Sea Vessels
© Siem Offshore, ODS Petrodata
• Number of AHTS > 15k bhp in the North Sea
reduced during 2011
• Increase in AHTS fleet in December mainly due
to vessels coming off Greenland campaign
• Summer season 2012 looks promising
• No Newbuild deliveries from yards in the region
until 2013
• Increased rig activity expected
* Spot Fleet = Total Fleet – Term Demand
• Number of PSV> 3,000 dwt working in the North
Sea has stabilized around 185 vessels
• Strong international markets and same North Sea
demand drivers as for AHTS segment
• Around 50 PSVs currently on order from
Norwegian yards cause some
uncertainty
• Around 30 to be delivered during 2012
23
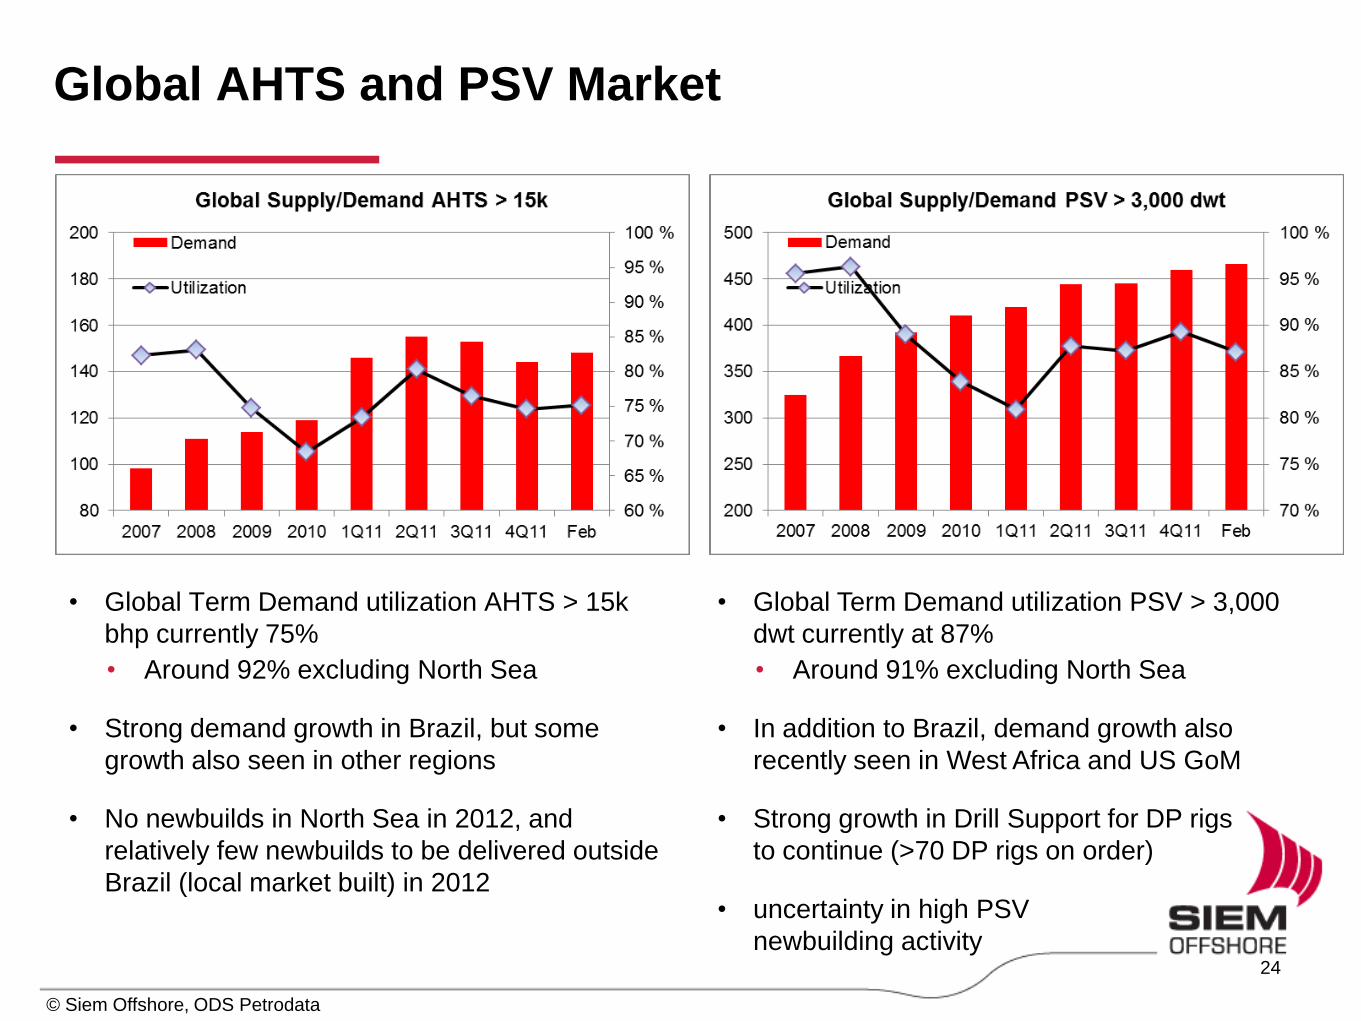
Global AHTS and PSV Market
© Siem Offshore, ODS Petrodata
• Global Term Demand utilization AHTS > 15k
bhp currently 75%
• Around 92% excluding North Sea
• Strong demand growth in Brazil, but some
growth also seen in other regions
• No newbuilds in North Sea in 2012, and
relatively few newbuilds to be delivered outside
Brazil (local market built) in 2012
• Global Term Demand utilization PSV > 3,000
dwt currently at 87%
• Around 91% excluding North Sea
• In addition to Brazil, demand growth also
recently seen in West Africa and US GoM
• Strong growth in Drill Support for DP rigs
to continue (>70 DP rigs on order)
• uncertainty in high PSV
newbuilding activity
24

Appendix
25
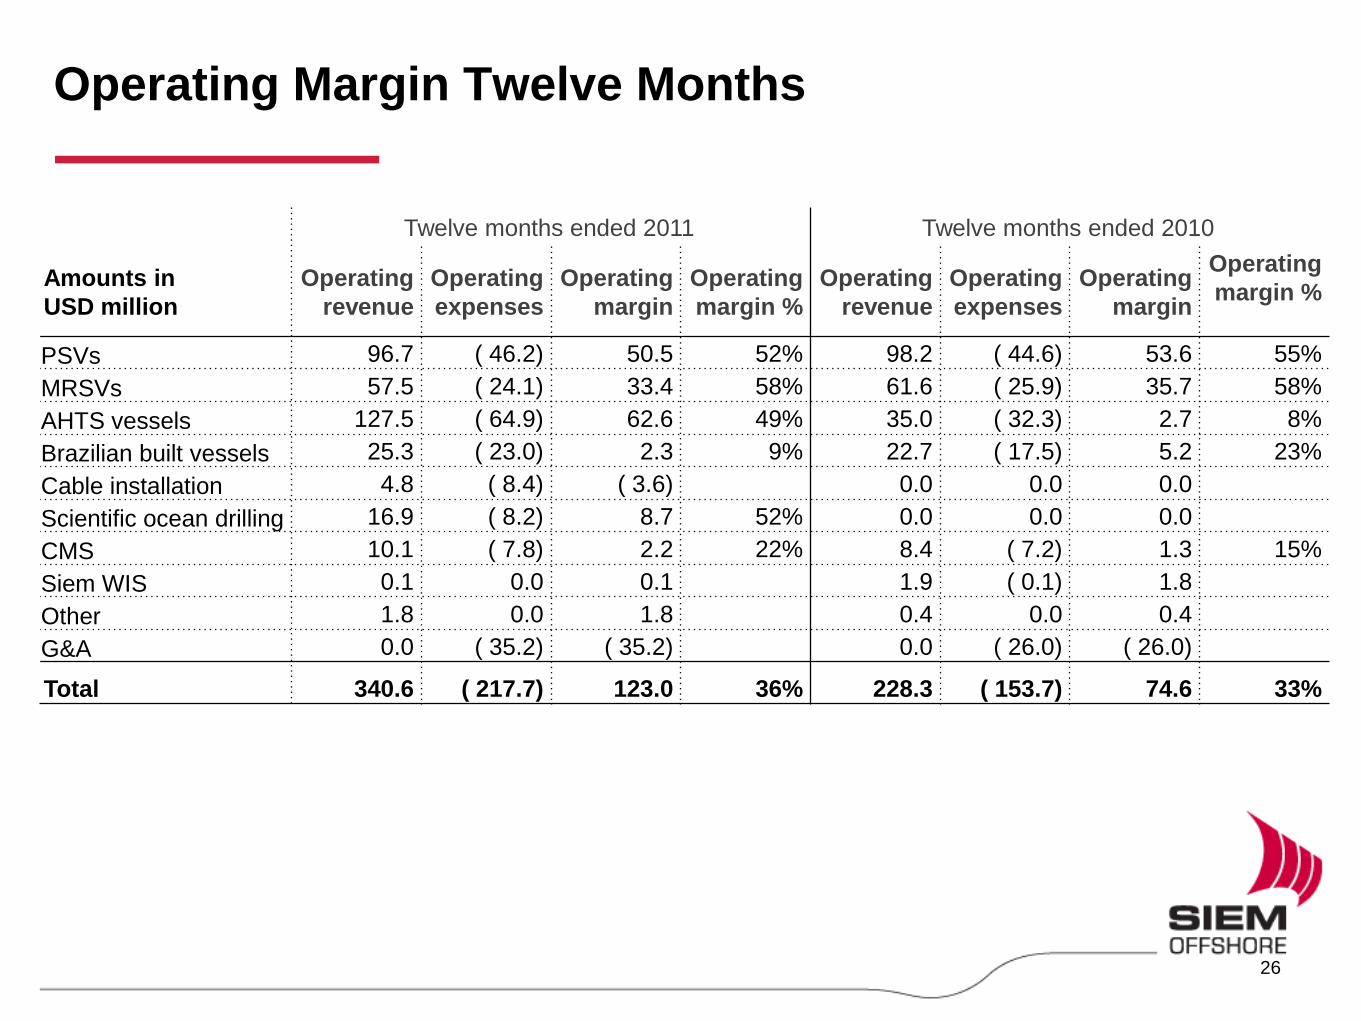
Operating Margin Twelve Months
Twelve months ended 2011 Twelve months ended 2010
Amounts in
USD million
Operating
revenue
Operating
expenses
Operating
margin
Operating
margin %
Operating
revenue
Operating
expenses
Operating
margin
Operating
margin %
PSVs 96.7 ( 46.2) 50.5 52% 98.2 ( 44.6) 53.6 55%
MRSVs 57.5 ( 24.1) 33.4 58% 61.6 ( 25.9) 35.7 58%
AHTS vessels 127.5 ( 64.9) 62.6 49% 35.0 ( 32.3) 2.7 8%
Brazilian built vessels 25.3 ( 23.0) 2.3 9% 22.7 ( 17.5) 5.2 23%
Cable installation 4.8 ( 8.4) ( 3.6) 0.0 0.0 0.0
Scientific ocean drilling 16.9 ( 8.2) 8.7 52% 0.0 0.0 0.0
CMS 10.1 ( 7.8) 2.2 22% 8.4 ( 7.2) 1.3 15%
Siem WIS 0.1 0.0 0.1 1.9 ( 0.1) 1.8
Other 1.8 0.0 1.8 0.4 0.0 0.4
G&A 0.0 ( 35.2) ( 35.2) 0.0 ( 26.0) ( 26.0)
Total 340.6 ( 217.7) 123.0 36% 228.3 ( 153.7) 74.6 33%
26
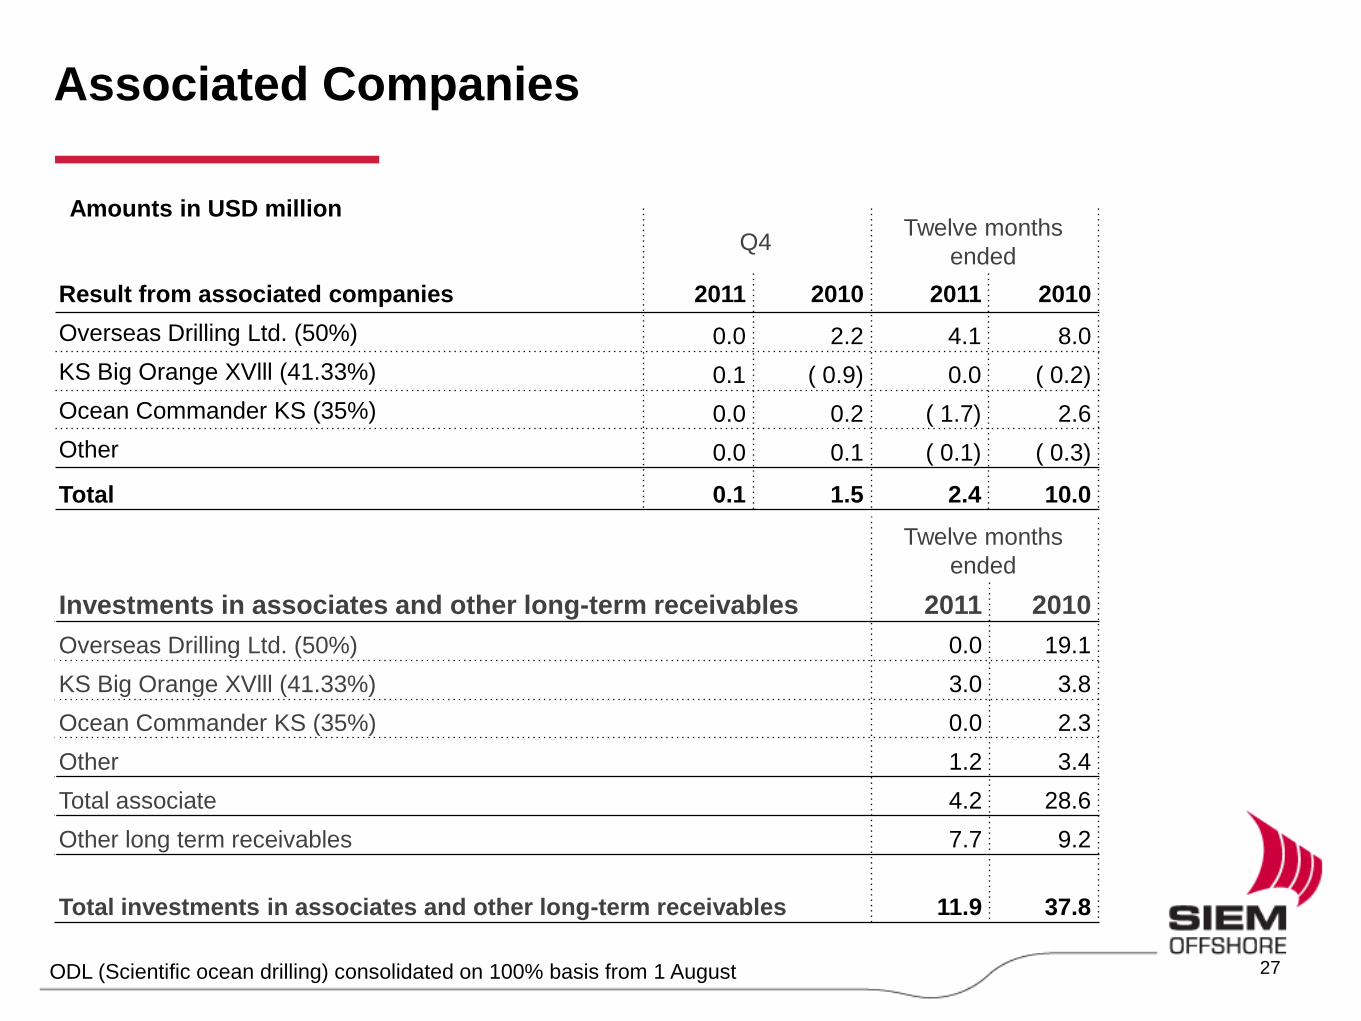
Associated Companies
Q4 Twelve months
ended
Result from associated companies 2011 2010 2011 2010
Overseas Drilling Ltd. (50%) 0.0 2.2 4.1 8.0
KS Big Orange XVlll (41.33%) 0.1 ( 0.9) 0.0 ( 0.2)
Ocean Commander KS (35%) 0.0 0.2 ( 1.7) 2.6
Other 0.0 0.1 ( 0.1) ( 0.3)
Total 0.1 1.5 2.4 10.0
Amounts in USD million
Twelve months
ended
Investments in associates and other long-term receivables 2011 2010
Overseas Drilling Ltd. (50%) 0.0 19.1
KS Big Orange XVlll (41.33%) 3.0 3.8
Ocean Commander KS (35%) 0.0 2.3
Other 1.2 3.4
Total associate 4.2 28.6
Other long term receivables 7.7 9.2
Total investments in associates and other long-term receivables 11.9 37.8
ODL (Scientific ocean drilling) consolidated on 100% basis from 1 August
27
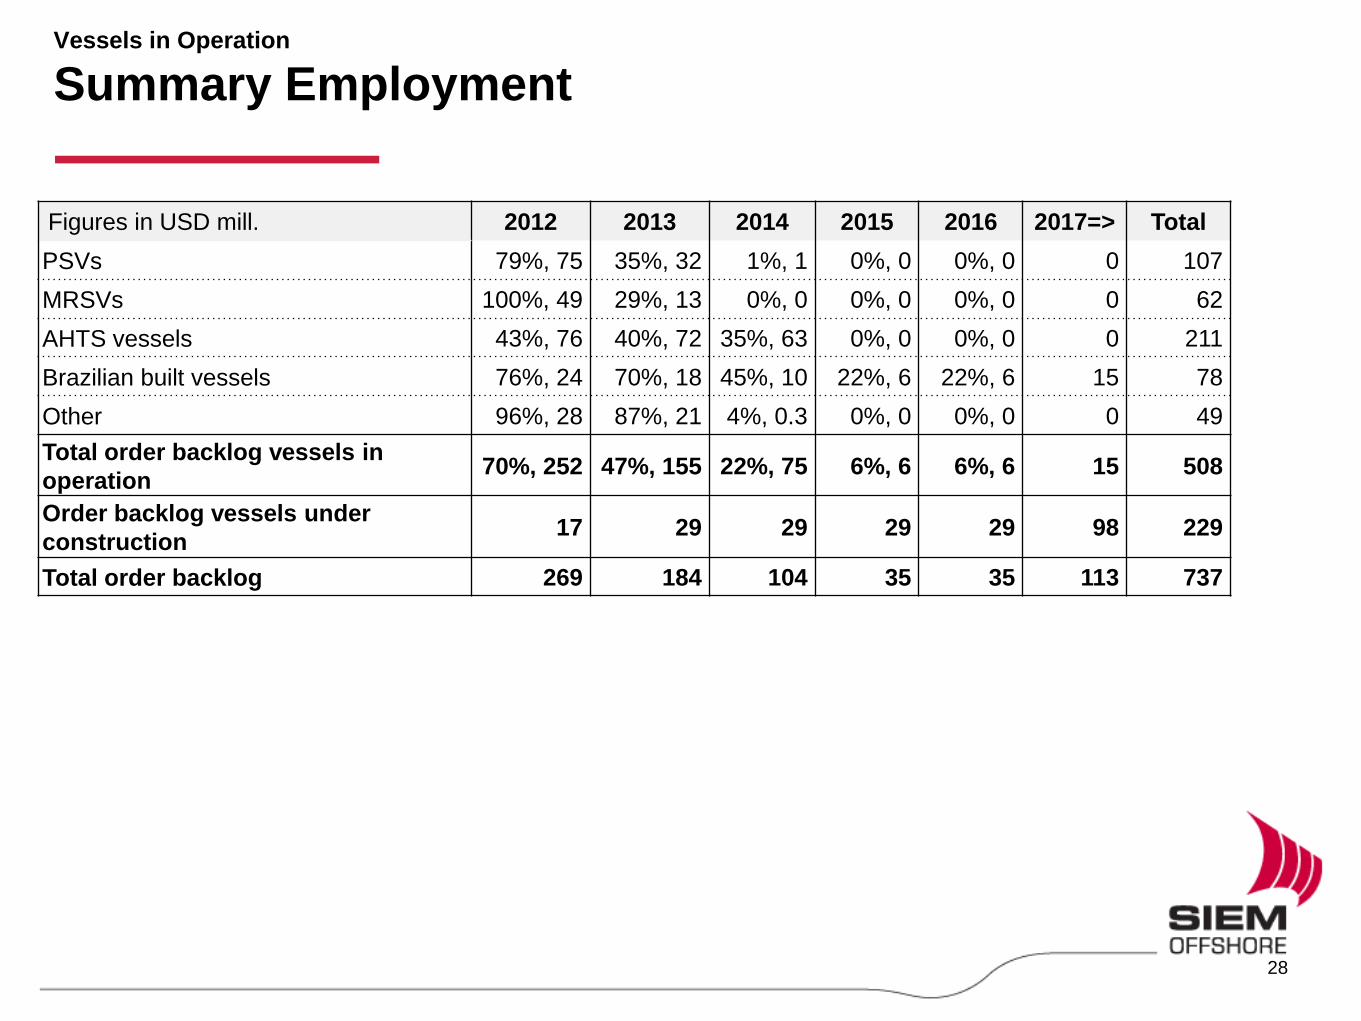
Vessels in Operation
Summary Employment
Figures in USD mill. 2012 2013 2014 2015 2016 2017=> Total
PSVs 79%, 75 35%, 32 1%, 1 0%, 0 0%, 0 0 107
MRSVs 100%, 49 29%, 13 0%, 0 0%, 0 0%, 0 0 62
AHTS vessels 43%, 76 40%, 72 35%, 63 0%, 0 0%, 0 0 211
Brazilian built vessels 76%, 24 70%, 18 45%, 10 22%, 6 22%, 6 15 78
Other 96%, 28 87%, 21 4%, 0.3 0%, 0 0%, 0 0 49
Total order backlog vessels in
operation 70%, 252 47%, 155 22%, 75 6%, 6 6%, 6 15 508
Order backlog vessels under
construction 17 29 29 29 29 98 229
Total order backlog 269 184 104 35 35 113 737
28