Embed Size (px)
Citation preview

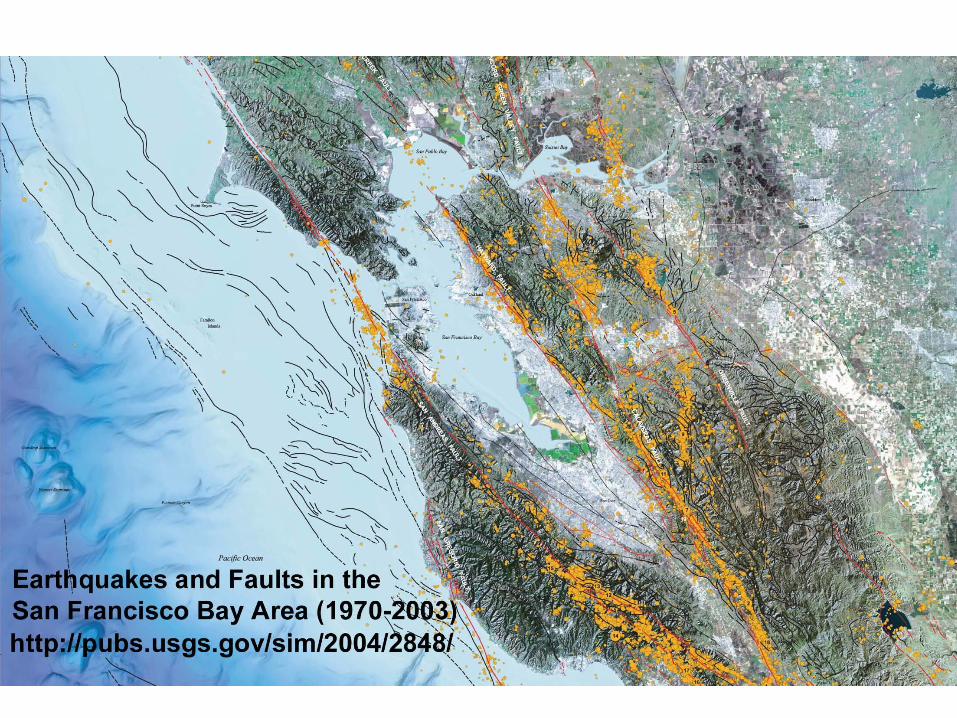
Earthquakes and Earthquake Prediction
Andrei GabrielovPurdue University
West Lafayette, IN, USAwww.math.purdue.edu/~agabriel
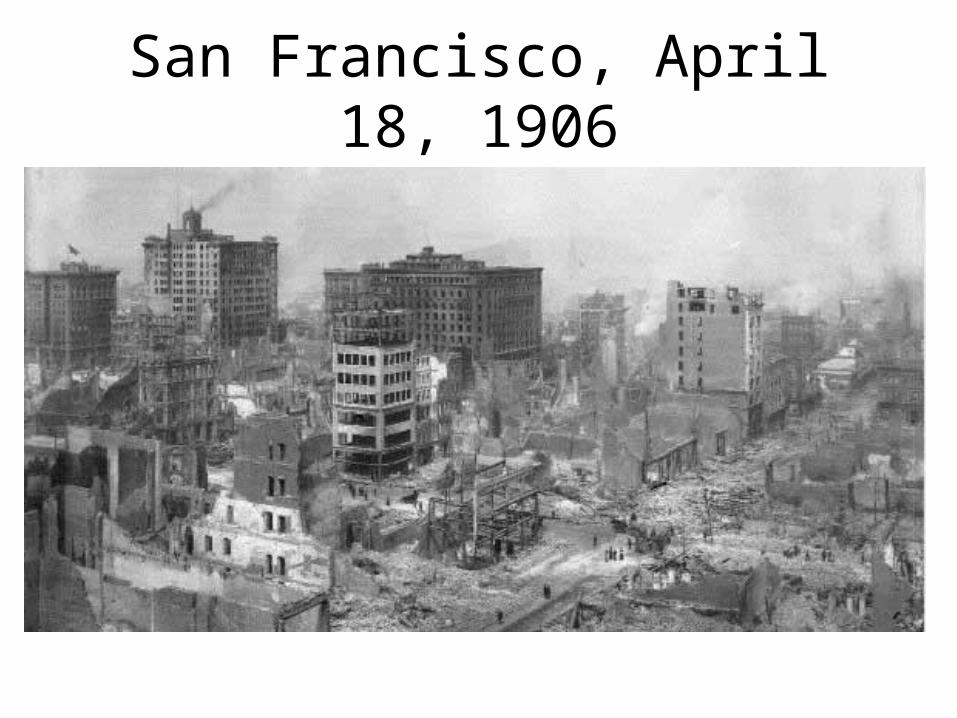
San Francisco, April 18, 1906
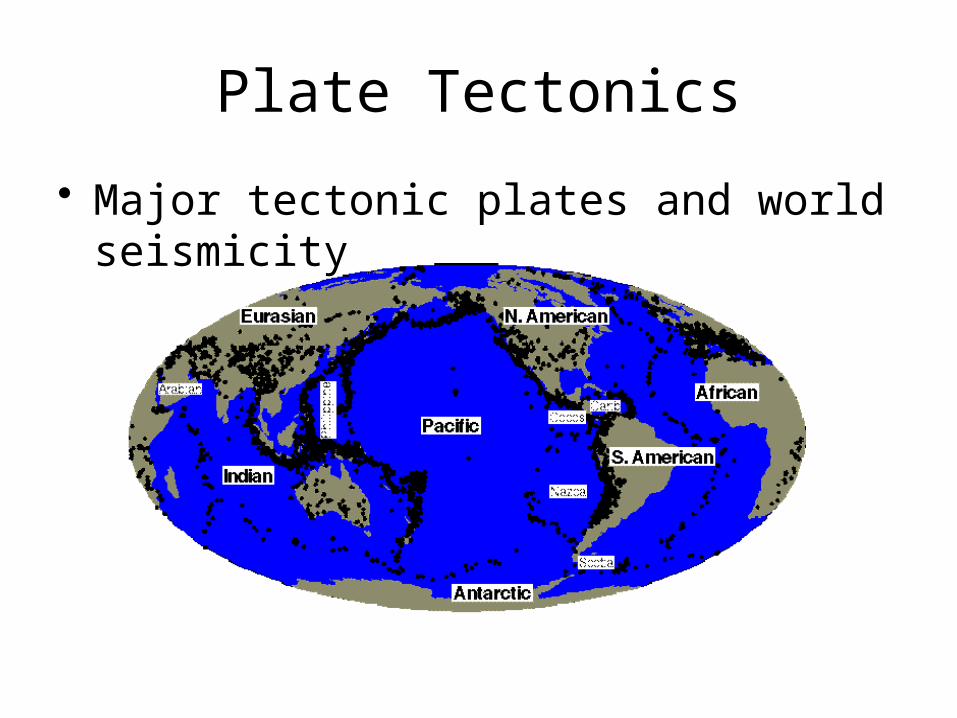
Plate Tectonics
• Major tectonic plates and world seismicity
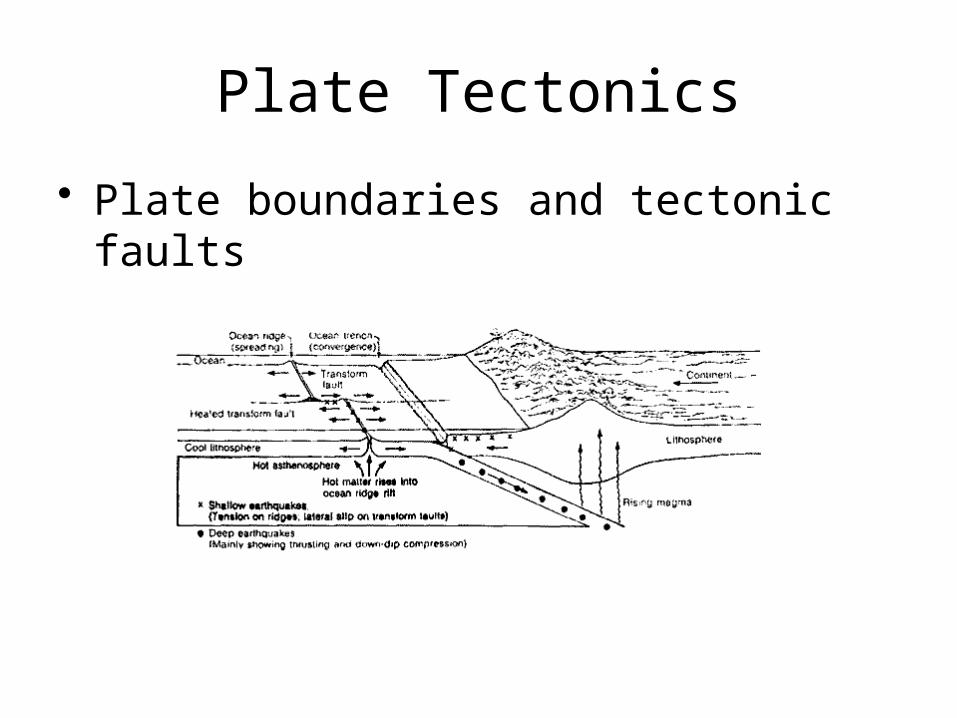
Plate Tectonics
• Plate boundaries and tectonic faults
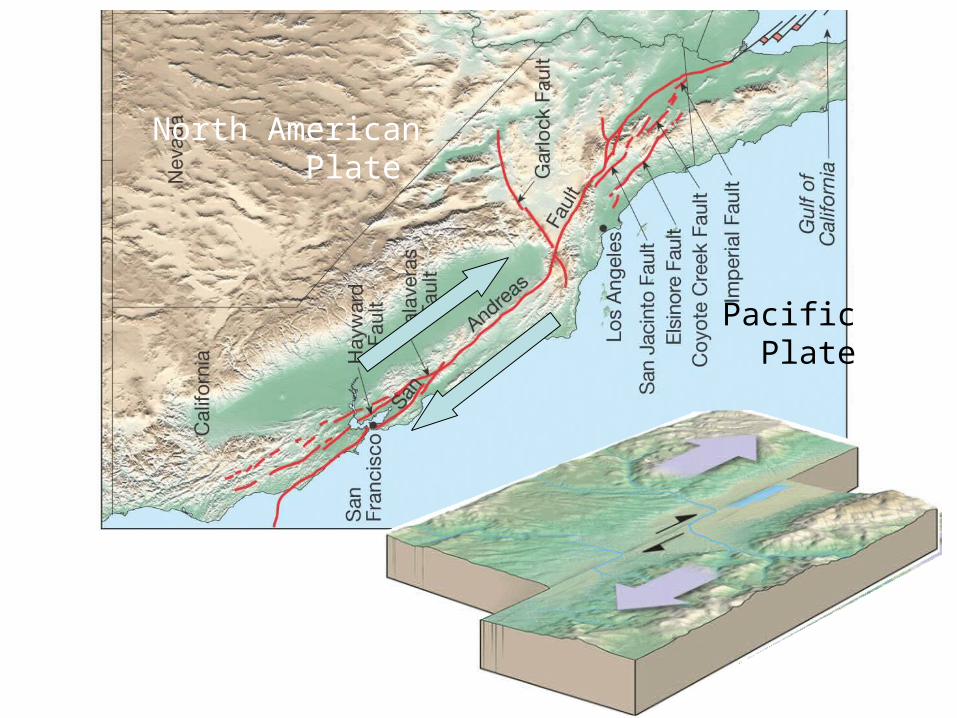
North American Plate
Pacific Plate
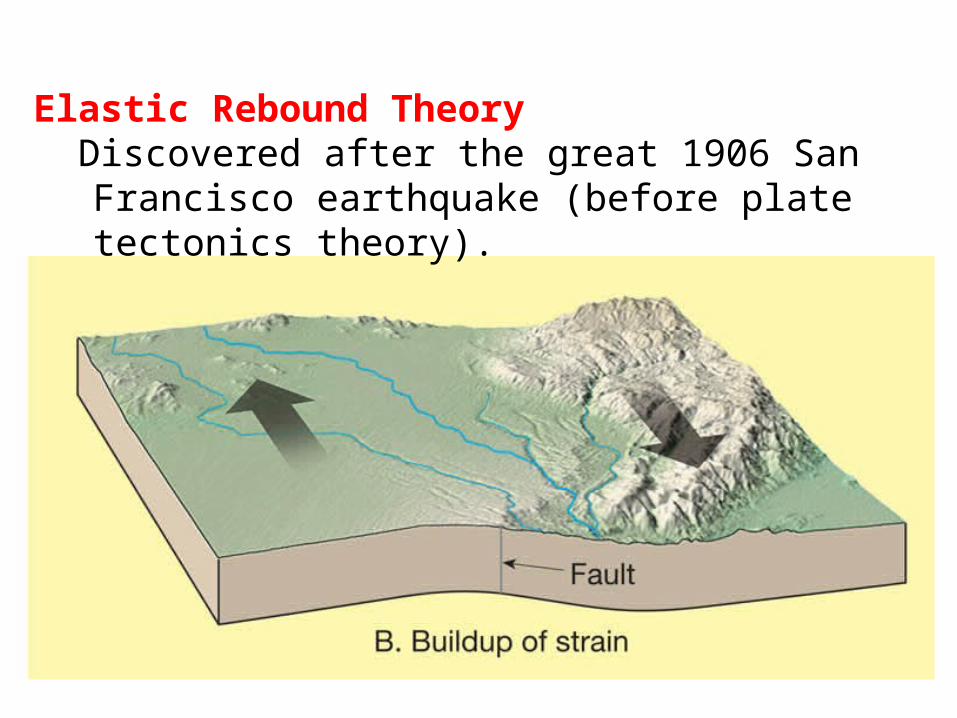
Elastic Rebound Theory Discovered after the great 1906 San Francisco
earthquake (before plate tectonics theory).
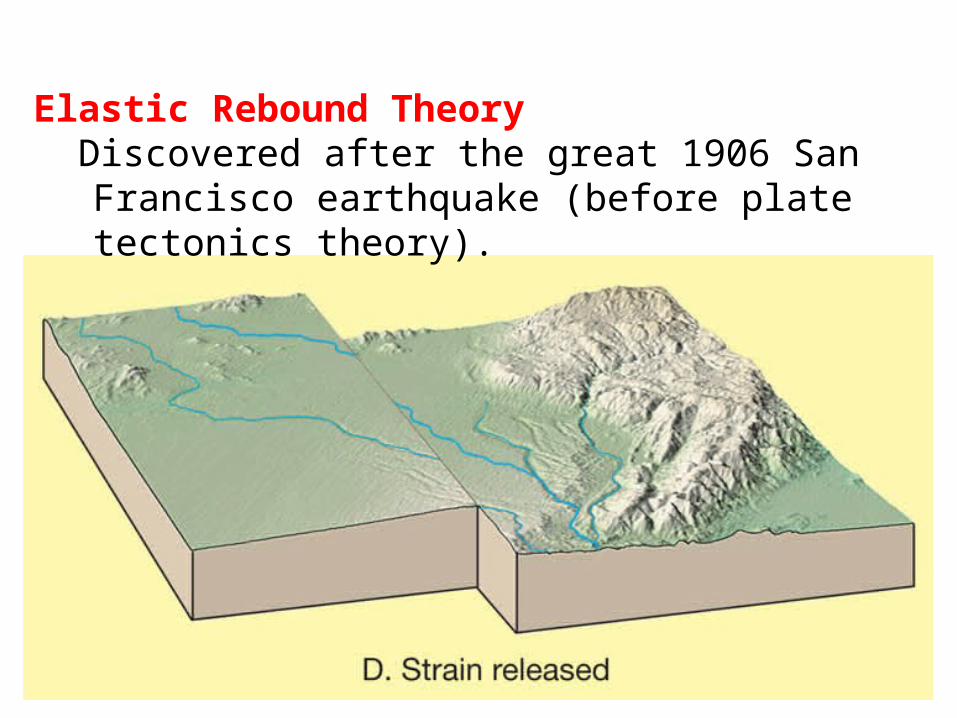
Elastic Rebound Theory Discovered after the great 1906 San Francisco
earthquake (before plate tectonics theory).
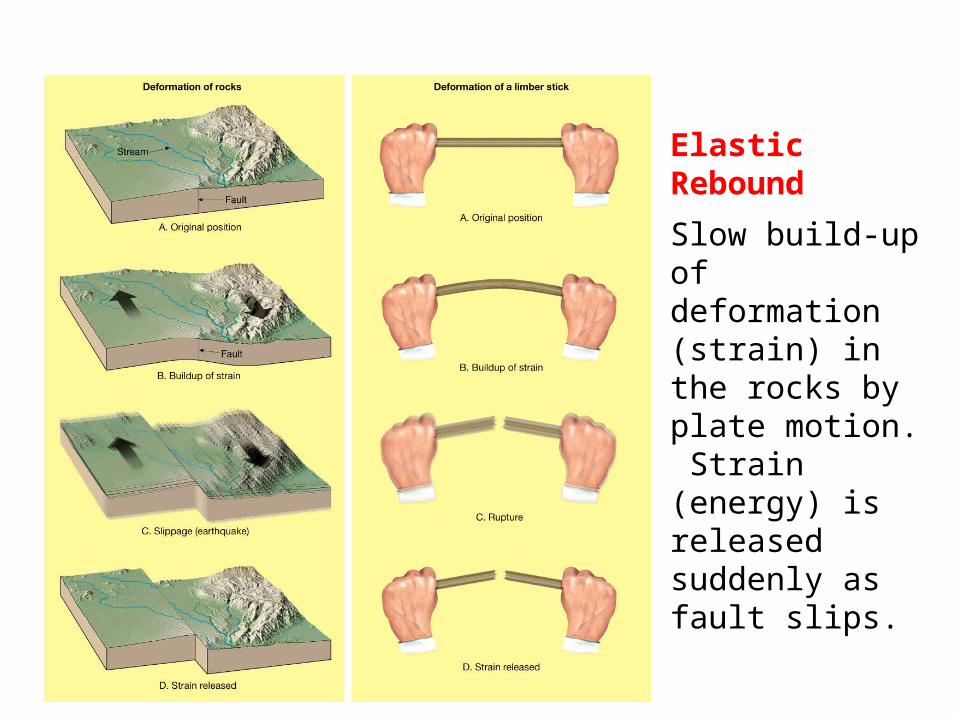
Elastic Rebound
Slow build-up of deformation (strain) in the rocks by plate motion. Strain (energy) is released suddenly as fault slips.
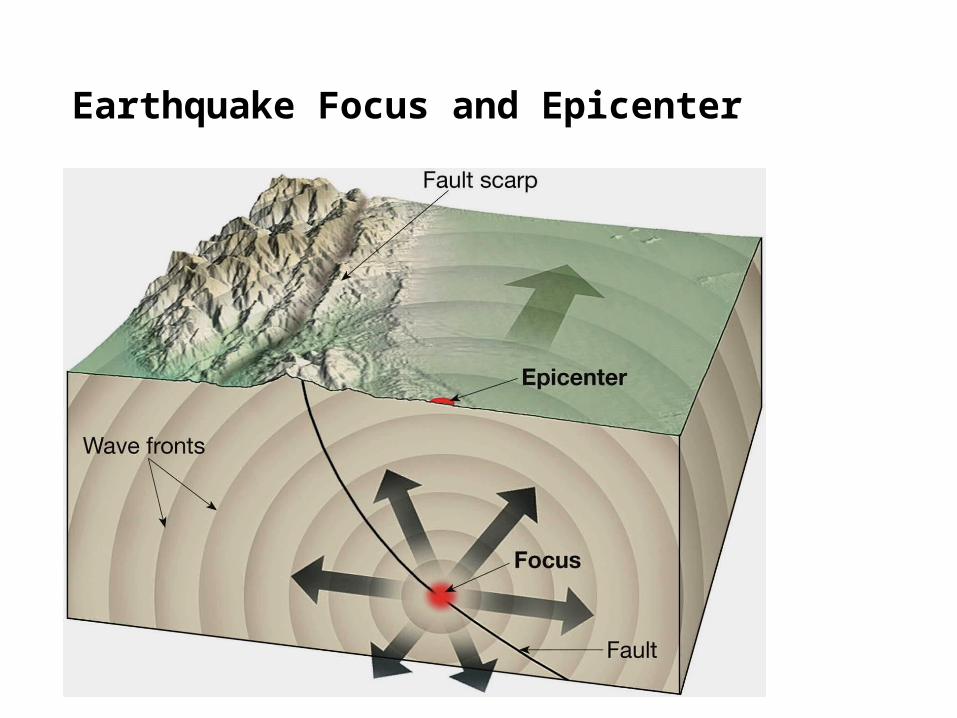
Earthquake Focus and Epicenter
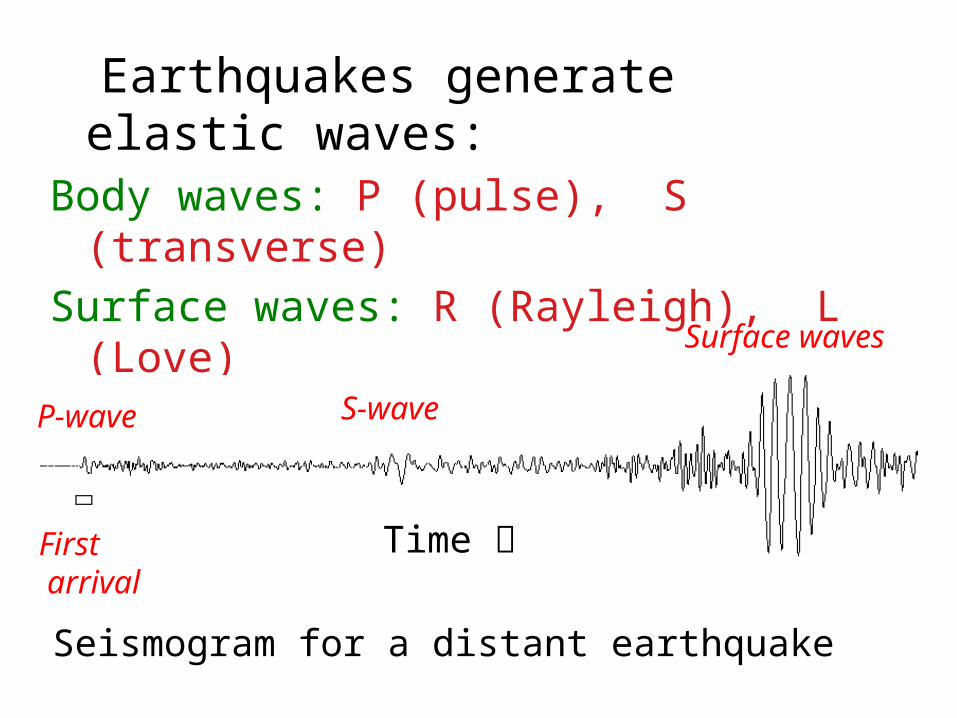
Earthquakes generate elastic waves:Body waves: P (pulse), S (transverse)
Surface waves: R (Rayleigh), L (Love)
P-wave
First arrival
S-wave
Surface waves
Time
Seismogram for a distant earthquake
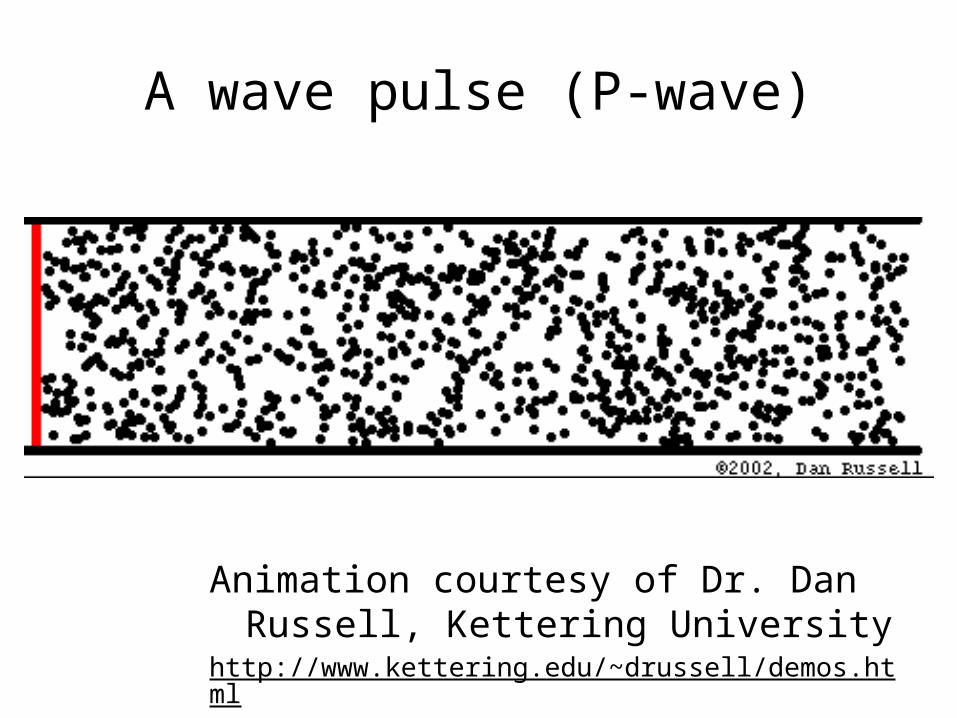
A wave pulse (P-wave)
Animation courtesy of Dr. Dan Russell, Kettering University
http://www.kettering.edu/~drussell/demos.html
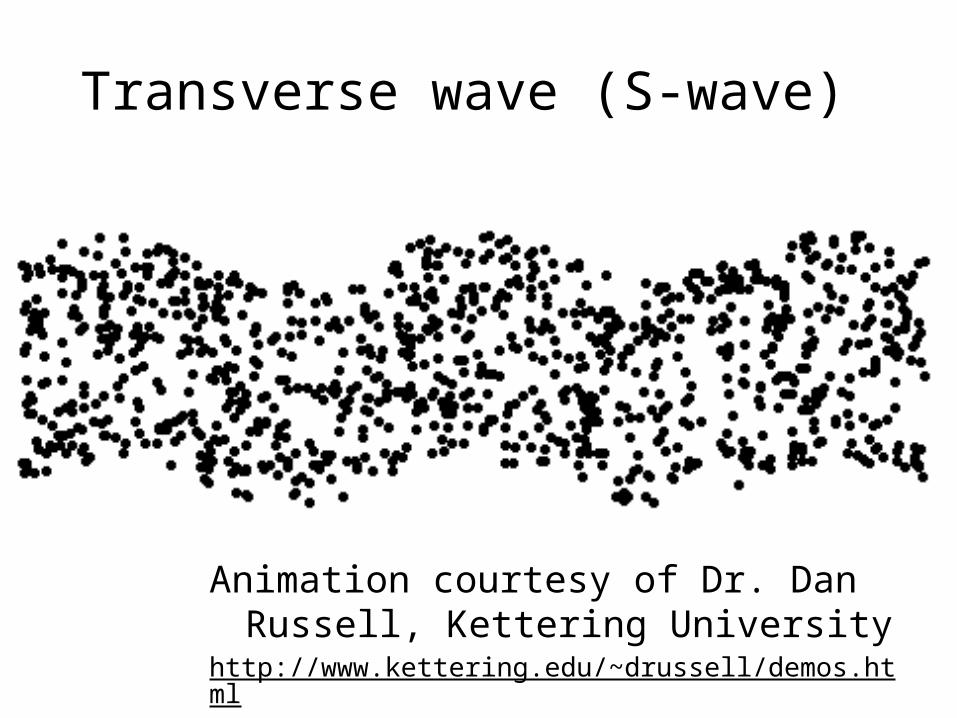
Transverse wave (S-wave)
Animation courtesy of Dr. Dan Russell, Kettering University
http://www.kettering.edu/~drussell/demos.html
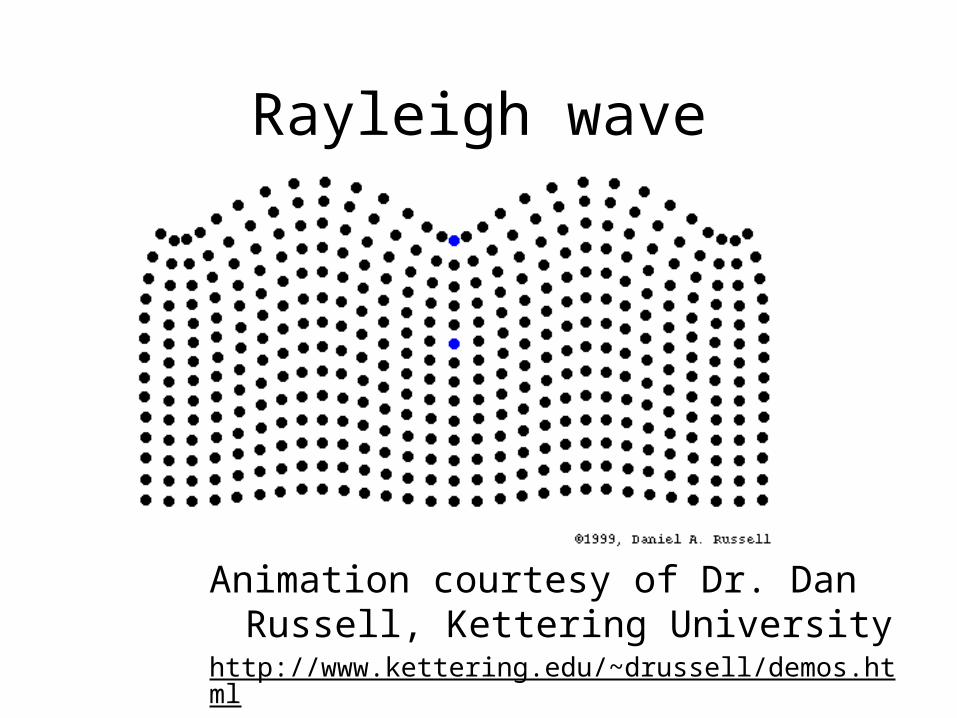
Rayleigh wave
Animation courtesy of Dr. Dan Russell, Kettering University
http://www.kettering.edu/~drussell/demos.html

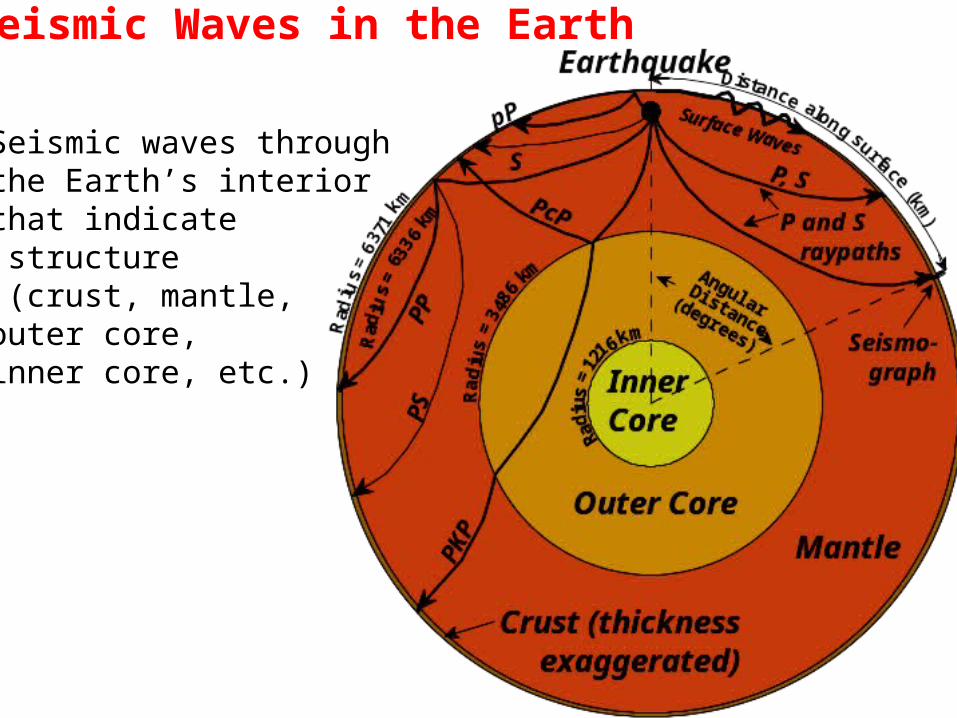
Seismic waves through the Earth’s interior that indicate structure (crust, mantle, outer core, inner core, etc.)
Seismic Waves in the Earth
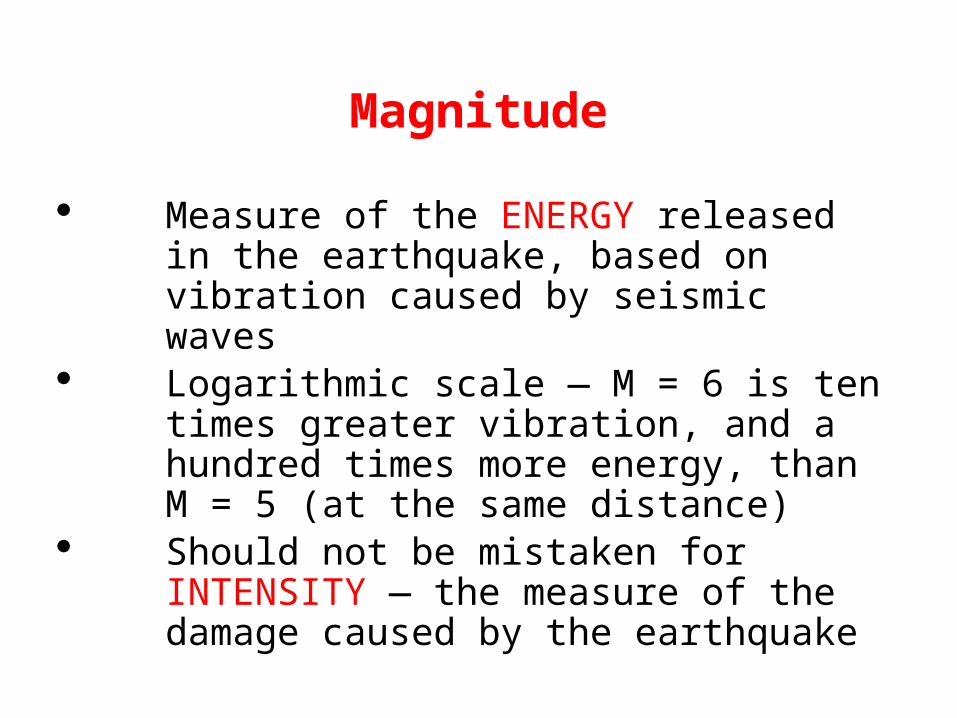
Magnitude
· Measure of the ENERGY released in the earthquake, based on vibration caused by seismic waves
· Logarithmic scale ― M = 6 is ten times greater vibration, and a hundred times more energy, than M = 5 (at the same distance)
· Should not be mistaken for INTENSITY ― the measure of the damage caused by the earthquake
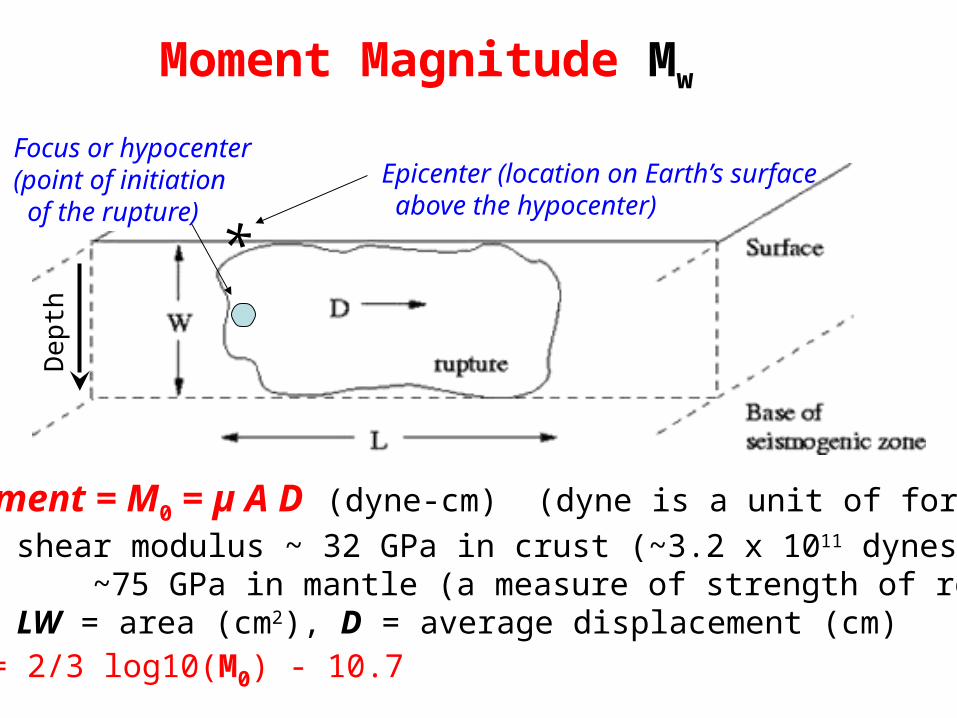
Moment = M0 = µ A D (dyne-cm) (dyne is a unit of force)
µ = shear modulus ~ 32 GPa in crust (~3.2 x 10¹¹ dynes/cm2), ~75 GPa in mantle (a measure of strength of rocks)A = LW = area (cm2), D = average displacement (cm)Mw = 2/3 log10(M0) - 10.7
Moment Magnitude Mw
Epicenter (location on Earth’s surface above the hypocenter)
Focus or hypocenter(point of initiation of the rupture)
*
De
pth
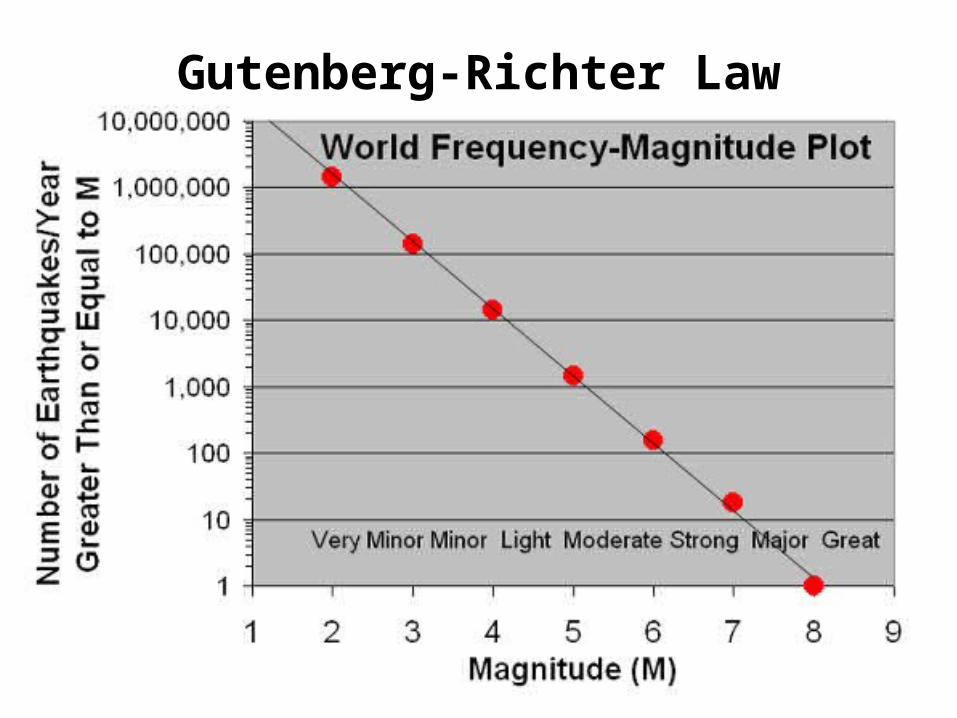
Gutenberg-Richter Law
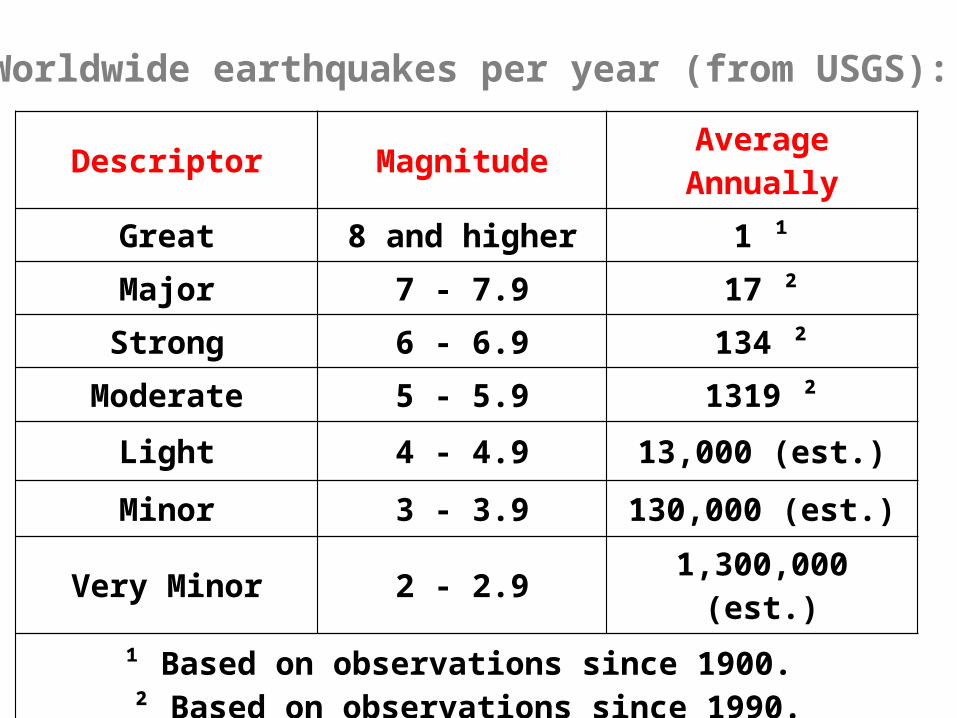
Descriptor Magnitude Average Annually
Great 8 and higher 1 ¹
Major 7 - 7.9 17 ²
Strong 6 - 6.9 134 ²
Moderate 5 - 5.9 1319 ²
Light 4 - 4.9 13,000 (est.)
Minor 3 - 3.9 130,000 (est.)
Very Minor 2 - 2.9 1,300,000 (est.)
¹ Based on observations since 1900. ² Based on observations since 1990.
Worldwide earthquakes per year (from USGS):
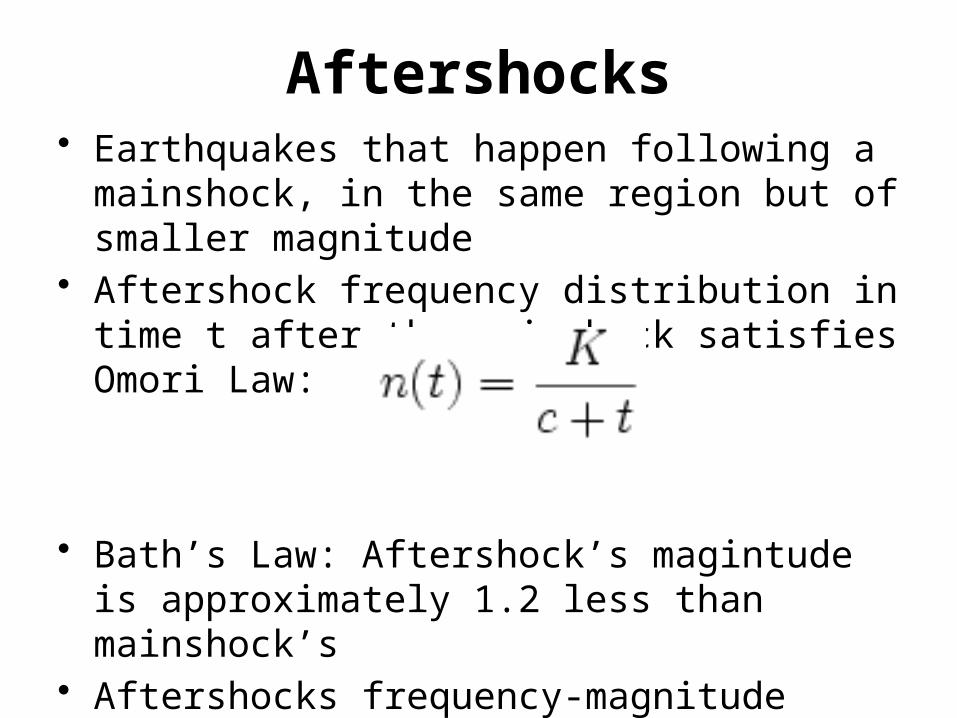
Aftershocks• Earthquakes that happen following a mainshock,
in the same region but of smaller magnitude• Aftershock frequency distribution in time t after
the mainshock satisfies Omori Law:
• Bath’s Law: Aftershock’s magintude is approximately 1.2 less than mainshock’s
• Aftershocks frequency-magnitude distribution satisfies Gutenberg-Richter law
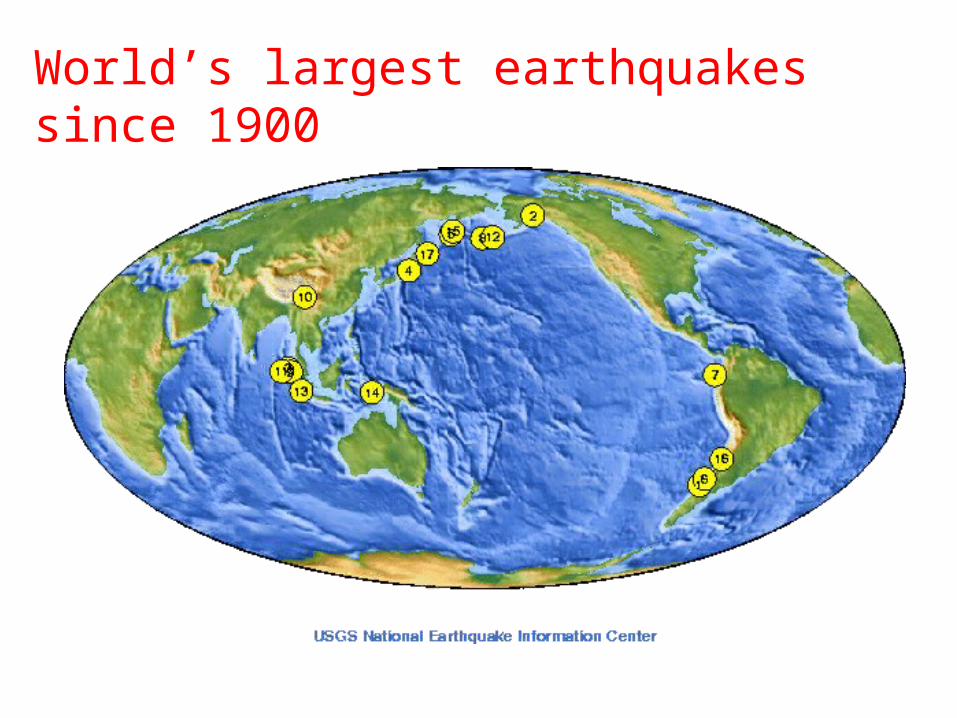
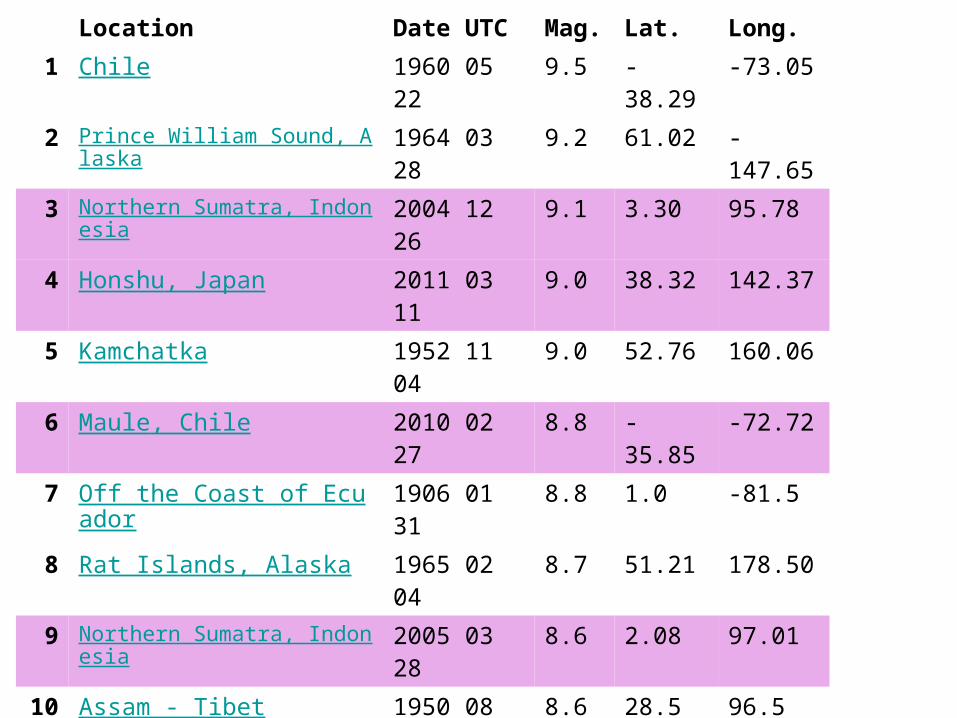
World’s largest earthquakes since 1900
Location Date UTC Mag.
Lat. Long.
1 Chile 1960 05 22
9.5 -38.29 -73.05
2 Prince William Sound, Alaska
1964 03 28
9.2 61.02 -147.65
3 Northern Sumatra, Indonesia
2004 12 26
9.1 3.30 95.78
4 Honshu, Japan 2011 03 11
9.0 38.32 142.37
5 Kamchatka 1952 11 04
9.0 52.76 160.06
6 Maule, Chile 2010 02 27
8.8 -35.85 -72.72
7 Off the Coast of Ecuador 1906 01 31
8.8 1.0 -81.5
8 Rat Islands, Alaska 1965 02 04
8.7 51.21 178.50
9 Northern Sumatra, Indonesia
2005 03 28
8.6 2.08 97.01
10
Assam - Tibet 1950 08 15
8.6 28.5 96.5
11
Northern Sumatra, Indonesia
2012 04 11
8.6 2.31 93.06
12
Andreanof Islands, Alaska
1957 03 09
8.6 51.56 -175.39
13
Southern Sumatra, Indonesia
2007 09 12
8.5 -4.44 101.37
14
Banda Sea, Indonesia 1938 02 01
8.5 -5.05 131.62
15
Kamchatka 1923 02 03
8.5 54.0 161.0
16
Chile-Argentina Border 1922 11 11
8.5 -28.55 -70.50
17
Kuril Islands 1963 10 13
8.5 44.9 149.6
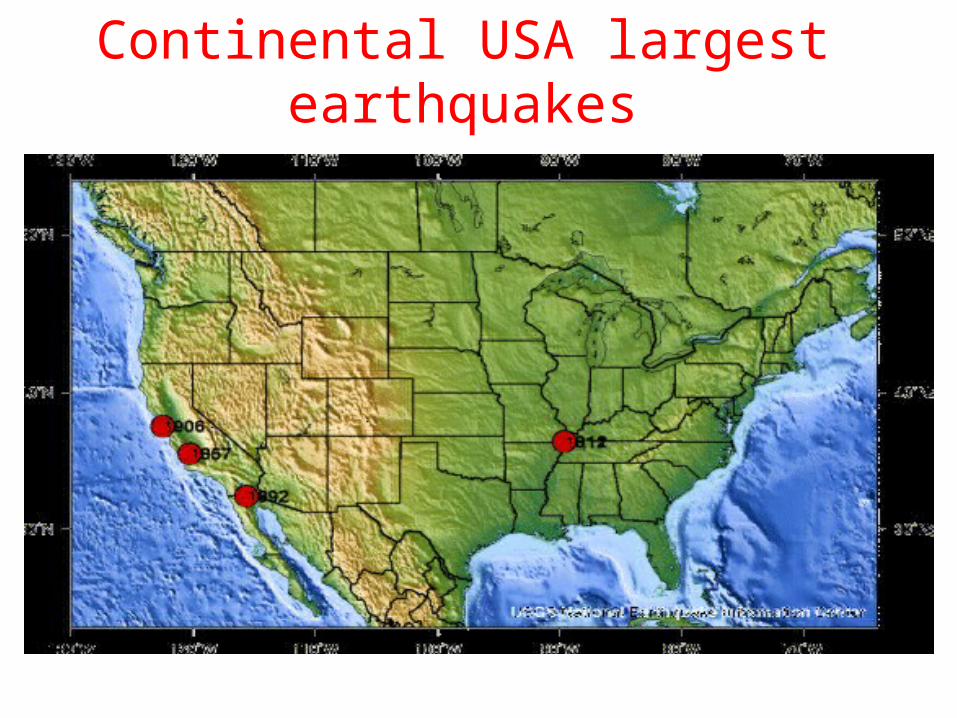
Continental USA largest earthquakes
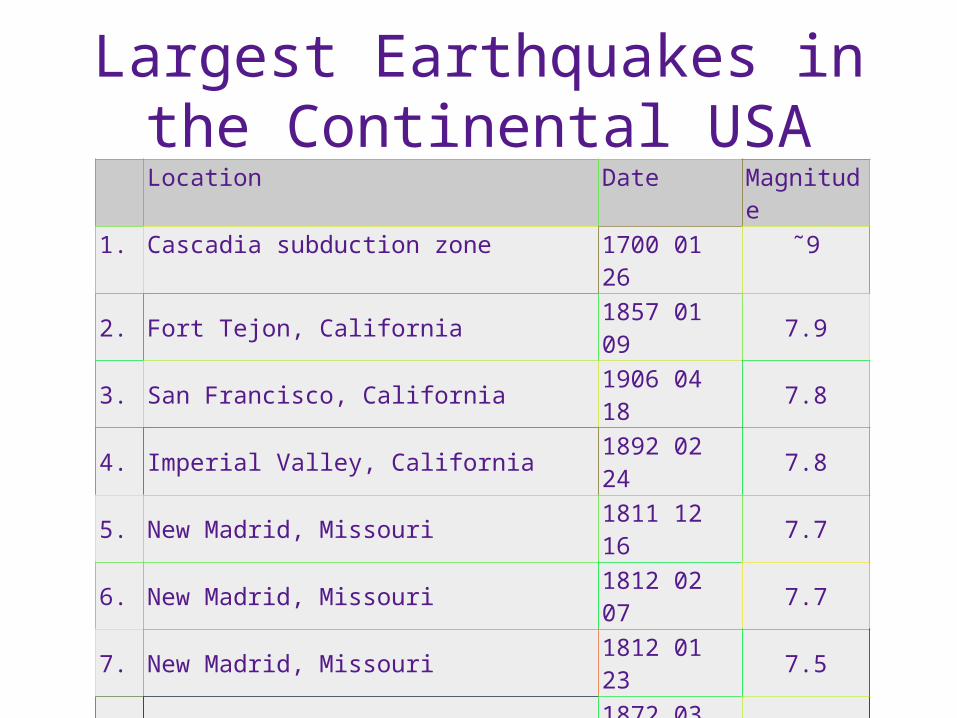
Largest Earthquakes in the Continental USA
Location Date Magnitude
1. Cascadia subduction zone 1700 01 26 ˜92. Fort Tejon, California 1857 01 09 7.93. San Francisco, California 1906 04 18 7.84. Imperial Valley, California 1892 02 24 7.85. New Madrid, Missouri 1811 12 16 7.76. New Madrid, Missouri 1812 02 07 7.77. New Madrid, Missouri 1812 01 23 7.58. Owens Valley, California 1872 03 26 7.49. Landers, California 1992 06 28 7.310. Hebgen Lake, Montana 1959 08 18 7.311. Kern County, California 1952 07 21 7.312. West of Eureka, California 1922 01 31 7.313. Charleston, South Carolina 1886 09 01 7.314. California - Oregon Coast 1873 11 23 7.3
15. N Cascades, Washington 1872 12 15 7.3
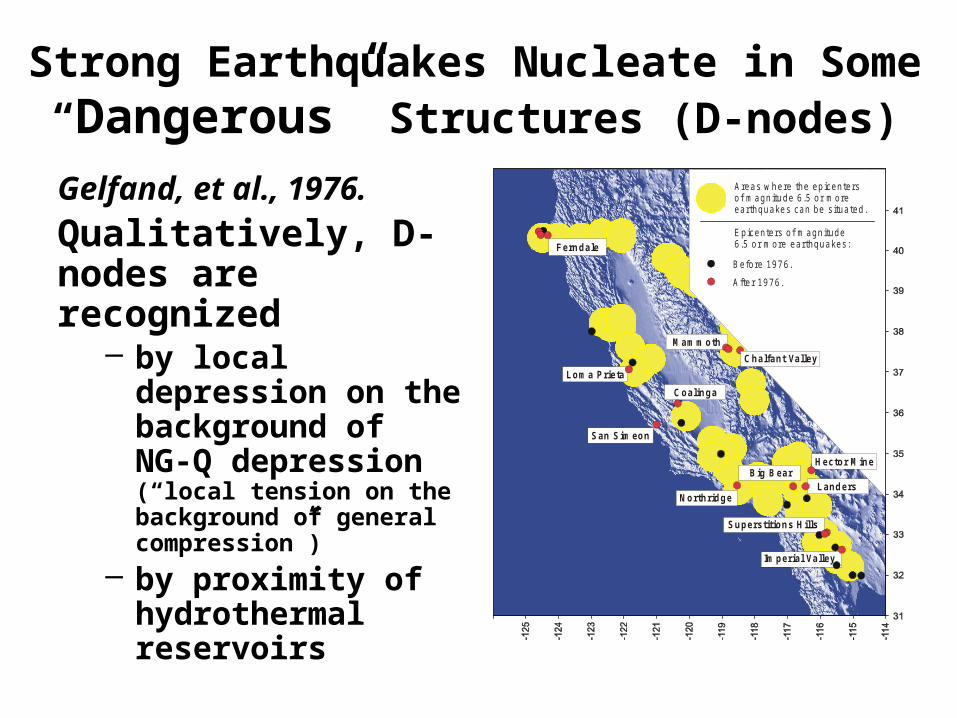
Strong Earthquakes Nucleate in Some “Dangerous” Structures (D-nodes)
Gelfand, et al., 1976.
Qualitatively, D-nodes are recognized
– by local depression on the background of NG‑Q depression (“local tension on the background of general compression”)
– by proximity of hydrothermal reservoirs
Ferndale
M ammoth
Loma Prieta
Coalinga
NorthridgeLanders
Superstitions Hills
Imperial Valley
Big Bear
A reas w here the ep icenters o fearthquakes can be s itua ted.
E p icenters o f earthquakes :
m agnitude 6 .5 or m ore
m agn itude 6 .5 o r m ore
B efore 1976.
A fte r 1976.
Chalfant Valley
Hector M ine
San Simeon
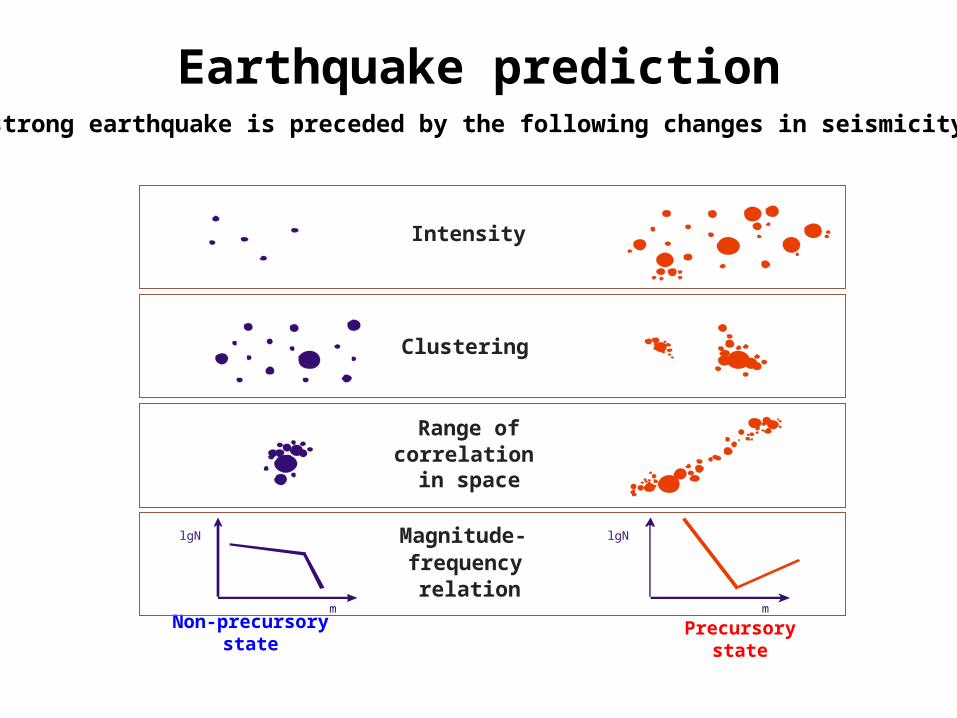
Non-precursory state
Precursory state
Clustering
Range ofcorrelation
in space
Intensity
Magnitude-frequency
relation
lgN
m
lgN
m
Earthquake predictionA strong earthquake is preceded by the following changes in seismicity:
Spac
e
Time
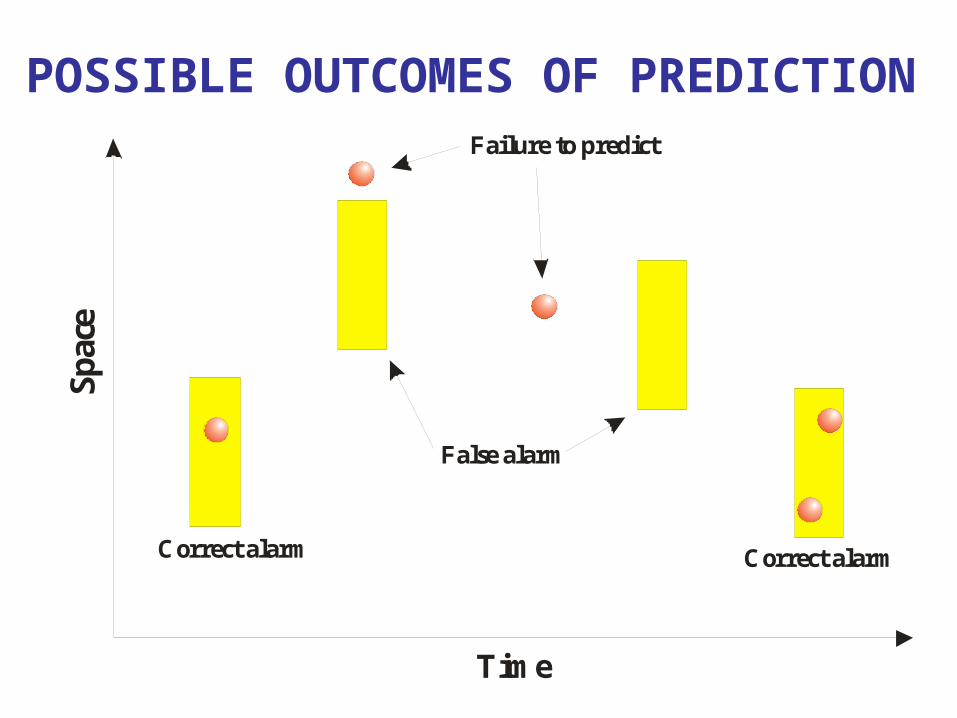
Failure to predict
False alarm
Correct alarm Correct alarm
POSSIBLE OUTCOMES OF PREDICTION
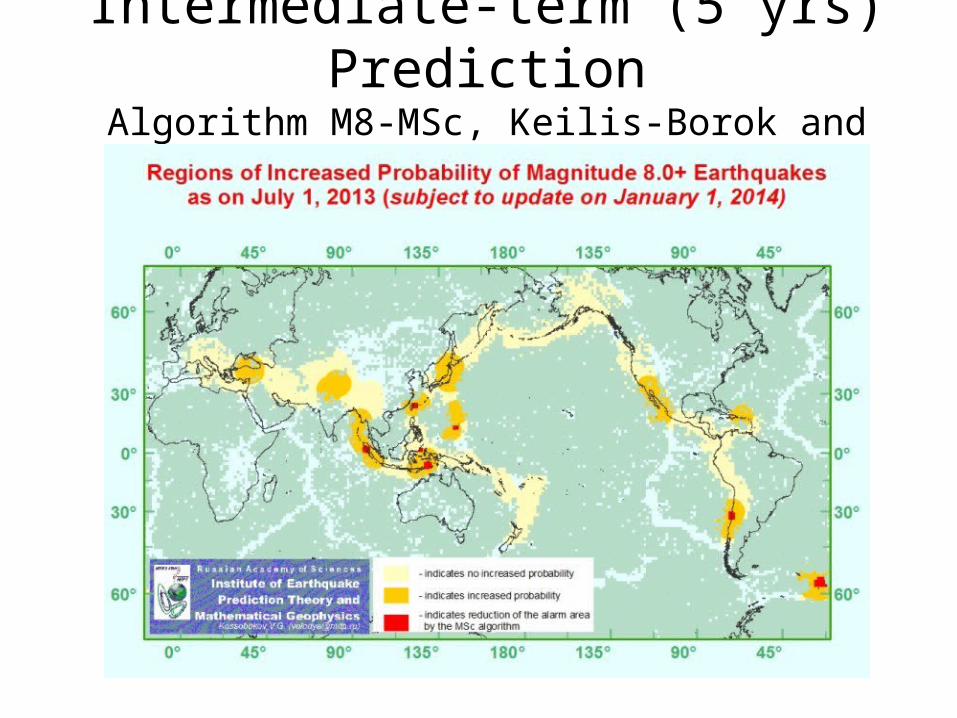
Intermediate-term (5 yrs) PredictionAlgorithm M8-MSc, Keilis-Borok and Kossobokov
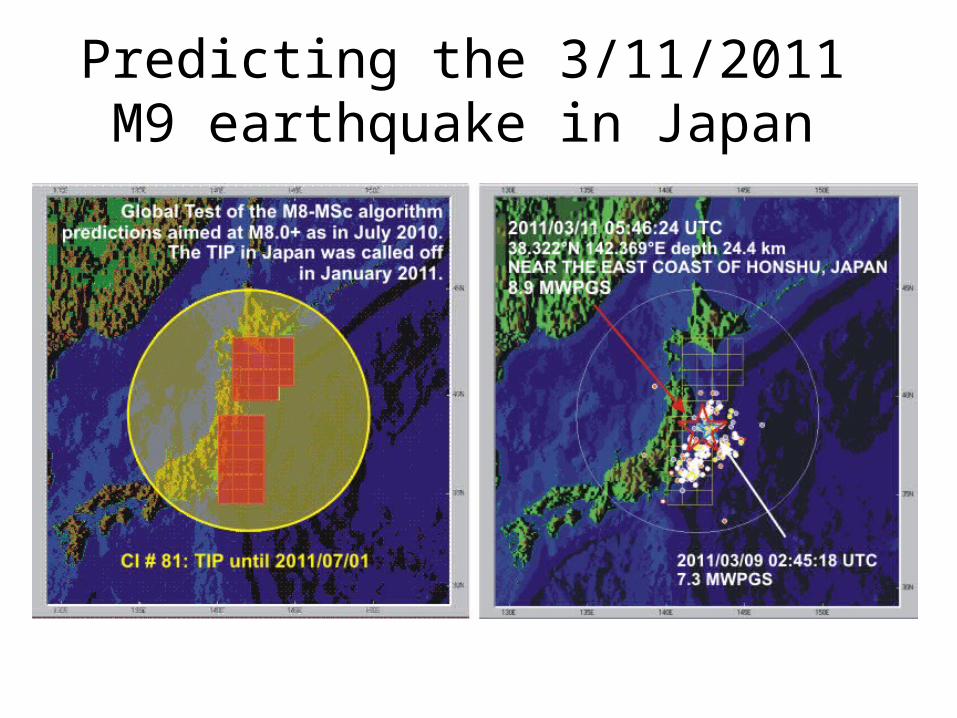
Predicting the 3/11/2011 M9 earthquake in Japan
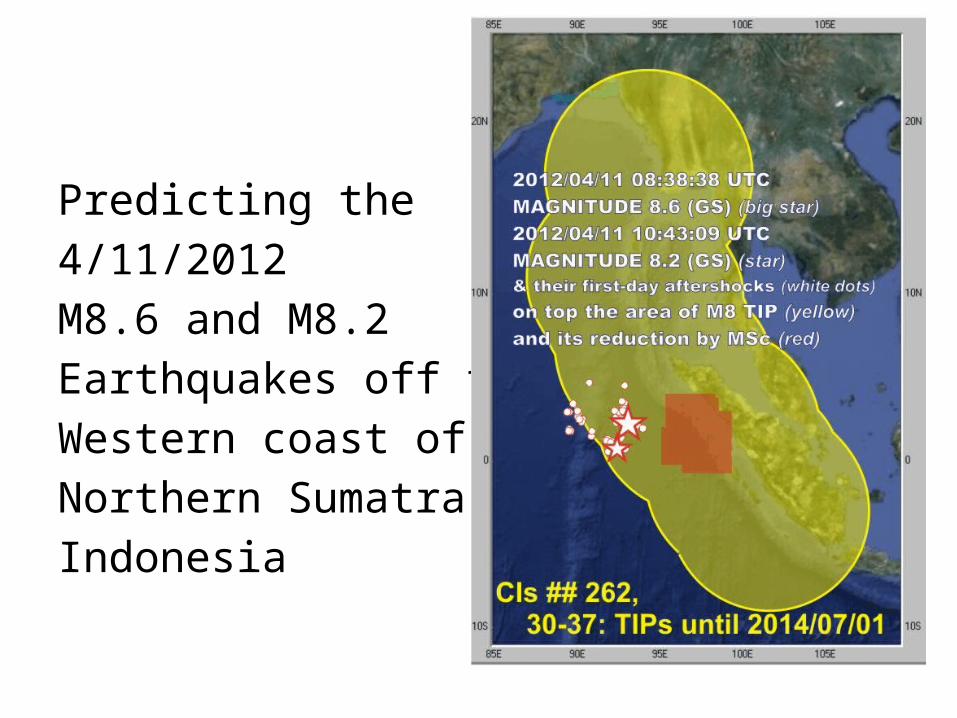
Predicting the
4/11/2012
M8.6 and M8.2
Earthquakes off the
Western coast of
Northern Sumatra,
Indonesia
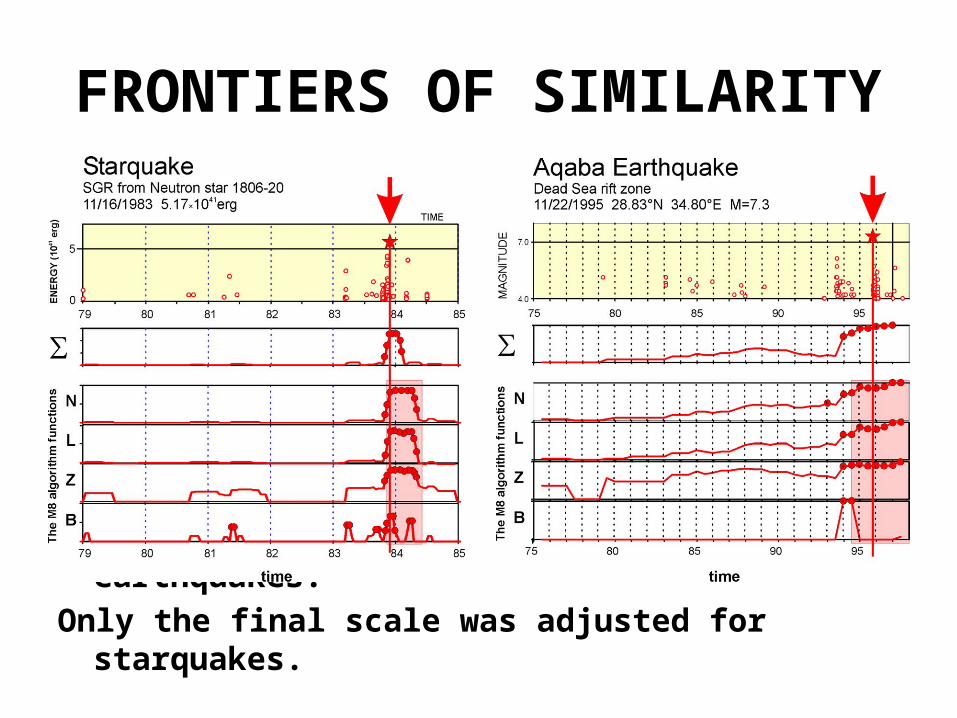
FRONTIERS OF SIMILARITY
Precursors have been defined for earthquakes.
Only the final scale was adjusted for starquakes.
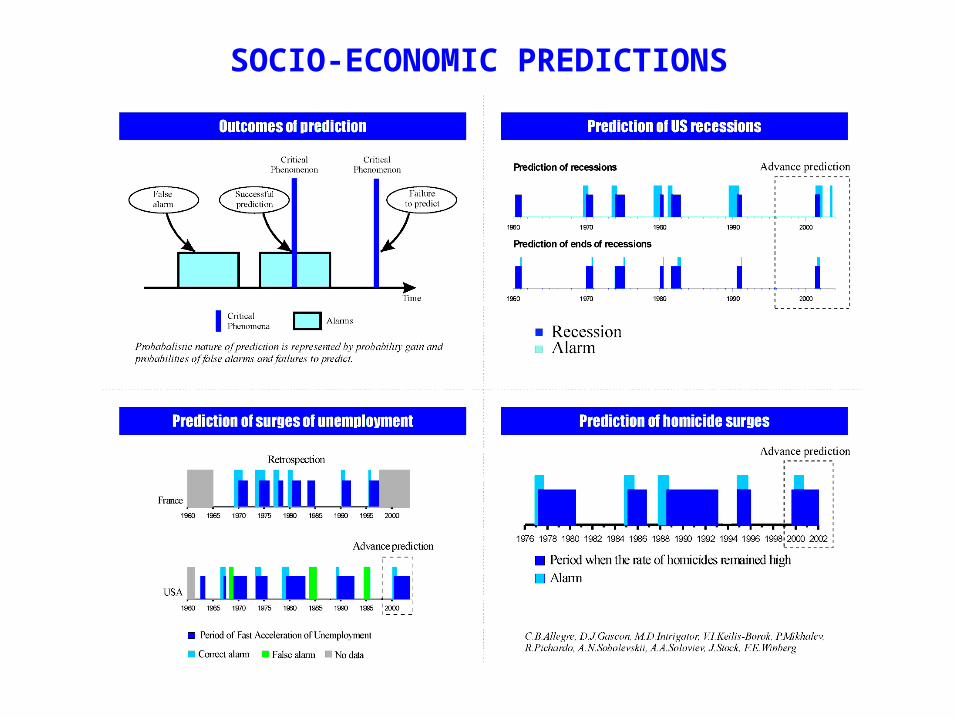
SOCIO-ECONOMIC PREDICTIONS
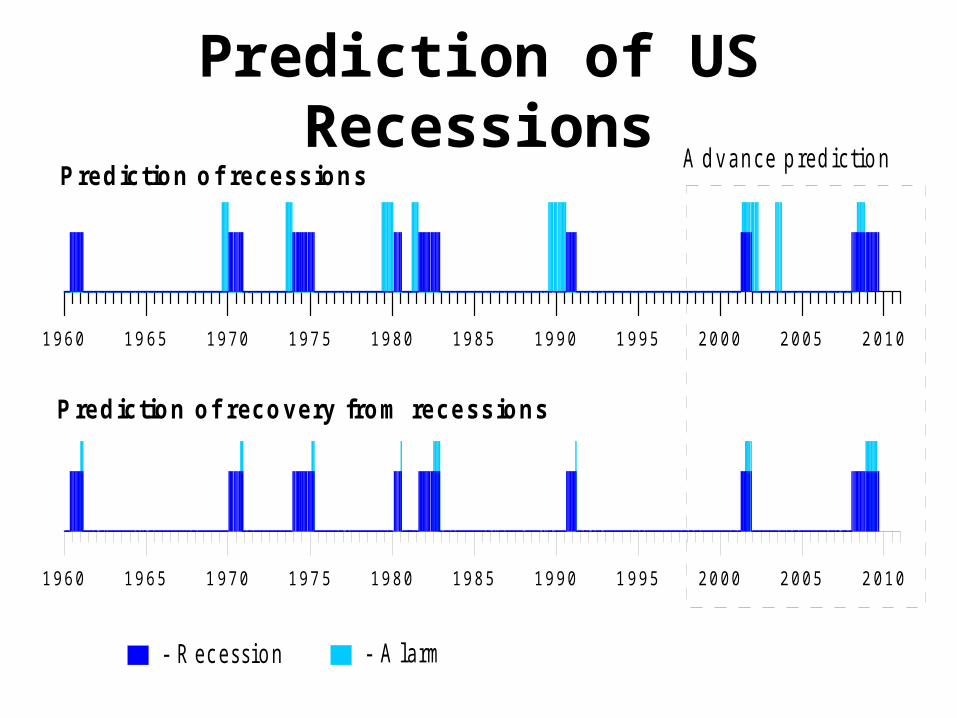
Prediction of US Recessions
19 60 19 6 5 19 70 19 7 5 19 80 19 85 19 90 1 99 5 20 00 20 05 2 01 0
19 60 19 65 1 97 0 19 7 5 19 80 19 85 19 90 1 99 5 20 00 20 05 2 01 0
Prediction of recessions
P rediction of recovery from recessions
A d v a n c e p re d ic tio n
- R e c e s sio n - A la rm
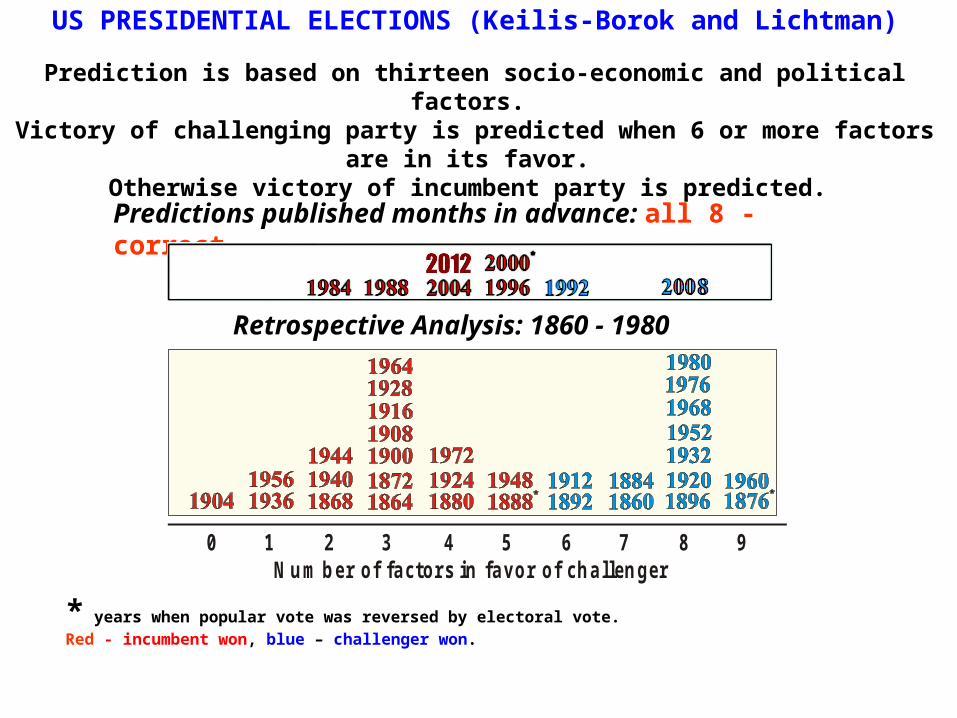
US PRESIDENTIAL ELECTIONS (Keilis-Borok and Lichtman)
Prediction is based on thirteen socio-economic and political factors. Victory of challenging party is predicted when 6 or more factors are in its favor.
Otherwise victory of incumbent party is predicted.
Retrospective Analysis: 1860 - 1980
0 1 2 3 4 5 6 7 8 9N u m b er o f fa ctors in fa vo r o f ch a llen g er
* years when popular vote was reversed by electoral vote.
Red - incumbent won, blue – challenger won.
Predictions published months in advance: all 8 - correct
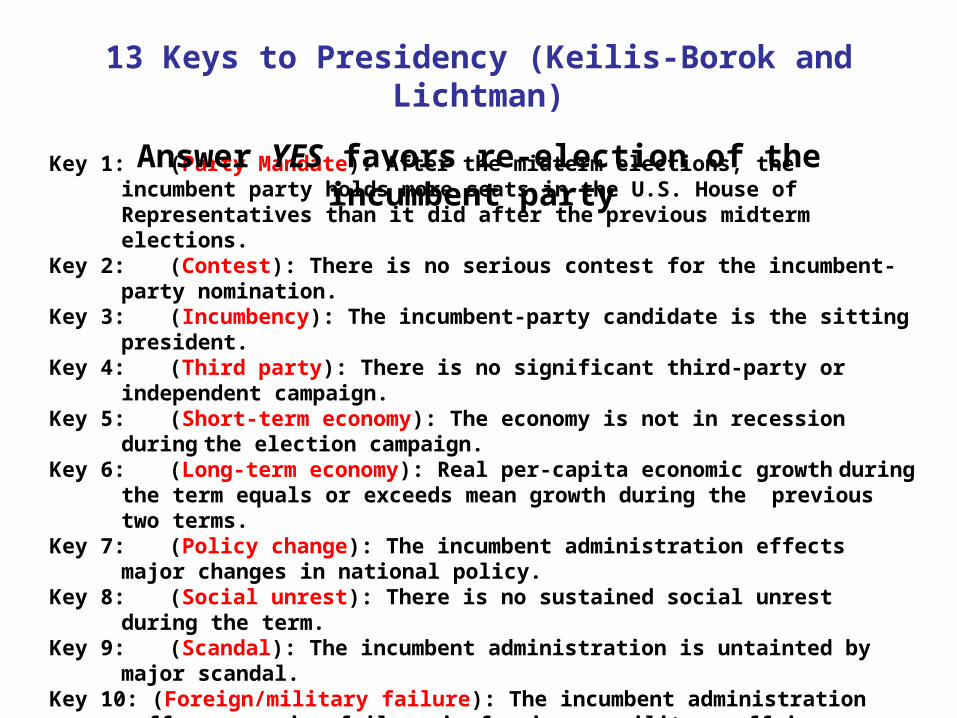
Key 1: (Party Mandate): After the midterm elections, the incumbent party holds more seats in the U.S. House of Representatives than it did after the previous midterm elections.
Key 2: (Contest): There is no serious contest for the incumbent-party nomination.Key 3: (Incumbency): The incumbent-party candidate is the sitting president.Key 4: (Third party): There is no significant third-party or independent campaign.Key 5: (Short-term economy): The economy is not in recession during the election
campaign.Key 6: (Long-term economy): Real per-capita economic growth during the term
equals or exceeds mean growth during the previous two terms.Key 7: (Policy change): The incumbent administration effects major changes in
national policy.Key 8: (Social unrest): There is no sustained social unrest during the term.Key 9: (Scandal): The incumbent administration is untainted by major scandal.Key 10: (Foreign/military failure): The incumbent administration suffers no major
failure in foreign or military affairs.Key 11: (Foreign/military success): The incumbent administration achieves a major
success in foreign or military affairs.Key 12: (Incumbent charisma): The incumbent-party candidate is charismatic or a
national hero.Key 13: (Challenger charisma): The challenging-party candidate is not charismatic or
a national hero.
13 Keys to Presidency (Keilis-Borok and Lichtman)
Answer YES favors re-election of the incumbent party
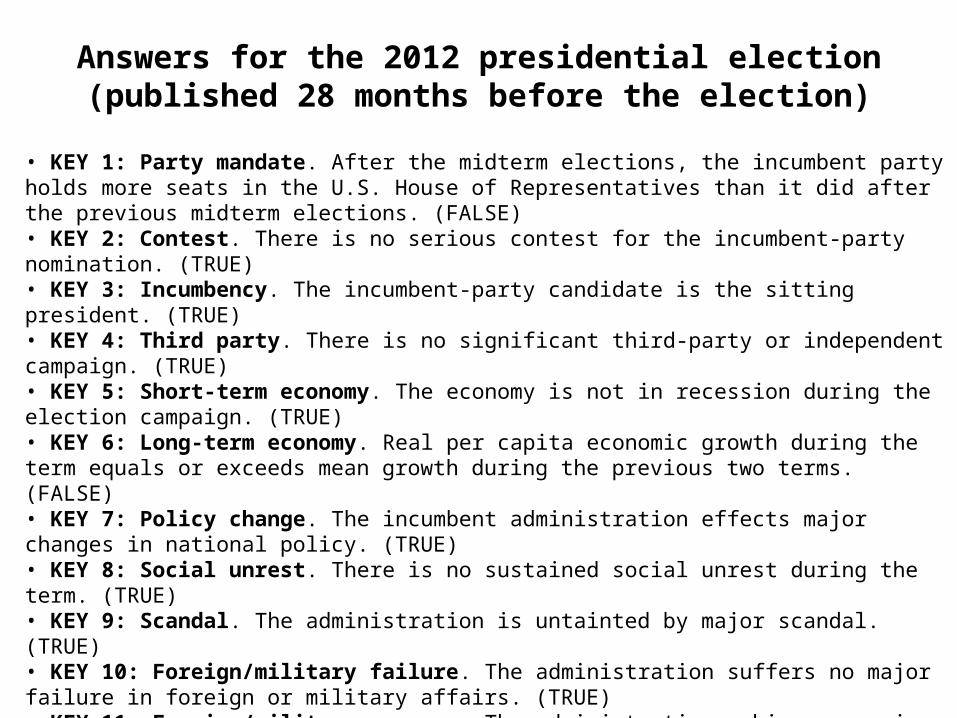
• KEY 1: Party mandate. After the midterm elections, the incumbent party holds more seats in the U.S. House of Representatives than it did after the previous midterm elections. (FALSE)• KEY 2: Contest. There is no serious contest for the incumbent-party nomination. (TRUE)• KEY 3: Incumbency. The incumbent-party candidate is the sitting president. (TRUE)• KEY 4: Third party. There is no significant third-party or independent campaign. (TRUE)• KEY 5: Short-term economy. The economy is not in recession during the election campaign. (TRUE)• KEY 6: Long-term economy. Real per capita economic growth during the term equals or exceeds mean growth during the previous two terms. (FALSE)• KEY 7: Policy change. The incumbent administration effects major changes in national policy. (TRUE)• KEY 8: Social unrest. There is no sustained social unrest during the term. (TRUE)• KEY 9: Scandal. The administration is untainted by major scandal. (TRUE)• KEY 10: Foreign/military failure. The administration suffers no major failure in foreign or military affairs. (TRUE)• KEY 11: Foreign/military success. The administration achieves a major success in foreign or military affairs. (FALSE)• KEY 12: Incumbent charisma. The incumbent-party candidate is charismatic or a national hero. (FALSE)• KEY 13: Challenger charisma: The challenging-party candidate is not charismatic or a national hero. (TRUE)
Answers for the 2012 presidential election(published 28 months before the election)