Embed Size (px)
Citation preview
EBB245 MATERIALS
CHARACTERIZATION
GROUP MEMBER : MOHD NAZIM BIN BIRKAMSIN (112254) MUHAMAD AIZZAT BIN MAT DZAHIR (112255) ZULFAHMI BIN ZANURI (112280) MUHAMMAD HASNOL HAZIQ BIN IMAR (112257) AHMAD FAIZUL AZRAL BIN ISMAIL (113694) MOHAMAD MURSYIK BIN ABD RAMAN (112252)
SAMPLE : ALUMINIUM FOIL
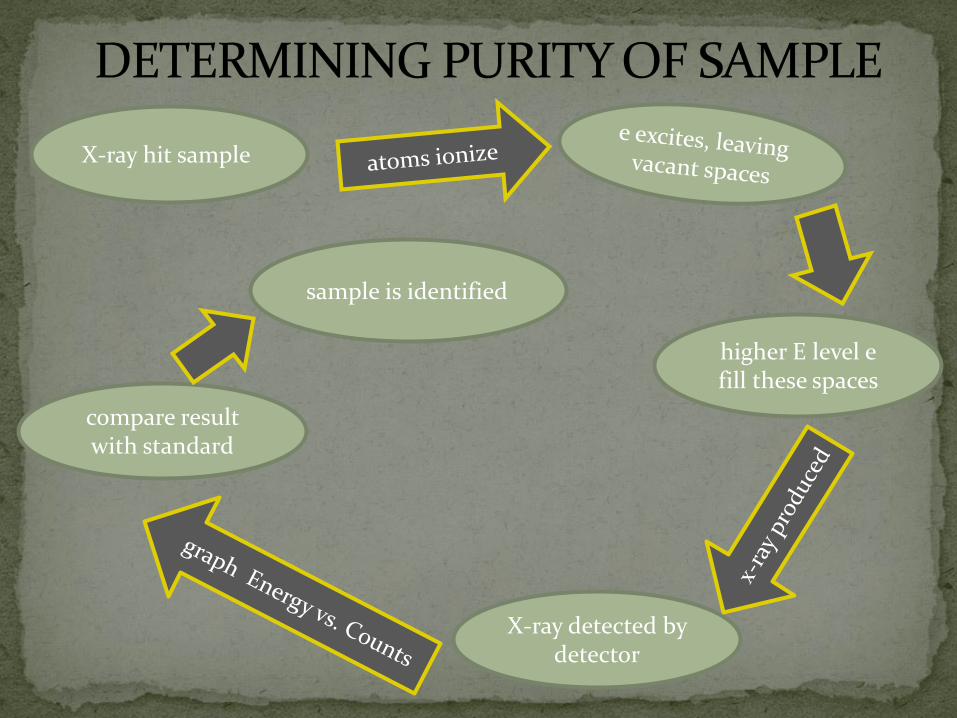
X-ray hit sample
X-ray detected by detector
compare result with standard
higher E level e fill these spaces
sample is identified
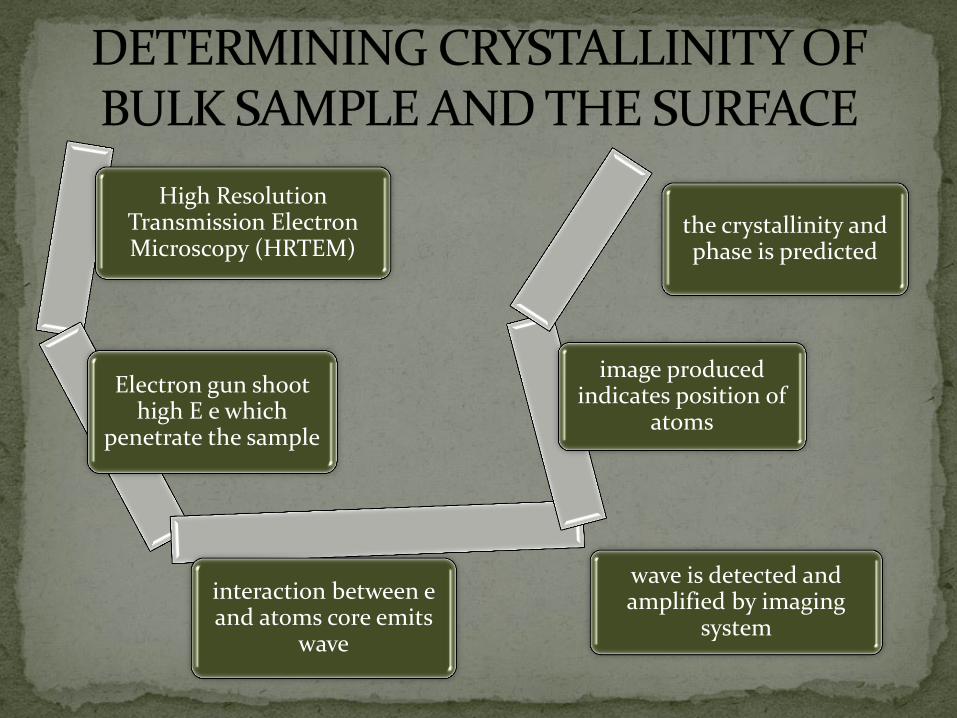
High Resolution Transmission Electron Microscopy (HRTEM)
Electron gun shoot high E e which
penetrate the sample
interaction between e and atoms core emits
wave
wave is detected and amplified by imaging
system
image produced indicates position of
atoms
the crystallinity and phase is predicted
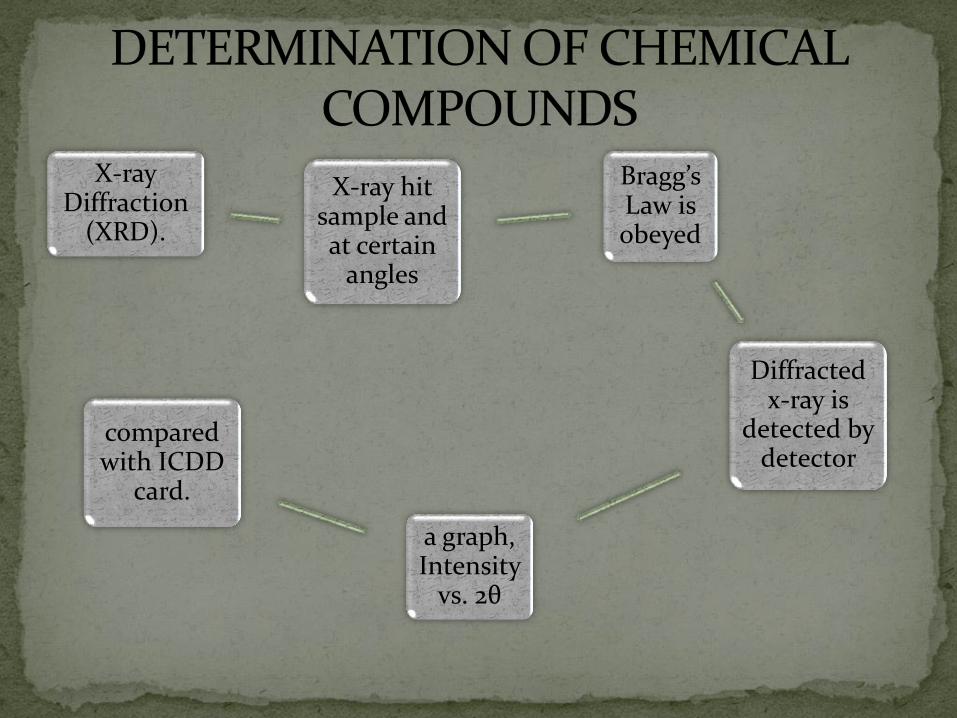
X-ray Diffraction
(XRD).
X-ray hit sample and at certain
angles
Bragg’s Law is obeyed
Diffracted x-ray is
detected by detector
a graph, Intensity
vs. 2θ
compared with ICDD
card.
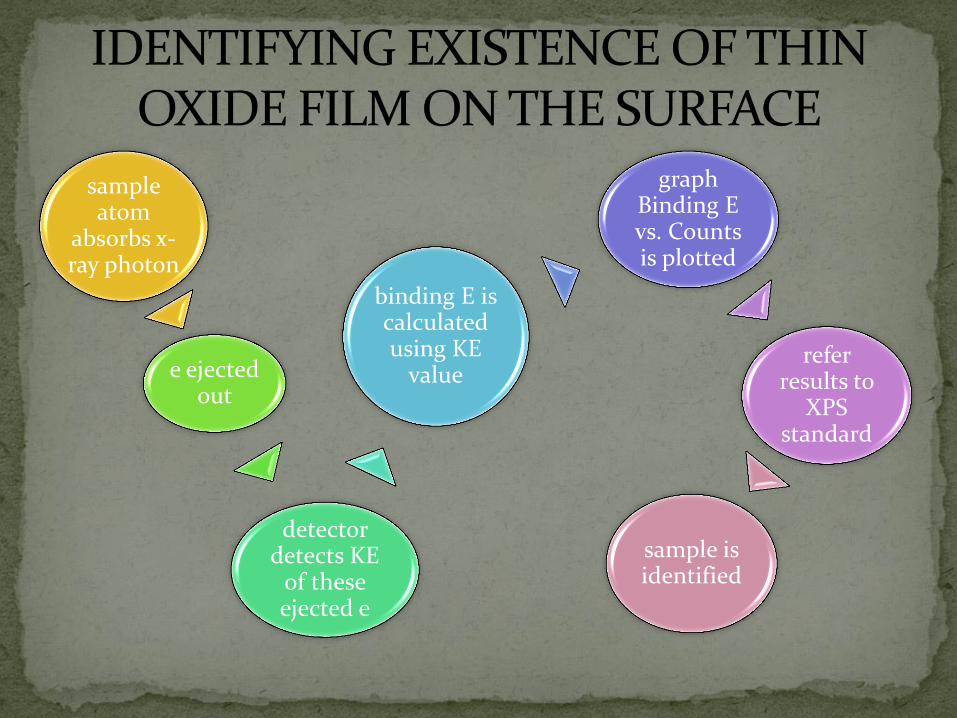
sample atom
absorbs x-ray photon
e ejected out
detector detects KE
of these ejected e
binding E is calculated using KE
value
graph Binding E vs. Counts is plotted
refer results to
XPS standard
sample is identified
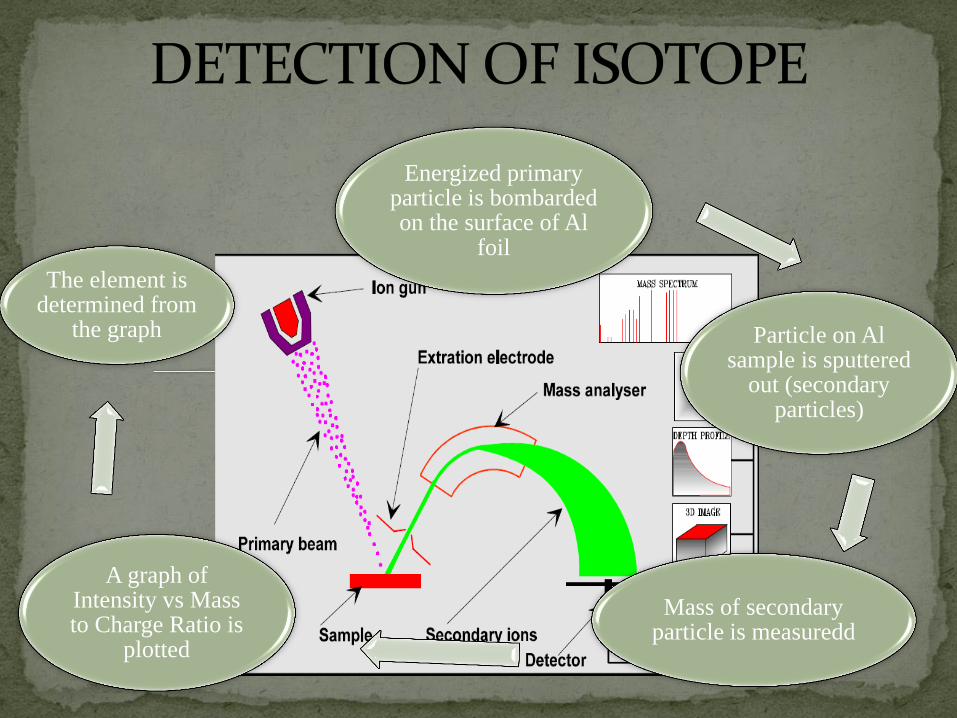
Energized primary particle is bombarded on the surface of Al
foil
Particle on Al sample is sputtered
out (secondary particles)
Mass of secondary particle is measuredd
A graph of Intensity vs Mass to Charge Ratio is
plotted
The element is determined from
the graph
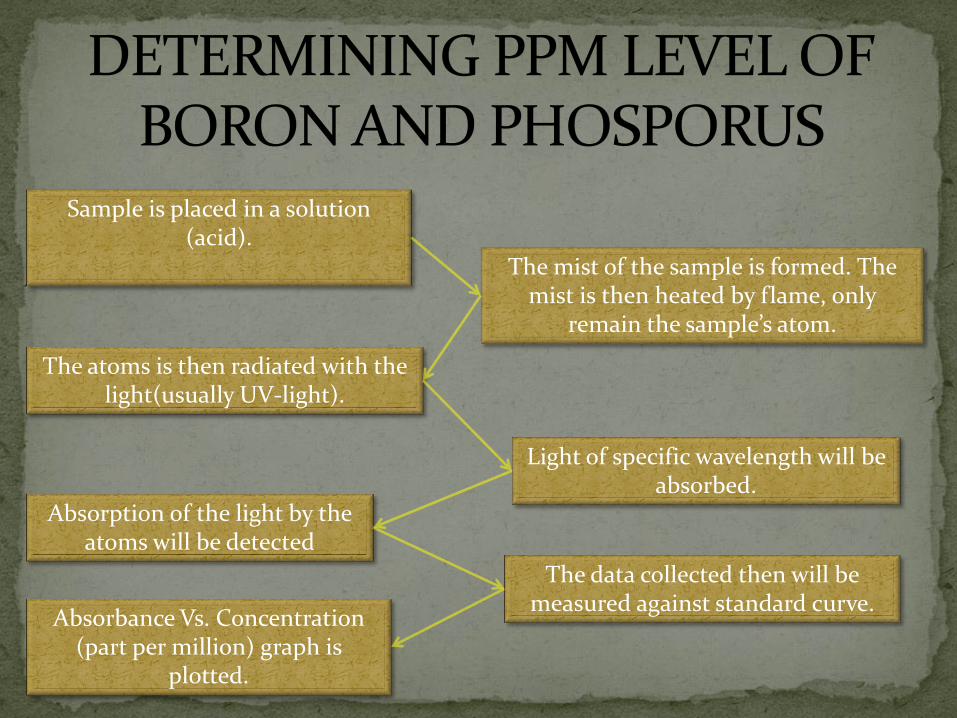
Sample is placed in a solution (acid).
The mist of the sample is formed. The mist is then heated by flame, only
remain the sample’s atom.
The atoms is then radiated with the light(usually UV-light).
Light of specific wavelength will be absorbed.
Absorption of the light by the atoms will be detected
The data collected then will be measured against standard curve.
Absorbance Vs. Concentration (part per million) graph is
plotted.