Embed Size (px)
Citation preview
EBIS SOIL CARBON & NITROGEN
Chuck Garten, Paul Hanson, and Don Todd
EBIS Research Workshop
January 6-7, 2004
Gaithersburg, MD
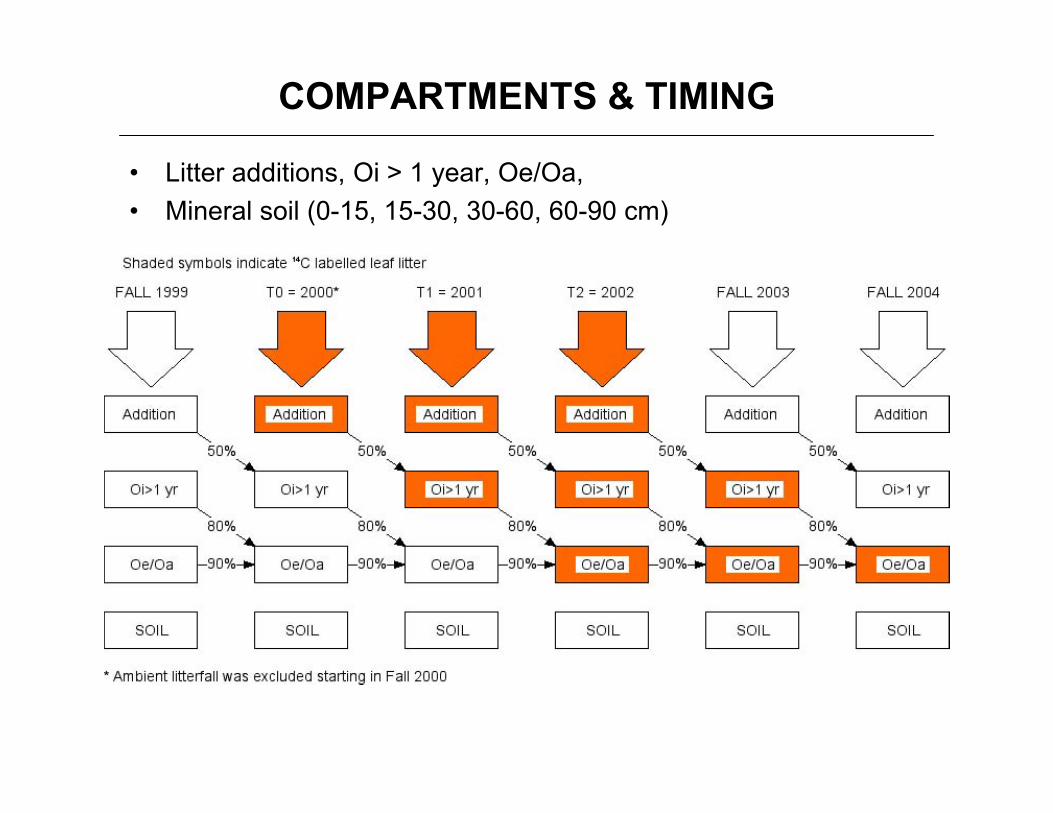
COMPARTMENTS & TIMING
• Litter additions, Oi > 1 year, Oe/Oa,
• Mineral soil (0-15, 15-30, 30-60, 60-90 cm)
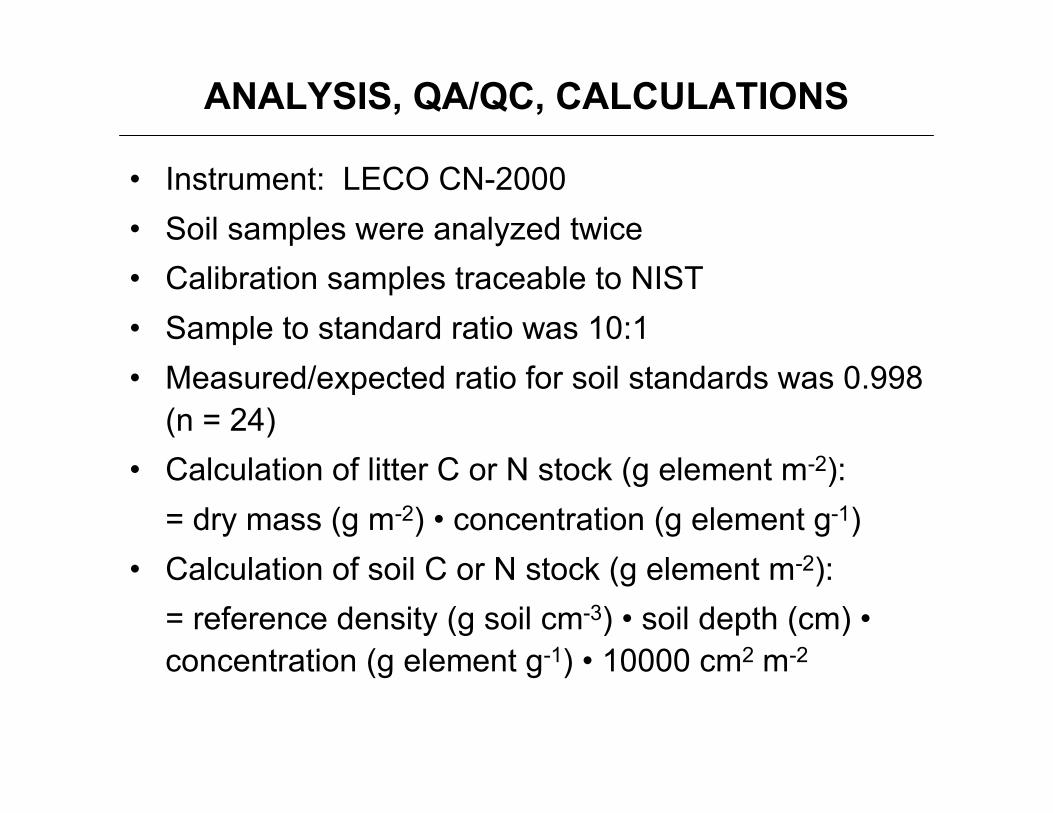
ANALYSIS, QA/QC, CALCULATIONS
• Instrument: LECO CN-2000
• Soil samples were analyzed twice
• Calibration samples traceable to NIST
• Sample to standard ratio was 10:1
• Measured/expected ratio for soil standards was 0.998(n = 24)
• Calculation of litter C or N stock (g element m-2):
= dry mass (g m-2) • concentration (g element g-1)
• Calculation of soil C or N stock (g element m-2):
= reference density (g soil cm-3) • soil depth (cm) •concentration (g element g-1) • 10000 cm2 m-2

LITTER ADDITIONS
• Composite
litter addition
sample in 2001
(T1) and site
specific data in
2002 (T2)
• N conc. in litter
additions are ≈
0.6%
• C:N ratio in
litter additions
is ≈ 80
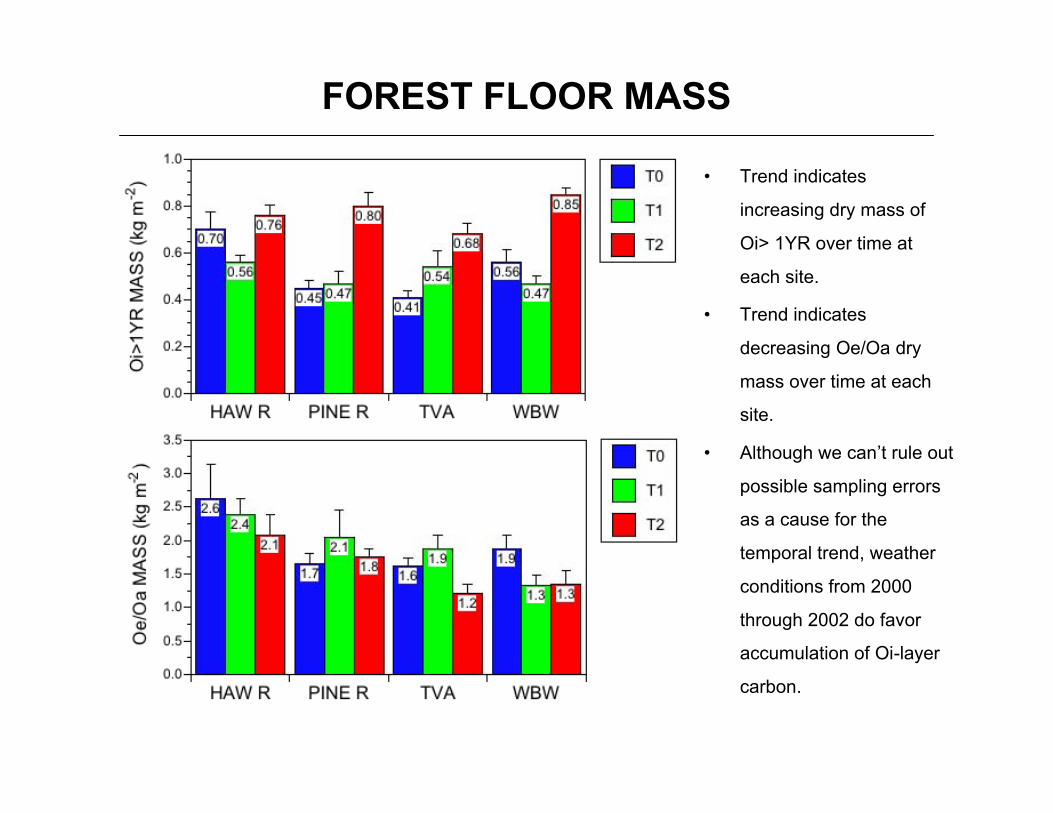
FOREST FLOOR MASS
• Trend indicates
increasing dry mass of
Oi> 1YR over time at
each site.
• Trend indicates
decreasing Oe/Oa dry
mass over time at each
site.
• Although we can’t rule out
possible sampling errors
as a cause for the
temporal trend, weather
conditions from 2000
through 2002 do favor
accumulation of Oi-layer
carbon.
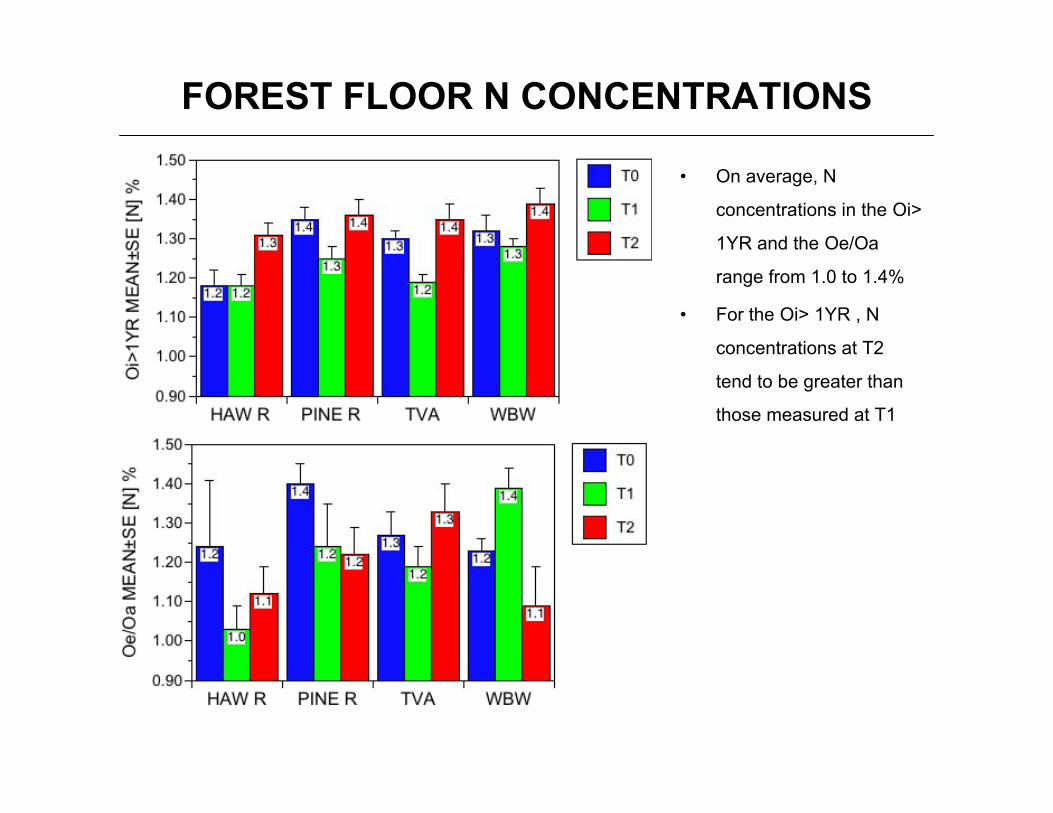
FOREST FLOOR N CONCENTRATIONS
• On average, N
concentrations in the Oi>
1YR and the Oe/Oa
range from 1.0 to 1.4%
• For the Oi> 1YR , N
concentrations at T2
tend to be greater than
those measured at T1
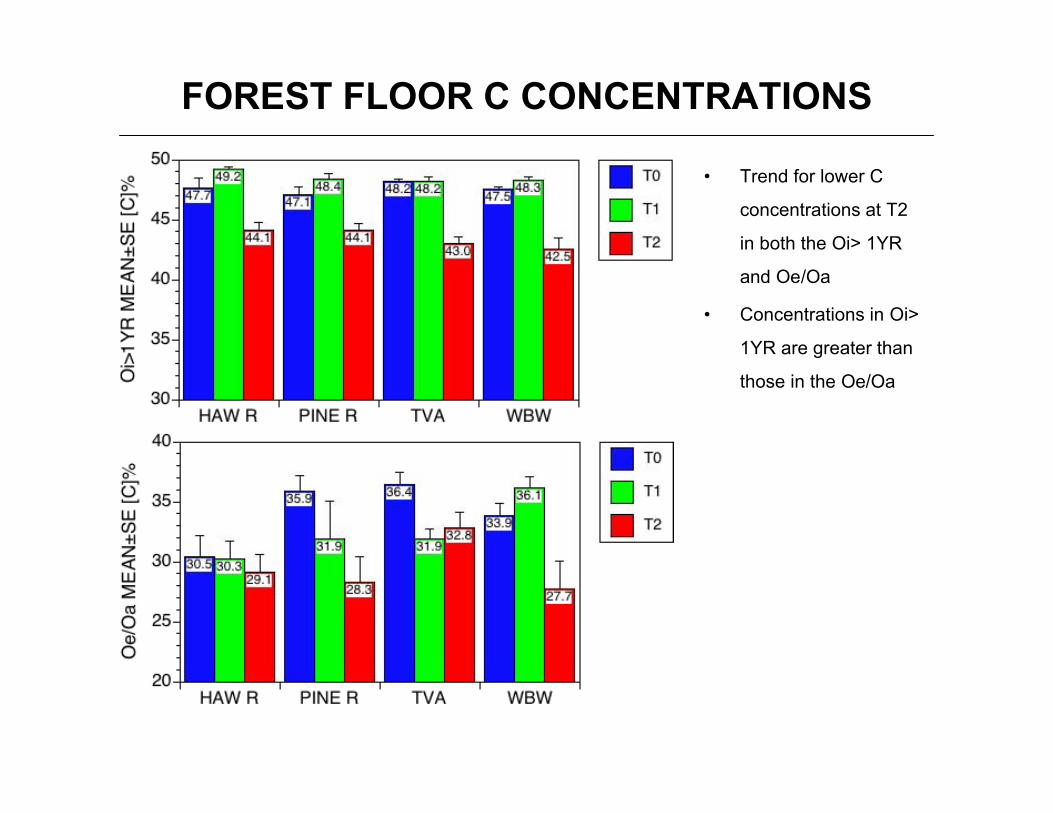
FOREST FLOOR C CONCENTRATIONS
• Trend for lower C
concentrations at T2
in both the Oi> 1YR
and Oe/Oa
• Concentrations in Oi>
1YR are greater than
those in the Oe/Oa
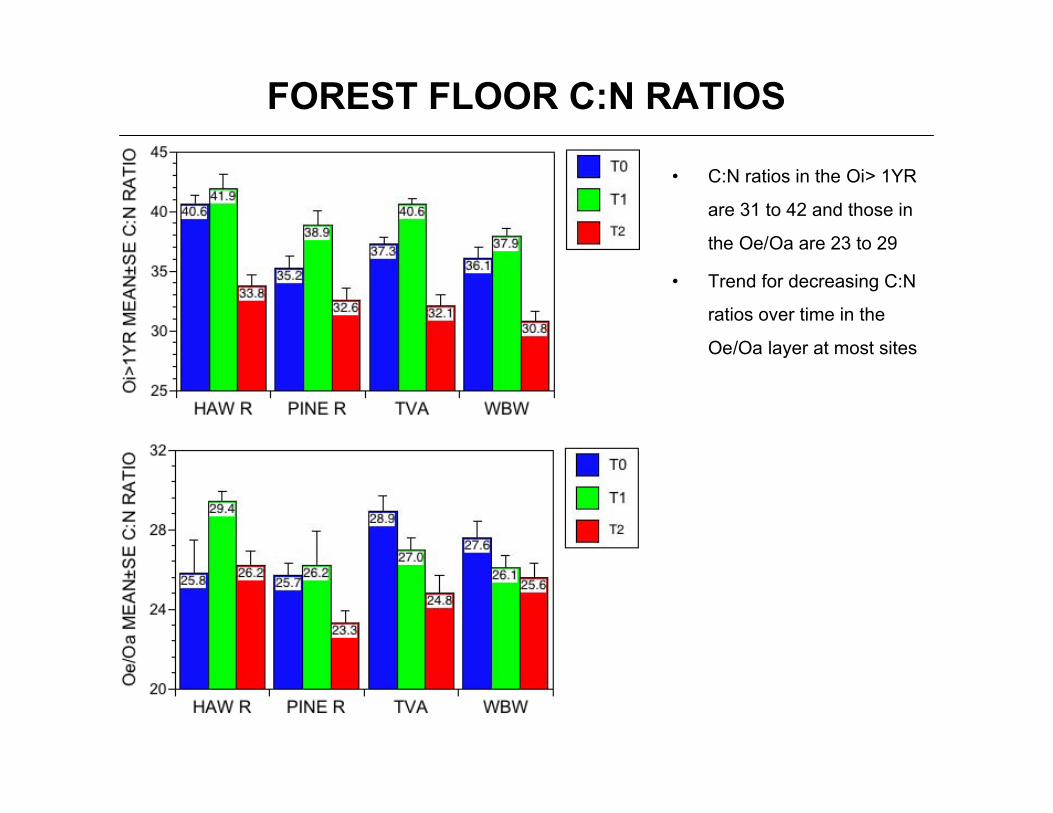
FOREST FLOOR C:N RATIOS
• C:N ratios in the Oi> 1YR
are 31 to 42 and those in
the Oe/Oa are 23 to 29
• Trend for decreasing C:N
ratios over time in the
Oe/Oa layer at most sites
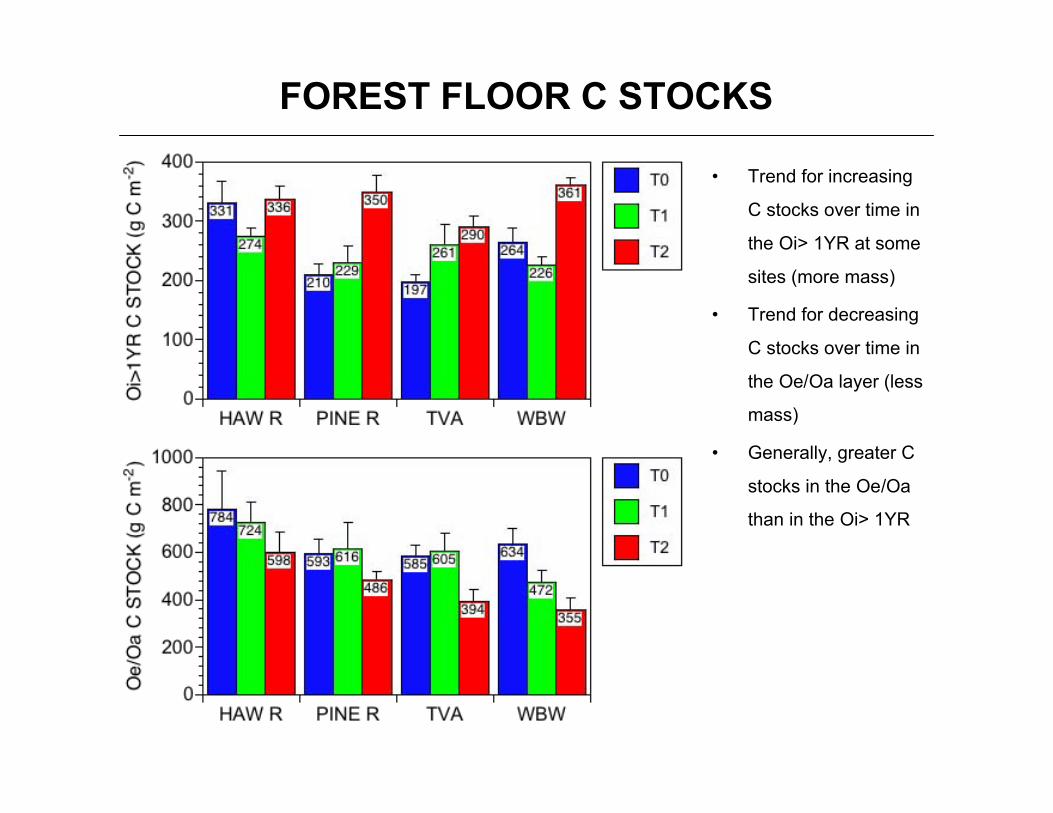
FOREST FLOOR C STOCKS
• Trend for increasing
C stocks over time in
the Oi> 1YR at some
sites (more mass)
• Trend for decreasing
C stocks over time in
the Oe/Oa layer (less
mass)
• Generally, greater C
stocks in the Oe/Oa
than in the Oi> 1YR
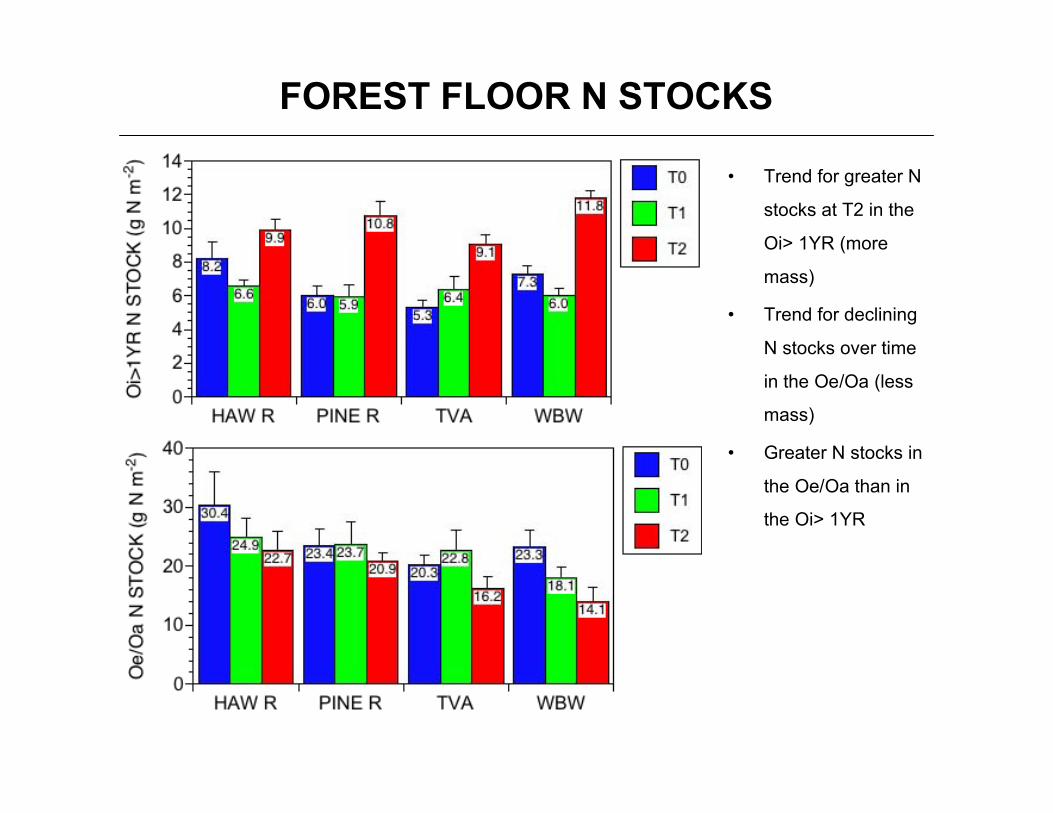
FOREST FLOOR N STOCKS
• Trend for greater N
stocks at T2 in the
Oi> 1YR (more
mass)
• Trend for declining
N stocks over time
in the Oe/Oa (less
mass)
• Greater N stocks in
the Oe/Oa than in
the Oi> 1YR
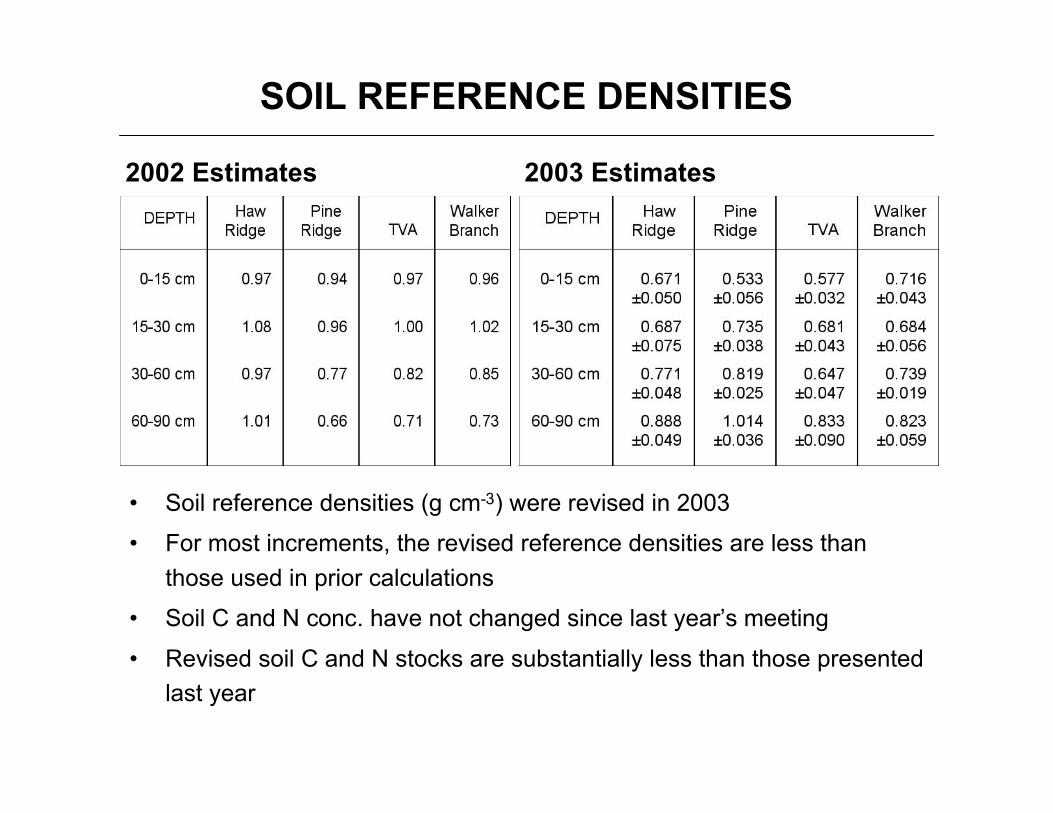
SOIL REFERENCE DENSITIES
• Soil reference densities (g cm-3) were revised in 2003
• For most increments, the revised reference densities are less than
those used in prior calculations
• Soil C and N conc. have not changed since last year’s meeting
• Revised soil C and N stocks are substantially less than those presented
last year
2002 Estimates 2003 Estimates
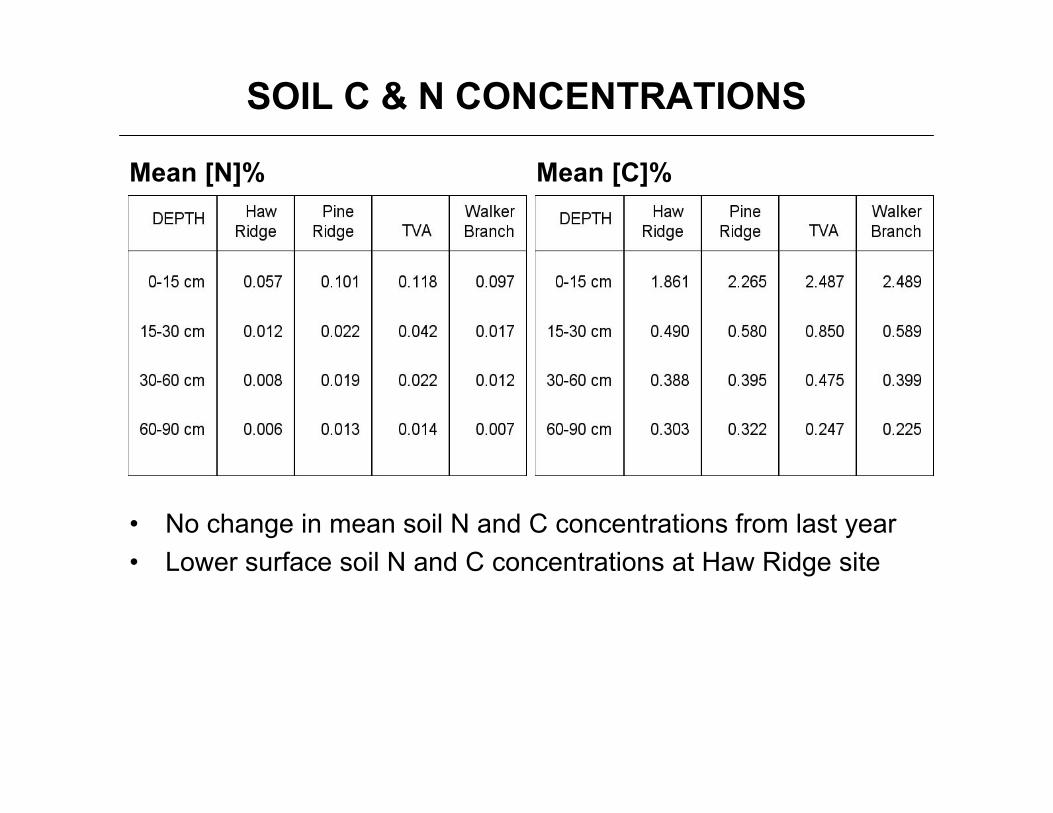
SOIL C & N CONCENTRATIONS
• No change in mean soil N and C concentrations from last year
• Lower surface soil N and C concentrations at Haw Ridge site
Mean [N]% Mean [C]%
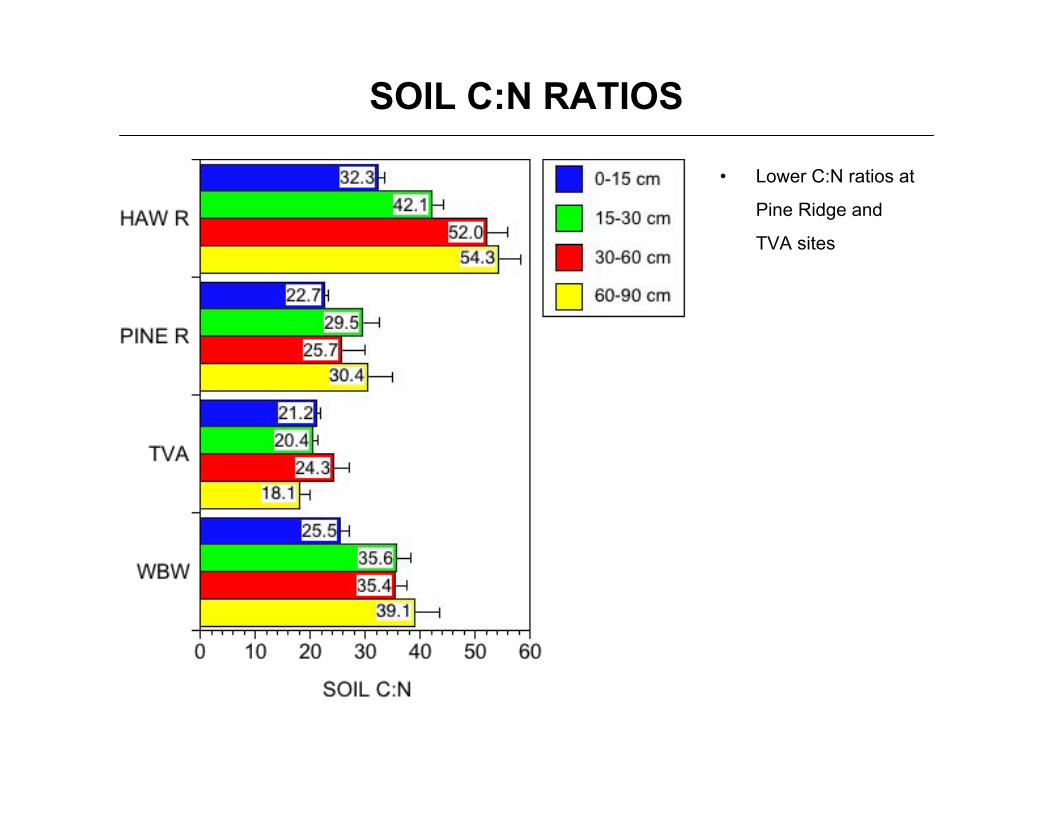
SOIL C:N RATIOS
• Lower C:N ratios at
Pine Ridge and
TVA sites
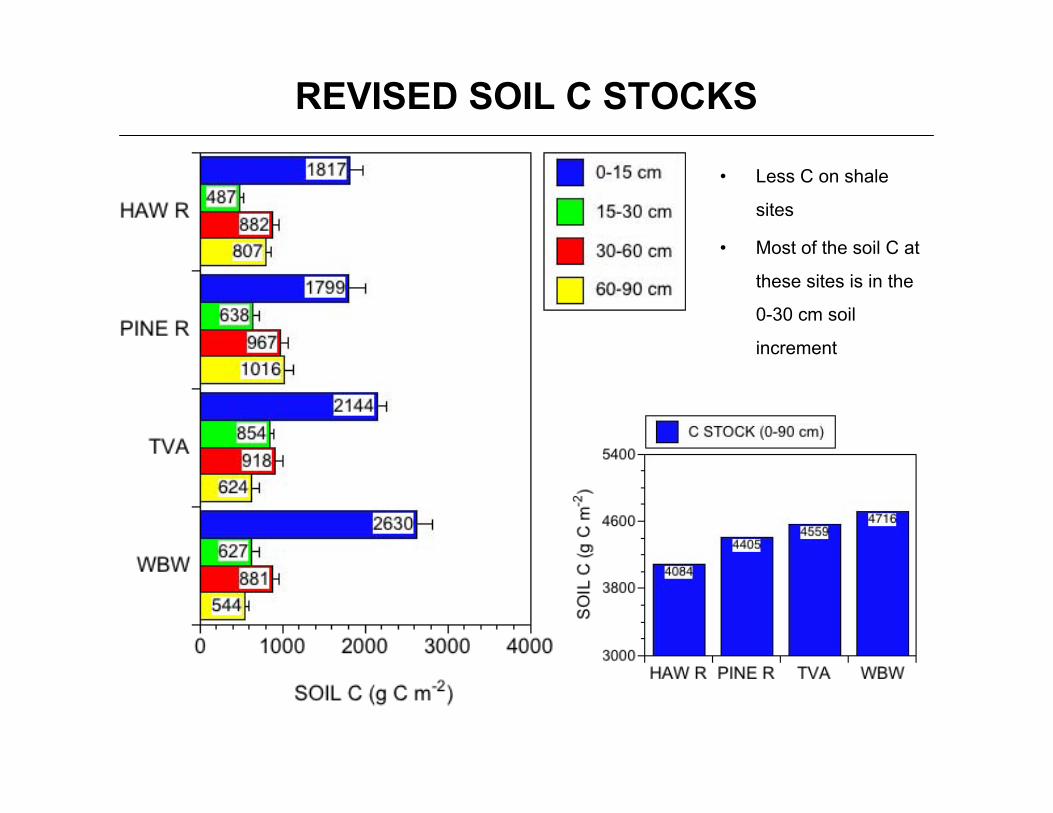
REVISED SOIL C STOCKS
• Less C on shale
sites
• Most of the soil C at
these sites is in the
0-30 cm soil
increment
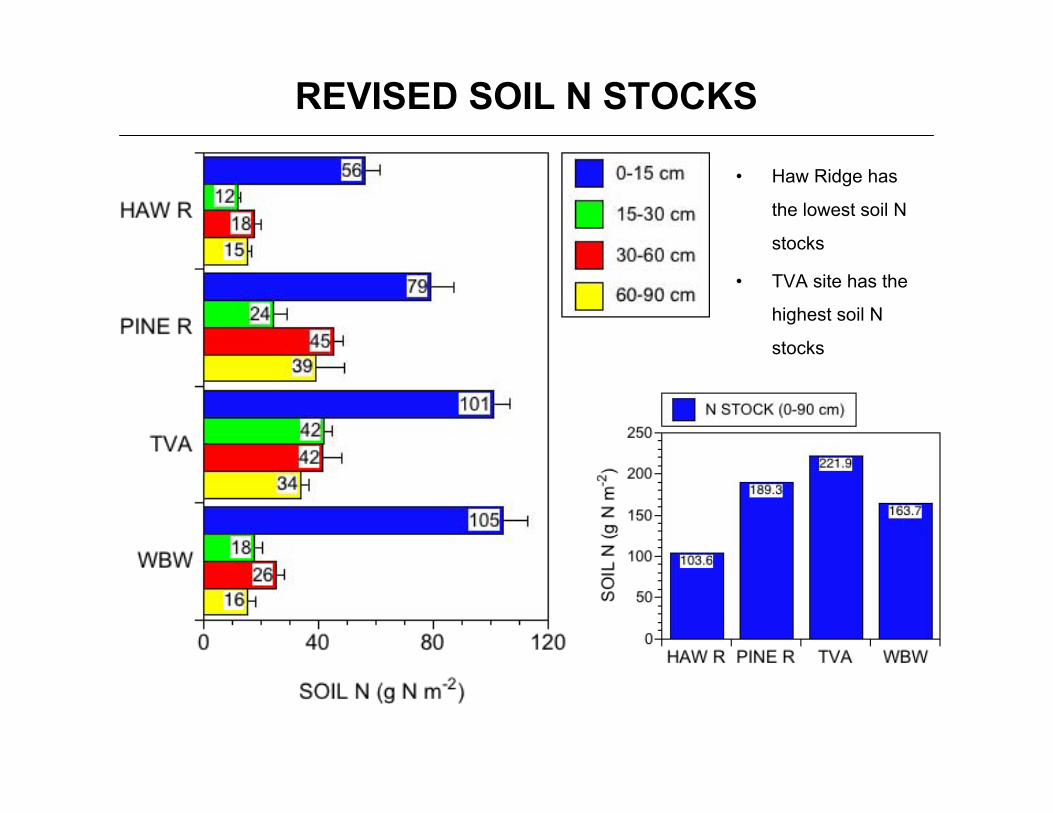
REVISED SOIL N STOCKS
• Haw Ridge has
the lowest soil N
stocks
• TVA site has the
highest soil N
stocks
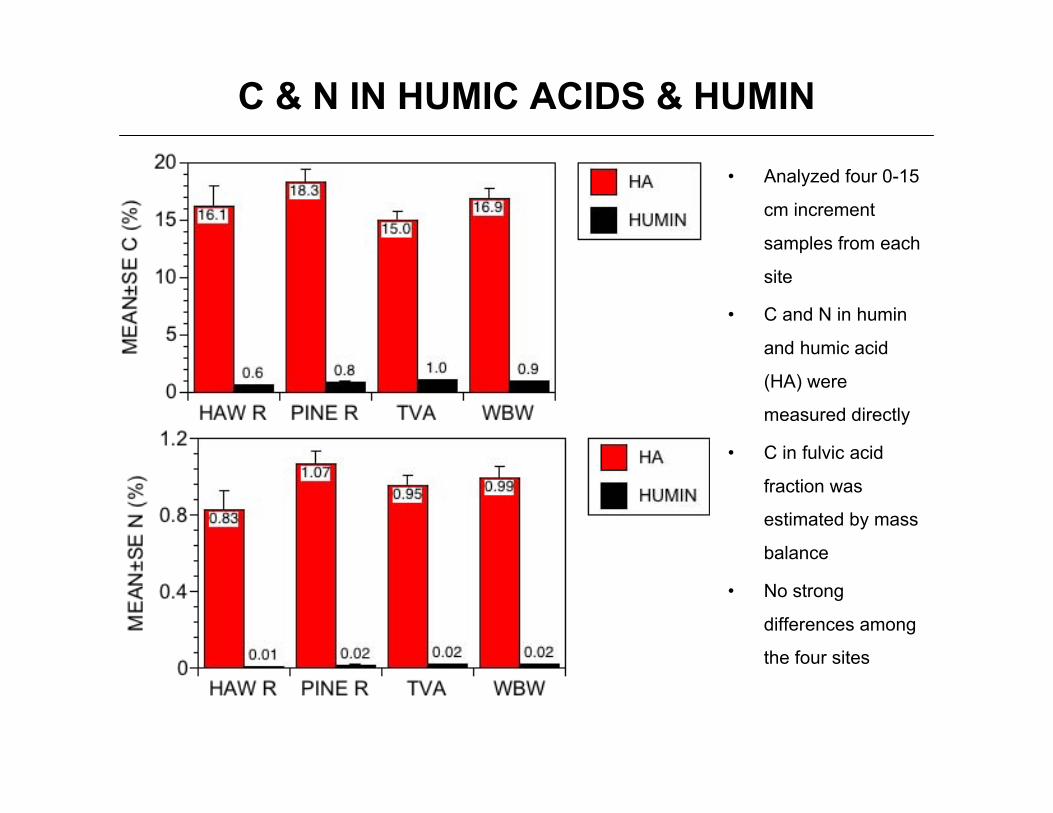
C & N IN HUMIC ACIDS & HUMIN
• Analyzed four 0-15
cm increment
samples from each
site
• C and N in humin
and humic acid
(HA) were
measured directly
• C in fulvic acid
fraction was
estimated by mass
balance
• No strong
differences among
the four sites

HUMIC ACID EXTRACTIONS
• High percentage of
soil C at all sites
was associated
with the fulvic acid
fraction
• About 25% of the
surface soil C was
associated with
humic acids
CONCLUSIONS
• Soil C and N stocks have been revised downward since last year’s
meeting because of revised soil densities
• Post revised calculations on the EBIS web site for all investigators
• Haw Ridge has the lowest soil C and N stocks
• Trend for increasing C and N stocks in the Oi>1YR and decreasing
stocks in the Oe/Oa (associated with changes in dry mass over time)
• Most (75-80%) of the surface (0-15 cm) soil C at each site is associated
with fulvic acid and humin fractions (≈25% in the humic acid fraction)

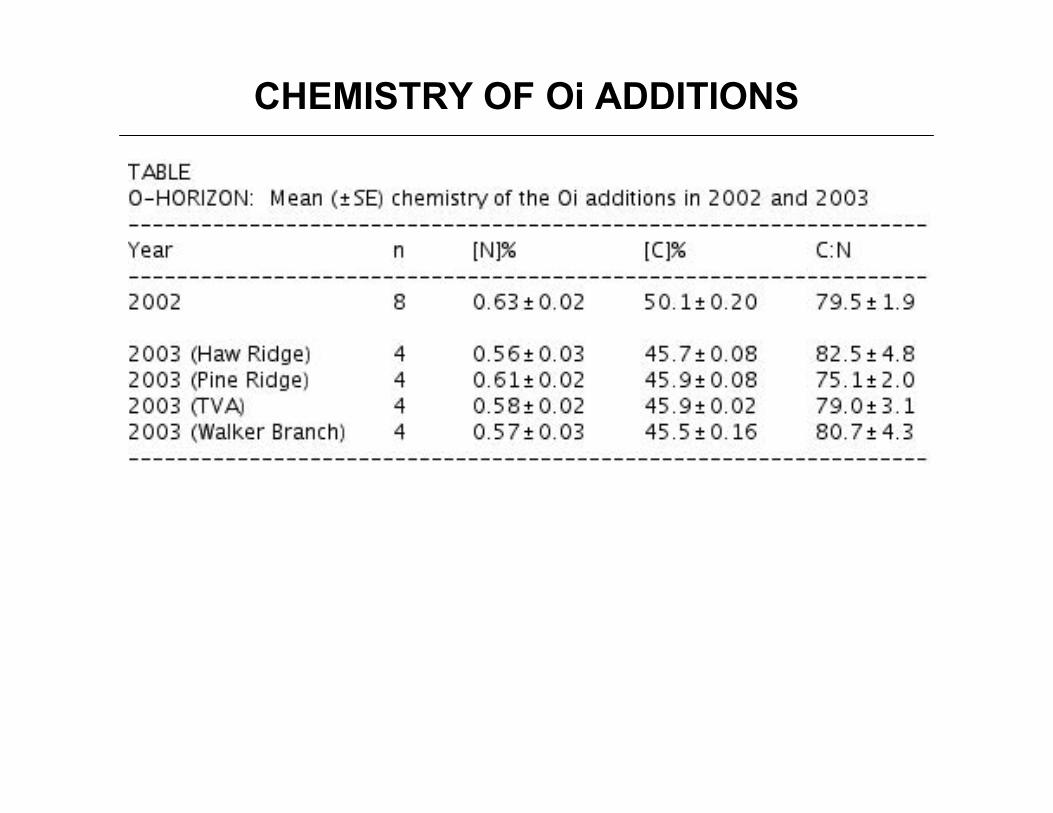
CHEMISTRY OF Oi ADDITIONS

O-HORIZON DRY MASS
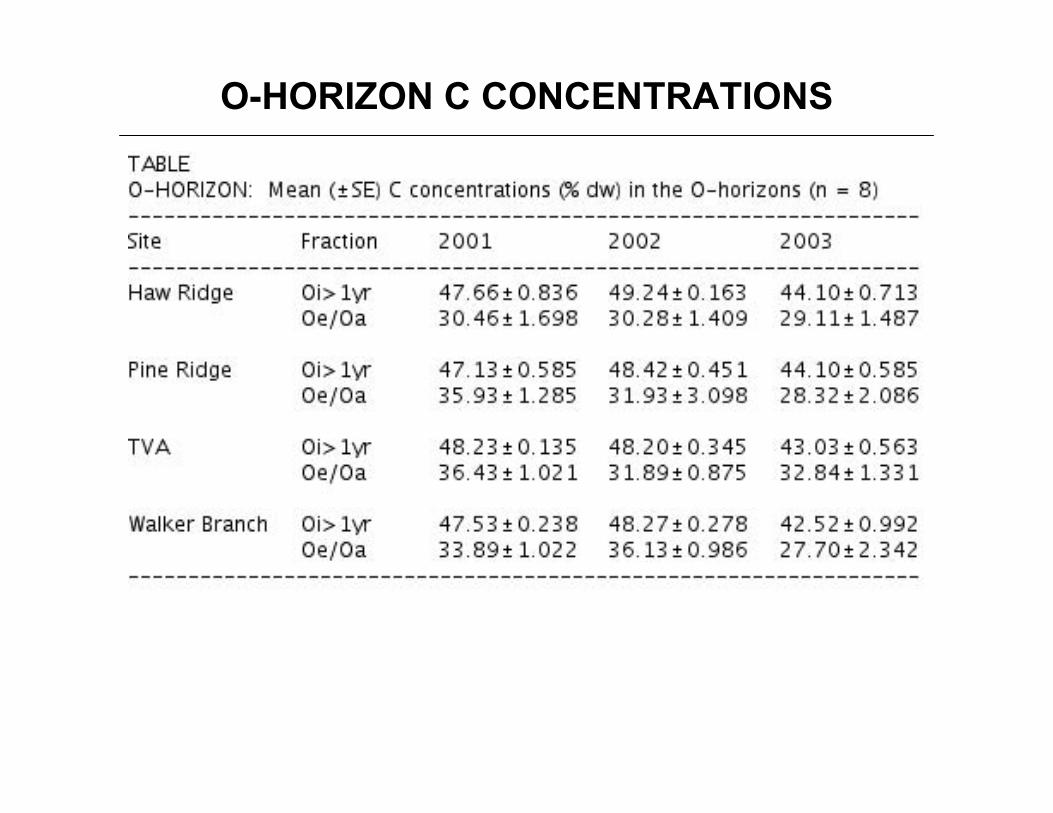
O-HORIZON C CONCENTRATIONS
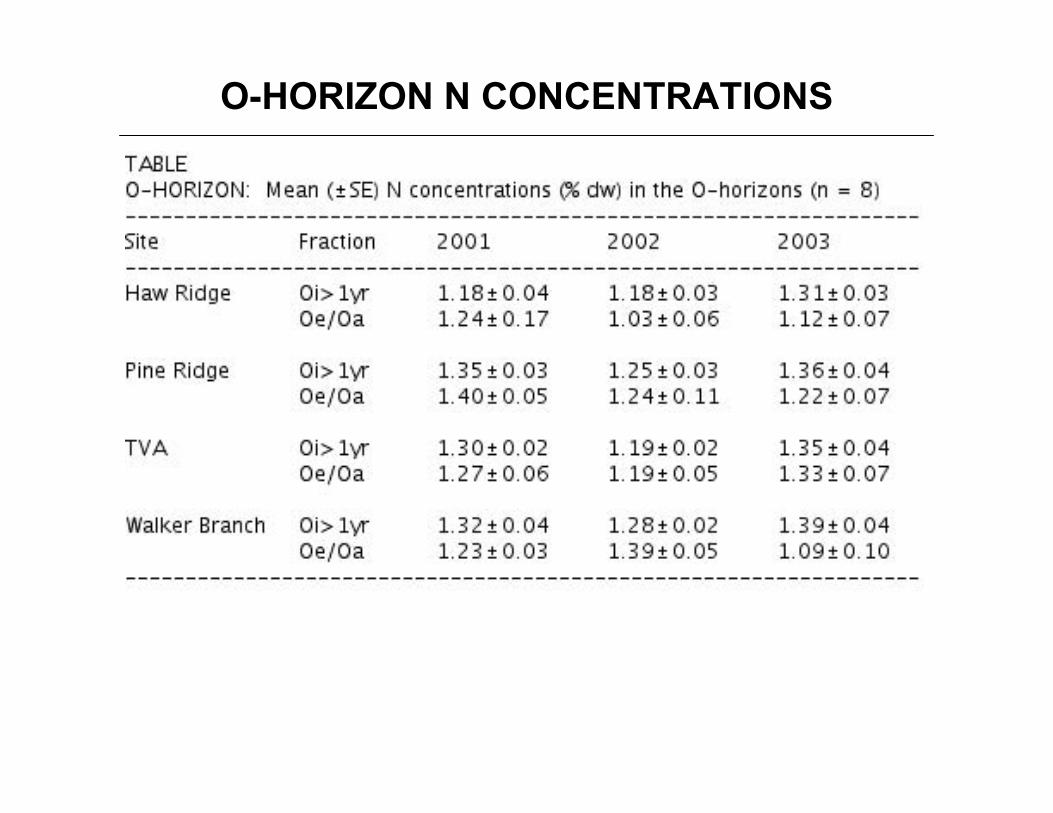
O-HORIZON N CONCENTRATIONS
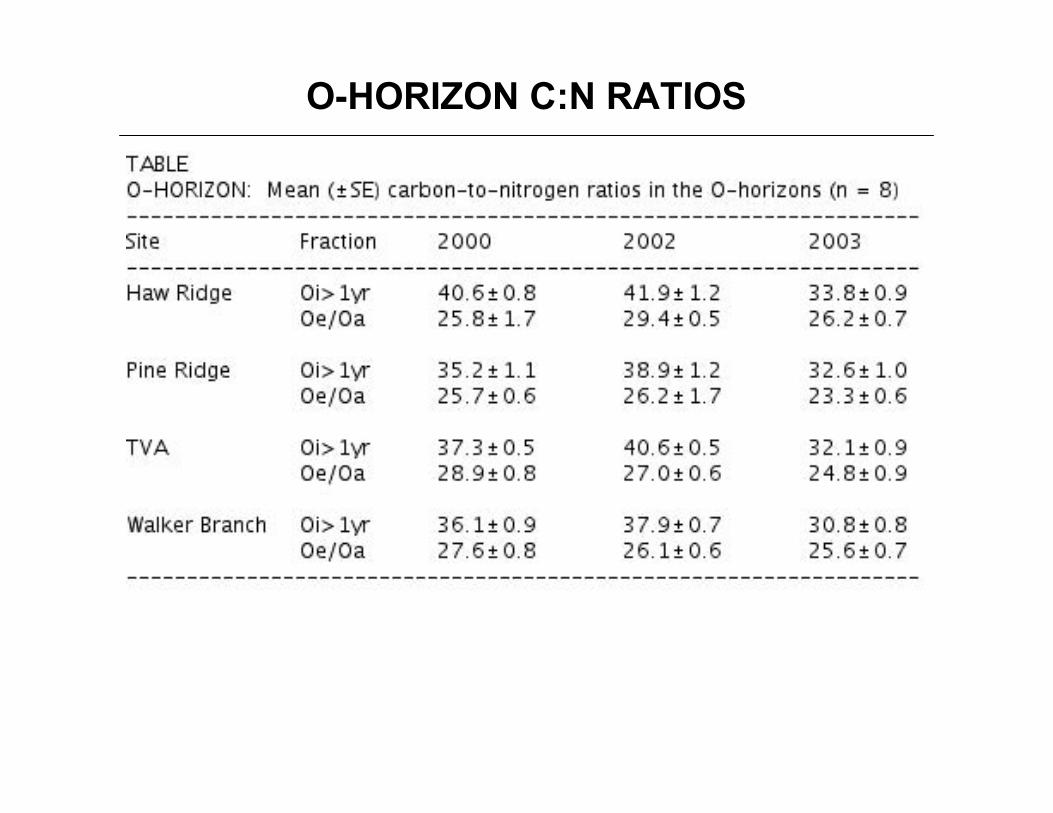
O-HORIZON C:N RATIOS

O-HORIZON C & N STOCKS
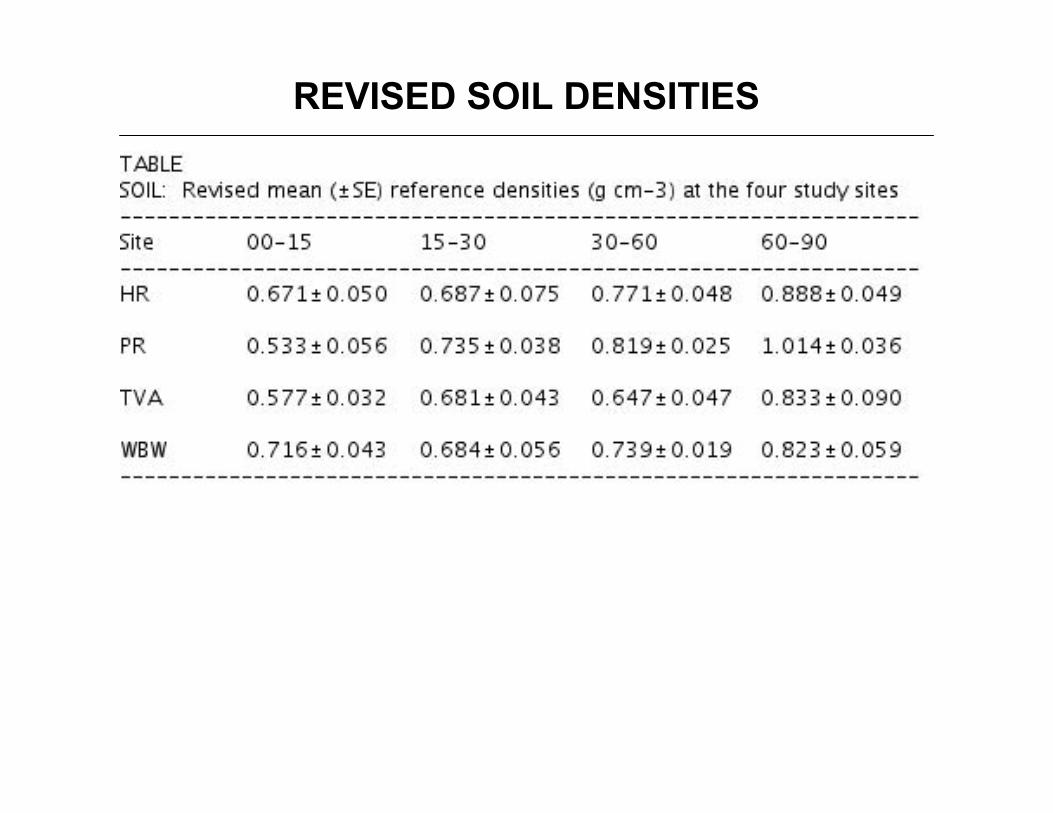
REVISED SOIL DENSITIES

SOIL N & C CONCENTRATIONS
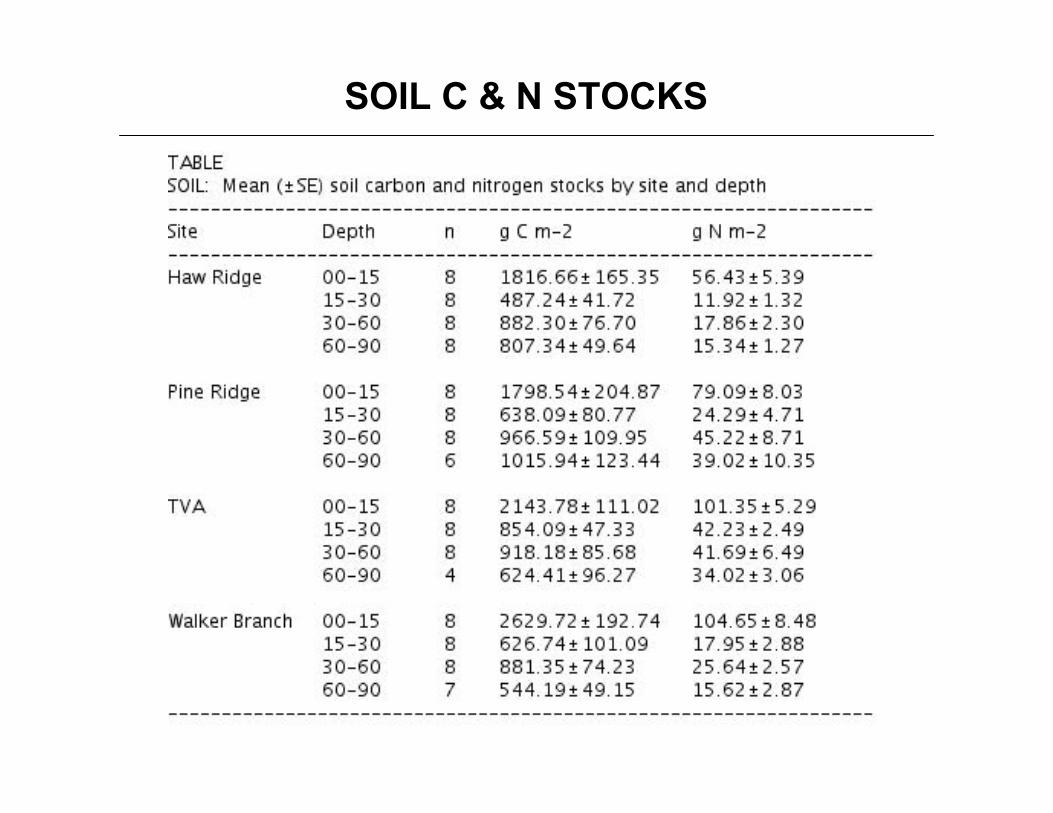
SOIL C & N STOCKS
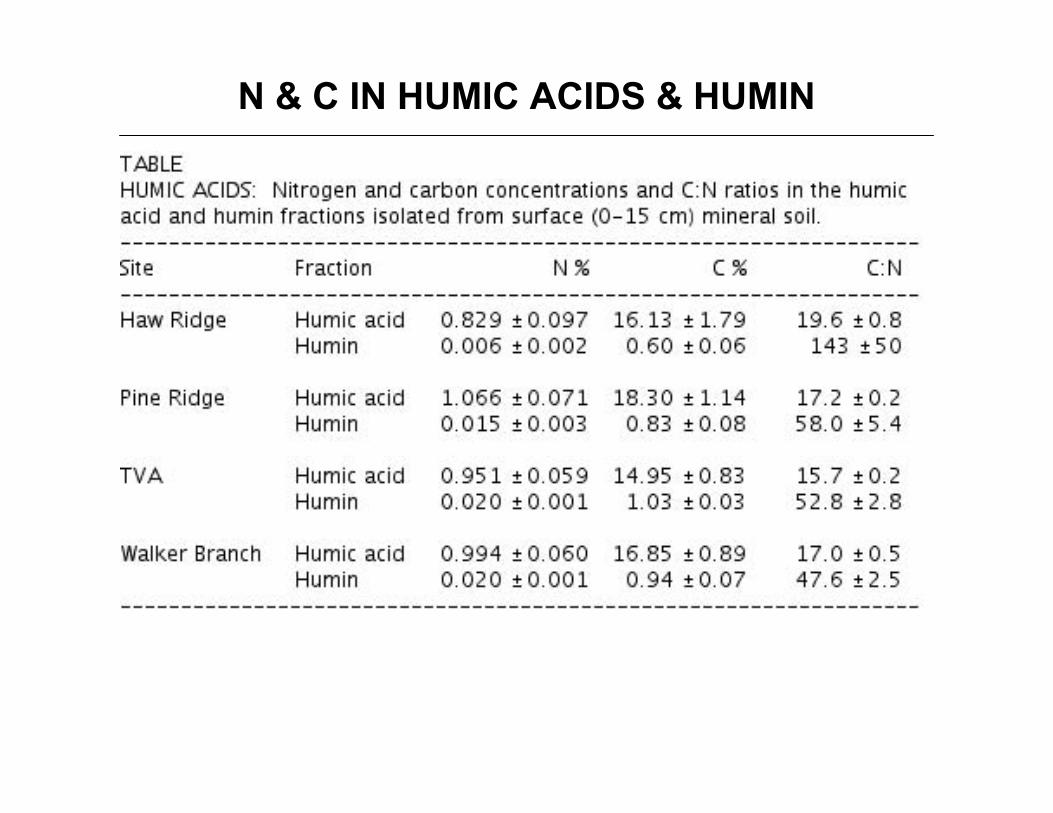
N & C IN HUMIC ACIDS & HUMIN
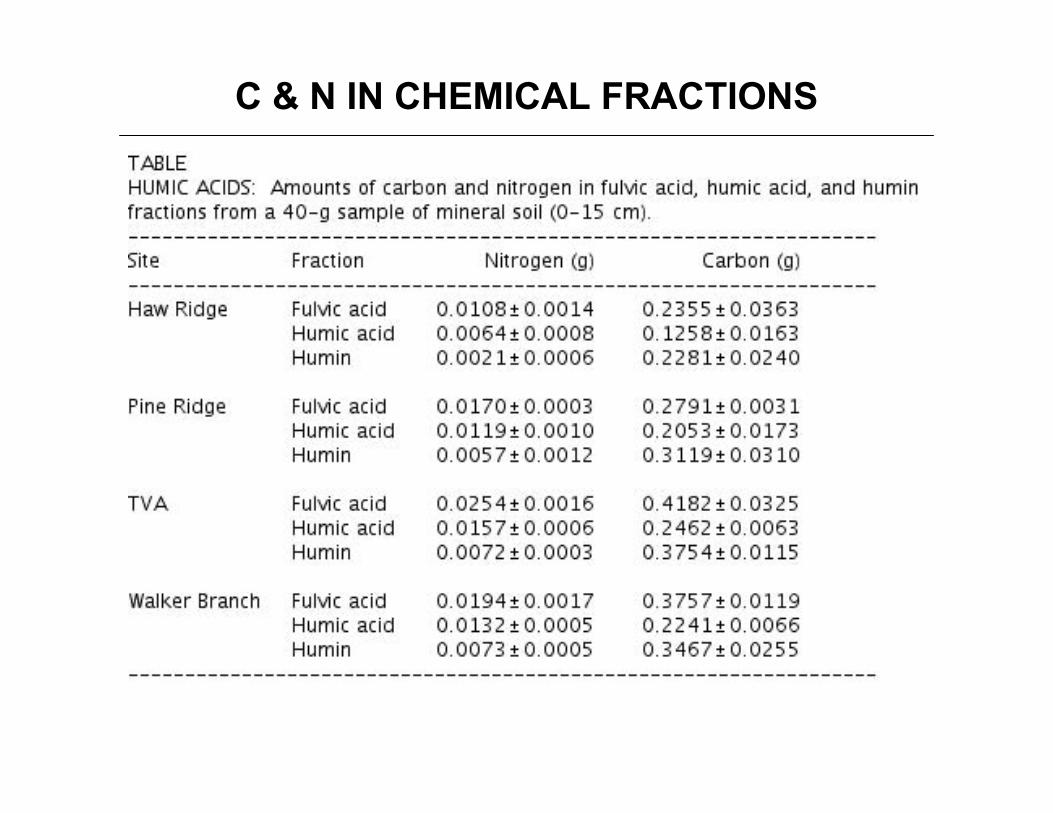
C & N IN CHEMICAL FRACTIONS
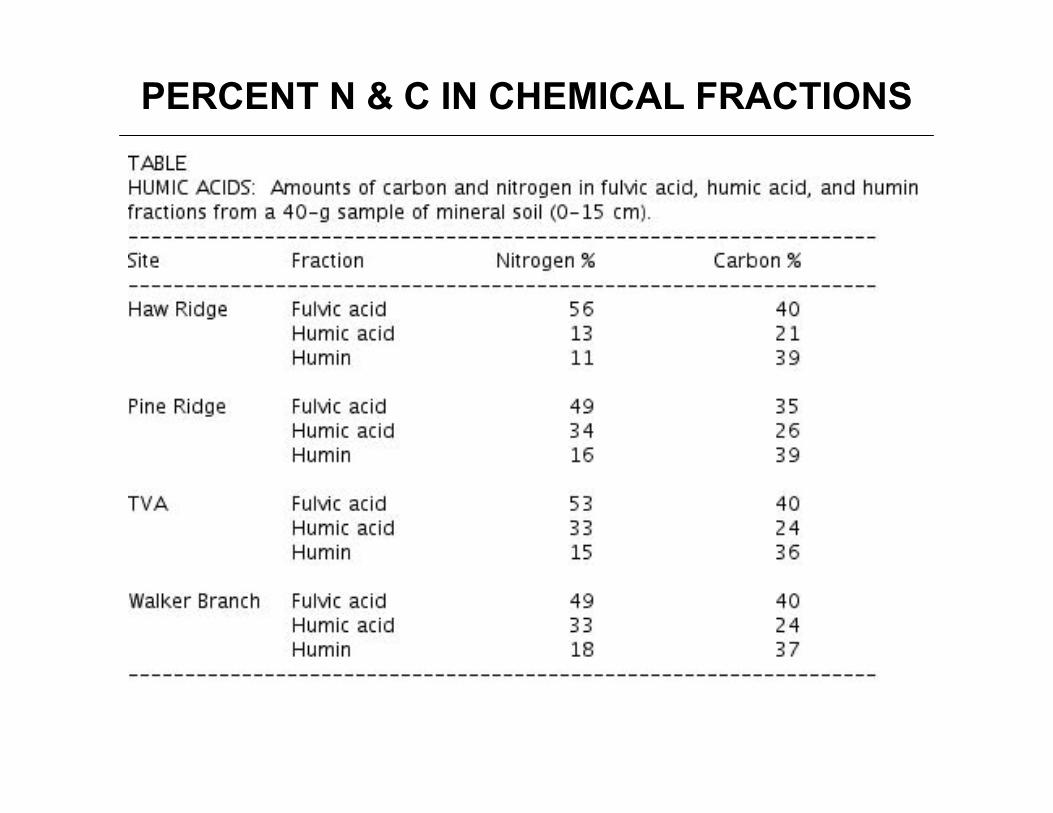
PERCENT N & C IN CHEMICAL FRACTIONS