Embed Size (px)
Citation preview
ECOLOGY AND PRODUCTION OF JUVENILE SPRINGCHINOOK SALMON, ONCORHYNCHUS TSHAWYTSCHA,
IN A EUTROPHIC RESERVOIRl,2
DUANE L. HIGLEY AND CARL E. BOND3
ABSTRACT
Juvenile spring chinook salmon, Oncorhynchus tshawytscha, were reared in a central Oregonreservoir of 7.5 hectare. The reservoir is strongly eutrophic, as shown by its heavy sedimentation, summer stratification, and cheinical qualities (total dissolved solids over 200 ppm,total phosphorus to 0.4 ppm, and summer pH between 9 and 10). Surface water temperaturesranged from 3° to 29°C. Salmon were apparently confined to the upper 3 m during thesummer because of low dissolved oxygen below this depth. In 1961, epilimnion conditionsof high pH, high temperatures, decreasing oxygen concentrations, and possibly algal toxinscaused condition loss and deaths among salmon. Fry planted in 1961 (75,300) and in 1962(150,000) suffered first-summer mortalities in excess of 80%, primarily due to predation byolder salmon. Summer growth was rapid, but dependent on population densities. Cohosalmon, O. kisu(ch, and chinook salmon remaining from a 1959 plant averaged 280 and215 g after 30 mo. The 1961 year class averaged 62 g at 10 mo and 89 g at 22 mo. The 1962year class averaged 22 g at 9 mo. Average condition factor values rose above 1.20 in thesummer. Net production by the 1961 year class was 159 kg/hectare in 1961 and 35.5 kg/hectare in 1962. The 1962 year class produced 170 kg/hectare in 1962. Potential Decemberyield of first-year salmon was 98 kg/hectare in 1961 and 73.5 kg/hectare in 1962. First-yearsalmon ate primarily Entomostraca and chaoborid larvae. Apparently competition from the1962 year class caused the 1961 year class to feed more on littoral and terrestrial forms andto grow and produce less in their second year. Age class 1 and age class 11 salmon weighingfrom 25 to 189 g emigrated via spillway outflows. In 1963, migrations occurred only attemperatures above 10°C; this relationship was not observed in 1962. This reservoir, orothers with similar limnological conditions, cannot be recommended as a rearing site forchinook salmon because of the severe summer conditions.
Reduction in natural rearing sites available toPacific salmon, Ol/corhynchus spp., has led to asearch for ways of augmenting the smolt production of various stream systems in the Pacific Northwest. One possibility is to rear theyoung salmon in impoundments where theypresumably would develop into naturally fed,vigorous smolts. The smolts could then be released into nearby streams suitable for downstream migration. Various pond, lake, andestuarial habitats have been utilized as rearing
1 Technical Paper No. 3439, Oregon Agricultural Experimental Station.
2 This research was supported by United States Department of the Interior contracts 14-17-0001-374 and 14-170001-544.
3 Department of Fisheries and Wildlife, Oregon StateUniversity, Corvallis, OR 97331.
Manuscript accepted February 1973.FISHERY BULLETIN: VOL. 71. NO.3, 1973
impoundments. This paper describes the resultsof the rearing of chinook salmon, O. tshawytscha(Walbaum), of the spring race in Happy :ValleyReservoir, a eutrophic impoundment locatedon the Warm Springs Indian Reservation incentral Oregon. The research correlated reservoir limnology with the growth, survival, foodhabits, and migratorial tendencies of salmonplanted in the reservoir. The project period wasFebruary 1961 to June 1963.
The reservoir was the site of an earlier studyon the survival and growth of 30,000 coho salmon, O. lcisutch (Walbaum), and 23,000 springchinook salmon, which were planted in January1959. Shelton (pers. comm.) reported that growthwas rapid in both species, coho salmon averaging 41 g and chinook salmon 32 g, after an I8-mo
877
residence. In June 1960, the reservoir wastreated with rotenone in an attempt to removeboth salmon and resident rainbow trout, Salmogainlueri Richardson. Survival of the salmon,to this time, was estimated to have been 90%.
In the present study, the reservoir receivedtwo plantings of spring chinook salmon fry:on 8 February 1961, 75,300 unfed fry at 3,300/kg from the Bureau of Sport Fisheries andWildlife hatchery at Carson, Wash.; and on 22March 1962, 150,000 advanced fry at 2,200/kgfrom the Bureau of Sport Fisheries and WildlifeEagle Creek hatchery at Estacada, Oreg.
A fry planted in 1961 is called a 1961 yearclass fish; it is designated as O-age from February 1961 to February 1962 and as age class Ifrom February 1962 to February 1963, so thatthe Roman numeral corresponds to the numberof winters spent in freshwater life (Roo, 1962).
METHODS AND MATERIALS
A stadia survey and depth sounding provideddata from which a hydrographic map was made.Area and volume were computed from this map.Temperature patterns of the upper strata ofwater were recorded with a maximum-minimumthermometer and constant-recording thermographs. A transistorized thermometer was usedto take vertical temperature series. Light penetration was measured with a Secchi disc.
A Kemmerer water bottle was employed totake water samples in vertical series for pH anddissolved oxygen determinations. The Winklermethod was used for oxygen determinations,and either a color-comparator or portable conductivity meter was used to measure pH.
Other determinations made were total dissolved solids, volatile dissolved solids, totalphosphorus, and methyl orange alkalinity. Thesame water sample sufficed for the first two;after the suspended solids were removed bycentrifugation, the sample was evaporated at60 a C and ashed at 600 a C for these measurements. The phosphorus analyses were conductedby the analytical laboratory of the Departmentof Soils at Oregon State University. A 0.02 Nsulfuric acid solution was used in the titrationfor methyl orange alkalinity.
878
FISHERY BULLETIN: VOL. 71. NO.3
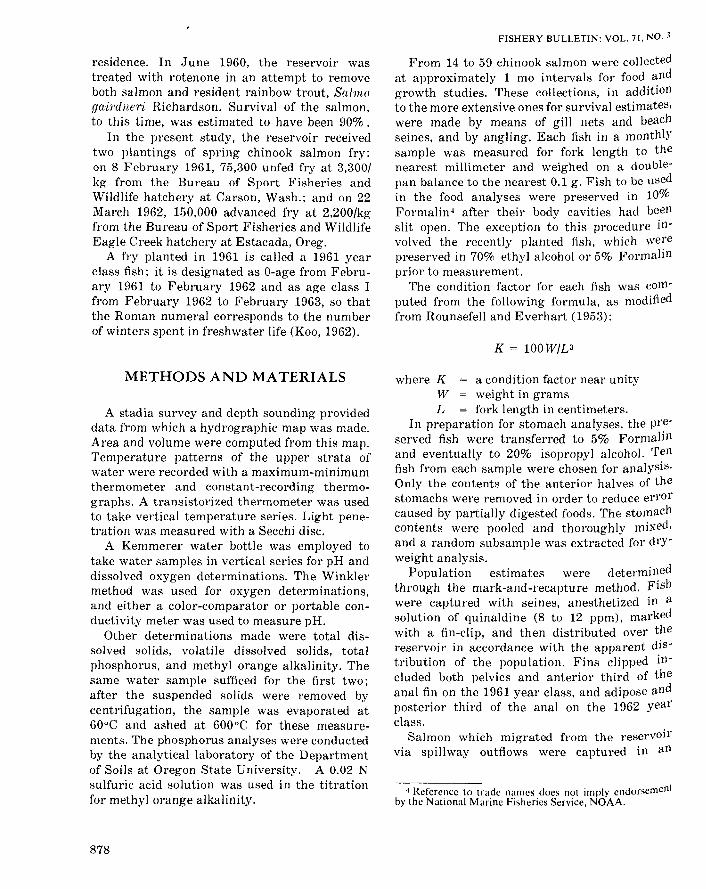
From 14 to 59 chinook salmon were collectedat approximately 1 mo intervals for food andgrowth studies. These collections, in additionto the more extensive ones for survival estimates,were made by means of gill nets and beachseines, and by angling. Each fish in a monthlysample was measured for fork length to thenearest millimeter and weighed on a doublepan balance to the nearest 0.1 g. Fish to be usedin the food analyses were preserved in 10%Formalin 4 after their body cavities had beenslit open. The exception to this procedure involved the recently planted fish, which werepreserved in 70% ethyl alcohol or 5% Formalinprior to measurement.
The condition factor for each fish was computed from the following formula, as modifiedfrom Rounsefell and Everhart (1953):
K = 100W/£3
where K a condition factor near unityW weight in gramsL fork length in centimeters.
In preparation for stomach analyses, the preserved fish were transferred to 5% Formalinand eventually to 20% isopropyl alcohol. Tenfish from each sample were chosen for analysis.Only the contents of the anterior halves of thestomachs were removed in order to reduce errorcaused by partially digested foods. The stomachcontents were pooled and thoroughly mixed,and a random subsample was extracted for dryweight analysis.
Population estimates were determinedthrough the mark-and-recapture method. Fishwere captured with seines, anesthetized in asolution of quinaldine (8 to 12 ppm), markedwith a fin-clip, and then distributed over thereservoir in accordance with the apparent distribution of the population. Fins clipped included both pelvics and anterior third of theanal fin on the 1961 year class, and adipose andposterior third of the anal on the 1962 yearclass.
Salmon which migrated from the reservoirvia spillway outflows were captured in an
4 Reference to trade names does not imply endorsementby the National Marine Fisheries Service. NOAA.
HIGLEY and BOND: CHINOOK SALMON IN A RESERVOIR
inclined-plane trap. Screens on the spillwayforced emigrating fish to enter the trap. Afterspill had ceased, additional outflows of 0.071m3/s [2.5 cfs (cubic feet per second)] wereproduced by using a U-shaped iron tube as asiphon. The time or amount of outflow wasotherwise uncontrolled.
Many of the measurements were taken inEnglish units, and these occasionally are presented for clarity.
DESCRIPTION OF RESERVOIR
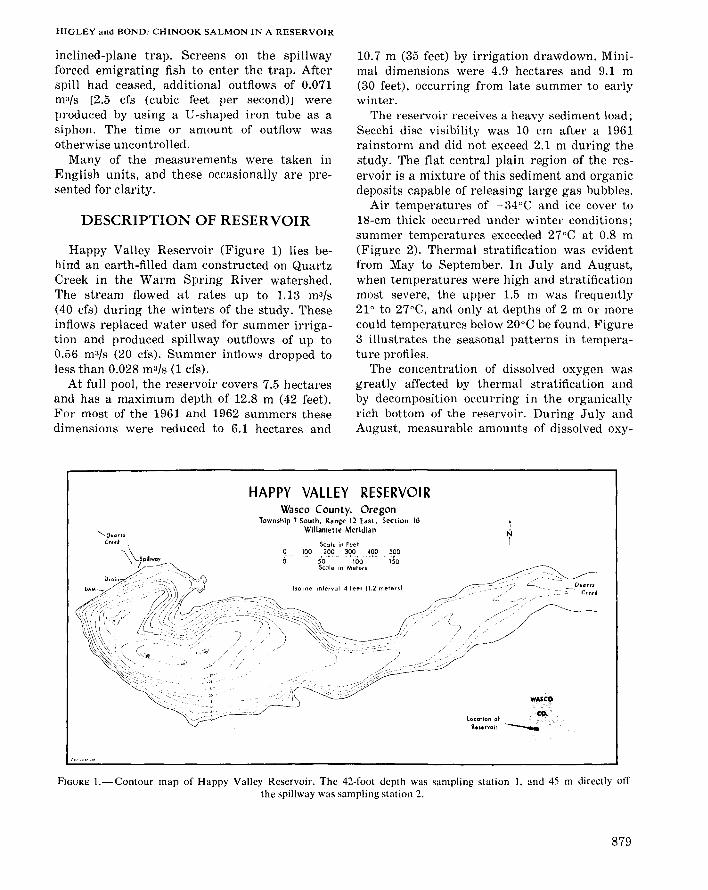
Happy Valley Reservoir (Figure 1) lies behind an earth-filled dam constructed on QuartzCreek in the Warm Spring River watershed.The stream flowed at rates up to 1.13 m3/s(40 cfs) during the winters of the study. Theseinflows replaced water used for summer irrigation and produced spillway outflows of up to0.56 m3/s (20 cfs). Summer inflows dropped toless than 0.028 m3/s (1 cfs).
At full pool, the reservoir covers 7.5 hectaresand has a maximum depth of 12.8 m (42 feet).For most of the 1961 and 1962 summers thesedimensions were reduced to 6.1 hectares and
10.7 m (35 feet) by irrigation drawdown. Minimal dimensions were 4.9 hectares and 9.1 m(30 feet), occurring from late summer to earlywinter.
The reservoir receives a heavy sediment load;Secchi disc visibility was 10 em after a 1961rainstorm and did not exceed 2.1 m during thestudy. The flat central plain region of the reservoir is a mixture of this sediment and organicdeposits capable of releasing large gas bubbles.
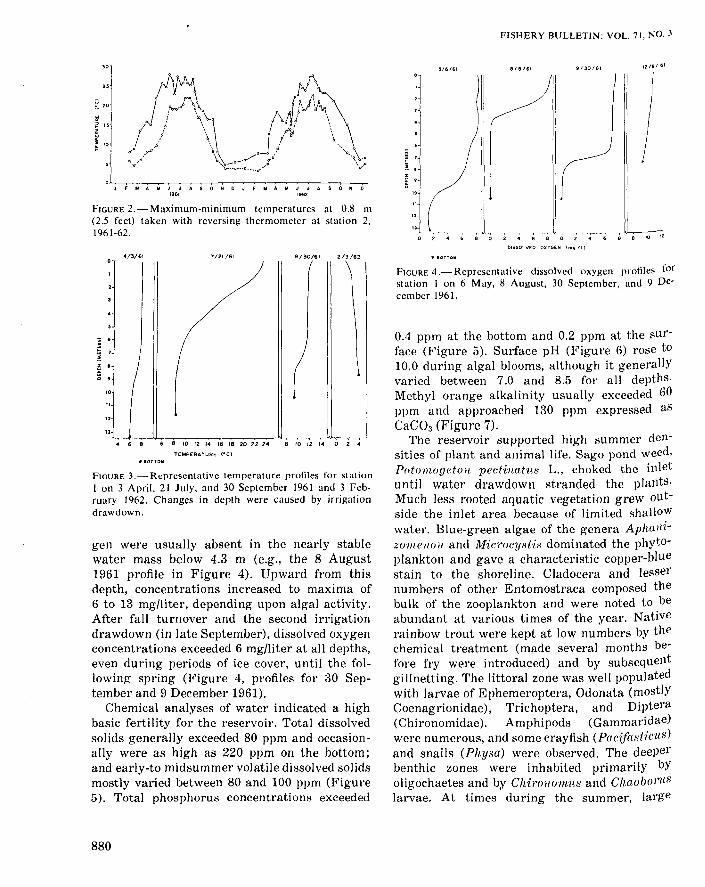
Air temperatures of -34°C and ice cover to18-cm thick occurred under winter conditions;summer temperatures exceeded 27°C at 0.8 m(Figure 2). Thermal stratification was evidentfrom May to September. In July and August,when temperatures were high and stratificationmost severe, the upper 1.5 m was frequently21 ° to 27°C, and only at depths of 2 m or morecould temperatures below 20°C be found. Figure3 illustrates the seasonal patterns in temperature profiles.
The concentration of dissolved oxygen wasgreatly affected by thermal stratification andby decomposition occurring in the organicallyrich bottom of the reservoir. During July andAugust, measurable amounts of dissolved oxy-
HAPPY VAllEY RESERVOI RWasco County, Oregon
Township 7 South. Range 12 East, Section 16Willamette Meridian
Scale in Feet~ 100 200 300 ,00 500o . 5'rt'-'~ . 'l()O _.b_ 1-50
Scale in Meters
holine interval 4
location ofR••• rvoir
~I
FIGURE I.-Contour map of Happy Valley Reservoir. The 42-foot depth was sampling station 1, and 45 m directly offthe spillway was sampling station 2.
879
FISHERY BULLETIN: VOL. 71, NO.3
JFIolAIolJJASONDJFMAMJJASONO1961 1962
~/6 161
J9/30/61 12/9 /6 /
FIGURE 2.-Maximum-minimum temperatures at 0.8 m(2.5 feet) taken with reversing thermometer at station 2,1961-62. o 2 .. 6 8 0 2 .. 6 B 0 2 .. 6 8 e 10 12
DISSOLVEO OXYGEN tm<jJlIl
"'/3/6/ 7/2//61 9/30/61 2/3/62
FIGURE 4.-Representative dissolved oxygen profiles forstation 1 on 6 May, 8 August, 30 September, and 9 December 1961.
E 6
= ,!% •
5o •
'0
11
4 6 8 6 8 10 12 '4 /6 '8 20 2Z 24 6 10 /2 14 0 Z 4
TEMPERATURE I'"C)• lOTTO"
FIGURE 3.-Representative temperature profiles for stationI on 3 April, 21 July, and 30 September 1961 and 3 February 1962. Changes in depth were caused by irrigationdrawdown.
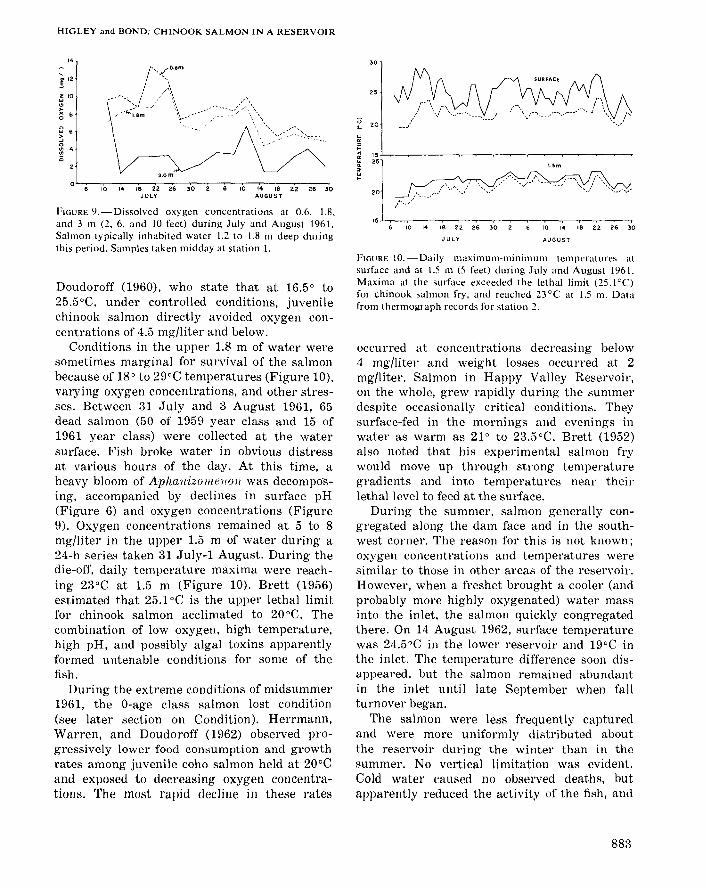
gen were usually absent in the nearly stablewater mass below 4.3 m (e.g., the 8 August1961 profile in Figure 4). Upward from thisdepth, concentrations increased to maxima of6 to 13 mg/liter, depending upon algal activity.After fall turnover and the second irrigationdrawdown (in late September), dissolved oxygenconcentrations exceeded 6 mg/liter at all depths,even during periods of ice cover, until the following spring (Figure 4, profiles for 30 September and 9 December 1961),
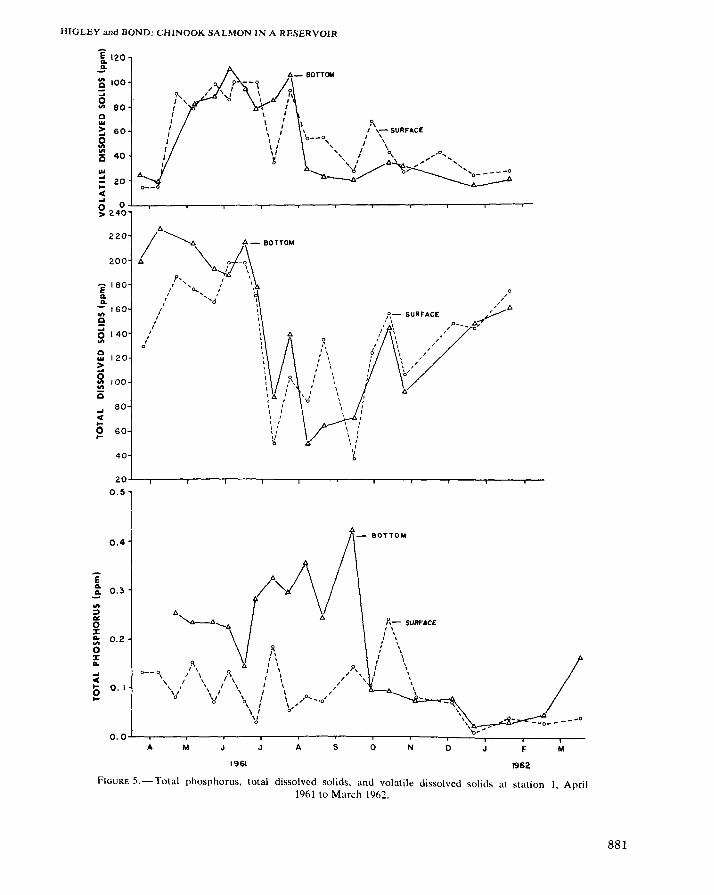
Chemical analyses of water indicated a highbasic fertility for the reservoir. Total dissolvedsolids generally exceeded 80 ppm and occasionally were as high as 220 ppm on the bottom;and early-to midsummer volatile dissolved solidsmostly varied between 80 and 100 ppm (Figure5). Total phosphorus concentrations exceeded
880
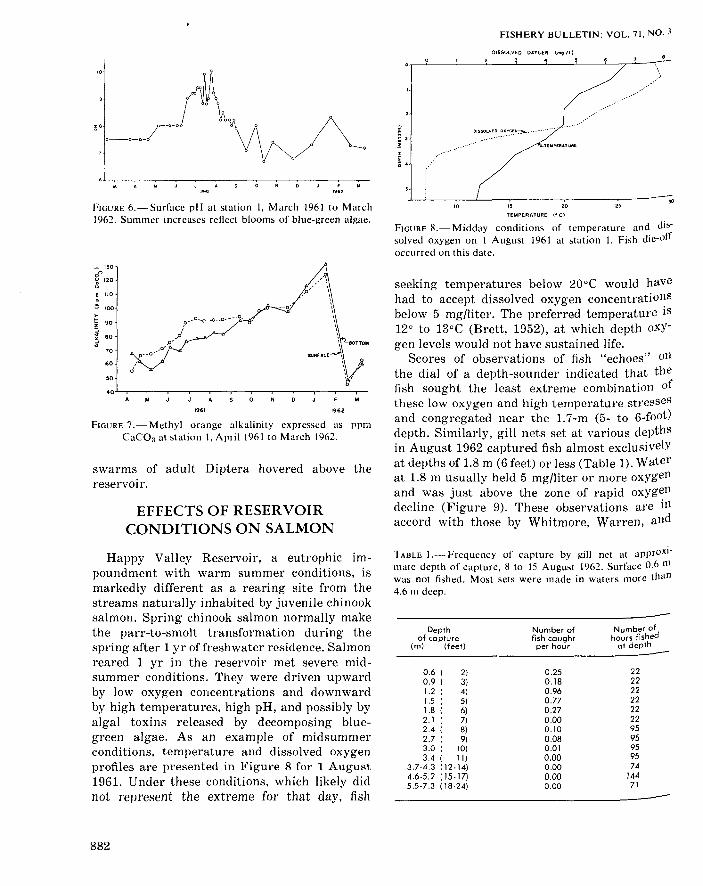
0.4 ppm at the bottom and 0.2 ppm at the surface (Figure 5). Surface pH (Figure 6) rose to10.0 during algal blooms, although it generallyvaried between 7.0 and 8.5 for all depths.Methyl orange alkalinity usually exceeded 60ppm and approached 130 ppm expressed asCaCO:! (Figure 7).
The reservoir supported high summer densities of plant and animal life. Sago pond weed,Pototnogeton pect-inatus L., choked the inletuntil water drawdown stranded the plants.Much less rooted aquatic vegetation grew outside the inlet area because of limited shallOWwater. Blue-green algae of the genera AphallizomellOiI and M'ic1'ocystis dominated the phytoplankton and gave a characteristic copper-bluestain to the shoreline. Cladocera and lessernumbers of other Entomostraca composed thebulk of the zooplankton and were noted to beabundant at various times of the year. Nativerainbow trout were kept at low numbers by thechemical treatment (made several months before fry were introduced) and by subsequentgillnetting. The littoral zone was well populatedwith larvae of Ephemeroptera, Odonata (mostlyCoenagrionidae), Trichoptera, and Diptera(Chironomidae). Amphipods (Gammaridae)were numerous, and some crayfish (Pacijasticus )and snails (Physa) were observed. The deeperbenthic zones were inhabited primarily byoligochaetes and by Chirouornus and Chaob01'Uslarvae. At times during the summer, large
HIGLEY and BOND: CHINOOK SALMON IN A RESERVOIR
,0,-' />
I~- SURFACE ~/,\ ;/f--_t:>;'I ''. 'I. ,, I 'o • ,, .,, .,
I • ,
, ", 0,/>,
\ 'I I~/>I
/
""""-1 ,\ '\ :
K • ,
~ "~
on 100C:::;0on 80cIII> 60...0onon
40isIII />...
20..cl:...g24~
220
200
E 160.....!!' 160onE...
1400on
C120III
>...0
100ononis... 60cl:..0 60..
40
200.5
'[ 120..!!'
- BOTTON
~- SURtACE
"I ,
! \ // \I ,
l "
-~~\~~~~ 0
'''0 .........O.OL--..---.---.-----.----.----r---,---.-----r--=---,-__.--_-.-_
0.4
...cl:e 0.\
E! 0.3
on:l<Ito:J:e; 0.2o:J:...
A M J
1961
J A s o N o F
1962
M
FIGURE 5.-Total phosphorus. total dissolved solids. and volatile dissolved solids at station I, April1961 to March 1962.
881
FISHERY BULLETIN: VOL. 71, NO.3
DISSOLVED OXYGEN (m; II), .
DISSOLYED O)(YGE~::'oL.' ••••- •••• -.,-_... -
......... --
,1962
FIGURE 8.-Midday conditions of temperature and dissolved oxygen on I August 1961 at station 1. Fish die-offoccurred on this date.
FIGURE 6.-Surface pH at station I, March 1961 to March1962. Summer increases reflect blooms of blue-green algae.
10 15 20
TEMPERATURE (. C) "
FIGURE 7.- Methyl orange alkalinity expressed as ppmCaC03 at station I, April 1961 to March 1962.
swarms of adult Diptera hovered above thereservoir.
EFFECTS OF RESERVOIRCONDITIONS ON SALMON
seeking temperatures below 20°C would havehad to accept dissolved oxygen concentrationsbelow 5 mg/liter. The preferred temperature is12° to 13°C (Brett, 1952), at which depth oxygen levels would not have sustained life.
Scores of observations of fish "echoes" onthe dial of a depth-sounder indicated that thefish sought the least extreme combination ofthese low oxygen and high temperature stressesand congregated near the 1.7-m (5- to 6-foot )depth. Similarly, gill nets set at various depthsin August 1962 captured fish almost exclusivelYat depths of 1.8 m (6 feet) or less (Table 1). Waterat 1.8 m usually held 5 mg/liter or more oxygenand was just above the zone of rapid oxygendecline (Figure 9). These observations are inaccord with those by Whitmore, Warren, and
M
19621961
100
60
50
70
>~
~ 90
~ 60
_ 130
o~
~ 120
E 110
Happy Valley Reservoir, a eutrophic impoundment with warm summer conditions, ismarkedly different as a rearing site from thestreams naturally inhabited by juvenile chinooksalmon. Spring chinook salmon normally makethe parr-to-smolt transformation during thespring after 1 yr offreshwater residence. Salmonreared 1 yr in the reservoir met severe midsummer conditions. They were driven upwardby low oxygen concentrations and downwardby high temperatures, high pH, and possibly byalgal toxins released by decomposing bluegreen algae. As an example of midsummerconditions, temperature and dissolved oxygenprofiles are presented in Figure 8 for 1 August1961. Under these conditions, which likely didnot represent the extreme for that day, fish
TABLE 1.- Frequency of capture by gill net at approximatc dcpth of capturc, 8 to 15 August 1962. Surfacc 0.6 mwas not fished. Most scts were made in watcrs more than4.6 m decp.
-Depth Number of Number of
of capture fish caught hours fished(m) (feet) per hour at depth-
0.6 ( 2) 0.25 220.9 ( 3) 0.18 221.2 ( 4) 0.96 221.5 ( 5) 0.77 221.8 ( 6) 0.27 222.1 ( 7) 0.00 222.4 ( 8) 0.10 952.7 ( 9) 0.08 953.0 ( 10) 0.01 953.4 ( II) 0.00 95
3.7-4.3 (12-14) 0.00 744.6-5.2 (15-17) 0.00 1445.5-7.3 (18-24) 0.00 71 -
882
HIGLEY and BOND: CHINOOK SALMON IN A RESERVOIR
"
22 26 30
AUGUST
to 14 1830 2
JULY
10 14 18 22 26
20
30
FIGURE IO.-Daily maximum-minimum temperatures atsurface and at 1.5 m (5 feet) during July and August 1961.Maxima at the surface exceeded the lethal limit (25.1 DC)for chinook salmon fry, and reached 23°C at 1.5 m. Datafrom thermograph records for station 2.
25
occurred at concentrations decreasing below4 mg/liter and weight losses occurred at 2mg/liter. Salmon in Happy Valley Reservoir,on the whole, grew rapidly during the summerdespite occasionally critical conditions. Theysurface-fed in the mornings and evenings inwater as warm as 21° to 23.5°C. Brett (1952)also noted that his experimental salmon frywould move up through strong temperaturegradients and into temperatures near theirlethal level to feed at the smface.
During the summer, salmon generally congregated along the dam face and in the southwest cornel'. The reason for this is not known;oxygen concentrations and temperatures weresimilar to those in other areas of the reservoir.However, when a freshet brought a cooler (andprobably more highly oxygenated) water massinto the inlet, the salmon quickly congregatedthere. On 14 August 1962, surface temperaturewas 24.5°C in the lower reservoir and 19°C inthe inlet. The temperature difference soon disappeared, but the salmon remained abundantin the inlet until late September when fallturnover began.
The salmon were less frequently capturedand were more uniformly distributed aboutthe reservoir during the winter than in thesummer. No vertical limitation was evident.Cold water caused no observed deaths, butapparently reduced the activity of the fish, and
10 14 18 22 26 30AUGUST
10 14 18 22 26 30 2JULY
o'" 6~ooJ> •oJ>C
FIGURE 9.-Dissolved oxygen concentrations at 0.6, 1.8,and 3 m (2. 6, and 10 feet) during July and August 1961.Salmon typically inhabited water 1.2 to 1.8 m deep duringthis period. Samples taken midday at station 1.
Doudoroff (1960), who state that at 16.5° to25.5°C, under controlled conditions, juvenilechinook salmon directly avoided oxygen concentrations of 4.5 mg/liter and below.
Conditions in the upper 1.8 m of water weresometimes marginal for survival of the salmonbecause of 18° to 29°C temperatures (Figure 10),varying oxygen concentrations, and other stresses. Between 31 July and 3 August 1961, 65dead salmon (50 of 1959 year class and 15 of1961 year class) were collected at the watersurface. Fish broke water in obvious distressat various hours of the day. At this time, aheavy bloom of Aphallizomclloll was decomposing, accompanied by declines in surface pH(Figure 6) and oxygen concentrations (Figure9). Oxygen concentrations remained at 5 to 8mg/liter in the upper 1.5 m of water during a24-h series taken 31 July-1 August. During thedie-off, daily temperature maxima were reaching 23°C at 1.5 m (Figure 10). Brett (1956)estimated that 25.1°C is the upper lethal limitfor chinook salmon acclimated to 20°C. Thecombination of low oxygen, high temperature,high pH, and possibly algal toxins apparentlyformed untenable conditions for some of thefish.
During the extreme conditions of midsummer1961, the O-age class salmon lost condition(see later section on Condition). Herrmann,Warren, and Doudoroff (1962) observed progressively lower food consumption and growthrates among juvenile coho salmon held at 20°Cand exposed to decreasing oxygen concentrations. The most rapid decline in these rates
883
FISHERY BULLETIN: VOL. 71. NO.3
O_llKZ'LAI'IT
150,000
\:)100
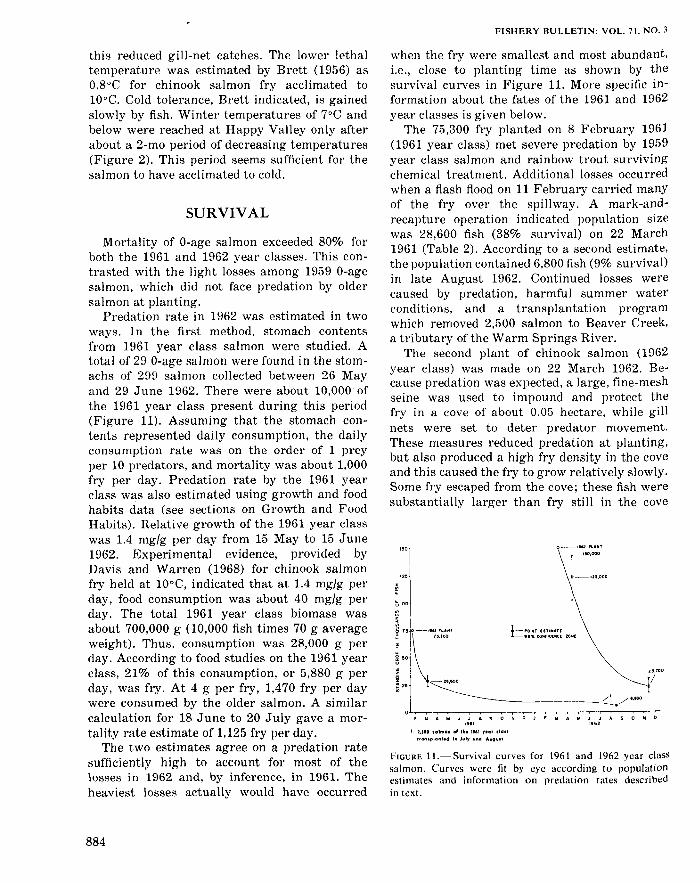
when the fry were smallest and most abundant,i.e., close to planting time as shown by thesurvival curves in Figure 11. More specific information about the fates of the 1961 and 1962year classes is given below.
The 75,300 fry planted on 8 February 1961(1961 year class) met severe predation by 1959year class salmon and rainbow trout survivingchemical treatment. Additional losses occurredwhen a flash flood on 11 February carried manyof the fry over the spillway. A mark-andrecapture operation indicated population sizewas 28,600 fish (38% survival) on 22 March1961 (Table 2). According to a second estimate,the population contained 6,800 fish (9% survival)in late August 1962. Continued losses werecaused by predation, harmful summer waterconditions, and a transplantation programwhich removed 2,500 salmon to Beaver Creek,a tributary of the Warm Springs River.
The second plant of chinook salmon (1962year class) was made on 22 March 1962. Because predation was expected, a large, fine-meshseine was used to impound and protect thefry in a cove of about 0.05 hectare, while gillnets were set to deter predator movement.These measures reduced predation at planting,but also produced a high fry density in the coveand this caused the fry to grow relatively slowly.Some fry escaped from the cove; these fish weresubstantially larger than fry still in the cove
FIGURE ll.-Survival curves for 1961 and 1962 year classsalmon. Curves were fit by eye according to populationestimates and information on predation rates describedin text.
this reduced gill-net catches. The lower lethaltemperature was estimated by Brett (1956) as0.8°C for chinook salmon fry acclimated tolOoC. Cold tolerance, Brett indicated, is gainedslowly by fish. Winter temperatures of 7°C andbelow were reached at Happy Valley only afterabout a 2-mo period of decreasing temperatures(Figure 2). This period seems sufficient for thesalmon to have acclimated to cold.
Mortality of O-age salmon exceeded 80% forboth the 1961 and 1962 year classes. This contl'asted with the light losses among 1959 O-agesalmon, which did not face predation by oldersalmon at planting.
Predation rate in 1962 was estimated in twoways. In the first method, stomach contentsfrom 1961 year class salmon were studied. Atotal of 29 O-age salmon were found in the stomachs of 299 salmon collected between 26 Mayand 29 June 1962. There were about 10,000 ofthe 1961 year class present during this period(Figure 11). Assuming that the stomach contents represented daily consumption, the dailyconsumption rate was on the order of 1 preyper 10 predators, and mortality was about 1,000fry per day. Predation rate by the 1961 yearclass was also estimated using growth and foodhabits data (see sections on Growth and FoodHabits). Relative growth of the 1961 year classwas 1.4 mg/g per day from 15 May to 15 June1962. Experimental evidence, provided byDavis and Warren (1968) for chinook salmonfry held at 10oe, indicated that at 1.4 mg/g perday, food consumption was about 40 mg/g perday. The total 1961 year class biomass wasabout 700,000 g (10,000 fish times 70 g averageweight). Thus, consumption was 28,000 g perday. According to food studies on the 1961 yearclass, 21% of this consumption, or 5,880 g perday, was fry. At 4 g per fry, 1,470 fry per daywere consumed by the older salmon, A similarcalculation for 18 June to 20 July gave a mortality rate estimate of 1,125 fry per day.
The two estimates agree on a predation ratesufficiently high to account for most of thelosses in 1962 and, by inference, in 1961. Theheaviest losses actually would have occurred
SURVIVAL
884
HIGLEY and BOND: CHINOOK SALMON IN A RESERVOIR
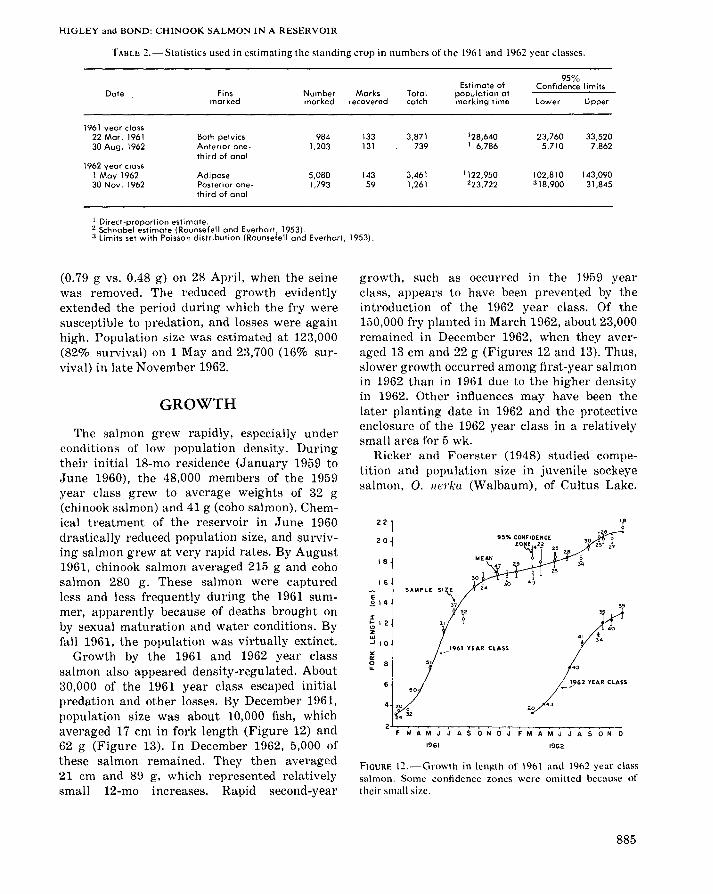
TABLE 2.-Statistics used in estimating the standing crop in numbers of the 1961 and 1962 year classes.
95%Estimate of Confidence limits
Date Fins Number Marks Total population atmarked marked recovered catch marking time Lower Upper
1961 year class22 Mar. 1961 80th pel vics 984 133 3,871 '28,640 23,760 33,52030 Aug. 1962 Anterior one· 1,203 131 739 I 6,786 5,710 7,862
third of anal1962 year class
1 May 1962 Adipose 5,080 143 3,461 1122,950 102,810 143,09030 Nov. 1962 Posterior one- 1,793 59 1,261 223,722 318,900 31,845
third of anal
I Direct-proportion estimate.2 Schnabel estimate (Rounsefell and Everhart, 1953).3 Limits set with Poisson distribution (Rounsefell and Everhart, 1953).
22
FMAMJJASONOJ FMAMJJASONO
FIGURE 12.-Growth in length of 1961 and 1962 year classsalmon. Some confidence zones were omitted because oftheir small size.
40
t34
1962 YEAR CLASS.-.r
1962
20
1961
".......--1961 YEAR CLASS..
50
SAMPLE Sl~
'7
4 20 0
4 '2
E214
6
'6
:r>-'2"zUJ...J 10
"0:a 8u.
20
growth, Ruch as occurred in the 1959 yearclaRs, appears to have been prevented by theintroduction of the 1962 year class. Of the150,000 fry planted in March 1962, about 23,000remained in December 1962, when they averaged 13 em and 22 g (Figures 12 and 13). Thus,slower growth occurred among first-year Ralmonin 1962 than in 1961 due to the higher densityin 1962. Other influences may have been thelater planting date in 1962 and the protectiveenclosure of the 1962 year class in a relativelysmall area for 5 wk.
Ricker and Foerster (1948) studied competition and population size in juvenile sockeyesalmon, O. ilerka (Walbaum), of Cultus Lake.
'8
(0.79 g vs. 0.48 g) on 28 April, when the seinewas removed. The reduced growth evidentlyextended the period during which the fry weresusceptible to predation, and losses were againhigh. Population size was estimated at 123,000(82% survival) on 1 May and 23,700 (16% survival) in late November 1962.
GROWTH
The salmon grew rapidly, especially underconditions of low population density. Duringtheir initial 18-mo residence (January 1959 toJune 1960), the 48,000 members of the 1959year class grew to average weights of 32 g(chinook salmon) and 41 g (coho salmon). Chemical treatment of the reservoir in June 1960drastically reduced population size, and surviving salmon grew at very rapid rates. By August1961, chinook salmon averaged 215 g and cohosalmon 280 g. These salmon were capturedless and less frequently during the 1961 summer, apparently because of deaths brought onby sexual maturation and water conditions. Byfall 1961, the population was virtually extinct.
Growth by the 1961 and 1962 year classsalmon also appeared density-regulated. About30,000 of the 1961 year class escaped initialpredation and other losses. By December 1961,population size was about 10,000 fish, whichaveraged 17 em in fork length (Figure 12) and62 g (Figure 13). In December 1962, 5,000 ofthese salmon remained. They then averaged21 em and 89 g, which represented relativelysmall 12-mo increases. Rapid second-year
885
FISHERY BULLETIN: VOL. 71, NO.3
100
90
80
70
60
2 50
l-X 40C>
'" 37;r 1962 YEAR CLASS30
\ 35
33 f20 2 52 ,
3.10 51
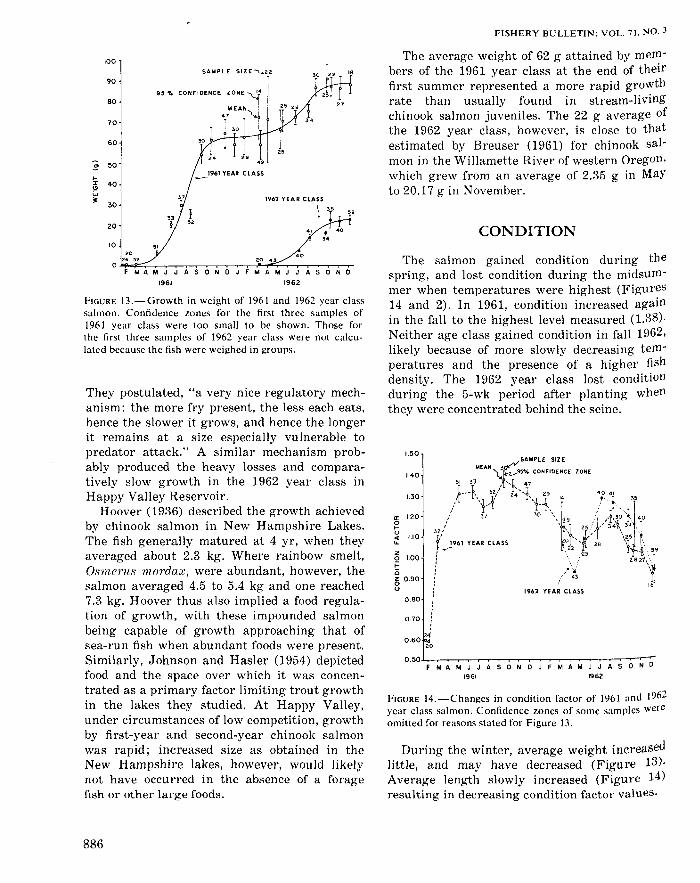
The average weight of 62 g attained by members of the 1961 year class at the end of theirfirst summer represented a more rapid growthrate than usually found in stream-livingchinook salmon juveniles. The 22 g average ofthe 1962 year class, however, is close to thatestimated by Breuser (1961) for chinook salmon in the Willamette River of western Oregon,which grew from an average of 2.35 g in Mayto 20.17 g in November.
CONDITION
FIGURE B.-Growth in weight of 1961 and 1962 year classsalmon. Confidence zones for the first three samples of1961 year class were too small to be shown. Those forthe first three samples of 1962 year class were not calculated because the fish were weighed in groups.
They postulated, "a very nice regulatory mechanism: the more fry present, the less each eats,hence the slower it grows, and hence the longerit remains at a size especially vulnerable topredator attack." A similar mechanism probably produced the heavy losses and comparatively slow growth in the 1962 year class inHappy Valley Reservoir.
Hoover (1936) described the growth achievedby chinook salmon in New Hampshire Lakes.The fish generally matured at 4 yr, when theyaveraged about 2.3 kg. Where rainbow smelt,Osmerus mordax, were abundant, however, thesalmon averaged 4.5 to 5.4 kg and one reached7.3 kg. Hoover thus also implied a food regulation of growth, with these impounded salmonbeing capable of growth approaching that ofsea-run fish when abundant foods were present.Similarly, Johnson and Hasler (1954) depictedfood and the space over which it was concentrated as a primary factor limiting trout growthin the lakes they studied. At Happy Valley,under circumstances of low competition, growthby first-year and second-year chinook salmonwas rapid; increased size as obtained in theNew Hampshire lakes, however, would likelynot have occurred in the absence of a foragefish or other large foods.
MEAN 3~SAMPLE SIZE
,\~95% CONFIDENCE ZONE
51 33 '~""l 47L--f, 52/ 2; .....1 2.9 40 41l \H' r'll 14 ,'1 35
,:" 30 \,I' .. I ,.f.;Of~. 40." , I 25;;' (' 34Y, 34"., l3f 196\ YEAR CLASS ;r---f:. \Yt!~ ;ii" 2;~\r! 1962 YEAR CLASS 1
4
1.30
1,40
0.70
0.80
0.6020
a: 120oI-
~ 1.10
zo 1.00>:;:;5 0 .90u
1.50
0.50 F M A M J J A SON 0 J F M A M J J A SON 0
1961 1962
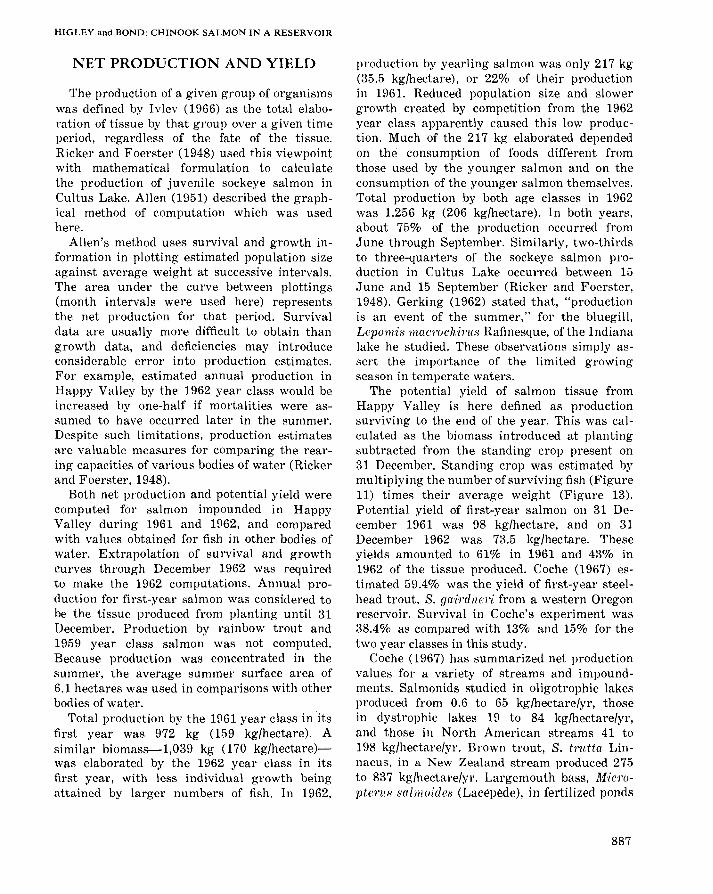
The salmon gained condition during thespring, and lost condition during the midsummer when temperatures were highest (FigureS14 and 2). In 1961, condition increased againin the fall to the highest level measured (1.38).Neither age class gained condition in fall 1962,likely because of more slowly decreasing temperatures and the presence of a higher fishdensity. The 1962 year class lost conditionduring the 5-wk period after planting whenthey were concentrated behind the seine.
During the winter, average weight increasedlittle, and may have decreased (Figure 13).Average length slowly increased (Figure 14)resulting in decreasing condition factor values.
FIGURE 14.-Changes in condition factor of 1961 and 1962year class salmon. Confidence zones of some samples wereomitted for reasons stated for Figure 13.
.02024 32
886
HIGLEY and BOND: CHINOOK SALMON IN A RESERVOIR
NET PRODUCTION AND YIELD
The production of a given group of organismswas defined by Ivlev (1966) as the total elaboration of tissue by that group over a given timeperiod, regardless of the fate of the tissue.Ricker and Foerster (1948) used this viewpointwith mathematical formulation to calculatethe production of juvenile sockeye salmon inCultus Lake. Allen (1951) described the graphical method of computation which was usedhere.
Allen's method uses survival and growth information in plotting estimated population sizeagainst average weight at successive intervals.The area under the curve between plottings(month intervals were used here) representsthe net production for that period. Survivaldata are usually more difficult to obtain thangrowth data, and deficiencies may introduceconsiderable error into production estimates.For example, estimated annual production inHappy Valley by the 1962 year class would beincreased by one-half if mortalities were assumed to have occurred later in the summer.Despite such limitations, production estimatesare valuable measures for comparing the rearing capacities of various bodies of water (Rickerand Foerster, 1948).
Both net production and potential yield werecomputed for salmon impounded in HappyValley during 1961 and 1962, and comparedwith values obtained for fish in other bodies ofwater. Extrapolation of survival and growthcurves through December 1962 was requiredto make the 1962 computations. Annual production for first-year salmon was considered tobe the tissue produced from planting until 31December. Production by rainbow trout and1959 year class salmon was not computed.Because production was concentrated in thesummer, the average summer surface area of6.1 hectares was used in comparisons with otherbodies of water.
Total production by the 1961 year class in itsfirst year was 972 kg (159 kg/hectare). Asimilar biomass-1,039 kg (170 kg/hectare)was elaborated by the 1962 year class in itsfirst year, with less individual growth beingattained by larger numbers of fish. In 1962,
production by yearling salmon was only 217 kg(35.5 kg/hectare), or 22% of their productionin 1961. Reduced population size and slowergrowth created by competition from the 1962year class apparently caused this low production. Much of the 217 kg elaborated dependedon the consumption of foods different fromthose used by the younger salmon and on theconsumption of the younger salmon themselves.Total production by both age classes in 1962was 1,256 kg (206 kg/hectare). In both years,about 75% of the production occurred fromJune through September. Similarly, two-thirdsto three-quarters of the sockeye salmon production in Cultus Lake occurred between 15June anu 15 September (Ricker and Foerster,1948). Gerking (1962) stated that, "productionis an event of the summer," for the bluegill,Lepolllis mac1'ochil'us Rafinesque, of the Indianalake he studied. These observations simply assert the importance of the limited growingseason in temperate waters.
The potential yield of salmon tissue fromHappy Valley is here defined as productionsurviving to the end of the year. This was calculated as the biomass introduced at plantingsubtracted from the standing crop present on31 December. Standing crop was estimated bymultiplying the number of surviving fish (Figure11) times their average weight (Figure 13).Potential yield of first-year salmon on 31 December 1961 was 98 kg/hectare, and on 31December 1962 was 73.5 kg/hectare. Theseyields amounted to 61% in 1961 and 43% in1962 of the tissue produced. Coche (1967) estimated 59.4% was the yield of first-year steelhead trout, S. gairdllen' from a western Oregonreservoir. Survival in Coche's experiment was38.4% as compared with 13% and 15% for thetwo year classes in this study.
Coche (1967) has summarized net productionvalues for a variety of streams and impoundments. Salmonids studied in oligotrophic lakesproduced from 0.6 to 65 kg/hectare/yr, thosein dystrophic lakes 19 to 84 kg/hectare/yr,and those in North American streams 41 to198 kg/hectare/yr. Brown trout, S. fruita Linnaeus, in a New Zealand stream produced 275to 837 kg/hectare/yr. Largemouth bass, Microptc/'us salmoides (Lacep~de), in feltilized ponds
887
of western Oregon produced up to 128 kg/hectare/yr. The maximum first-year productionof 170 kg/hectare/yr and the total 1962 production of 206 kg/hectare/yr by salmon inHappy Valley rank this reservoir as high amongimpoundments studied and apparently comparable to some of the more productive streamsstudied.
The yield of juvenile salmonids from 10 impoundments has also been summarized byCoche (1967). The lowest value (2.3 kg/hectare/yr) was for sockeye salmon in a large oligotrophic lake in Canada. Most values rangedbetween 20 and 100 kg/hectare/yr; the highestwas 143 kg/hectare/yr. Ellis, Pressey, andSmith (1958), citing Washington Departmentof Game figures, stated that Washington lakesyield 45 to 209 kg/hectare/yr (average 112)in rainbow trout. Although covering a widerange, these figures suggest that yields of 100kg/hectare/yr may be expected of fertile impoundments. This was true for Happy Valleywhich, despite high mortality rates, yielded 98and 73.5 kg/hectare/yr of first-year salmon inthe 2-yr of this study. Both net production andyield estimates corroborate chemical evidencethat the reservoir is highly fertile.
FOOD HABITS
Studies such as those by Johnson and Hasler(1954) and Ricker and Foerster (1948) haveshown Entomostraca to be the primary foodtype eaten by many lake-resident juvenile salmonids. The coho salmon of the small lake inKamchatka Penninsula studied by Dvinin (1949),however, fed on insects (midges and mosquitoes),although older fish took some zooplankton. Infood-habit studies of stream-inhabiting coho andchinook salmon juveniles, Brueser (1961) andChapman et al. (1961) found mainly Dipteraand Trichoptera larvae, Ephemeroptera nymphs,and terrestrial insects. Availability very likelyplayed a major role in these differences of foodhabits; for example, planktonic forms in a stratified lake and "drift" organisms in a streamwould be available forms, with salmonids capable of eating a variety of foods.
888
FISHERY BULLETIN: VOL. 71. NO.3
Food habits of the 1961 year class in HappYValley Reservoir were determined by dry-weightanalyses of stomach contents from 17 samplesof fish taken between April 1961 and November1962. The results (Table 3) indicated a heavYutilization of Entomostraca (mostly Cladocera)and chaoborid larvae in both summer and winteruntil the 1962 year class was released. Thesefoods averaged 97% of the stomach contents forthe samples taken before the 1962 salmon werereleased, and only about 6% of the sample contents taken thereafter. The planktonic Entomostraca and vertically migrating chaoboridlarvae were apparently both abundant andavailable to the salmon, which probably fed inthe upper 3 m of water during the summer.Competition from the 1962 year class, however,evidently forced a shift in food habits and ledto the slow growth already mentioned. A varietyof benthic forms (crayfish, snails, damsel flynaiads, and amphipods) as well as chironomid
pupae, terrestrial insects, and members of the1962 year class were then eaten.
Meanwhile, the 1962 year class was utilizingEntomostraca, as shown by field checks ofstomach contents. In a 23-member sample ofthese fish taken on 21 August 1962, Entomostraca were found in all stomachs and made uproughly 80% of the total contents identified. Inanother sample of 10 fish taken on 2 September1962, 9 stomachs contained Entomostraca,which formed 45% of the total contents. Most ofthe remaining food in both samples waschironomids.
Increased size does not seem to have beenthe direct cause of the change in food preferenceby the 1961 salmon because their size (Figures12 and 13) did not appreciably increase from fall1961 to spring 1962, when the apparent foodshift occurred. That fish of their size are capableof feeding upon the Entomostraca was shownby an earlier analysis of the stomach contentsfrom 25 salmon of the 1959 yea~ class. Thesefish averaged 193 g when collected on 8 April1961. Entomostraca were found in 13 of thestomachs and constituted 90% of the combinedsample on a settle volume basis. The high production by first-year salmon in Happy ValleyReservoir apparently was supported chiefly byentomostracan foods.
HIGLEY and BOND: CHINOOK SALMON IN A RESERVOIR
MIGRATION OF SALMONFROM RESERVOIR
Intrinsic factors suggested as influencingthe downstream migration of salmonid juvenilesinclude size and age of fish (E Ison, 1957) although these apparently are variable in migrating spring chinook salmon juveniles (Wallis,1968; Wagner, Conte, and Fessler, 1969).Changes in water flow and temperature maybe associated with movements. Wallis (1968) inreviewing literature concerning this subjectfound a number of authors who cited elevationsin water temperature as correlated with downstream movements of Pacific salmon smolts.Emigration of sockeye salmon juveniles fromCultus and other lakes typically follows icebreak up and rising temperatures (Foerster,1968).
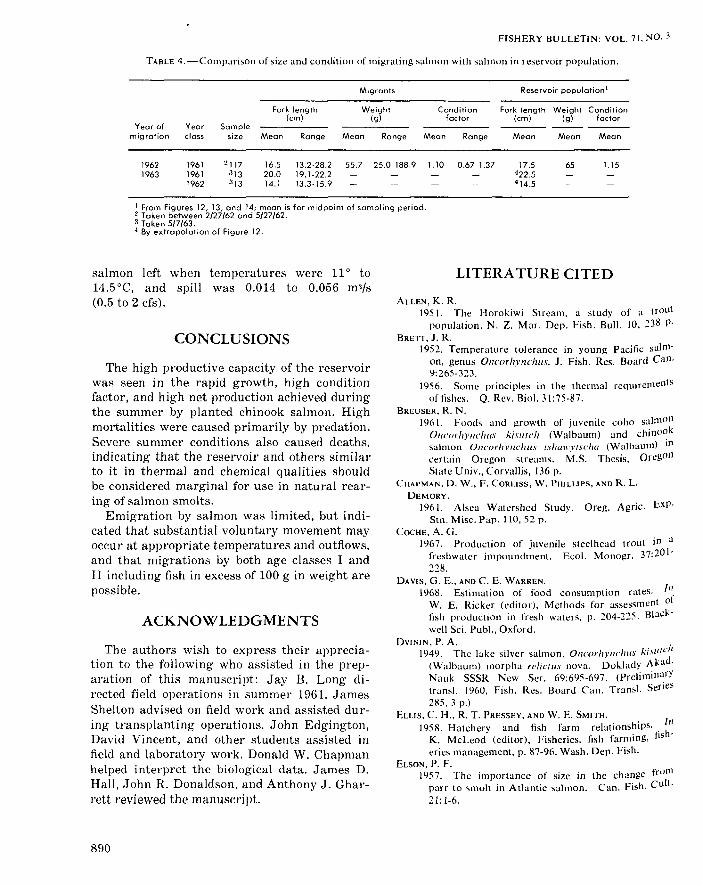
Migrants from Happy Valley Reservoirvaried in size from 25 to 188.9 g and includedfish of both age class I and class II (Table 4).The migrants appeared similar in size and condition to fish taken from the reservoir forgrowth studies. Migrations occurred betweenFebruary and May of 1962 and 1963 at varyingtemperatures and outflow volumes. In 1962, notemperature relation was evident; but migrations in 1963 occurred only at temperaturesabove 10°C.
In 1962, 196 fish of age class I emigrated.On different days during a 6-wk period, groupsof 30, 37, and 33 left when temperatures were3.5° to 5°C, and outflows were 0.141 to 0.283mats (5 to 10 cfs). During an 18-day periodwhen temperatures were increasing from 6°to 15°C and outflows were less than 0.056 m3ts(2 cfs), migrations of 5 to 15 fish occurred on7 nights. Outflow through the iron tube, usedon 13 days when temperatures were 11.5° to24°C, attracted one migration of 17 fish at atemperature of 13°C.
In 1963, a mid-February to mid-March spillvolume of 0.141 m3ts (5 cfs) maximum, at temperatures below 5°C, brought no migration.By late April, water temperatures were 100to 13°C, and a new spill of 0.141 to 0.283 m3ts(5 to 10 cfs) occurred. Approximately 500salmon including both age classes exited. Anadditional 56 age class II and 498 age class I
<Xl<"?<Xl
N...,ci
..., '"M '"ci ciM
o...,M
0-goo
8g
-0 a-N "1aia-
NoR:
MaM
-0
g
--01.[') MOO lJ1-o"",<>-",O~oai ~O o.oMociM"'-
<Xl N
N '"g: 0
8g
<Xl
-06
6
o
N
'o'"EOJ
Eo
1I
889
FISHERY BULLETIN: VOL. 71, NO.3
TABLE 4.-Comparison of size and condition of migrating salmon with salmon in reservoir population.
Fork length(em)
Migrants
Weight(g)
Conditionfoetor
Reservoir population'
Fork length Weight Condition(em) (g) foetor
Year of Year Samplemigration class size Mean Range Mean Range Mean Range Mean Mean Mean
19621963
196119611962
2117313313
16.5 13.2·28.2 55.7 25.0·188.9 1.10 0.67-1.3720.0 19.1·22.214.1 13.3·15.9
17.5422.5414.5
65 1.15
I From Figures 12, 13, and 14; mean is for midpoint of sampling period.2 Token between 2/27/62 and 5/27/62.3 Token 5/7/63.4 By extrapolation of Figure 12.
salmon left when temperatures were 11 ° to14.5°C, and spill was 0.014 to 0.056 m3/s(0.5 to 2 cfs).
CONCLUSIONS
The high productive capacity of the reservoirwas seen in the rapid growth, high conditionfactor, and high net production achieved duringthe summer by planted chinook salmon. Highmortalities were caused primarily by predation.Severe summer conditions also caused deaths,indicating that the reservoir and others similarto it in thermal and chemical qualities shouldbe considered marginal for use in natural rearing of salmon smolts.
Emigration by salmon was limited, but indicated that substantial voluntary movement mayoccur at appropriate temperatures and outflows,and that migrations by both age classes I andII including fish in excess of 100 g in weight arepossible.
ACKNOWLEDGMENTS
The authors wish to express their appreciation to the following who assisted in the preparation of this manuscript: Jay B. Long directed field operations in summer 1961. JamesShelton advised on field work and assisted during transplanting operations. John Edgington,David Vincent, and other students assisted infield and laboratory work, Donald W. Chapmanhelped interpret the biological data. James D.Hall, John R. Donaldson, and Anthony J. Gharrett reviewed the manuscript.
890
LITERATURE CITED
ALLEN, K. R.1951. The Horokiwi Stream, a study of a trout
population. N. Z. Mar. Dep. Fish. Bull. 10,238 p.BRETT, J. R.
1952. Temperature tolerance in young Pacific salmon, genus Oncorhynchus. J. Fish. Res. Board Can.9:265-323.
1956. Some principles in the thermal requirementsof fishes. Q. Rev. BioI. 31:75-87.
BREUSER, R. N.1961. Foods and growth of juvenile coho salmon
OncorhVllc/IlIS kisulch (Walbaum) and chinooksalmon' OllcorhYllchus Ishuwylschu (Walbaum) incertain Oregon streams. M.S. Thesis, OregonState Univ., Corvallis, 136 p.
CHAPMAN, D. W., F. CORLISS, W. PHILLIPS, AND R. L.DEMORY.
1961. Alsea Watershed Study. Oreg. Agric. ExP·Stn. Misc. Pap. 110,52 p.
COCHE, A. G.1967. Production of juvenile steel head trout in a
freshwater impoundr;lent. Ecol. Monogr. 37:201228.
DAVIS, G. E., AND C. E. WARREN.1968. Estimation of food consumption rates. /11.
W. E. Ricker (editor), Methods for assessment 01fish production in fresh waters, p. 204-225. Blackwell Sci. Publ., Oxford.
DVININ, P. A.. .' cll1949. The lake sIlver salmon, O/lcorhynchus k/.I1~~ d
(Walbaum) morpha relic/us nova. Doklady Aka·Nauk SSSR New Ser. 69:695-697. (Preliminarytransl. 1960, Fish. Res. Board Can. Transl. Series285.3 p.)
ELLIS, C. H., R. T. PRESSEY, A~D W., E. SMITH. . '. Itt1958. Hatchery and fish farm relatIOnshIPs.,
K. McLeod (editor), Fisheries, fish farming, fisheries management, p. 87-96. Wash. Dep. Fish.
ELSON, P. F.1957. The importance of size in the change fro01
parr to smolt in Atlantic salmon. Can. Fish. cult.21: 1-6.
HIGLEY and BOND: CHINOOK SALMON IN A RESERVOIR
FOERSTER, R. E.
1968. The sockeye salmon, OllcurhYllcJllIs Ilaka.
Fish. Res. Board Can., Bull. 162,422 p.GERKING, S. D.
1962. Production and food utilization in a population of bluegill sunfish. Ecol. Monogr. 32: 31-78.
HERRMANN, R. B., C. E. WARREN, AND P. DOUDOROFF.
1962. Int1uence of oxygen concentration of thegrowth of juvenile coho salmon. Trans. Am. Fish.Soc. 91: 155-167.
HOOVER, E. E.1936. Contributions to the life history of the chinook
and landlocked salmon in New Hampshire. Copcia1936: 193-198.
lVLEV, V. S.1966. The biological productivity of waters. [Transl.
wiIh anno!.] J. Fish. Res. Board Can. 23: 1727- 1759.JOHNSON, W. E., AND A. D. HASLER.
1954. Rainbow Irout production in dystrophic lakes.J. Wildl. Manage. 18: I 13-134.
Koo, T. S. Y.IY62. Age designation in salmon. Univ. Wash.
Publ. Fish., New Ser. 1:37-48.
RICKER, W. E., AND R. E. FOERSTER.
1948. Computation of fish production. Bull. Bingham. Oceanogr. Collect., Yale Univ. 11(4): 173-211.
ROUNSEFELL, G. A., AND W. H. EVERHART.
1953. Fishery science. its methods and applications.John Wiley and Sons, N.Y., 444 p.
WAGNER, H. H., F. P. CONTE, AND J. L. FESSLER.
1969. Development of osmotic and ionic regulationin two races of Chinook salmon, OllcurhYllchusIslllIwylscha. Compo Biochem. Physiol. 29: 325-341.
WALLIS, J.
1968. Recommended time, size, and age for releaseof hatchery reared salmon and steelhead trou!.Prog. Rep. Fish. Comm. Oreg., Clackamas, Oreg.,61 p.
WHITMORE, C. M., C. E. WARREN, AND P. DOUDOROFF.
1960. Avoidance reactions of salmonid and centrarchid tishes to low oxygen concentrations. Trans.Am. Fish. Soc. 89: 17-26.
891