Embed Size (px)
Citation preview
Ecology meets economyEco-Efficiency Analysis of
water-based ink systems
for PE film applications.
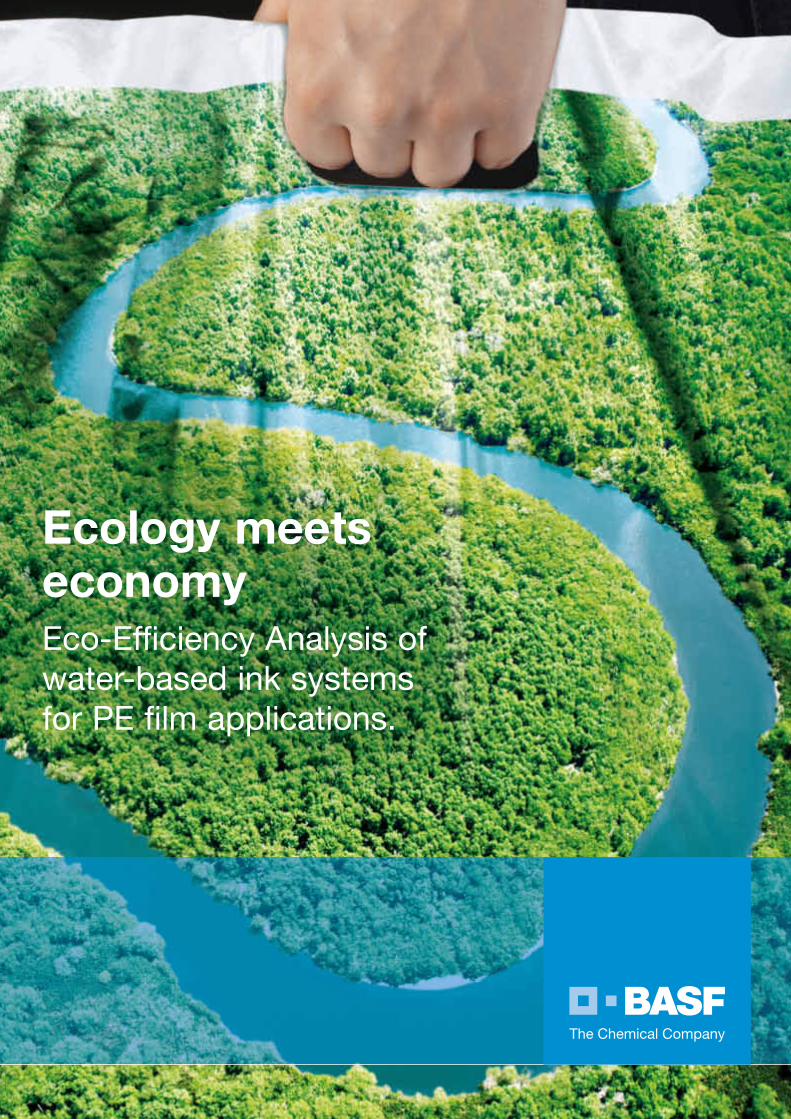
Contents
Input and methodology
Customer benefit and alternatives 04
System boundaries 04
Model parameters 06
Environmental impact categories
The eco-efficiency portfolio according to BASF 08
Environmental impact categories 08
Fingerprints
Ecological fingerprint 12
Costs summary 13
Results
Conclusions 14
Growing expectations – growing responsibility
Consumers continue to expect more from the packages
that deliver and protect the products they consume.
In response brand owners strive to innovate with new
package designs, materials and user-friendly features. With
increasing legislation and pressure to create sustainable
packaging, brand owners and retailers are starting to
explore alternatives to conventional approaches. Creating
packaging that is sustainable on an environmental,
social and economic level is key to providing value to the
consumer, maintaining the competitive edge and adhering
to current regulations. Market interest in environmental
information on products that is credible, unbiased,
verifiable, and covers the entire life cycle is growing.
Life cycle assessment tools have become an important
quantitative tool to validate the environmental impacts
and claims of products and processes.
About the Eco-Efficiency Analysis
This Eco-Efficiency Analysis (EEA) was conducted
comparing two ink technologies used in the printing of
low-density polyethylene film for the European market,
such as used to produce shopping bags. The analysis
is based on the 2008 US study with adjustments to the
European conditions in the following categories:
• ink composition, material and labor costs,
printing conditions
• risk and toxicity potential
• European weighting and relevance factors
• methodology updates
Developed by BASF in 1996, the Eco-Efficiency Analysis
compares the economic and environmental impacts that
products and processes have over the course of their
The Eco-Efficiency Analysis makes sustainability measurable
Method for Eco-Efficiency
Analysis is validated by
NSF International
Method for Eco-Efficiency
Analysis is validated by
the German Association
for Technical Inspection (TÜV)
BASF label to mark
eco-efficient products
02 03
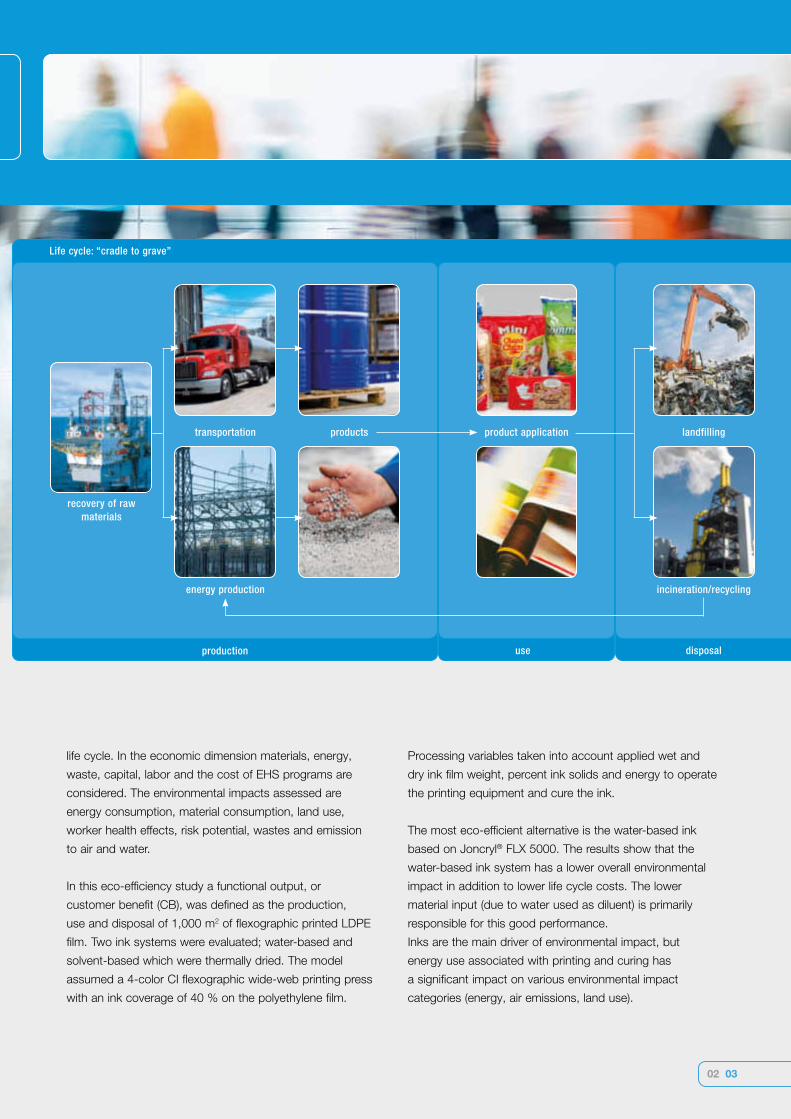
life cycle. In the economic dimension materials, energy,
waste, capital, labor and the cost of EHS programs are
considered. The environmental impacts assessed are
energy consumption, material consumption, land use,
worker health effects, risk potential, wastes and emission
to air and water.
In this eco-efficiency study a functional output, or
customer benefit (CB), was defined as the production,
use and disposal of 1,000 m2 of flexographic printed LDPE
film. Two ink systems were evaluated; water-based and
solvent-based which were thermally dried. The model
assumed a 4-color CI flexographic wide-web printing press
with an ink coverage of 40 % on the polyethylene film.
Processing variables taken into account applied wet and
dry ink film weight, percent ink solids and energy to operate
the printing equipment and cure the ink.
The most eco-efficient alternative is the water-based ink
based on Joncryl® FLX 5000. The results show that the
water-based ink system has a lower overall environmental
impact in addition to lower life cycle costs. The lower
material input (due to water used as diluent) is primarily
responsible for this good performance.
Inks are the main driver of environmental impact, but
energy use associated with printing and curing has
a significant impact on various environmental impact
categories (energy, air emissions, land use).
Life cycle: “cradle to grave”
recovery of raw materials
energy production incineration/recycling
disposaluseproduction
transportation landfillingproducts product application
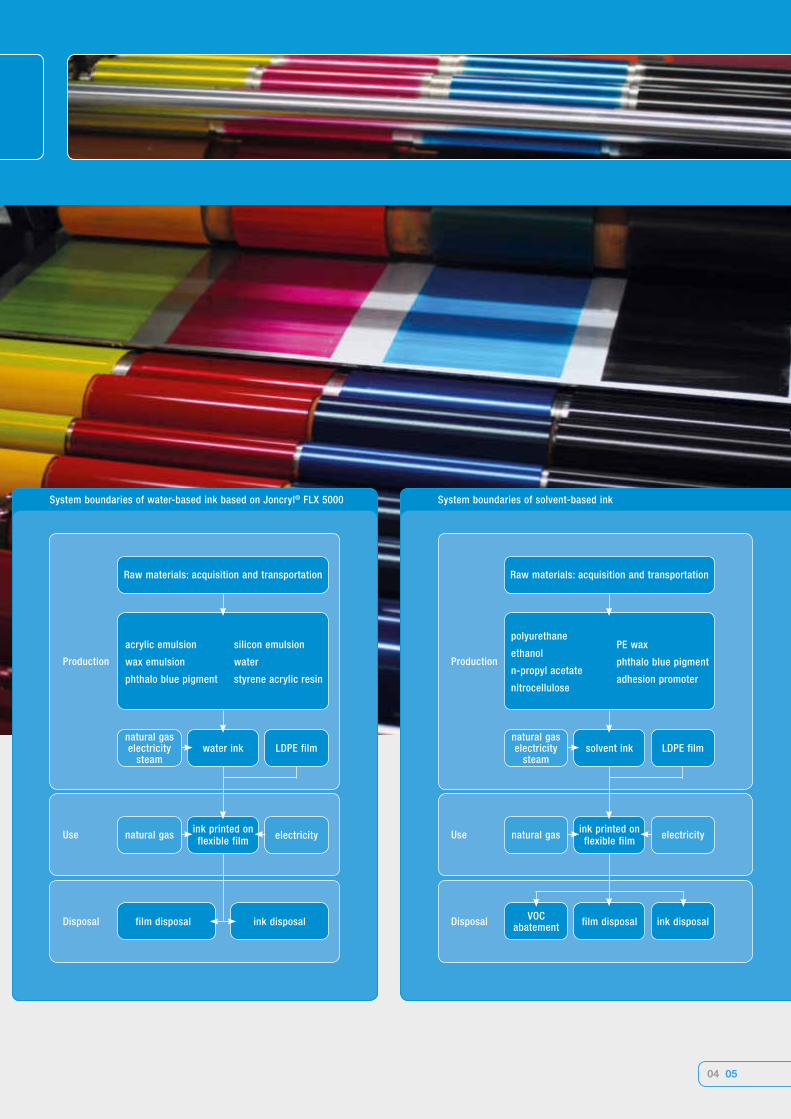
System boundaries
The scope of any EEA is defined by its system boundaries,
which define the specific elements of production, use, and
disposal that are considered as part of the analysis. The
production, use and disposal phases of the printing inks
differed slightly between the alternatives; therefore, the
environmental and economic impact analysis focused on
all three phases for each printing ink alternative.
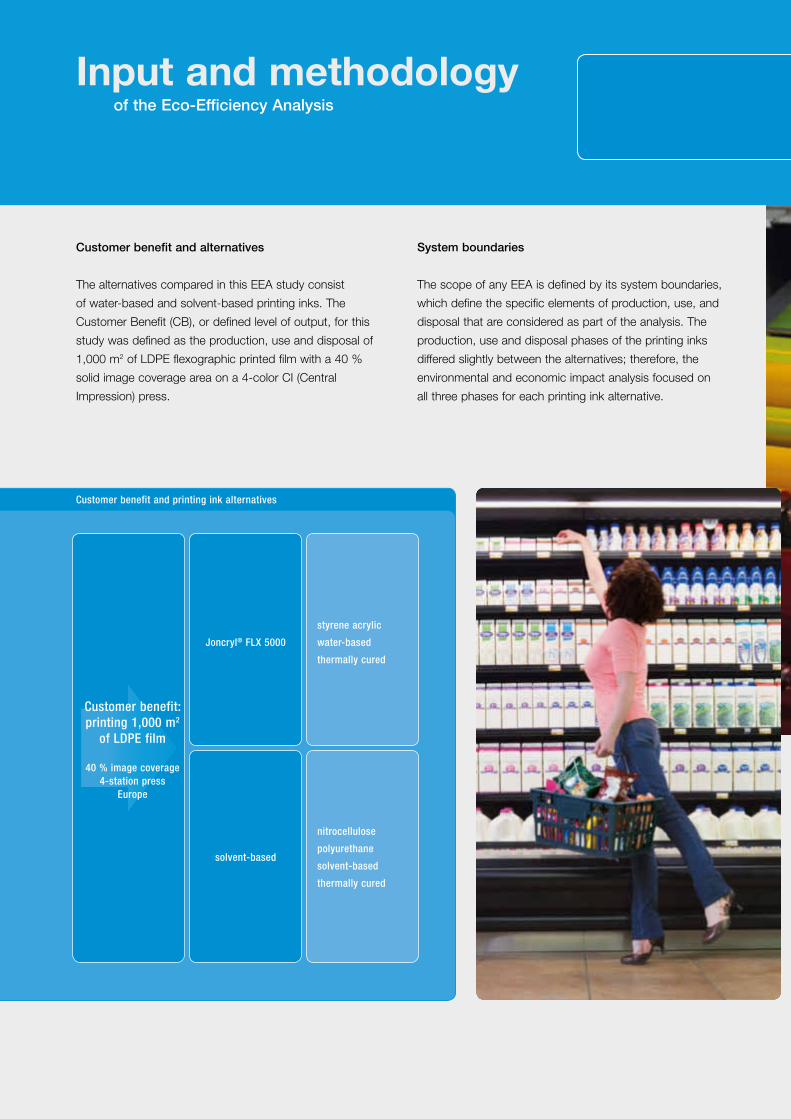
Customer benefit and alternatives
The alternatives compared in this EEA study consist
of water-based and solvent-based printing inks. The
Customer Benefit (CB), or defined level of output, for this
study was defined as the production, use and disposal of
1,000 m2 of LDPE flexographic printed film with a 40 %
solid image coverage area on a 4-color CI (Central
Impression) press.
Customer benefit and printing ink alternatives
Input and methodology of the Eco-Efficiency Analysis
Customer benefit: printing 1,000 m2
of LDPE film
40 % image coverage4-station press
Europe
Joncryl® FLX 5000
styrene acrylic
water-based
thermally cured
solvent-based
nitrocellulose
polyurethane
solvent-based
thermally cured
04 05
System boundaries of water-based ink based on Joncryl® FLX 5000
Production
Use
Disposal
Raw materials: acquisition and transportation
natural gaselectricity
steam
silicon emulsion
water
styrene acrylic resin
acrylic emulsion
wax emulsion
phthalo blue pigment
natural gas
film disposal ink disposal
electricity
LDPE filmwater ink
ink printed on flexible film
System boundaries of solvent-based ink
Production
Use
Disposal
Raw materials: acquisition and transportation
natural gaselectricity
steam
polyurethane
ethanol
n-propyl acetate
nitrocellulose
PE wax
phthalo blue pigment
adhesion promoter
natural gas
LDPE filmsolvent ink
ink printed on flexible film electricity
VOC abatement film disposal ink disposal
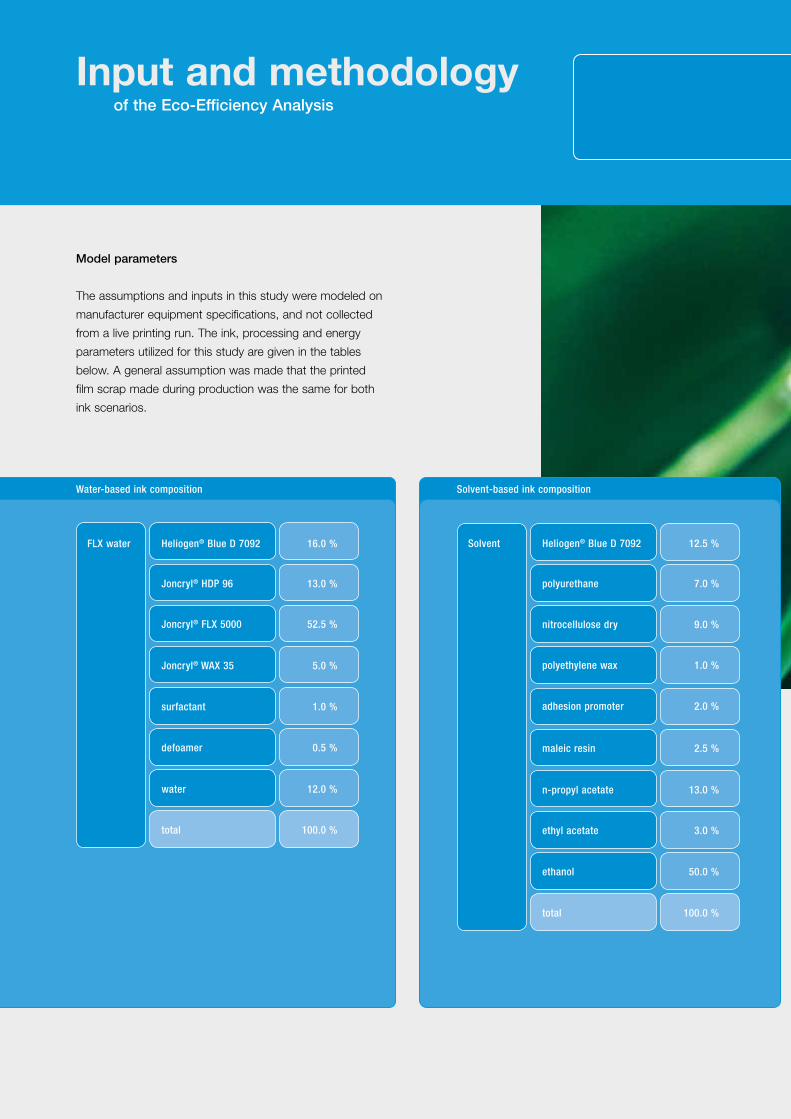
Water-based ink composition Solvent-based ink composition
Input and methodology of the Eco-Efficiency Analysis
FLX water Heliogen® Blue D 7092 16.0 %
Joncryl® HDP 96 13.0 %
Joncryl® FLX 5000 52.5 %
Joncryl® WAX 35 5.0 %
surfactant 1.0 %
defoamer 0.5 %
water 12.0 %
total 100.0 %
Solvent Heliogen® Blue D 7092 12.5 %
polyurethane 7.0 %
nitrocellulose dry 9.0 %
polyethylene wax 1.0 %
adhesion promoter 2.0 %
maleic resin 2.5 %
n-propyl acetate 13.0 %
ethyl acetate 3.0 %
ethanol 50.0 %
total 100.0 %
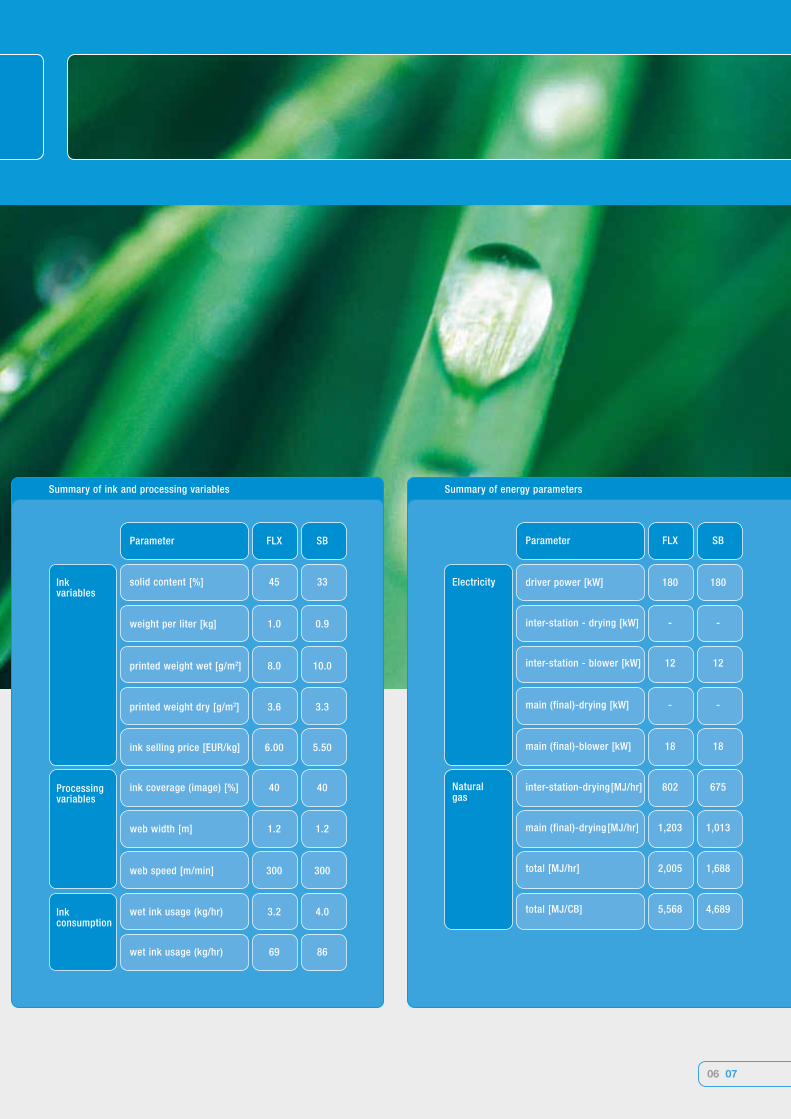
Model parameters
The assumptions and inputs in this study were modeled on
manufacturer equipment specifications, and not collected
from a live printing run. The ink, processing and energy
parameters utilized for this study are given in the tables
below. A general assumption was made that the printed
film scrap made during production was the same for both
ink scenarios.
06 07
Summary of ink and processing variables Summary of energy parameters
Parameter FLX SB
Inkvariables
solid content [%] 45 33
weight per liter [kg] 1.0 0.9
printed weight wet [g/m2] 8.0 10.0
printed weight dry [g/m2] 3.6 3.3
ink selling price [EUR/kg] 6.00 5.50
Processingvariables
ink coverage (image) [%] 40 40
web width [m] 1.2 1.2
web speed [m/min] 300 300
Inkconsumption
wet ink usage (kg/hr) 3.2 4.0
wet ink usage (kg/hr) 69 86
Parameter FLX SB
Electricity driver power [kW] 180 180
inter-station - drying [kW] - -
inter-station - blower [kW] 12 12
main (final)-drying [kW] - -
main (final)-blower [kW] 18 18
Natural gas
inter-station-drying[MJ/hr] 802 675
main (final)-drying[MJ/hr] 1,203 1,013
total [MJ/hr] 2,005 1,688
total [MJ/CB] 5,568 4,689
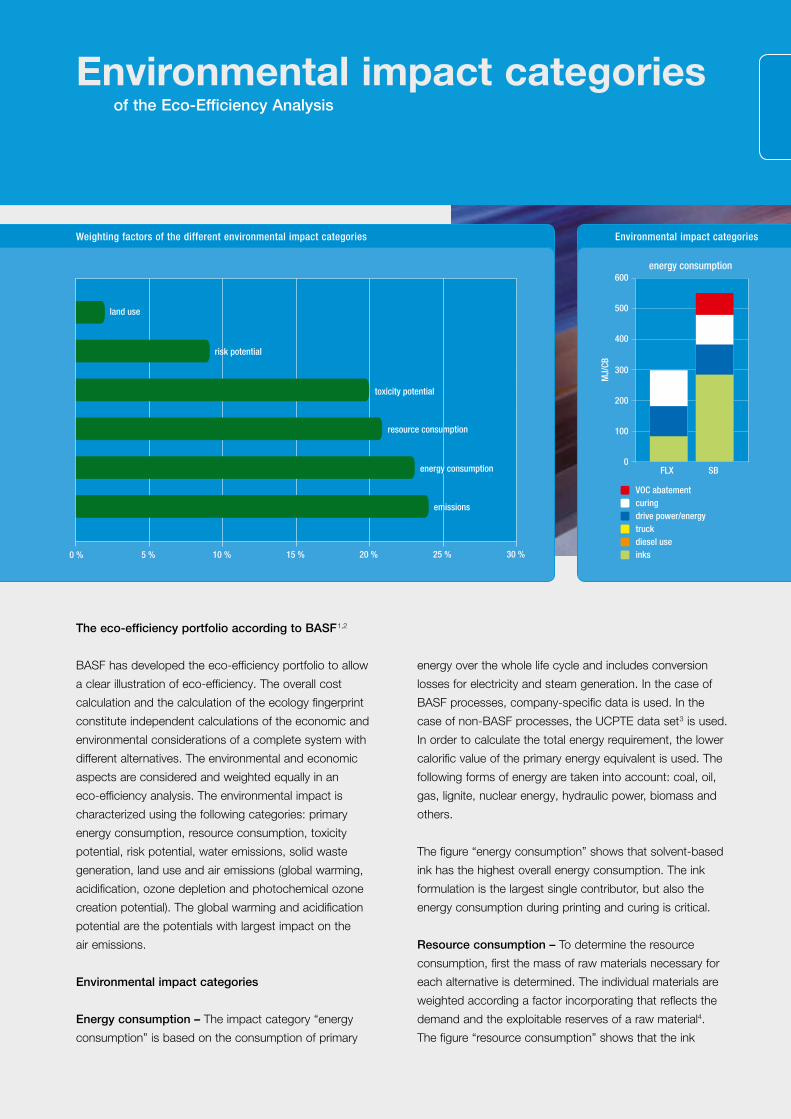
energy over the whole life cycle and includes conversion
losses for electricity and steam generation. In the case of
BASF processes, company-specific data is used. In the
case of non-BASF processes, the UCPTE data set3 is used.
In order to calculate the total energy requirement, the lower
calorific value of the primary energy equivalent is used. The
following forms of energy are taken into account: coal, oil,
gas, lignite, nuclear energy, hydraulic power, biomass and
others.
The figure “energy consumption” shows that solvent-based
ink has the highest overall energy consumption. The ink
formulation is the largest single contributor, but also the
energy consumption during printing and curing is critical.
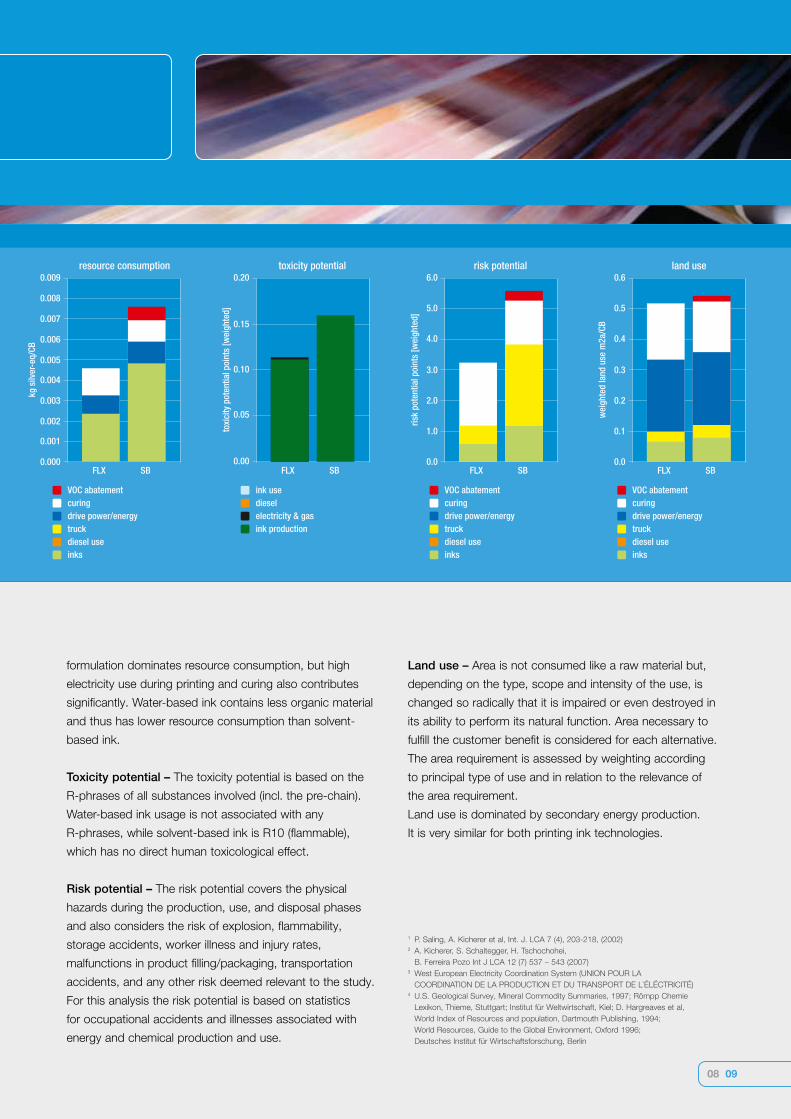
Resource consumption – To determine the resource
consumption, first the mass of raw materials necessary for
each alternative is determined. The individual materials are
weighted according a factor incorporating that reflects the
demand and the exploitable reserves of a raw material4.
The figure “resource consumption” shows that the ink
The eco-efficiency portfolio according to BASF1,2
BASF has developed the eco-efficiency portfolio to allow
a clear illustration of eco-efficiency. The overall cost
calculation and the calculation of the ecology fingerprint
constitute independent calculations of the economic and
environmental considerations of a complete system with
different alternatives. The environmental and economic
aspects are considered and weighted equally in an
eco-efficiency analysis. The environmental impact is
characterized using the following categories: primary
energy consumption, resource consumption, toxicity
potential, risk potential, water emissions, solid waste
generation, land use and air emissions (global warming,
acidification, ozone depletion and photochemical ozone
creation potential). The global warming and acidification
potential are the potentials with largest impact on the
air emissions.
Environmental impact categories
Energy consumption – The impact category “energy
consumption” is based on the consumption of primary
0 % 5 % 10 % 15 % 20 % 25 % 30 %
resource consumption
land use
risk potential
toxicity potential
energy consumption
emissions
Weighting factors of the different environmental impact categories Environmental impact categories
Environmental impact categories of the Eco-Efficiency Analysis
600
500
400
300
200
100
0
MJ/
CB
FLX
energy consumption
SB
VOC abatementcuringdrive power/energytruckdiesel useinks
08 09
formulation dominates resource consumption, but high
electricity use during printing and curing also contributes
significantly. Water-based ink contains less organic material
and thus has lower resource consumption than solvent-
based ink.
Toxicity potential – The toxicity potential is based on the
R-phrases of all substances involved (incl. the pre-chain).
Water-based ink usage is not associated with any
R-phrases, while solvent-based ink is R10 (flammable),
which has no direct human toxicological effect.
Risk potential – The risk potential covers the physical
hazards during the production, use, and disposal phases
and also considers the risk of explosion, flammability,
storage accidents, worker illness and injury rates,
malfunctions in product filling/packaging, transportation
accidents, and any other risk deemed relevant to the study.
For this analysis the risk potential is based on statistics
for occupational accidents and illnesses associated with
energy and chemical production and use.
Land use – Area is not consumed like a raw material but,
depending on the type, scope and intensity of the use, is
changed so radically that it is impaired or even destroyed in
its ability to perform its natural function. Area necessary to
fulfill the customer benefit is considered for each alternative.
The area requirement is assessed by weighting according
to principal type of use and in relation to the relevance of
the area requirement.
Land use is dominated by secondary energy production.
It is very similar for both printing ink technologies.
1 P. Saling, A. Kicherer et al, Int. J. LCA 7 (4), 203-218, (2002)2 A. Kicherer, S. Schaltegger, H. Tschochohei,
B. Ferreira Pozo Int J LCA 12 (7) 537 – 543 (2007)3 West European Electricity Coordination System (UNION POUR LA
COORDINATION DE LA PRODUCTION ET DU TRANSPORT DE L`ÉLÉCTRICITÉ)4 U.S. Geological Survey, Mineral Commodity Summaries, 1997; Römpp Chemie
Lexikon, Thieme, Stuttgart; Institut für Weltwirtschaft, Kiel; D. Hargreaves et al,
World Index of Resources and population, Dartmouth Publishing, 1994;
World Resources, Guide to the Global Environment, Oxford 1996;
Deutsches Institut für Wirtschaftsforschung, Berlin
0.009
0.008
0.007
0.006
0.005
0.004
0.003
0.002
0.001
0.000
kg s
ilver
-eq/
CB
FLX
resource consumption
SB
VOC abatementcuringdrive power/energytruckdiesel useinks
0.20
0.15
0.10
0.05
0.00
toxi
city
pot
entia
l poi
nts
[wei
ghte
d]
FLX
toxicity potential
SB
ink usedieselelectricity & gasink production
6.0
5.0
4.0
3.0
2.0
1.0
0.0
risk
pote
ntia
l poi
nts
[wei
ghte
d]
FLX
risk potential
SB
VOC abatementcuringdrive power/energytruckdiesel useinks
0.6
0.5
0.4
0.3
0.2
0.1
0.0
wei
ghte
d la
nd u
se m
2a/C
B
FLX
land use
SB
VOC abatementcuringdrive power/energytruckdiesel useinks
cycle are considered, for example for the generation and
use of electricity. The effect of these air emissions in the
environment varies depending on the type of gas. In order
to take account of this, the various emission quantities
are linked to scientifically determined assessment factors1.
Using this method, the emissions of 21 kg of carbon
dioxide have the same greenhouse effect as 1 kg of
methane. These so-called impact factors are used for
each emission. Some emissions play a role in several
impact categories.
Ethanol use in the solvent-based ink formulation results in
a large contribution in the acidification potential compared
to the water-based alternative.
The main contributors to the GWP of each alternative
include the CO2 emitted during the ink formulation, drive
power, and curing stages. Additionally, the solvent-based
ink system contains a VOC abatement stage that has a
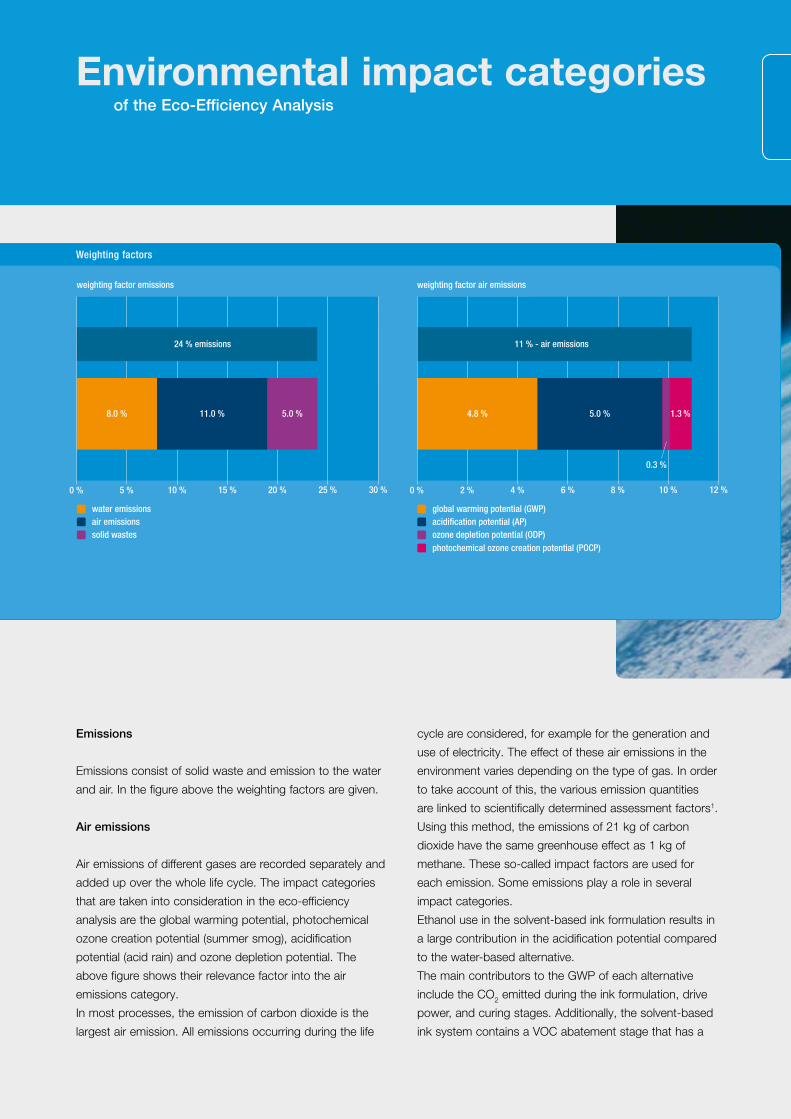
Emissions
Emissions consist of solid waste and emission to the water
and air. In the figure above the weighting factors are given.
Air emissions
Air emissions of different gases are recorded separately and
added up over the whole life cycle. The impact categories
that are taken into consideration in the eco-efficiency
analysis are the global warming potential, photochemical
ozone creation potential (summer smog), acidification
potential (acid rain) and ozone depletion potential. The
above figure shows their relevance factor into the air
emissions category.
In most processes, the emission of carbon dioxide is the
largest air emission. All emissions occurring during the life
Weighting factors
0 % 5 % 10 % 15 % 20 % 25 % 30 %
weighting factor emissions
water emissionsair emissionssolid wastes
24 % emissions
8.0 % 11.0 % 5.0 %
0 % 2 % 4 % 6 % 8 % 10 % 12 %
weighting factor air emissions
global warming potential (GWP)acidification potential (AP)ozone depletion potential (ODP)photochemical ozone creation potential (POCP)
11 % - air emissions
4.8 % 5.0 %
0.3 %
1.3 %
Environmental impact categories of the Eco-Efficiency Analysis
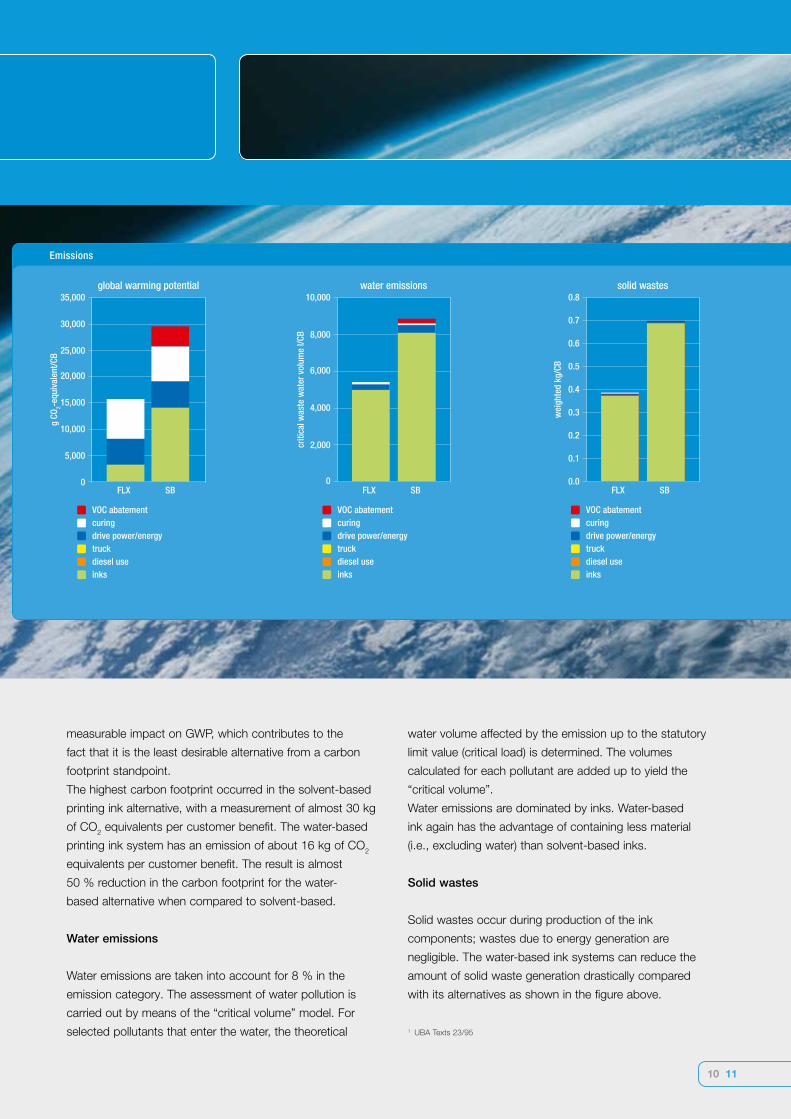
measurable impact on GWP, which contributes to the
fact that it is the least desirable alternative from a carbon
footprint standpoint.
The highest carbon footprint occurred in the solvent-based
printing ink alternative, with a measurement of almost 30 kg
of CO2 equivalents per customer benefit. The water-based
printing ink system has an emission of about 16 kg of CO2
equivalents per customer benefit. The result is almost
50 % reduction in the carbon footprint for the water-
based alternative when compared to solvent-based.
Water emissions
Water emissions are taken into account for 8 % in the
emission category. The assessment of water pollution is
carried out by means of the “critical volume” model. For
selected pollutants that enter the water, the theoretical
water volume affected by the emission up to the statutory
limit value (critical load) is determined. The volumes
calculated for each pollutant are added up to yield the
“critical volume”.
Water emissions are dominated by inks. Water-based
ink again has the advantage of containing less material
(i.e., excluding water) than solvent-based inks.
Solid wastes
Solid wastes occur during production of the ink
components; wastes due to energy generation are
negligible. The water-based ink systems can reduce the
amount of solid waste generation drastically compared
with its alternatives as shown in the figure above.
10 11
10,000
8,000
6,000
4,000
2,000
0
criti
cal w
aste
wat
er v
olum
e I/C
B
FLX
water emissions
SB
VOC abatementcuringdrive power/energytruckdiesel useinks
0.8
0.7
0.6
0.5
0.4
0.3
0.2
0.1
0.0
wei
ghte
d kg
/CB
FLX
solid wastes
SB
VOC abatementcuringdrive power/energytruckdiesel useinks
35,000
30,000
25,000
20,000
15,000
10,000
5,000
0
g CO
2-eq
uiva
lent
/CB
FLX
global warming potential
SB
VOC abatementcuringdrive power/energytruckdiesel useinks
Emissions
1 UBA Texts 23/95
energy consumption
risk potential
land use
resource consumption
emissions
toxicity potential
Joncryl® FLX
solvent-based
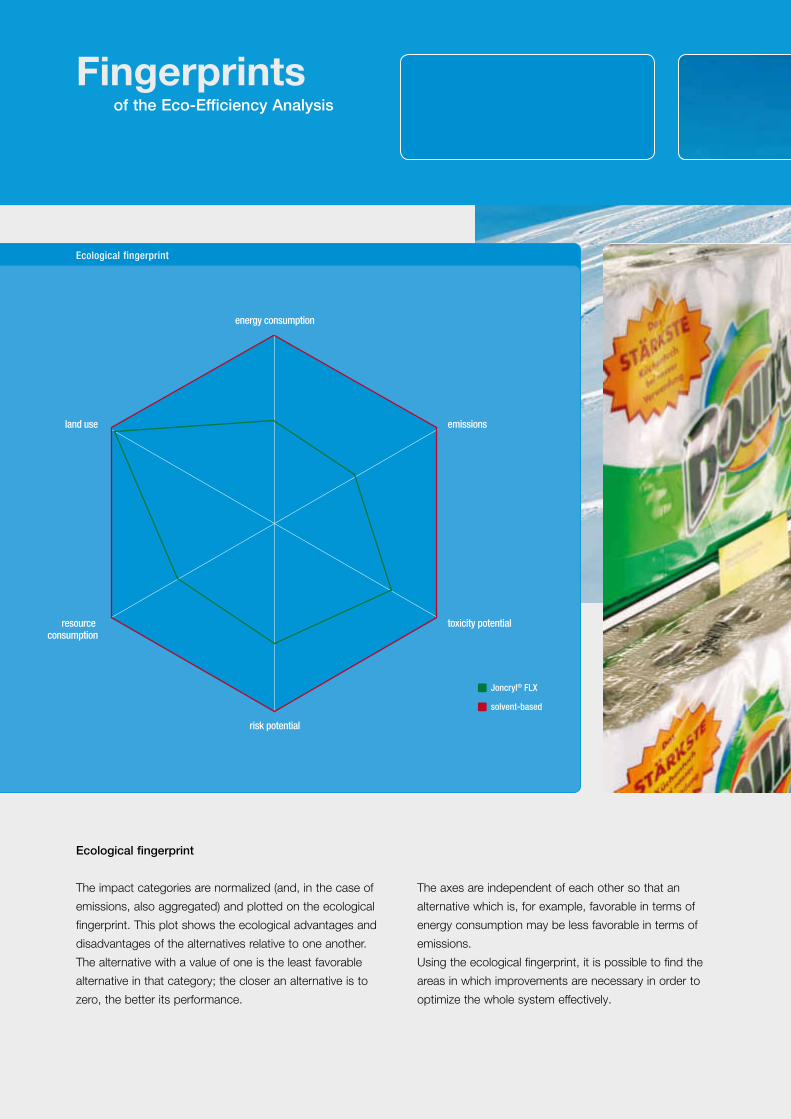
Ecological fingerprint
The axes are independent of each other so that an
alternative which is, for example, favorable in terms of
energy consumption may be less favorable in terms of
emissions.
Using the ecological fingerprint, it is possible to find the
areas in which improvements are necessary in order to
optimize the whole system effectively.
Ecological fingerprint
The impact categories are normalized (and, in the case of
emissions, also aggregated) and plotted on the ecological
fingerprint. This plot shows the ecological advantages and
disadvantages of the alternatives relative to one another.
The alternative with a value of one is the least favorable
alternative in that category; the closer an alternative is to
zero, the better its performance.
Fingerprints of the Eco-Efficiency Analysis
12 13
45
40
35
30
25
20
15
10
5
0
EUR/
CB
FLX SB
wasteshandlingthermal oxidizerlaborelectricitynatural gasinks
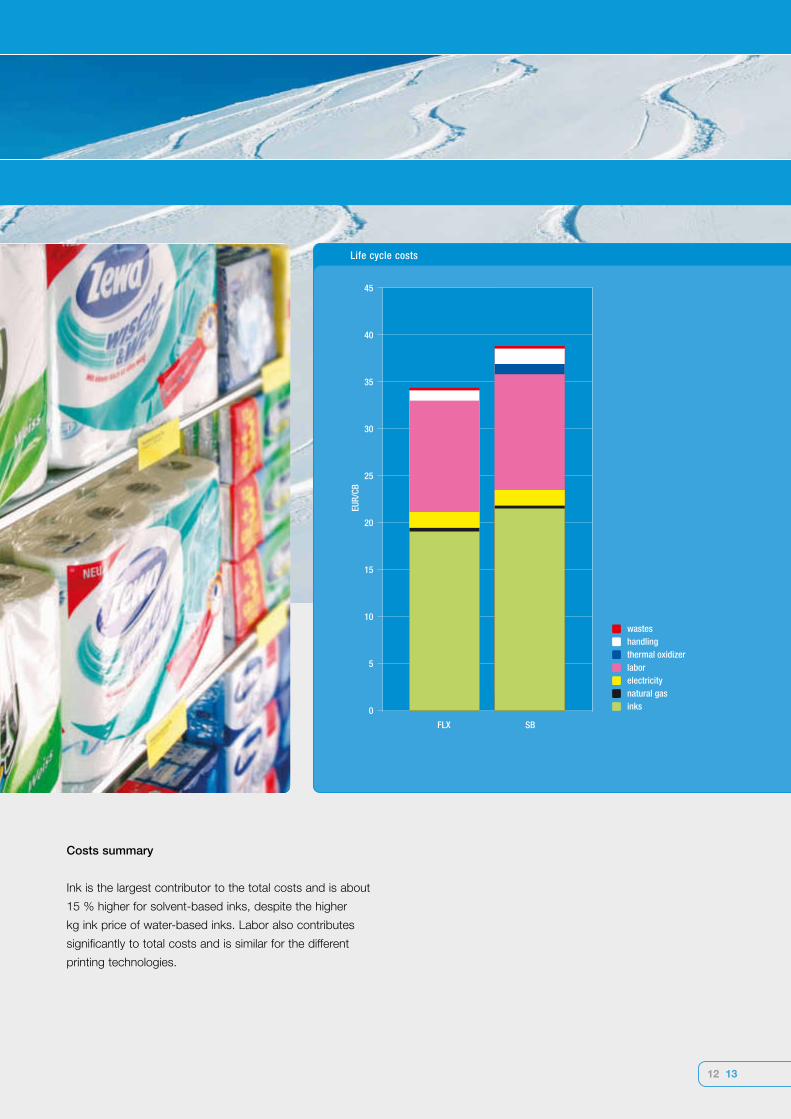
Life cycle costs
Costs summary
Ink is the largest contributor to the total costs and is about
15 % higher for solvent-based inks, despite the higher
kg ink price of water-based inks. Labor also contributes
significantly to total costs and is similar for the different
printing technologies.
Results of the Eco-Efficiency Analysis
2.0 1.0 0.0
0.0
1.0
2.0
costs (norm.)
envi
ronm
enta
l im
pact
(nor
m.)
solvent-based
Joncryl® FLX
Overall environmental impact and life cycle costs
Customer benefit
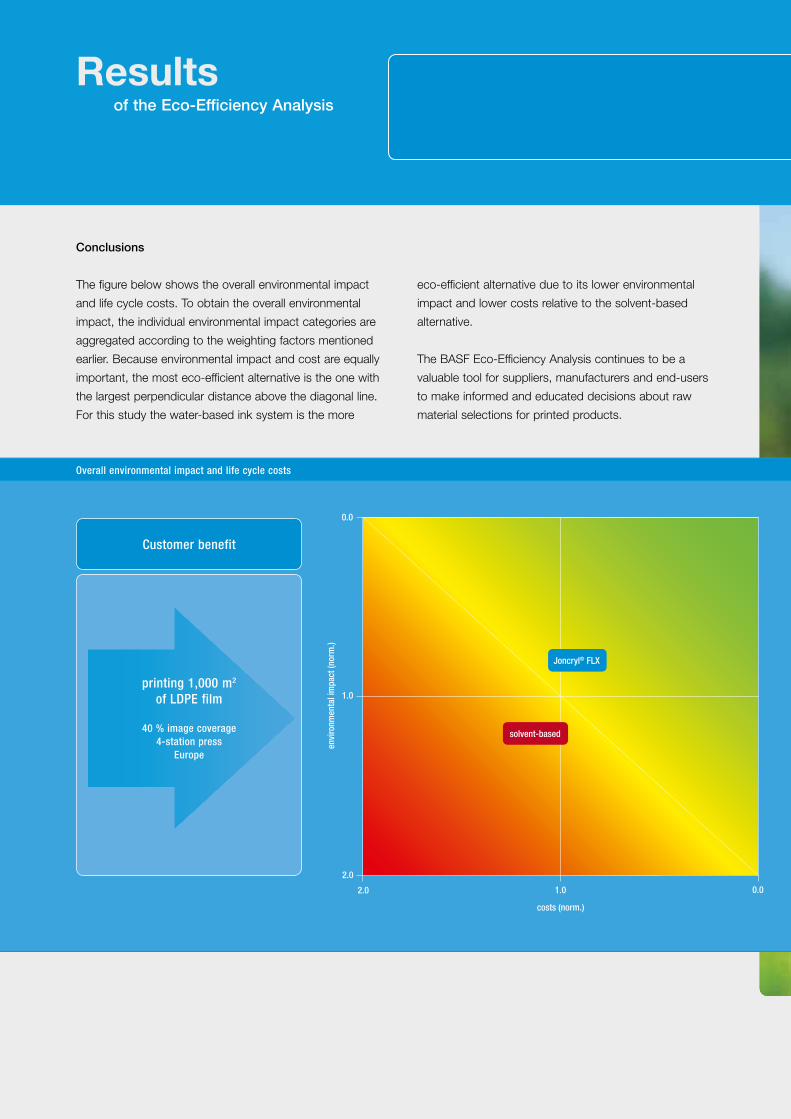
eco-efficient alternative due to its lower environmental
impact and lower costs relative to the solvent-based
alternative.
The BASF Eco-Efficiency Analysis continues to be a
valuable tool for suppliers, manufacturers and end-users
to make informed and educated decisions about raw
material selections for printed products.
Conclusions
The figure below shows the overall environmental impact
and life cycle costs. To obtain the overall environmental
impact, the individual environmental impact categories are
aggregated according to the weighting factors mentioned
earlier. Because environmental impact and cost are equally
important, the most eco-efficient alternative is the one with
the largest perpendicular distance above the diagonal line.
For this study the water-based ink system is the more
printing 1,000 m2 of LDPE film
40 % image coverage4-station press
Europe

14 15
Result
water-based ink is themost efficient alternativedue to lower environmental impact and lower cost
ED
C 0
110 eBASF SE
67056 Ludwigshafen
Germany www.basf.com/resins
The data contained in this publication are based on our current knowledge and
experience. In view of the many factors that may affect processing and application
of our product, these data do not relieve processors from carrying out their own
investigations and tests; neither do these data imply any guarantee of certain
properties, nor the suitability of the product for a specific purpose. Any descriptions,
drawings, photographs, data, proportions, weights, etc. given herein may change
without prior information and do not constitute the agreed contractual quality of the
product. The agreed contractual quality of the product results exclusively from the
statements made in the product specification. It is the responsibility of the recipient of
our product to ensure that any proprietary rights and existing laws and legislation are
observed. When handling these products, advice and information given in the safety
data sheet must be complied with. Further, protective and workplace hygiene measures
adequate for handling chemicals must be observed.
® = registered trademark of the BASF Group
BASF SE
Success-Info-Point
67056 Ludwigshafen
Germany
Tel.: +49 621 60-79777
Fax: +49 621 60-6679777
www.basf.de/success
www.ecoefficiency.basf.com
BASF Nederland B.V.
Resins & Additives
Innovatielaan 1
8466 SN Nijehaske
P.O. Box 390
8440 AJ Heerenveen
The Netherlands
Tel.: +31 513 619-662
Fax: +31 513 619-600
Contact