Embed Size (px)
Citation preview
Ecology
Ecology
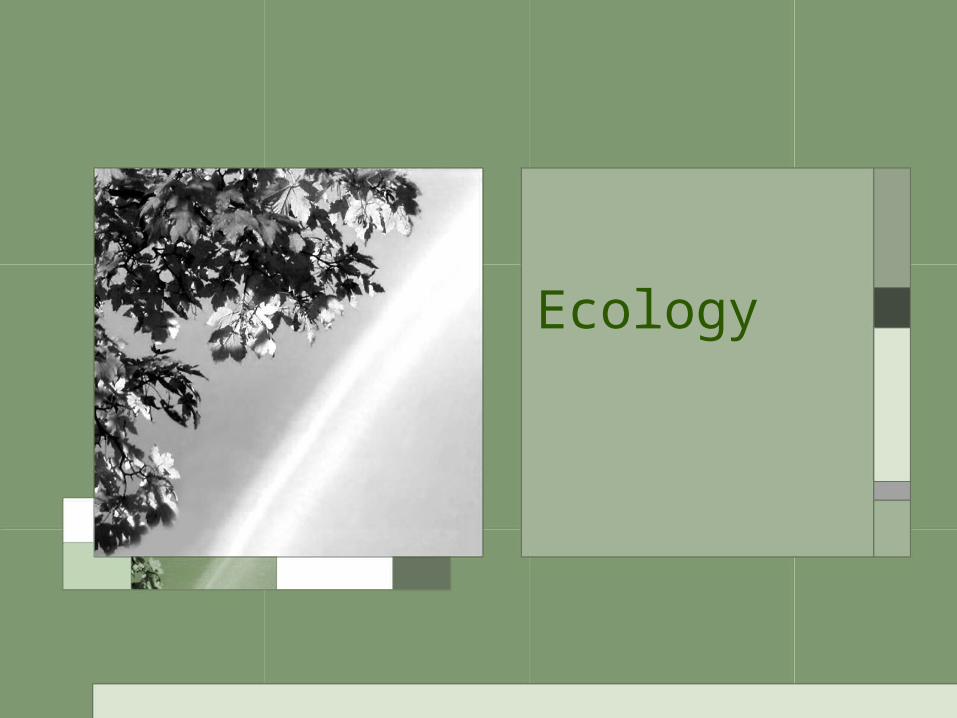
• Scientific study of the interactions between organisms and their environment
Levels of Study
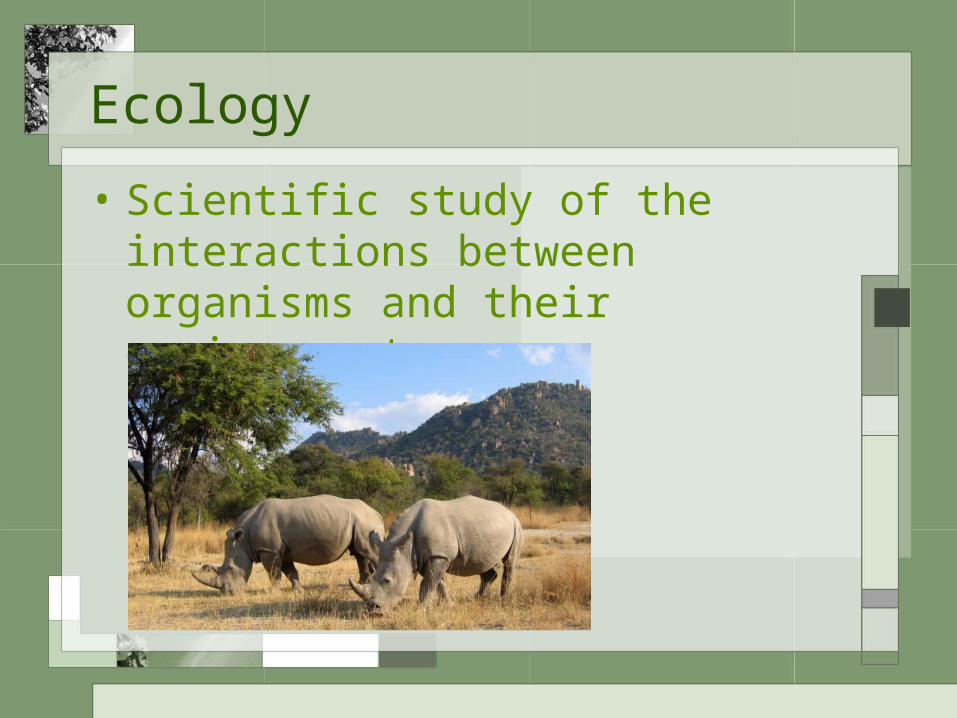
• Organism– Individual– 1 turtle
Levels of Study
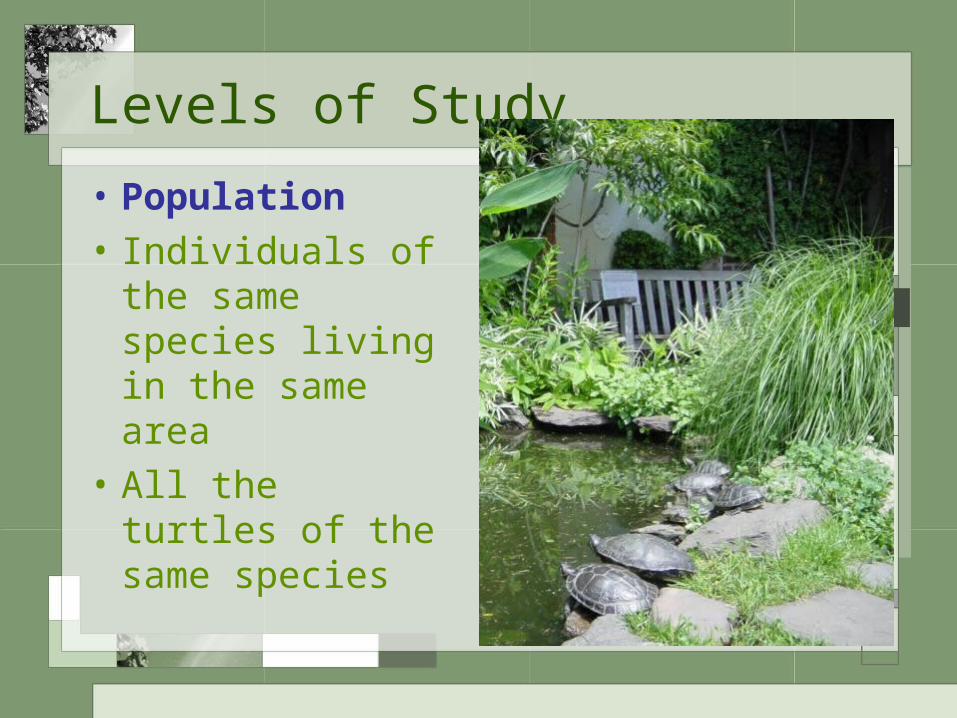
• Population• Individuals of the same species living in the same area
• All the turtles of the same species
Levels of Study
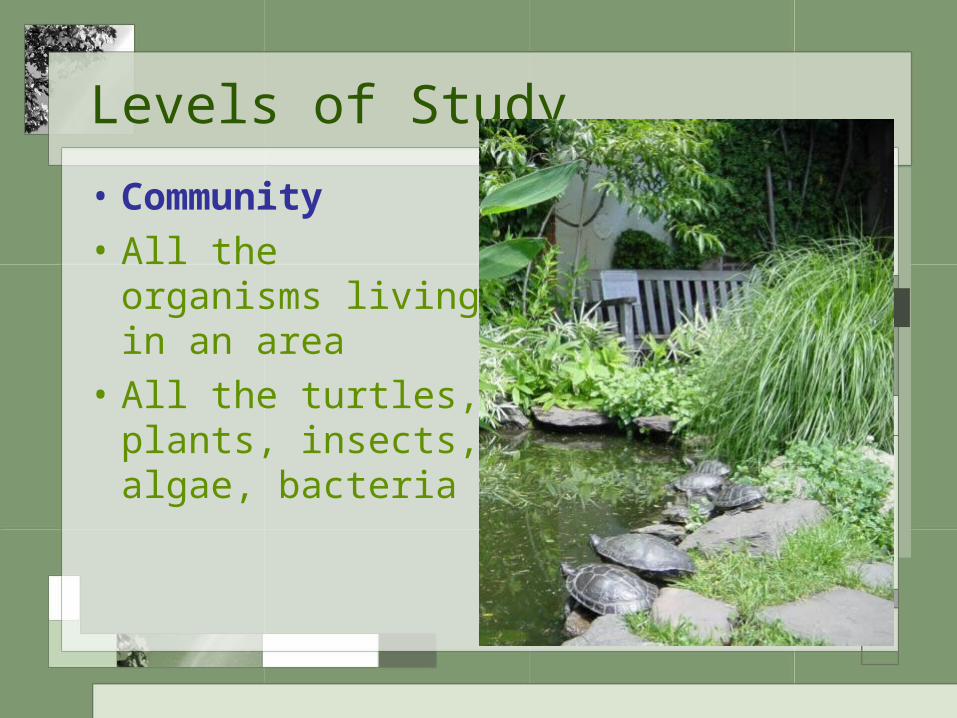
• Community• All the organisms living in an area
• All the turtles, plants, insects, algae, bacteria
Levels of Study
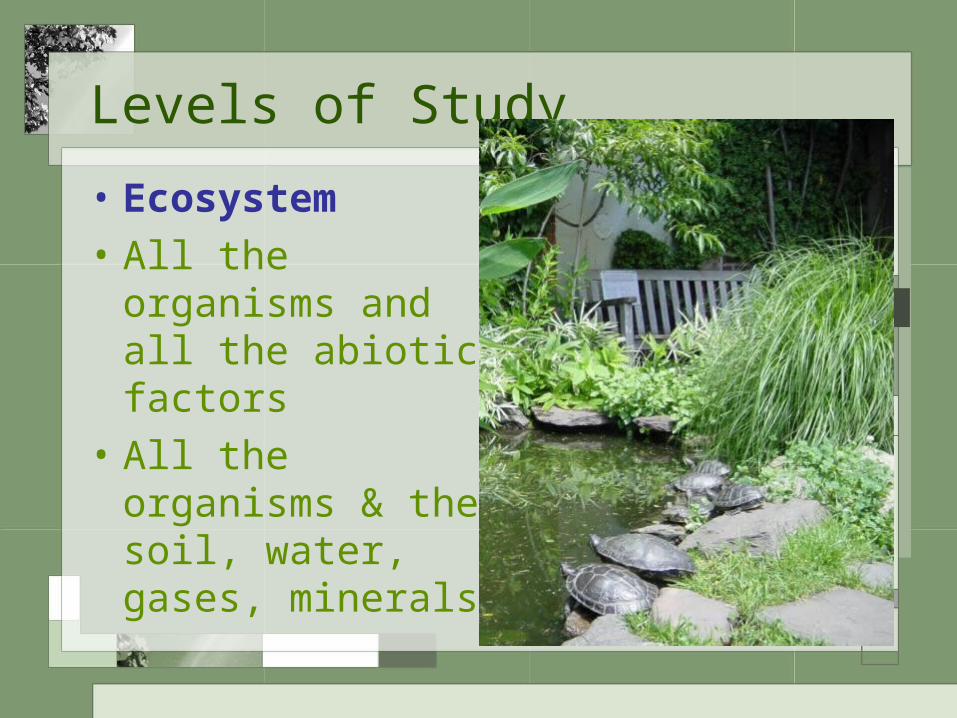
• Ecosystem• All the organisms and all the abiotic factors
• All the organisms & the soil, water, gases, minerals
Levels of Study
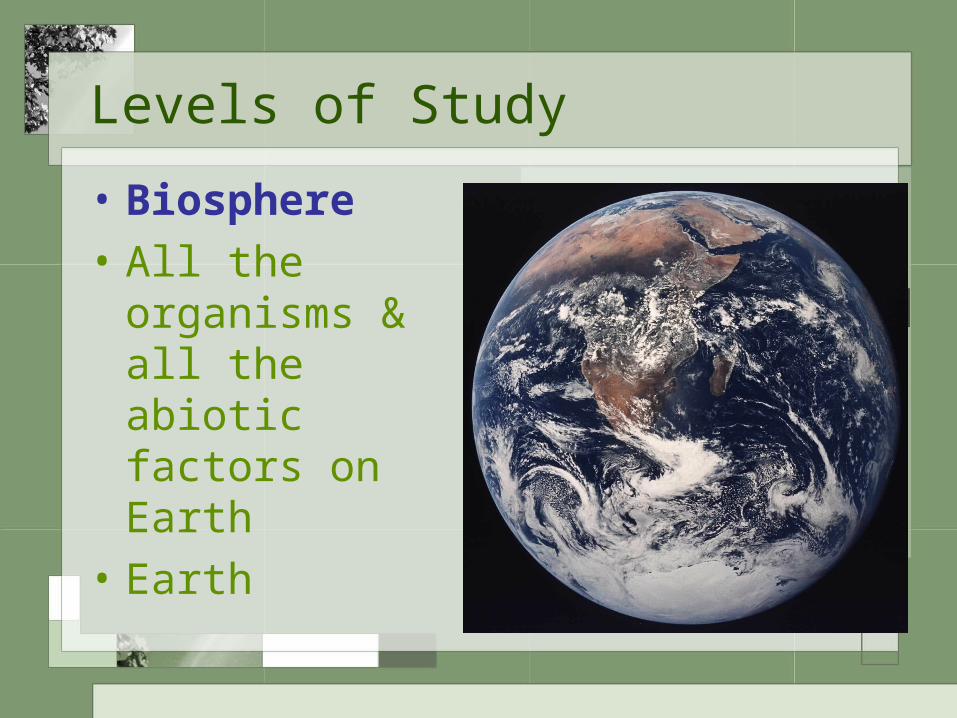
• Biosphere• All the organisms & all the abiotic factors on Earth
• Earth
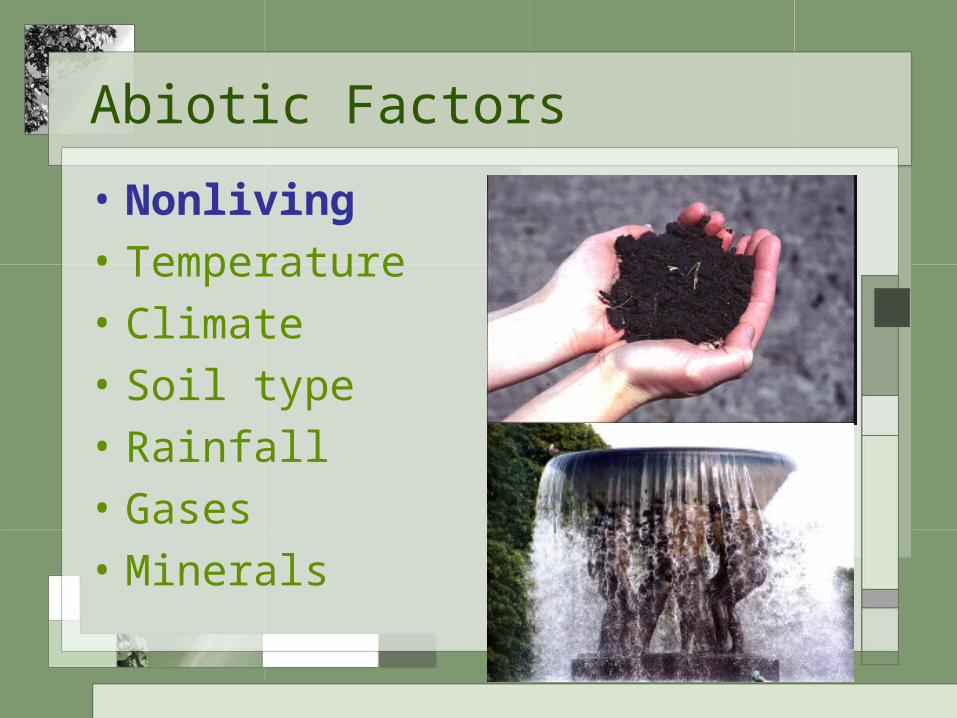
Abiotic Factors
• Nonliving• Temperature• Climate• Soil type• Rainfall• Gases• Minerals
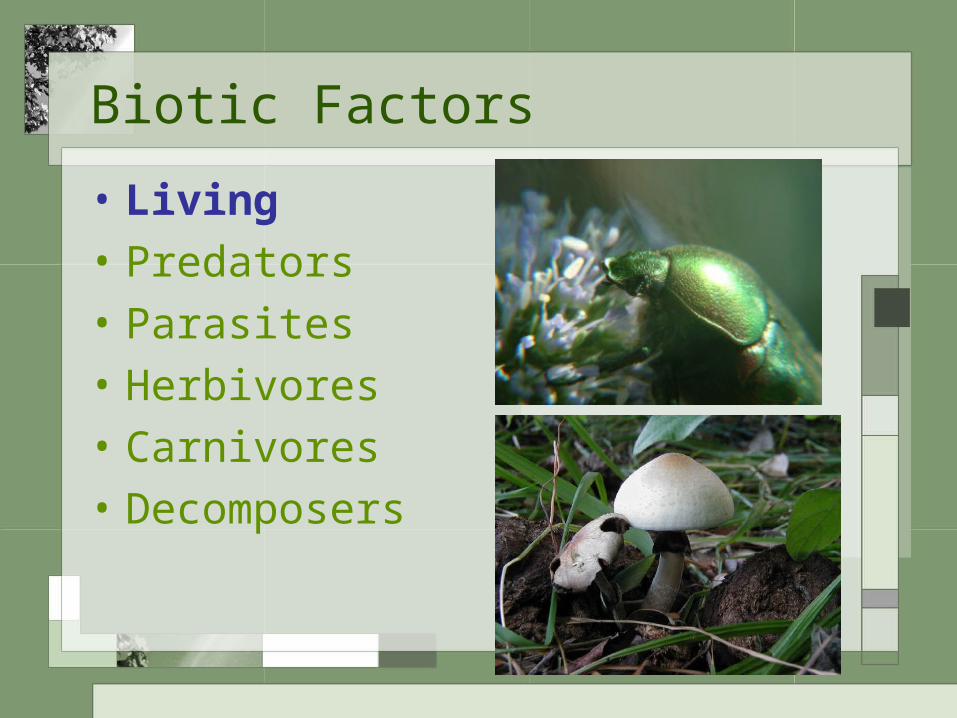
Biotic Factors
• Living• Predators• Parasites• Herbivores• Carnivores• Decomposers
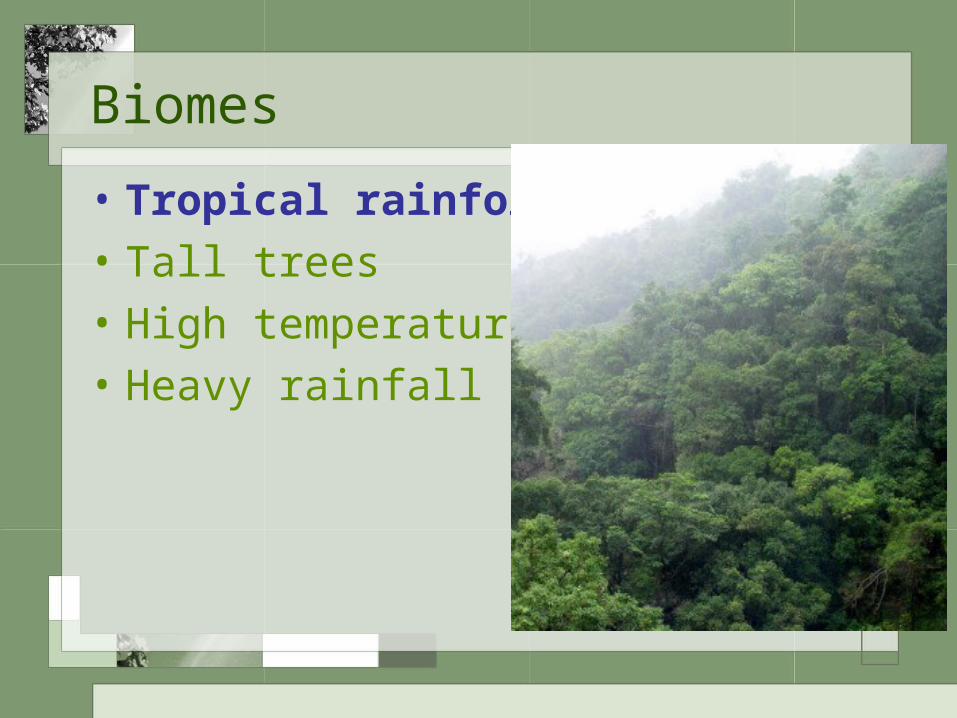
Biomes
• Tropical rainforest• Tall trees• High temperature• Heavy rainfall
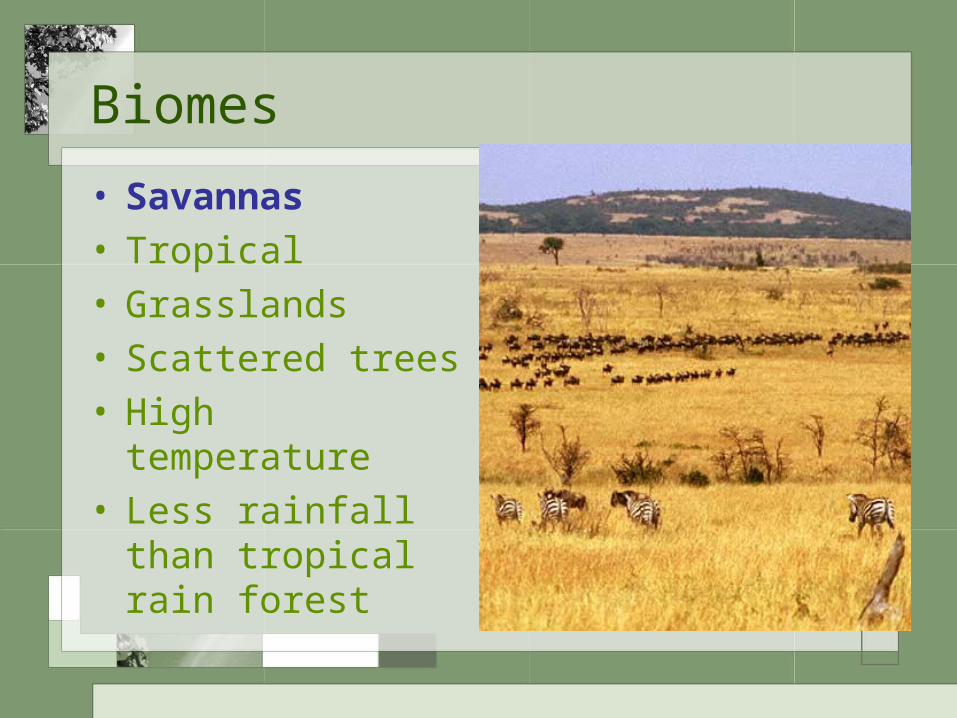
Biomes
• Savannas• Tropical• Grasslands• Scattered trees• High temperature
• Less rainfall than tropical rain forest
Biomes
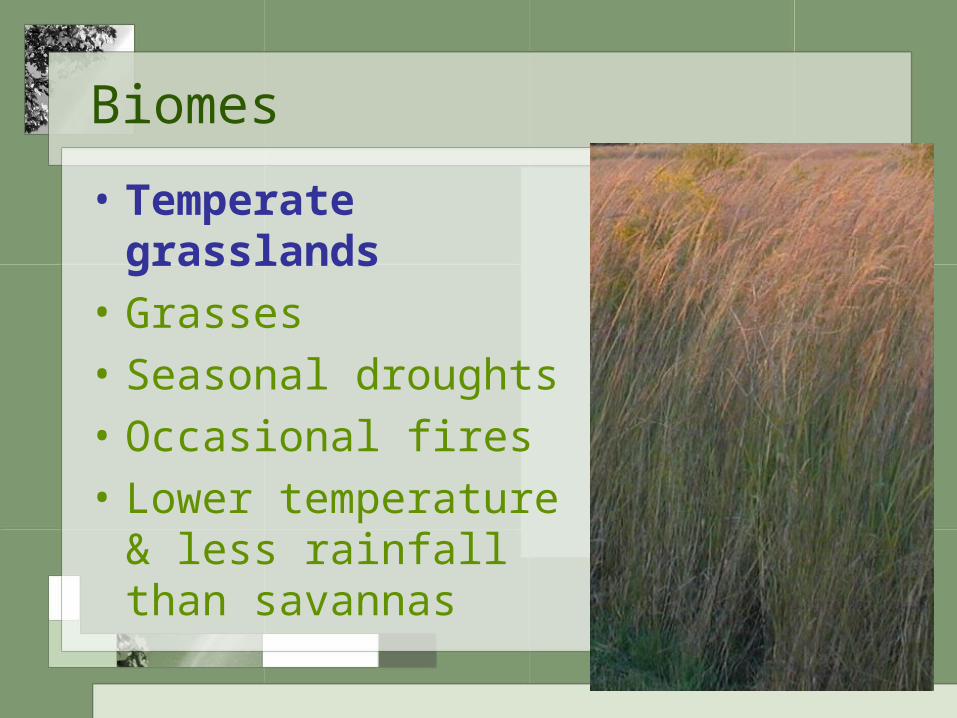
• Temperate grasslands
• Grasses• Seasonal droughts• Occasional fires• Lower temperature & less rainfall than savannas
Biomes
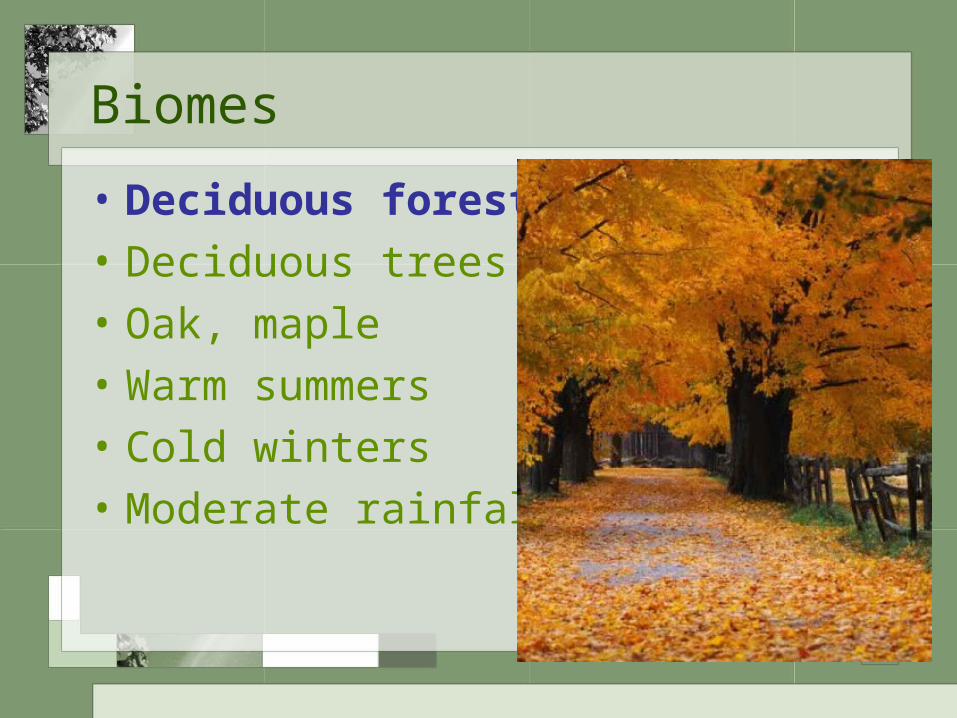
• Deciduous forests• Deciduous trees• Oak, maple• Warm summers• Cold winters• Moderate rainfall
Biomes
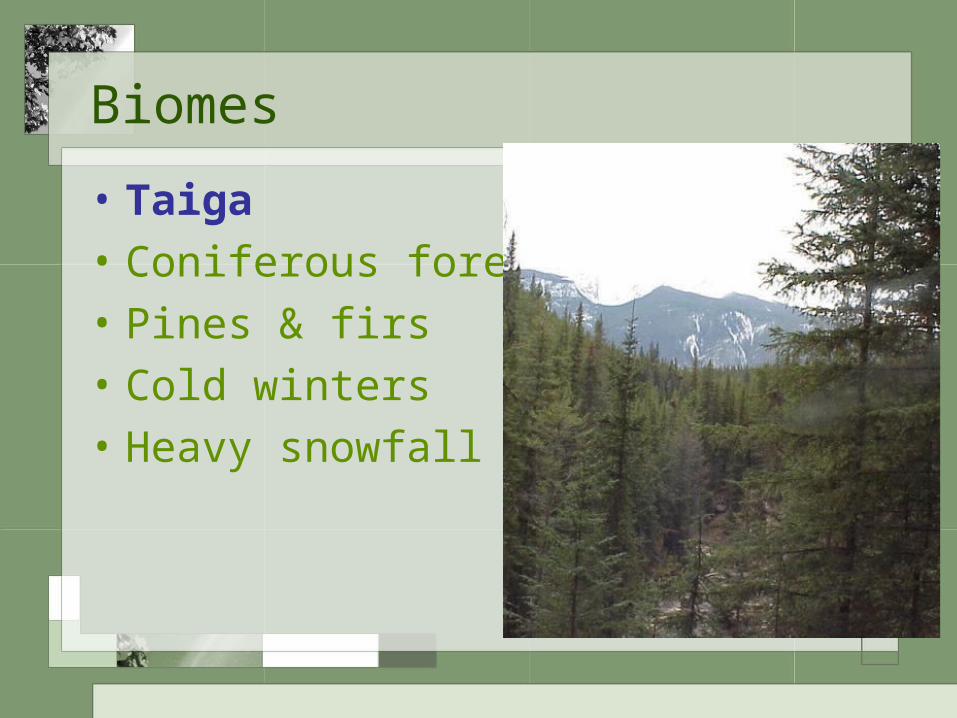
• Taiga• Coniferous forests• Pines & firs• Cold winters• Heavy snowfall
Biomes
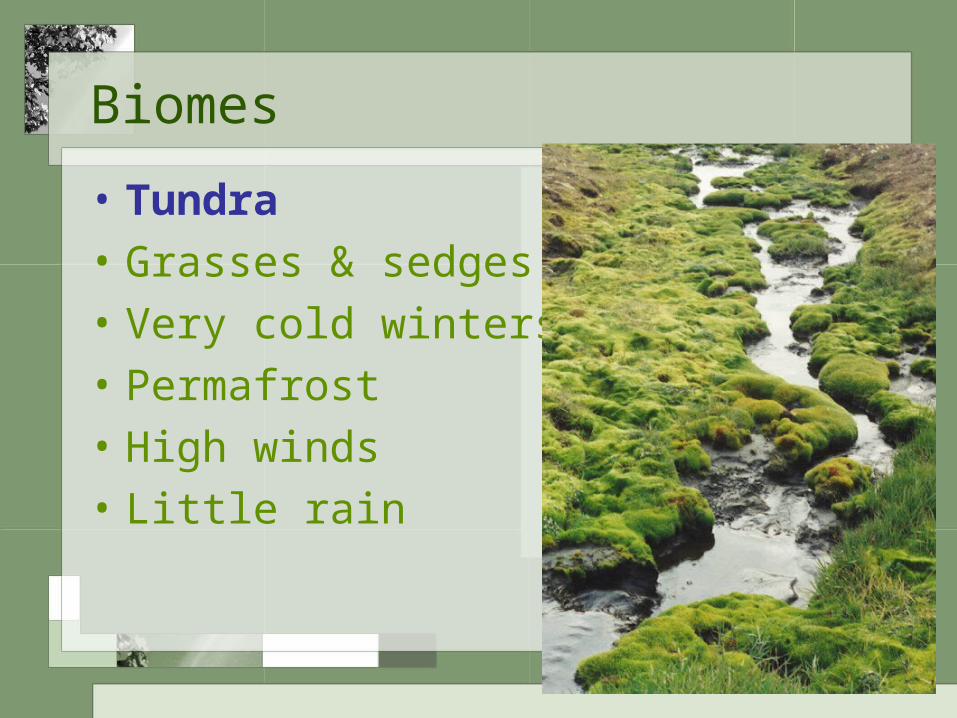
• Tundra• Grasses & sedges• Very cold winters• Permafrost• High winds• Little rain
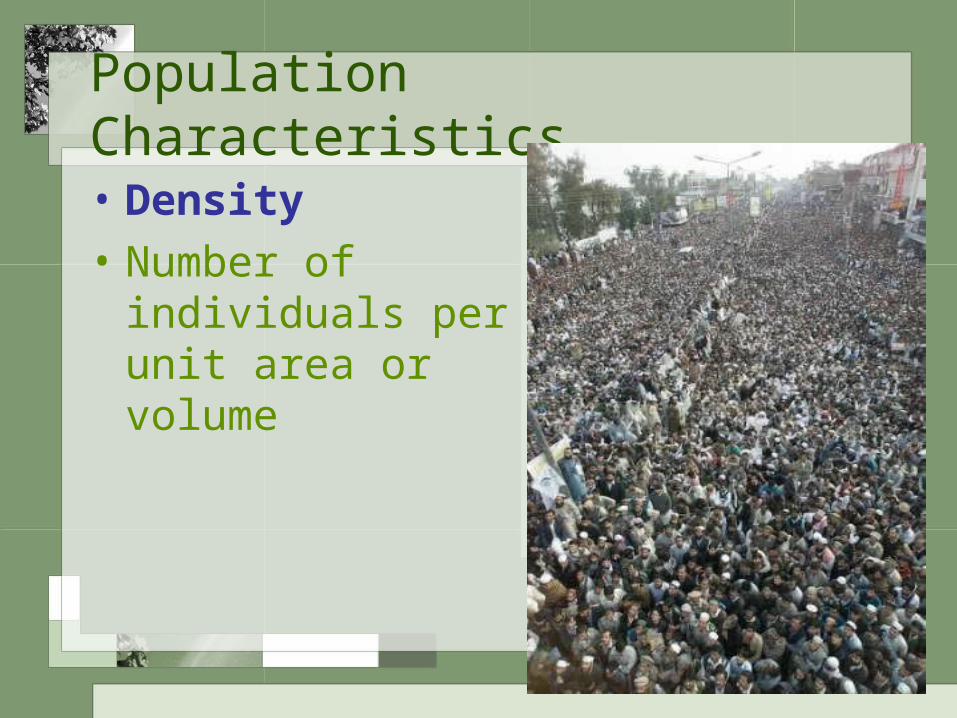
Population Characteristics• Density• Number of individuals per unit area or volume
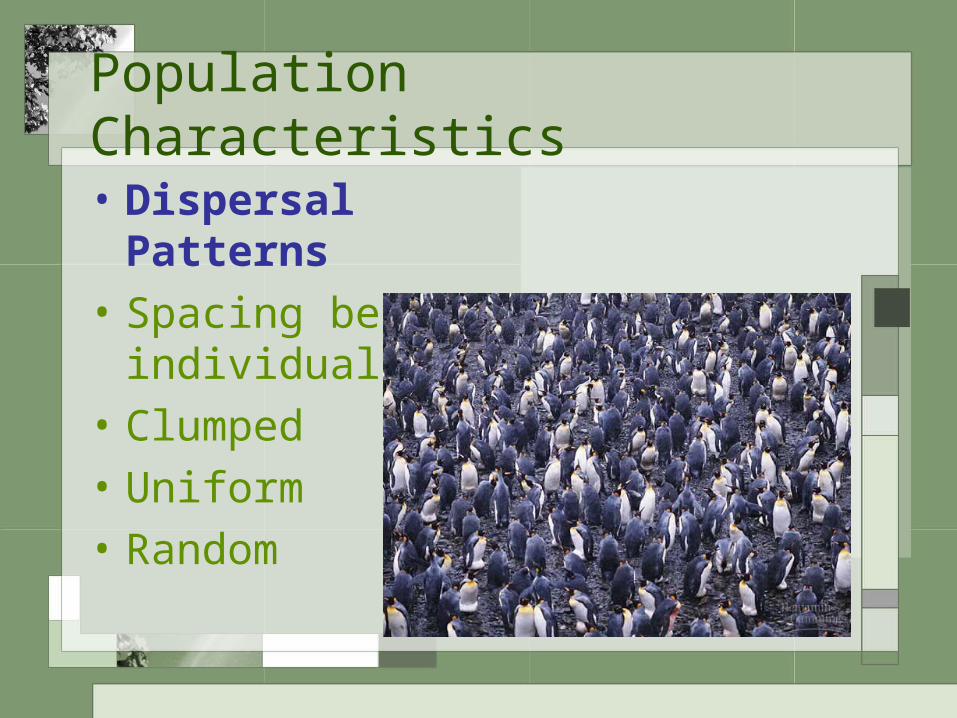
Population Characteristics• Dispersal Patterns
• Spacing between individuals
• Clumped• Uniform• Random
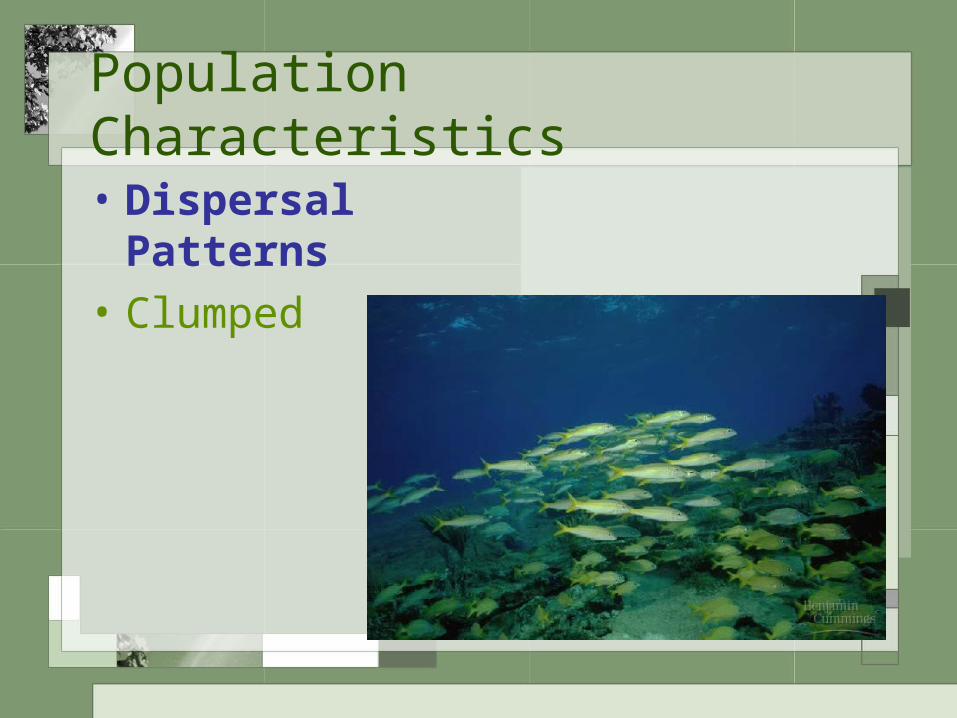
Population Characteristics• Dispersal Patterns
• Clumped
Population Characteristics• Dispersal Patterns
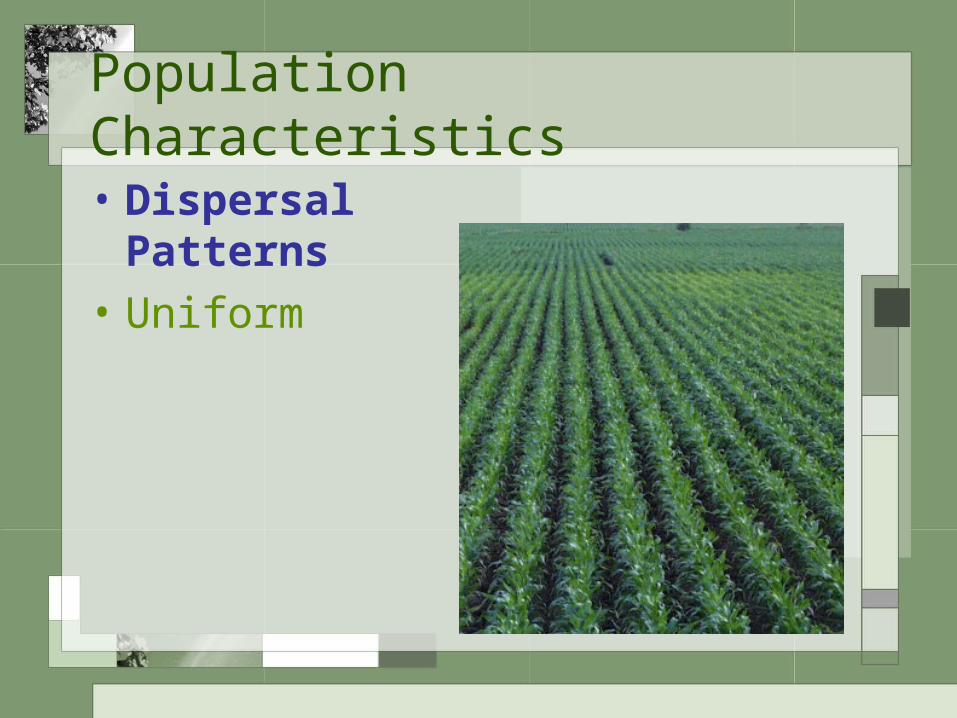
• Uniform
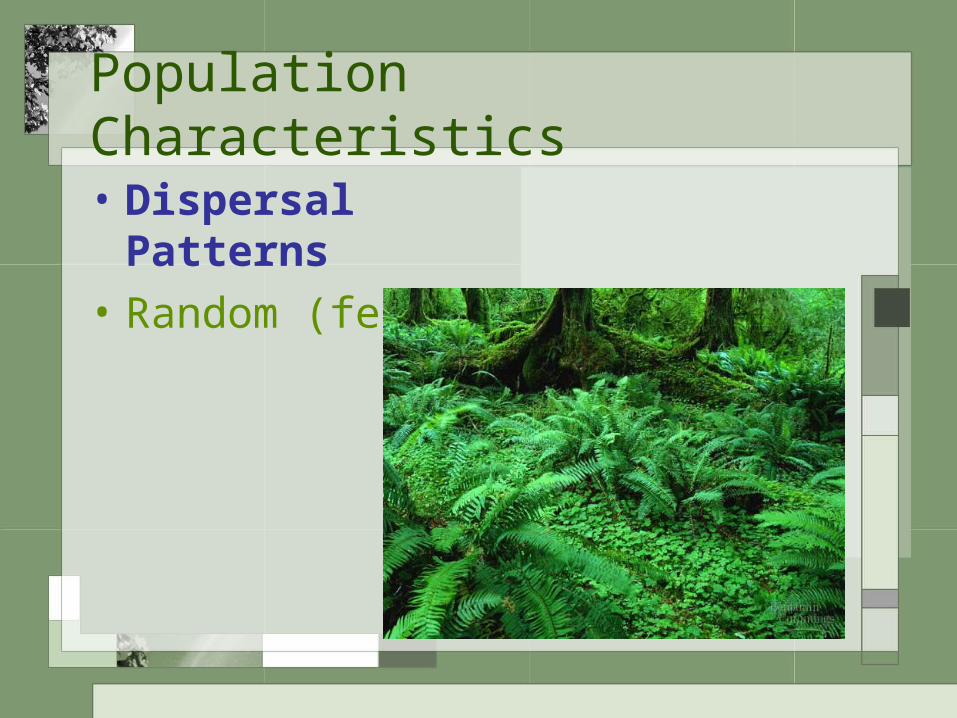
Population Characteristics• Dispersal Patterns
• Random (ferns)
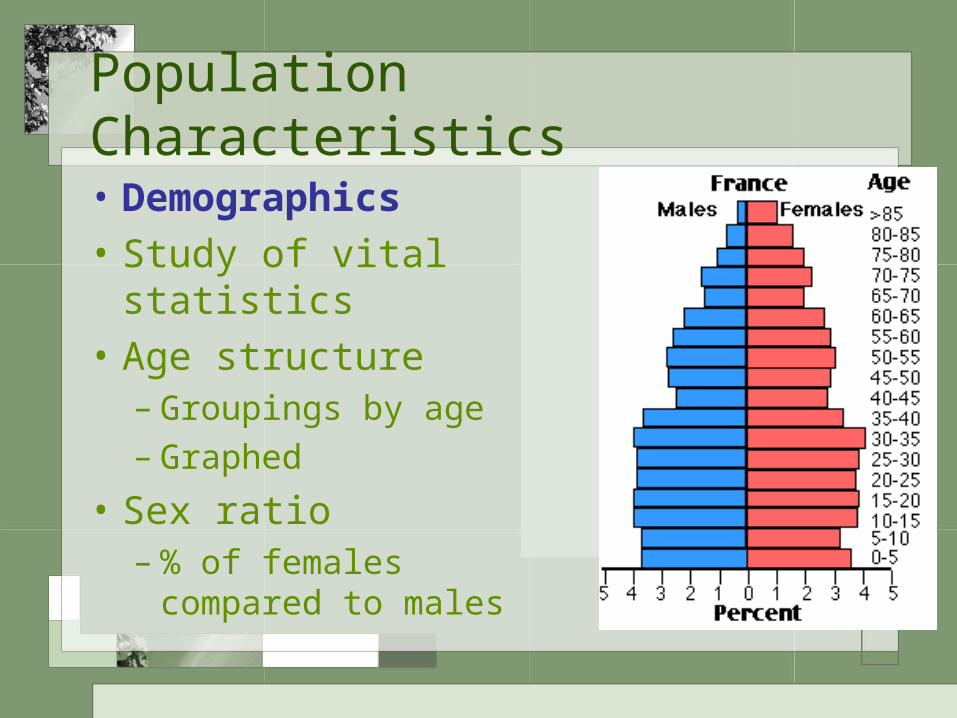
Population Characteristics• Demographics• Study of vital statistics
• Age structure– Groupings by age– Graphed
• Sex ratio– % of females compared to males
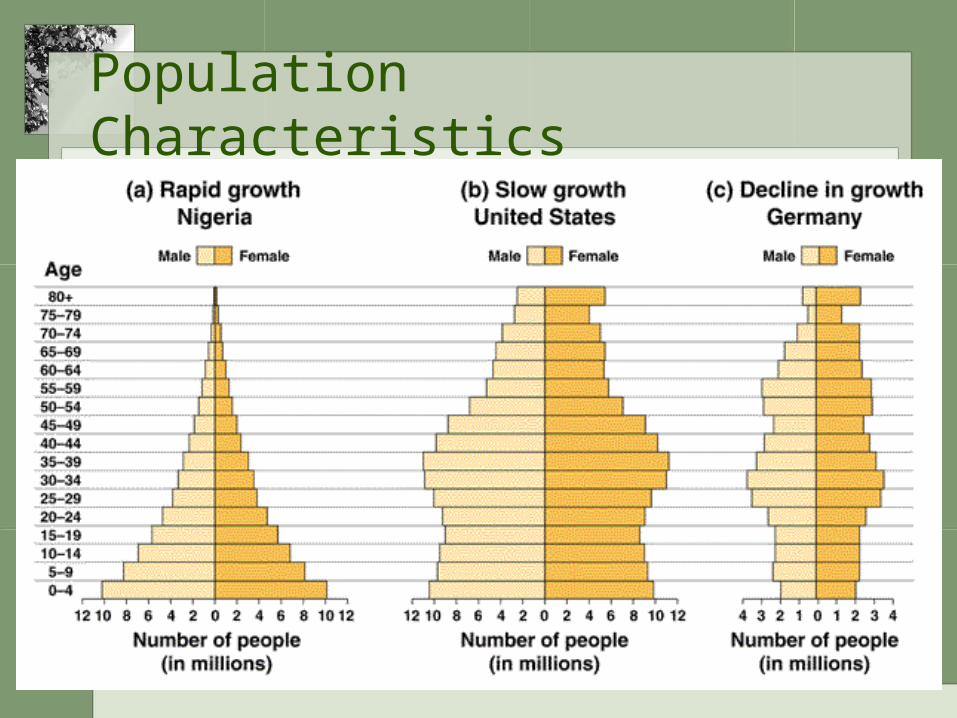
Population Characteristics
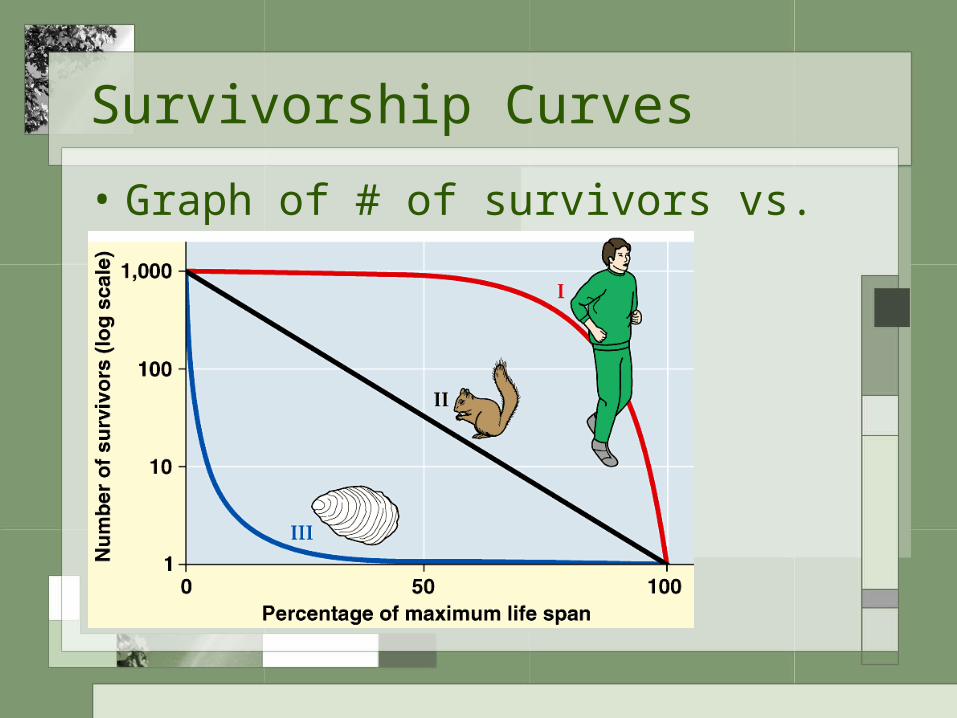
Survivorship Curves
• Graph of # of survivors vs. relative age
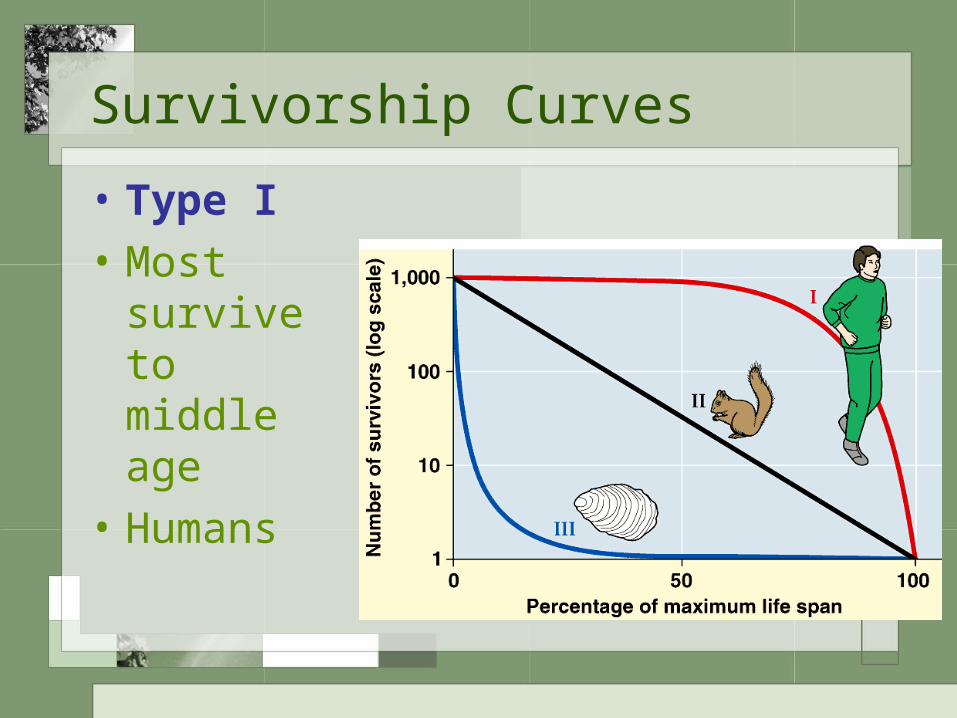
Survivorship Curves
• Type I• Most survive to middle age
• Humans
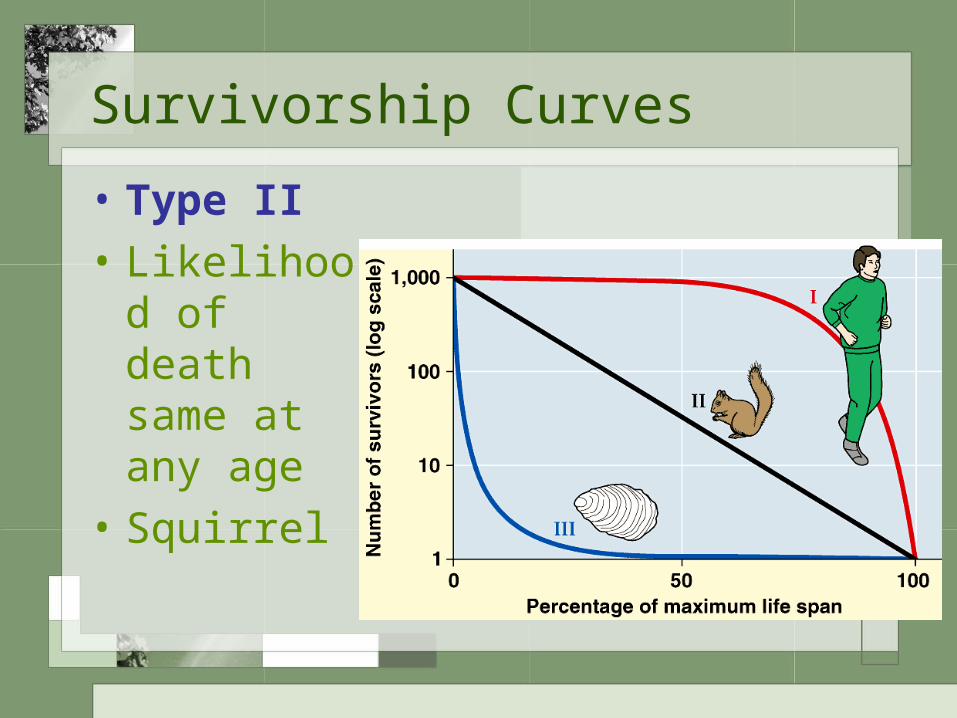
Survivorship Curves
• Type II• Likelihood of death same at any age
• Squirrel
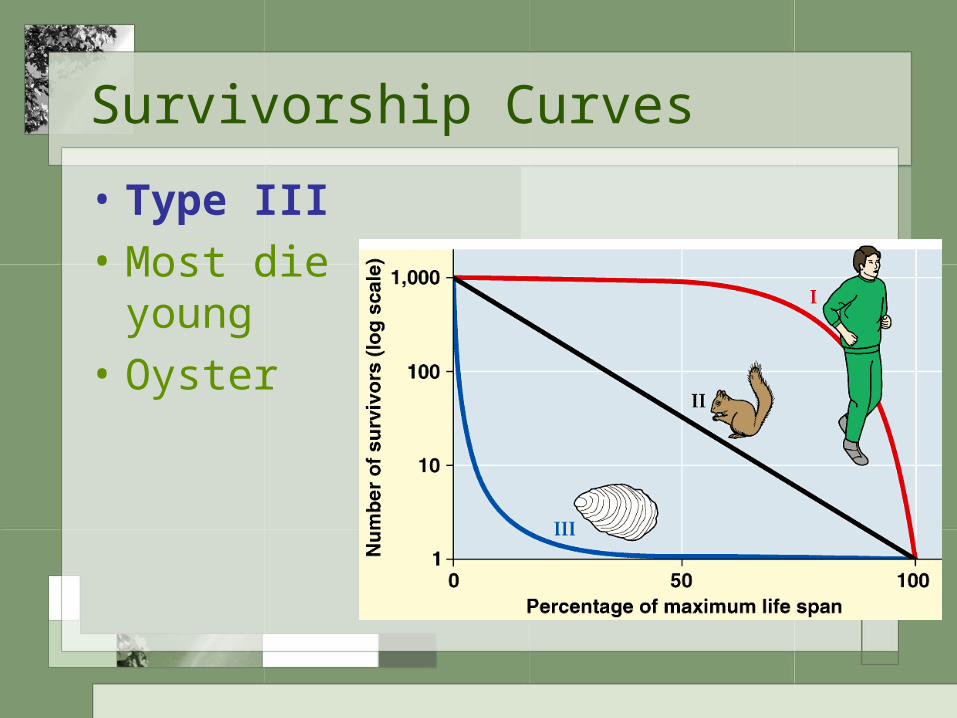
Survivorship Curves
• Type III• Most die young
• Oyster
Limiting Factors
• Prevent population from reaching biotic potential
• Types– Density dependent– Density independent
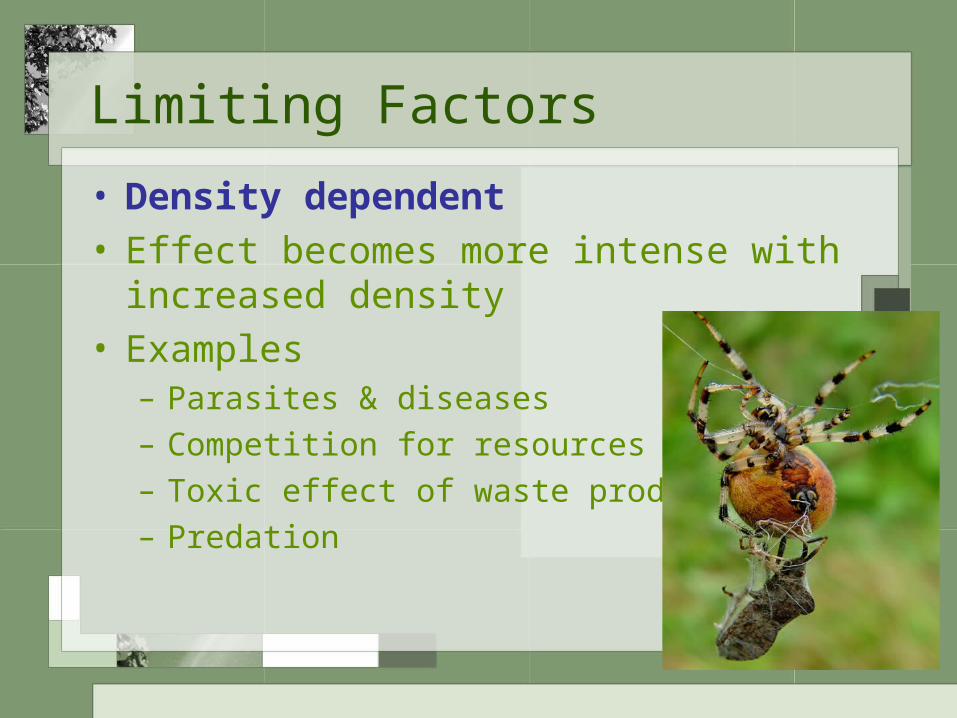
Limiting Factors
• Density dependent• Effect becomes more intense with increased density
• Examples– Parasites & diseases– Competition for resources– Toxic effect of waste products– Predation
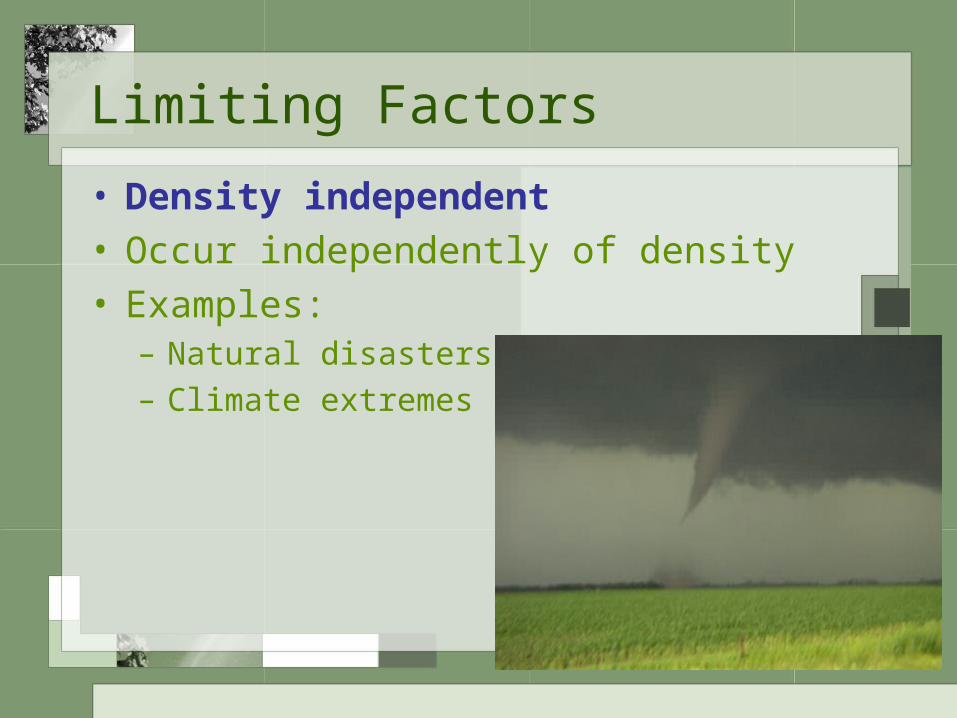
Limiting Factors
• Density independent• Occur independently of density• Examples:
– Natural disasters– Climate extremes
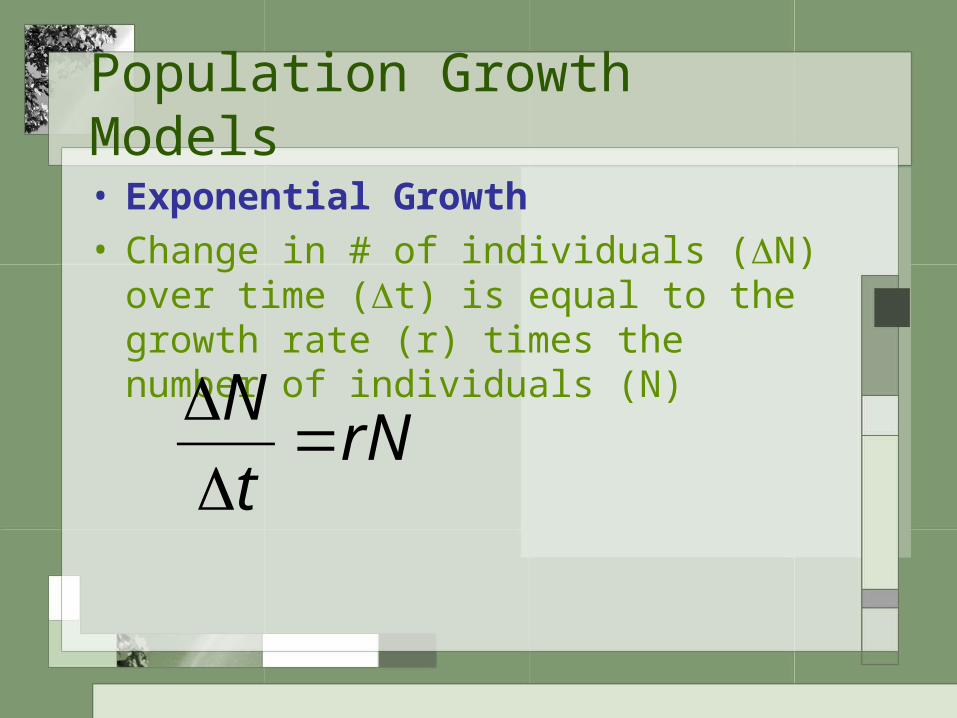
Population Growth Models• Exponential Growth• Change in # of individuals (N) over time (t) is equal to the growth rate (r) times the number of individuals (N)
rNt
N=
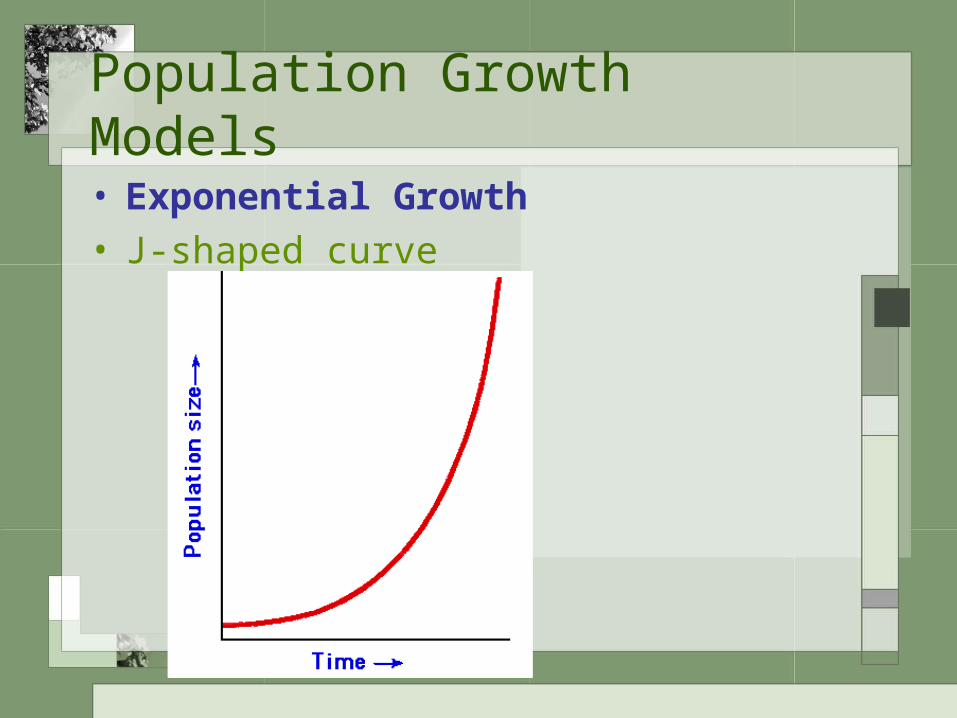
Population Growth Models• Exponential Growth• J-shaped curve
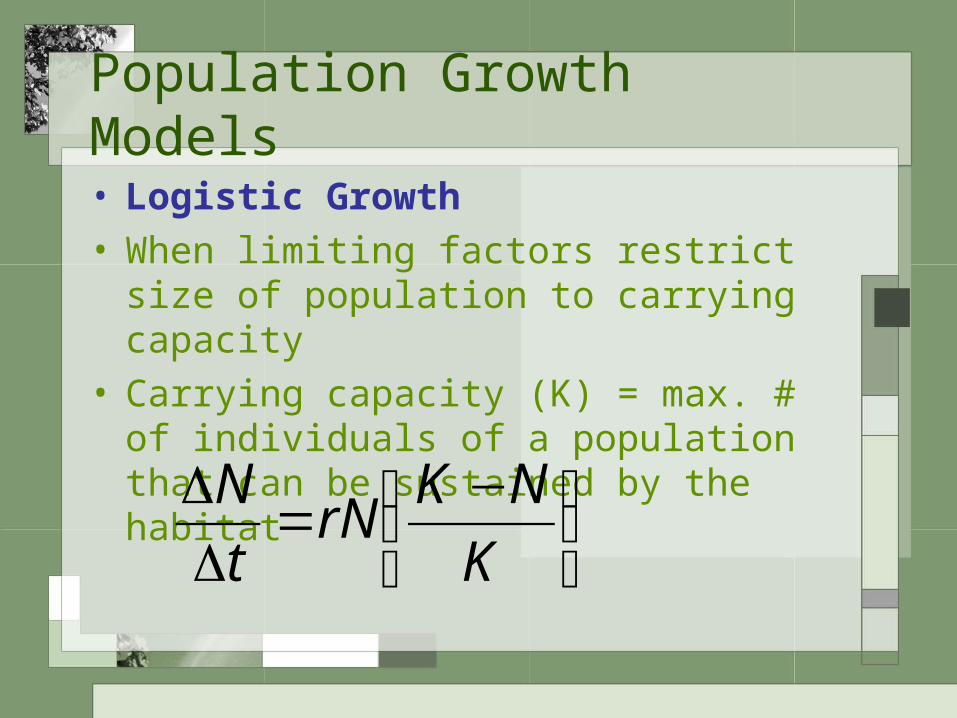
Population Growth Models• Logistic Growth• When limiting factors restrict size of population to carrying capacity
• Carrying capacity (K) = max. # of individuals of a population that can be sustained by the habitat ⎟
⎠
⎞⎜⎝
⎛ −=
K
NKrN
t
N
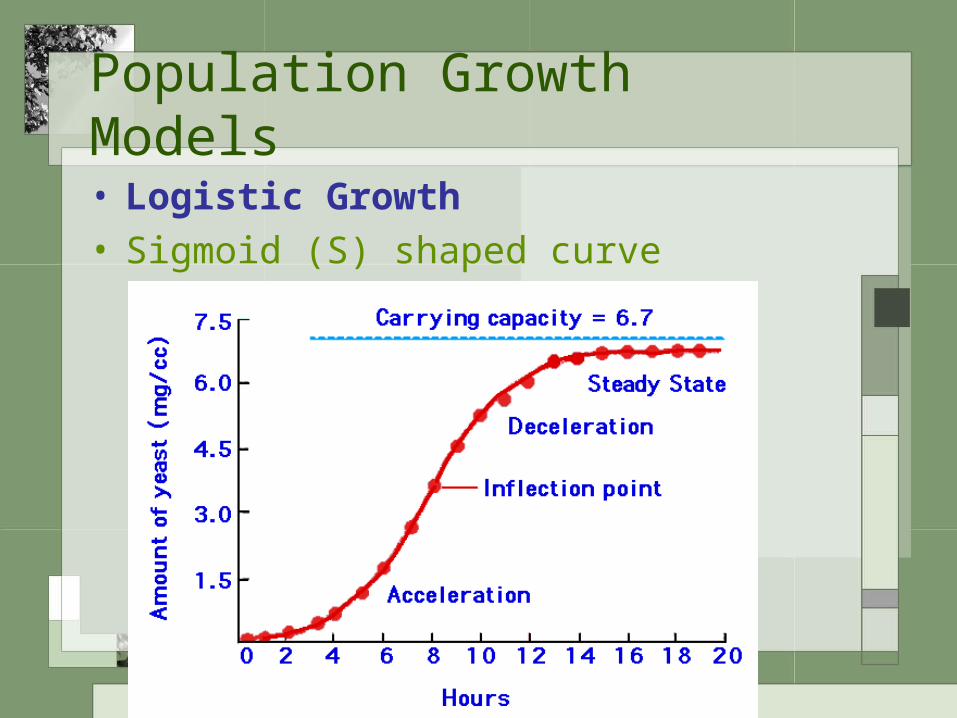
Population Growth Models• Logistic Growth• Sigmoid (S) shaped curve
Life-History Strategies
• r-selected species• Exhibit rapid growth (J-curve)• Examples – grasses, insects• Characterized by opportunistic species
– Quickly invade habitat– Quickly reproduce– Then die
• Produce many offspring that are small, mature quickly, require little parental care
Life-History Strategies
• k-selected species• Population size remains relatively constant
• Example - humans• Produce small number of relatively large offspring that require extensive parental care
• Reproduction occurs repeatedly during lifetime
Community Interactions
• Interspecific Competition• Competition between different species• When 2 species compete for same resources one will be more successful
• To survive, the less successful species– Must use slightly different resources
– Must use resources during different time of day
Community Interactions
• Predation• Any animal that totally or partly consumes a plant or animal
• True predator kills and eats another animal
• Parasite lives in and off a host• Herbivore is an animal that eats plants
Community Interactions
• Symbiosis• Two species that live together in close contact
• Types– Mutualism– Commensalism– Parasitism
Community Interactions
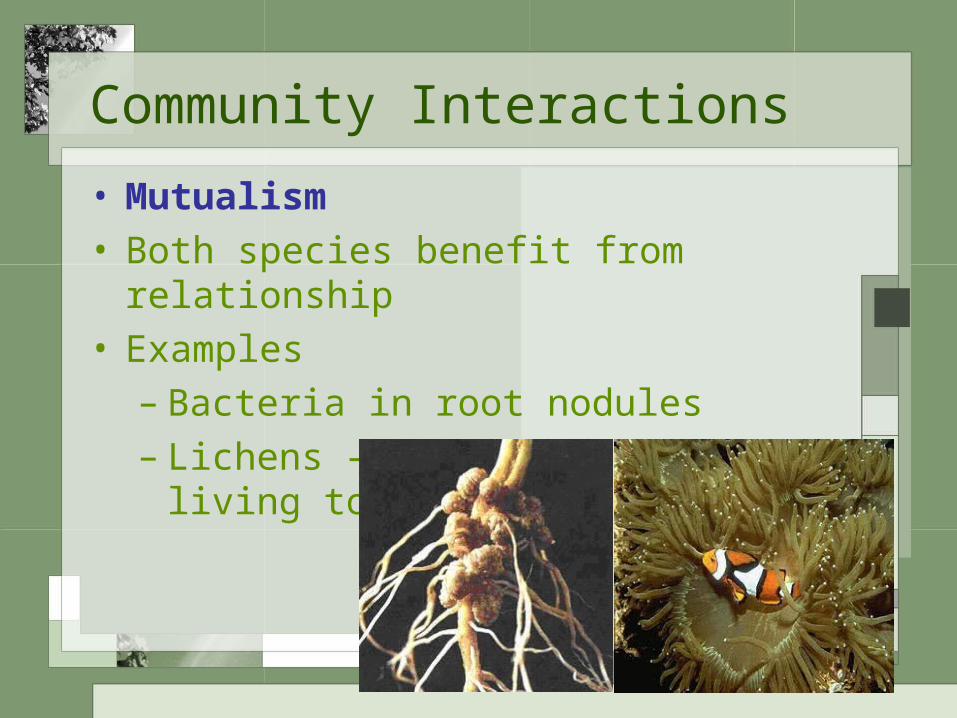
• Mutualism• Both species benefit from relationship
• Examples– Bacteria in root nodules– Lichens – algae & fungus living together
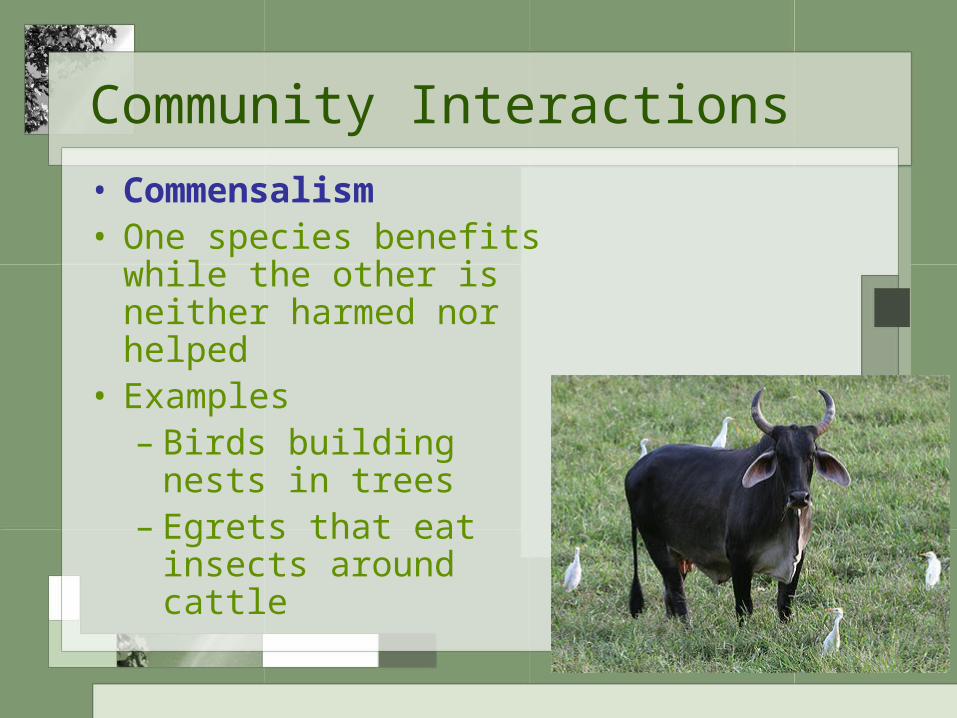
Community Interactions
• Commensalism• One species benefits while the other is neither harmed nor helped
• Examples– Birds building nests in trees
– Egrets that eat insects around cattle
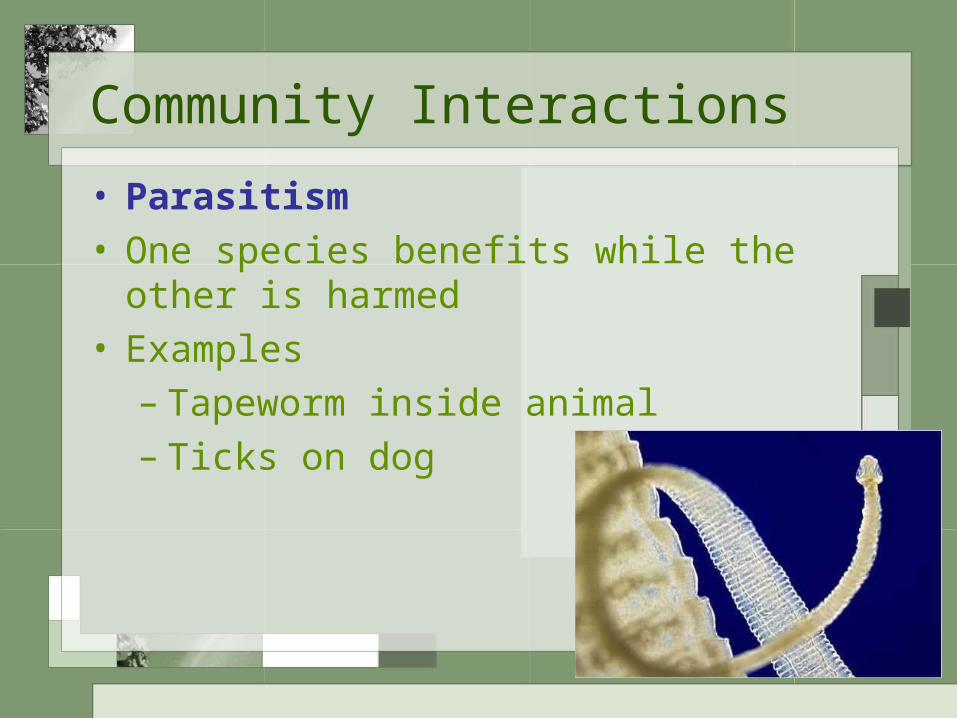
Community Interactions
• Parasitism• One species benefits while the other is harmed
• Examples– Tapeworm inside animal– Ticks on dog
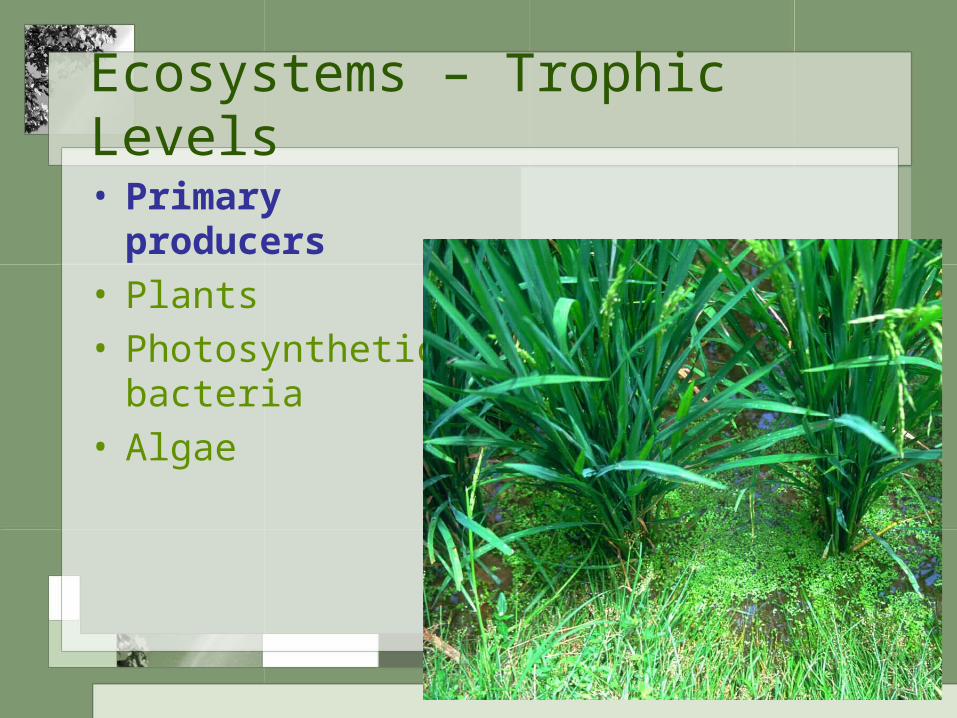
Ecosystems – Trophic Levels• Primary producers
• Plants• Photosynthetic bacteria
• Algae
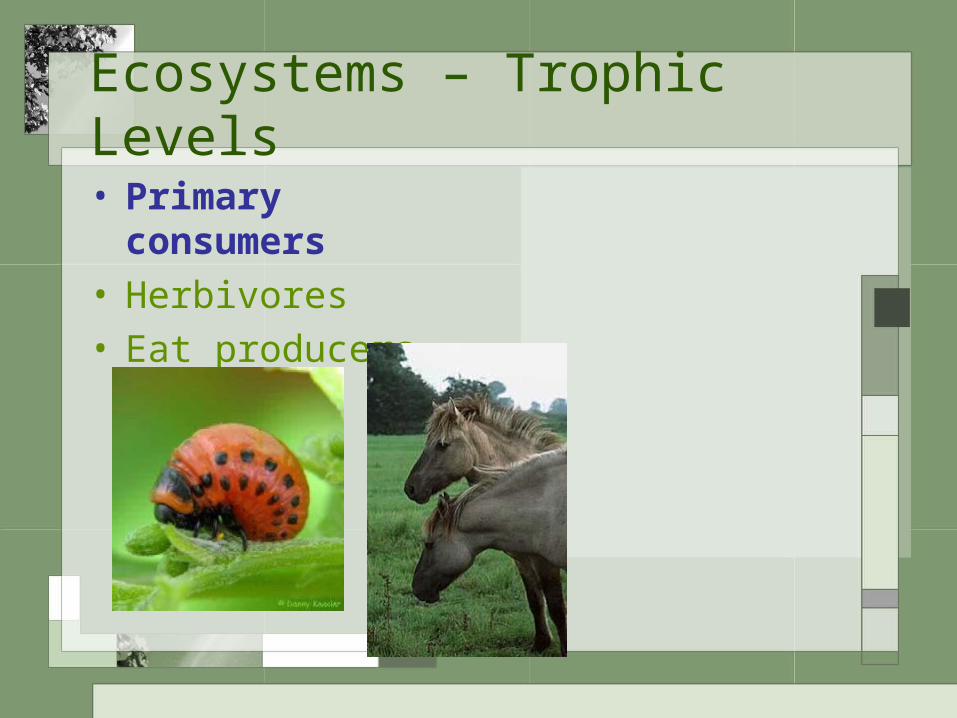
Ecosystems – Trophic Levels• Primary consumers
• Herbivores• Eat producers
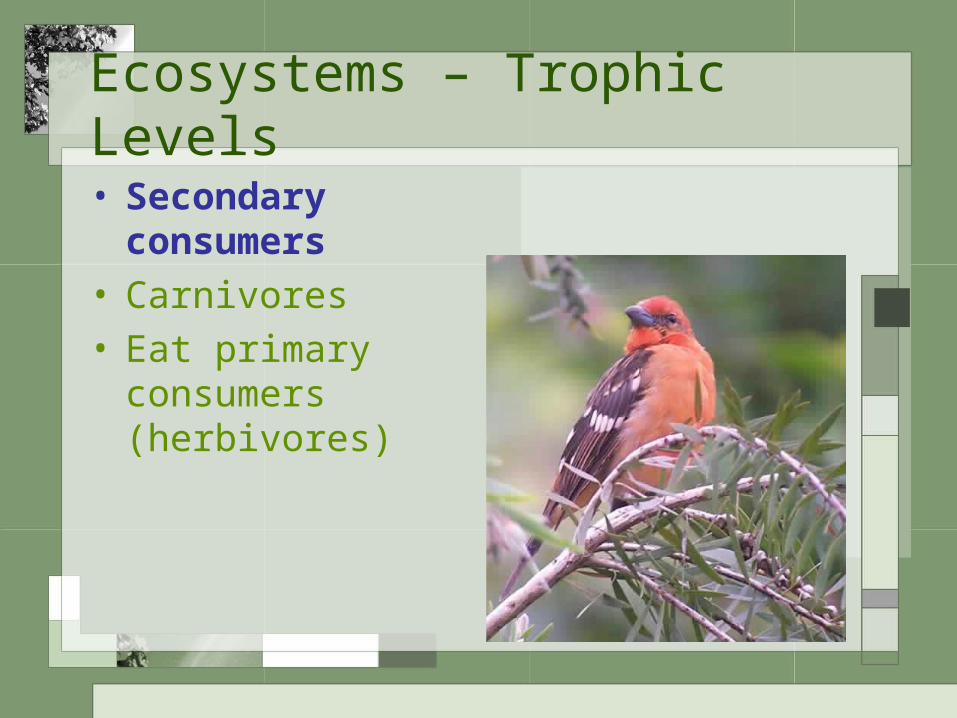
Ecosystems – Trophic Levels• Secondary consumers
• Carnivores• Eat primary consumers (herbivores)
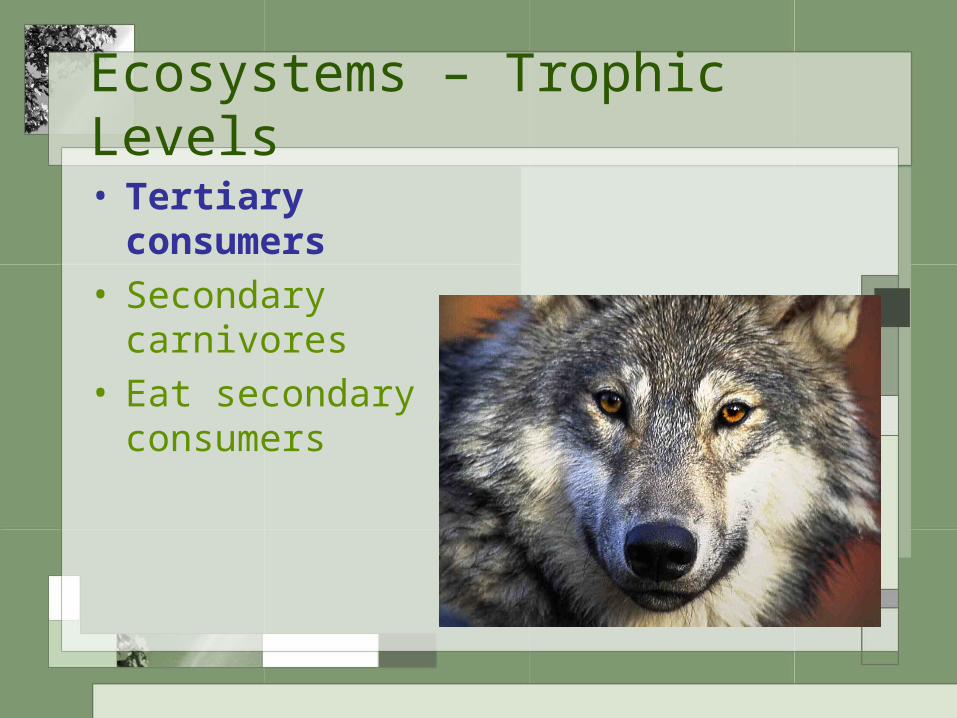
Ecosystems – Trophic Levels• Tertiary consumers
• Secondary carnivores
• Eat secondary consumers
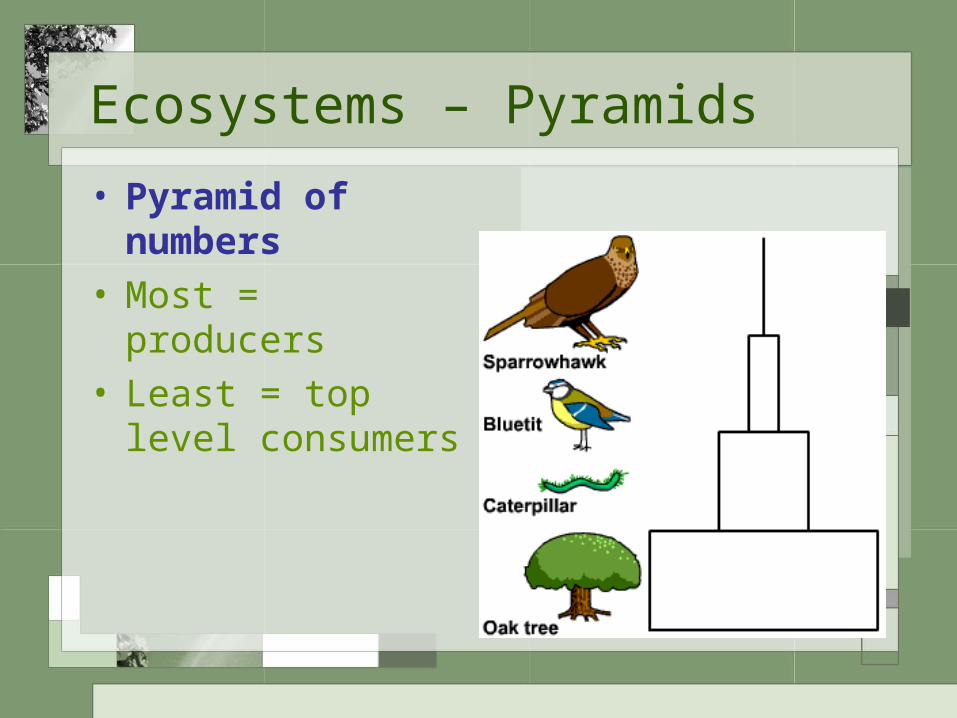
Ecosystems – Pyramids
• Pyramid of numbers
• Most = producers
• Least = top level consumers
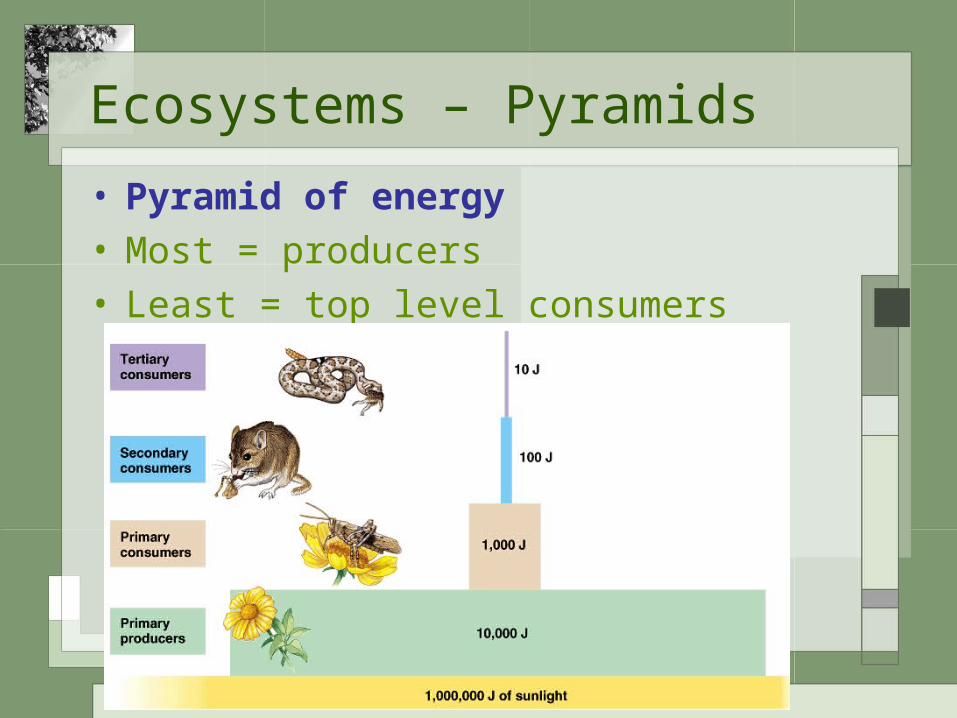
Ecosystems – Pyramids
• Pyramid of energy• Most = producers• Least = top level consumers
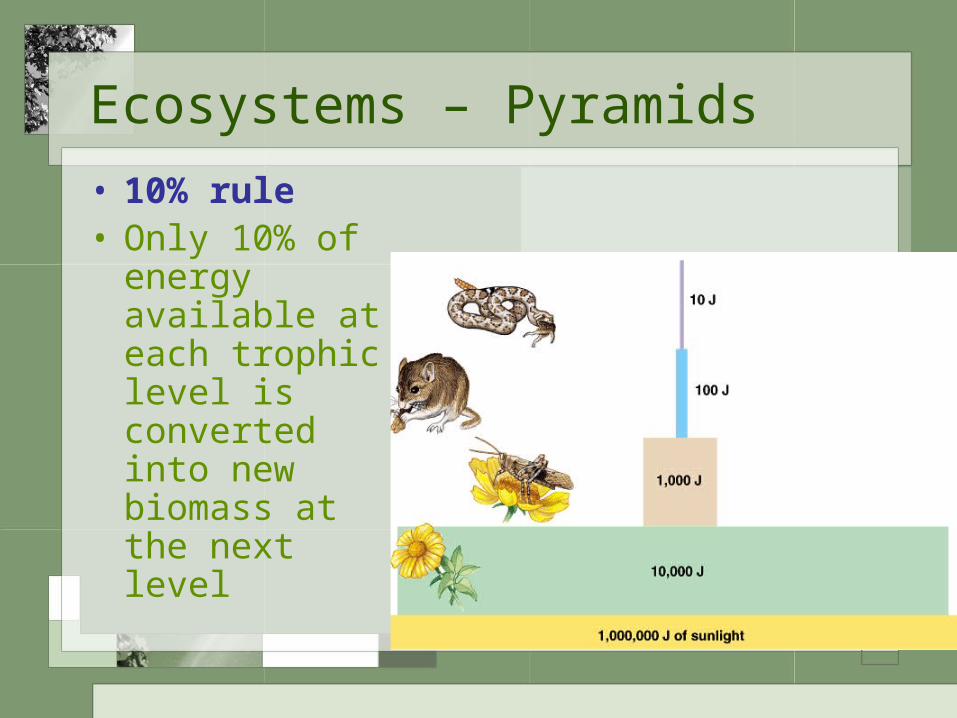
Ecosystems – Pyramids
• 10% rule• Only 10% of energy available at each trophic level is converted into new biomass at the next level
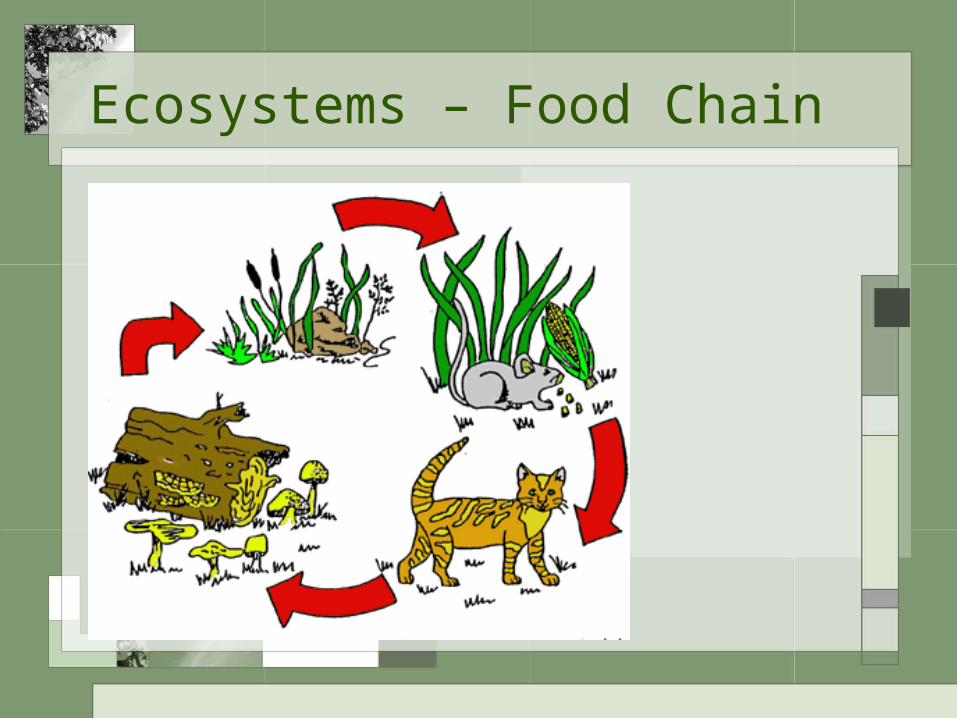
Ecosystems – Food Chain
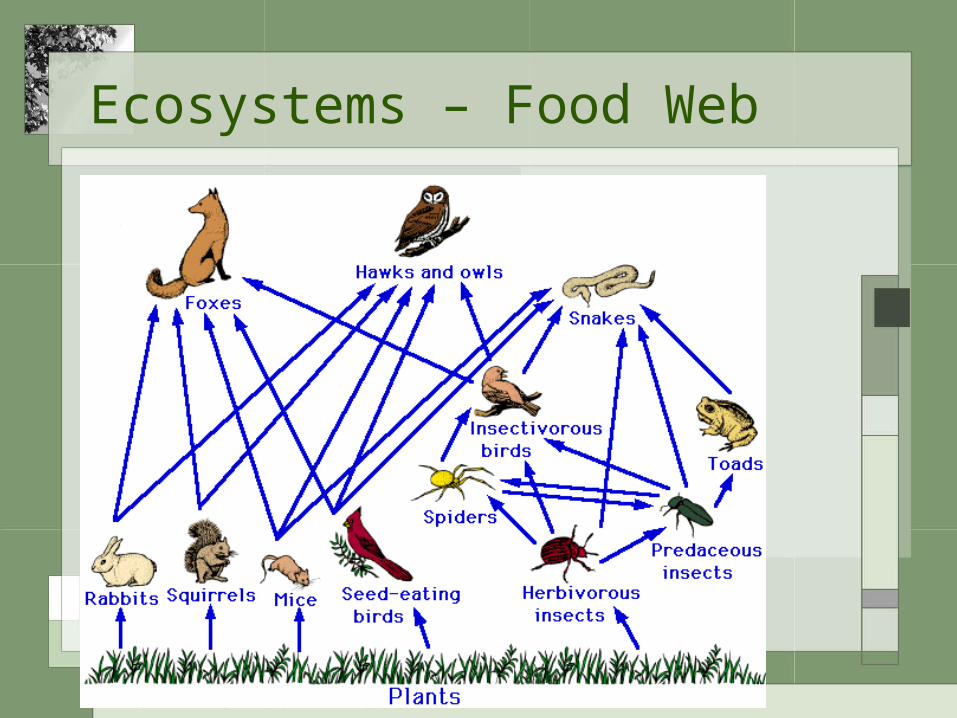
Ecosystems – Food Web
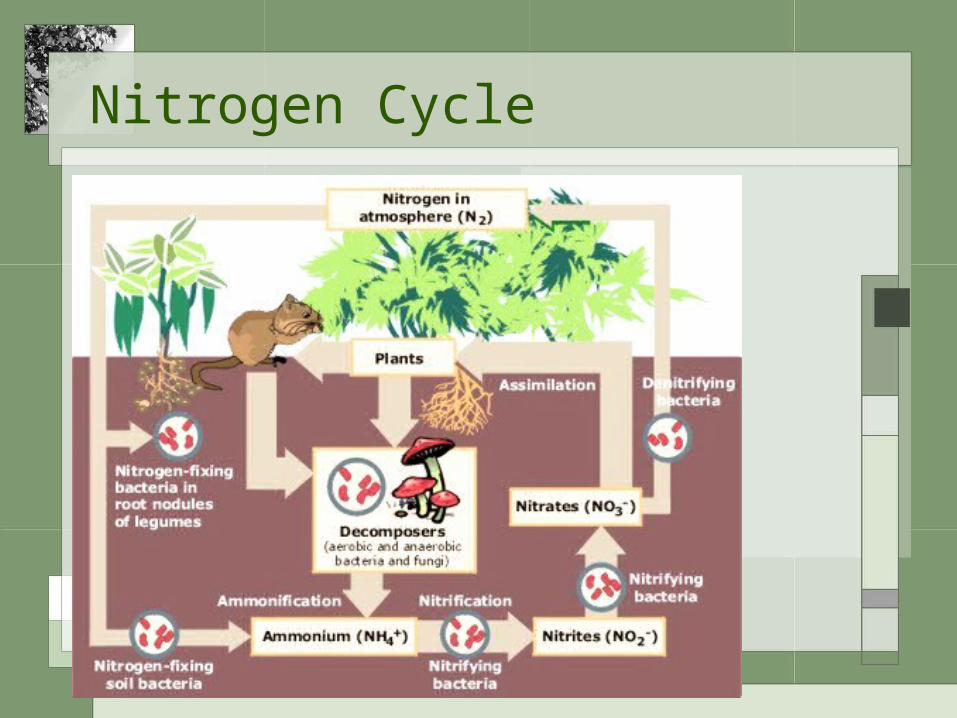
Nitrogen Cycle
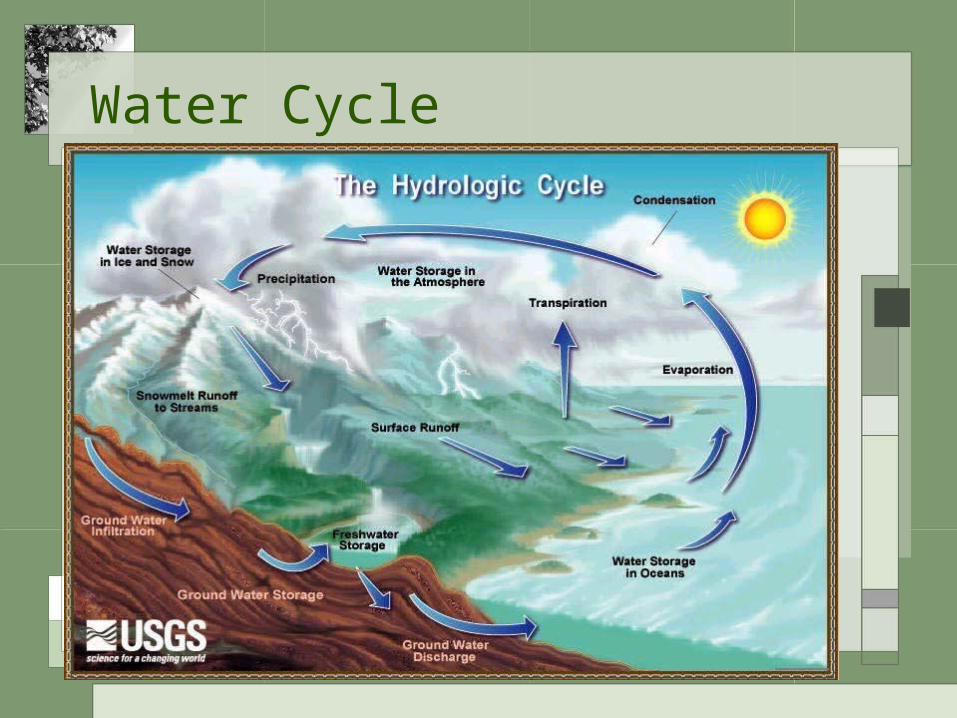
Water Cycle
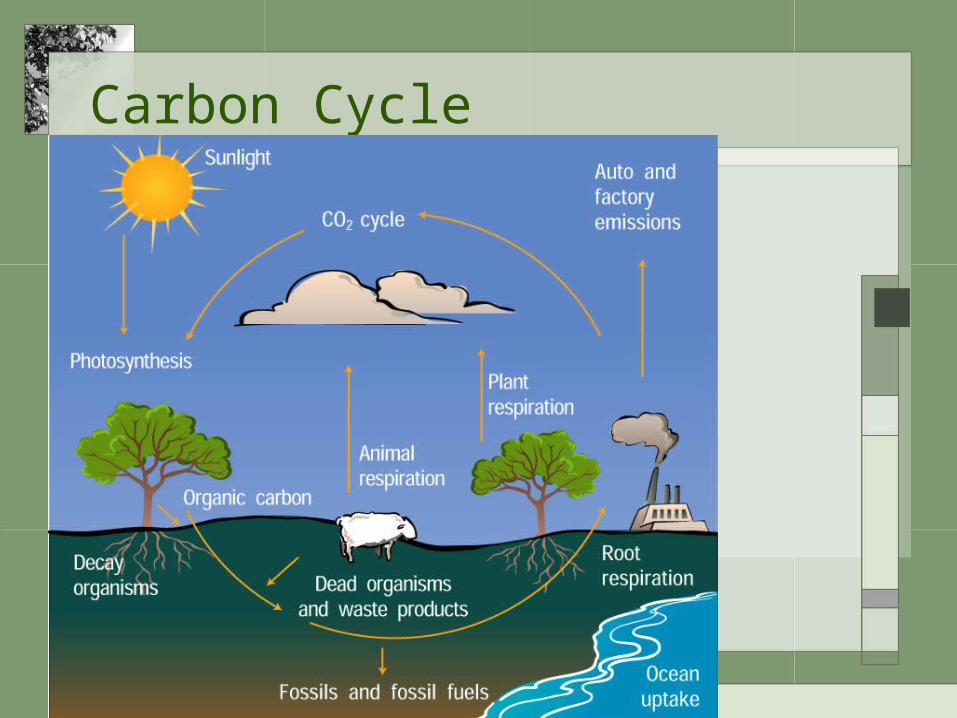
Carbon Cycle
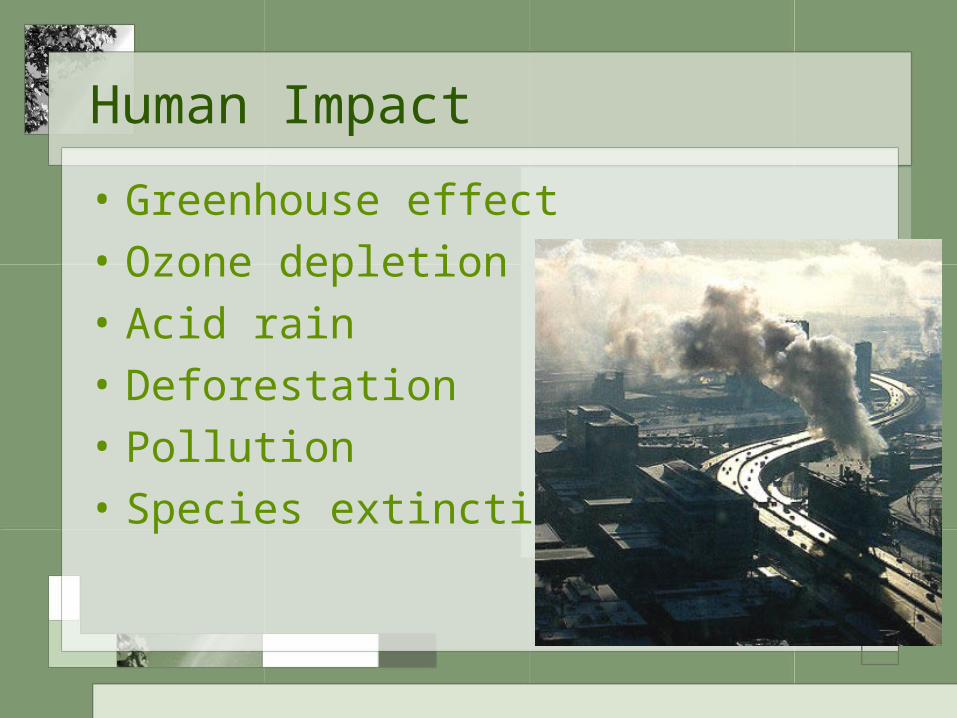
Human Impact
• Greenhouse effect• Ozone depletion• Acid rain• Deforestation• Pollution• Species extinction