Embed Size (px)
Citation preview

ECON 102 Tutorial: Week 12
Ayesha Aliwww.lancaster.ac.uk/postgrad/alia10/econ102.html
[email protected] hours: 8:00AM – 8:50AM tuesdays LUMS C85

How to Prepare for the Exam Review your Tutorial Worksheets and Slides, Lecture Slides, The
Specimen Exam, and Textbook chapters – that’s the order of importance.
Economics Questions should be similar in format to the Specimen Exam, but will not necessarily cover the same topics!
Maths Questions should be very similar to the Specimen Exam. You can also use my Practice Maths Questions and David Peel’s Notes on Moodle to prepare.
Don’t worry about how much to write or the format of your writing – what matters the most is that you show that you understand the material and answer the question that is being asked directly, preferably using diagrams.
Please write neatly! If I can’t read what you wrote, I can’t give you any marks.

Important Details about the Exam
What to know: Check your timetable for Exam time and location. You will need to write my name on your Exam booklet.
My name is Ayesha Ali.
What to bring: Bring a pencil! (Actually, bring two in case one breaks)
Bring an eraser. Bring your library card number (You will not be allowed to turn in an exam without a library card number.)
Bring a paper English/Other Language dictionary if you need one. Electronic devices will not be allowed at all.
Question 1(a) Phoebe keeps a bee farm next door to an apple orchard. She chooses her optimal number of beehives by selecting the honey output level at which her private marginal benefit from beekeeping equals her private marginal cost.
Assume that Phoebe’s private marginal benefit and marginal cost curves from beekeeping are normally shaped. Draw a diagram of them.
First – what do “normally shaped” MB and MC curves look like? MB is downward sloping, MC is upward sloping.
So what do we want to draw?We want to show the equilibrium where these two curves cross each other.
However, if you are thinking ahead and know that this unit is about externalities, we could also draw the Social Marginal Benefit curve and the Social Marginal Cost curve on this graph.
Question 1(a) Assume that Phoebe’s private marginal benefit and marginal cost curves from beekeeping are normally shaped. Draw a diagram of them.
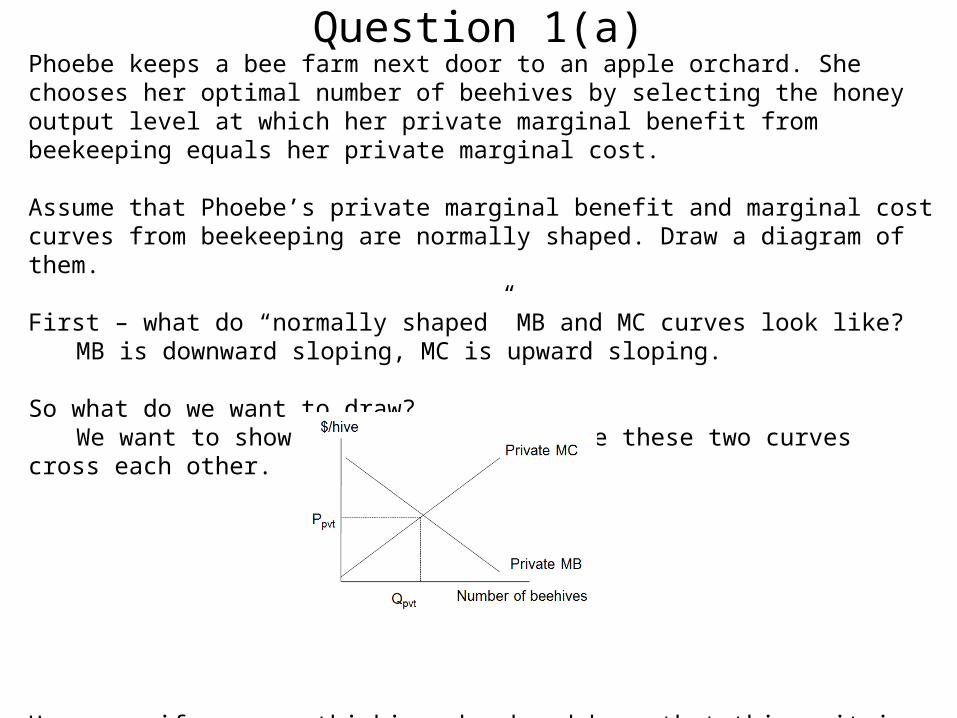
So if we draw a diagram that includes a Social MB and MC, we could have two different scenarios:
The socially optimal number of beehives could be greater or less than the privately optimal number, depending on the magnitude of the social marginal cost relative to the private marginal cost, as well as the magnitude of the social marginal benefit relative to the private marginal benefit.
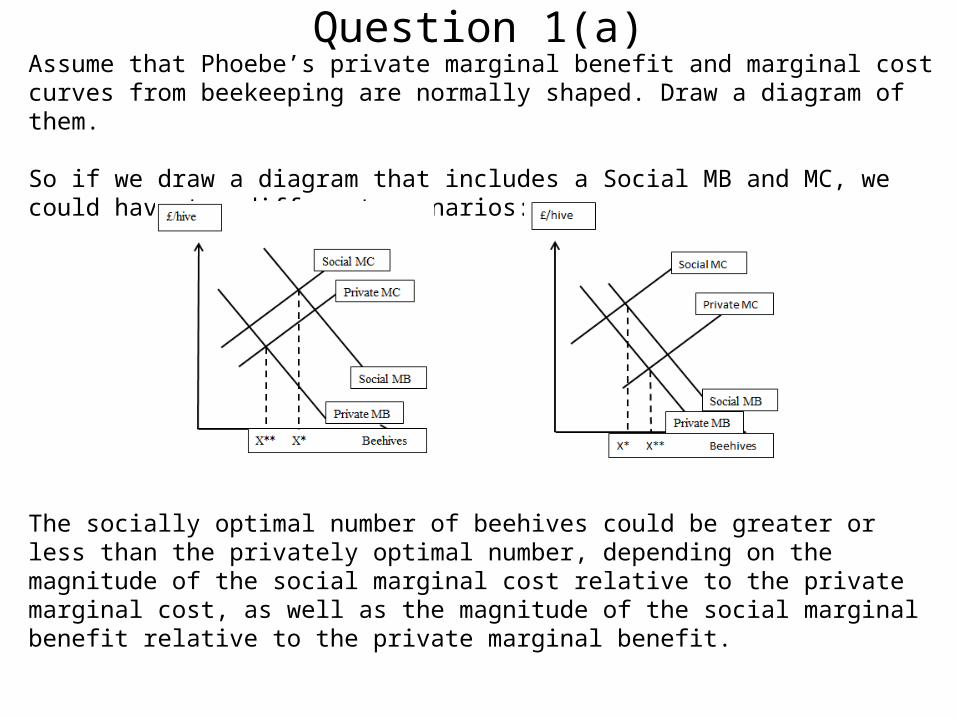
Question 1(b) Phoebe’s bees help to pollinate the blossoms in the apple orchard, increasing the fruit yield. Show the social marginal benefit from Phoebe’s beekeeping in your diagram.
The bees pollinating the orchard is a positive externality.
If we assume the negative externality is negligible and the positive externality is large, we get the following graph in which the socially optimal number of beehives, X*, exceeds the privately optimal number, X**.
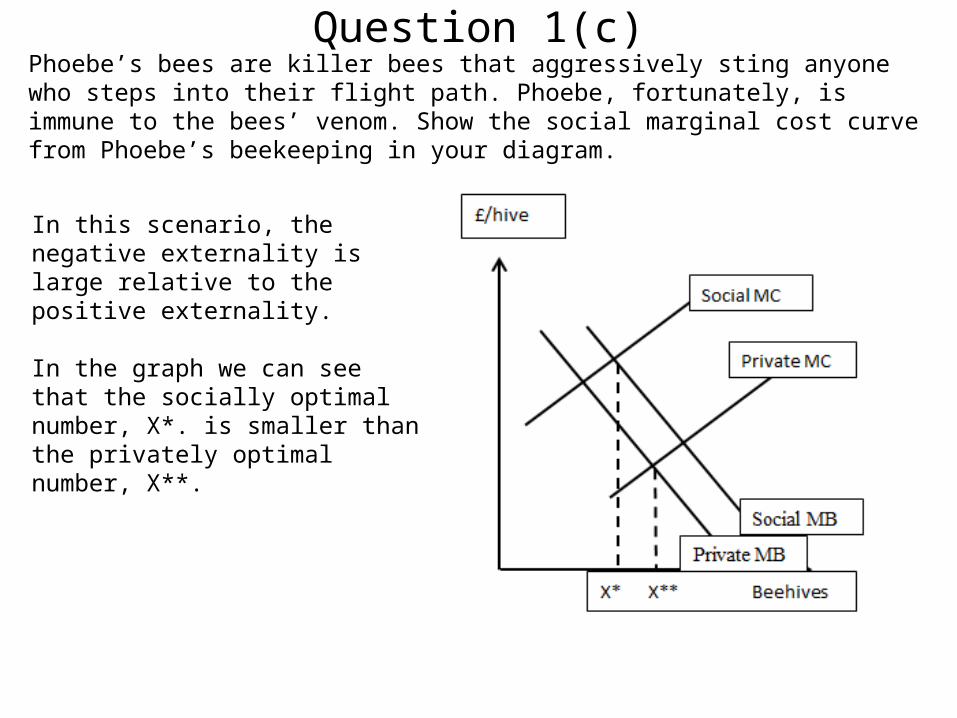
Question 1(c) Phoebe’s bees are killer bees that aggressively sting anyone who steps into their flight path. Phoebe, fortunately, is immune to the bees’ venom. Show the social marginal cost curve from Phoebe’s beekeeping in your diagram.
In this scenario, the negative externality is large relative to the positive externality.
In the graph we can see that the socially optimal number, X*. is smaller than the privately optimal number, X**.
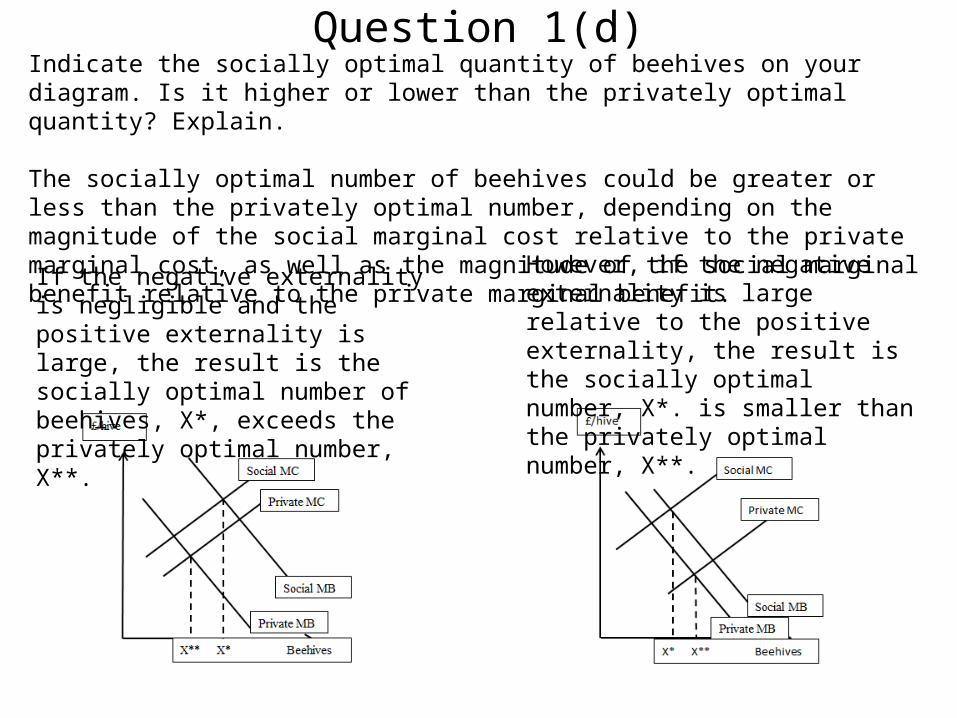
Question 1(d) Indicate the socially optimal quantity of beehives on your diagram. Is it higher or lower than the privately optimal quantity? Explain.
The socially optimal number of beehives could be greater or less than the privately optimal number, depending on the magnitude of the social marginal cost relative to the private marginal cost, as well as the magnitude of the social marginal benefit relative to the private marginal benefit.
If the negative externality is negligible and the positive externality is large, the result is the socially optimal number of beehives, X*, exceeds the privately optimal number, X**.
However, if the negative externality is large relative to the positive externality, the result is the socially optimal number, X*. is smaller than the privately optimal number, X**.
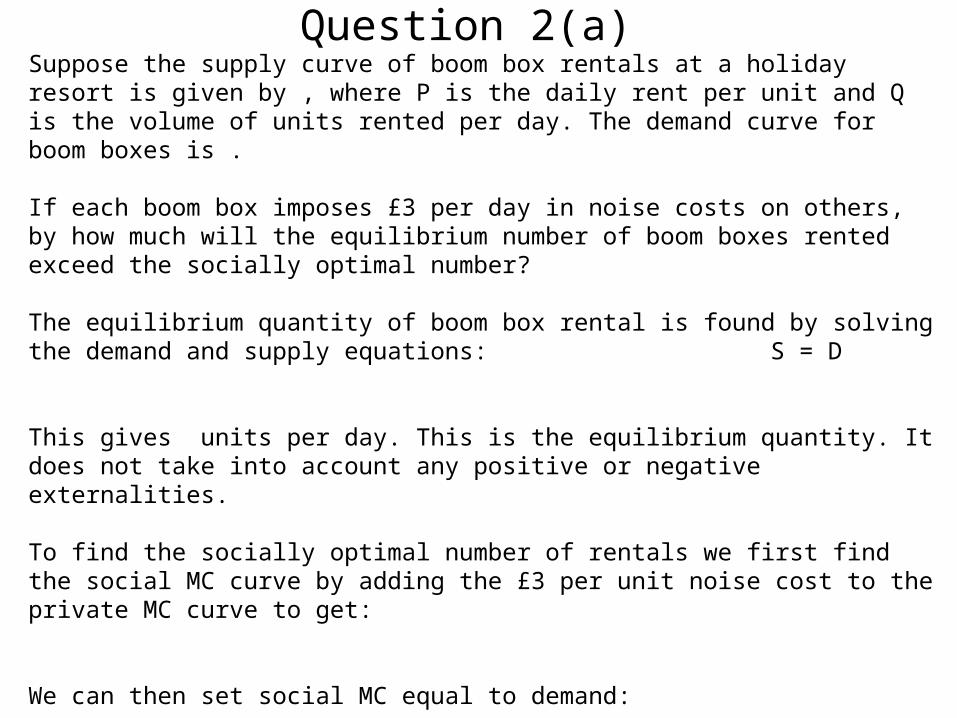
Question 2(a) Suppose the supply curve of boom box rentals at a holiday resort is given by , where P is the daily rent per unit and Q is the volume of units rented per day. The demand curve for boom boxes is .
If each boom box imposes £3 per day in noise costs on others, by how much will the equilibrium number of boom boxes rented exceed the socially optimal number?
The equilibrium quantity of boom box rental is found by solving the demand and supply equations: S = D
This gives units per day. This is the equilibrium quantity. It does not take into account any positive or negative externalities.
To find the socially optimal number of rentals we first find the social MC curve by adding the £3 per unit noise cost to the private MC curve to get:
We can then set social MC equal to demand:
which gives for units per day. This is 10 less than the equilibrium number.
Question 2(b) How would the imposition of a tax of £3 per unit on each daily boom box rental affect efficiency in this market? Imposition of the tax of £3 per unit would shift the private MC curve upward by £3 per unit (graphically). (Mathematically, we would be adding £3 to the Supply equation (note: that’s our MC curve), so that the Supply + tax would be: , which is exactly the same as our Social MC curve.)
This would make it identical to the social MC curve. So then, the socially optimal number of boom boxes would be rented, resulting in an overall increase in efficiency in this market.
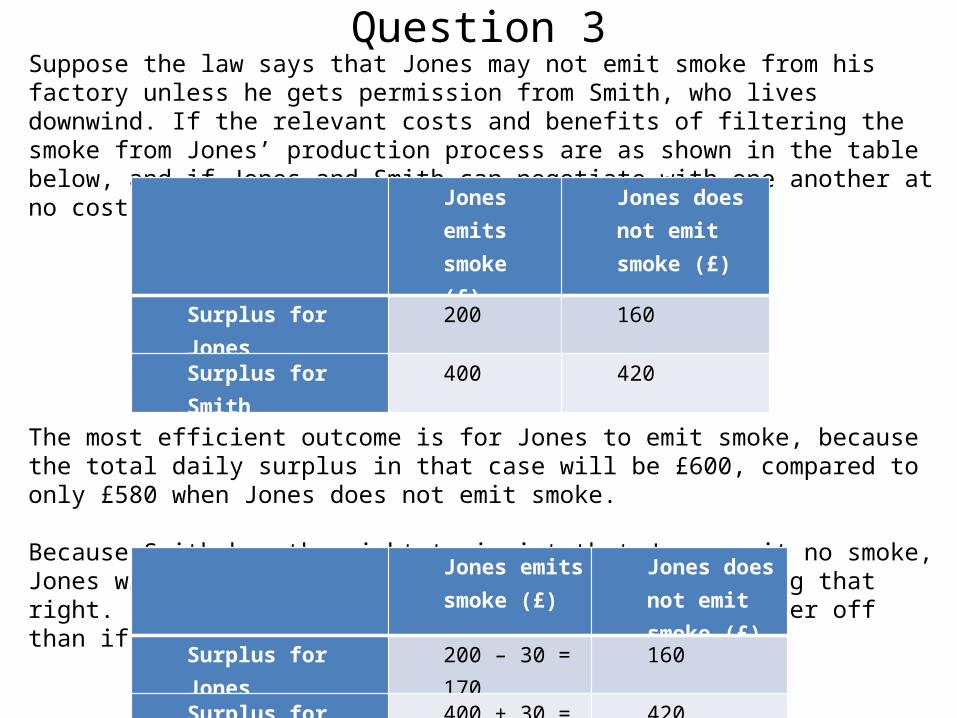
Question 3 Suppose the law says that Jones may not emit smoke from his factory unless he gets permission from Smith, who lives downwind. If the relevant costs and benefits of filtering the smoke from Jones’ production process are as shown in the table below, and if Jones and Smith can negotiate with one another at no cost, will Jones emit smoke?
The most efficient outcome is for Jones to emit smoke, because the total daily surplus in that case will be £600, compared to only £580 when Jones does not emit smoke.
Because Smith has the right to insist that Jones emit no smoke, Jones will have to compensate Smith for not exercising that right. If Jones pays Smith £30, each will be £10 better off than if Smith had forced Jones not to emit smoke.
Jones emits smoke (£)
Jones does not emit smoke (£)
Surplus for Jones 200 160Surplus for Smith 400 420
Jones emits smoke (£)
Jones does not emit smoke (£)
Surplus for Jones 200 – 30 = 170 160Surplus for Smith 400 + 30 = 430 420
Question 4(a) John and Karl can live together in a two-bedroom flat for £500 per month, or each can rent a single-bedroom flat for £350 per month. Aside from rent, the two would be indifferent between living together and living separately, except for one problem: John leaves dirty dishes in the sink every night. Karl would be willing to pay up to £175 per month to avoid John’s dirty dishes. John would be willing to pay up to £225 to be able to continue his sloppiness.
Should John and Karl live together? If they do, will there be dirty dishes in the sink? Explain.
Note: This problem has exactly the same setup as Example 11.5 and 11.6 in the textbook (pg. 315-316).
Question 4(a) John and Karl can live together in a two-bedroom flat for £500 per month, or each can rent a single-bedroom flat for £350 per month. Aside from rent, the two would be indifferent between living together and living separately, except for one problem: John leaves dirty dishes in the sink every night. Karl would be willing to pay up to £175 per month to avoid John’s dirty dishes. John would be willing to pay up to £225 to be able to continue his sloppiness.
Should John and Karl live together? If they do, will there be dirty dishes in the sink? Explain.
John and Karl stand to save £200 per month in rental payments by living together.
The lowest-cost accommodation to the dirty dish problem is for John to leave his dirty dishes in the sink. Under that agreement, the maximum monthly rent Karl would be willing to pay to share an apartment with John is £350 - £175 = £175 per month.
That amount would leave John with a remaining monthly rent bill of £325, which generates a social surplus of £25 per month (compared to the £350 John would have to pay if he lives on his own).
If John splits this surplus evenly with Karl, John ends up paying £337.50 per month and Karl pays £162.50. Thus both will be better off sharing.
Question 4(b) How, if at all, would your answer differ if John would be willing to pay up to £30 per month to avoid giving up his privacy by sharing with Karl?
Let’s compare this to the scenario where Karl pays the maximum amount that he is willing to pay in rent, £175, as we had in part (a). In this case, John would prefer the individual apartment (living separately will cost him £350 rather than £325, as in part (a), but he values the independence at £30, so £30 is added to the cost of sharing: £325 + £30 = £355).
So no sharing arrangements would be made.
Alternatively, we could say that:The SOCIAL cost of sharing is £175 (from part(a), this is the least-cost solution to the dirty-dishes problem). So, the Social cost of sharing, taking into account the additional £30, is £205, which is more than the total amount of rent saved (£200).
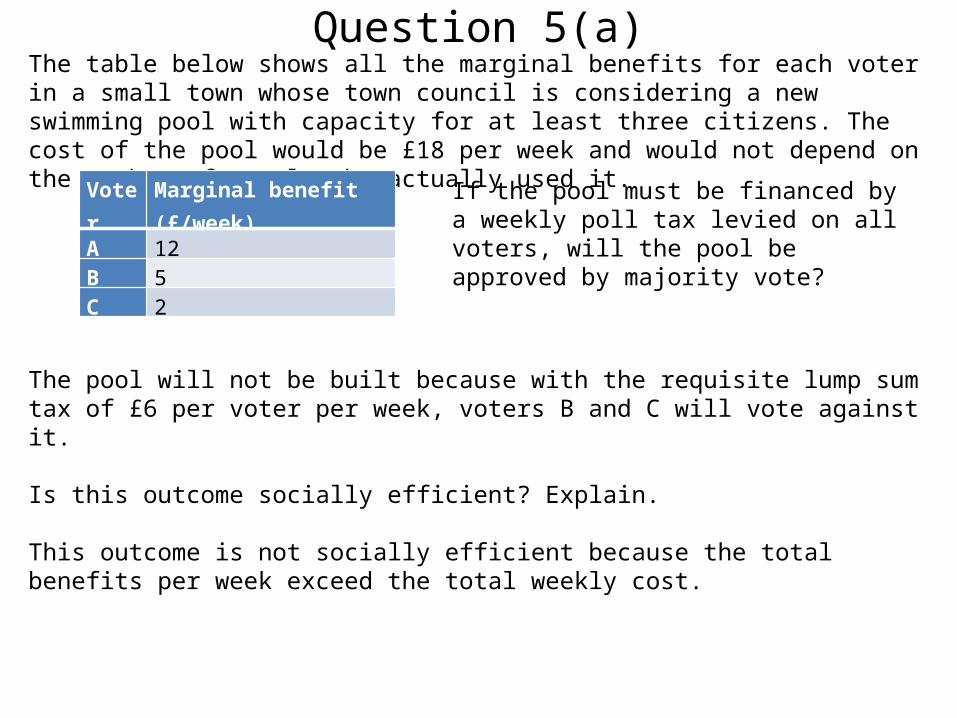
Question 5(a) The table below shows all the marginal benefits for each voter in a small town whose town council is considering a new swimming pool with capacity for at least three citizens. The cost of the pool would be £18 per week and would not depend on the number of people who actually used it.
The pool will not be built because with the requisite lump sum tax of £6 per voter per week, voters B and C will vote against it.
Is this outcome socially efficient? Explain.
This outcome is not socially efficient because the total benefits per week exceed the total weekly cost.
Voter Marginal benefit (£/week)A 12B 5C 2
If the pool must be financed by a weekly poll tax levied on all voters, will the pool be approved by majority vote?
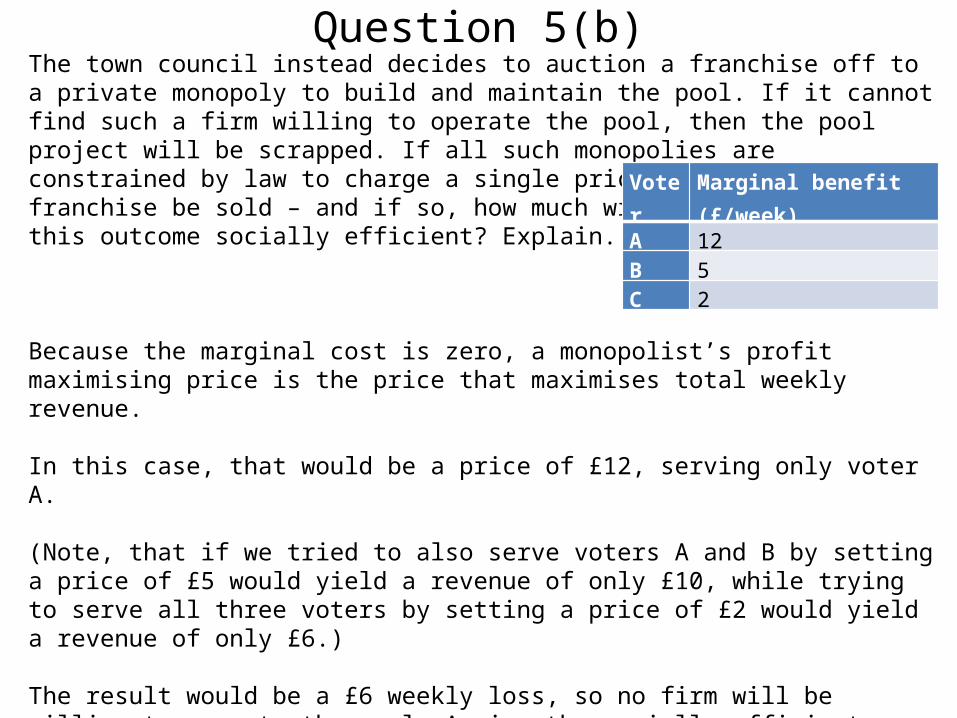
Question 5(b) The town council instead decides to auction a franchise off to a private monopoly to build and maintain the pool. If it cannot find such a firm willing to operate the pool, then the pool project will be scrapped. If all such monopolies are constrained by law to charge a single price to users, will the franchise be sold – and if so, how much will it sell for? Is this outcome socially efficient? Explain.
Because the marginal cost is zero, a monopolist’s profit maximising price is the price that maximises total weekly revenue.
In this case, that would be a price of £12, serving only voter A.
(Note, that if we tried to also serve voters A and B by setting a price of £5 would yield a revenue of only £10, while trying to serve all three voters by setting a price of £2 would yield a revenue of only £6.)
The result would be a £6 weekly loss, so no firm will be willing to operate the pool. Again, the socially efficient outcome is not achieved.
Voter Marginal benefit (£/week)A 12B 5C 2
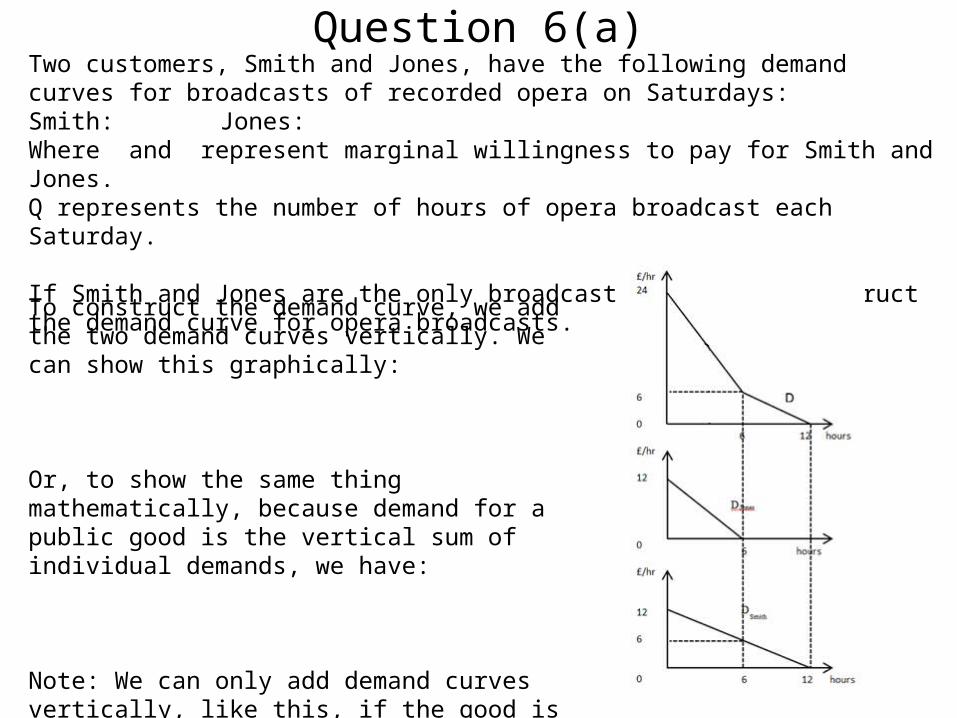
Question 6(a) Two customers, Smith and Jones, have the following demand curves for broadcasts of recorded opera on Saturdays: Smith: Jones: Where and represent marginal willingness to pay for Smith and Jones. Q represents the number of hours of opera broadcast each Saturday.
If Smith and Jones are the only broadcast listeners, construct the demand curve for opera broadcasts.
To construct the demand curve, we add the two demand curves vertically. We can show this graphically:
Or, to show the same thing mathematically, because demand for a public good is the vertical sum of individual demands, we have:
Note: We can only add demand curves vertically, like this, if the good is non-excludable. If a good is excludable, we have to add the demand curves horizontally.
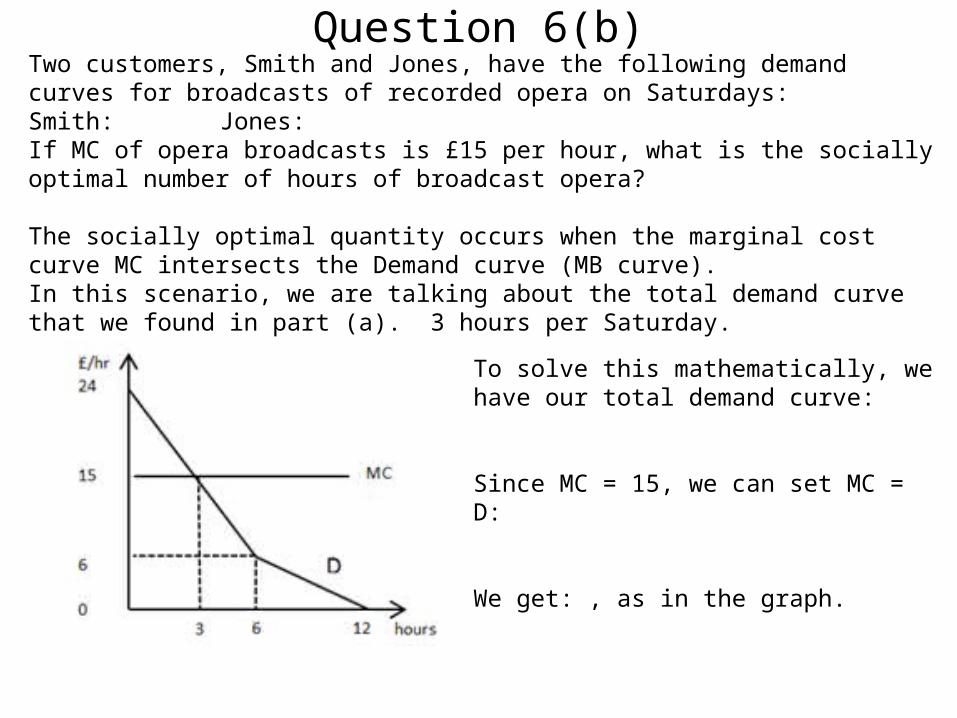
Question 6(b) Two customers, Smith and Jones, have the following demand curves for broadcasts of recorded opera on Saturdays: Smith: Jones: If MC of opera broadcasts is £15 per hour, what is the socially optimal number of hours of broadcast opera? The socially optimal quantity occurs when the marginal cost curve MC intersects the Demand curve (MB curve). In this scenario, we are talking about the total demand curve that we found in part (a). 3 hours per Saturday.
To solve this mathematically, we have our total demand curve:
Since MC = 15, we can set MC = D:
We get: , as in the graph.
Question 7 If a regulator is seeking to regulate an industry with a large number of competing firms, why might the problem of regulatory failure be smaller than if the industry were monopolised? It is easier for a single or a few firms to attempt regulatory capture i.e. to influence the regulator and hence advance the firm’s interests.
If there are many firms in the industry, then it is more difficult to coordinate lobbying efforts between firms (the free rider problem), and firms may have a wider range of views as to what their interest are, due to differences in the firms’ situations.
However, if the large number of firms organize to form a single industry association that can defend the industry’s interests (and the firms’ interests), then the risk of regulatory failure may increase.
Next Class
Week 13 Worksheet Please email me by Sunday if you’d like me to go over
any Exam questions/solutions in class.
Exam is on Friday this week – Tutors have 4 weeks to complete marking The office will probably take a week or two for processing So, if there are no problems at all, you should get your exam
results back in roughly 5-6 weeks. Please be patient and work hard in the meantime.
Good luck!