Embed Size (px)
Citation preview

ECONMOMIC ENVIRONMENT OF BUSINESS
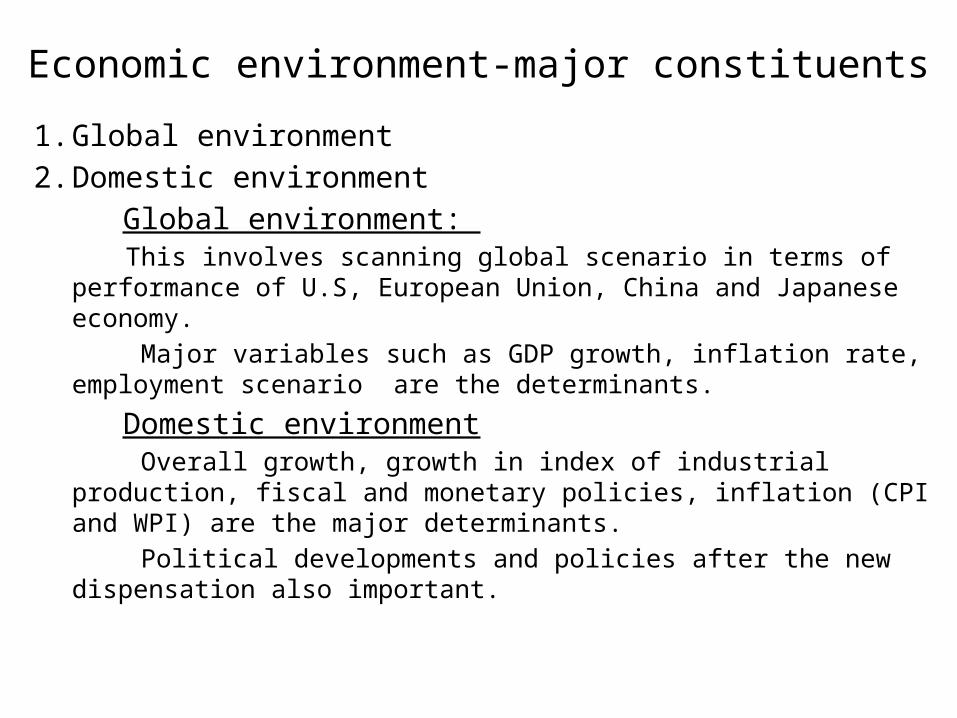
Economic environment-major constituents1. Global environment
2. Domestic environment
Global environment: This involves scanning global scenario in terms of performance of U.S,
European Union, China and Japanese economy.
Major variables such as GDP growth, inflation rate, employment scenario are the determinants.
Domestic environment Overall growth, growth in index of industrial production, fiscal and
monetary policies, inflation (CPI and WPI) are the major determinants.
Political developments and policies after the new dispensation also important.
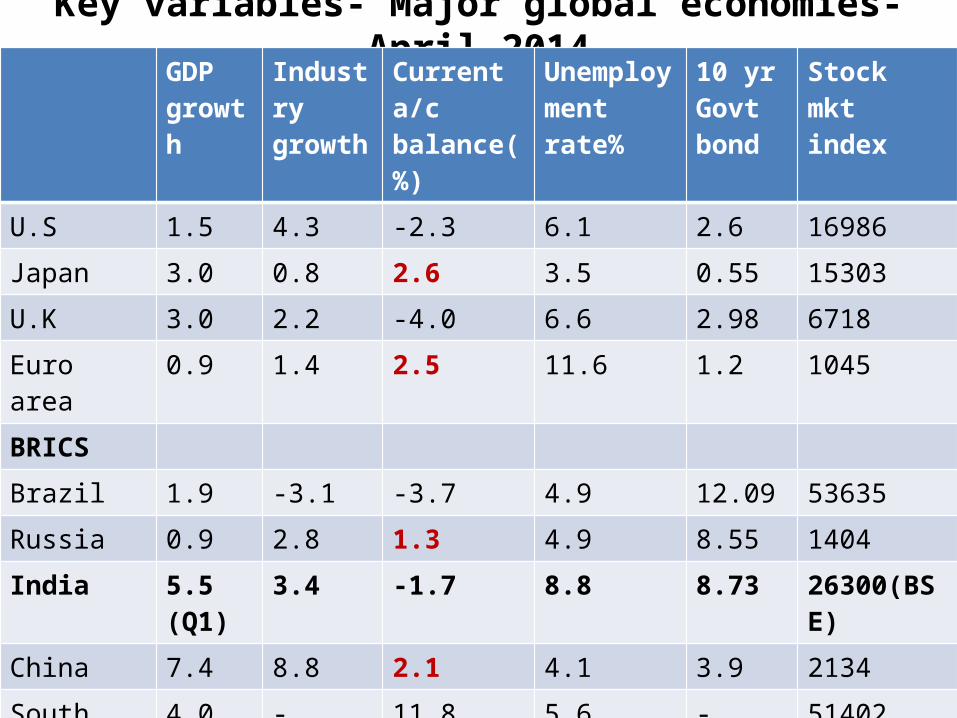
Key variables- Major global economies-April 2014GDP growth
Industry growth
Current a/c balance(%)
Unemployment rate%
10 yr Govt bond
Stock mkt index
U.S 1.5 4.3 -2.3 6.1 2.6 16986
Japan 3.0 0.8 2.6 3.5 0.55 15303
U.K 3.0 2.2 -4.0 6.6 2.98 6718
Euro area 0.9 1.4 2.5 11.6 1.2 1045
BRICS
Brazil 1.9 -3.1 -3.7 4.9 12.09 53635
Russia 0.9 2.8 1.3 4.9 8.55 1404
India 5.5 (Q1)
3.4 -1.7 8.8 8.73 26300(BSE)
China 7.4 8.8 2.1 4.1 3.9 2134
South Africa 4.0 - 11.8 5.6 - 51402
Indonesia 5.2 2.5 -3.5 5.7 - 5025
China followed by India & Indonesia highest growth economies. Red indicates current a/c surplus economies. Euro Zone scores low on growth and unemployment, a source of worry for our corporates with export potential.
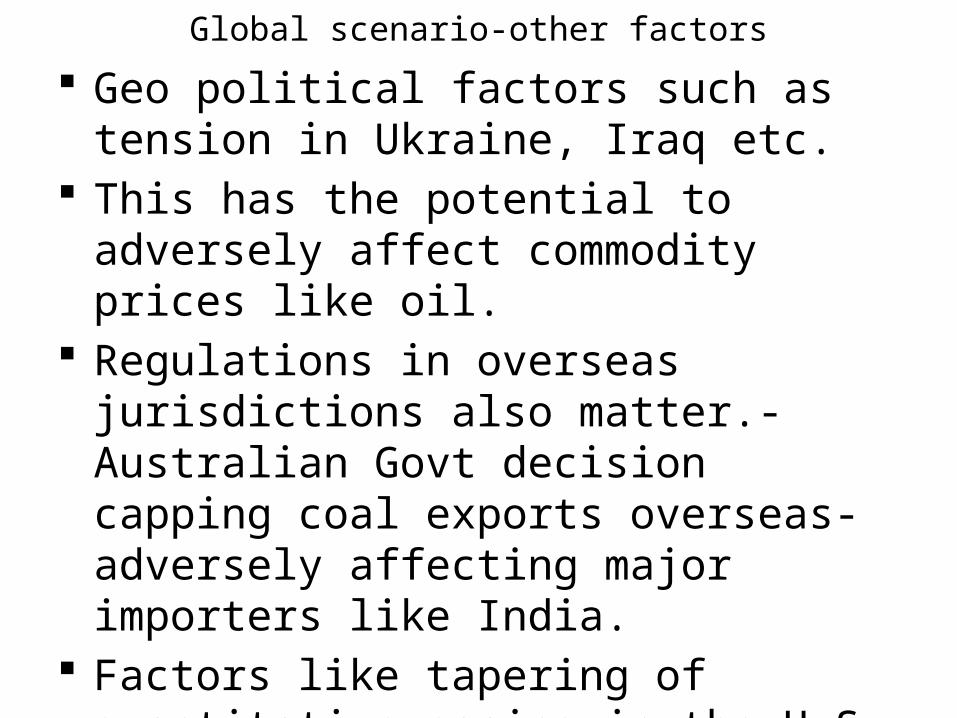
Global scenario-other factors Geo political factors such as tension in
Ukraine, Iraq etc. This has the potential to adversely affect
commodity prices like oil. Regulations in overseas jurisdictions also
matter.-Australian Govt decision capping coal exports overseas-adversely affecting major importers like India.
Factors like tapering of quantitative easing in the U.S, theior immigration policies etc.
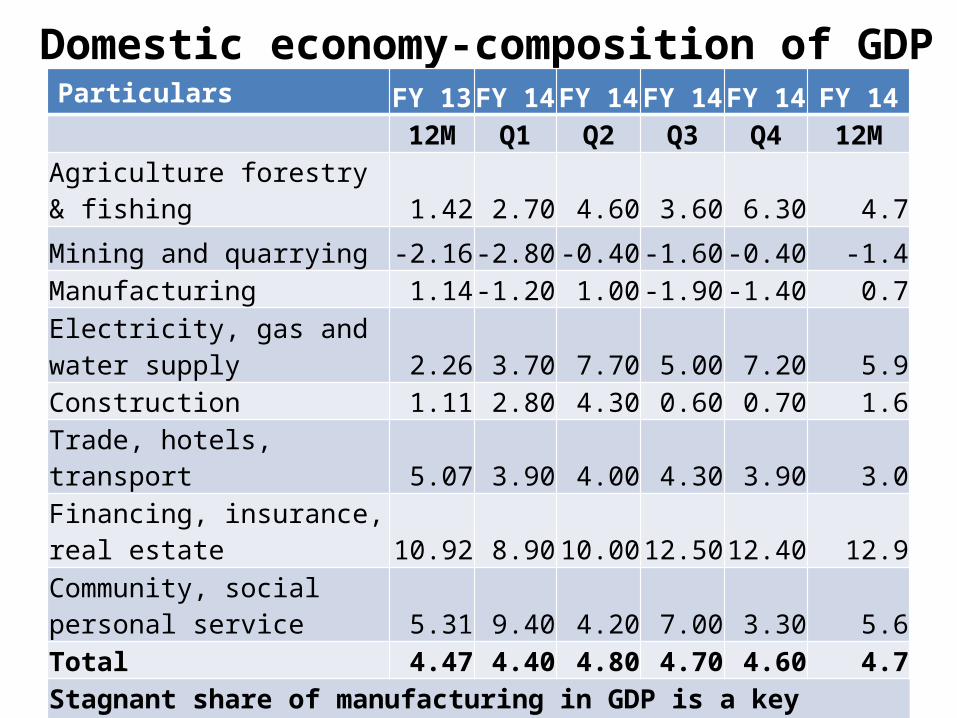
Domestic economy-composition of GDPParticulars FY 13 FY 14 FY 14 FY 14 FY 14 FY 14
12M Q1 Q2 Q3 Q4 12MAgriculture forestry & fishing 1.42 2.70 4.60 3.60 6.30 4.7
Mining and quarrying -2.16 -2.80 -0.40 -1.60 -0.40 -1.4Manufacturing 1.14 -1.20 1.00 -1.90 -1.40 0.7
Electricity, gas and water supply 2.26 3.70 7.70 5.00 7.20 5.9Construction 1.11 2.80 4.30 0.60 0.70 1.6
Trade, hotels, transport 5.07 3.90 4.00 4.30 3.90 3.0Financing, insurance, real estate 10.92 8.90 10.00 12.50 12.40 12.9
Community, social personal service 5.31 9.40 4.20 7.00 3.30 5.6Total 4.47 4.40 4.80 4.70 4.60 4.7Stagnant share of manufacturing in GDP is a key concern. FY 14 GDP is just a tad higher than FY 13. However, FY 15 growth expected at 5.5%.
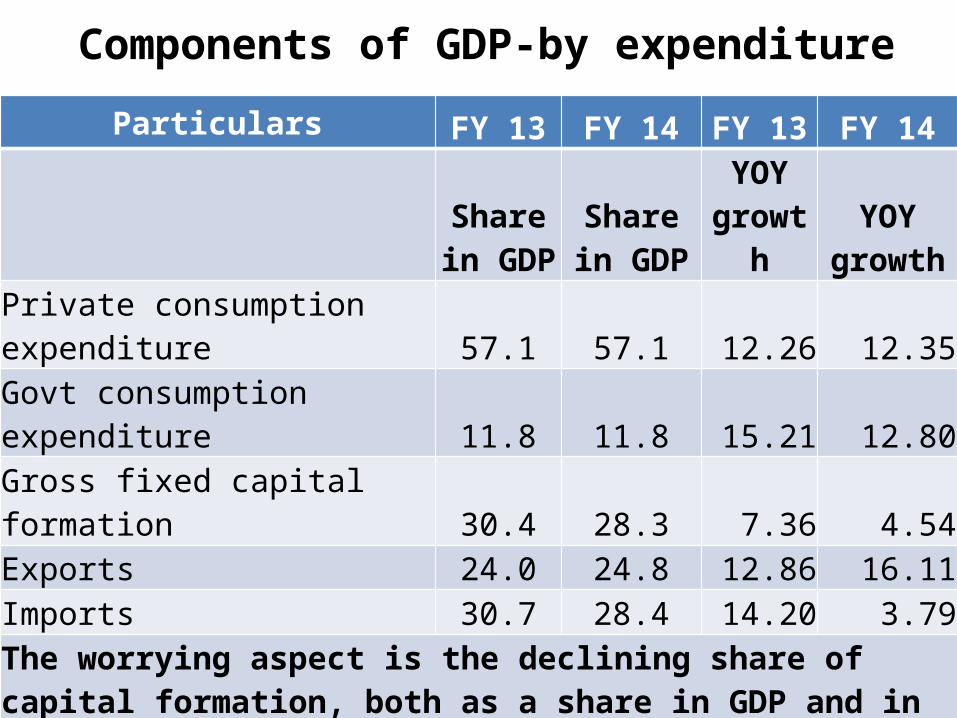
Components of GDP-by expenditure
Particulars FY 13 FY 14 FY 13 FY 14Share in
GDPShare in
GDPYOY
growthYOY
growthPrivate consumption expenditure 57.1 57.1 12.26 12.35Govt consumption expenditure 11.8 11.8 15.21 12.80Gross fixed capital formation 30.4 28.3 7.36 4.54Exports 24.0 24.8 12.86 16.11Imports 30.7 28.4 14.20 3.79The worrying aspect is the declining share of capital formation, both as a share in GDP and in growth terms. Govt expenditure alos declined, which is a reason for slow GDP growth. This also proves that fiscal deficit was managed by expenditure compression rather than revenue maximization. Low capital formation ot GDP shows policy paralysis
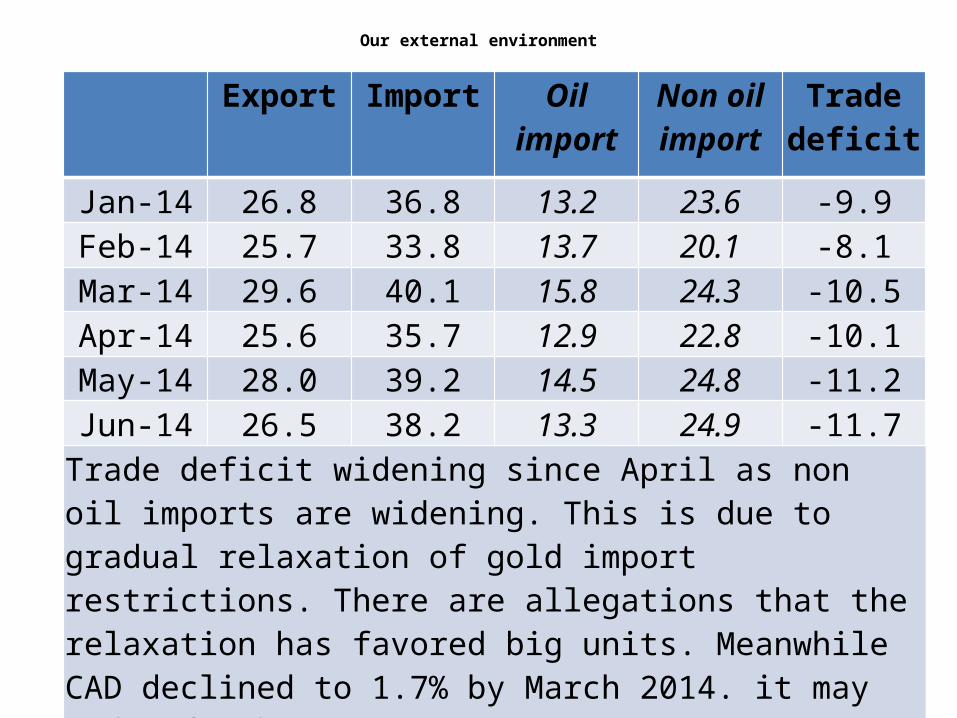
Our external environment
Export Import Oil import Non oil import
Trade deficit
Jan-14 26.8 36.8 13.2 23.6 -9.9
Feb-14 25.7 33.8 13.7 20.1 -8.1
Mar-14 29.6 40.1 15.8 24.3 -10.5
Apr-14 25.6 35.7 12.9 22.8 -10.1
May-14 28.0 39.2 14.5 24.8 -11.2Jun-14 26.5 38.2 13.3 24.9 -11.7
Trade deficit widening since April as non oil imports are widening. This is due to gradual relaxation of gold import restrictions. There are allegations that the relaxation has favored big units. Meanwhile CAD declined to 1.7% by March 2014. it may widen further.
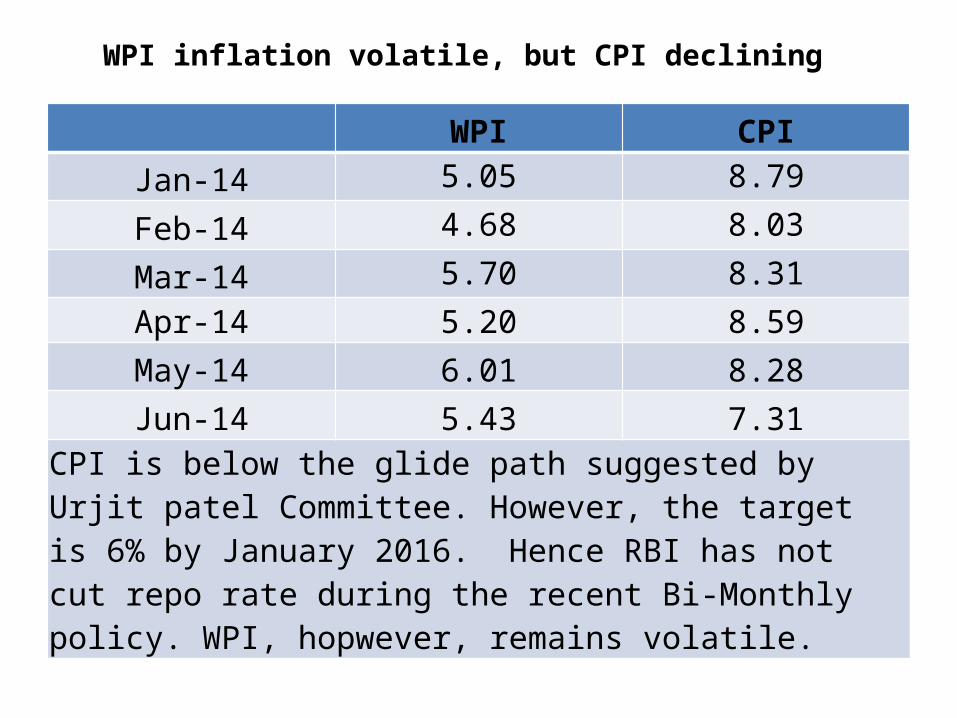
WPI inflation volatile, but CPI declining
WPI CPI
Jan-14 5.05 8.79
Feb-14 4.68 8.03
Mar-14 5.70 8.31
Apr-14 5.20 8.59
May-14 6.01 8.28
Jun-14 5.43 7.31CPI is below the glide path suggested by Urjit patel Committee. However, the target is 6% by January 2016. Hence RBI has not cut repo rate during the recent Bi-Monthly policy. WPI, hopwever, remains volatile.
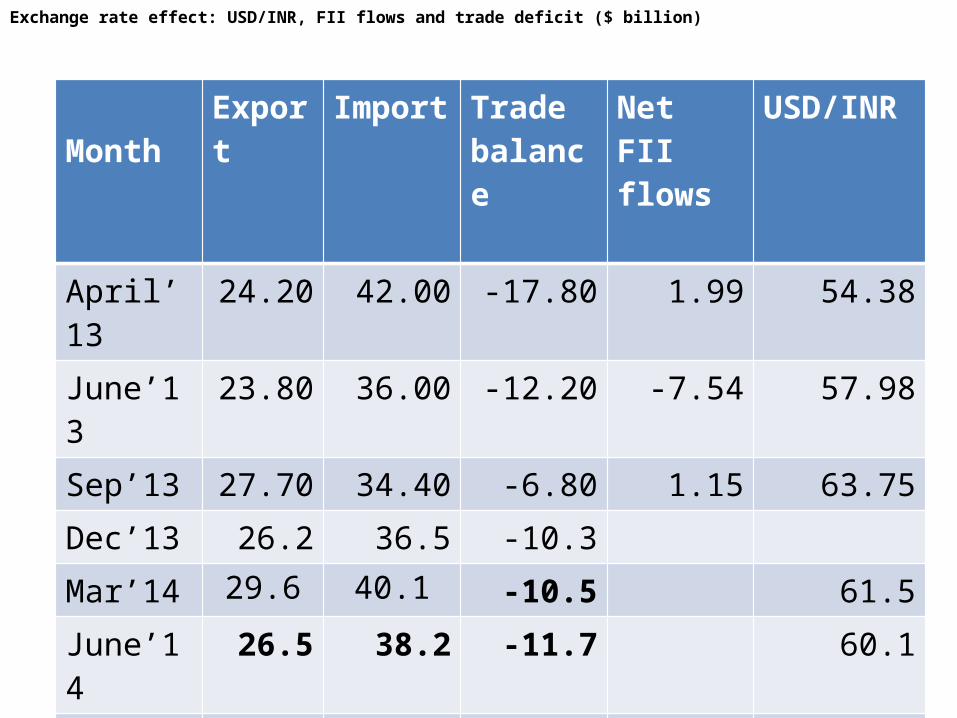
Exchange rate effect: USD/INR, FII flows and trade deficit ($ billion)
Month
Export Import Trade balance
Net FII flows
USD/INR
April’13 24.20 42.00 -17.80 1.99 54.38
June’13 23.80 36.00 -12.20 -7.54 57.98
Sep’13 27.70 34.40 -6.80 1.15 63.75
Dec’13 26.2 36.5 -10.3
Mar’14 29.6 40.1 -10.5 61.5
June’14 26.5 38.2 -11.7 60.1
July’14
Exchange rates stabilized and INR appreciated since September due to various RBI measures-FCNR(B) swaps etc. FII flows (debt + equity) are also seen increasing since January 2014.
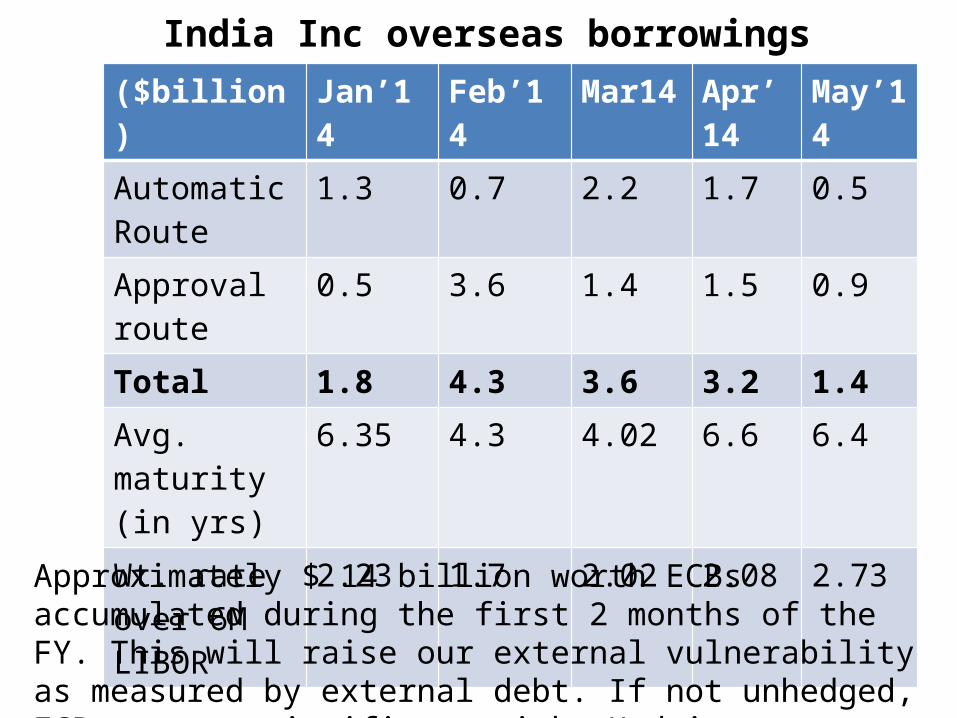
India Inc overseas borrowings($billion) Jan’14 Feb’14 Mar14 Apr’1
4May’14
Automatic Route
1.3 0.7 2.2 1.7 0.5
Approval route
0.5 3.6 1.4 1.5 0.9
Total 1.8 4.3 3.6 3.2 1.4
Avg. maturity (in yrs)
6.35 4.3 4.02 6.6 6.4
Wt. rate over 6M LIBOR
2.23 1.7 2.02 2.08 2.73
Approximately $ 14 billion worth ECBs accumulated during the first 2 months of the FY. This will raise our external vulnerability as measured by external debt. If not unhedged, ECBs pose a significant risk. Hedging costs are also high.
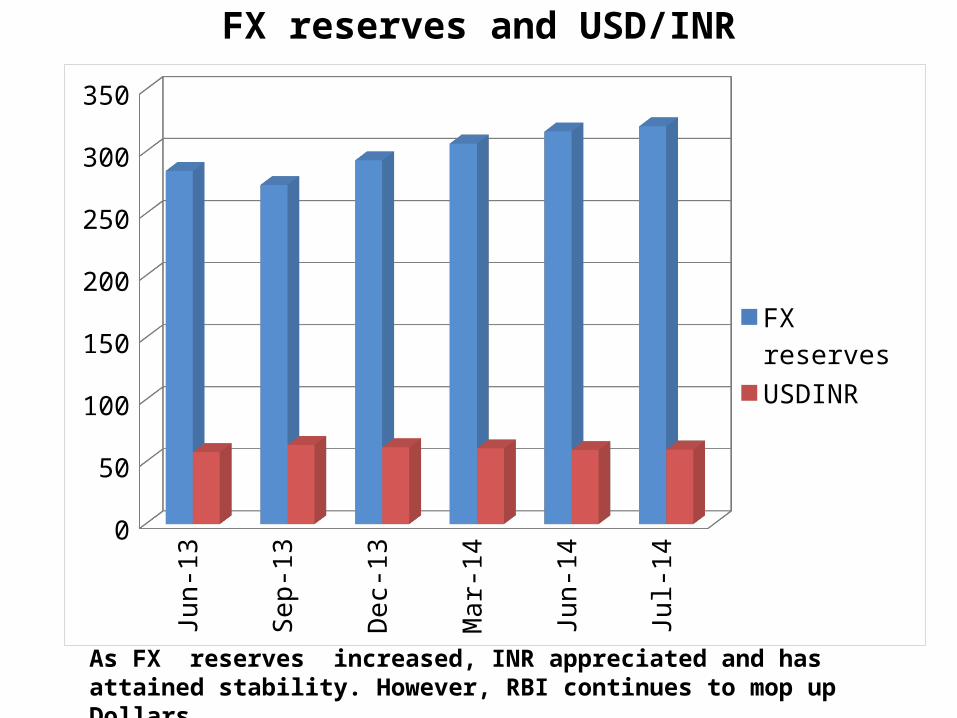
FX reserves and USD/INR
Jun-
13
Sep
-13
Dec
-13
Mar
-14
Jun-
14
Jul-
14
0
50
100
150
200
250
300
350
FX reserves
USDINR
As FX reserves increased, INR appreciated and has attained stability. However, RBI continues to mop up Dollars.
Measures announced by RBI to reverse Rupee slide RBI announced various measures. They include:
1. Deregulation of interest rates on NRE deposits.
2. Banks allowed to offer interest rates upto LIBOR/SWAP + 400
bps on FCNR(B) deposits till Jan 31, 2014. Also exempted from
CRR/SLR.
3. FCNR(B) deposits of >3 yr maturity allowed to be swapped with
RBI at fixed swap rate of 3.5% p.a with a lock in of one year.
Swap with RBI only in USD.
4. Banks allowed to swap Tier 1 capital raised abroad with RBI at
1% below market rate for those with 12% CRAR.
5. Special USD swap window for oil marketing companies.
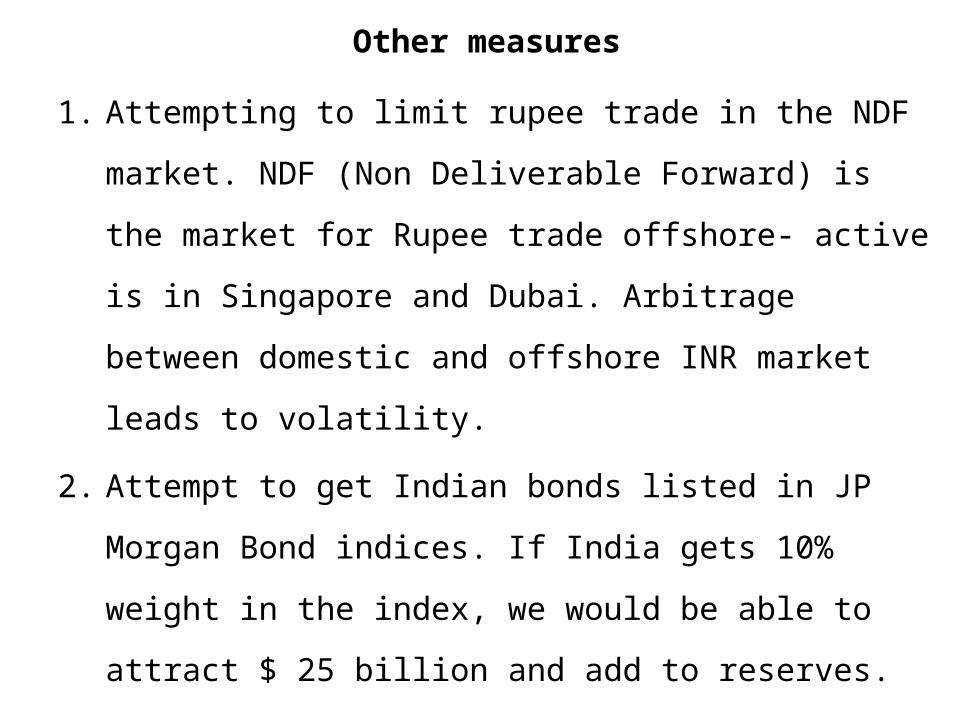
Other measures
1. Attempting to limit rupee trade in the NDF market. NDF
(Non Deliverable Forward) is the market for Rupee trade
offshore- active is in Singapore and Dubai. Arbitrage
between domestic and offshore INR market leads to
volatility.
2. Attempt to get Indian bonds listed in JP Morgan Bond
indices. If India gets 10% weight in the index, we would be
able to attract $ 25 billion and add to reserves. Addition to
FX reserves is necessary to improve import cover (7
months) and to prevent further slide in Rupee.
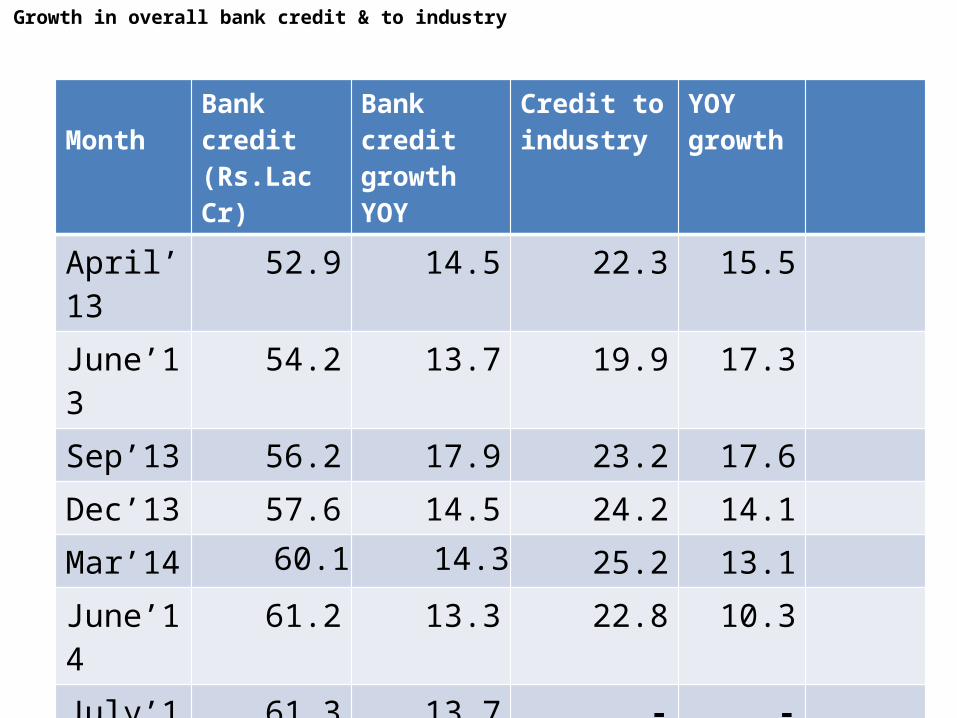
Growth in overall bank credit & to industry
Month
Bank credit (Rs.Lac Cr)
Bank credit growth YOY
Credit to industry
YOY growth
April’13 52.9 14.5 22.3 15.5
June’13 54.2 13.7 19.9 17.3
Sep’13 56.2 17.9 23.2 17.6
Dec’13 57.6 14.5 24.2 14.1
Mar’14 60.1 14.3 25.2 13.1
June’14 61.2 13.3 22.8 10.3
July’14 61.3 13.7 - -
Credit to industry on a declining trend. Shows lack of demand due to slow growth. ECBs at lower cost is also one reason. IIP growth also substantiates this aspect.
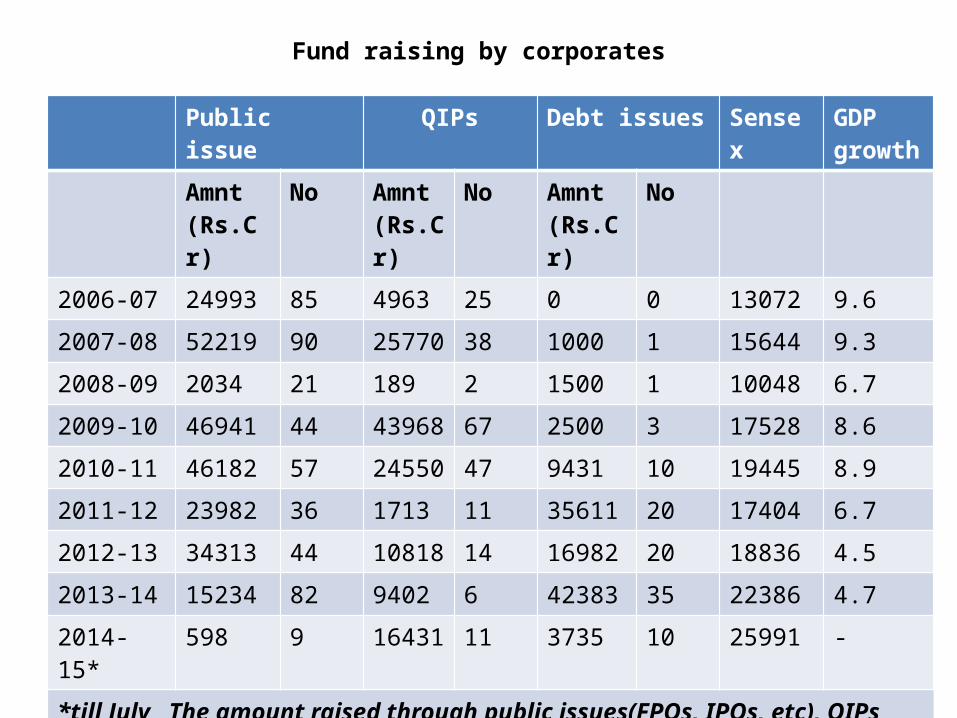
Fund raising by corporates
Public issue QIPs Debt issues Sensex GDP growth
Amnt (Rs.Cr)
No Amnt (Rs.Cr)
No Amnt (Rs.Cr)
No
2006-07 24993 85 4963 25 0 0 13072 9.6
2007-08 52219 90 25770 38 1000 1 15644 9.3
2008-09 2034 21 189 2 1500 1 10048 6.7
2009-10 46941 44 43968 67 2500 3 17528 8.6
2010-11 46182 57 24550 47 9431 10 19445 8.9
2011-12 23982 36 1713 11 35611 20 17404 6.7
2012-13 34313 44 10818 14 16982 20 18836 4.5
2013-14 15234 82 9402 6 42383 35 22386 4.7
2014-15* 598 9 16431 11 3735 10 25991 -
*till July The amount raised through public issues(FPOs, IPOs, etc), QIPs and debt issues has little correlation with domestic growth. In 2008-09, the fall was sharpest due to global crisis. The correlation with Sensex movements is much stronger except 2013-14 due to political uncertainty.
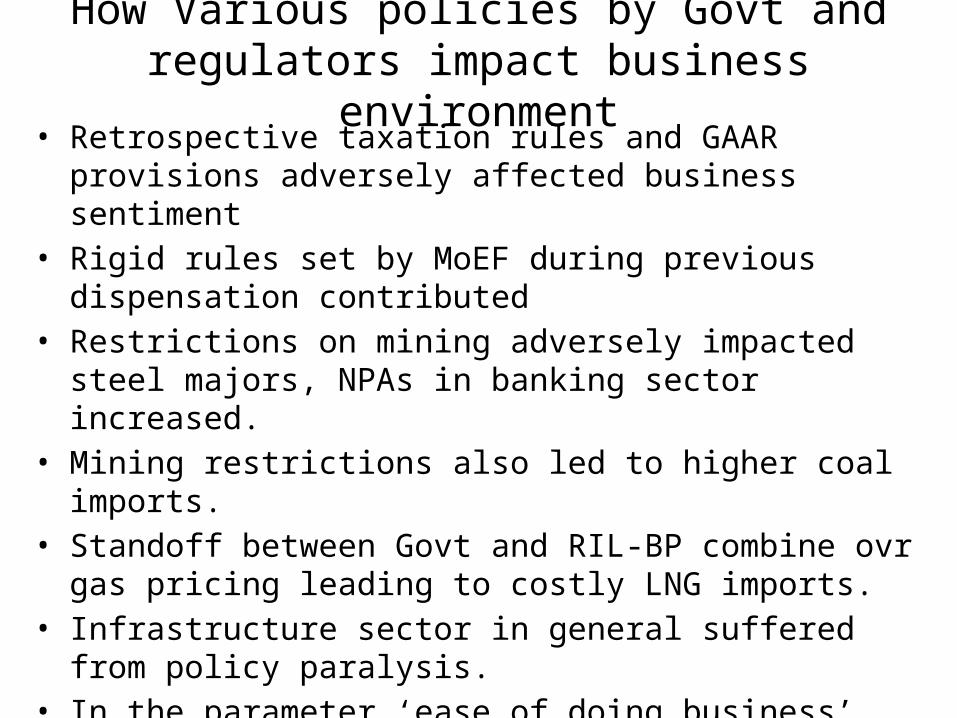
How Various policies by Govt and regulators impact business environment
• Retrospective taxation rules and GAAR provisions adversely affected business sentiment
• Rigid rules set by MoEF during previous dispensation contributed• Restrictions on mining adversely impacted steel majors, NPAs in
banking sector increased.• Mining restrictions also led to higher coal imports.• Standoff between Govt and RIL-BP combine ovr gas pricing
leading to costly LNG imports.• Infrastructure sector in general suffered from policy paralysis.• In the parameter ‘ease of doing business’, India slipped in
rankings.• RBI measure to curb INR fall by restricting access to LAF
window did not help. It adversely affected bank margins.
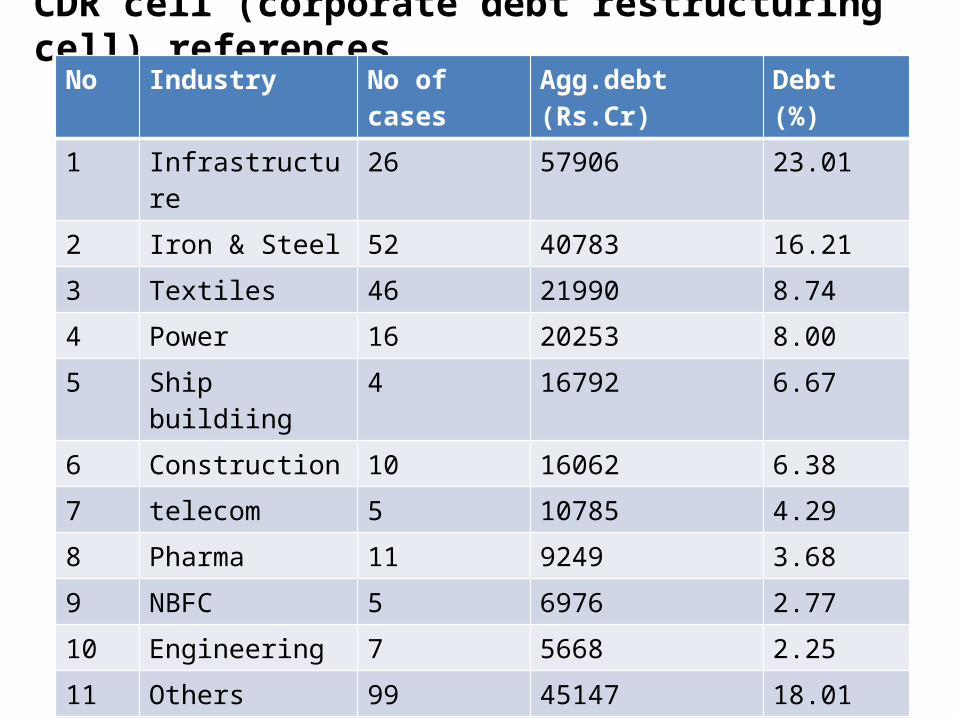
CDR cell (corporate debt restructuring cell) referencesNo Industry No of cases Agg.debt (Rs.Cr) Debt (%)
1 Infrastructure 26 57906 23.01
2 Iron & Steel 52 40783 16.21
3 Textiles 46 21990 8.74
4 Power 16 20253 8.00
5 Ship buildiing 4 16792 6.67
6 Construction 10 16062 6.38
7 telecom 5 10785 4.29
8 Pharma 11 9249 3.68
9 NBFC 5 6976 2.77
10 Engineering 7 5668 2.25
11 Others 99 45147 18.01
Total 281 251611* 100.00
* Net of cases withdrawn and successfully exited. Top 4 sectors account for more than 50% cases referred to CDR by amount. These are the stressed sectors and the most leveraged. They account for bulk of NPAs.
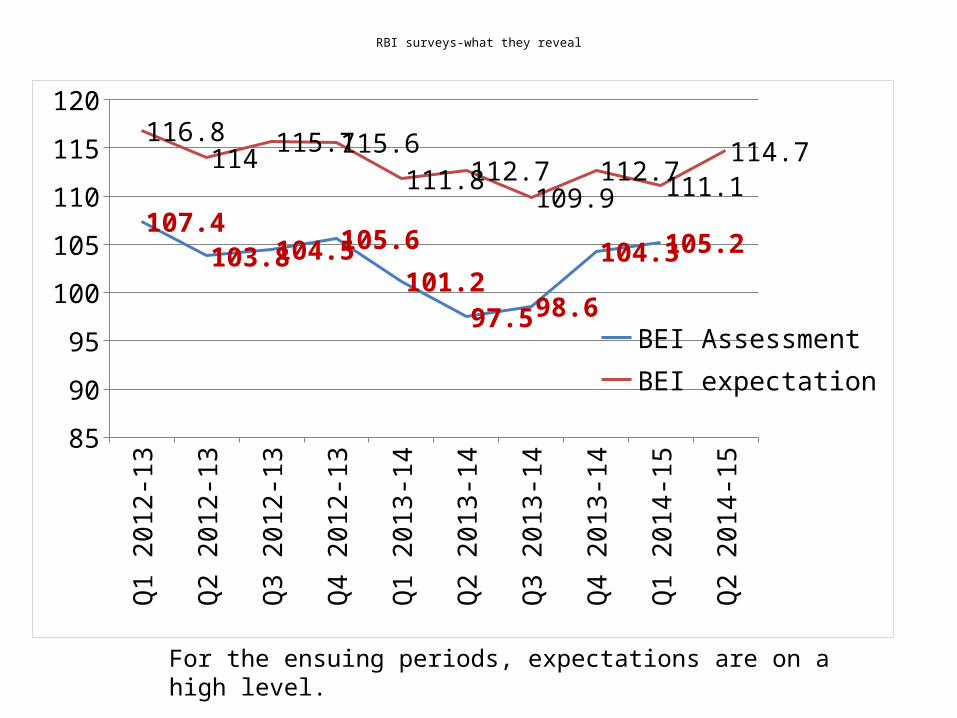
RBI surveys-what they reveal
Q1
2012
-13
Q2
2012
-13
Q3
2012
-13
Q4
2012
-13
Q1
2013
-14
Q2
2013
-14
Q3
2013
-14
Q4
2013
-14
Q1
2014
-15
Q2
2014
-1585
90
95
100
105
110
115
120
107.4103.8104.5105.6
101.297.5 98.6
104.3105.2
116.8114
115.7115.6111.8112.7
109.9112.7
111.1114.7
BEI AssessmentBEI expectation
For the ensuing periods, expectations are on a high level.
Key takeaways from the survey
• Expectation Index (BEI), shows improvement for Q2:2014-15 (114.7) as compared to previous quarter (111.1) and the corresponding quarter of previous year (112.7).
• The improvement in BEI for the expectation quarter is due to optimism on overall business situation, production, order books, capacity utilization, imports, etc.
• Reduced pessimism on cost of finance, cost of raw material and the profit margin is another reason.
• For Q2:2014-15, the proportion of respondents who expected increase in production and at the same time decline in employment (indicating jobless growth) turns out to be around two per cent. This has been consistent throughout past ten rounds of the survey.
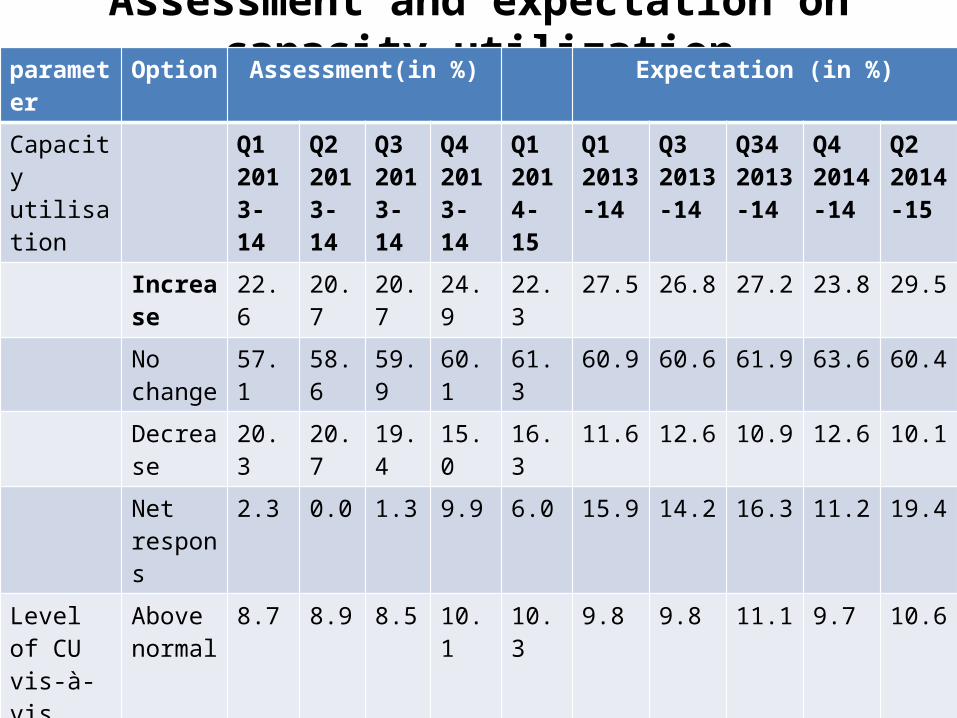
Assessment and expectation on capacity utilizationparameter
Option Assessment(in %) Expectation (in %)
Capacity utilisation
Q1 2013-14
Q2 2013-14
Q3 2013-14
Q4 2013-14
Q1 2014-15
Q1 2013-14
Q3 2013-14
Q34 2013-14
Q4 2014-14
Q2 2014-15
Increase 22.6 20.7 20.7 24.9 22.3 27.5 26.8 27.2 23.8 29.5No change
57.1 58.6 59.9 60.1 61.3 60.9 60.6 61.9 63.6 60.4
Decrease
20.3 20.7 19.4 15.0 16.3 11.6 12.6 10.9 12.6 10.1
Net respons
2.3 0.0 1.3 9.9 6.0 15.9 14.2 16.3 11.2 19.4
Level of CU vis-à-vis last 4 yr avg
Above normal
8.7 8.9 8.5 10.1 10.3 9.8 9.8 11.1 9.7 10.6
Normal 71.0 70.7 69.7 72.2 71.8 76.2 75.0 73.4 75.4 76.6
Below normal
20.3 20.4 21.8 17.6 17.9 13.9 15.2 15.5 14.9 12.7
Net response
-11.6 -11.5
-13.3
-7.5 -7.6 -4.1 -5.3 -4.4 -5.2 -2.1
The assessment and expectation survey on capacity utilisation show a robust and upbeat picture of future. Also indicates possibility of better growth prospects.
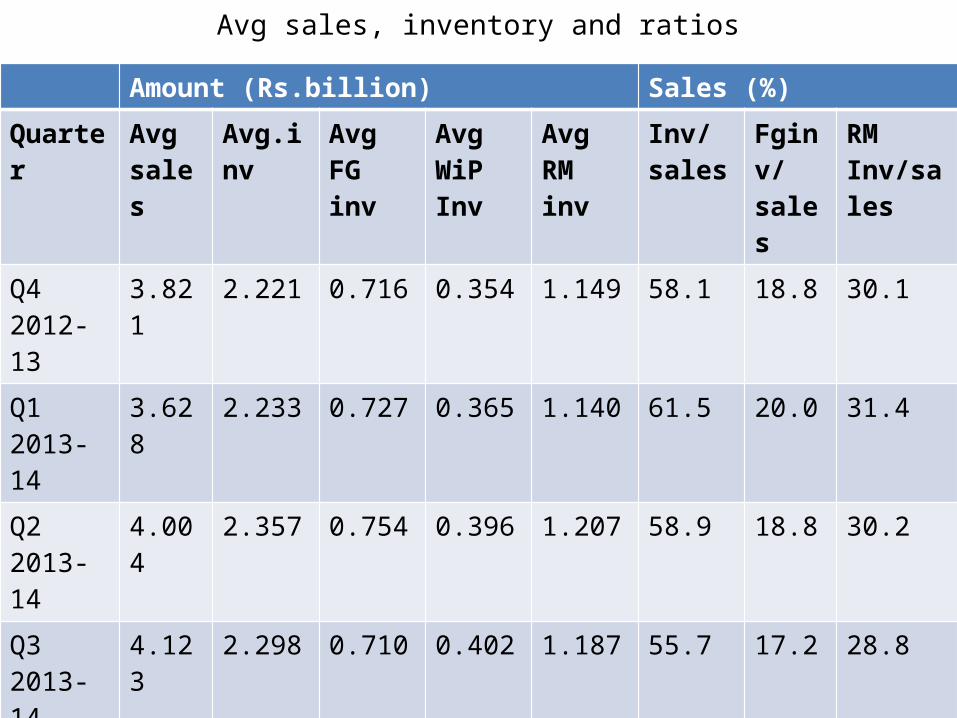
Avg sales, inventory and ratios
Amount (Rs.billion) Sales (%)
Quarter Avg sales
Avg.inv Avg FG inv
Avg WiP Inv
Avg RM inv
Inv/sales
Fginv/sales
RM Inv/sales
Q4 2012-13
3.821 2.221 0.716 0.354 1.149 58.1 18.8 30.1
Q1 2013-14
3.628 2.233 0.727 0.365 1.140 61.5 20.0 31.4
Q2 2013-14
4.004 2.357 0.754 0.396 1.207 58.9 18.8 30.2
Q3 2013-14
4.123 2.298 0.710 0.402 1.187 55.7 17.2 28.8
Q4 2013-14
4.342 2.290 0.722 0.400 1.168 52.7 16.6 26.9
RM; Raw material; WiP; work in progress; FG; Finished Goods
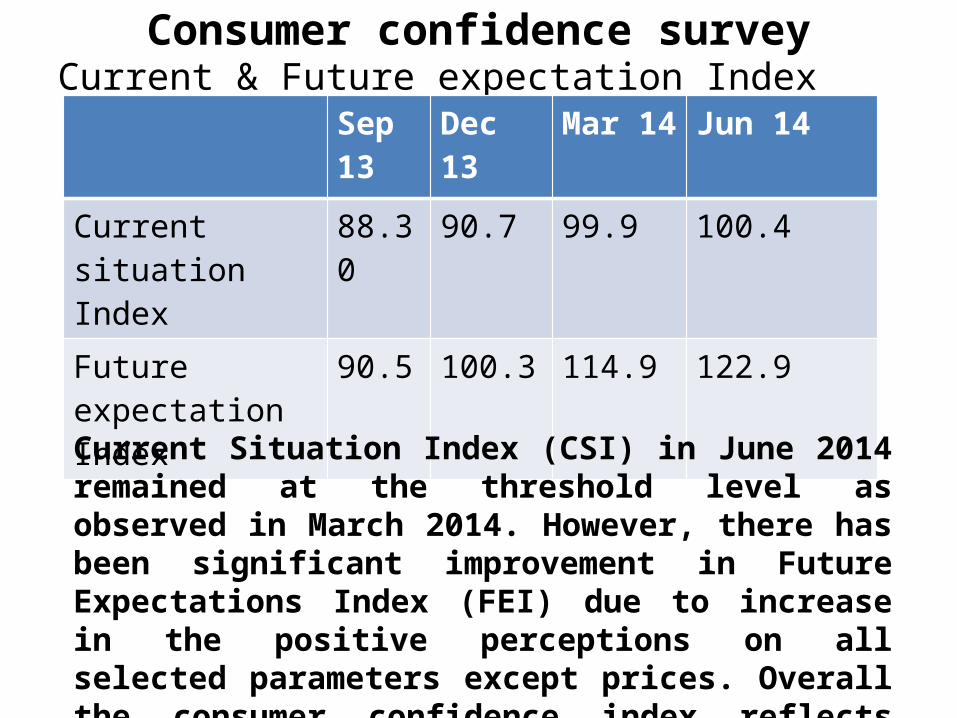
Consumer confidence surveyCurrent & Future expectation Index
Sep 13
Dec 13 Mar 14 Jun 14
Current situation Index
88.30 90.7 99.9 100.4
Future expectation Index
90.5 100.3 114.9 122.9
Current Situation Index (CSI) in June 2014 remained at the threshold level as observed in March 2014. However, there has been significant improvement in Future Expectations Index (FEI) due to increase in the positive perceptions on all selected parameters except prices. Overall the consumer confidence index reflects improvement in the positive perceptions during current round of survey.
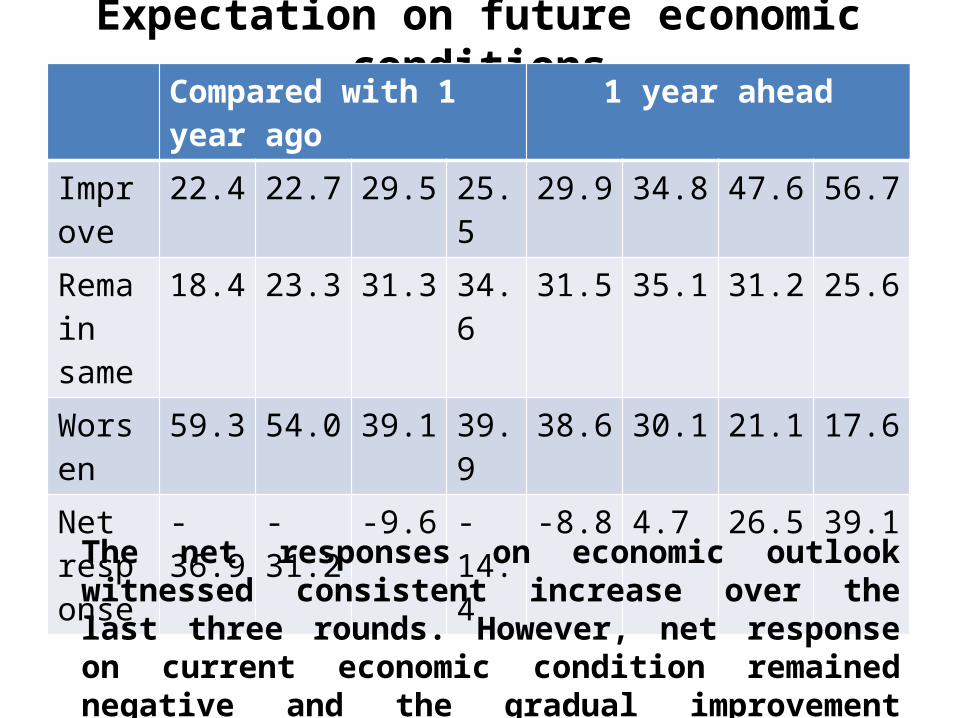
Expectation on future economic conditionsCompared with 1 year ago
1 year ahead
Improve
22.4 22.7 29.5 25.5 29.9 34.8 47.6 56.7
Remain same
18.4 23.3 31.3 34.6 31.5 35.1 31.2 25.6
Worsen
59.3 54.0 39.1 39.9 38.6 30.1 21.1 17.6
Net response
-36.9 -31.2 -9.6 -14.4
-8.8 4.7 26.5 39.1
The net responses on economic outlook witnessed consistent increase over the last three rounds. However, net response on current economic condition remained negative and the gradual improvement observed till the last round got reversed . However, the 1 year ahead expectation is upbeat.
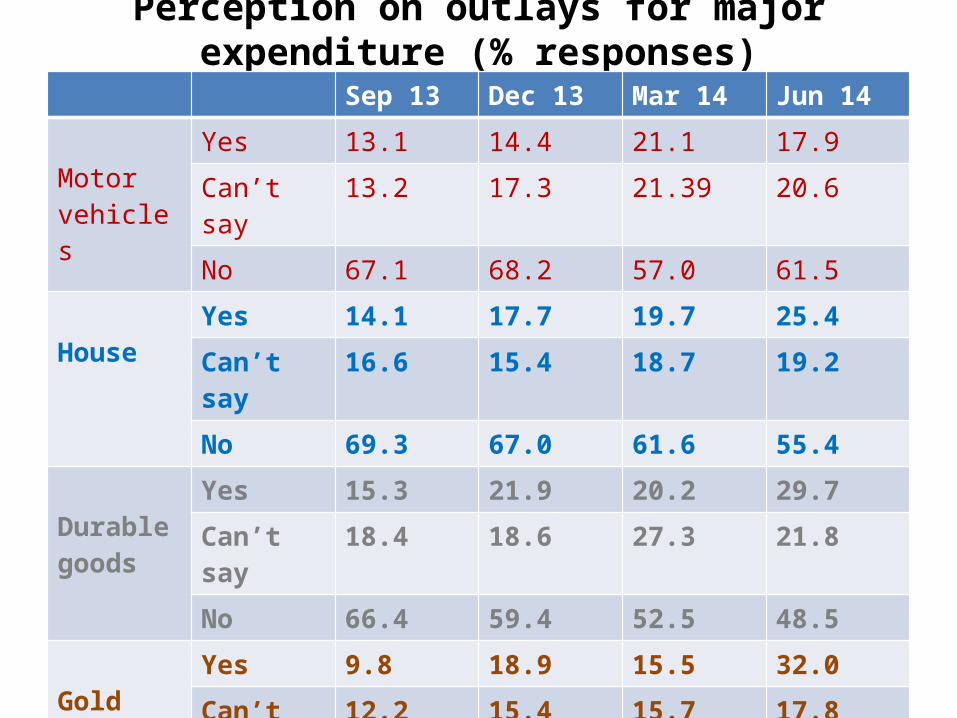
Perception on outlays for major expenditure (% responses)
Sep 13 Dec 13 Mar 14 Jun 14
Motor vehicles
Yes 13.1 14.4 21.1 17.9
Can’t say 13.2 17.3 21.39 20.6
No 67.1 68.2 57.0 61.5
HouseYes 14.1 17.7 19.7 25.4
Can’t say 16.6 15.4 18.7 19.2
No 69.3 67.0 61.6 55.4
Durable goods
Yes 15.3 21.9 20.2 29.7
Can’t say 18.4 18.6 27.3 21.8
No 66.4 59.4 52.5 48.5
GoldYes 9.8 18.9 15.5 32.0
Can’t say 12.2 15.4 15.7 17.8
No 78.0 65.6 68.8 50.2
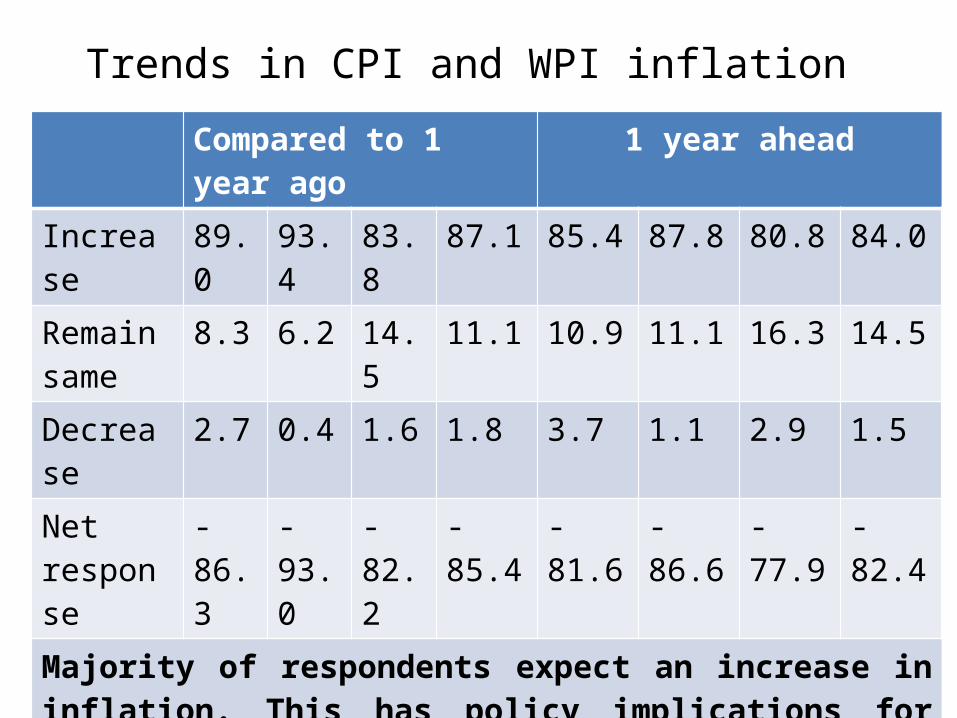
Trends in CPI and WPI inflation Compared to 1 year ago 1 year ahead
Increase 89.0 93.4 83.8 87.1 85.4 87.8 80.8 84.0
Remain same
8.3 6.2 14.5 11.1 10.9 11.1 16.3 14.5
Decrease 2.7 0.4 1.6 1.8 3.7 1.1 2.9 1.5
Net response
-86.3
-93.0
-82.2
-85.4 -81.6 -86.6 -77.9 -82.4
Majority of respondents expect an increase in inflation. This has policy implications for sectors like FMCG and even banks. For instance, banks might have to increase deposit rates to attract funds.
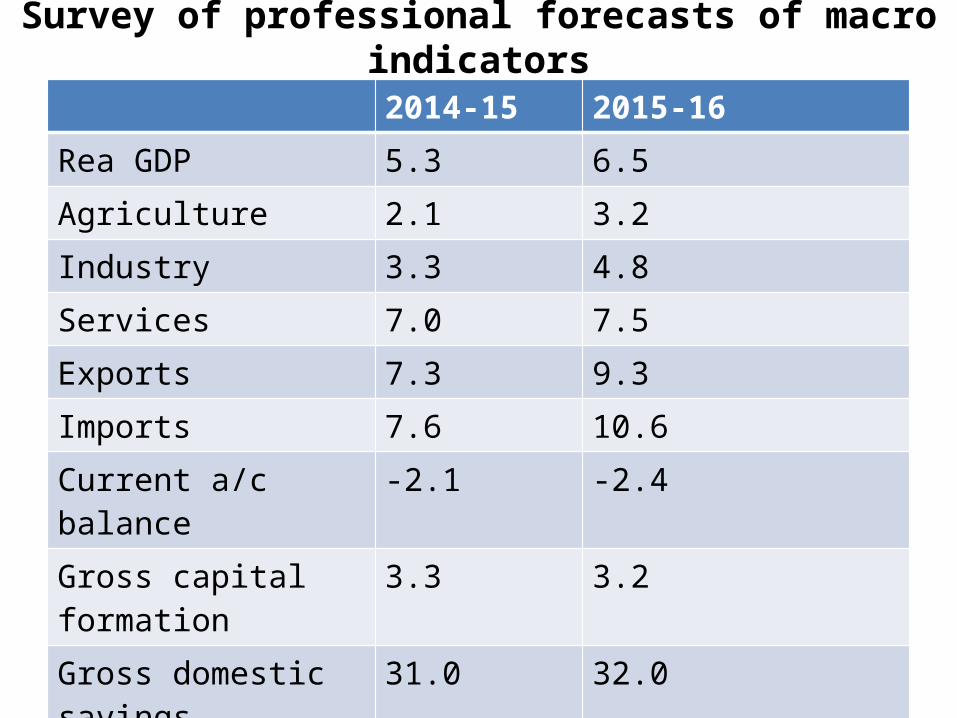
Survey of professional forecasts of macro indicators
2014-15 2015-16
Rea GDP 5.3 6.5
Agriculture 2.1 3.2
Industry 3.3 4.8
Services 7.0 7.5
Exports 7.3 9.3
Imports 7.6 10.6
Current a/c balance -2.1 -2.4
Gross capital formation 3.3 3.2
Gross domestic savings 31.0 32.0
FY 2015-16 looks like the real turnaround year.
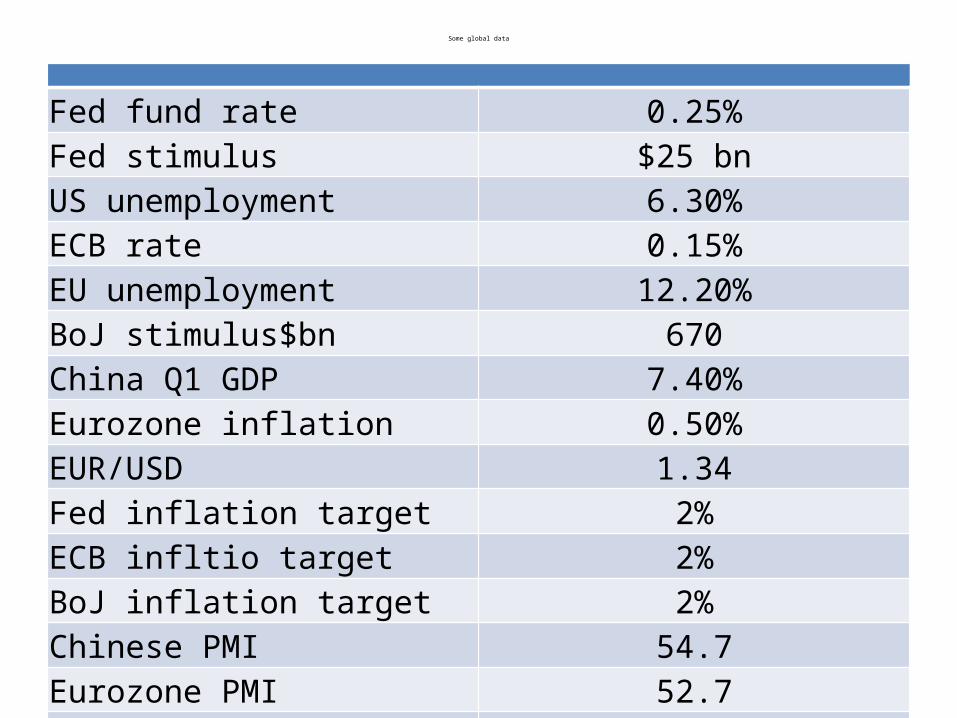
Some global data
Fed fund rate 0.25%Fed stimulus $25 bnUS unemployment 6.30%ECB rate 0.15%EU unemployment 12.20%BoJ stimulus$bn 670China Q1 GDP 7.40%Eurozone inflation 0.50%EUR/USD 1.34Fed inflation target 2%ECB infltio target 2%BoJ inflation target 2%Chinese PMI 54.7Eurozone PMI 52.7US non farm payroll (in lakhs) 209000
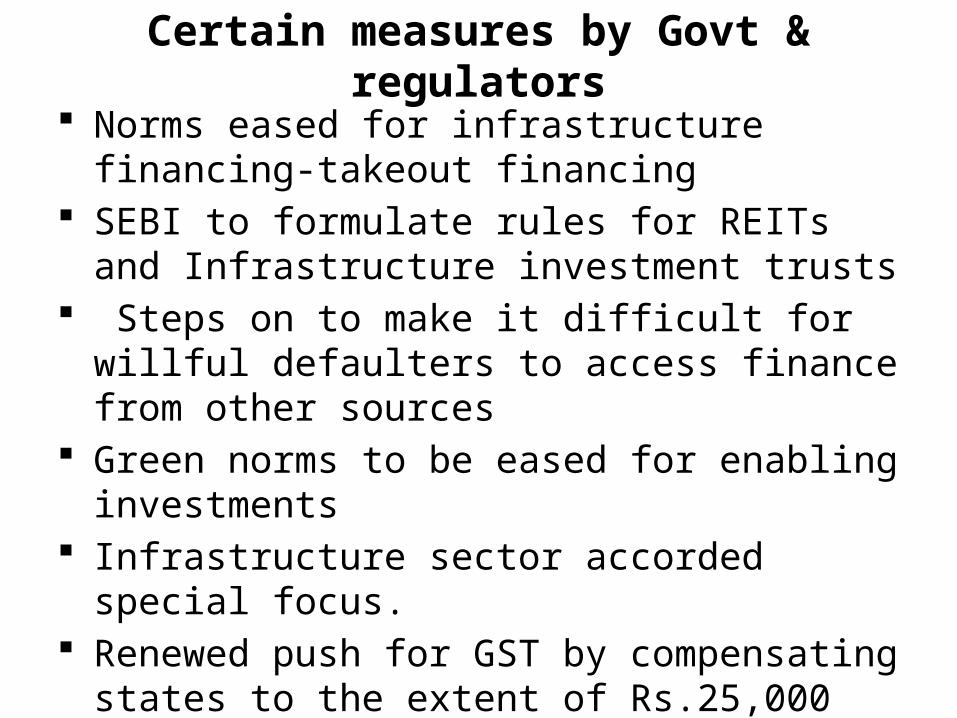
Certain measures by Govt & regulators
Norms eased for infrastructure financing-takeout financing
SEBI to formulate rules for REITs and Infrastructure investment trusts
Steps on to make it difficult for willful defaulters to access finance from other sources
Green norms to be eased for enabling investments Infrastructure sector accorded special focus. Renewed push for GST by compensating states to the
extent of Rs.25,000 Cr. Merger of PSBs and changes in board constitution.
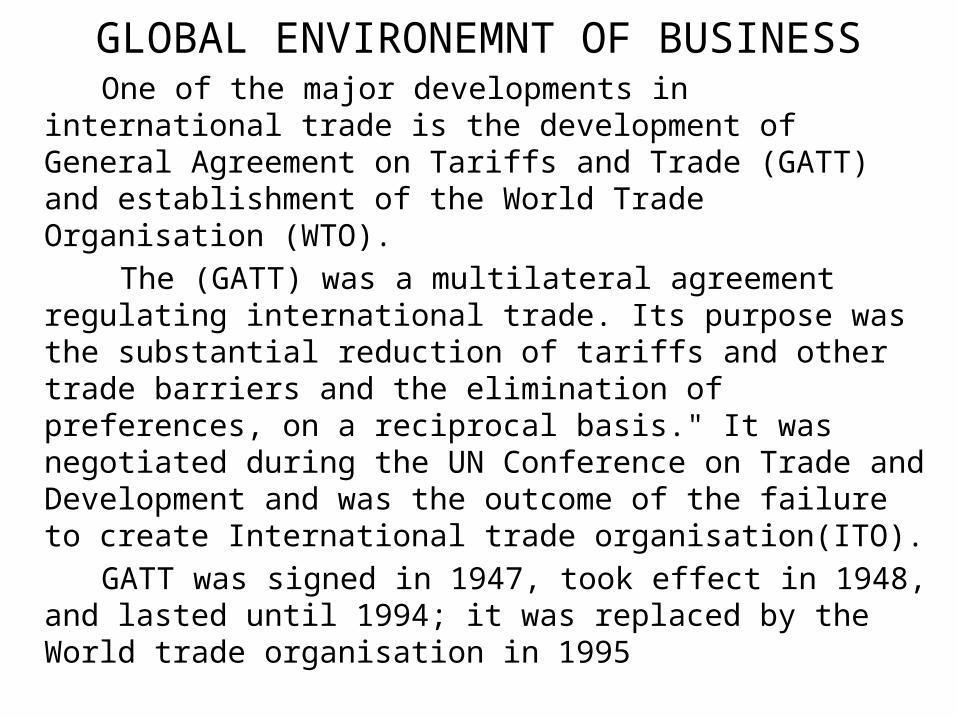
GLOBAL ENVIRONEMNT OF BUSINESS One of the major developments in international trade is the
development of General Agreement on Tariffs and Trade (GATT) and establishment of the World Trade Organisation (WTO).
The (GATT) was a multilateral agreement regulating international trade. Its purpose was the substantial reduction of tariffs and other trade barriers and the elimination of preferences, on a reciprocal basis." It was negotiated during the UN Conference on Trade and Development and was the outcome of the failure to create International trade organisation(ITO).
GATT was signed in 1947, took effect in 1948, and lasted until 1994; it was replaced by the World trade organisation in 1995
Why WTO replaced GATT? While the GATT functioned well enough, the leading members
wished to replace it with a world-wide trade-regulating body like the WTO for a number of reasons.
GATT rules applied to trade only in merchandise goods. In addition to goods, the WTO covers trade in services and intellectual property (through the agreement on Trade-related Aspects of Intellectual Property Rights-TRIPs).
The WTO dispute settlement system is faster, more automatic, and thus much less susceptible to blockages, than the old GATT system.GATT was a set of rules, a multilateral agreement, with no institutional foundation.
Moreover, the GATT was applied on a "provisional basis" even if, after more than forty years, governments chose to treat it as a permanent commitment while the WTO commitments are fully and functionally permanent. GATT was on a "provisional basis“ while the WTO commitments are fully and functionally permanent.
• The Doha Round is the latest round of trade negotiations among the WTO membership. Its aim is to achieve major reform of the international trading system through the introduction of lower trade barriers and revised trade rules. The work programme covers about 20 areas of trade. The Round is also known semi-officially as the Doha Development Agenda as a fundamental objective is to improve the trading prospects of developing countries.
• The Round was officially launched at the WTO’s Fourth Ministerial Conference in Doha, Qatar, in November 2001. The Doha Ministerial Declaration provided the mandate for the negotiations, including on agriculture, services and an intellectual property topic, which began earlier.
• In Doha, ministers also approved a decision on how to address the problems developing countries face in implementing the current WTO agreements.
Main areas of negotiation in Doha Rounds are agriculture, Non Agricultural market Access (NAMA), services, intellectual property, trade and development, environment, trade facilitation, WTO rules and dispute settlement.
Right now, the Bali declaration started on December 2013 is going on.
India has taken a tough stance in trade facilitation agreement by linking it with agriculture where the issue is that of [public stockholding of food grains.
BIPAs
• Bilateral Investment Promotion and Protection Agreement (BIPA) is a
bilateral treaty which is defined as an agreement between two countries
for reciprocal encouragement, promotion and protection of investments in
each other's territories by the companies based in either country (or State)
• The Government of India has, so far, signed BIPAs with 62 countries out
of which 50 BIPAs have already come into force and the remaining
agreements are in the process of being enforced.
Features of BIPA
• The agreements apply to all investments made by the investors of each
contracting party in the territory of the other contracting party in
accordance with their laws and regulations.
In particular, it includes the following
Movable and immovable property as well as other rights such as
mortgages, liens or pledges;
Shares in the stocks and debentures of a company and any other
similar forms of participation in a company; Rights to money or to
any performance under the contract having a financial value
Intellectual property rights, goodwill, technical processes and
know how in accordance with the relevant laws of the respective
contracting party;
Business concessions conferred by law or under contract,
including concessions to search for and extract oil and other
minerals.
The agreement also contains elaborate provisions for resolution of
disputes between the contracting parties