Embed Size (px)
Citation preview
Economic and State Budget Cost of Reducing the Consumptive Use of Irrigation Water in the Platte and Republican Basins
Analysis Prepared by:
Ray Supalla, Tom Buell and Brian McMullen1
August 21, 2006
1 Ray Supalla is Professor of Agricultural Economics, Tom Buell is Graduate Research Assistant and Brian McMullen is Research Associate, Department of Agricultural Economics, UNL. Analysis was conducted as a public service for the Nebraska Department of Natural Resources.
Summary The potential costs to irrigators, the state economy and the state budget were estimated
for different methods of reducing consumptive use (CU) of irrigation water in the Platte and
Republican Basins. The policy methods considered included: leased retirement of irrigated land
using a willing buyer-willing seller approach; required land retirement with lease payments equal
to actual producer losses; retirement of irrigated land by purchasing water rights using a willing
buyer-willing seller approach; forced retirement of irrigated land with the purchase price equal to
actual market value; allocation with 100 percent producer compensation; and allocation with 50
percent producer compensation. Both long and short-term programs were considered with the
reduced consumptive use occurring at different locations within each basin. The analysis
assumes that CU must be reduced by 75,000 acre-feet in the Platte Basin west of Elm Creek, and
by 100,000 acre-feet in the Republican Basin.
Findings and Conclusions Concerning Economic Costs
• The land rental and land sales markets provide the best indication of the value of irrigation water at the farm level. A comparison of irrigated and dryland market values suggests that irrigation water is worth an average of $74 per acre per year in the Platte Basin and $82 per acre per year in the Republican Basin, with an average sale value of $639 per acre in the Platte and $725 in the Republican.
• The on-farm cost of reducing consumptive use depends on the per acre value of irrigation
water and on the level of consumptive use per acre. The on-farm costs were estimated to average $69 per acre-foot of CU in the Platte Basin and $98 in the Republican Basin. In both basins on-farm costs per acre-foot of consumptive use decreases as one moves from east to west.
• The off-farm costs of reducing consumptive use are initially quite high, but diminish as
the displaced resources move to alternative uses. Off-farm costs for the first year of a CU reduction program were estimated at $180 per acre-foot for the Platte and $193 for the Republican when a land retirement approach was assumed, and at $131 for the Platte and $176 for the Republican if only allocation was used to reduce consumptive use. All first year costs were projected to diminish to about 15 percent of the first year values within10 years or less.
• Total statewide economic costs for both the on-farm and off-farm effects were estimated
for the Platte Basin to range from $185 per acre-foot change in CU for a 10 year program to $114 for a 50 year program, if a land retirement approach was used and from $225 to $147 if allocation was used to achieve the same level of reduction. The corresponding estimates for the Republican Basin were from $160 to $143 for land retirement and from $230 to $207 for allocation.
2
• The total economic cost of reducing depletions to the river was found to be substantially cheaper if the irrigation reductions occurred on land located close to the river, especially if the need was for a short-term program. A 10 year program in the Platte Basin, for example, would cost over $20,000 per acre-foot if the reduced pumping occurred five miles from the river, which corresponded for this calculation to the 28/40 line, compared to $367 for land located one mile from the river. Location was found to be much less important for a 50 year program, but still varied from $155 for land one mile from the river to $702 per acre-foot for land 5 miles away.
Findings and Conclusions Concerning Community Impacts • The best indication of how community level employment, population and income will be
affected by irrigation reductions is how such communities were affected when the irrigation development occurred.
• The available empirical evidence suggests that the effects from the expected level of
change in irrigation will be too small to be problematic at the community level.
• In the late 1990’s irrigated acreage in the Republican Basin increased by about 15 percent, which is approximately the level of decrease that may be needed, yet employment, population and income was not noticeably effected.
• The community property tax revenue base is unlikely to be reduced by more than two
percent in either basin by the expected level of irrigation reductions, unless the irrigation reductions are very concentrated in small parts of the basin.
Findings and Conclusions Concerning State Budget Costs • The estimated total annual state budget cost of reducing CU in the Platte Basin by 75 kaf
ranged from $3.2 million ($42/AF reduction in CU) for a land retirement, water right purchase program with compensation equal to market value, to 7.7 million ($103/AF reduction in CU) for a voluntary water right leasing program.
• Total up-front budget costs for a 75 kaf Platte Basin program depend on the planned
program length. A very long-term 50 year program would have total up-front costs ranging from $45.5 million for a water right purchase with market value compensation, to $168.1 million if an allocation approach with full compensation is used. Total up-front costs for a short-term 10 year program were estimated to range from $31.7 million to $68.3 million.
• The estimated total annual state budget cost of reducing CU in the Republican Basin by
100 kaf ranged from $4.5 million ($45/AF reduction in CU) for a land retirement, water right purchase program with compensation equal to market value, to $15.5 million ($155/AF reduction in CU) for a voluntary water right leasing program.
3

• Total up-front budget costs for a 100 kaf Republican Basin program followed a pattern similar to the Platte and ranged from $64.8 million for a water right purchase with market value compensation, to $110.7 million using a voluntary water right leasing approach. The range for a 10 year program was $63.0 million to $120.7 million.
• The per acre-foot cost of reducing depletions to the river will be much higher than the
cost of reducing depletions to the basin, especially if the reduced irrigation occurs at more than one or two miles from the river.
• The cost differences between water right leasing and purchasing are very large for long
term programs, because with leasing the costs continue indefinitely, whereas with purchasing once the right is paid for there are no further costs.
Policy Implications
• Policy makers can minimize the cost of reducing consumptive use from irrigation and augmenting stream-flow by purchasing rather than leasing irrigation rights, by using regulatory instead of a willing buyer and willing seller approach, and by reducing irrigation at locations close to the river
• Allocation programs, with compensation, rather than irrigated land retirement should be
seriously considered as administratively easier, although somewhat more expensive, approach to reducing CU from irrigation.
• Cost uncertainties are primarily due to unknowns regarding what type of program(s) will
be used to achieve the desired outcomes. If the political process finds required irrigated land retirement with market value compensation, or allocation with perhaps only partial compensation acceptable, then state budget costs will be relatively low. On the other hand, if Nebraska chooses to use a willing buyer and willing seller land retirement program, or a land leasing program, then many may find the costs prohibitively high.
4
Introduction
Nebraska must reduce the consumptive use (CU) of irrigation water in the Republican
Basin, as per a legally binding Compact with Kansas and Colorado; in the Platte Basin, as per the
requirements in a proposed plan developed under the terms of a Cooperative Agreement with
Colorado, Wyoming and the U. S. Department of Interior; and in any over appropriated basin, as
per the requirements of LB962. This analysis addresses the economic costs and the potential
state budget costs of meeting these objectives under alternative policy scenarios. Economic costs
are estimated for both the on-farm and off-farm consequences, including the statewide effects as
the changes ripple through the Nebraska economy.
Factors Affecting Costs
Both the economic and the budgetary costs depend on the policy characteristics which
determine how and when consumptive use is reduced. First, these costs depend on whether the
appropriate policy concern is depletion to the basin or depletion to the river. When the policy
concern is depletion to the river, depletion reduction costs will be much lower if the policies used
result in irrigation reductions on lands which are close to the river. Second, CU reduction costs
depend on whether CU is reduced by decreasing irrigated acres, or by reducing the amount of
water pumped or diverted (allocations). It is usually less costly to reduce CU by reducing acres,
compared to reducing allocations, because there is more opportunity for simultaneously reducing
production and irrigation costs. Third, CU reduction costs depend on factors affecting the
profitability of irrigation, including rainfall, crop prices, irrigation costs and other production
costs. All factors affecting the profitability of irrigation, per unit of consumptive use, will
proportionately change the cost of reducing depletions to both the basin and the river. Finally,
average CU reduction costs depend on whether the need is for short or long-term reductions.
This is especially true for off-farm costs which are relatively high initially but diminish
substantially over the long-term.
Policy Options Evaluated
The policy options considered in this analysis reflect current issues in the Platte and
Republican Basins. For the Platte Basin the analysis focuses on the potential cost of off-setting
the increased depletions to the river which have occurred between 1997 and 2005, as determined
under the terms of the Cooperative Agreement. The cost of off-setting these depletions is
5
estimated for both irrigated land retirement and for allocation programs implemented over 10, 25
and 50 years, respectively. The specific programs considered include:
Land retirement via a voluntary annual lease; Land retirement via regulations, with annual compensation payments equal to the actual average on-farm cost; Land retirement via voluntary purchase of water rights; Land retirement via regulation with one-time compensation payments equal to market value of the water right (difference in land value with and without irrigation); Allocation via regulation with no compensation; and Allocation via regulation with compensation equal to 100 percent of the calculated reduction in farm income.
Costs under these policy scenarios were estimated for reducing depletions to the Platte
Basin, as well as for reducing depletions to the Platte River. Off-setting depletions to the basin
represent what might be required over the long-term under the requirements of LB962, which
mandates a water balance at the basin level, but not necessarily a restoration of stream flow.
The needs in the Republican Basin are slightly different. Under the terms of the
Republican River Compact any reduction in consumptive use helps Nebraska meet its
obligations. However, actions which have a relatively quick impact on the river during an
extended drought are especially useful. Republican Basin costs were accordingly estimated for
reduced depletions to both the river and the basin, for the same array of policy choices as the
Platte Basin.
Procedures Used to Estimate On-farm and Off-farm Economic Costs
Parties involved in the water policy process have expressed an interest in several
economic effects associated with reducing consumptive use. This analysis addresses the four
effects which are most often mentioned: the economic cost at the farm level, the economic
consequences for local communities, the effects on the state economy and the potential state
budget costs.
On-farm Costs
Farm-level economic costs were defined as the change in net economic returns. The
change in net returns for irrigation land retirement was estimated as the difference between the
6
net returns per acre of land for irrigation and the returns from the same quality land under
dryland conditions. The on-farm cost of allocation was assumed to equal the difference in net
returns due to a reduced water supply, assuming no change in capital costs.2 All on-farm values
were estimated for three representative counties in the Platte Basin (Morrill, Lincoln and Phelps)
and three counties in the Republican Basin (Franklin, Red Willow and Chase). A weighted
average of county results was used to represent each basin.3 Water Optimizer, a management
tool developed by Supalla and Martin, UNL, was used to compute the differences in net returns
using prices and costs which reflect current conditions.4 Annual property taxes on agricultural
land were assumed to be 1.72 percent in the Republican Basin and 1.67 percent in the Platte
Basin, levied on 80 percent of the market value of the land, as estimated in Johnson, 2006.5 The
interest charge was 8.0 percent for operating capital and 6.0 percent for capital costs. General
overhead was estimated at 10 percent of operating costs.
Off-farm Costs
Total economic costs for the State of Nebraska include both on and off-farm costs. These
costs could be measured as changes in economic output, value added or household income.
Change in economic output is a good measure of how business activity is affected, but is a poor
measure of the effects on Nebraska households. Value added is a better measure because it
adjusts for intermediate input costs and is therefore an indication of the net contribution made by
Nebraska resources. It is still not a good measure of how the welfare of Nebraska citizens is
affected, however, because some of the returns to Nebraska resources may accrue to citizens
outside the state. The changes in primary payments to Nebraska households which result from
changes in irrigation are the best measure of total economic cost to the state. Primary payments 2 This approach assumes that the allocation levels do not result in reduced investment in farm or irrigation equipment, either because it is uneconomic to do so or because allocation rules require sustaining the capacity to irrigate all acres to maintain the allocation. 3 The Republican Basin average was based on certified acres, with Franklin representing the 330,000 certified acres in the LRNRD (30.3% of the Basin), Red Willow representing 312,000 acres in the MRNRD (28.6%) and Chase representing 448,700 acres in the URNRD (41.1%). The weighted average for the Platte Basin was based on the 2005 estimates of irrigated acres within the 28/40 area in three reaches, with Morrill County representing 424,900 acres (53.4%), Lincoln County representing 262,037 acres (33%) and Phelps County representing 108,000 acres (13.6%). 4 The crop production costs incorporated in Water Optimizer are based on 2006 Crop Budgets developed by Roger Selley, Nebraska Cooperative Extension Service. Irrigation Costs, excluding a $7.00 per acre capital charge for the well, were assumed to be $5.00 per acre inch for all counties except Chase, which was assumed to be $5.50 because of greater pumping depth. The crop prices used were corn, $2.40/bu.; grain sorghum, $2.30/bu.; soybeans, $5.50/bu.; wheat, $3.50/bu. and hay, $70/T. 5 These basin averages are a simple average of the 2005 County Average Rate for the three counties representing each basin.
7
to households, often called earned income, are equal to wages and salaries and proprietors
income. They exclude dividends and most types of transfer income such as social security
payments. These values were estimated for the various policy scenarios using multipliers
developed by a recent study by Charles Lamphear (Lamphear, 2005).
Lamphear found that primary payments to households per one dollar change in output
from irrigated crops totaled $.796 of which $0.162 was direct payments to on-farm households
and $0.634 was payments to off-farm households. He also found that household payments from
dryland crops totaled $0.646 per one dollar change in dryland output, consisting of $0.14 in
payments to on-farm households and $0.506 in payments to off-farm households. These
coefficients were used to estimate the off-farm payments to households for both changes in
irrigated acres and changes in water allocation.
For policy scenarios involving retirement of irrigated land, the off-farm costs for the first
year of the program were estimated by multiplying the change in the value of irrigated
production times 0.634 and then subtracting the off-setting increase in dryland production, which
was computed as the change in dryland crop value times 0.506. When irrigation is reduced
through allocation rather than land retirement, however, the off-farm effects per one dollar
change in irrigated output are much different. In this case, as the value of irrigated crop
production changes there is no off-setting increase in dryland production. The only production
inputs which change are irrigation costs and some yield dependent costs such as fertilizer. The
multiplier for this situation was estimated at $0.466 cents per one dollar change in the value of
irrigated crop production. It was estimated by modifying Lamphear’s direct and indirect
requirements matrix to reflect the production input mix when irrigation crop output changes as a
result of water allocation.
Duration of Off-farm Costs
The off-farm costs, also called secondary costs in the economics literature, are transitory
because most of the resources involved eventually find alternative employment. This is why the
principles and guidelines used by federal agencies for evaluating water projects do not allow
project applicants to count secondary benefits or costs (U.S. Water Resource Council, 1983). The
federal agencies assume that the labor and other resources which become unemployed as a result
of some change in irrigation (which is called a secondary effect) will eventually move on to
alternative employment and earn as much or more than they earned before the change in
8
irrigation. Statewide off-farm costs are indeed zero if the resources which are displaced when
irrigation is reduced could immediately find comparably productive alternative employment
within Nebraska. But unfortunately some resources are immobile, and in all cases it may take
some time before alternative employment can be secured. In addition, some of the resources
involved may shift to uses outside the community or to another state. When this happens there is
a long-term economic cost at the community and/or state level.
The multipliers described above can be used to estimate off-farm costs in the short-run,
which in this case is probably at least one year, but there is no widely accepted method of
determining how long these costs are likely to be sustained. Extensive research by the Economic
Research Service, USDA (Sullivan, et al., 2004) found that retiring irrigated land under the
Conservation Reserve Program (CRP) had little lasting effect. They found that:
“In the years immediately after land was enrolled in the CRP, job growth in
high-CRP counties was significantly lower than in comparable low-CRP
counties. However, job growth was indistinguishable over the longer term
(1985-2000).” (Sullivan et al., 2004).
Although not discussed in this study, sustained state level impacts from reductions in agriculture
would be even less likely.
Most economists contend that secondary benefits and costs should be ignored in
economic analyses because they are both transitory and difficult to estimate (Anderson and
Settle, 1977). We disagree. In an agricultural state such as Nebraska there is likely to be some
lasting effect, if only because some of the people and resources involved may need to leave the
state to find alternative employment. In this analysis we assume that off-farm costs at the state
level decrease linearly during the first 10 years from 100 percent of the multiplier effects
described above in year one to 15 percent in year 10, and then remain at 15 percent for the
indefinite future. The unknown actual costs may be lower than this because of faster resource
adjustments, but they are very unlikely to be higher.
Local Community Impacts
Community leaders are understandably concerned about the potential effect of irrigation
reductions on their communities, especially effects on employment, population and tax revenues.
Like off-farm costs, this issue is hard to address because of the dynamics of resource adjustment.
Will people who lose irrigation related jobs find others within the community, or move to
9
another community or another state? Will school enrollments decrease? Will public service costs
increase relative to the tax base? Empirical estimates of these potential consequences were not
developed for this analysis, but much can be learned from a cursory assessment of the downside
risk
We begin our assessment by reviewing what has happened in the Nebraska communities
which experienced rapid irrigation growth in the recent past. Our contention is that the effects of
decreased irrigation should be a mirror image of the effects from irrigation growth, assuming no
other significant changes to the economic base of the community. And fortunately we have a
great laboratory in the Republican Basin where the MRNRD and the LRNRD experienced
irrigation growth of about 150,000 acres, or 15 percent, from 1995 to 2004, with little change in
other factors affecting their economic base.
A plot of employment and irrigation growth in the Republican Basin for the 1995 to 2004
time period shows no discernible relationship (Figure 1). The fact that employment did not
noticeably increase as irrigation development occurred does not mean that irrigation had no
effect, however, because without irrigation development there may have been actual employment
declines. To address this possibility we compared the growth in Republican Basin employment
relative to employment in all other rural Nebraska counties for 1995 to 2005 (Table 1 and Figure
2). We found that the employment growth pattern in the Republican Basin during a period of
rapid irrigation growth was nearly exactly the same as the pattern for all other rural counties.
An analysis of the percentage changes in employment, population and sales tax revenues
from 1995 to 2005, for all non-metropolitan Nebraska counties leads to the same conclusion
regarding community impacts from irrigation (Figures 3, 4 and 5). No statistically significant
relationships were found between changes in irrigated acres and employment, population or sales
tax revenue, for the Republican Basin counties, the Platte Basin counties, or the remainder of
non-metropolitan Nebraska.
One should not conclude from this assessment that irrigation has had no impact on local
employment, population or sales taxes, because surely it has. What we can conclude, however, is
that the effects are so small, even during periods of rapid irrigation growth, that they cannot be
easily detected or observed. This also means that they are probably small enough to be ignored
when contemplating reductions in irrigation that are equal to or less than the growth we have
seen in the last 5 to10 years.
10
Property Tax Impacts
Another potential community impact that is of concern to policy makers is the potential
for adversely affecting the property tax base. The property tax base would decline if land values
declined as a result of irrigation restrictions (allocations), or if irrigated land is retired and taxed
as dryland.
The potential allocation levels being discussed will decrease economic returns to land but
over the long-term this effect will be small and less than general inflation, thus making it likely
that land values will continue to increase, rather than decrease, although the rate of increase is
likely to be slower than would otherwise occur. This expectation is supported by 25 years of
experience in the URNRD. Despite going from an initial allocation level of 22.5 inches in 1979
to 13.5 inches in 2005, land values have continued to increase, albeit more slowly than in other
parts of the state (Figure 6). Over the short- term (2 to 3 years), however, market psychology
may be more important than economics. If uncertainty and fear leads to pessimism, then some
decline in land values is certainly possible. This appears to have happened in Southwest
Nebraska in 2006, with gravity irrigated land values dropping by 1.8 percent in the Southwest
Crop Reporting District (CRD) and by 4.8 percent in the South CRD. Center pivot irrigated land
was down by 6.3 percent in the South CRD, but up by 5.1 percent in the Southwest CRD
(Johnson, 2006).
The impact of land retirement on the property tax base depends in part on how the
retirement is implemented. If the right to irrigate is sold in perpetuity, then the value of the
remaining land asset decreases to a dryland value and taxes are likely to be adjusted accordingly.
On the other hand, if the right to irrigate is leased as it has been under the EQUIP and CREP
programs, then the asset value probably hasn’t changed and land taxes will remain at the
irrigated level. Let us assume for purposes of illustration that enough land is retired to reduce CU
by 75,000 acre-feet in the Platte Basin (65,800 acres) and by 100,000 acre-feet in the Republican
Basin (117,600 acres), and that all of these acres are then taxed at dryland values. This would
reduce assessed values by $46 million in the Platte Basin, which is 0.4 percent of total valuation
in the Basin, and by $85 million in the Republican Basin, which is 2.0 percent of the total.6
6 Tax data is for 2005 and was compiled from Nebraska Department of Property Assessment and Taxation, http://pat.nol.org/researchReports/valuation/. The counties included in these calculations for the Platte Basin were Adams, Banner, Buffalo, Dawson, Garden, Gosper, Hall, Kearney, Keith, Lincoln, Morrill, Phelps and Scotts Bluff. The Republican counties were Chase, Dundy, Franklin, Frontier, Furnas, Harlan, Hayes, Hitchcock, Nucholls,
11
These amounts may be significant in an absolute sense, but the percentage decreases are too
small to materially disrupt the delivery of public services as long as the retirement program is not
concentrated in a small part of the basin.
Estimates of On-Farm Economic Costs
The on-farm economic costs of reducing consumptive use for irrigation were estimated
for two types of programs, land retirement and allocation. The on-farm cost of land retirement,
when expressed on an annual basis is equal to the difference in net income when using the land
for dryland production instead of irrigation. Three methodologies were used for determining this
cost: the land rental market, the land sales market and a computed value using Water Optimizer.
The results from each methodology were averaged to determine a best estimate.
The cost of retiring irrigated acres was found to average $74 per acre per year in the
Platte Basin and $82 per acre per year in the Republican Basin (Table 2). The corresponding
costs when expressed on the basis of a one-time purchase were $639 per acre in the Platte Basin
and $725 per acre in the Republican Basin. There are significant differences within each basin,
however, with the Platte ranging from $810 in the eastern part of the critical habitat area to $547
above Lake McConaughy. Cost for the Republican Basin varied by much less, but again they
were lowest in the far west. The basin average was lower in the Platte than in the Republican
primarily because the averages were weighted by the number of impacted acres in each reach,
and a high proportion of the Platte acres are above McConaughy where retirement costs are
relatively low.
The estimated per acre costs of retiring irrigated land were converted to a cost per acre-
foot change in CU by dividing through by an estimate of CU per acre (Table 2). Expressed on
this basis the costs were $69 per acre-foot of reduced consumptive use in the Platte Basin and
$98 per acre-foot in the Republican Basin. Again, the Platte Basin average is relatively low
because of the dominating effect of land above McConaughy where CU per acre is the higher
than anywhere else in either basin.
The on-farm economic cost of using allocation to reduce consumptive use is equal to the
difference in annual income that results from applying less water. These costs were estimated for
Perkins, Red Willow and Webster. Calculations assume retirement of 97,939 acres in the Platte Basin and 117,647 acres in the Republican Basin and that retired irrigated land will be taxed at dryland value. Land values taken from Johnson, B., Nebraska Farm Real Estate Market Developments, 2005-2006. http://agecon.unl.edu/realestate/re2006.pdf.
12
a representative county in each reach using Water Optimizer, which computes the difference in
net returns when each water supply level is used optimally. In this case the cost per acre-foot
change in CU depends on how much the water supply (allocation) has to change to produce the
desired effect, which in turn depends upon how many acres are regulated and on how much
reduction in CU is needed. For this analysis we assumed a 75,000 acre-foot reduction in the
Platte Basin proportionately distributed across all acres within the 28/40 zone and west of Elm
Creek, and a 100,000 acre-foot reduction in the Republican Basin proportionately distributed
across the certified acres in each NRD (Table 3). Achieving these reductions would reduce net
returns by an average of $104 per acre-foot of CU reduction in the Platte Basin and by $155 per
acre-foot in the Republican Basin. Reducing CU by allocation is more costly at the farm level
than retiring acres, because there is no change in taxes and less opportunity to reduce capital
costs.
When the on-farm cost of reducing CU by allocation is expressed on a per affected acre
basis, instead of a per acre-foot of CU basis, the results look quite different. Costs per affected
acre were estimated for this case to average only $9 in the Platte Basin and $14 in the Republican
Basin (Table 3). Costs per affected acre are low because they are spread across the entire land
area and because the last units of water applied to an acre of land do not add much to net
economic returns.7
It should be noted that if the required reductions in CU from irrigation were higher than
the values used for these calculations, or if the same level of total reduction was achieved by
regulating fewer acres, then the on-farm costs could be much different. For example, it was
estimated that if only one-third as many acres were regulated to achieve the same level of total
reduction, then the cost per acre-foot change in CU would be about the same, but the cost per
affected acre would triple.
Estimates of Off-Farm Economic Costs
Off-farm economic costs were also estimated for both land retirement and allocation. To
consider off-farm costs, however, one must also consider the length of the program, because off-
7 As more and more water is applied to a crop, the increase in grain yield per unit of water applied gradually diminishes to zero because at some point more water does not add to crop yields. As the increase in yield per unit of water applied decreases, the net economic gain from applying the water also decreases. Hence, net economic returns do not change much as a result of applying less water under allocation programs that reduce the amount of water applied by about 20 percent or less. Very low allocations, however, will have a cost per affected acre that is similar to the cost of land retirement.
13
farm impacts are transitory, as noted earlier. Although most CU reduction needs are probably
long-term, there may be a need for policy officials to consider shorter term programs as well.
Hence, off-farm costs were considered for programs of 10, 25 and 50 years.
The off-farm costs of land retirement were estimated at $203 per acre per year for the
Platte Basin in the short-run (first year), decreasing to an average of $132, $71 and $56 per acre
per year for programs that continue for 10, 25 and 50 years, respectively (Table 4). The
corresponding costs for the Republican Basin were somewhat lower at $164 for the first year,
then averaging $107, $58 and $41 per acre per year for 10, 25 and 50 year programs. Average
off-farm statewide costs for land retirements, when expressed on a per acre basis, are lower in
the Republican Basin, because there is less difference between irrigated and dryland agricultural
output, compared to the average for the Platte Basin west of Elm Creek. However, when off-farm
costs are expressed in terms of dollars per acre-foot change in CU they are very similar for both
basins, because average CU per acre is lower in the Republican Basin. First year off-farm land
retirement costs were estimated for both basins at approximately $185 per acre-foot of CU
reduction, decreasing to an average of $120, $65 and $46 per year, per acre-foot of CU, for
programs of 10, 25 and 50 years, respectively (Table 4).
The off-farm costs of reducing CU with allocation when compared to land retirement
were 27 percent lower in the Platte Basin and 9 percent lower in the Republican Basin (Table 5).
Off-farm effects from allocation are lower than for land retirement, for the same total change in
CU, because there is less reduction in irrigation input costs. Off-farm costs from allocation in the
Republican Basin are a little higher than in the Platte because the amount of water applied is
already regulated in the Republican Basin. Current allocation levels were used as the baseline for
the Republican Basin, whereas an estimate of current uncontrolled pumping was the baseline
used for the Platte Basin. Off-farm costs from allocation, expressed as a cost per unit change in
CU, increase as the allocation level decreases.
Estimates of Total Economic Costs
The total economic cost, on-farm and off-farm, of a long-term program (50 years or
more) that would reduce CU by 100 kaf in the Republican Basin and by 75 kaf in the Platte
Basin was estimated at $23.2 million per year using land retirement and $31.4 million using
allocation (Table 7). Estimated total economic costs, per acre-foot change in CU, were about 20
percent higher in the Platte Basin than in the Republican Basin under a land retirement approach,
14
and about 30 percent higher if allocation was used (Table 6). A long-term 50 year land
retirement program for the Platte was estimated to cost $114 per acre-foot compared to $147 for
the Republican. A comparable allocation program was estimated to cost $143 in the Platte and
$207 in the Republican.
Cost of Reducing Depletions to the River Compared to Depletions to the Basin
Our discussion of costs to this point has been entirely in terms of reduction in
consumptive use, which is equivalent to reduced depletions to the basin. However, in the Platte
Basin the central issue is depletions to the river rather than depletions to the basin, and to a lesser
extent this is also the case in the Republican Basin. It will cost more per unit to reduce depletions
to the river because not all of the reduction in CU will show up as a reduced depletion at the river
in the relevant time frame. To examine the sensitivity of the results to this issue we computed
the cost of reducing depletions to the river when land that is located from one to five miles from
the river is retired. This was done using the well known Jenkins Equation, as described in Table
5 and on Figure 6.
The total economic cost of reducing depletions to the river using land retirement was
found to be substantially cheaper if the retired land was located close to the river, especially if
the need was for a short-term program. A 10 year program in the Platte Basin, for example,
would cost over $20,000 per acre-foot if the reduced pumping occurred five miles from the river,
which corresponded for this calculation to the 28/40 line, compared to $367 for land located one
mile from the river (Table 8). Location was found to be much less important for a 50 year
program, but still varied from $155 for land one mile from river to $702 per acre-foot for land 5
miles away. Illustrative results for the Republican Basin were similar, assuming no difference in
average transmissivity or the aquifer storage coefficient.
These calculations illustrate that when the policy concern is depletions to stream flow it is
very important to consider where irrigation should be reduced to provide for reduced depletions
at least cost. However, the actual significance of proximity to the river in both basins may be
quite different than what was calculated here using the Jenkins Equation with assumed
parameters. Groundwater models are needed to more closely examine this issue.
Estimated State Budget Costs under Alternative Policy Approaches
State budget costs were defined as the amount of money it would take to implement a
variety of approaches to reducing consumptive use. All estimates are for programs which would
15
reduce consumptive use for irrigation by 75,000 acre-feet in the Platte Basin and by 100,000
acre-feet in the Republican Basin.8 Estimates are provided for the annual cost of the programs
and for the full up-front costs. The up-front costs represent what it would cost if all required
funds were appropriated in the first year of the program. Estimates are also provided for the unit
cost of reducing depletions to the basin and to the river. All CU is assumed to be a depletion to
the basin, but how much of the change in CU actually shows up as a change in depletions to the
river depends on where the reduced depletions occur (proximity to the river and on the relevant
time frame. For illustrative purposes costs were calculated for time frames of 10, 25 and 50
years, with corresponding depletions to the river equal to 2.2, 9.8 and 36.0 percent of the
changes in CU which occur during each time period.
The estimated annualized state budget costs for reducing CU in the Platte Basin by 75 kaf
ranged from $3.2 million ($103/AF reduction in CU) for a land retirement, water right purchase
program, with compensation equal to market value, to 7.7 million ($42/AF reduction in CU) for
a voluntary water right leasing program (Table 9). Total up-front costs depend on the planned
program length. A very long-term 50 year program would have total up-front costs ranging from
$45.5 million for a water right purchase with market value compensation to $110.7 million using
a voluntary water right leasing approach.
Estimated costs for a Republican Basin program are slightly higher per unit change in
consumptive use, but the cost differences by policy option follow a similar pattern. The only
significant difference is that further use of allocation in the Republican Basin to achieve
additional reductions in CU would be relatively more expensive compared to land retirement.
This is because one is starting from a baseline which already includes allocation limits.
Although allocation would not be the least cost method of reducing consumptive use, it
may still be an attractive policy option. Using allocation to reduce CU by 75 kaf in the Platte
Basin, for example, would have a budget cost of $7.8 million per year if producers are
compensated in full and $ 3.9 million with 50 percent compensation (compared to $3.2 million
for a land retirement purchase approach with market value compensation). With allocation any
uncompensated costs are spread across all irrigators in the impact area, whereas with land
8 The 75 kaf for the Platte is based on the amount of irrigation development which occurred in the basin from 1997 to 2005 and is a rough approximation of the reduction which may be required under the terms of the Cooperative Agreement. The 100 kaf estimate is simply an illustrative value for the Republican and may be significantly more or less than what is ultimately required given uncertain weather and future groundwater modeling results.
16
retirement uncompensated costs accrue only to those whose land is retired. As a result, policy
makers may find it acceptable to implement an allocation approach with only partial producer
compensation, in contrast to land retirement which may require compensation in excess of actual
producer losses, especially if a willing buyer and willing seller approach is used. Another
advantage of allocation is that it is administratively simpler than land retirement, especially if
land retirement is involuntary.
The total state budget costs associated with reducing consumptive use by the required
amounts in both the Platte and Republican Basins depends primarily on the type of program
which the state chooses to use to achieve the desired results. If the state chooses to use a
voluntary leasing approach, the combined costs for long-term 50 year programs could be as
much as $486 million, $166 million for the Platte program and $320 million for the Republican
program. On an amortized annual basis these costs are equivalent to $22.6 million per year, $7.7
million for the Platte and $14.9 million for the Republican. However, if a land retirement water
right purchase approach with compensation equal to actual losses is used, then total costs for
both basins for a long-term program could be as little as $110 million, consisting of $45 million
for the Platte and $65 million for the Republican. The equivalent amortized annual costs are $7.7
million total, $3.2 million for the Platte and $4.5 million for the Republican. Of course, these
estimates would change proportionately if it turns out that the required reductions in
consumptive use are more or less than the estimates used in this analysis.
17
Figures and Tables
Figure 1. Annual Employment and Cumulative Irrigated Acres, 1995 to 2005, Middle and Lower Republican NRD’s.
Figure 2. Employment in the Lower and Middle Republican NRD’s Compared To Employment in all other Rural Counties. Figure 3. Relationship between Growth in Irrigated Acres and Employment, 1995-2005. Figure 4. Relationship between Growth in Irrigated Acres and Sales Taxes, 1995-2005. Figure 5. Relationship between Growth in Irrigated Acres and Population Growth,
1995-2005. Figure 6. Irrigated Land Value Trends. Figure 7. Cumulative Depletions to River as a Function of Time and Distance. Table 1. Changes in Irrigated Acres, Employment, Sales Taxes and Population,
1995-2005.
Table 2. On-Farm Economic Cost of Retiring Irrigated Acres Table 3. On-farm Economic Cost of Using Allocation to Reduce Consumptive Use Table 4. Off-Farm Statewide Economic Cost of Retiring Irrigated Acres Table 5. Off-farm Economic Cost of Using Allocations to Reduce Consumptive Use Table 6. Combined On and Off-Farm Economic Cost of Reducing Consumptive Use
(Depletions to Basin) Table 7. Total Economic Cost of Reducing Consumptive Use: Acreage Retirement vs.
Allocation Tabl 8. Total Economic Cost of Retiring Irrigated Acres, per Acre-Foot of Depletion to
River Table 9. State Budget Costs Under Alternative Policies, Excluding Administrative Costs
18
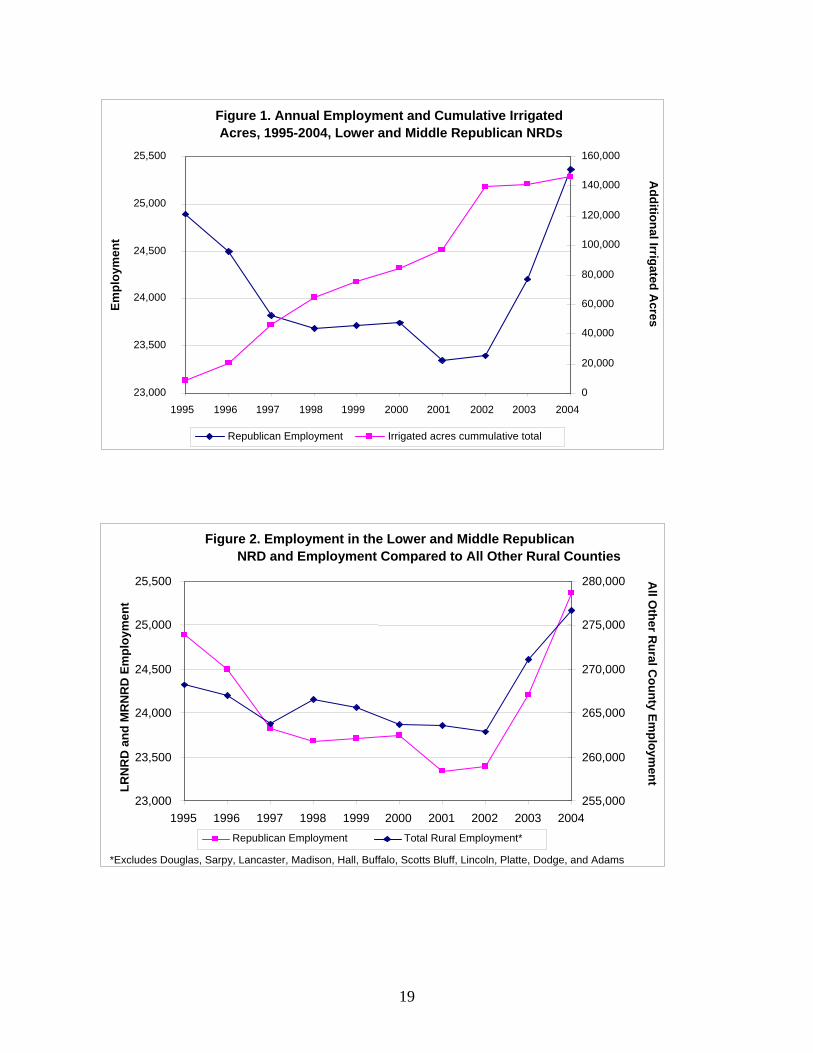
Figure 1. Annual Employment and Cumulative Irrigated Acres, 1995-2004, Lower and Middle Republican NRDs
23,000
23,500
24,000
24,500
25,000
25,500
1995 1996 1997 1998 1999 2000 2001 2002 2003 2004
Empl
oym
ent
0
20,000
40,000
60,000
80,000
100,000
120,000
140,000
160,000 A
dditional Irrigated Acres
Republican Employment Irrigated acres cummulative total
Figure 2. Employment in the Lower and Middle Republican NRD and Employment Compared to All Other Rural Counties
23,000
23,500
24,000
24,500
25,000
25,500
1995 1996 1997 1998 1999 2000 2001 2002 2003 2004
LRN
RD
and
MR
NR
D E
mpl
oym
ent
255,000
260,000
265,000
270,000
275,000
280,000 All O
ther Rural C
ounty Employm
ent
Republican Employment Total Rural Employment*
*Excludes Douglas, Sarpy, Lancaster, Madison, Hall, Buffalo, Scotts Bluff, Lincoln, Platte, Dodge, and Adams
19

Figure 3. Relationship between Growth in Irrigated Acres And Employment, 1995 - 2005
-15
-10
-5
0
5
10
15
20
25
30
0 10 20 30 40 50 60 70
Perc
ent C
hang
e in
Em
ploy
men
t
No Statistically significant correlation between irrigation development and employment change.
Percent Change in Irrigated Acres
Linear (Platte)Linear (Republican)Linear (Rest of NE)
PlatteRepublicanRest of NE
Figure 4. Relationship between Growth in Irrigated Acresand Sales Taxes, 1995 - 2005
0 10 20 30 40 50 60 70 80 90
100
0 10 20 30 40 50 60 70 80 90 Percent Change in Irrigated Acres
Perc
ent C
hang
e in
Sal
es T
ax
Rest of NE Republican Platte
Linear (Rest of NE) Linear (Republican) Linear (Platte)
No statistically significant correlation between irrigation development and sales tax.
Saunders County
20
Figure 5. Relationship between Growth in Irrigated Acres and Population Growth, 1995 - 2005
-15
-10
-5
0
5
10
15
0 10 20 30 40 50 60 70 80 90
Percent Change in Irrigated Acres
Perc
ent C
hang
e in
Pop
ulat
ion
Gro
wth
Rest of NE Republican PlatteLinear (Rest of NE) Linear (Republican) Linear (Platte)
No statistically significant correlation between irrigation development and population change.
Saunders County
0
500
1000
1500
2000
2500
1978 1980 1982 1984 1986 1988 1990 1992 1994 1996 1998 2000 2002 2004
$ pe
r Acr
e
Southwest Nebraska State Average
Figure 6. Irrigated Land Value Trends
21

Figure 7. Depletions to River as a Function of Depletion to Basin, Time and Distance
0.010.020.030.040.050.060.070.080.090.0
1 8 15 22 29 36 43 50 57 64 71 78 85 92 99
Years
Dep
letio
ns, %
of P
umpe
d
1 Mile2 Mile3 Mile4 Mile5 Mile
22
Table 1. Changes in Irrigated Acres, Employment, Sales Taxes and Population, 1995-2005 Percent Change 1995-2005 Irrigated Acres Employment Sales Tax Population Republican 17.6 1.9 24.7 -8.9 Platte 10.7 4.4 39.7 3.7 Rest of Nebraska* 15.3 1.9 35.2 -1.8 * Does not include urban counties (Douglas, Sarpy, Lancaster, Madison, Hall, Buffalo, Scotts Bluff, Lincoln, Platte, Dodge and Adams) and counties in the Platte or Republican Basins.
Table 2. On-Farm Economic Cost of Retiring Irrigated Acres
Representative Counties
Calculated Cost
$/Acre/Yr
Cash Rent Market
$/Acre/Yr
Land Market $/Acre
Best Estimate
$/Acre/Yr Cu
Inches/Acre
$/AF of Depletion to Basin
Morrill $65 $76 $547 $70 15.4 $55 Lincoln $73 $80 $719 $76 12.8 $71 Phelps $98 $75 $810 $86 8.8 $118 Platte Wtd. Avg. $72 $77 $639 $74 13.7 $69 Chase $78 $80 $719 $79 10.4 $91 Red Willow $94 $80 $719 $87 11.8 $88 Franklin $80 $83 $739 $81 8.4 $116 Repub. Wtd. Avg. $83 $80 $725 $82 10.2 $98 Notes: 1. Cash rent and land market values are from the 2006 land market survey by Bruce Johnson, averaged for center pivot and gravity irrigated land. 2. Republican Basin calculations based on irrigation returns given current allocation levels. 3. Basin averages are weighted by the number of acres in each reach. For the Platte Basin, Morrill represents the reach above McConaughy, Lincoln represents the area from McConaughy to Lexington, and Phelps represents the area from Lexington to Elm Creek. For the Republican Basin, Chase represents the URNRD, Red Willow the MRNRD and Franklin the LRNRD.
23
24
Table 3. On-farm Economic Cost of Using Allocation to Reduce Consumptive Use Cost of CU Reduction
Sub-Basins Required CU
Reduction Regulated
Acres
Base Allocation (Inches)
New Allocation (Inches)
$/AF of CU Total Cost
$/Affected Acre
Above Kingsley 40,085.724 424,906 25.1 22.4 $66 $2,645,658 $6 Kingsley to Lexington 24,720.627 262,037 18.6 15.7 $132 $3,263,123 $13 Lexington to HW 183 10,194 $108,052 15 13 $188 $1,916,406 $18 Platte Basin 75,000 $794,995 $104 $7,825,187 $9 URNRD 41,140 $448,717 14 12 $121 $4,977,896 $11 MRNRD 28,605 $312,000 13 11 $163 $4,662,621 $15 LRNRD 30,255 $330,000 11 9 $195 $5,899,789 $18 Republican Basin 100,000 $1,090,717 $155 $15, 540,306 $14 Notes: 1. If the allocation program focused on part of the acres, such as those nearest the river, on-farm costs per AF of CU would change very little, but cost per regulated acre would increase nearly proportionately, e.g., if the same amount of CU was reduced by regulating 1/3 as many acres then cost per regulated acre would increase three-fold.
Table 4. Off-Farm Statewide Economic Cost of Retiring Irrigated Acres
Off-farm Costs Based on Estimated Changes in Crop Revenue Representative Crop Revenue In Short Run In Long Run Counties Dryland Irrigated Difference 10 Years 25 Years 50 Years
$/Acre/Yr $/Acre/Yr $/Acre/Yr $/AF
CU/Yr $/Acre/Yr $/AF
Depletion $/Acre/Yr $/AF
Depletion $/Acre/Yr $/AF
Depletion $/Acre/Yr $/AF
Depletion to Basin to Basin to Basin to Basin Morrill $106 $437 $331 $257 $223 $174 $145 $113 $78 $61 $56 $43 Lincoln $208 $473 $265 $248 $195 $182 $127 $118 $68 $64 $49 $45 Phelps $285 $455 $169 $232 $144 $197 $94 $128 $50 $69 $36 $49 Platte Avg. $164 $451 $287 $251 $203 $180 $132 $117 $71 $63 $51 $45 Chase $151 $417 $266 $271 $188 $192 $122 $125 $66 $67 $47 $48 Red Willow $219 $427 $208 $298 $160 $229 $104 $149 $56 $80 $40 $57 Franklin $278 $438 $160 $188 $137 $161 $89 $105 $48 $56 $34 $40 Repub. Avg. $209 $426 $217 $254 $164 $193 $107 $125 $58 $68 $41 $48
Notes: 1. Short run values assume that all of the resources which are displaced because of reduced irrigation remain unemployed, which is probably true during the initial year of the program. Long-term values represent an annual average for next 25 years. This estimate assumes that 85 percent of the displaced resources find alternative employment in the state during the next 10 years (linear adjustment), but that the lost productivity from the remaining 15 percent continues indefinitely. 3. Basin averages are weighted by the number of acres in each reach. For the Platte Basin, Morrill represents the reach above McConaughy, Lincoln represents the area from McConaughy to Lexington and Phelps represents the area from Lexington to Elm Creek. For the Republican Basin, Chase represents the URNRD, Red Willow the MRNRD and Franklin the LRNRD.
25
Table 5. Off-farm Economic Cost of Using Allocations to Reduce Consumptive Use Long Run Costs
Required
CU Reduction Regulated
Acres
Reduced Ag Output
$/Acre
Short Run Cost
50 Year 10 Year $/AF CU
25 Year $/AF CU $/AF CU
$/AF CU
Above Kingsley 40,086 424,906 $26 $131 $56 $42 $38 Kingsley to Lexington 24,721 262,037 $28 $137 $58 $44 $40 Lexington to HW 183 10,194 108,052 $24 $117 $50 $38 $34 Platte Basin 75,000 794,995 $27 $131 $56 $42 $38 URNRD 41,140 448,717 $27 $139 $59 $45 $41 MRNRD 28,605 312,000 $41 $208 $88 $67 $61 LRNRD 30,255 330,000 $38 $196 $83 $63 $57 Republican Basin 100,000 1,090,717 $35 $176 $75 $56 $52 Note: 1. Off-farm costs for the short-run were calculated using a multiplier derived from Lamphear (2005), as follows: Lamphear’s estimate of Primary Payments to HH (on crop farm) was 0.162 per dollar change in irrigated output. This value was increased to 0.33 to represent impacts due to allocation. Subtracting 0.33 from .796 equals 0.466 which is an estimate of the off-farm costs under allocation. 2. Short-term values assume that all of the resources which are displaced because of reduced irrigation remain unemployed, which is probably true during the initial year of the program. Long-term values represent the expected annual average.. This estimate assumes that 85 percent of the displaced resources find alternative employment in the state during the next 10 years (linear adjustment), but that the productivity from the remaining 15 percent is lost to the state indefinitely.
26
27
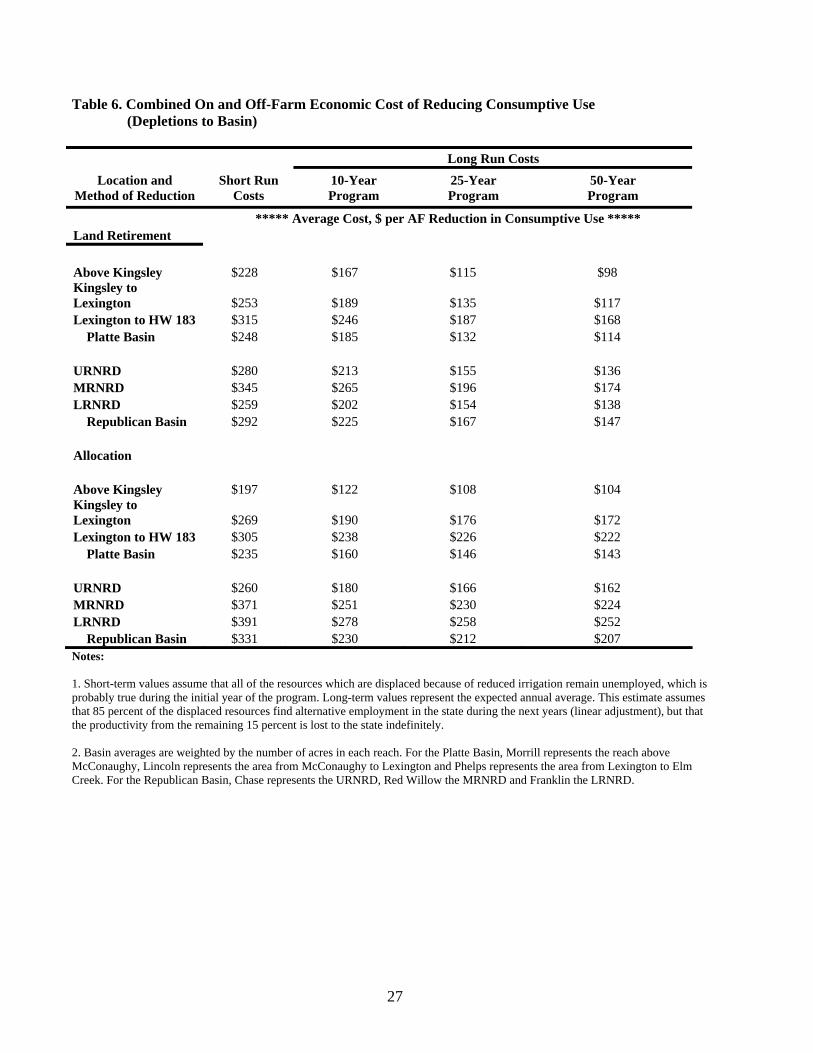
Table 6. Combined On and Off-Farm Economic Cost of Reducing Consumptive Use (Depletions to Basin)
Long Run Costs
Location and Method of Reduction
Short Run Costs
10-Year Program
25-Year Program
50-Year Program
***** Average Cost, $ per AF Reduction in Consumptive Use ***** Land Retirement Above Kingsley $228 $167 $115 $98 Kingsley to Lexington $253 $189 $135 $117 Lexington to HW 183 $315 $246 $187 $168 Platte Basin $248 $185 $132 $114 URNRD $280 $213 $155 $136 MRNRD $345 $265 $196 $174 LRNRD $259 $202 $154 $138 Republican Basin $292 $225 $167 $147 Allocation Above Kingsley $197 $122 $108 $104 Kingsley to Lexington $269 $190 $176 $172 Lexington to HW 183 $305 $238 $226 $222 Platte Basin $235 $160 $146 $143 URNRD $260 $180 $166 $162 MRNRD $371 $251 $230 $224 LRNRD $391 $278 $258 $252 Republican Basin $331 $230 $212 $207 Notes: 1. Short-term values assume that all of the resources which are displaced because of reduced irrigation remain unemployed, which is probably true during the initial year of the program. Long-term values represent the expected annual average. This estimate assumes that 85 percent of the displaced resources find alternative employment in the state during the next years (linear adjustment), but that the productivity from the remaining 15 percent is lost to the state indefinitely. 2. Basin averages are weighted by the number of acres in each reach. For the Platte Basin, Morrill represents the reach above McConaughy, Lincoln represents the area from McConaughy to Lexington and Phelps represents the area from Lexington to Elm Creek. For the Republican Basin, Chase represents the URNRD, Red Willow the MRNRD and Franklin the LRNRD.
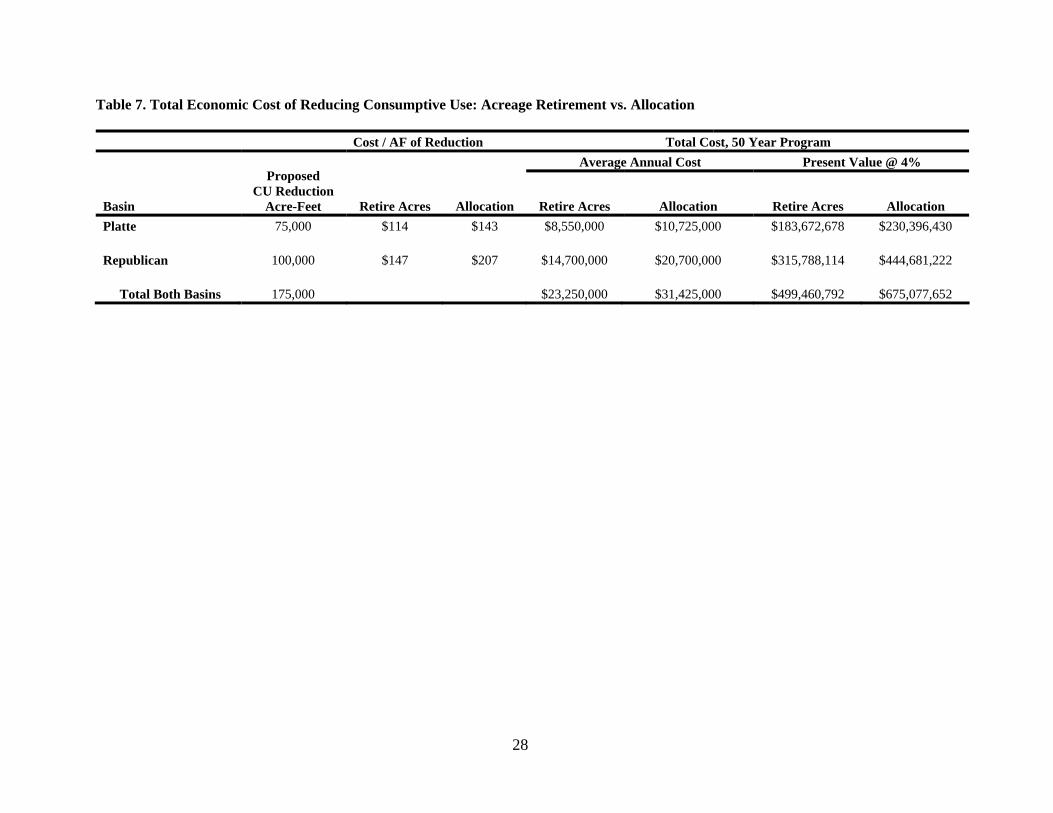
Table 7. Total Economic Cost of Reducing Consumptive Use: Acreage Retirement vs. Allocation Cost / AF of Reduction Total Cost, 50 Year Program Average Annual Cost Present Value @ 4%
Basin
Proposed
CU Reduction Acre-Feet Retire Acres Allocation Retire Acres Allocation Retire Acres Allocation
Platte 75,000 $114 $143 $8,550,000 $10,725,000 $183,672,678 $230,396,430 Republican 100,000 $147 $207 $14,700,000 $20,700,000 $315,788,114 $444,681,222 Total Both Basins 175,000 $23,250,000 $31,425,000 $499,460,792 $675,077,652
28
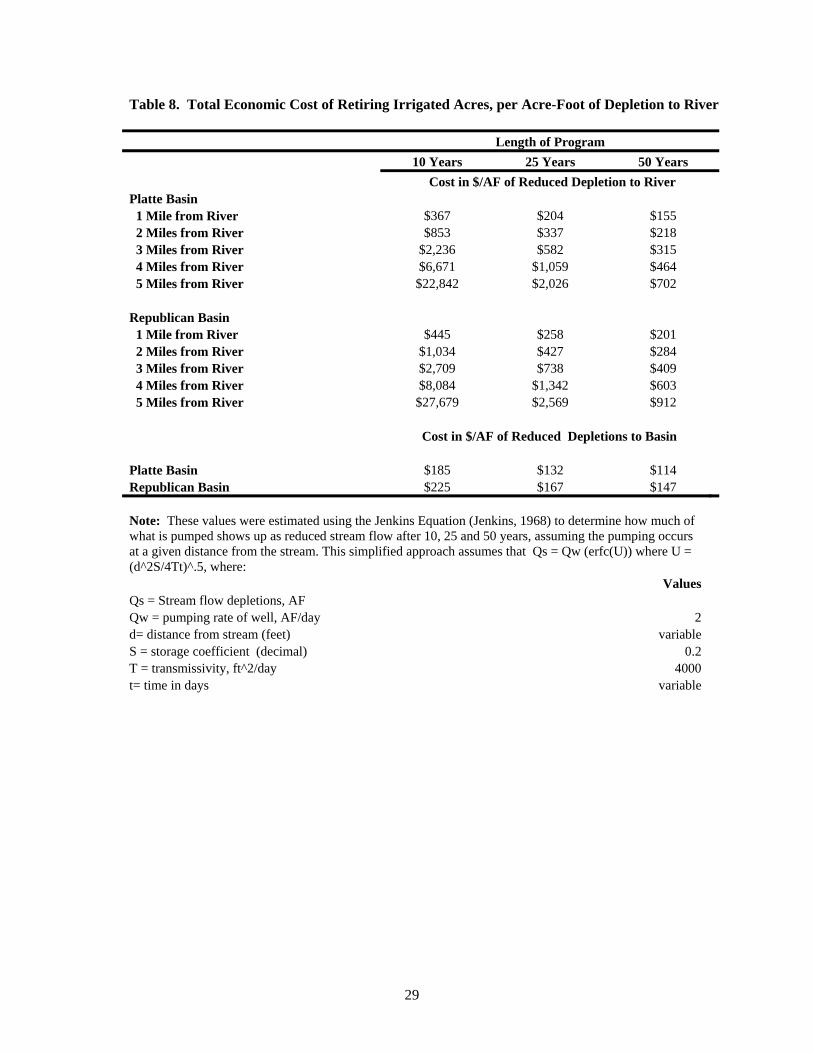
Table 8. Total Economic Cost of Retiring Irrigated Acres, per Acre-Foot of Depletion to River Length of Program 10 Years 25 Years 50 Years
Cost in $/AF of Reduced Depletion to River Platte Basin 1 Mile from River $367 $204 $155 2 Miles from River $853 $337 $218 3 Miles from River $2,236 $582 $315 4 Miles from River $6,671 $1,059 $464 5 Miles from River $22,842 $2,026 $702 Republican Basin 1 Mile from River $445 $258 $201 2 Miles from River $1,034 $427 $284 3 Miles from River $2,709 $738 $409 4 Miles from River $8,084 $1,342 $603 5 Miles from River $27,679 $2,569 $912 Cost in $/AF of Reduced Depletions to Basin Platte Basin $185 $132 $114 Republican Basin $225 $167 $147 Note: These values were estimated using the Jenkins Equation (Jenkins, 1968) to determine how much of what is pumped shows up as reduced stream flow after 10, 25 and 50 years, assuming the pumping occurs at a given distance from the stream. This simplified approach assumes that Qs = Qw (erfc(U)) where U = (d^2S/4Tt)^.5, where:
Values Qs = Stream flow depletions, AF Qw = pumping rate of well, AF/day 2 d= distance from stream (feet) variable S = storage coefficient (decimal) 0.2 T = transmissivity, ft^2/day 4000 t= time in days variable
29
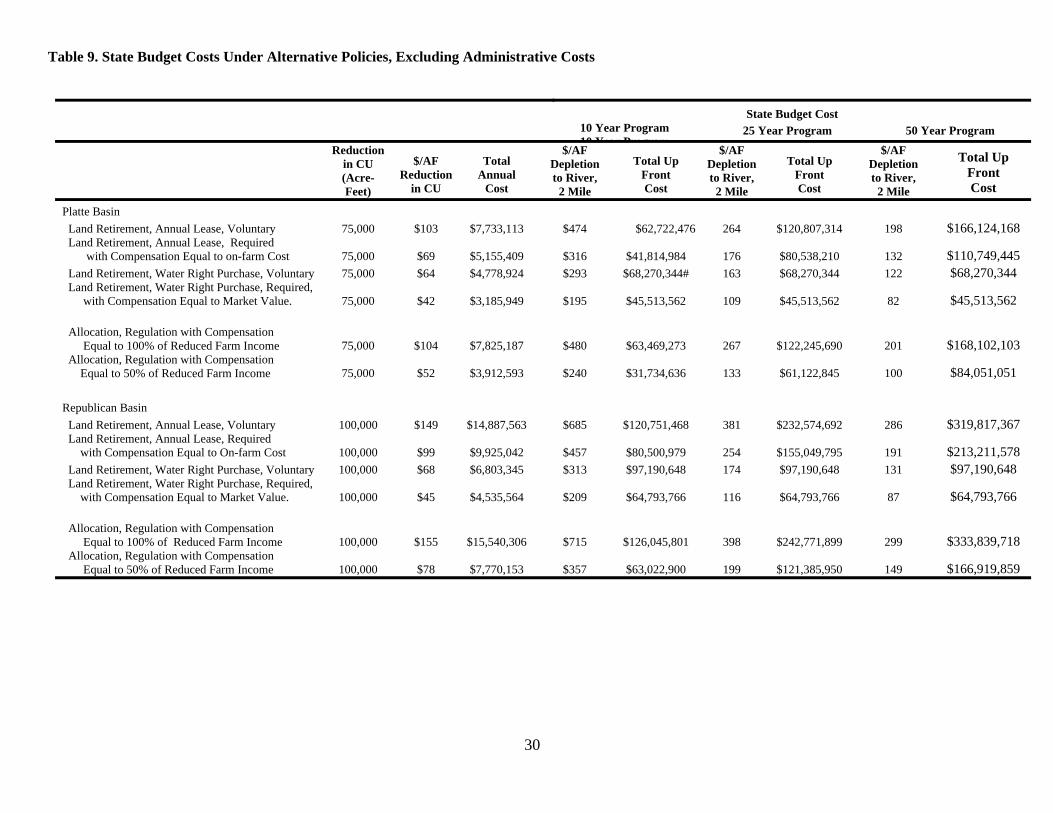
Table 9. State Budget Costs Under Alternative Policies, Excluding Administrative Costs
State Budget Cost
10 Year Program 10 Year Program
25 Year Program 50 Year Program
Reduction in CU (Acre-Feet)
$/AF Reduction
in CU
Total Annual
Cost
$/AF Depletion to River,
2 Mile
Total Up Front Cost
$/AF Depletion to River,
2 Mile
Total Up Front Cost
$/AF Depletion to River,
2 Mile
Total Up Front Cost
Platte Basin Land Retirement, Annual Lease, Voluntary 75,000 $103 $7,733,113 $474 $62,722,476 264 $120,807,314 198 $166,124,168 Land Retirement, Annual Lease, Required with Compensation Equal to on-farm Cost 75,000 $69 $5,155,409 $316 $41,814,984 176 $80,538,210 132 $110,749,445 Land Retirement, Water Right Purchase, Voluntary 75,000 $64 $4,778,924 $293 $68,270,344# 163 $68,270,344 122 $68,270,344 Land Retirement, Water Right Purchase, Required, with Compensation Equal to Market Value. 75,000 $42 $3,185,949 $195 $45,513,562 109 $45,513,562 82 $45,513,562 Allocation, Regulation with Compensation Equal to 100% of Reduced Farm Income 75,000 $104 $7,825,187 $480 $63,469,273 267 $122,245,690 201 $168,102,103 Allocation, Regulation with Compensation Equal to 50% of Reduced Farm Income 75,000 $52 $3,912,593 $240 $31,734,636 133 $61,122,845 100 $84,051,051 Republican Basin Land Retirement, Annual Lease, Voluntary 100,000 $149 $14,887,563 $685 $120,751,468 381 $232,574,692 286 $319,817,367 Land Retirement, Annual Lease, Required with Compensation Equal to On-farm Cost 100,000 $99 $9,925,042 $457 $80,500,979 254 $155,049,795 191 $213,211,578 Land Retirement, Water Right Purchase, Voluntary 100,000 $68 $6,803,345 $313 $97,190,648 174 $97,190,648 131 $97,190,648 Land Retirement, Water Right Purchase, Required, with Compensation Equal to Market Value. 100,000 $45 $4,535,564 $209 $64,793,766 116 $64,793,766 87 $64,793,766 Allocation, Regulation with Compensation Equal to 100% of Reduced Farm Income 100,000 $155 $15,540,306 $715 $126,045,801 398 $242,771,899 299 $333,839,718 Allocation, Regulation with Compensation Equal to 50% of Reduced Farm Income 100,000 $78 $7,770,153 $357 $63,022,900 199 $121,385,950 149 $166,919,859
30
References Anderson, Lee G. and Settle, Russell F. 1977. “Benefit-Cost Analysis: A Practical Guide” D.C.
Heath and Company. Bureau of Economic Analysis. 2006. “Regional Economic Accounts.” Taken from
http://www.bea.gov/bea/regional/reis/default.cfm#a. Last accessed July 12, 2006. Johnson, Bruce. 2006. “Nebraska Farm Real Estate Market Developments 2005-2006.”
University of Nebraska-Lincoln Extension EC 06-809-S. Lamphear, Charles. 2005. “Economic Importance of Irrigated Agriculture, 2003.” Nebraska
Policy Institute, Lincoln, NE. Nebraska Department of Economic Development, 2006. “Net Taxable Sales and State Sales Tax
Collections.” http://info.neded.org/stathand/lsect8b.htm, http://info.neded.org/stathand/lsect8a.htm. Last accessed July 13, 2006.
Nebraska Department of Economic Development. 2006. “Time Series of Nebraska Intercensal
Population Estimates by County.” http://info.neded.org/intercen.htm, http://info.neded.org/stathand/bsect4b.htm. Last accessed July 13, 2006.
Nebraska Department of Labor. 2006. “Nebraska Civilian Labor Force Statistics.”
http://www.dol.state.ne.us/nstars/webnstars/frame_it.asp?theProductName=WebNSTARS. Last accessed Aug. 3, 2006.
Nebraska Department of Property Assessment and Taxation. 2006. “1997-2005 Counties Value
& Taxes, by Subdivision & Property Type.” http://pat.nol.org/researchReports/valuation/. Last accessed Aug. 3, 2006.
Nebraska Department of Property Assessment & Taxation. 2006. 1997 Abstracts & 2006
Abstractsas of April 10, 2006, Information prepared by E.Thompson, rev 5-23-06 per request of Omaha World Herald newspaper.
Sullivan, Patrick, D. Hellerstein, L. Hansen, R. Johansson, S. Koenig, R. Lubowski, W.
McBride, D. McGranahan, M. Roberts, S. Vogel and S. Bucholtz. 2004. “The Conservation Reserve Program, Economic Implications for Rural America.” USDA, ERS, Report No. 834.
U.S. Water Resources Council, 1983. “Economic and Environmental Principles and Guidelines
for Water and Related Land Resources Implementation Studies.” Water Optimizer. http://real.unl.edu/h20/. Last accessed on Aug. 1, 2006.
31