Embed Size (px)
Citation preview
Economic Developments in 2008
23
Economic Developments in 2008
1
Impact of Developments in Commodity Prices
Commodity prices were characterised by exceptional volatilities in 2008, with prices moving in large magnitudes on the upswing and downswing within the short period of a year. Commodity prices increased sharply in the fi rst half of the year due in part to the strong underlying demand and the expectations of stronger demand from the large emerging economies and also due to the increase in demand from funds as commodities became a new investment asset class. In addition, food prices were also driven by the increasing use of food crops for the production of alternative fuels and production shortfalls due to adverse weather conditions. Prices of several commodities reached all time highs. However, as the global fi nancial turmoil intensifi ed in the second half of the year, the large unwinding of long positions by funds and the pull back of fi nancing by fi nancial institutions caused commodity prices to correct sharply, with prices of several commodities declining signifi cantly from their peaks in the fi rst half of 2008. As the year progressed, the decline in demand also contributed to the softening in prices of commodities.
1 BNM Commodity Price Index is an export-weighted index (2000 = 100) of prices of major Malaysia’s export commodities, namely palm oil, palm kernel oil, crude oil, natural gas, saw logs, sawn timber, cocoa, rubber and tin.
Economic Developments in 2008
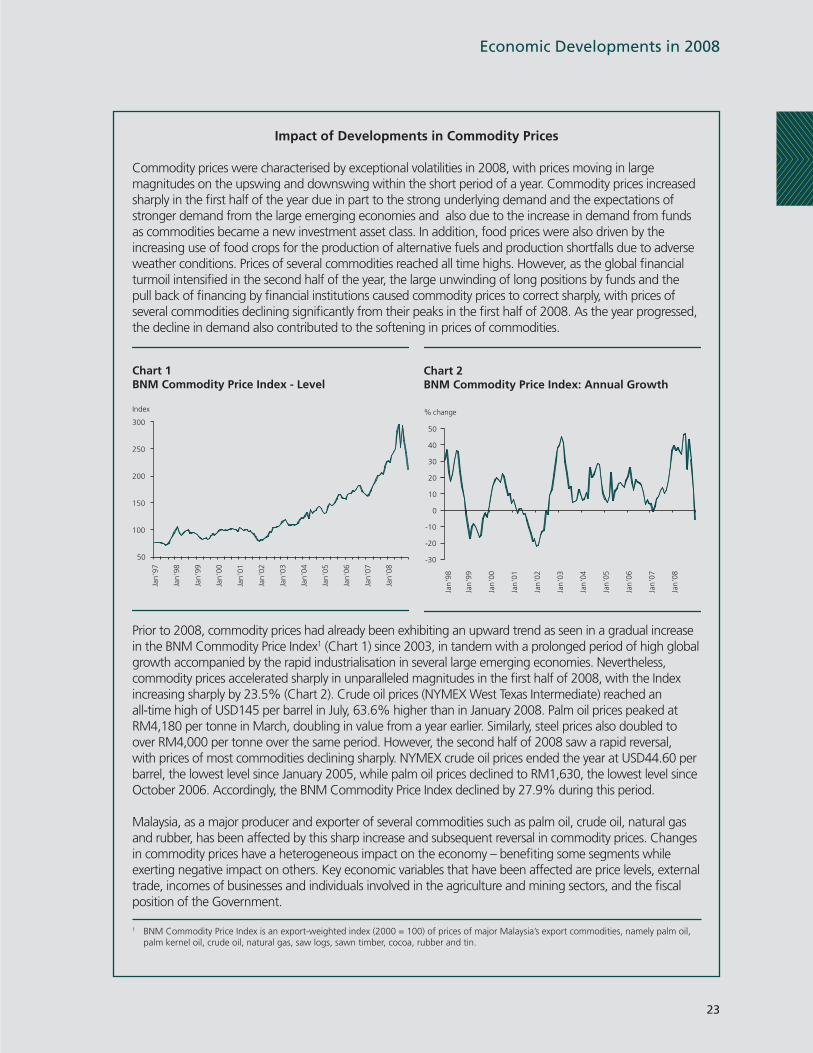
Chart 1BNM Commodity Price Index - Level
Index
50
100
150
200
250
300
Jan
'97
Jan
'98
Jan
'99
Jan
'00
Jan
'01
Jan
'02
Jan
'03
Jan
'04
Jan
'05
Jan
'06
Jan
'07
Jan
'08
Chart 2BNM Commodity Price Index: Annual Growth
% change
-30
-20
-10
0
10
20
30
40
50
Jan
'98
Jan
'99
Jan
'00
Jan
'01
Jan
'02
Jan
'03
Jan
'04
Jan
'05
Jan
'06
Jan
'07
Jan
'08
Prior to 2008, commodity prices had already been exhibiting an upward trend as seen in a gradual increase in the BNM Commodity Price Index1 (Chart 1) since 2003, in tandem with a prolonged period of high global growth accompanied by the rapid industrialisation in several large emerging economies. Nevertheless, commodity prices accelerated sharply in unparalleled magnitudes in the fi rst half of 2008, with the Index increasing sharply by 23.5% (Chart 2). Crude oil prices (NYMEX West Texas Intermediate) reached an all-time high of USD145 per barrel in July, 63.6% higher than in January 2008. Palm oil prices peaked at RM4,180 per tonne in March, doubling in value from a year earlier. Similarly, steel prices also doubled to over RM4,000 per tonne over the same period. However, the second half of 2008 saw a rapid reversal, with prices of most commodities declining sharply. NYMEX crude oil prices ended the year at USD44.60 per barrel, the lowest level since January 2005, while palm oil prices declined to RM1,630, the lowest level since October 2006. Accordingly, the BNM Commodity Price Index declined by 27.9% during this period.
Malaysia, as a major producer and exporter of several commodities such as palm oil, crude oil, natural gas and rubber, has been affected by this sharp increase and subsequent reversal in commodity prices. Changes in commodity prices have a heterogeneous impact on the economy – benefi ting some segments while exerting negative impact on others. Key economic variables that have been affected are price levels, external trade, incomes of businesses and individuals involved in the agriculture and mining sectors, and the fi scal position of the Government.
24
Annual Report 2008
2
Economic Developments in 2008
3
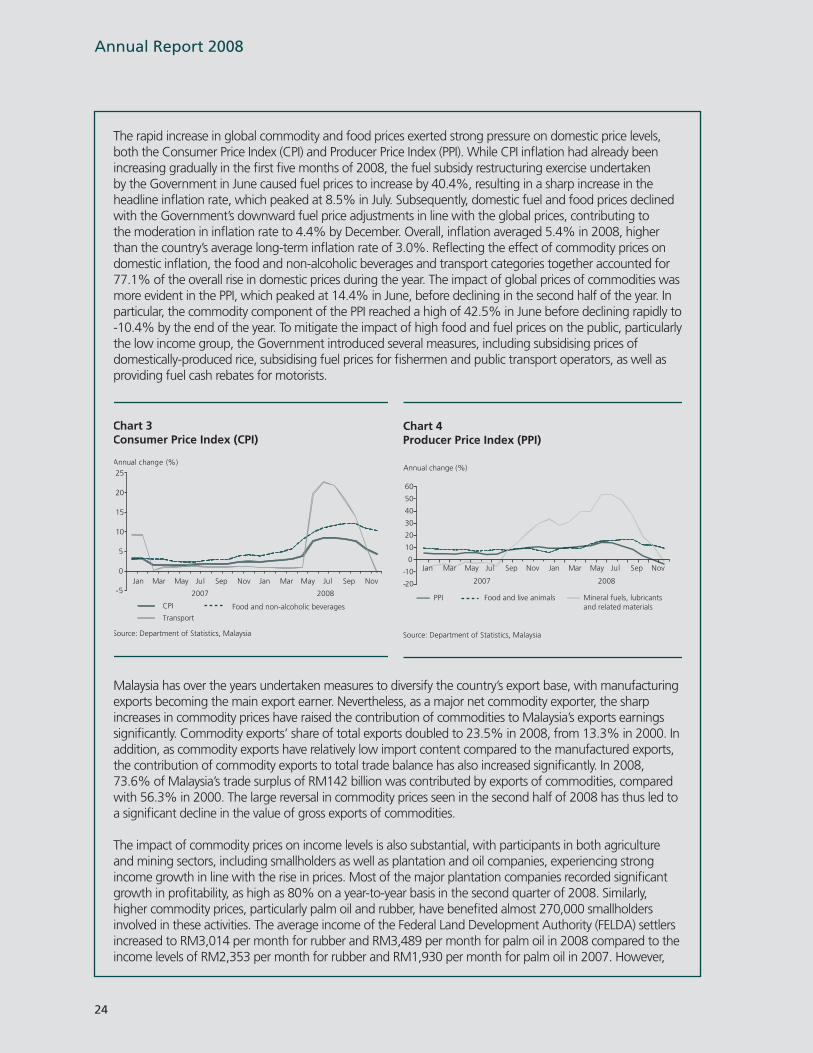
The rapid increase in global commodity and food prices exerted strong pressure on domestic price levels, both the Consumer Price Index (CPI) and Producer Price Index (PPI). While CPI infl ation had already been increasing gradually in the fi rst fi ve months of 2008, the fuel subsidy restructuring exercise undertaken by the Government in June caused fuel prices to increase by 40.4%, resulting in a sharp increase in the headline infl ation rate, which peaked at 8.5% in July. Subsequently, domestic fuel and food prices declined with the Government’s downward fuel price adjustments in line with the global prices, contributing to the moderation in infl ation rate to 4.4% by December. Overall, infl ation averaged 5.4% in 2008, higher than the country’s average long-term infl ation rate of 3.0%. Refl ecting the effect of commodity prices on domestic infl ation, the food and non-alcoholic beverages and transport categories together accounted for 77.1% of the overall rise in domestic prices during the year. The impact of global prices of commodities was more evident in the PPI, which peaked at 14.4% in June, before declining in the second half of the year. In particular, the commodity component of the PPI reached a high of 42.5% in June before declining rapidly to -10.4% by the end of the year. To mitigate the impact of high food and fuel prices on the public, particularly the low income group, the Government introduced several measures, including subsidising prices of domestically-produced rice, subsidising fuel prices for fi shermen and public transport operators, as well as providing fuel cash rebates for motorists.
with the decline in commodity prices towards the end of 2008, profi ts of the plantation and mining companies were adversely affected, while incomes of the smallholders have retreated substantially, to about RM600 per month for rubber and RM750 per month for palm oil as at end-2008.
Another consequence of the sharp increase in commodity prices was the consequential rise in prices of most input materials as well as cost of investment in the mining and agriculture sectors. Oil and gas companies experienced a sharp increase in costs of rigs of about 100% in the fi rst half of the year, as well as steel which rose by 75% during the same period. Meanwhile, the price of fertilizer increased by almost 100% in 2008. While the decline in commodity prices towards the end of 2008 has eased somewhat the cost pressures on these input materials, the concurrent decline in revenue and the reduction in margins served to limit the ability of plantation and oil companies to increase investment expenditure, with several reporting a reduction in capital spending.
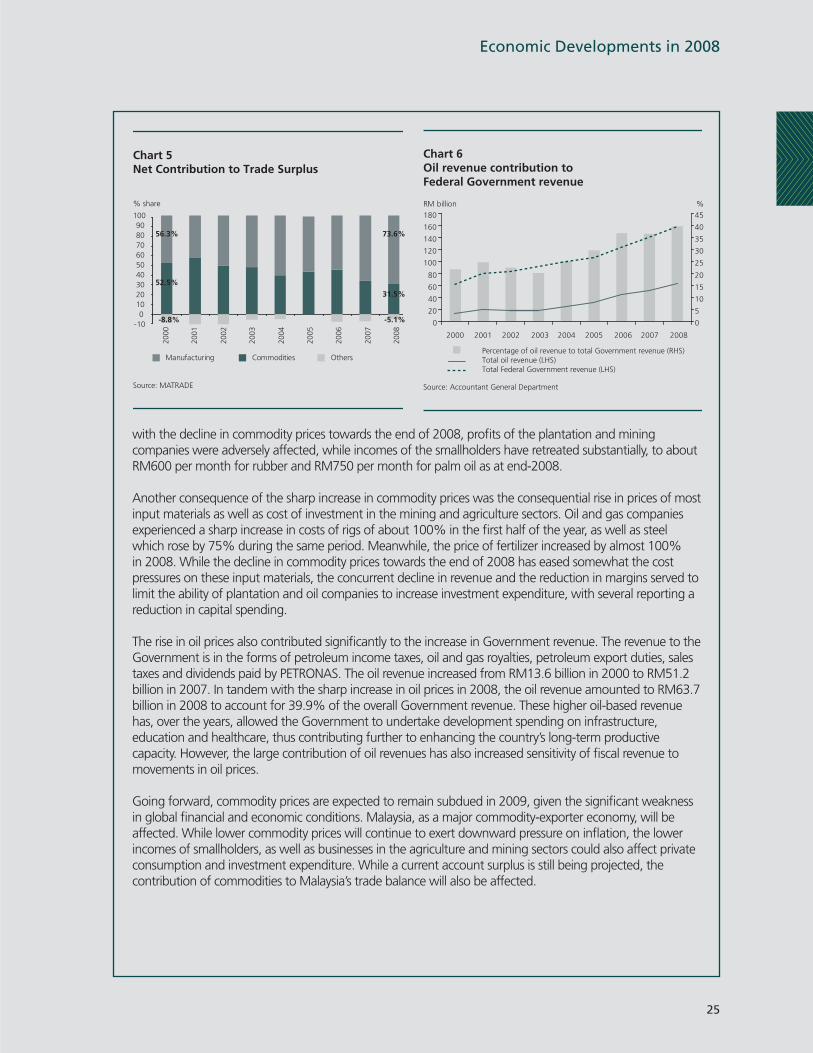
The rise in oil prices also contributed signifi cantly to the increase in Government revenue. The revenue to the Government is in the forms of petroleum income taxes, oil and gas royalties, petroleum export duties, sales taxes and dividends paid by PETRONAS. The oil revenue increased from RM13.6 billion in 2000 to RM51.2 billion in 2007. In tandem with the sharp increase in oil prices in 2008, the oil revenue amounted to RM63.7 billion in 2008 to account for 39.9% of the overall Government revenue. These higher oil-based revenue has, over the years, allowed the Government to undertake development spending on infrastructure, education and healthcare, thus contributing further to enhancing the country’s long-term productive capacity. However, the large contribution of oil revenues has also increased sensitivity of fi scal revenue to movements in oil prices.
Going forward, commodity prices are expected to remain subdued in 2009, given the signifi cant weakness in global fi nancial and economic conditions. Malaysia, as a major commodity-exporter economy, will be affected. While lower commodity prices will continue to exert downward pressure on infl ation, the lower incomes of smallholders, as well as businesses in the agriculture and mining sectors could also affect private consumption and investment expenditure. While a current account surplus is still being projected, the contribution of commodities to Malaysia’s trade balance will also be affected.
Chart 3Consumer Price Index (CPI)
CPI
0
5
10
15
20
25
Jan Mar May Jul Sep Nov Jan Mar May Jul Sep Nov
Annual change (%)
Food and non-alcoholic beverages
Source: Department of Statistics, Malaysia
-5 2007 2008
Transport
Chart 4Producer Price Index (PPI)
-20
-10
0
10
20
30
40
50
60
Annual change (%)
Jan Mar May Jul Sep Nov Jan Mar May Jul Sep Nov
Food and live animals Mineral fuels, lubricants and related materials
PPI
2007 2008
Source: Department of Statistics, Malaysia
Chart 5Net Contribution to Trade Surplus
2000
2001
2002
2003
2004
2005
2006
2007
2008
Manufacturing Commodities Others
-100
102030405060708090
100
% share
56.3%
52.5%
73.6%
31.5%
-5.1%-8.8%
Source: MATRADE
Economic Developments in 2008
Malaysia has over the years undertaken measures to diversify the country’s export base, with manufacturing exports becoming the main export earner. Nevertheless, as a major net commodity exporter, the sharp increases in commodity prices have raised the contribution of commodities to Malaysia’s exports earnings signifi cantly. Commodity exports’ share of total exports doubled to 23.5% in 2008, from 13.3% in 2000. In addition, as commodity exports have relatively low import content compared to the manufactured exports, the contribution of commodity exports to total trade balance has also increased signifi cantly. In 2008, 73.6% of Malaysia’s trade surplus of RM142 billion was contributed by exports of commodities, compared with 56.3% in 2000. The large reversal in commodity prices seen in the second half of 2008 has thus led to a signifi cant decline in the value of gross exports of commodities.
The impact of commodity prices on income levels is also substantial, with participants in both agriculture and mining sectors, including smallholders as well as plantation and oil companies, experiencing strong income growth in line with the rise in prices. Most of the major plantation companies recorded signifi cant growth in profi tability, as high as 80% on a year-to-year basis in the second quarter of 2008. Similarly, higher commodity prices, particularly palm oil and rubber, have benefi ted almost 270,000 smallholders involved in these activities. The average income of the Federal Land Development Authority (FELDA) settlers increased to RM3,014 per month for rubber and RM3,489 per month for palm oil in 2008 compared to the income levels of RM2,353 per month for rubber and RM1,930 per month for palm oil in 2007. However,
Chart 6Oil revenue contribution to Federal Government revenue
Percentage of oil revenue to total Government revenue (RHS)Total oil revenue (LHS)Total Federal Government revenue (LHS)
0
20
40
60
80
100
120
140
160
180
2000 2001 2002 2003 2004 2005 2006 2007 2008
RM billion
0
5
10
15
20
25
30
35
40
45
%
Source: Accountant General Department
Economic Developments in 2008
252
Economic Developments in 2008
3
The rapid increase in global commodity and food prices exerted strong pressure on domestic price levels, both the Consumer Price Index (CPI) and Producer Price Index (PPI). While CPI infl ation had already been increasing gradually in the fi rst fi ve months of 2008, the fuel subsidy restructuring exercise undertaken by the Government in June caused fuel prices to increase by 40.4%, resulting in a sharp increase in the headline infl ation rate, which peaked at 8.5% in July. Subsequently, domestic fuel and food prices declined with the Government’s downward fuel price adjustments in line with the global prices, contributing to the moderation in infl ation rate to 4.4% by December. Overall, infl ation averaged 5.4% in 2008, higher than the country’s average long-term infl ation rate of 3.0%. Refl ecting the effect of commodity prices on domestic infl ation, the food and non-alcoholic beverages and transport categories together accounted for 77.1% of the overall rise in domestic prices during the year. The impact of global prices of commodities was more evident in the PPI, which peaked at 14.4% in June, before declining in the second half of the year. In particular, the commodity component of the PPI reached a high of 42.5% in June before declining rapidly to -10.4% by the end of the year. To mitigate the impact of high food and fuel prices on the public, particularly the low income group, the Government introduced several measures, including subsidising prices of domestically-produced rice, subsidising fuel prices for fi shermen and public transport operators, as well as providing fuel cash rebates for motorists.
with the decline in commodity prices towards the end of 2008, profi ts of the plantation and mining companies were adversely affected, while incomes of the smallholders have retreated substantially, to about RM600 per month for rubber and RM750 per month for palm oil as at end-2008.
Another consequence of the sharp increase in commodity prices was the consequential rise in prices of most input materials as well as cost of investment in the mining and agriculture sectors. Oil and gas companies experienced a sharp increase in costs of rigs of about 100% in the fi rst half of the year, as well as steel which rose by 75% during the same period. Meanwhile, the price of fertilizer increased by almost 100% in 2008. While the decline in commodity prices towards the end of 2008 has eased somewhat the cost pressures on these input materials, the concurrent decline in revenue and the reduction in margins served to limit the ability of plantation and oil companies to increase investment expenditure, with several reporting a reduction in capital spending.
The rise in oil prices also contributed signifi cantly to the increase in Government revenue. The revenue to the Government is in the forms of petroleum income taxes, oil and gas royalties, petroleum export duties, sales taxes and dividends paid by PETRONAS. The oil revenue increased from RM13.6 billion in 2000 to RM51.2 billion in 2007. In tandem with the sharp increase in oil prices in 2008, the oil revenue amounted to RM63.7 billion in 2008 to account for 39.9% of the overall Government revenue. These higher oil-based revenue has, over the years, allowed the Government to undertake development spending on infrastructure, education and healthcare, thus contributing further to enhancing the country’s long-term productive capacity. However, the large contribution of oil revenues has also increased sensitivity of fi scal revenue to movements in oil prices.
Going forward, commodity prices are expected to remain subdued in 2009, given the signifi cant weakness in global fi nancial and economic conditions. Malaysia, as a major commodity-exporter economy, will be affected. While lower commodity prices will continue to exert downward pressure on infl ation, the lower incomes of smallholders, as well as businesses in the agriculture and mining sectors could also affect private consumption and investment expenditure. While a current account surplus is still being projected, the contribution of commodities to Malaysia’s trade balance will also be affected.
Chart 3Consumer Price Index (CPI)
CPI
0
5
10
15
20
25
Jan Mar May Jul Sep Nov Jan Mar May Jul Sep Nov
Annual change (%)
Food and non-alcoholic beverages
Source: Department of Statistics, Malaysia
-5 2007 2008
Transport
Chart 4Producer Price Index (PPI)
-20
-10
0
10
20
30
40
50
60
Annual change (%)
Jan Mar May Jul Sep Nov Jan Mar May Jul Sep Nov
Food and live animals Mineral fuels, lubricants and related materials
PPI
2007 2008
Source: Department of Statistics, Malaysia
Chart 5Net Contribution to Trade Surplus
2000
2001
2002
2003
2004
2005
2006
2007
2008
Manufacturing Commodities Others
-100
102030405060708090
100
% share
56.3%
52.5%
73.6%
31.5%
-5.1%-8.8%
Source: MATRADE
Economic Developments in 2008
Malaysia has over the years undertaken measures to diversify the country’s export base, with manufacturing exports becoming the main export earner. Nevertheless, as a major net commodity exporter, the sharp increases in commodity prices have raised the contribution of commodities to Malaysia’s exports earnings signifi cantly. Commodity exports’ share of total exports doubled to 23.5% in 2008, from 13.3% in 2000. In addition, as commodity exports have relatively low import content compared to the manufactured exports, the contribution of commodity exports to total trade balance has also increased signifi cantly. In 2008, 73.6% of Malaysia’s trade surplus of RM142 billion was contributed by exports of commodities, compared with 56.3% in 2000. The large reversal in commodity prices seen in the second half of 2008 has thus led to a signifi cant decline in the value of gross exports of commodities.
The impact of commodity prices on income levels is also substantial, with participants in both agriculture and mining sectors, including smallholders as well as plantation and oil companies, experiencing strong income growth in line with the rise in prices. Most of the major plantation companies recorded signifi cant growth in profi tability, as high as 80% on a year-to-year basis in the second quarter of 2008. Similarly, higher commodity prices, particularly palm oil and rubber, have benefi ted almost 270,000 smallholders involved in these activities. The average income of the Federal Land Development Authority (FELDA) settlers increased to RM3,014 per month for rubber and RM3,489 per month for palm oil in 2008 compared to the income levels of RM2,353 per month for rubber and RM1,930 per month for palm oil in 2007. However,
Chart 6Oil revenue contribution to Federal Government revenue
Percentage of oil revenue to total Government revenue (RHS)Total oil revenue (LHS)Total Federal Government revenue (LHS)
0
20
40
60
80
100
120
140
160
180
2000 2001 2002 2003 2004 2005 2006 2007 2008
RM billion
0
5
10
15
20
25
30
35
40
45
%
Source: Accountant General Department