Embed Size (px)
Citation preview
Editing VectorGeodata
in
TNTmips®
and TNTedit™
EDIT
VECTORS
Tutorial
page 2
Editing Vector Geodata
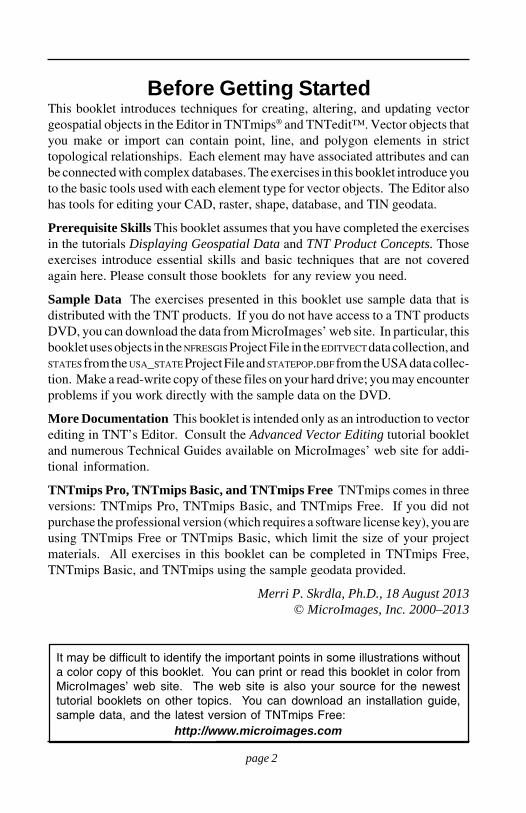
This booklet introduces techniques for creating, altering, and updating vectorgeospatial objects in the Editor in TNTmips® and TNTedit™. Vector objects thatyou make or import can contain point, line, and polygon elements in stricttopological relationships. Each element may have associated attributes and canbe connected with complex databases. The exercises in this booklet introduce youto the basic tools used with each element type for vector objects. The Editor alsohas tools for editing your CAD, raster, shape, database, and TIN geodata.
Prerequisite Skills This booklet assumes that you have completed the exercisesin the tutorials Displaying Geospatial Data and TNT Product Concepts. Thoseexercises introduce essential skills and basic techniques that are not coveredagain here. Please consult those booklets for any review you need.
Sample Data The exercises presented in this booklet use sample data that isdistributed with the TNT products. If you do not have access to a TNT productsDVD, you can download the data from MicroImages’ web site. In particular, thisbooklet uses objects in the NFRESGIS Project File in the EDITVECT data collection, andSTATES from the USA_STATE Project File and STATEPOP.DBF from the USA data collec-tion. Make a read-write copy of these files on your hard drive; you may encounterproblems if you work directly with the sample data on the DVD.
More Documentation This booklet is intended only as an introduction to vectorediting in TNT’s Editor. Consult the Advanced Vector Editing tutorial bookletand numerous Technical Guides available on MicroImages’ web site for addi-tional information.
TNTmips Pro, TNTmips Basic, and TNTmips Free TNTmips comes in threeversions: TNTmips Pro, TNTmips Basic, and TNTmips Free. If you did notpurchase the professional version (which requires a software license key), you areusing TNTmips Free or TNTmips Basic, which limit the size of your projectmaterials. All exercises in this booklet can be completed in TNTmips Free,TNTmips Basic, and TNTmips using the sample geodata provided.
Merri P. Skrdla, Ph.D., 18 August 2013© MicroImages, Inc. 2000–2013
It may be difficult to identify the important points in some illustrations withouta color copy of this booklet. You can print or read this booklet in color fromMicroImages’ web site. The web site is also your source for the newesttutorial booklets on other topics. You can download an installation guide,sample data, and the latest version of TNTmips Free:
http://www.microimages.com
Before Getting Started
page 3
Editing Vector Geodata
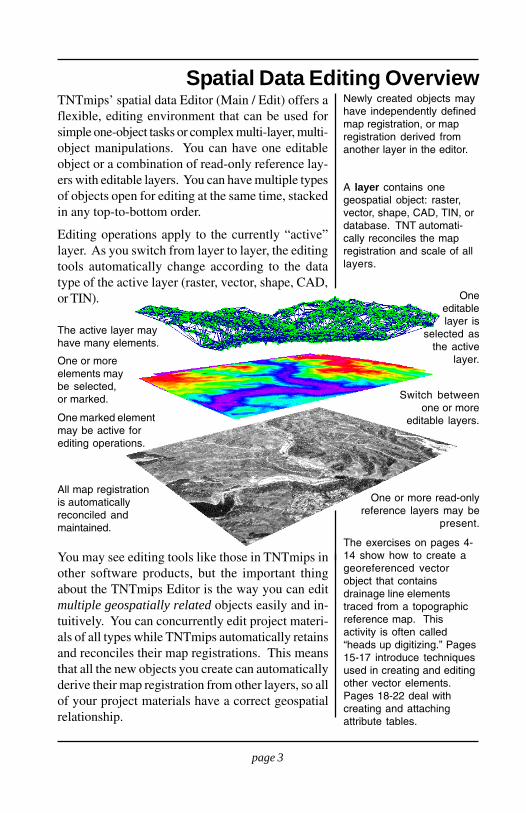
TNTmips’ spatial data Editor (Main / Edit) offers aflexible, editing environment that can be used forsimple one-object tasks or complex multi-layer, multi-object manipulations. You can have one editableobject or a combination of read-only reference lay-ers with editable layers. You can have multiple typesof objects open for editing at the same time, stackedin any top-to-bottom order.
Editing operations apply to the currently “active”layer. As you switch from layer to layer, the editingtools automatically change according to the datatype of the active layer (raster, vector, shape, CAD,or TIN).
You may see editing tools like those in TNTmips inother software products, but the important thingabout the TNTmips Editor is the way you can editmultiple geospatially related objects easily and in-tuitively. You can concurrently edit project materi-als of all types while TNTmips automatically retainsand reconciles their map registrations. This meansthat all the new objects you create can automaticallyderive their map registration from other layers, so allof your project materials have a correct geospatialrelationship.
Spatial Data Editing Overview
The exercises on pages 4-14 show how to create ageoreferenced vectorobject that containsdrainage line elementstraced from a topographicreference map. Thisactivity is often called“heads up digitizing.” Pages15-17 introduce techniquesused in creating and editingother vector elements.Pages 18-22 deal withcreating and attachingattribute tables.
Newly created objects mayhave independently definedmap registration, or mapregistration derived fromanother layer in the editor.
A layer contains onegeospatial object: raster,vector, shape, CAD, TIN, ordatabase. TNT automati-cally reconciles the mapregistration and scale of alllayers.
One or more read-onlyreference layers may be
present.
One marked elementmay be active forediting operations.
The active layer mayhave many elements.
One or moreelements maybe selected,or marked.
All map registrationis automaticallyreconciled andmaintained.
Oneeditablelayer is
selected asthe active
layer.
Switch betweenone or more
editable layers.
page 4
Editing Vector Geodata
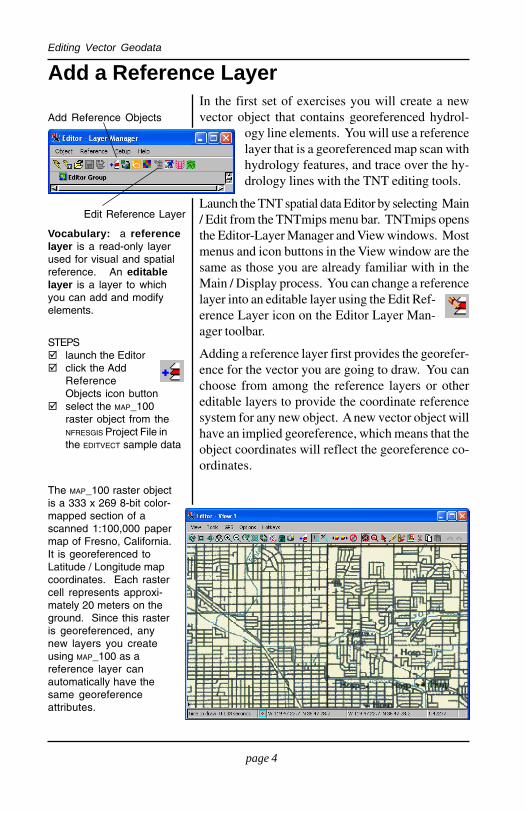
In the first set of exercises you will create a newvector object that contains georeferenced hydrol-
ogy line elements. You will use a referencelayer that is a georeferenced map scan withhydrology features, and trace over the hy-drology lines with the TNT editing tools.
Launch the TNT spatial data Editor by selecting Main/ Edit from the TNTmips menu bar. TNTmips opensthe Editor-Layer Manager and View windows. Mostmenus and icon buttons in the View window are thesame as those you are already familiar with in theMain / Display process. You can change a referencelayer into an editable layer using the Edit Ref-erence Layer icon on the Editor Layer Man-ager toolbar.
Adding a reference layer first provides the georefer-ence for the vector you are going to draw. You canchoose from among the reference layers or othereditable layers to provide the coordinate referencesystem for any new object. A new vector object willhave an implied georeference, which means that theobject coordinates will reflect the georeference co-ordinates.
Add a Reference Layer
Vocabulary: a referencelayer is a read-only layerused for visual and spatialreference. An editablelayer is a layer to whichyou can add and modifyelements.
The MAP_100 raster objectis a 333 x 269 8-bit color-mapped section of ascanned 1:100,000 papermap of Fresno, California.It is georeferenced toLatitude / Longitude mapcoordinates. Each rastercell represents approxi-mately 20 meters on theground. Since this rasteris georeferenced, anynew layers you createusing MAP_100 as areference layer canautomatically have thesame georeferenceattributes.
STEPS launch the Editor click the Add
ReferenceObjects icon button
select the MAP_100raster object from theNFRESGIS Project File inthe EDITVECT sample data
Edit Reference Layer
Add Reference Objects
page 5
Editing Vector Geodata
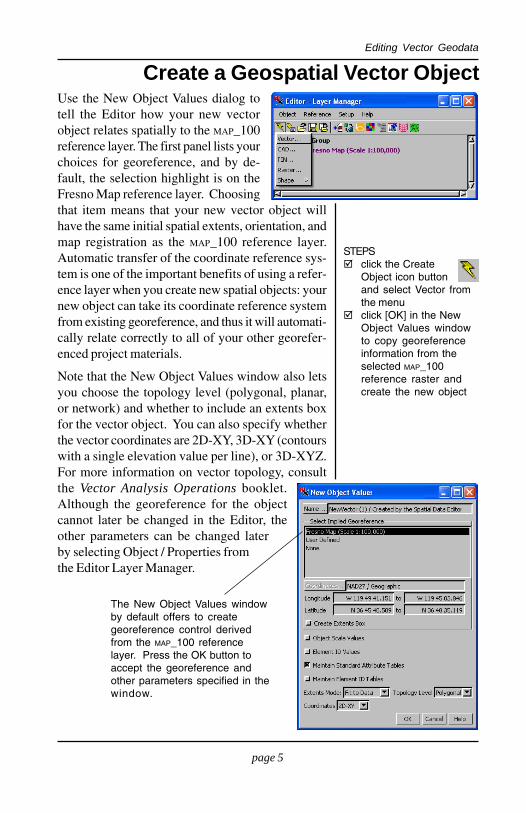
Create a Geospatial Vector ObjectUse the New Object Values dialog totell the Editor how your new vectorobject relates spatially to the MAP_100reference layer. The first panel lists yourchoices for georeference, and by de-fault, the selection highlight is on theFresno Map reference layer. Choosingthat item means that your new vector object willhave the same initial spatial extents, orientation, andmap registration as the MAP_100 reference layer.Automatic transfer of the coordinate reference sys-tem is one of the important benefits of using a refer-ence layer when you create new spatial objects: yournew object can take its coordinate reference systemfrom existing georeference, and thus it will automati-cally relate correctly to all of your other georefer-enced project materials.
Note that the New Object Values window also letsyou choose the topology level (polygonal, planar,or network) and whether to include an extents boxfor the vector object. You can also specify whetherthe vector coordinates are 2D-XY, 3D-XY (contourswith a single elevation value per line), or 3D-XYZ.For more information on vector topology, consultthe Vector Analysis Operations booklet.Although the georeference for the objectcannot later be changed in the Editor, theother parameters can be changed laterby selecting Object / Properties fromthe Editor Layer Manager.
STEPS click the Create
Object icon buttonand select Vector fromthe menu
click [OK] in the NewObject Values windowto copy georeferenceinformation from theselected MAP_100reference raster andcreate the new object
The New Object Values windowby default offers to creategeoreference control derivedfrom the MAP_100 referencelayer. Press the OK button toaccept the georeference andother parameters specified in thewindow.
page 6
Editing Vector Geodata
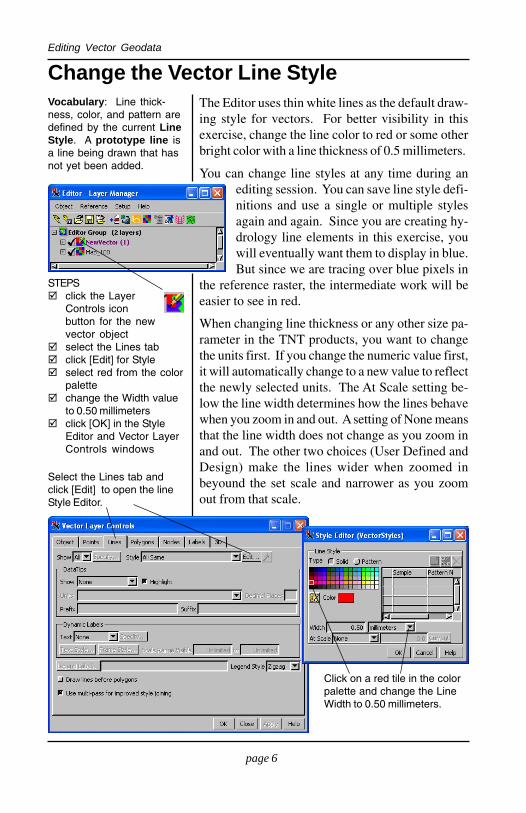
Change the Vector Line StyleThe Editor uses thin white lines as the default draw-ing style for vectors. For better visibility in thisexercise, change the line color to red or some otherbright color with a line thickness of 0.5 millimeters.
You can change line styles at any time during anediting session. You can save line style defi-nitions and use a single or multiple stylesagain and again. Since you are creating hy-drology line elements in this exercise, youwill eventually want them to display in blue.But since we are tracing over blue pixels in
the reference raster, the intermediate work will beeasier to see in red.
When changing line thickness or any other size pa-rameter in the TNT products, you want to changethe units first. If you change the numeric value first,it will automatically change to a new value to reflectthe newly selected units. The At Scale setting be-low the line width determines how the lines behavewhen you zoom in and out. A setting of None meansthat the line width does not change as you zoom inand out. The other two choices (User Defined andDesign) make the lines wider when zoomed inbeyound the set scale and narrower as you zoomout from that scale.
Vocabulary: Line thick-ness, color, and pattern aredefined by the current LineStyle. A prototype line isa line being drawn that hasnot yet been added.
Select the Lines tab andclick [Edit] to open the lineStyle Editor.
Click on a red tile in the colorpalette and change the LineWidth to 0.50 millimeters.
STEPS click the Layer
Controls iconbutton for the newvector object
select the Lines tab click [Edit] for Style select red from the color
palette change the Width value
to 0.50 millimeters click [OK] in the Style
Editor and Vector LayerControls windows
page 7
Editing Vector Geodata
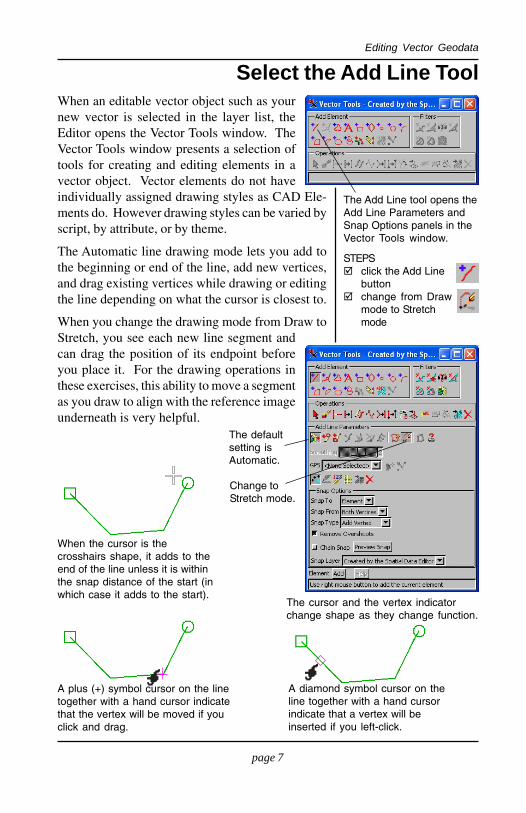
Select the Add Line ToolWhen an editable vector object such as yournew vector is selected in the layer list, theEditor opens the Vector Tools window. TheVector Tools window presents a selection oftools for creating and editing elements in avector object. Vector elements do not haveindividually assigned drawing styles as CAD Ele-ments do. However drawing styles can be varied byscript, by attribute, or by theme.
The Automatic line drawing mode lets you add tothe beginning or end of the line, add new vertices,and drag existing vertices while drawing or editingthe line depending on what the cursor is closest to.
When you change the drawing mode from Draw toStretch, you see each new line segment andcan drag the position of its endpoint beforeyou place it. For the drawing operations inthese exercises, this ability to move a segmentas you draw to align with the reference imageunderneath is very helpful.
The Add Line tool opens theAdd Line Parameters andSnap Options panels in theVector Tools window.
The defaultsetting isAutomatic.
The cursor and the vertex indicatorchange shape as they change function.
STEPS click the Add Line
button change from Draw
mode to Stretchmode
Change toStretch mode.
When the cursor is thecrosshairs shape, it adds to theend of the line unless it is withinthe snap distance of the start (inwhich case it adds to the start).
A plus (+) symbol cursor on the linetogether with a hand cursor indicatethat the vertex will be moved if youclick and drag.
A diamond symbol cursor on theline together with a hand cursorindicate that a vertex will beinserted if you left-click.
page 8
Editing Vector Geodata
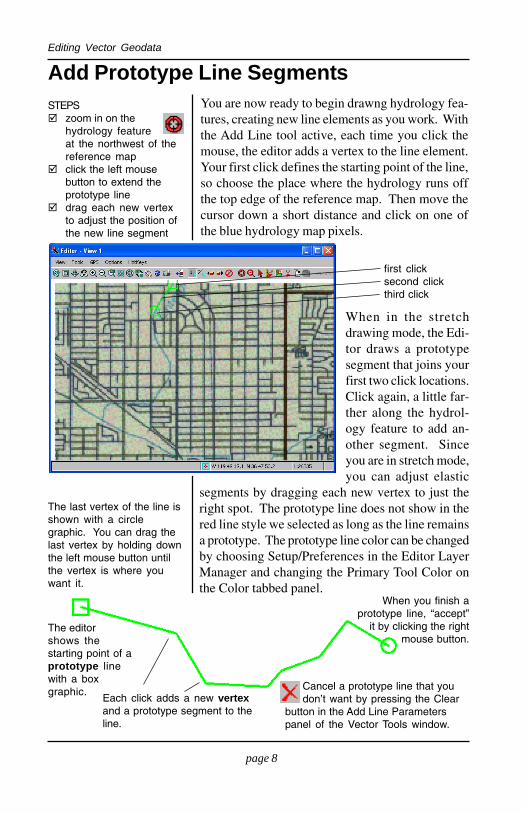
Add Prototype Line SegmentsYou are now ready to begin drawng hydrology fea-tures, creating new line elements as you work. Withthe Add Line tool active, each time you click themouse, the editor adds a vertex to the line element.Your first click defines the starting point of the line,so choose the place where the hydrology runs offthe top edge of the reference map. Then move thecursor down a short distance and click on one ofthe blue hydrology map pixels.
STEPS zoom in on the
hydrology featureat the northwest of thereference map
click the left mousebutton to extend theprototype line
drag each new vertexto adjust the position ofthe new line segment
The editorshows thestarting point of aprototype linewith a boxgraphic.
Each click adds a new vertexand a prototype segment to theline.
Cancel a prototype line that youdon’t want by pressing the Clear
button in the Add Line Parameterspanel of the Vector Tools window.
The last vertex of the line isshown with a circlegraphic. You can drag thelast vertex by holding downthe left mouse button untilthe vertex is where youwant it.
When you finish aprototype line, “accept”
it by clicking the rightmouse button.
first clicksecond clickthird click
When in the stretchdrawing mode, the Edi-tor draws a prototypesegment that joins yourfirst two click locations.Click again, a little far-ther along the hydrol-ogy feature to add an-other segment. Sinceyou are in stretch mode,you can adjust elastic
segments by dragging each new vertex to just theright spot. The prototype line does not show in thered line style we selected as long as the line remainsa prototype. The prototype line color can be changedby choosing Setup/Preferences in the Editor LayerManager and changing the Primary Tool Color onthe Color tabbed panel.
page 9
Editing Vector Geodata
Accept Line Elements
Save Early, Save OftenChoose Object / Save from the main window. Use the standard select objecttechniques to select or create a Project File, and name your new object HY-DROLOGY. The Editor also offers an autosave feature. To use autosave, selectPreferences / Save from the Setup menu in the Editor Layer Manager andspecify how frequently you want a reminder to save your work. You can alsoenable automatic backups on the Backup tabbed panel. These backups canoptionally occur in the background without you being prompted.
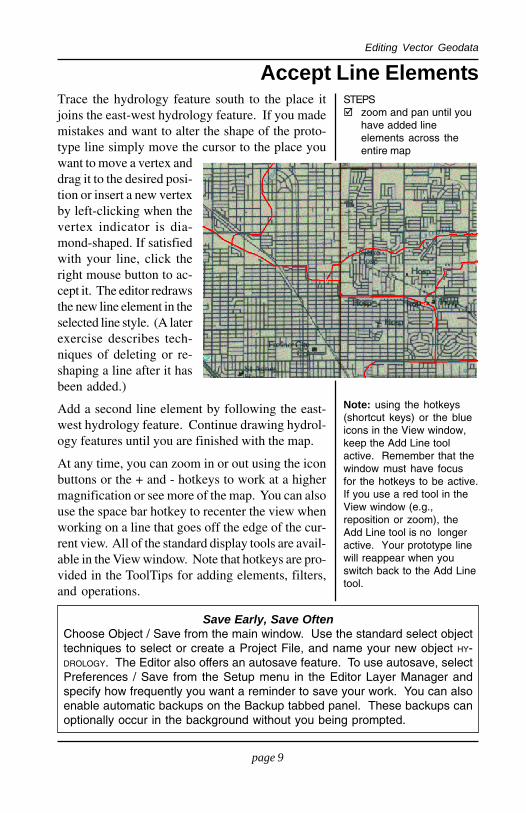
Trace the hydrology feature south to the place itjoins the east-west hydrology feature. If you mademistakes and want to alter the shape of the proto-type line simply move the cursor to the place youwant to move a vertex anddrag it to the desired posi-tion or insert a new vertexby left-clicking when thevertex indicator is dia-mond-shaped. If satisfiedwith your line, click theright mouse button to ac-cept it. The editor redrawsthe new line element in theselected line style. (A laterexercise describes tech-niques of deleting or re-shaping a line after it hasbeen added.)
Add a second line element by following the east-west hydrology feature. Continue drawing hydrol-ogy features until you are finished with the map.
At any time, you can zoom in or out using the iconbuttons or the + and - hotkeys to work at a highermagnification or see more of the map. You can alsouse the space bar hotkey to recenter the view whenworking on a line that goes off the edge of the cur-rent view. All of the standard display tools are avail-able in the View window. Note that hotkeys are pro-vided in the ToolTips for adding elements, filters,and operations.
STEPS zoom and pan until you
have added lineelements across theentire map
Note: using the hotkeys(shortcut keys) or the blueicons in the View window,keep the Add Line toolactive. Remember that thewindow must have focusfor the hotkeys to be active.If you use a red tool in theView window (e.g.,reposition or zoom), theAdd Line tool is no longeractive. Your prototype linewill reappear when youswitch back to the Add Linetool.
page 10
Editing Vector Geodata
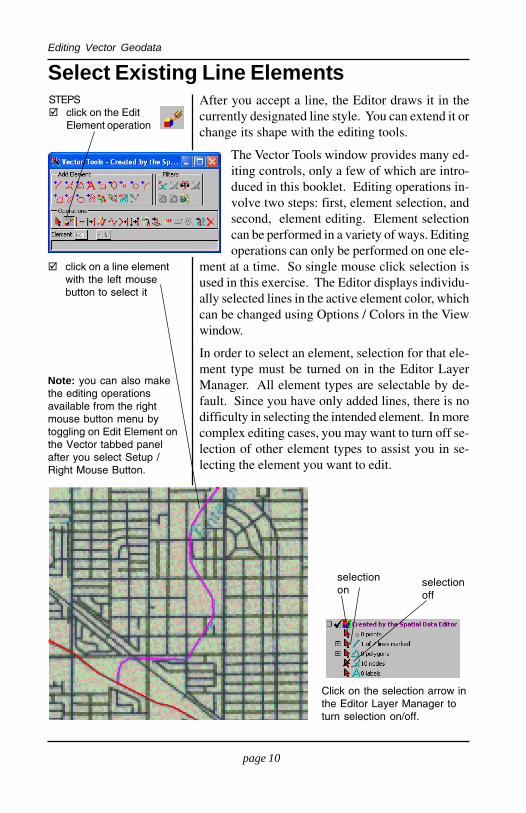
Select Existing Line ElementsAfter you accept a line, the Editor draws it in thecurrently designated line style. You can extend it orchange its shape with the editing tools.
The Vector Tools window provides many ed-iting controls, only a few of which are intro-duced in this booklet. Editing operations in-volve two steps: first, element selection, andsecond, element editing. Element selectioncan be performed in a variety of ways. Editingoperations can only be performed on one ele-
ment at a time. So single mouse click selection isused in this exercise. The Editor displays individu-ally selected lines in the active element color, whichcan be changed using Options / Colors in the Viewwindow.
In order to select an element, selection for that ele-ment type must be turned on in the Editor LayerManager. All element types are selectable by de-fault. Since you have only added lines, there is nodifficulty in selecting the intended element. In morecomplex editing cases, you may want to turn off se-lection of other element types to assist you in se-lecting the element you want to edit.
click on a line elementwith the left mousebutton to select it
STEPS click on the Edit
Element operation
Click on the selection arrow inthe Editor Layer Manager toturn selection on/off.
selectionon
selectionoff
Note: you can also makethe editing operationsavailable from the rightmouse button menu bytoggling on Edit Element onthe Vector tabbed panelafter you select Setup /Right Mouse Button.
page 11
Editing Vector Geodata
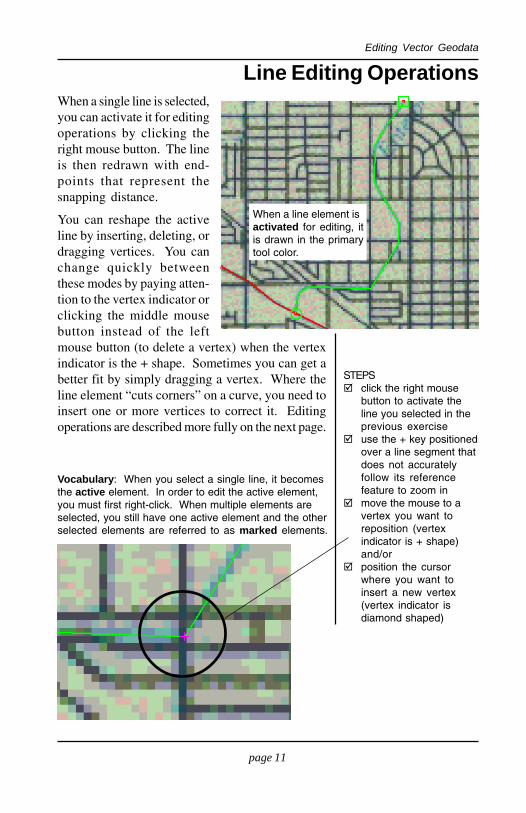
Line Editing OperationsWhen a single line is selected,you can activate it for editingoperations by clicking theright mouse button. The lineis then redrawn with end-points that represent thesnapping distance.
You can reshape the activeline by inserting, deleting, ordragging vertices. You canchange quickly betweenthese modes by paying atten-tion to the vertex indicator orclicking the middle mousebutton instead of the leftmouse button (to delete a vertex) when the vertexindicator is the + shape. Sometimes you can get abetter fit by simply dragging a vertex. Where theline element “cuts corners” on a curve, you need toinsert one or more vertices to correct it. Editingoperations are described more fully on the next page.
Vocabulary: When you select a single line, it becomesthe active element. In order to edit the active element,you must first right-click. When multiple elements areselected, you still have one active element and the otherselected elements are referred to as marked elements.
STEPS click the right mouse
button to activate theline you selected in theprevious exercise
use the + key positionedover a line segment thatdoes not accuratelyfollow its referencefeature to zoom in
move the mouse to avertex you want toreposition (vertexindicator is + shape)and/or
position the cursorwhere you want toinsert a new vertex(vertex indicator isdiamond shaped)
When a line element isactivated for editing, itis drawn in the primarytool color.
page 12
Editing Vector Geodata
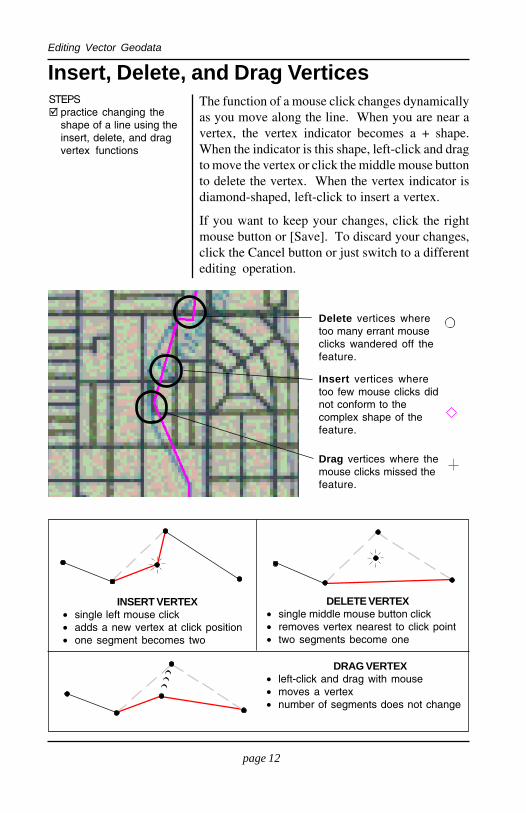
Insert, Delete, and Drag VerticesThe function of a mouse click changes dynamicallyas you move along the line. When you are near avertex, the vertex indicator becomes a + shape.When the indicator is this shape, left-click and dragto move the vertex or click the middle mouse buttonto delete the vertex. When the vertex indicator isdiamond-shaped, left-click to insert a vertex.
If you want to keep your changes, click the rightmouse button or [Save]. To discard your changes,click the Cancel button or just switch to a differentediting operation.
INSERT VERTEX• single left mouse click• adds a new vertex at click position• one segment becomes two
Delete vertices wheretoo many errant mouseclicks wandered off thefeature.
Insert vertices wheretoo few mouse clicks didnot conform to thecomplex shape of thefeature.
Drag vertices where themouse clicks missed thefeature.
DRAG VERTEX• left-click and drag with mouse• moves a vertex• number of segments does not change
DELETE VERTEX• single middle mouse button click• removes vertex nearest to click point• two segments become one
STEPS practice changing the
shape of a line using theinsert, delete, and dragvertex functions
page 13
Editing Vector Geodata
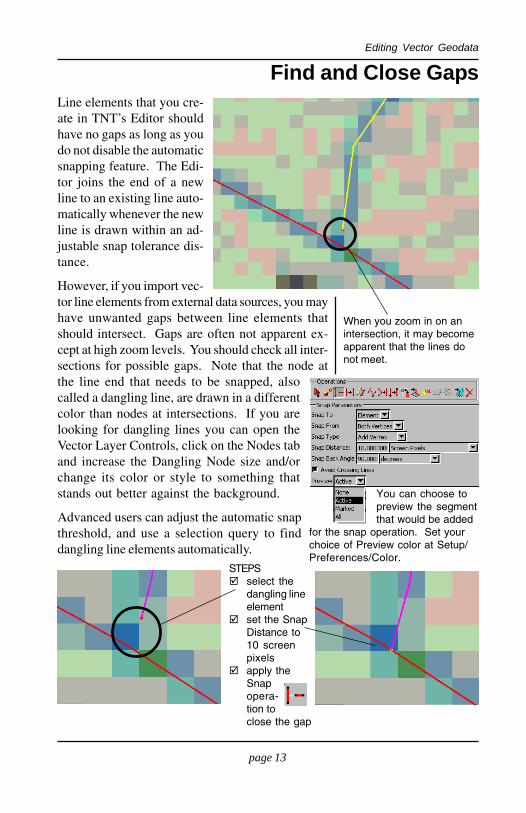
Find and Close GapsLine elements that you cre-ate in TNT’s Editor shouldhave no gaps as long as youdo not disable the automaticsnapping feature. The Edi-tor joins the end of a newline to an existing line auto-matically whenever the newline is drawn within an ad-justable snap tolerance dis-tance.
However, if you import vec-tor line elements from external data sources, you mayhave unwanted gaps between line elements thatshould intersect. Gaps are often not apparent ex-cept at high zoom levels. You should check all inter-sections for possible gaps. Note that the node atthe line end that needs to be snapped, alsocalled a dangling line, are drawn in a differentcolor than nodes at intersections. If you arelooking for dangling lines you can open theVector Layer Controls, click on the Nodes taband increase the Dangling Node size and/orchange its color or style to something thatstands out better against the background.
STEPS select the
dangling lineelement
set the SnapDistance to10 screenpixels
apply theSnapopera-tion toclose the gap
When you zoom in on anintersection, it may becomeapparent that the lines donot meet.
You can choose topreview the segmentthat would be added
for the snap operation. Set yourchoice of Preview color at Setup/Preferences/Color.
Advanced users can adjust the automatic snapthreshold, and use a selection query to finddangling line elements automatically.
page 14
Editing Vector Geodata
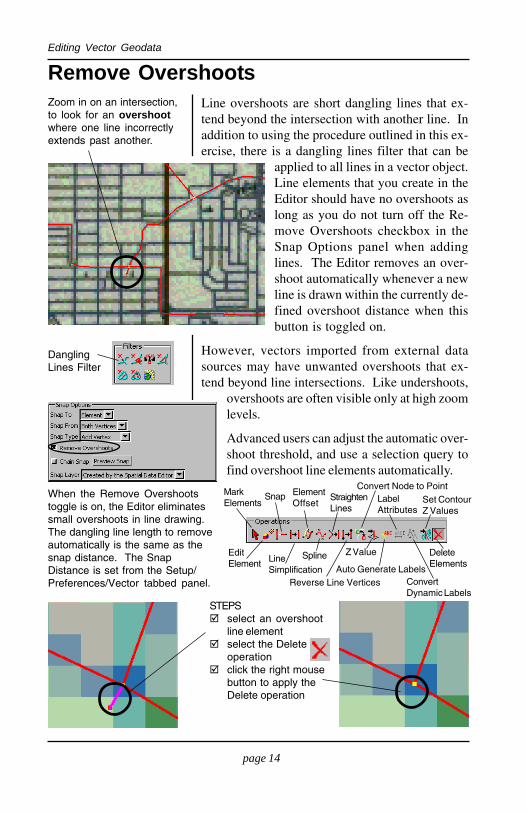
Remove OvershootsLine overshoots are short dangling lines that ex-tend beyond the intersection with another line. Inaddition to using the procedure outlined in this ex-ercise, there is a dangling lines filter that can be
applied to all lines in a vector object.Line elements that you create in theEditor should have no overshoots aslong as you do not turn off the Re-move Overshoots checkbox in theSnap Options panel when addinglines. The Editor removes an over-shoot automatically whenever a newline is drawn within the currently de-fined overshoot distance when thisbutton is toggled on.
However, vectors imported from external datasources may have unwanted overshoots that ex-tend beyond line intersections. Like undershoots,
overshoots are often visible only at high zoomlevels.
Advanced users can adjust the automatic over-shoot threshold, and use a selection query tofind overshoot line elements automatically.
STEPS select an overshoot
line element select the Delete
operation click the right mouse
button to apply theDelete operation
Zoom in on an intersection,to look for an overshootwhere one line incorrectlyextends past another.
When the Remove Overshootstoggle is on, the Editor eliminatessmall overshoots in line drawing.The dangling line length to removeautomatically is the same as thesnap distance. The SnapDistance is set from the Setup/Preferences/Vector tabbed panel.
DanglingLines Filter
MarkElements
EditElement
Snap
LineSimplification
ElementOffset
Spline
StraightenLines
Reverse Line Vertices
Convert Node to Point
Auto Generate Labels
Z Value
LabelAttributes
DeleteElements
Set ContourZ Values
ConvertDynamic Labels
page 15
Editing Vector Geodata
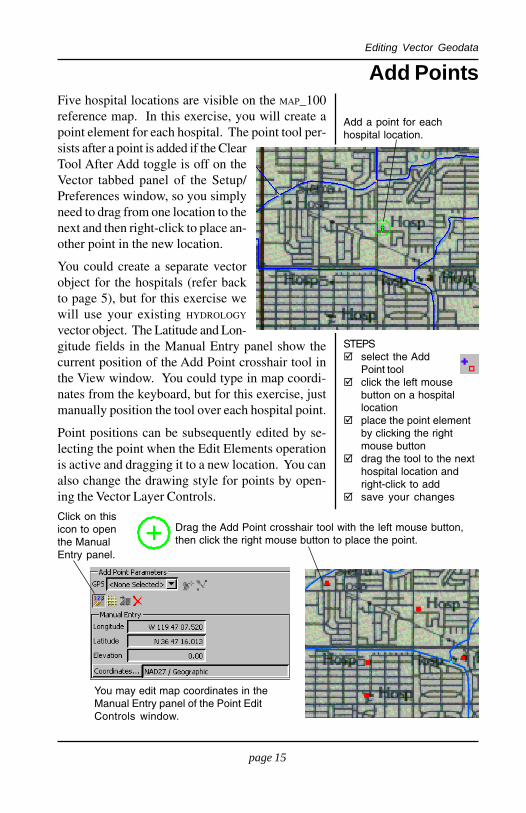
Add PointsFive hospital locations are visible on the MAP_100reference map. In this exercise, you will create apoint element for each hospital. The point tool per-sists after a point is added if the ClearTool After Add toggle is off on theVector tabbed panel of the Setup/Preferences window, so you simplyneed to drag from one location to thenext and then right-click to place an-other point in the new location.
You could create a separate vectorobject for the hospitals (refer backto page 5), but for this exercise wewill use your existing HYDROLOGY
vector object. The Latitude and Lon-gitude fields in the Manual Entry panel show thecurrent position of the Add Point crosshair tool inthe View window. You could type in map coordi-nates from the keyboard, but for this exercise, justmanually position the tool over each hospital point.
Point positions can be subsequently edited by se-lecting the point when the Edit Elements operationis active and dragging it to a new location. You canalso change the drawing style for points by open-ing the Vector Layer Controls.
STEPS select the Add
Point tool click the left mouse
button on a hospitallocation
place the point elementby clicking the rightmouse button
drag the tool to the nexthospital location andright-click to add
save your changes
Add a point for eachhospital location.
Drag the Add Point crosshair tool with the left mouse button,then click the right mouse button to place the point.
You may edit map coordinates in theManual Entry panel of the Point EditControls window.
Click on thisicon to openthe ManualEntry panel.
page 16
Editing Vector Geodata
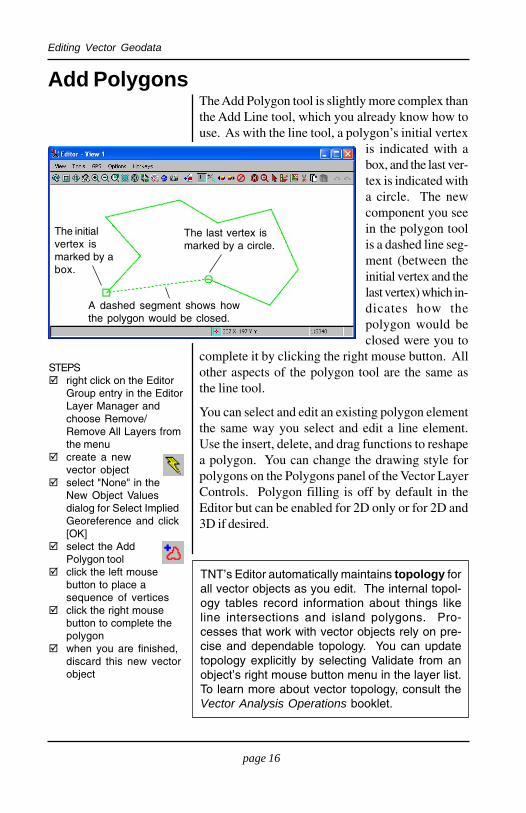
Add PolygonsThe Add Polygon tool is slightly more complex thanthe Add Line tool, which you already know how touse. As with the line tool, a polygon’s initial vertex
is indicated with abox, and the last ver-tex is indicated witha circle. The newcomponent you seein the polygon toolis a dashed line seg-ment (between theinitial vertex and thelast vertex) which in-dicates how thepolygon would beclosed were you to
complete it by clicking the right mouse button. Allother aspects of the polygon tool are the same asthe line tool.
You can select and edit an existing polygon elementthe same way you select and edit a line element.Use the insert, delete, and drag functions to reshapea polygon. You can change the drawing style forpolygons on the Polygons panel of the Vector LayerControls. Polygon filling is off by default in theEditor but can be enabled for 2D only or for 2D and3D if desired.
STEPS right click on the Editor
Group entry in the EditorLayer Manager andchoose Remove/Remove All Layers fromthe menu
create a newvector object
select "None" in theNew Object Valuesdialog for Select ImpliedGeoreference and click[OK]
select the AddPolygon tool
click the left mousebutton to place asequence of vertices
click the right mousebutton to complete thepolygon
when you are finished,discard this new vectorobject
The last vertex ismarked by a circle.
TNT’s Editor automatically maintains topology forall vector objects as you edit. The internal topol-ogy tables record information about things likeline intersections and island polygons. Pro-cesses that work with vector objects rely on pre-cise and dependable topology. You can updatetopology explicitly by selecting Validate from anobject’s right mouse button menu in the layer list.To learn more about vector topology, consult theVector Analysis Operations booklet.
A dashed segment shows howthe polygon would be closed.
The initialvertex ismarked by abox.
page 17
Editing Vector Geodata
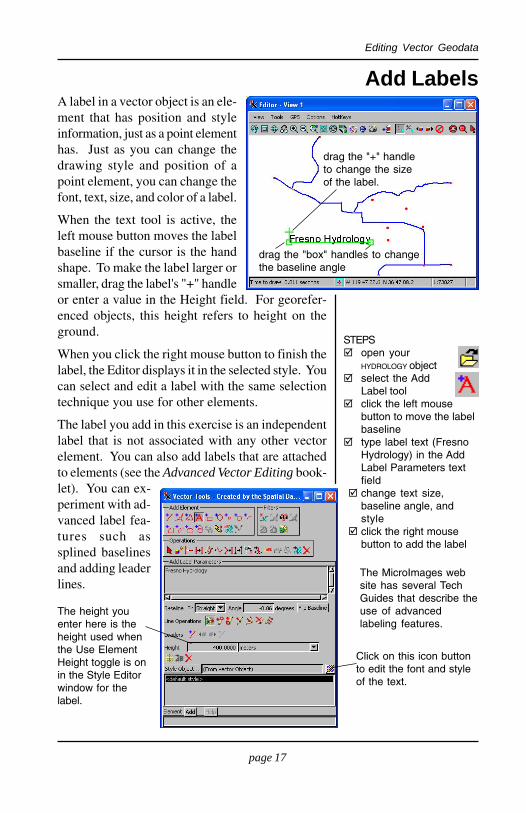
Add LabelsA label in a vector object is an ele-ment that has position and styleinformation, just as a point elementhas. Just as you can change thedrawing style and position of apoint element, you can change thefont, text, size, and color of a label.
When the text tool is active, theleft mouse button moves the labelbaseline if the cursor is the handshape. To make the label larger orsmaller, drag the label's "+" handleor enter a value in the Height field. For georefer-enced objects, this height refers to height on theground.
When you click the right mouse button to finish thelabel, the Editor displays it in the selected style. Youcan select and edit a label with the same selectiontechnique you use for other elements.
The label you add in this exercise is an independentlabel that is not associated with any other vectorelement. You can also add labels that are attachedto elements (see the Advanced Vector Editing book-let). You can ex-periment with ad-vanced label fea-tures such assplined baselinesand adding leaderlines.
STEPS open your
HYDROLOGY object select the Add
Label tool click the left mouse
button to move the labelbaseline
type label text (FresnoHydrology) in the AddLabel Parameters textfield
change text size,baseline angle, andstyle
click the right mousebutton to add the label
drag the "+" handleto change the sizeof the label.
type your label textin the Text: tab
The MicroImages website has several TechGuides that describe theuse of advancedlabeling features.
Click on this icon buttonto edit the font and styleof the text.
drag the "box" handles to changethe baseline angle
The height youenter here is theheight used whenthe Use ElementHeight toggle is onin the Style Editorwindow for thelabel.
page 18
Editing Vector Geodata
Create an Attribute Table
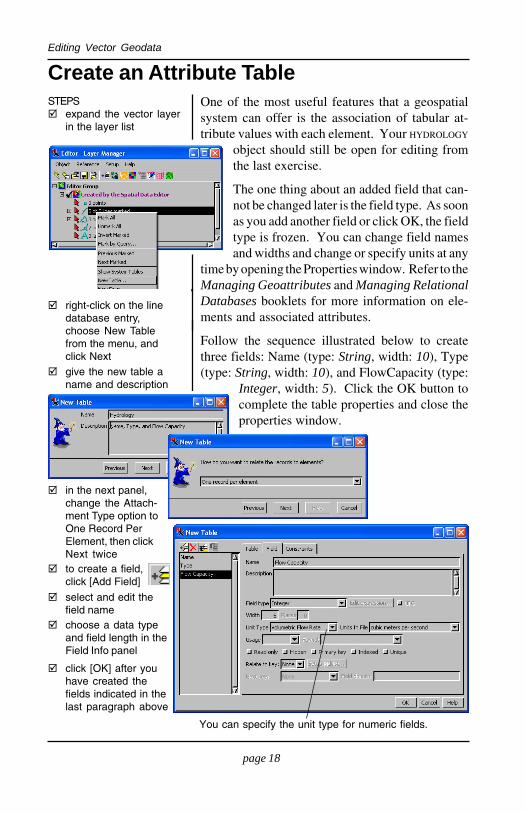
click [OK] after youhave created thefields indicated in thelast paragraph above
right-click on the linedatabase entry,choose New Tablefrom the menu, andclick Next
give the new table aname and description
to create a field,click [Add Field]
STEPS expand the vector layer
in the layer list
choose a data typeand field length in theField Info panel
in the next panel,change the Attach-ment Type option toOne Record PerElement, then clickNext twice
select and edit thefield name
You can specify the unit type for numeric fields.
One of the most useful features that a geospatialsystem can offer is the association of tabular at-tribute values with each element. Your HYDROLOGY
object should still be open for editing fromthe last exercise.
The one thing about an added field that can-not be changed later is the field type. As soonas you add another field or click OK, the fieldtype is frozen. You can change field namesand widths and change or specify units at any
time by opening the Properties window. Refer to theManaging Geoattributes and Managing RelationalDatabases booklets for more information on ele-ments and associated attributes.
Follow the sequence illustrated below to createthree fields: Name (type: String, width: 10), Type(type: String, width: 10), and FlowCapacity (type:
Integer, width: 5). Click the OK button tocomplete the table properties and close theproperties window.
page 19
Editing Vector Geodata
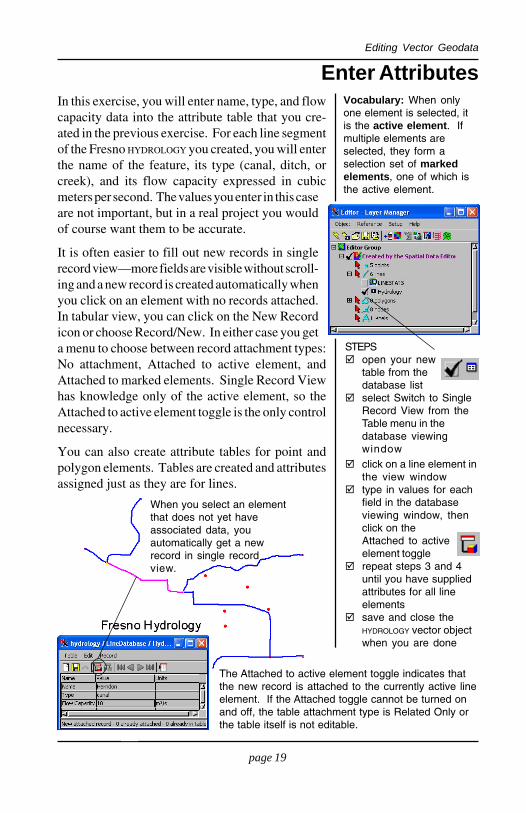
Enter AttributesIn this exercise, you will enter name, type, and flowcapacity data into the attribute table that you cre-ated in the previous exercise. For each line segmentof the Fresno HYDROLOGY you created, you will enterthe name of the feature, its type (canal, ditch, orcreek), and its flow capacity expressed in cubicmeters per second. The values you enter in this caseare not important, but in a real project you wouldof course want them to be accurate.
It is often easier to fill out new records in singlerecord view—more fields are visible without scroll-ing and a new record is created automatically whenyou click on an element with no records attached.In tabular view, you can click on the New Recordicon or choose Record/New. In either case you geta menu to choose between record attachment types:No attachment, Attached to active element, andAttached to marked elements. Single Record Viewhas knowledge only of the active element, so theAttached to active element toggle is the only controlnecessary.
You can also create attribute tables for point andpolygon elements. Tables are created and attributesassigned just as they are for lines.
click on a line element inthe view window
type in values for eachfield in the databaseviewing window, thenclick on theAttached to activeelement toggle
repeat steps 3 and 4until you have suppliedattributes for all lineelements
save and close theHYDROLOGY vector objectwhen you are done
STEPS open your new
table from thedatabase list
select Switch to SingleRecord View from theTable menu in thedatabase viewingwindow
The Attached to active element toggle indicates thatthe new record is attached to the currently active lineelement. If the Attached toggle cannot be turned onand off, the table attachment type is Related Only orthe table itself is not editable.
When you select an elementthat does not yet haveassociated data, youautomatically get a newrecord in single recordview.
Vocabulary: When onlyone element is selected, itis the active element. Ifmultiple elements areselected, they form aselection set of markedelements, one of which isthe active element.
page 20
Editing Vector Geodata
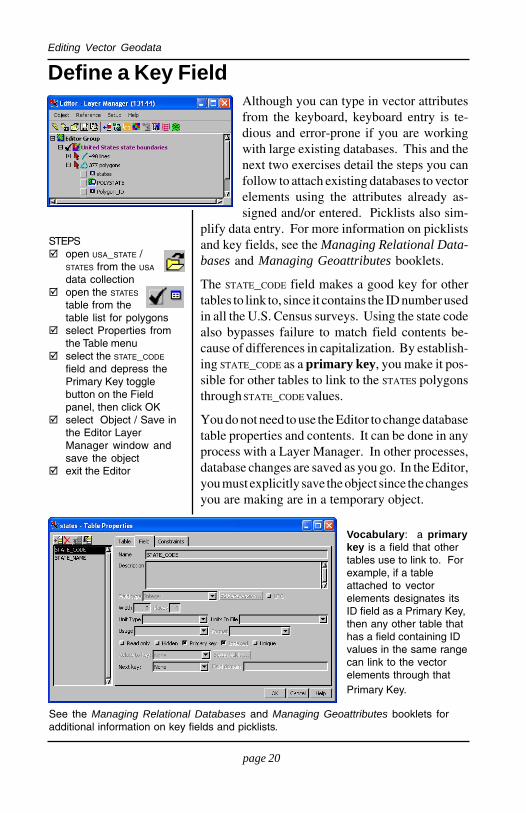
Define a Key FieldAlthough you can type in vector attributesfrom the keyboard, keyboard entry is te-dious and error-prone if you are workingwith large existing databases. This and thenext two exercises detail the steps you canfollow to attach existing databases to vectorelements using the attributes already as-signed and/or entered. Picklists also sim-
plify data entry. For more information on picklistsand key fields, see the Managing Relational Data-bases and Managing Geoattributes booklets.
The STATE_CODE field makes a good key for othertables to link to, since it contains the ID number usedin all the U.S. Census surveys. Using the state codealso bypasses failure to match field contents be-cause of differences in capitalization. By establish-ing STATE_CODE as a primary key, you make it pos-sible for other tables to link to the STATES polygonsthrough STATE_CODE values.
You do not need to use the Editor to change databasetable properties and contents. It can be done in anyprocess with a Layer Manager. In other processes,database changes are saved as you go. In the Editor,you must explicitly save the object since the changesyou are making are in a temporary object.
Vocabulary: a primarykey is a field that othertables use to link to. Forexample, if a tableattached to vectorelements designates itsID field as a Primary Key,then any other table thathas a field containing IDvalues in the same rangecan link to the vectorelements through thatPrimary Key.
STEPS open USA_STATE /
STATES from the USA
data collection open the STATES
table from thetable list for polygons
select Properties fromthe Table menu
select the STATE_CODE
field and depress thePrimary Key togglebutton on the Fieldpanel, then click OK
select Object / Save inthe Editor LayerManager window andsave the object
exit the Editor
Choose a fieldand make it a key.
See the Managing Relational Databases and Managing Geoattributes booklets foradditional information on key fields and picklists.
page 21
Editing Vector Geodata
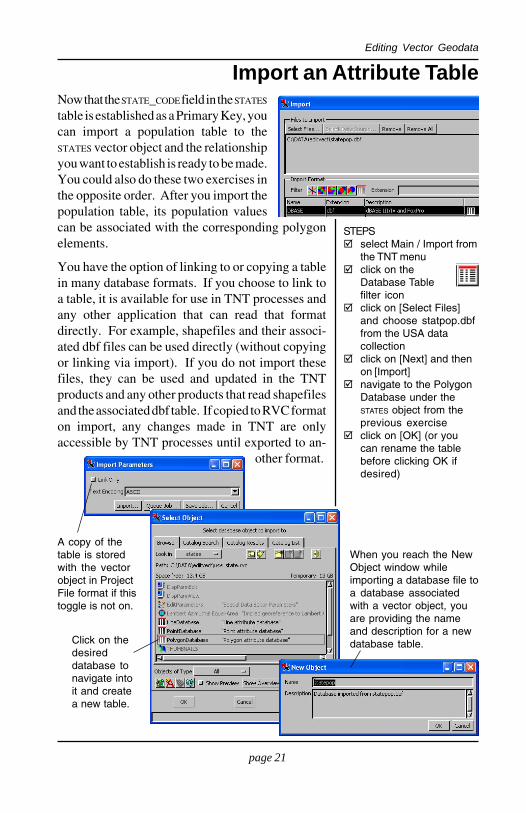
Import an Attribute TableNow that the STATE_CODE field in the STATES
table is established as a Primary Key, youcan import a population table to theSTATES vector object and the relationshipyou want to establish is ready to be made.You could also do these two exercises inthe opposite order. After you import thepopulation table, its population valuescan be associated with the corresponding polygonelements.
You have the option of linking to or copying a tablein many database formats. If you choose to link toa table, it is available for use in TNT processes andany other application that can read that formatdirectly. For example, shapefiles and their associ-ated dbf files can be used directly (without copyingor linking via import). If you do not import thesefiles, they can be used and updated in the TNTproducts and any other products that read shapefilesand the associated dbf table. If copied to RVC formaton import, any changes made in TNT are onlyaccessible by TNT processes until exported to an-
other format.
STEPS select Main / Import from
the TNT menu click on the
Database Tablefilter icon
click on [Select Files]and choose statpop.dbffrom the USA datacollection
click on [Next] and thenon [Import]
navigate to the PolygonDatabase under theSTATES object from theprevious exercise
click on [OK] (or youcan rename the tablebefore clicking OK ifdesired)
A copy of thetable is storedwith the vectorobject in ProjectFile format if thistoggle is not on.
Click on thedesireddatabase tonavigate intoit and createa new table.
When you reach the NewObject window whileimporting a database file toa database associatedwith a vector object, youare providing the nameand description for a newdatabase table.
page 22
Editing Vector Geodata
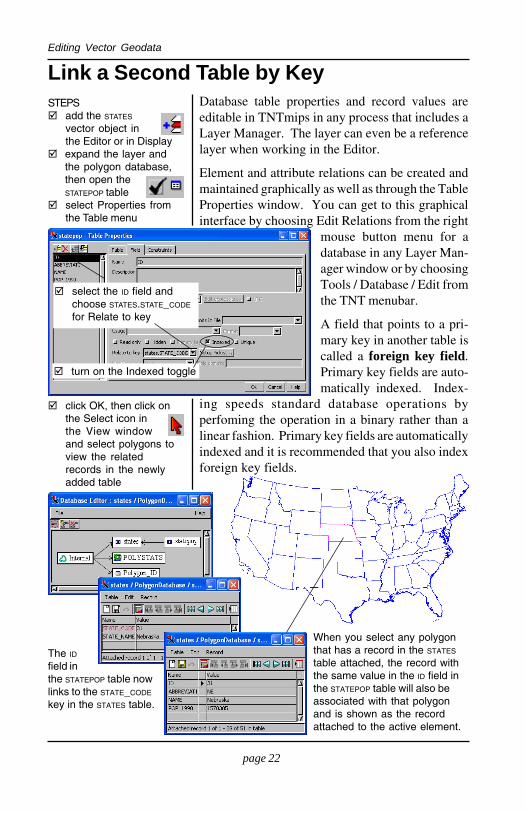
Link a Second Table by KeyDatabase table properties and record values areeditable in TNTmips in any process that includes aLayer Manager. The layer can even be a referencelayer when working in the Editor.
Element and attribute relations can be created andmaintained graphically as well as through the TableProperties window. You can get to this graphicalinterface by choosing Edit Relations from the right
mouse button menu for adatabase in any Layer Man-ager window or by choosingTools / Database / Edit fromthe TNT menubar.
A field that points to a pri-mary key in another table iscalled a foreign key field.Primary key fields are auto-matically indexed. Index-
ing speeds standard database operations byperfoming the operation in a binary rather than alinear fashion. Primary key fields are automaticallyindexed and it is recommended that you also indexforeign key fields.
The IDfield inthe STATEPOP table nowlinks to the STATE_CODE
key in the STATES table.
STEPS add the STATES
vector object inthe Editor or in Display
expand the layer andthe polygon database,then open theSTATEPOP table
select Properties fromthe Table menu
select the ID field andchoose STATES.STATE_CODE
for Relate to key
turn on the Indexed toggle
click OK, then click onthe Select icon inthe View windowand select polygons toview the relatedrecords in the newlyadded table
When you select any polygonthat has a record in the STATES
table attached, the record withthe same value in the ID field inthe STATEPOP table will also beassociated with that polygonand is shown as the recordattached to the active element.
page 23
Editing Vector Geodata
Where Next?
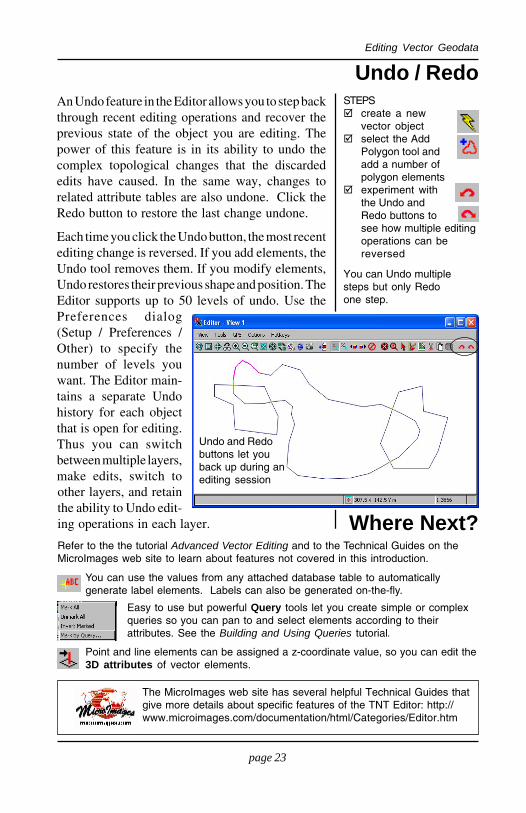
An Undo feature in the Editor allows you to step backthrough recent editing operations and recover theprevious state of the object you are editing. Thepower of this feature is in its ability to undo thecomplex topological changes that the discardededits have caused. In the same way, changes torelated attribute tables are also undone. Click theRedo button to restore the last change undone.
Each time you click the Undo button, the most recentediting change is reversed. If you add elements, theUndo tool removes them. If you modify elements,Undo restores their previous shape and position. TheEditor supports up to 50 levels of undo. Use thePreferences dialog(Setup / Preferences /Other) to specify thenumber of levels youwant. The Editor main-tains a separate Undohistory for each objectthat is open for editing.Thus you can switchbetween multiple layers,make edits, switch to
Easy to use but powerful Query tools let you create simple or complexqueries so you can pan to and select elements according to theirattributes. See the Building and Using Queries tutorial.
Point and line elements can be assigned a z-coordinate value, so you can edit the3D attributes of vector elements.
You can use the values from any attached database table to automaticallygenerate label elements. Labels can also be generated on-the-fly.
Undo / RedoSTEPS create a new
vector object select the Add
Polygon tool andadd a number ofpolygon elements
experiment withthe Undo andRedo buttons tosee how multiple editingoperations can bereversed
The MicroImages web site has several helpful Technical Guides thatgive more details about specific features of the TNT Editor: http://www.microimages.com/documentation/html/Categories/Editor.htm
Undo and Redobuttons let youback up during anediting session
Refer to the the tutorial Advanced Vector Editing and to the Technical Guides on theMicroImages web site to learn about features not covered in this introduction.
other layers, and retainthe ability to Undo edit-ing operations in each layer.
You can Undo multiplesteps but only Redoone step.
page 24
Editing Vector GeodataAdvanced Software for Geospatial Analysis EDIT
VECTORS
www.microimages.com
Indexactive element ............................ 3, 11, 19add label tool ........................................ 17add line tool ........................................ 7, 8add point tool ........................................ 1 5add polygon tool ................................... 16attachment type ..................................... 1 8attribute tables ................................. 18–22autosave .................................................... 9clear button .............................................. 8create new object ..................................... 5dangling line ................................... 13, 14delete element ....................................... 14Draw mode ............................................... 7Edit Element ................................... 10–11editable layer ............................................ 4foreign key field ................................... 2 2gaps ........................................................ 13georeference ............................................ 5hotkeys ..................................................... 9import attributes ................................... 21index (fields) ......................................... 22insert, delete, drag vertex ......... 7, 11, 12key field .................................... 20, 21, 22
labels ................................................ 17, 23Line / Polygon Edit Controls ................. 7line style .................................................... 6link tables ........................................ 21, 22marked elements ............................... 3, 19new object values dialog ........................ 5overshoots ............................................. 14primary key .............................. 20, 21, 22prototype elements .................................. 8query ....................................................... 2 3reference layer .................................... 3, 4relating attribute tables ......................... 2 2selected element ......................... 3, 10, 11snap lines ......................................... 11, 13Stretch mode ............................................ 7styles ............................................ 6, 15, 17table properties ............................... 20, 22tool color .................................................. 8undo / redo ............................................ 23vector topology .................................... 16vertex ................................................... 7, 8zoom and pan .......................................... 9
MicroImages, Inc.¤
MicroImages, Inc. publishes a complete line of professional software for advancedgeospatial data visualization, analysis, and publishing. Contact us or visit our website for detailed product information.TNTmips Proanalysis, CAD, TIN, desktop cartography, and geospatial database management.
TNTmips Basic TNTmips Basic is a low-cost version of TNTmips for small projects.
TNTmips Free TNTmips Free is a free version of TNTmips for students and profession-als with small projects. You can download TNTmips Free from MicroImages’ web site.
TNTedit TNTedit provides interactive tools to create, georeference, and edit vector, image,CAD, TIN, and relational database project materials in a wide variety of formats.
TNTview TNTview has the same powerful display features as TNTmips and is perfect forthose who do not need the technical processing and preparation features of TNTmips.
TNTatlas TNTatlas lets you publish and distribute your spatial project materials on CD orDVD at low cost. TNTatlas CDs/DVDs can be used on any popular computing platform.