Embed Size (px)
Citation preview
204/2016 - 21 October 2016
Provision of deficit and debt data for 2015 - second notification
Euro area and EU28 government deficit at 2.1% and 2.4% of GDP respectively Government debt at 90.4% and 85.0%
In 2015, the government deficit and debt of both the euro area (EA19) and the EU28 decreased in relative terms
compared with 2014. In the euro area the government deficit to GDP ratio fell from 2.6% in 2014 to 2.1% in 2015,
and in the EU28 from 3.0% to 2.4%. In the euro area the government debt to GDP ratio declined from 92.0% at the
end of 2014 to 90.4% at the end of 2015, and in the EU28 from 86.7% to 85.0%.
In this release, Eurostat, the statistical office of the European Union, is providing government deficit and debt
data based on figures reported in the second 2016 notification by EU Member States for the years 2012-2015, for
the application of the excessive deficit procedure (EDP). This notification is based on the ESA 2010 system of
national accounts. This release also includes data on government expenditure and revenue.
2012 2013 2014 2015
Euro area (EA19)
GDP market prices (mp) (million euro) 9 835 733 9 932 136 10 133 243 10 455 774
Government deficit (-) / surplus (+) (million euro) -357 885 -294 253 -261 211 -214 962
(% of GDP) -3.6 -3.0 -2.6 -2.1
Government expenditure (% of GDP) 49.7 49.7 49.4 48.5
Government revenue (% of GDP) 46.1 46.7 46.8 46.5
Government debt (million euro) 8 798 628 9 072 295 9 326 349 9 449 336
(% of GDP) 89.5 91.3 92.0 90.4
EU28
GDP market prices (mp) (million euro) 13 447 007 13 555 150 13 996 021 14 702 097
Government deficit (-) / surplus (+) (million euro) -572 173 -445 087 -418 997 -347 618
(% of GDP) -4.3 -3.3 -3.0 -2.4
Government expenditure (% of GDP) 49.0 48.7 48.1 47.3
Government revenue (% of GDP) 44.7 45.4 45.2 44.9
Government debt (million euro) 11 268 771 11 615 719 12 140 632 12 494 504
(% of GDP) 83.8 85.7 86.7 85.0
In 2015, Luxembourg (+1.6%), Germany (+0.7%), Sweden (+0.2%) and Estonia (+0.1%) registered a
government surplus. The lowest government deficits as a percentage of GDP were recorded in Lithuania (-0.2%),
the Czech Republic (-0.6%), Romania (-0.8%) and Austria (-1.0%). Six Member States had deficits equal to or
higher than 3% of GDP: Greece (-7.5%), Spain (-5.1%), Portugal (-4.4%), the United Kingdom (-4.3%), France
(-3.5%) and Croatia (-3.3%).
At the end of 2015, the lowest ratios of government debt to GDP were recorded in Estonia (10.1%), Luxembourg
(22.1%), Bulgaria (26.0%), Latvia (36.3%) and Romania (37.9%). Seventeen Member States had government
debt ratios higher than 60% of GDP, with the highest registered in Greece (177.4%), Italy (132.3%), Portugal
(129.0%), Cyprus (107.5%) and Belgium (105.8%).
In 2015, government expenditure in the euro area was equivalent to 48.5% of GDP and government revenue to
46.5%. The figures for the EU28 were 47.3% and 44.9% respectively. In both zones, the government expenditure
and government revenue ratios decreased between 2014 and 2015.
Reservations on reported data
Cyprus: Eurostat is expressing a reservation on the quality of the data reported by Cyprus in relation to a series of technical issues, such as the recording of EU flows, the basis for the working balance of central government, incomplete use of source data for accrual reporting and the absence of reporting of statistical discrepancy in EDP tables, which were not clarified in a satisfactory manner during the October 2016 data assessment. Eurostat will investigate these issues with the Cypriot statistical authorities.
Belgium: Eurostat is maintaining the reservation on the quality of the data reported by Belgium in relation to the sector classification of hospitals. Eurostat considers that, in line with ESA 2010, government controlled hospitals in Belgium should be classified inside government. This is currently not the case. A future reclassification will most likely result in a limited increase in government debt.
Hungary: Eurostat is maintaining the reservation on the quality of the data reported by Hungary in relation to the sector classification of Eximbank (Hungarian Export-Import Bank Plc). Eximbank needs to be reclassified inside the general government sector which will result in an increase in government debt. Moreover, Eurostat is discussing with the Hungarian statistical authorities the possible rerouting of operations carried out by the Hungarian National Bank, deemed to be undertaken on behalf of government.
France: Eurostat is withdrawing the reservations on the quality of the data reported by France in relation to (1) the classification of the French Deposit Guarantee and Resolution Funds (Fonds de Garantie des Dépôts et de Résolution - FGDR), as the entity has been reclassified by INSEE inside government and (2) the recording chosen by INSEE of settlements costs related to the restructuring of complex debt instruments issued by local government, pending the results of ongoing consultations on this issue at EU level.
Amendment by Eurostat to reported data
Eurostat has made no amendments to the data reported by Member States.
Issued by: Eurostat Press Office
Tim ALLEN Tel: +352-4301-33 444
Media requests: Eurostat media support
Tel: +352-4301-33 408
ec.europa.eu/eurostat/
@EU_Eurostat
Geographical information
Euro area (EA19): Belgium, Germany, Estonia, Ireland, Greece, Spain, France, Italy, Cyprus, Latvia, Lithuania, Luxembourg,
Malta, Netherlands, Austria, Portugal, Slovenia, Slovakia and Finland. In the attached table, the euro area is defined as including Latvia and Lithuania for the full period, although Latvia joined the euro area on 1 January 2014 and Lithuania on 1 January 2015.
Up to 30 June 2013, the European Union (EU27) included 27 Member States. From 1 July 2013 the European Union (EU28)
also includes Croatia. In the attached table, all periods refer to the EU28.
Methods and definitions
According to Article 14 (1) of Council Regulation (EC) 479/2009, Eurostat publishes the actual government deficit and debt data for the application of the Protocol on the excessive deficit procedure, within three weeks after the reporting deadlines.
The Protocol on the excessive deficit procedure annexed to the EC Treaty, defines government deficit (surplus) as the net
borrowing (net lending) of the whole general government sector (central government, state government, local government and social security funds). It is calculated according to national accounts concepts (European System of Accounts, ESA 2010). Government debt (commonly known as Maastricht or EDP debt) is the consolidated gross debt of the whole general
government sector outstanding at the end of the year (at nominal value).
Table of euro area and EU28 aggregates: the data are in euro. For those countries not belonging to the euro area, the rate of conversion into euro is as follows: - for deficit / surplus and GDP data, the annual average exchange rate; - for the stock of government debt, the end of year exchange rate.
Table of national data: the data are in national currencies. For Latvia and Lithuania, data for the years prior to the adoption of the euro have been converted into euro according to the irrevocable conversion rate.
Government expenditure and revenue are reported to Eurostat under the ESA 2010 transmission programme. They cover
non-financial transactions of general government, and include both current and capital transactions. For definitions, see Regulation (EU) No 549/2013 of the European Parliament and of the Council of 21 May 2013 on the European system of national and regional accounts in the European Union.
Intergovernmental lending
For the purpose of proper consolidation of general government debt in European aggregates and to provide users with information, Eurostat is collecting and publishing data on government loans to other EU governments, including those made through the European Financial Stability Facility (EFSF). For the years 2012 to 2015 the intergovernmental lending figures relate mainly to lending to Greece, Ireland and Portugal.
Valuation of debt instruments
Eurostat is currently reviewing, in co-operation with Member States, the valuation of certain debt instruments, such as non-negotiable saving and treasury certificates, for EDP purposes. This may lead to a future increase in government debt in some Member States due to the inclusion of accumulated capitalised interest under these instruments.
Reservations and amendments The term “reservations” is defined in article 15 (1) of Council Regulation (EC) 479/2009. The Commission (Eurostat) expresses
reservations when it has doubts on the quality of the reported data.
According to Article 15 (2) of Council Regulation (EC) 479/2009, the Commission (Eurostat) may amend actual data reported by
Member States and provide the amended data and a justification of the amendment where there is evidence that actual data reported by Member States do not comply with the quality requirements (compliance with accounting rules, completeness, reliability, timeliness and consistency of statistical data).
Revisions and timetable
In the previous provision of data for the excessive deficit procedure, the 2015 government deficit for the EA19 was 2.1% and for EU28 2.4% of GDP, and the government debt was 90.7% and 85.2% of GDP respectively. See News Release 76/2016 of 21 April 2016.
For more information
For further information on the methodology of statistics reported under the excessive deficit procedure, please see the Eurostat publication "Manual on government deficit and debt – Implementation of ESA 2010".
Background note and supplementary tables on government interventions to support financial institutions: Eurostat
publishes supplementary tables by Member State on the impact of the government support to financial institutions on its website. Eurostat also publishes a background note providing further information on the supplementary tables, including summary tables for the EU and the euro area. Table 2 of the background note shows government deficit/surplus data for 2014 and 2015 excluding the impacts of government interventions to support financial institutions. It should be noted that this adjusted measure of government deficit/surplus is only intended to be an improvement in the presentation of data for users.
Stock of liabilities of trade credits and advances: Eurostat publishes on its website, as complementary information on
government liabilities, data on trade credits and advances, as reported by Member States for the years 2012 to 2015. It should be noted that, according to Council Regulation (EC) 479/2009, the liabilities in trade credits and advances of government units are not part of EDP debt.
Stock-flow adjustment: Eurostat also publishes a note on the Stock-flow adjustment which presents the contribution of
deficit/surplus as well as other relevant factors to the variation in the debt level.
Eurostat will also be releasing information on the underlying government sector accounts on the government finance and EDP statistics section on its website.
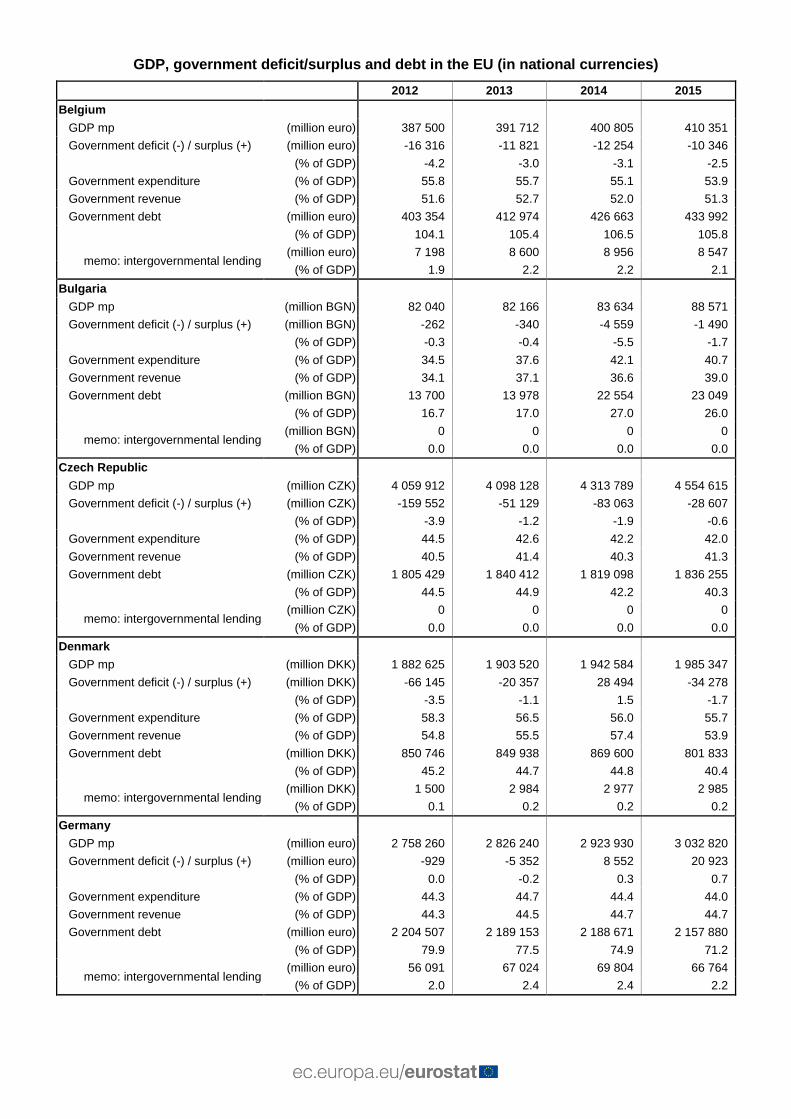
GDP, government deficit/surplus and debt in the EU (in national currencies)
2012 2013 2014 2015
Belgium
GDP mp (million euro) 387 500 391 712 400 805 410 351
Government deficit (-) / surplus (+) (million euro) -16 316 -11 821 -12 254 -10 346
(% of GDP) -4.2 -3.0 -3.1 -2.5
Government expenditure (% of GDP) 55.8 55.7 55.1 53.9
Government revenue (% of GDP) 51.6 52.7 52.0 51.3
Government debt (million euro) 403 354 412 974 426 663 433 992
(% of GDP) 104.1 105.4 106.5 105.8
memo: intergovernmental lending (million euro) 7 198 8 600 8 956 8 547
(% of GDP) 1.9 2.2 2.2 2.1
Bulgaria
GDP mp (million BGN) 82 040 82 166 83 634 88 571
Government deficit (-) / surplus (+) (million BGN) -262 -340 -4 559 -1 490
(% of GDP) -0.3 -0.4 -5.5 -1.7
Government expenditure (% of GDP) 34.5 37.6 42.1 40.7
Government revenue (% of GDP) 34.1 37.1 36.6 39.0
Government debt (million BGN) 13 700 13 978 22 554 23 049
(% of GDP) 16.7 17.0 27.0 26.0
memo: intergovernmental lending (million BGN) 0 0 0 0
(% of GDP) 0.0 0.0 0.0 0.0
Czech Republic
GDP mp (million CZK) 4 059 912 4 098 128 4 313 789 4 554 615
Government deficit (-) / surplus (+) (million CZK) -159 552 -51 129 -83 063 -28 607
(% of GDP) -3.9 -1.2 -1.9 -0.6
Government expenditure (% of GDP) 44.5 42.6 42.2 42.0
Government revenue (% of GDP) 40.5 41.4 40.3 41.3
Government debt (million CZK) 1 805 429 1 840 412 1 819 098 1 836 255
(% of GDP) 44.5 44.9 42.2 40.3
memo: intergovernmental lending (million CZK) 0 0 0 0
(% of GDP) 0.0 0.0 0.0 0.0
Denmark
GDP mp (million DKK) 1 882 625 1 903 520 1 942 584 1 985 347
Government deficit (-) / surplus (+) (million DKK) -66 145 -20 357 28 494 -34 278
(% of GDP) -3.5 -1.1 1.5 -1.7
Government expenditure (% of GDP) 58.3 56.5 56.0 55.7
Government revenue (% of GDP) 54.8 55.5 57.4 53.9
Government debt (million DKK) 850 746 849 938 869 600 801 833
(% of GDP) 45.2 44.7 44.8 40.4
memo: intergovernmental lending (million DKK) 1 500 2 984 2 977 2 985
(% of GDP) 0.1 0.2 0.2 0.2
Germany
GDP mp (million euro) 2 758 260 2 826 240 2 923 930 3 032 820
Government deficit (-) / surplus (+) (million euro) -929 -5 352 8 552 20 923
(% of GDP) 0.0 -0.2 0.3 0.7
Government expenditure (% of GDP) 44.3 44.7 44.4 44.0
Government revenue (% of GDP) 44.3 44.5 44.7 44.7
Government debt (million euro) 2 204 507 2 189 153 2 188 671 2 157 880
(% of GDP) 79.9 77.5 74.9 71.2
memo: intergovernmental lending (million euro) 56 091 67 024 69 804 66 764
(% of GDP) 2.0 2.4 2.4 2.2
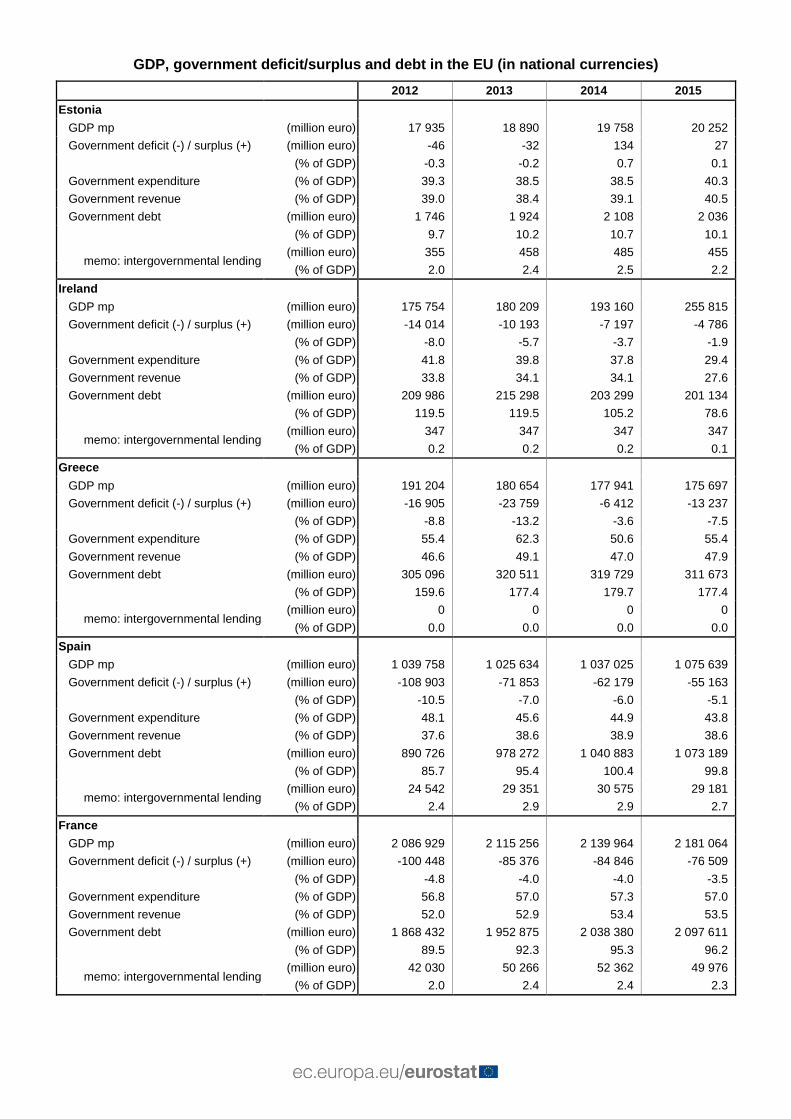
GDP, government deficit/surplus and debt in the EU (in national currencies)
2012 2013 2014 2015
Estonia
GDP mp (million euro) 17 935 18 890 19 758 20 252
Government deficit (-) / surplus (+) (million euro) -46 -32 134 27
(% of GDP) -0.3 -0.2 0.7 0.1
Government expenditure (% of GDP) 39.3 38.5 38.5 40.3
Government revenue (% of GDP) 39.0 38.4 39.1 40.5
Government debt (million euro) 1 746 1 924 2 108 2 036
(% of GDP) 9.7 10.2 10.7 10.1
memo: intergovernmental lending (million euro) 355 458 485 455
(% of GDP) 2.0 2.4 2.5 2.2
Ireland
GDP mp (million euro) 175 754 180 209 193 160 255 815
Government deficit (-) / surplus (+) (million euro) -14 014 -10 193 -7 197 -4 786
(% of GDP) -8.0 -5.7 -3.7 -1.9
Government expenditure (% of GDP) 41.8 39.8 37.8 29.4
Government revenue (% of GDP) 33.8 34.1 34.1 27.6
Government debt (million euro) 209 986 215 298 203 299 201 134
(% of GDP) 119.5 119.5 105.2 78.6
memo: intergovernmental lending (million euro) 347 347 347 347
(% of GDP) 0.2 0.2 0.2 0.1
Greece
GDP mp (million euro) 191 204 180 654 177 941 175 697
Government deficit (-) / surplus (+) (million euro) -16 905 -23 759 -6 412 -13 237
(% of GDP) -8.8 -13.2 -3.6 -7.5
Government expenditure (% of GDP) 55.4 62.3 50.6 55.4
Government revenue (% of GDP) 46.6 49.1 47.0 47.9
Government debt (million euro) 305 096 320 511 319 729 311 673
(% of GDP) 159.6 177.4 179.7 177.4
memo: intergovernmental lending (million euro) 0 0 0 0
(% of GDP) 0.0 0.0 0.0 0.0
Spain
GDP mp (million euro) 1 039 758 1 025 634 1 037 025 1 075 639
Government deficit (-) / surplus (+) (million euro) -108 903 -71 853 -62 179 -55 163
(% of GDP) -10.5 -7.0 -6.0 -5.1
Government expenditure (% of GDP) 48.1 45.6 44.9 43.8
Government revenue (% of GDP) 37.6 38.6 38.9 38.6
Government debt (million euro) 890 726 978 272 1 040 883 1 073 189
(% of GDP) 85.7 95.4 100.4 99.8
memo: intergovernmental lending (million euro) 24 542 29 351 30 575 29 181
(% of GDP) 2.4 2.9 2.9 2.7
France
GDP mp (million euro) 2 086 929 2 115 256 2 139 964 2 181 064
Government deficit (-) / surplus (+) (million euro) -100 448 -85 376 -84 846 -76 509
(% of GDP) -4.8 -4.0 -4.0 -3.5
Government expenditure (% of GDP) 56.8 57.0 57.3 57.0
Government revenue (% of GDP) 52.0 52.9 53.4 53.5
Government debt (million euro) 1 868 432 1 952 875 2 038 380 2 097 611
(% of GDP) 89.5 92.3 95.3 96.2
memo: intergovernmental lending (million euro) 42 030 50 266 52 362 49 976
(% of GDP) 2.0 2.4 2.4 2.3
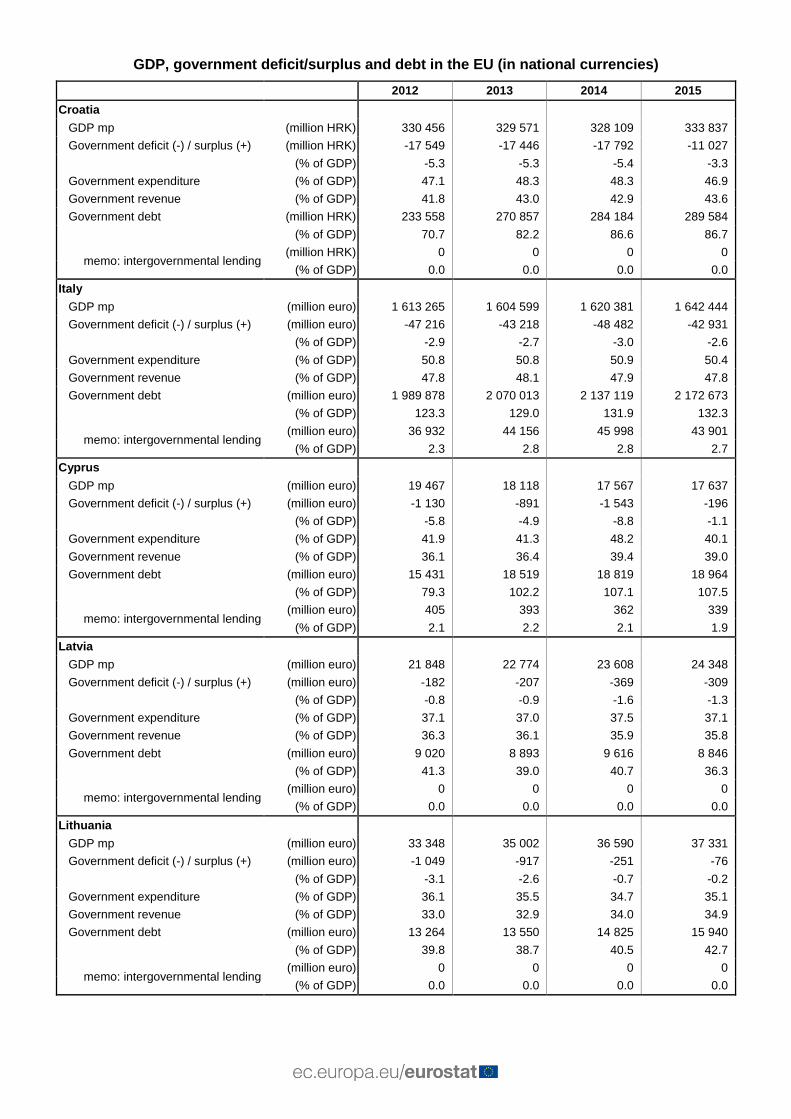
GDP, government deficit/surplus and debt in the EU (in national currencies)
2012 2013 2014 2015
Croatia
GDP mp (million HRK) 330 456 329 571 328 109 333 837
Government deficit (-) / surplus (+) (million HRK) -17 549 -17 446 -17 792 -11 027
(% of GDP) -5.3 -5.3 -5.4 -3.3
Government expenditure (% of GDP) 47.1 48.3 48.3 46.9
Government revenue (% of GDP) 41.8 43.0 42.9 43.6
Government debt (million HRK) 233 558 270 857 284 184 289 584
(% of GDP) 70.7 82.2 86.6 86.7
memo: intergovernmental lending (million HRK) 0 0 0 0
(% of GDP) 0.0 0.0 0.0 0.0
Italy
GDP mp (million euro) 1 613 265 1 604 599 1 620 381 1 642 444
Government deficit (-) / surplus (+) (million euro) -47 216 -43 218 -48 482 -42 931
(% of GDP) -2.9 -2.7 -3.0 -2.6
Government expenditure (% of GDP) 50.8 50.8 50.9 50.4
Government revenue (% of GDP) 47.8 48.1 47.9 47.8
Government debt (million euro) 1 989 878 2 070 013 2 137 119 2 172 673
(% of GDP) 123.3 129.0 131.9 132.3
memo: intergovernmental lending (million euro) 36 932 44 156 45 998 43 901
(% of GDP) 2.3 2.8 2.8 2.7
Cyprus
GDP mp (million euro) 19 467 18 118 17 567 17 637
Government deficit (-) / surplus (+) (million euro) -1 130 -891 -1 543 -196
(% of GDP) -5.8 -4.9 -8.8 -1.1
Government expenditure (% of GDP) 41.9 41.3 48.2 40.1
Government revenue (% of GDP) 36.1 36.4 39.4 39.0
Government debt (million euro) 15 431 18 519 18 819 18 964
(% of GDP) 79.3 102.2 107.1 107.5
memo: intergovernmental lending (million euro) 405 393 362 339
(% of GDP) 2.1 2.2 2.1 1.9
Latvia
GDP mp (million euro) 21 848 22 774 23 608 24 348
Government deficit (-) / surplus (+) (million euro) -182 -207 -369 -309
(% of GDP) -0.8 -0.9 -1.6 -1.3
Government expenditure (% of GDP) 37.1 37.0 37.5 37.1
Government revenue (% of GDP) 36.3 36.1 35.9 35.8
Government debt (million euro) 9 020 8 893 9 616 8 846
(% of GDP) 41.3 39.0 40.7 36.3
memo: intergovernmental lending (million euro) 0 0 0 0
(% of GDP) 0.0 0.0 0.0 0.0
Lithuania
GDP mp (million euro) 33 348 35 002 36 590 37 331
Government deficit (-) / surplus (+) (million euro) -1 049 -917 -251 -76
(% of GDP) -3.1 -2.6 -0.7 -0.2
Government expenditure (% of GDP) 36.1 35.5 34.7 35.1
Government revenue (% of GDP) 33.0 32.9 34.0 34.9
Government debt (million euro) 13 264 13 550 14 825 15 940
(% of GDP) 39.8 38.7 40.5 42.7
memo: intergovernmental lending (million euro) 0 0 0 0
(% of GDP) 0.0 0.0 0.0 0.0
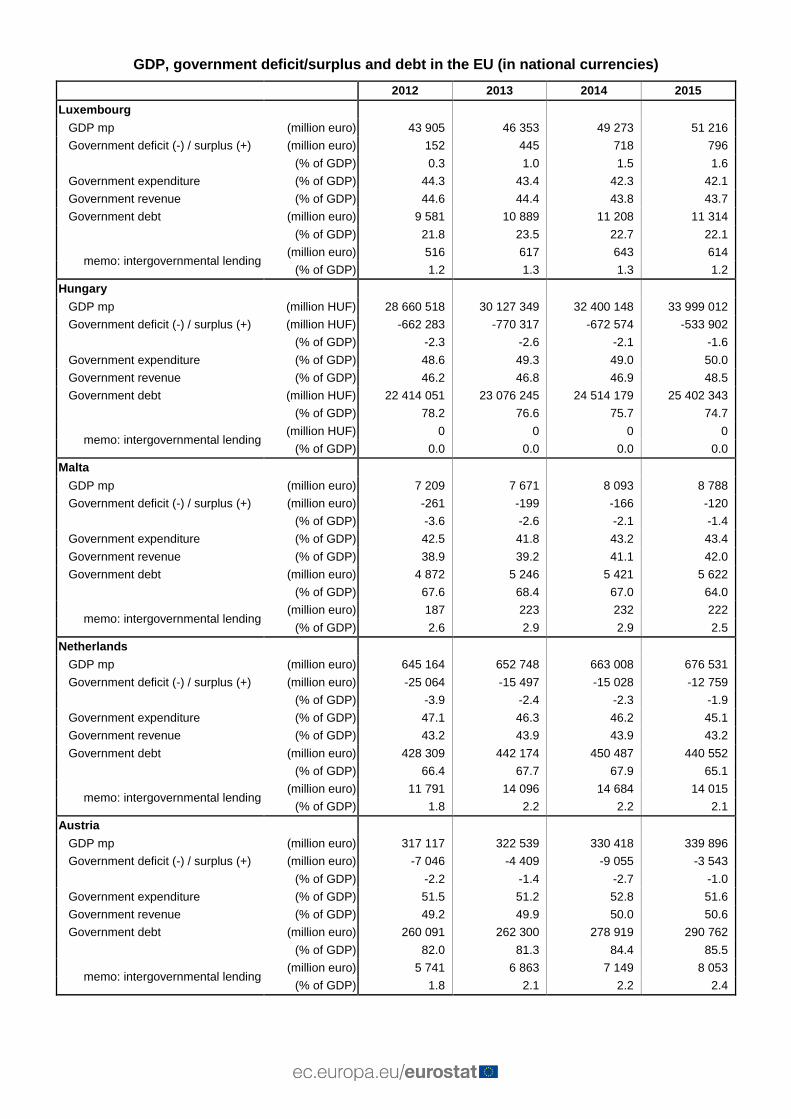
GDP, government deficit/surplus and debt in the EU (in national currencies)
2012 2013 2014 2015
Luxembourg
GDP mp (million euro) 43 905 46 353 49 273 51 216
Government deficit (-) / surplus (+) (million euro) 152 445 718 796
(% of GDP) 0.3 1.0 1.5 1.6
Government expenditure (% of GDP) 44.3 43.4 42.3 42.1
Government revenue (% of GDP) 44.6 44.4 43.8 43.7
Government debt (million euro) 9 581 10 889 11 208 11 314
(% of GDP) 21.8 23.5 22.7 22.1
memo: intergovernmental lending (million euro) 516 617 643 614
(% of GDP) 1.2 1.3 1.3 1.2
Hungary
GDP mp (million HUF) 28 660 518 30 127 349 32 400 148 33 999 012
Government deficit (-) / surplus (+) (million HUF) -662 283 -770 317 -672 574 -533 902
(% of GDP) -2.3 -2.6 -2.1 -1.6
Government expenditure (% of GDP) 48.6 49.3 49.0 50.0
Government revenue (% of GDP) 46.2 46.8 46.9 48.5
Government debt (million HUF) 22 414 051 23 076 245 24 514 179 25 402 343
(% of GDP) 78.2 76.6 75.7 74.7
memo: intergovernmental lending (million HUF) 0 0 0 0
(% of GDP) 0.0 0.0 0.0 0.0
Malta
GDP mp (million euro) 7 209 7 671 8 093 8 788
Government deficit (-) / surplus (+) (million euro) -261 -199 -166 -120
(% of GDP) -3.6 -2.6 -2.1 -1.4
Government expenditure (% of GDP) 42.5 41.8 43.2 43.4
Government revenue (% of GDP) 38.9 39.2 41.1 42.0
Government debt (million euro) 4 872 5 246 5 421 5 622
(% of GDP) 67.6 68.4 67.0 64.0
memo: intergovernmental lending (million euro) 187 223 232 222
(% of GDP) 2.6 2.9 2.9 2.5
Netherlands
GDP mp (million euro) 645 164 652 748 663 008 676 531
Government deficit (-) / surplus (+) (million euro) -25 064 -15 497 -15 028 -12 759
(% of GDP) -3.9 -2.4 -2.3 -1.9
Government expenditure (% of GDP) 47.1 46.3 46.2 45.1
Government revenue (% of GDP) 43.2 43.9 43.9 43.2
Government debt (million euro) 428 309 442 174 450 487 440 552
(% of GDP) 66.4 67.7 67.9 65.1
memo: intergovernmental lending (million euro) 11 791 14 096 14 684 14 015
(% of GDP) 1.8 2.2 2.2 2.1
Austria
GDP mp (million euro) 317 117 322 539 330 418 339 896
Government deficit (-) / surplus (+) (million euro) -7 046 -4 409 -9 055 -3 543
(% of GDP) -2.2 -1.4 -2.7 -1.0
Government expenditure (% of GDP) 51.5 51.2 52.8 51.6
Government revenue (% of GDP) 49.2 49.9 50.0 50.6
Government debt (million euro) 260 091 262 300 278 919 290 762
(% of GDP) 82.0 81.3 84.4 85.5
memo: intergovernmental lending (million euro) 5 741 6 863 7 149 8 053
(% of GDP) 1.8 2.1 2.2 2.4
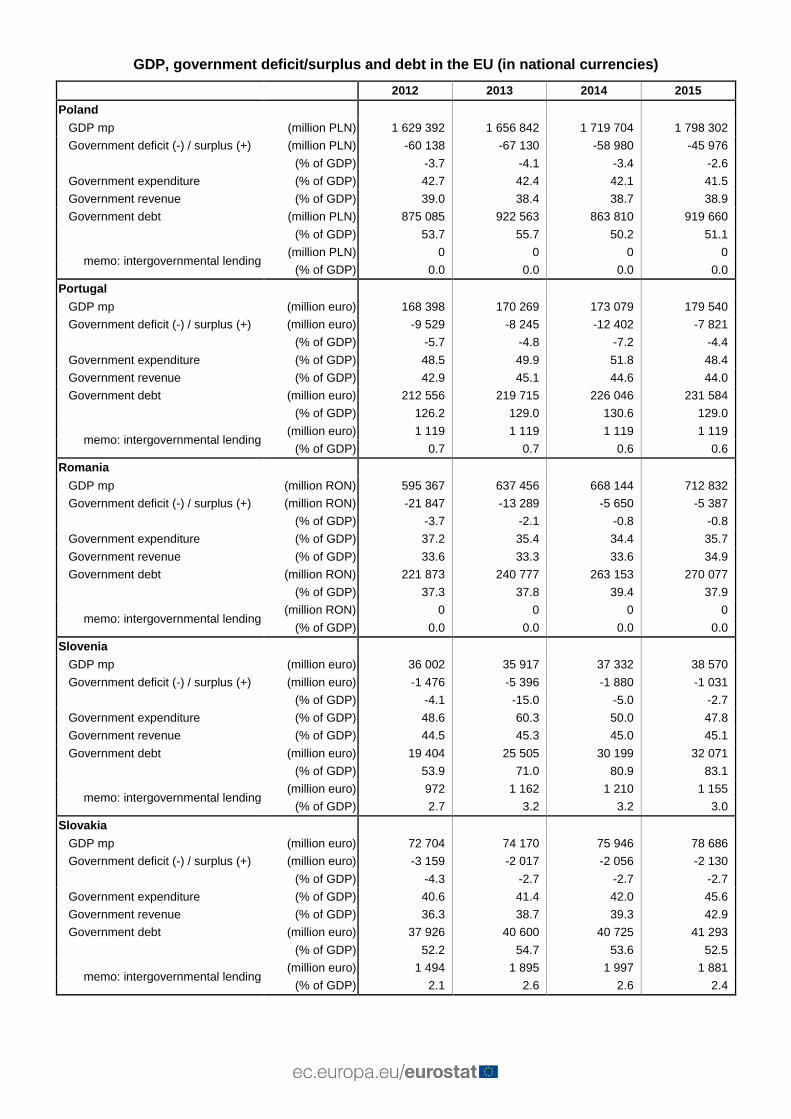
GDP, government deficit/surplus and debt in the EU (in national currencies)
2012 2013 2014 2015
Poland
GDP mp (million PLN) 1 629 392 1 656 842 1 719 704 1 798 302
Government deficit (-) / surplus (+) (million PLN) -60 138 -67 130 -58 980 -45 976
(% of GDP) -3.7 -4.1 -3.4 -2.6
Government expenditure (% of GDP) 42.7 42.4 42.1 41.5
Government revenue (% of GDP) 39.0 38.4 38.7 38.9
Government debt (million PLN) 875 085 922 563 863 810 919 660
(% of GDP) 53.7 55.7 50.2 51.1
memo: intergovernmental lending (million PLN) 0 0 0 0
(% of GDP) 0.0 0.0 0.0 0.0
Portugal
GDP mp (million euro) 168 398 170 269 173 079 179 540
Government deficit (-) / surplus (+) (million euro) -9 529 -8 245 -12 402 -7 821
(% of GDP) -5.7 -4.8 -7.2 -4.4
Government expenditure (% of GDP) 48.5 49.9 51.8 48.4
Government revenue (% of GDP) 42.9 45.1 44.6 44.0
Government debt (million euro) 212 556 219 715 226 046 231 584
(% of GDP) 126.2 129.0 130.6 129.0
memo: intergovernmental lending (million euro) 1 119 1 119 1 119 1 119
(% of GDP) 0.7 0.7 0.6 0.6
Romania
GDP mp (million RON) 595 367 637 456 668 144 712 832
Government deficit (-) / surplus (+) (million RON) -21 847 -13 289 -5 650 -5 387
(% of GDP) -3.7 -2.1 -0.8 -0.8
Government expenditure (% of GDP) 37.2 35.4 34.4 35.7
Government revenue (% of GDP) 33.6 33.3 33.6 34.9
Government debt (million RON) 221 873 240 777 263 153 270 077
(% of GDP) 37.3 37.8 39.4 37.9
memo: intergovernmental lending (million RON) 0 0 0 0
(% of GDP) 0.0 0.0 0.0 0.0
Slovenia
GDP mp (million euro) 36 002 35 917 37 332 38 570
Government deficit (-) / surplus (+) (million euro) -1 476 -5 396 -1 880 -1 031
(% of GDP) -4.1 -15.0 -5.0 -2.7
Government expenditure (% of GDP) 48.6 60.3 50.0 47.8
Government revenue (% of GDP) 44.5 45.3 45.0 45.1
Government debt (million euro) 19 404 25 505 30 199 32 071
(% of GDP) 53.9 71.0 80.9 83.1
memo: intergovernmental lending (million euro) 972 1 162 1 210 1 155
(% of GDP) 2.7 3.2 3.2 3.0
Slovakia
GDP mp (million euro) 72 704 74 170 75 946 78 686
Government deficit (-) / surplus (+) (million euro) -3 159 -2 017 -2 056 -2 130
(% of GDP) -4.3 -2.7 -2.7 -2.7
Government expenditure (% of GDP) 40.6 41.4 42.0 45.6
Government revenue (% of GDP) 36.3 38.7 39.3 42.9
Government debt (million euro) 37 926 40 600 40 725 41 293
(% of GDP) 52.2 54.7 53.6 52.5
memo: intergovernmental lending (million euro) 1 494 1 895 1 997 1 881
(% of GDP) 2.1 2.6 2.6 2.4
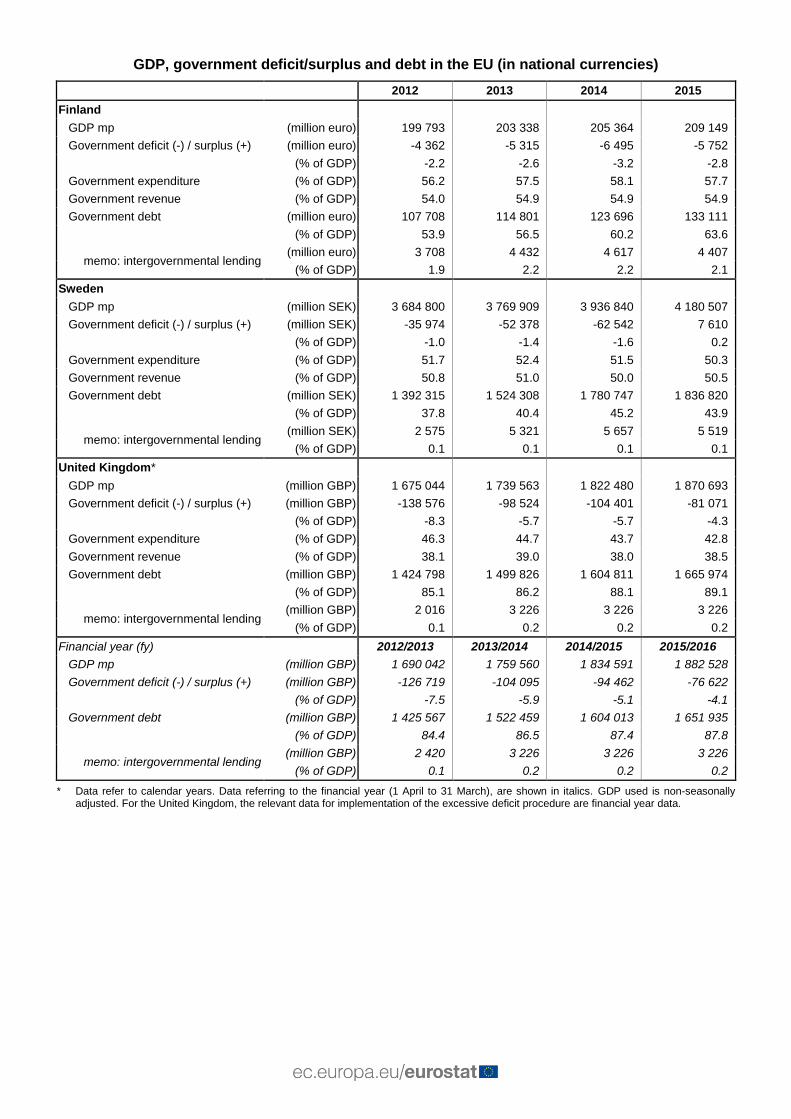
GDP, government deficit/surplus and debt in the EU (in national currencies)
2012 2013 2014 2015
Finland
GDP mp (million euro) 199 793 203 338 205 364 209 149
Government deficit (-) / surplus (+) (million euro) -4 362 -5 315 -6 495 -5 752
(% of GDP) -2.2 -2.6 -3.2 -2.8
Government expenditure (% of GDP) 56.2 57.5 58.1 57.7
Government revenue (% of GDP) 54.0 54.9 54.9 54.9
Government debt (million euro) 107 708 114 801 123 696 133 111
(% of GDP) 53.9 56.5 60.2 63.6
memo: intergovernmental lending (million euro) 3 708 4 432 4 617 4 407
(% of GDP) 1.9 2.2 2.2 2.1
Sweden
GDP mp (million SEK) 3 684 800 3 769 909 3 936 840 4 180 507
Government deficit (-) / surplus (+) (million SEK) -35 974 -52 378 -62 542 7 610
(% of GDP) -1.0 -1.4 -1.6 0.2
Government expenditure (% of GDP) 51.7 52.4 51.5 50.3
Government revenue (% of GDP) 50.8 51.0 50.0 50.5
Government debt (million SEK) 1 392 315 1 524 308 1 780 747 1 836 820
(% of GDP) 37.8 40.4 45.2 43.9
memo: intergovernmental lending (million SEK) 2 575 5 321 5 657 5 519
(% of GDP) 0.1 0.1 0.1 0.1
United Kingdom*
GDP mp (million GBP) 1 675 044 1 739 563 1 822 480 1 870 693
Government deficit (-) / surplus (+) (million GBP) -138 576 -98 524 -104 401 -81 071
(% of GDP) -8.3 -5.7 -5.7 -4.3
Government expenditure (% of GDP) 46.3 44.7 43.7 42.8
Government revenue (% of GDP) 38.1 39.0 38.0 38.5
Government debt (million GBP) 1 424 798 1 499 826 1 604 811 1 665 974
(% of GDP) 85.1 86.2 88.1 89.1
memo: intergovernmental lending (million GBP) 2 016 3 226 3 226 3 226
(% of GDP) 0.1 0.2 0.2 0.2
Financial year (fy) 2012/2013 2013/2014 2014/2015 2015/2016
GDP mp (million GBP) 1 690 042 1 759 560 1 834 591 1 882 528
Government deficit (-) / surplus (+) (million GBP) -126 719 -104 095 -94 462 -76 622
(% of GDP) -7.5 -5.9 -5.1 -4.1
Government debt (million GBP) 1 425 567 1 522 459 1 604 013 1 651 935
(% of GDP) 84.4 86.5 87.4 87.8
memo: intergovernmental lending (million GBP) 2 420 3 226 3 226 3 226
(% of GDP) 0.1 0.2 0.2 0.2
* Data refer to calendar years. Data referring to the financial year (1 April to 31 March), are shown in italics. GDP used is non-seasonally adjusted. For the United Kingdom, the relevant data for implementation of the excessive deficit procedure are financial year data.
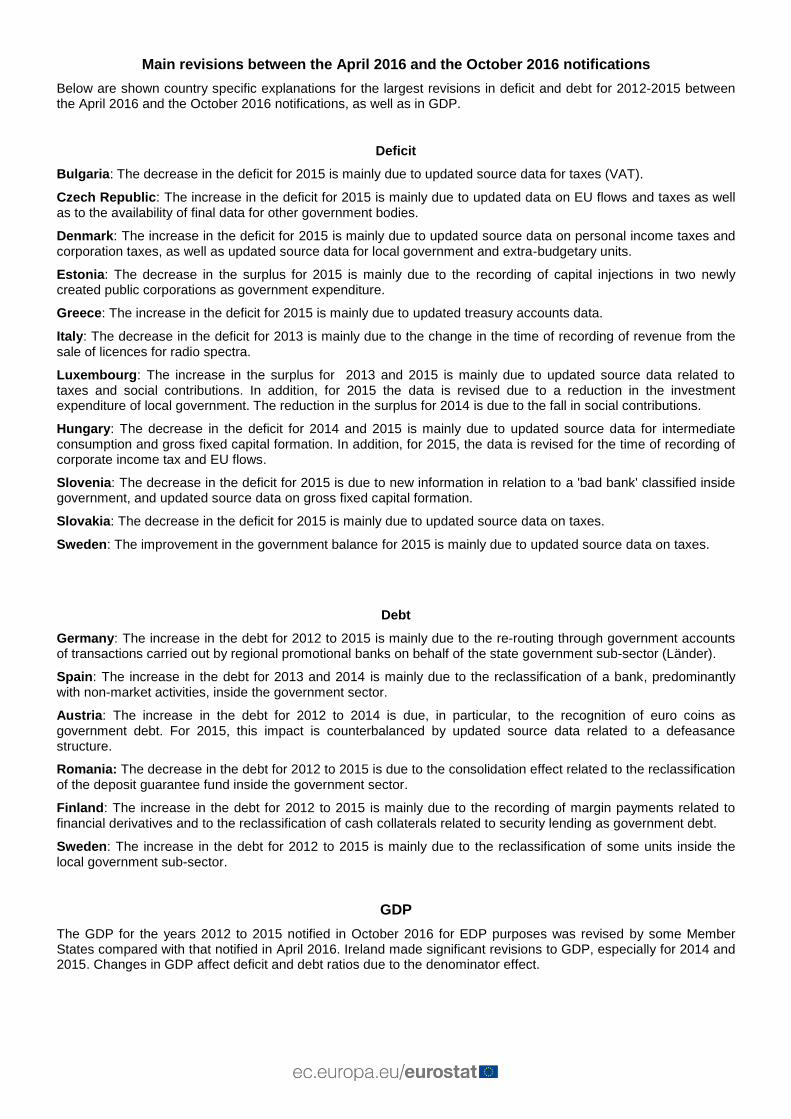
Main revisions between the April 2016 and the October 2016 notifications
Below are shown country specific explanations for the largest revisions in deficit and debt for 2012-2015 between the April 2016 and the October 2016 notifications, as well as in GDP.
Deficit
Bulgaria: The decrease in the deficit for 2015 is mainly due to updated source data for taxes (VAT).
Czech Republic: The increase in the deficit for 2015 is mainly due to updated data on EU flows and taxes as well as to the availability of final data for other government bodies.
Denmark: The increase in the deficit for 2015 is mainly due to updated source data on personal income taxes and corporation taxes, as well as updated source data for local government and extra-budgetary units.
Estonia: The decrease in the surplus for 2015 is mainly due to the recording of capital injections in two newly created public corporations as government expenditure.
Greece: The increase in the deficit for 2015 is mainly due to updated treasury accounts data.
Italy: The decrease in the deficit for 2013 is mainly due to the change in the time of recording of revenue from the sale of licences for radio spectra.
Luxembourg: The increase in the surplus for 2013 and 2015 is mainly due to updated source data related to taxes and social contributions. In addition, for 2015 the data is revised due to a reduction in the investment expenditure of local government. The reduction in the surplus for 2014 is due to the fall in social contributions.
Hungary: The decrease in the deficit for 2014 and 2015 is mainly due to updated source data for intermediate consumption and gross fixed capital formation. In addition, for 2015, the data is revised for the time of recording of corporate income tax and EU flows.
Slovenia: The decrease in the deficit for 2015 is due to new information in relation to a 'bad bank' classified inside government, and updated source data on gross fixed capital formation.
Slovakia: The decrease in the deficit for 2015 is mainly due to updated source data on taxes.
Sweden: The improvement in the government balance for 2015 is mainly due to updated source data on taxes.
Debt
Germany: The increase in the debt for 2012 to 2015 is mainly due to the re-routing through government accounts of transactions carried out by regional promotional banks on behalf of the state government sub-sector (Länder).
Spain: The increase in the debt for 2013 and 2014 is mainly due to the reclassification of a bank, predominantly with non-market activities, inside the government sector.
Austria: The increase in the debt for 2012 to 2014 is due, in particular, to the recognition of euro coins as government debt. For 2015, this impact is counterbalanced by updated source data related to a defeasance structure.
Romania: The decrease in the debt for 2012 to 2015 is due to the consolidation effect related to the reclassification of the deposit guarantee fund inside the government sector.
Finland: The increase in the debt for 2012 to 2015 is mainly due to the recording of margin payments related to financial derivatives and to the reclassification of cash collaterals related to security lending as government debt.
Sweden: The increase in the debt for 2012 to 2015 is mainly due to the reclassification of some units inside the local government sub-sector.
GDP
The GDP for the years 2012 to 2015 notified in October 2016 for EDP purposes was revised by some Member States compared with that notified in April 2016. Ireland made significant revisions to GDP, especially for 2014 and 2015. Changes in GDP affect deficit and debt ratios due to the denominator effect.
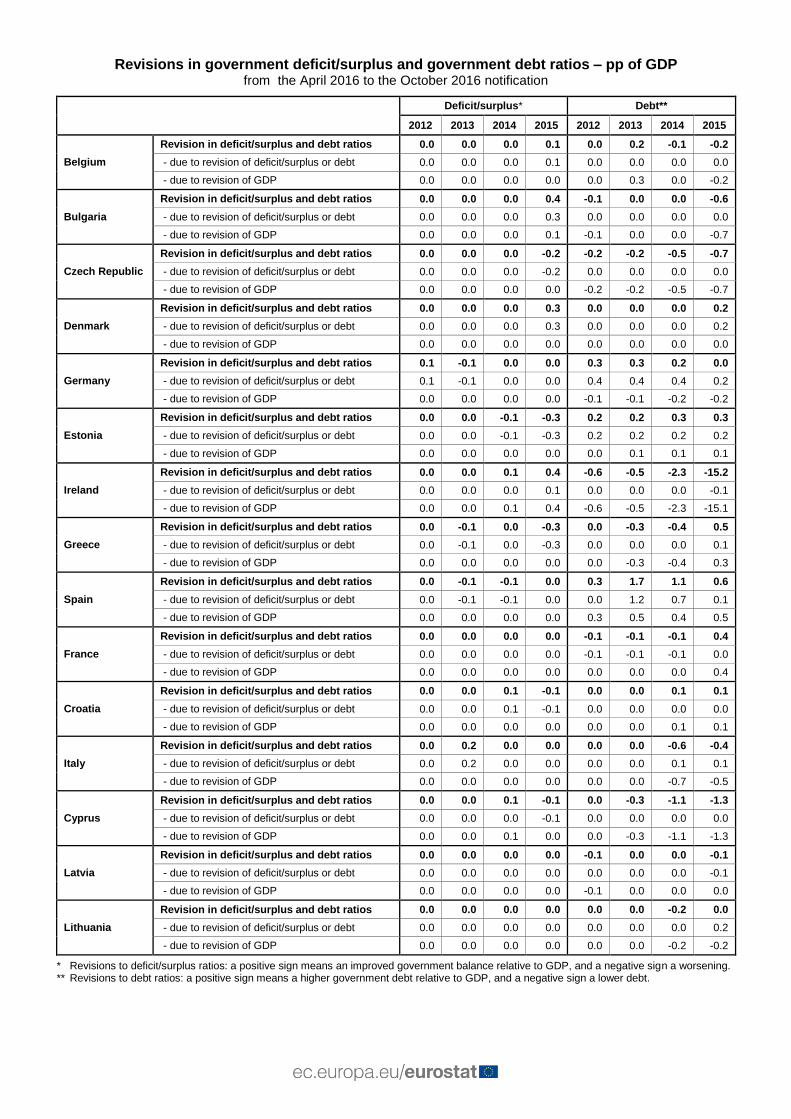
Revisions in government deficit/surplus and government debt ratios – pp of GDP from the April 2016 to the October 2016 notification
Deficit/surplus* Debt**
2012 2013 2014 2015 2012 2013 2014 2015
Belgium
Revision in deficit/surplus and debt ratios 0.0 0.0 0.0 0.1 0.0 0.2 -0.1 -0.2
- due to revision of deficit/surplus or debt 0.0 0.0 0.0 0.1 0.0 0.0 0.0 0.0
- due to revision of GDP 0.0 0.0 0.0 0.0 0.0 0.3 0.0 -0.2
Bulgaria
Revision in deficit/surplus and debt ratios 0.0 0.0 0.0 0.4 -0.1 0.0 0.0 -0.6
- due to revision of deficit/surplus or debt 0.0 0.0 0.0 0.3 0.0 0.0 0.0 0.0
- due to revision of GDP 0.0 0.0 0.0 0.1 -0.1 0.0 0.0 -0.7
Czech Republic
Revision in deficit/surplus and debt ratios 0.0 0.0 0.0 -0.2 -0.2 -0.2 -0.5 -0.7
- due to revision of deficit/surplus or debt 0.0 0.0 0.0 -0.2 0.0 0.0 0.0 0.0
- due to revision of GDP 0.0 0.0 0.0 0.0 -0.2 -0.2 -0.5 -0.7
Denmark
Revision in deficit/surplus and debt ratios 0.0 0.0 0.0 0.3 0.0 0.0 0.0 0.2
- due to revision of deficit/surplus or debt 0.0 0.0 0.0 0.3 0.0 0.0 0.0 0.2
- due to revision of GDP 0.0 0.0 0.0 0.0 0.0 0.0 0.0 0.0
Germany
Revision in deficit/surplus and debt ratios 0.1 -0.1 0.0 0.0 0.3 0.3 0.2 0.0
- due to revision of deficit/surplus or debt 0.1 -0.1 0.0 0.0 0.4 0.4 0.4 0.2
- due to revision of GDP 0.0 0.0 0.0 0.0 -0.1 -0.1 -0.2 -0.2
Estonia
Revision in deficit/surplus and debt ratios 0.0 0.0 -0.1 -0.3 0.2 0.2 0.3 0.3
- due to revision of deficit/surplus or debt 0.0 0.0 -0.1 -0.3 0.2 0.2 0.2 0.2
- due to revision of GDP 0.0 0.0 0.0 0.0 0.0 0.1 0.1 0.1
Ireland
Revision in deficit/surplus and debt ratios 0.0 0.0 0.1 0.4 -0.6 -0.5 -2.3 -15.2
- due to revision of deficit/surplus or debt 0.0 0.0 0.0 0.1 0.0 0.0 0.0 -0.1
- due to revision of GDP 0.0 0.0 0.1 0.4 -0.6 -0.5 -2.3 -15.1
Greece
Revision in deficit/surplus and debt ratios 0.0 -0.1 0.0 -0.3 0.0 -0.3 -0.4 0.5
- due to revision of deficit/surplus or debt 0.0 -0.1 0.0 -0.3 0.0 0.0 0.0 0.1
- due to revision of GDP 0.0 0.0 0.0 0.0 0.0 -0.3 -0.4 0.3
Spain
Revision in deficit/surplus and debt ratios 0.0 -0.1 -0.1 0.0 0.3 1.7 1.1 0.6
- due to revision of deficit/surplus or debt 0.0 -0.1 -0.1 0.0 0.0 1.2 0.7 0.1
- due to revision of GDP 0.0 0.0 0.0 0.0 0.3 0.5 0.4 0.5
France
Revision in deficit/surplus and debt ratios 0.0 0.0 0.0 0.0 -0.1 -0.1 -0.1 0.4
- due to revision of deficit/surplus or debt 0.0 0.0 0.0 0.0 -0.1 -0.1 -0.1 0.0
- due to revision of GDP 0.0 0.0 0.0 0.0 0.0 0.0 0.0 0.4
Croatia
Revision in deficit/surplus and debt ratios 0.0 0.0 0.1 -0.1 0.0 0.0 0.1 0.1
- due to revision of deficit/surplus or debt 0.0 0.0 0.1 -0.1 0.0 0.0 0.0 0.0
- due to revision of GDP 0.0 0.0 0.0 0.0 0.0 0.0 0.1 0.1
Italy
Revision in deficit/surplus and debt ratios 0.0 0.2 0.0 0.0 0.0 0.0 -0.6 -0.4
- due to revision of deficit/surplus or debt 0.0 0.2 0.0 0.0 0.0 0.0 0.1 0.1
- due to revision of GDP 0.0 0.0 0.0 0.0 0.0 0.0 -0.7 -0.5
Cyprus
Revision in deficit/surplus and debt ratios 0.0 0.0 0.1 -0.1 0.0 -0.3 -1.1 -1.3
- due to revision of deficit/surplus or debt 0.0 0.0 0.0 -0.1 0.0 0.0 0.0 0.0
- due to revision of GDP 0.0 0.0 0.1 0.0 0.0 -0.3 -1.1 -1.3
Latvia
Revision in deficit/surplus and debt ratios 0.0 0.0 0.0 0.0 -0.1 0.0 0.0 -0.1
- due to revision of deficit/surplus or debt 0.0 0.0 0.0 0.0 0.0 0.0 0.0 -0.1
- due to revision of GDP 0.0 0.0 0.0 0.0 -0.1 0.0 0.0 0.0
Lithuania
Revision in deficit/surplus and debt ratios 0.0 0.0 0.0 0.0 0.0 0.0 -0.2 0.0
- due to revision of deficit/surplus or debt 0.0 0.0 0.0 0.0 0.0 0.0 0.0 0.2
- due to revision of GDP 0.0 0.0 0.0 0.0 0.0 0.0 -0.2 -0.2
* Revisions to deficit/surplus ratios: a positive sign means an improved government balance relative to GDP, and a negative sign a worsening. ** Revisions to debt ratios: a positive sign means a higher government debt relative to GDP, and a negative sign a lower debt.
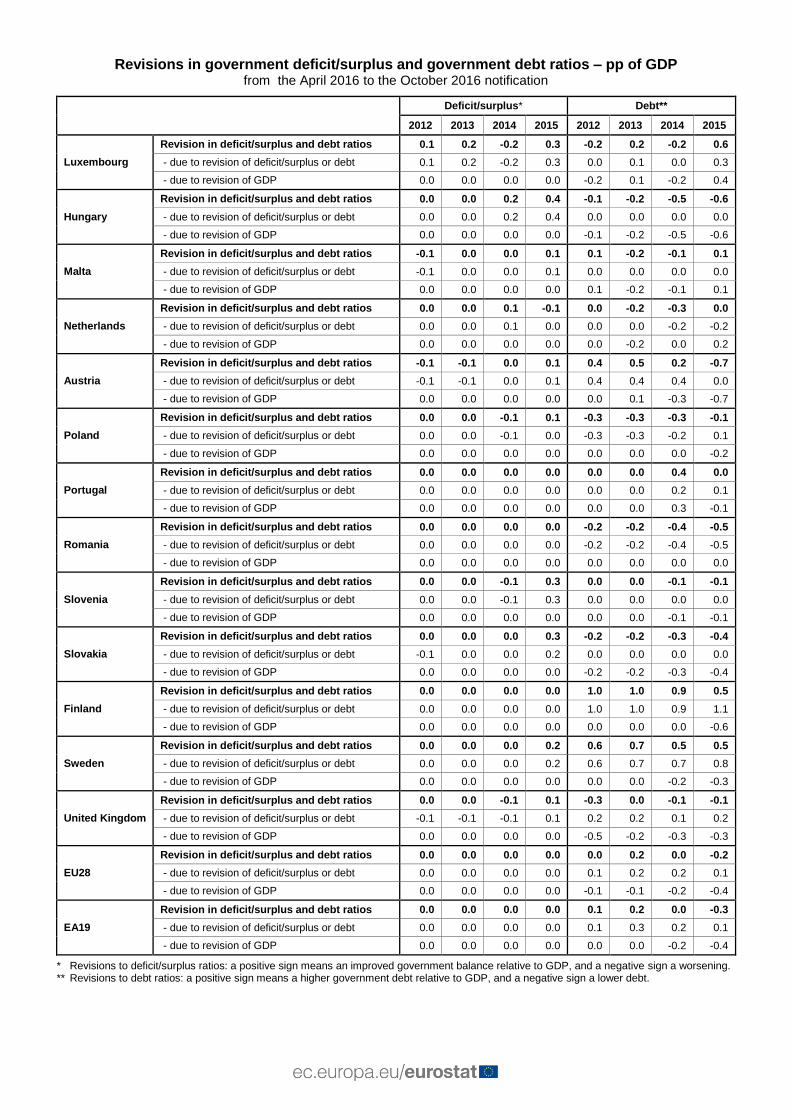
Revisions in government deficit/surplus and government debt ratios – pp of GDP from the April 2016 to the October 2016 notification
Deficit/surplus* Debt**
2012 2013 2014 2015 2012 2013 2014 2015
Luxembourg
Revision in deficit/surplus and debt ratios 0.1 0.2 -0.2 0.3 -0.2 0.2 -0.2 0.6
- due to revision of deficit/surplus or debt 0.1 0.2 -0.2 0.3 0.0 0.1 0.0 0.3
- due to revision of GDP 0.0 0.0 0.0 0.0 -0.2 0.1 -0.2 0.4
Hungary
Revision in deficit/surplus and debt ratios 0.0 0.0 0.2 0.4 -0.1 -0.2 -0.5 -0.6
- due to revision of deficit/surplus or debt 0.0 0.0 0.2 0.4 0.0 0.0 0.0 0.0
- due to revision of GDP 0.0 0.0 0.0 0.0 -0.1 -0.2 -0.5 -0.6
Malta
Revision in deficit/surplus and debt ratios -0.1 0.0 0.0 0.1 0.1 -0.2 -0.1 0.1
- due to revision of deficit/surplus or debt -0.1 0.0 0.0 0.1 0.0 0.0 0.0 0.0
- due to revision of GDP 0.0 0.0 0.0 0.0 0.1 -0.2 -0.1 0.1
Netherlands
Revision in deficit/surplus and debt ratios 0.0 0.0 0.1 -0.1 0.0 -0.2 -0.3 0.0
- due to revision of deficit/surplus or debt 0.0 0.0 0.1 0.0 0.0 0.0 -0.2 -0.2
- due to revision of GDP 0.0 0.0 0.0 0.0 0.0 -0.2 0.0 0.2
Austria
Revision in deficit/surplus and debt ratios -0.1 -0.1 0.0 0.1 0.4 0.5 0.2 -0.7
- due to revision of deficit/surplus or debt -0.1 -0.1 0.0 0.1 0.4 0.4 0.4 0.0
- due to revision of GDP 0.0 0.0 0.0 0.0 0.0 0.1 -0.3 -0.7
Poland
Revision in deficit/surplus and debt ratios 0.0 0.0 -0.1 0.1 -0.3 -0.3 -0.3 -0.1
- due to revision of deficit/surplus or debt 0.0 0.0 -0.1 0.0 -0.3 -0.3 -0.2 0.1
- due to revision of GDP 0.0 0.0 0.0 0.0 0.0 0.0 0.0 -0.2
Portugal
Revision in deficit/surplus and debt ratios 0.0 0.0 0.0 0.0 0.0 0.0 0.4 0.0
- due to revision of deficit/surplus or debt 0.0 0.0 0.0 0.0 0.0 0.0 0.2 0.1
- due to revision of GDP 0.0 0.0 0.0 0.0 0.0 0.0 0.3 -0.1
Romania
Revision in deficit/surplus and debt ratios 0.0 0.0 0.0 0.0 -0.2 -0.2 -0.4 -0.5
- due to revision of deficit/surplus or debt 0.0 0.0 0.0 0.0 -0.2 -0.2 -0.4 -0.5
- due to revision of GDP 0.0 0.0 0.0 0.0 0.0 0.0 0.0 0.0
Slovenia
Revision in deficit/surplus and debt ratios 0.0 0.0 -0.1 0.3 0.0 0.0 -0.1 -0.1
- due to revision of deficit/surplus or debt 0.0 0.0 -0.1 0.3 0.0 0.0 0.0 0.0
- due to revision of GDP 0.0 0.0 0.0 0.0 0.0 0.0 -0.1 -0.1
Slovakia
Revision in deficit/surplus and debt ratios 0.0 0.0 0.0 0.3 -0.2 -0.2 -0.3 -0.4
- due to revision of deficit/surplus or debt -0.1 0.0 0.0 0.2 0.0 0.0 0.0 0.0
- due to revision of GDP 0.0 0.0 0.0 0.0 -0.2 -0.2 -0.3 -0.4
Finland
Revision in deficit/surplus and debt ratios 0.0 0.0 0.0 0.0 1.0 1.0 0.9 0.5
- due to revision of deficit/surplus or debt 0.0 0.0 0.0 0.0 1.0 1.0 0.9 1.1
- due to revision of GDP 0.0 0.0 0.0 0.0 0.0 0.0 0.0 -0.6
Sweden
Revision in deficit/surplus and debt ratios 0.0 0.0 0.0 0.2 0.6 0.7 0.5 0.5
- due to revision of deficit/surplus or debt 0.0 0.0 0.0 0.2 0.6 0.7 0.7 0.8
- due to revision of GDP 0.0 0.0 0.0 0.0 0.0 0.0 -0.2 -0.3
United Kingdom
Revision in deficit/surplus and debt ratios 0.0 0.0 -0.1 0.1 -0.3 0.0 -0.1 -0.1
- due to revision of deficit/surplus or debt -0.1 -0.1 -0.1 0.1 0.2 0.2 0.1 0.2
- due to revision of GDP 0.0 0.0 0.0 0.0 -0.5 -0.2 -0.3 -0.3
EU28
Revision in deficit/surplus and debt ratios 0.0 0.0 0.0 0.0 0.0 0.2 0.0 -0.2
- due to revision of deficit/surplus or debt 0.0 0.0 0.0 0.0 0.1 0.2 0.2 0.1
- due to revision of GDP 0.0 0.0 0.0 0.0 -0.1 -0.1 -0.2 -0.4
EA19
Revision in deficit/surplus and debt ratios 0.0 0.0 0.0 0.0 0.1 0.2 0.0 -0.3
- due to revision of deficit/surplus or debt 0.0 0.0 0.0 0.0 0.1 0.3 0.2 0.1
- due to revision of GDP 0.0 0.0 0.0 0.0 0.0 0.0 -0.2 -0.4
* Revisions to deficit/surplus ratios: a positive sign means an improved government balance relative to GDP, and a negative sign a worsening. ** Revisions to debt ratios: a positive sign means a higher government debt relative to GDP, and a negative sign a lower debt.