Embed Size (px)
Citation preview
Education, on-the-job training, and the black-white earnings gap Black men's earnings lag those of white men, but their monetary returns for each year of education are as high as those for white men; on-the-job training does not pay off' as well for blacks
DANIEL E. TAYLOR
More than a decade after the passage of the Economic
Opportunity Act and the establishment of the Equal
Employment Opportunity Commission, black men con-
tinued to earn much less than white men . Those who
worked full time in 1977 earned a median of $8,714 in
wage and salary income, compared with $12,603 earned
by white men . Median weekly earnings for black men
were $189, or $72 less than those of white men.'
During most of the postwar era, the earnings of black
men increased faster than those of white men. Richard
Freeman, in a comprehensive study of the economic sta-
tus of blacks in the 1950's and 1960's, demonstrated
that during that period, the median wage and salary an-
nual income of black men increased at a rate of 3 .2 per-
cent per year, compared with a 2.6-percent rate for
white men .z According to Janice Hedges and Earl
Mellor, usual weekly earnings of black men who work-
ed full time increased relative to those of white men
from 1967 until the recession of 1974-75, but made lit-
tle gain subsequently. Black men's usual weekly earn-
ings rose from 69 percent of white men's earnings in
1967 to 77 percent in 1973 and to 78 percent by 1978.'
The interplay of social and economic factors compli-
cates the analysis of the black-white earnings gap. For
example, discrimination historically has played an im-
portant role in keeping black workers out of occupa-
tions which provide higher levels of earnings, skills
training, and job stability . Racial disparities in educa-
Daniel E. Taylor is an economist in the Office of Current Employ-
ment Anaylsis, Bureau of Labor Statistics .
tion and other spheres that influence the worker's pro-
ductivity also affect earnings .' Both the quantity and
quality of education differ for whites and blacks . While
the quantity usually is measured by years of school
completed, the quality-which is affected by housing
patterns, geographic location, and community and fami-
ly investments in education-is more difficult to mea-
sure .
The human capital approach
The notion that workers embody wealth similar to
that of capital is not new. Although the concept of hu-
man capital has been discussed since the 18th century,
it received more attention in the 1960's, spurred by the
National Defense Education Act of 1958 and the man-
power development acts of the early 1960's . Gary
Becker presented a general statement of human capital
theory in 1964.5 A decade later, Jacob Mincer set down
perhaps the most fully developed discussion of the hu-
man capital theory to date .° This article uses Mincer's
approach to report earnings differences of black and
white men in 1977, by years of educational attainment
and work experience . Basically, human capital theory states that job skills
obtained by workers through formal schooling and on-
the-job training increase productivity . Because workers
put aside time for training in which earnings otherwise
could be made, they expect a return on this investment
analagous to that on invested funds. This return is in
the form of increased earnings for higher productivity .
Under the human .capital approach, education and work
28
experience along with other variables are used to ex-plain differences in earnings among workers.'
Because dollar amounts of investment are difficult to obtain, education is most often measured by years com-pleted . Educational achievement affects both weekly earnings (earnings are increased because of the effect of education on productivity) and weeks worked per year (workers with more education tend to work more weeks, recapturing investments in education) . Further-more, education affects earnings and worktime indirect-ly through workers' occupations . Actual work experience also is difficult to measure and often is approximated by the number of years since leaving school .
Black-white earnings ratios
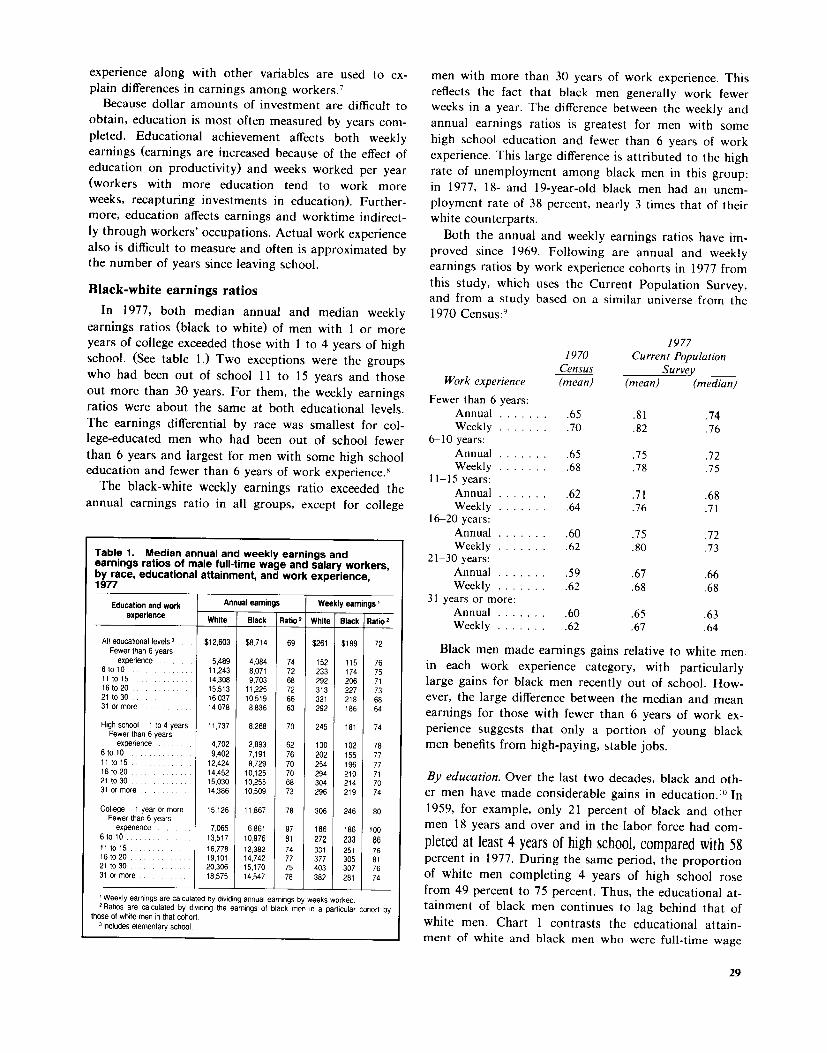
In 1977, both median annual and median weekly earnings ratios (black to white) of men with 1 or more years of college exceeded those with 1 to 4 years of high school . (See table 1 .) Two exceptions were the groups who had been out of school 11 to 15 years and those out more than 30 years . For them, the weekly earnings ratios were about the same at both educational levels . The earnings differential by race was smallest for col-lege-educated men who had been out of school fewer than 6 years and largest for men with some high school education and fewer than 6 years of work experience .' The black-white weekly earnings ratio exceeded the
annual earnings ratio in all groups, except for college
Table 1 . Median annual and weekly earnings and earnings ratios of male full-time wage and salary workers, by race, educational attainment, and work experience, 1977
Education and work Annual earnings Weekly earnings' experience
White Black Ratio' White Black Ration
All educational levels' . . . . $12,603 $8,714 69 $261 $189 72 Fewer than 6 years
experience . . . . . . 5,489 4,084 74 152 115 76 6 to 10 . . . . . . . . . . . . . . 11,243 8,071 72 233 174 75 11 to 15 14,308 9,703 68 292 206 71 16 to 20 . . . . . . . . . . . . . . 15,513 11,225 72 313 227 73 21 to 30 . . . . . . . . . . 16,037 10,519 66 321 218 68 31 or more 14,078 8,836 63 292 186 64
High school -1 to 4 years 11,737 8,268 70 245 181 74 Fewer than 6 years
experience . . . . . . . 4,702 2,893 62 130 102 78 6 to 10 . . . . . . . . . . . . . . . 9,402 7,191 76 202 155 77 11 to 15 . . . . . . . . . . 12,424 8,729 70 254 196 77 16 to 20 . . . . 14,452 10,125 70 294 210 71 21 to 30 . . . . . . . . . 15,030 10,255 68 304 214 70 31 or more . . . . . . . . . . 14,386 10,509 73 296 219 74
College-- 1 year or more 15,126 11,867 78 306 246 80 Fewer than 6 years
experience . . . 7,065 6,861 97 186 186 100 6 to 10 . . . . . . . . . . . . . 13,517 10,976 81 272 233 86 11 t0 15 . . . . . . 16,778 12,382 74 331 251 76 160 20 . . . . . . . . . . 19,101 14,742 77 377 305 81 21 to 30 . . . . . . . . . . 20,306 15,170 75 403 307 76 31 or more . . . . . . . . . . . 18,575 14,547 78 382 281 74
'Weekly earnings are calculated by dividing annual earnings by weeks worked . 2 Ratios are calculated by dividing the earnings of black men in a particular cohort by those of white men in that cohort.
' Includes elementary school .
men with more than 30 years of work experience . This reflects the fact that black men generally work fewer weeks in a year . The difference between the weekly and annual earnings ratios is greatest for men with some high school education and fewer than 6 years of work experience . This large difference is attributed to the high rate of unemployment among black men in this group : in 1977, 18- and 19-year-old black men had an unem-ployment rate of 38 percent, nearly 3 times that of their white counterparts . Both the annual and weekly earnings ratios have im-
proved since 1969 . Following are annual and weekly earnings ratios by work experience cohorts in 1977 from this study, which uses the Current Population Survey, and from a study based on a similar universe from the 1970 Census :9
ork experience
Fewer than 6 years :
1970 Census (mean)
Curre
(mean)
1977 nt Population Survey
(median)
Annual . . . . . . . .65 .81 .74 Weekly . . . . . . . .70 .82 .76
6-10 years : Annual . . . . . . . .65 .75 .72 Weekly . . . . . . . .68 .78 .75
11-15 years : Annual . . . . . . . .62 .71 .68 Weekly . . . . . . . .64 .76 .71
16-20 years : Annual . . . . . . . .60 .75 .72 Weekly . . . . . . . .62 .80 .73
21-30 years : Annual . . . . . . . .59 .67 .66 Weekly . . . . . . . .62 .68 .68
31 years or more : Annual . . . . . . . .60 .65 .63 Weekly . . . . . . . .62 .67 .64
Black men made earnings gains relative to white men . in each work experience category, with particularly large gains for black men recently out of school . How-ever, the large difference between the median and mean earnings for those with fewer than 6 years of work ex-perience suggests that only a portion of young black men benefits from high-paying, stable jobs .
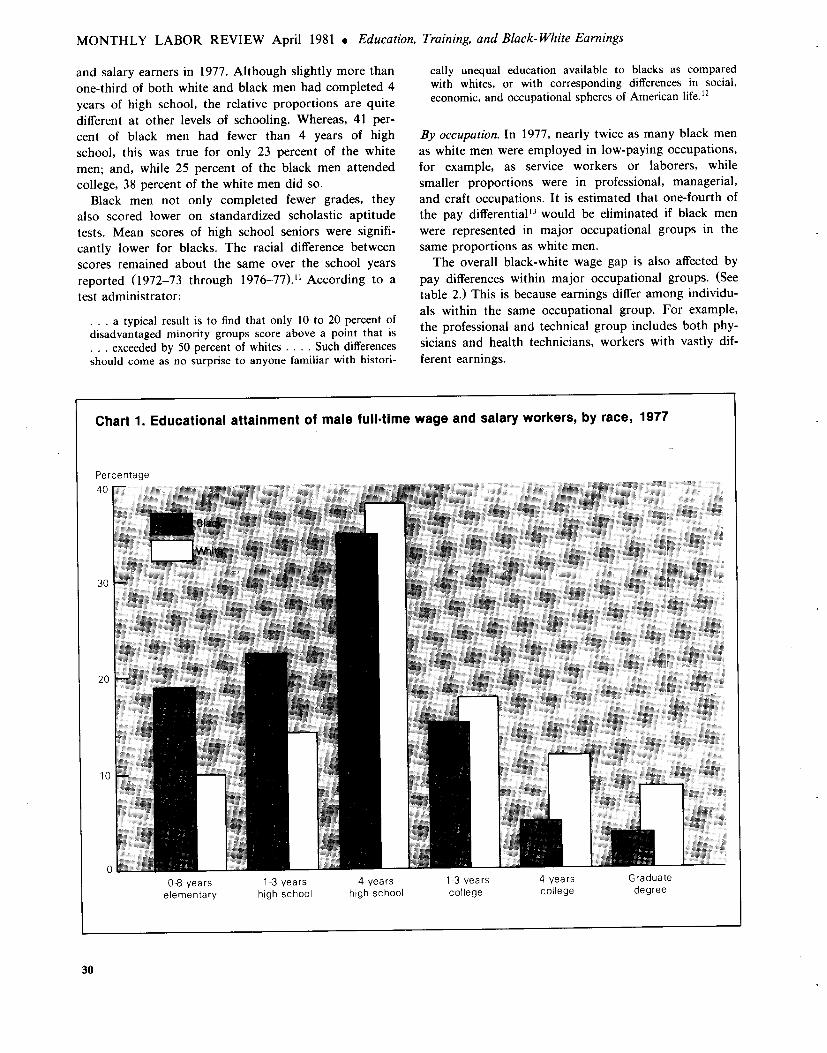
By education. Over the last two decades, black and oth-er men have made considerable gains in education. 10 In 1959, for example, only 21 percent of black and other men 18 years and over and in the labor force had com-pleted at least 4 years of high school, compared with 58 percent in 1977 . During the same period, the proportion of white men completing 4 years of high school rose from 49 percent to 75 percent. Thus, the educational at-tainment of black men continues to lag behind that of white men. Chart 1 contrasts the educational attain-ment of white and black men who were full-time wage
29
MONTHLY LABOR REVIEW April 1981 a Education, Training, and Black-White Earnings
and salary earners in 1977. Although slightly more than one-third of both white and black men had completed 4 years of high school, the relative proportions are quite different at other levels of schooling. Whereas, 41 per-cent of black men had fewer than 4 years of high school, this was true for only 23 percent of the white men ; and, while 25 percent of the black men attended college, 38 percent of the white men did so .
Black men not only completed fewer grades, they also scored lower on standardized scholastic aptitude tests . Mean scores of high school seniors were signifi-cantly lower for blacks . The racial difference between scores remained about the same over the school years reported (1972-73 through 1976-77) ." According to a test administrator:
. . . a typical result is to find that only 10 to 20 percent of disadvantaged minority groups score above a point that is . . . exceeded by 50 percent of whites . . . . Such differences should come as no surprise to anyone familiar with histori-
cally unequal education available to blacks as compared with whites, or with corresponding differences in social, economic, and occupational spheres of American life . '2
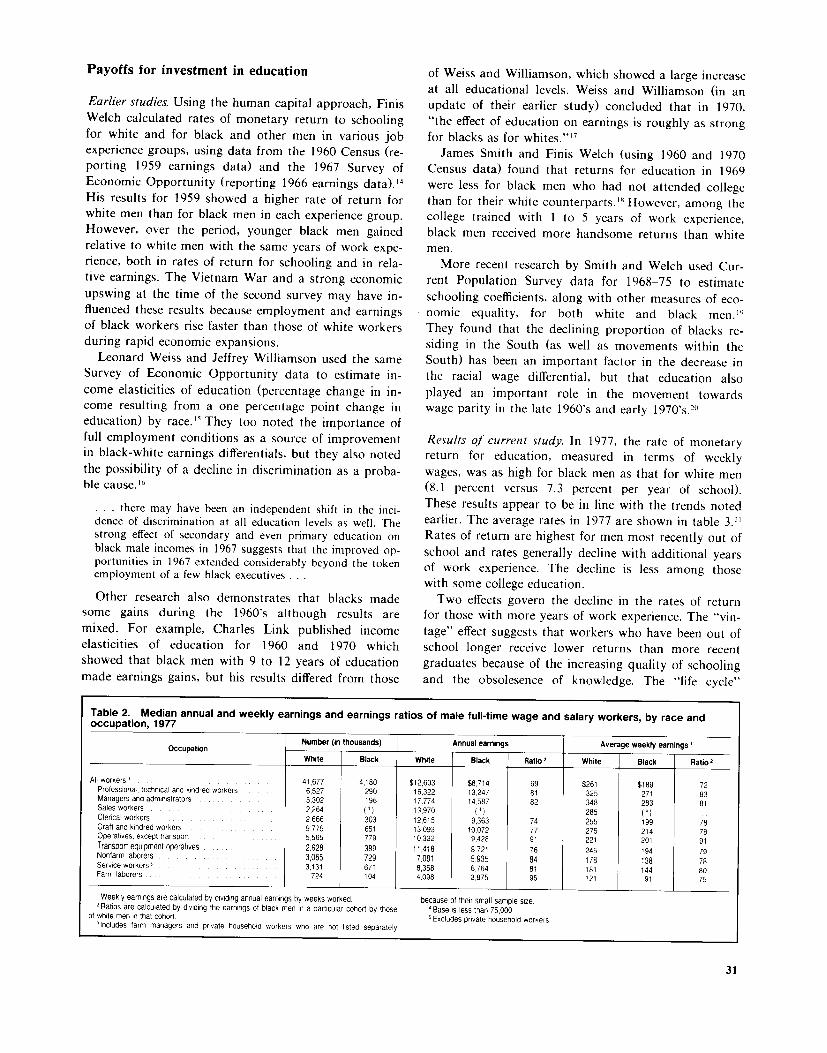
By occupation . In 1977, nearly twice as many black men as white men were employed in low-paying occupations, for example, as service workers or laborers, while smaller proportions were in professional, managerial, and craft occupations. It is estimated that one-fourth of the pay differential" would be eliminated if black men were represented in major occupational groups in the same proportions as white men. The overall black-white wage gap is also affected by
pay differences within major occupational groups . (See table 2.) This is because earnings differ among individu-als within the same occupational group. For example, the professional and technical group includes both phy-sicians and health technicians, workers with vastly dif-ferent earnings.
Chart 1 . Educational attainment of male full-time wage and salary workers, by race, 1977
08 years 1-3 years 4 years elementary high school high school
1-3 years 4 years Graduate college college degree
30
Payoffs for investment in education
Earlier studies. Using the human capital approach, Finis Welch calculated rates of monetary return to schooling for white and for black and other men in various job experience groups, using data from the 1960 Census (re-porting 1959 earnings data) and the 1967 Survey of Economic Opportunity (reporting 1966 earnings data)." His results for 1959 showed a higher rate of return for white men than for black men in each experience group . However, over the period, younger black men gained relative to white men with the same years of work expe-rience, both in rates of return for schooling and in rela-tive earnings . The Vietnam War and a strong economic upswing at the time of the second survey may have in-fluenced these results because employment and earnings of black workers rise faster than those of white workers during rapid economic expansions . Leonard Weiss and Jeffrey Williamson used the same
Survey of Economic Opportunity data to estimate in-come elasticities of education (percentage change in in-come resulting from a one percentage point change in education) by race . '5 They too noted the importance of full employment conditions as a source of improvement in black-white earnings differentials, but they also noted the possibility of a decline in discrimination as a proba-ble cause . II
. . . there may have been an independent shift in the inci-dence of discrimination at all education levels as well . The strong effect of secondary and even primary education on black male incomes in 1967 suggests that the improved op-portunities in 1967 extended considerably beyond the token employment of a few black executives . . .
Other research also demonstrates that blacks made some gains during the 1960's although results are mixed . For example, Charles Link published income elasticities of education for 1960 and 1970 which showed that black men with 9 to 12 years of education made earnings gains, but his results differed from those
of Weiss and Williamson, which showed a large increase at all educational levels . Weiss and Williamson (in an update of their earlier study) concluded that in 1970, "the effect of education on earnings is roughly as strong for blacks as for whites ." 17 James Smith and Finis Welch (using 1960 and 1970
Census data) found that returns for education in 1969 were less for black men who had not attended college than for their white counterparts." However, among the college trained with 1 to 5 years of work experience, black men received more handsome returns than white men . More recent research by Smith and Welch used Cur-
rent Population Survey data for 1968-75 to estimate schooling coefficients, along with other measures of eco-nomic equality, for both white and black men ." They found that the declining proportion of blacks re-siding in the South (as well as movements within the South) has been an important factor in the decrease in the racial wage differential, but that education also played an important role in the movement towards wage parity in the late 1960's and early 1970's .=°
Results of current study. In 1977, the rate of monetary return for education, measured in terms of weekly wages, was as high for black men as that for white men (8.1 percent versus 7.3 percent per year of school) . These results appear to be in line with the trends noted earlier . The average rates in 1977 are shown in table 3 .21 Rates of return are highest for men most recently out of school and rates generally decline with additional years of work experience . The decline is less among those with some college education . Two effects govern the decline in the rates of return
for those with more years of work experience . The "vin-tage" effect suggests that workers who have been out of school longer receive lower returns than more recent graduates because of the increasing quality of schooling and the obsolesence of knowledge. The "life cycle"
Table 2 . Median annual and weekly earnings and earnings ratios of male full-time wage and salary workers, by race and occupation, 1977
Occupation Number (in thousands) Annual earnings Average weekly earnings'
White Black White Black Ratio' White Black Ratio'
Allworkers ' . . . 41,677 4,180 $12,603 $8714 69 $261 $189 72 Professional, technical and kindred workers 6,527 290 16,322 13,247 81 325 271 83 Managers and administrators 5,302 196 17,774 14,587 82 348 283 81 Sales workers 2,264 (°) 13 .970 (°) 285 (°) Clerical workers 2,666 303 12,615 9,363 74 255 199 78 Craft and kindred workers 9,775 651 13,093 10,072 77 275 214 78 Operatives, except transport 5,565 779 10 .332 9,428 91 221 201 91 Transport equipment operatives 2,628 389 11,418 8,721 76 245 194 79 Nonfarm laborers 3,065 729 7,081 5,935 84 178 138 78 Service workers 3,131 671 8,358 6,764 81 181 144 80 Farm laborers 724 104 4,098 3,875 95 121 91 75
' Weekly earnings are calculated by dividing annual earnings by weeks worked because of their small sample size z Ratios are calculated by dividing the earnings of black men in a particular cohort by those ° Base is less than 75 000 , of white men in that cohort. 5 Excludes private household workers .
3 Includes farm managers and private household workers who are not listed separately
31
MONTHLY LABOR REVIEW April 1981 . Education, Training, and Black-White Earnings
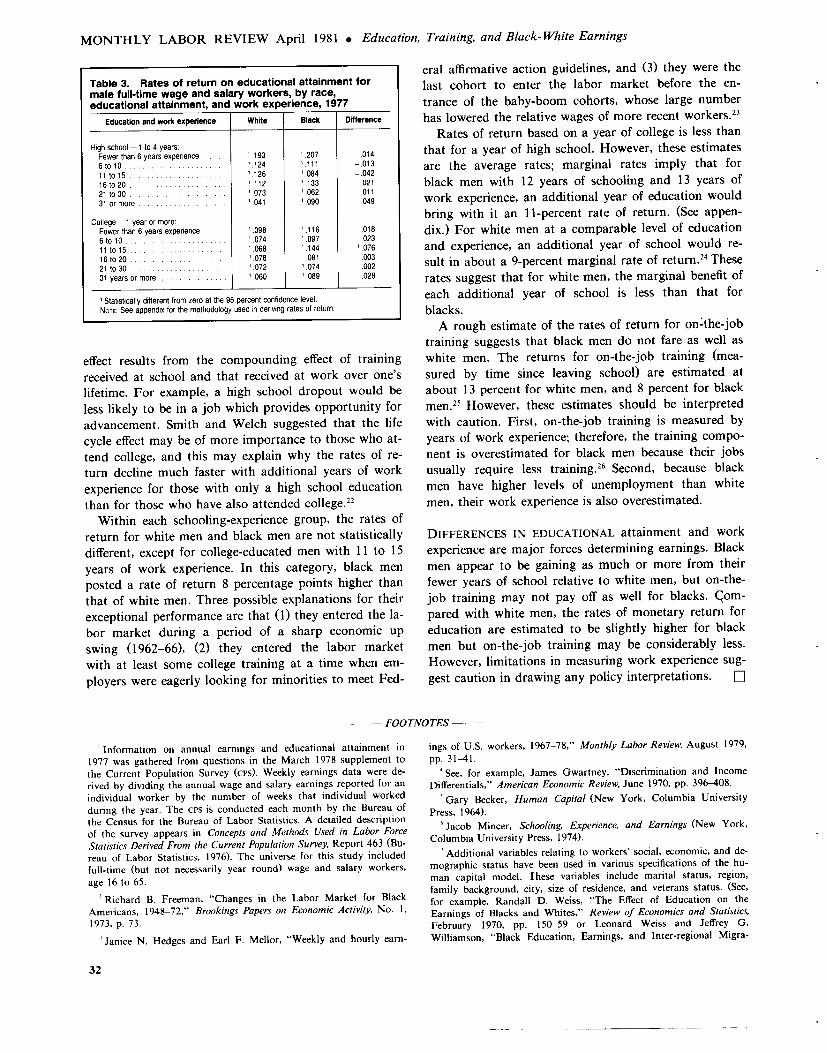
Table 3. Rates of return on educational attainment for male full-time wage and salary workers, by race, educational attainment, and work experience, 1977
Education and work experience White Black Difference
High school-1 to 4 years: Fewer than 6 years experience . . . . . ' .193 ' .207 014 6 to 10 . . . . . . . . . . . . . . . . . . . . . . . 1 .124 1 .111 - .013 11 to 15 . . . . . . . . . . . . . . . . . . . . . . 1 .126 1 .084 - .042 16to20 . . . . . . . . . . . . . . . . . . . . . . ' .112 ' .133 .021 21 to 30 . . . . . . . . . . . . . . . . . . . . . . 1 .073 1 .062 - .011 31 or more . . . . . . . . . . . . . . . . . . . . 1 .041 1 .090 049
College--1 year or more: Fewer than 6 years experience . . . . . 1 .098 1 .116 018 6 to 10 . . . . . . . . . . . . . . . . . . . . . . . 1 .074 1 .097 023 11 to 15 . . . . . . . . . . . . . . . . . . . . . . 1,068 1 .144 1 .076 16 to 20 . . . . . . . . . . . . . . . . . . . . . . 1 .078 081 003 21 to 30 . . . . . . . . . . . . . . . . . . . . . . 1 .072 1 .074 002 31 years or more . . . . . . . . . . . . . . . 1 .060 1 .089 028
' Statistically different from zero at the 95 percent confidence level . NOTE : See appendix for the methodology used in deriving rates of return.
effect results from the compounding effect of training
received at school and that received at work over one's lifetime . For example, a high school dropout would be
less likely to be in a job which provides opportunity for advancement. Smith and Welch suggested that the life
cycle effect may be of more importance to those who at-
tend college, and this may explain why the rates of re-turn decline much faster with additional years of work
experience for those with only a high school education than for those who have also attended college."
Within each schooling-experience group, the rates of return for white men and black men are not statistically different, except for college-educated men with 11 to 15
years of work experience. In this category, black men posted a rate of return 8 percentage points higher than that of white men. Three possible explanations for their exceptional performance are that (1) they entered the la-bor market during a period of a sharp economic up swing (1962-66), (2) they entered the labor market with at least some college training at a time when em-ployers were eagerly looking for minorities to meet Fed-
eral affirmative action guidelines, and (3) they were the last cohort to enter the labor market before the en-trance of the baby-boom cohorts, whose large number has lowered the relative wages of more recent workers."
Rates of return based on a year of college is less than that for a year of high school . However, these estimates are the average rates; marginal rates imply that for
black men with 12 years of schooling and 13 years of
work experience, an additional year of education would bring with it an 11-percent rate of return . (See appen-dix.) For white men at a comparable level of education and experience, an additional year of school would re-
sult in about a 9-percent marginal rate of return." These rates suggest that for white men, the marginal benefit of each additional year of school is less than that for blacks . A rough estimate of the rates of return for on-the-job
training suggests that black men do not fare as well as white men. The returns for on-the-job training (mea-sured by time since leaving school) are estimated at about 13 percent for white men, and 8 percent for black men. 21 However, these estimates should be interpreted with caution . First, on-the-job training is measured by years of work experience ; therefore, the training compo-nent is overestimated for black men because their jobs usually require less training .26 Second, because black men have higher levels of unemployment than white men, their work experience is also overestimated.
DIFFERENCES IN EDUCATIONAL attainment and work
experience are major forces determining earnings . Black
men appear to be gaining as much or more from their
fewer years of school relative to white men, but on-the-
job training may not pay off as well for blacks . Com-
pared with white men, the rates of monetary return for
education are estimated to be slightly higher for black
men but on-the-job training may be considerably less.
However, limitations in measuring work experience sug-
gest caution in drawing any policy interpretations . El
FOOTNOTES
' Information on annual earnings and educational attainment in 1977 was gathered from questions in the March 1978 supplement to the Current Population Survey (cps). Weekly earnings data were de-rived by dividing the annual wage and salary earnings reported for an individual worker by the number of weeks that individual worked during the year . The cps is conducted each month by the Bureau of the Census for the Bureau of Labor Statistics . A detailed description of the survey appears in Concepts and Methods Used in Labor Force Statistics Derived From the Current Population Survey, Report 463 (Bu-reau of Labor Statistics, 1976). The universe for this study included full-time (but not necessarily year round) wage and salary workers,
age 16 to 65 .
Richard B. Freeman, "Changes in the Labor Market for Black Americans, 1948-72," Brookings Papers on Economic Activity, No . 1, 1973, p. 73 .
' Janice N. Hedges and Earl F. Mellor, "Weekly and hourly earn-
ings of U.S . workers, 1967-78," Monthly Labor Review, August 1979,
pp . 31-41 .
'See, for example, James Gwartney, "Discrimination and Income Differentials," American Economic Review, June 1970, pp . 396-408.
`Gary Becker, Human Capital (New York, Columbia University Press, 1964).
Jacob Mincer, Schooling, Experience, and Earnings (New York,
Columbia University Press, 1974).
' Additional variables relating to workers' social, economic, and de-mographic status have been used in various specifications of the hu-man capital model. These variables include marital status, region, family background, city, size of residence, and veterans status. (See, for example, Randall D. Weiss, "The Effect of Education on the Earnings of Blacks and Whites," Review of Economics and Statistics, February 1970, pp . 150-59 or Leonard Weiss and Jeffrey G. Williamson, "Black Education, Earnings, and Inter-regional Migra-
32
tion : Some New Evidence," American Economic Review, June 1972, pp. 372-83 .) Occupation, a variable which has an important indirect effect upon the distribution of earnings, is often discussed . Another important variable in the model, individual ability, is often excluded from consideration because it is difficult to measure.
" Work experience is estimated in the following manner : the years of schooling plus 5 years representing the preschool years are subtracted from the worker's age. Although this estimation of work experience is often used in human capital studies, it has serious limitations. Among these are that it assumes men finish school, go immediately to work, and work continuously until retirement . Also, it implicitly assumes that the amount of on-the-job training embodied in a given amount of work experience is the same for all men and that on-the-job training decreases over the life cycle in the same manner for all men.
'James P. Smith and Finis Welch, "Black-White Male Wage Ra-tios, 1960-70," American Economic Review, June 1977, p. 324. Smith and Welch groups with the shortest and longest work experience ex-clude workers with less than 1 year of experience and those with more than 40 years. (The Current Population Survey data include all full-time wage and salary workers between age 16 and 65 in 1977, irre-spective of length of work experience .) Smith and Welch describe their ratios in the following manner : "Numbers reported are ratios of aver-ages, i .e., they are average black earnings or weekly wages relative to appropriate averages for whites . Weekly wages are earnings last year divided by weeks worked last year . The average weekly wage used here is total earnings of all persons divided by total weeks worked, i .e., individual earnings per week are weighted by weeks worked ." Al-though their data include workers with less than full-time schedules, this has little effect on the earnings ratios because the black-white ra-tio of median usual weekly earnings of part-time workers was .98 in May 1977 .
"~ The term "black and other" is used for historical data which are not available for blacks only . In the 1970 Census of Population, 89 percent of the black and other group were black; the remainder in-cluded American Indian, Alaskan Natives, Asian and Pacific Island-ers. The regression model, however, was designed to measure the earnings differential between blacks and other races. Whites com-prised the overwhelming majority of the nonblack group-about 98 percent in 1970 .
Statement of Winton H. Manning, senior vice president for Re-search and Development, Educational Testing Service, before the Sub-committee on the Civil Service. (See Professional and Administrative Career Examination, U.S . House of Representatives, Subcommittee on the Civil Service of the Committee on Post Office and Civil Service, 96th Cong. 1st sess ., May 15, 1979 .)
''Statement of Winton H. Manning, Professional and Administra-tive . . . , p. 62 .
" This figure was calculated by distributing black men across occu-pations in the same proportions as white men, then redistributing these groups across their earnings distribution in the same propor-tions. This new income distribution was then used to calculate a re-vised median in which 24 percent of the black-white difference was explained .
" Finis Welch, "Black-White Differences in Returns to Schooling, American Economic Review, December 1973, pp . 893-907.
Weiss and Williamson, "Black Education, Earnings . . ." '° Weiss and Williamson, "Black Education, Earnings . . ." Charles R. Link, "Black Education, Earnings, and Interregional
Migration : Comment and Some New Evidence," and Leonard Weiss and Jeffrey G . Williamson, "Black Education, Earnings and Interregional Migration : Even Newer Evidence," American Economic Review, March 1975, pp. 236-44 . Link's estimates were based on grouped data from the 1970 Census, while Weiss and Williamson's es-timates were based on individual data from the 1970 census .
" Smith and Welch, "Black-White . . . . . . pp . 323-38 . In their anal-ysis of earnings ratios, they found that the earnings differential diminished somewhat over the decade yet remained large in 1970 ; that blacks entering the labor market in the 1960's, especially in the late 1960's fared best ; and that college educated black men made the greatest improvements.
In their regression model, Smith and Welch include government employment and geographic location as explanatory variables as well as school completion and years of work experience which means that their results are not directly comparable with those reported in this article . However, it is useful to note that they found that little change had taken place between 1960 and 1970 in the rates of return for schooling of either black or white men in the elementary and second-ary category and that data for both years showed the rate of return for black men to be lower than that for white men in each experience category . For example, white men in the 1 to 5 years of experience category accrued a return of .143, compared with a rate of .097 for black men of this category ; in the 31 to 40 years of experience group, the rates of return were .050 and .026 . Among those who attended college, the rate grew in the 1960's, while there was little difference between the races. In 1970, black men in the 1 to 5 years experience category had a rate of return for schooling of .158, compared with a rate of return of .124 for white men of this group. "James P. Smith and Finis Welch, "Race Differences in Earnings :
A Survey and New Evidence," in Peter Mieszkowski and Mahlon Straszheim, eds., Current Issues in Urban Economics (Baltimore, The Johns Hopkins University Press, 1979), pp . 40-73.
" Smith and Welch, "Race Differences . . . ," -1 Differences were tested for statistical significance using results
from the dummy variable analysis . (See appendix .) - Smith and Welch, "Black-White Male . . . ," p. 330. ,, For a discussion of the "baby-boom" effect on wages see Richard
B. Freeman, "The Effect of Demographic Factors on Age-Earnings Profiles," The Journal of Human Resources, Summer, 1979, pp . 289-318.
'These calculations were derived in the following manner for whites :
Change in logarithm of weekly earnings Change in education
1414- .0022X(12)- .0018X(13)
"` Coefficients of experience and experience squared were used to de-rive these estimates . Mincer, Schooling . . . . p. 91, provides formulas used in the derivation of these estimates . For estimates of the effect experiences on earnings using a more direct measure of on-the-job training, see Greg J. Duncan and Saul Hoffman, "On-the-Job Train-ing and Earnings Differences by Race and Sex," Review of Economics and Statistics, November 1979, pp . 594-603.
_' See Duncan and Hoffman, "On-the-Job Training . . . ," p. 597, for estimates of the average amount of training by occupation .
APPENDIX: Rates of return for education
The model used to estimate rates of return for educa-tion in the current study is
In W = a + b, S + b2 t + b, t2 ; where: In W is the natural logarithm of average weekly earnings .
S is the number of years of schooling completed.
t is the calculated number of years of work experi-ence (Age -S -5). Average weekly earnings (annual earnings divided by
weeks worked) is used as the dependent variable of the model because earnings and work time are both depen-dent on schooling and experience. An advantage in us-
33
MONTHLY LABOR REVIEW April 1981 . Education, Training, and Black-White Earnings
ing weekly earnings as the dependent variable (as op-
posed to annual earnings) is that the labor-leisure
tradeoff is taken into account, that is, the effect of hu-
man capital on earnings is separated from its effect on
work time . However, involuntary unemployment, which
reduces work time beyond that which would be freely
chosen, makes this variable less useful, that is, to the
extent that black men are involuntarily unemployed more than white men, their rate of return to schooling is overestimated.
Because years of schooling measure the quantity of
schooling but not its quality and because the black edu-
cational experience historically has been lower in quali-
ty than that of whites, the independent variable, years
of schooling, overestimates blacks' educational input .
Experience, defined as the time since leaving school,
overestimates black men's work experience as they are
more likely to have periods of unemployment than
white men . Additionally, the amount of on-the-job
training which is embodied within a given amount of
work experience may be less for black men. The experi-
ence squared term takes into account the fact that actu-
al on-the-job training declines as workers age, which
means that additional years of work experience will
have less impact on workers' earnings .
To measure the statistical significance of the dif-ference between the effect of schooling on the earnings
of white and black men (holding experience constant),
the model takes the form
In W=a+a'Z+b,S+b,'SZ+bzt+b2'tz+ b3 t2 + b3'tz Z
where Z is a dummy variable designating race (Z = 1 if
black, 0 if white) . Using this method, it can be said that
the rate of return for black men is significantly different from that for white men if the coefficient, b,' is
statistically different from zero . (These differences are
reported in table 3 of the text .) For a discussion of this
estimation technique, see Jan Kmenta, Elements of
Econometrics (New York, The Macmillian Co., 1971),
pp . 419-22 . The regressions were run separately by length of
work experience for workers who completed 1 to 4
years of high school and for those completing at least 1
year of college (total figures include those completing
only elementary school). By analyzing the data in this
manner, experience acts as an index of age (that is, suc-
cessive experience groups can be considered successive
age groups). In the context of the human capital model,
this indexing marks the vintage of schooling . This is im-
portant because the difference in the quality of educa-
tion of blacks and whites has declined over the past
several decades. See John D. Owen, School Inequality
and the Welfare State (Baltimore, the Johns Hopkins
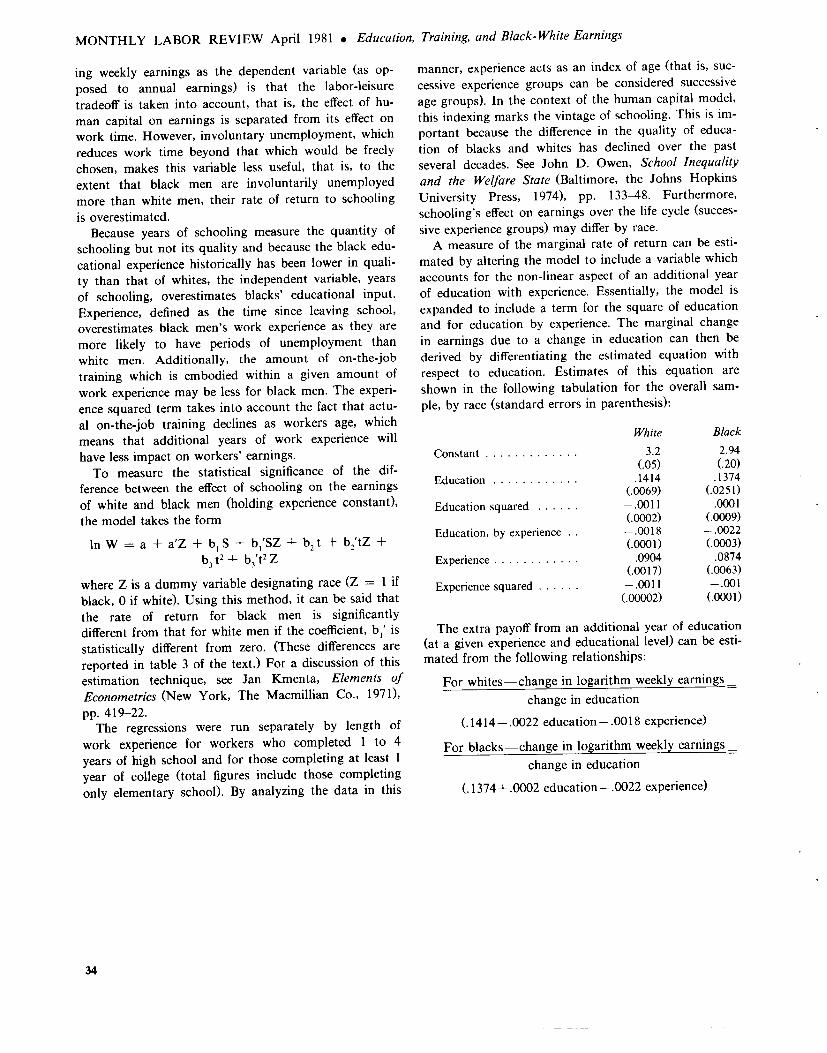
University Press, 1974), pp . 133-48 . Furthermore, schooling's effect on earnings over the life cycle (succes-sive experience groups) may differ by race . A measure of the marginal rate of return can be esti-
mated by altering the model to include a variable which accounts for the non-linear aspect of an additional year of education with experience . Essentially, the model is expanded to include a term for the square of education and for education by experience . The marginal change in earnings due to a change in education can then be derived by differentiating the estimated equation with respect to education. Estimates of this equation are shown in the following tabulation for the overall sam-
ple, by race (standard errors in parenthesis) :
Constant . . . . . . . . . . . . .
Education . . . . . . . . . . . .
Education squared . . . . . .
Education, by experience . .
Experience . . . . . . . . . . . .
Experience squared . . . . . .
White Black
3 .2 2 .94 ( .05) (20) .1414 .1374
( .0069) ( .0251) -.0011 .0001 ( .0002) (.0009) - .0018 - .0022 (.0001) (.0003) .0904 .0874
(.0017) (.0063) -.0011 -.001 ( .00002) (.0001)
The extra payoff from an additional year of education (at a given experience and educational level) can be esti-mated from the following relationships :
For whites-change in logarithm weekly earnings
change in education
(.1414- .0022 education- .0018 experience)
For blacks-change in logarithm weekly earnings
change in education
(.1374+ .0002 education- .0022 experience)