Embed Size (px)
Citation preview
NATIONAL CENTER FOR EDUCATION STATISTICS
Statistical Analysis Report July 2001
U.S. Department of EducationOffice of Educational Research and Improvement NCES 2001–061
EDUCATIONALACHIEVEMENT AND BLACK-WHITE INEQUALITY
NATIONAL CENTER FOR EDUCATION STATISTICS
Statistical Analysis Report July 2001
U.S. Department of EducationOffice of Educational Research and Improvement NCES 2001–061
EDUCATIONALACHIEVEMENT AND BLACK-WHITE INEQUALITY
Jonathan JacobsonCara OlsenJennifer King RiceStephen SweetlandMathematica Policy Research, Inc.
John RalphNational Center for Education Statistics

U.S. Department of EducationRod Paige Secretary
National Center for Education StatisticsGary W. Phillips Acting Commissioner
The National Center for Education Statistics (NCES) is the primary federal entity for collecting, analyzing,and reporting data related to education in the United States and other nations. It fulfills a congressionalmandate to collect, collate, analyze, and report full and complete statistics on the condition of education inthe United States; conduct and publish reports and specialized analyses of the meaning and significance ofsuch statistics; assist state and local education agencies in improving their statistical systems; and reviewand report on education activities in foreign countries.
NCES activities are designed to address high priority education data needs; provide consistent, reliable,complete, and accurate indicators of education status and trends; and report timely, useful, and high qualitydata to the U.S. Department of Education, the Congress, the states, other education policymakers, practi-tioners, data users, and the general public.
We strive to make our products available in a variety of formats and in language that is appropriate to avariety of audiences. You, as our customer, are the best judge of our success in communicating informa-tion effectively. If you have any comments or suggestions about this or any other NCES product or report,we would like to hear from you. Please direct your comments to:
National Center for Education StatisticsOffice of Educational Research and ImprovementU.S. Department of Education1990 K Street, NWWashington, DC 20006
July 2001
The NCES World Wide Web Home Page is: http://nces.ed.govThe NCES World Wide Web Electronic Catalog is: http://nces.ed.gov/pubsearch/index.asp
Suggested CitationU.S. Department of Education, National Center for Education Statistics. Educational Achievement andBlack-White Inequality, NCES 2001-061, by Jonathan Jacobson, Cara Olsen, Jennifer King Rice, StephenSweetland and John Ralph. Project Officer: John Ralph. Washington, DC: U.S. Government PrintingOffice, 2001.
For ordering information on this report, writeU.S. Department of EducationED PubsP.O. Box 1398Jessup, MD 20794-1398
or by calling toll free 1-877-4ED-Pubs.
Content Contact:John Ralph(202) 502-7441
iii
ACKNOWLEDGMENTSThe authors wish to express their appreciation to David Myers of Mathematica PolicyResearch, Inc., for reviewing our work throughout this study. Dr. Myers also took thephoto on the cover of this report. We thank Professor Donald Rubin of HarvardUniversity for his helpful suggestions regarding the imputation of missing data and theuse of propensity scores in the analysis of black-white differences in outcomes. We alsothank Paul Decker and Daniel Mayer of Mathematica, James Crouse of the Universityof Delaware, Ellen Bradburn of the Education Statistics Services Institute/AmericanInstitutes of Research, and several other reviewers of earlier versions of this report. Weare grateful to Anne Meek and Sally Dillow of AIR for their assistance in editing thereport, and to Mary Fran Miklitsch for designing and producing the report. Finally, wewould like to acknowledge the many other Mathematica staff who assisted with thisstudy at various stages, including: John DiCarlo and Susan Thomas with data prepara-tion; Joyetta Conn Ibrahim, Jill Corcoran, Elyse Forkosh, Bruce Gottlieb, and Emily Paswith expert research assistance; and Daryl Hall and the other editorial and support staffresponsible for report production and distribution.
EXECUTIVESUMMARYI. MAJOR FINDINGS
The study reported here explored the relationship between black-white differences ineducational achievement and black-white differences in a variety of educational and eco-nomic outcomes. Comparisons were made, first between overall average outcomes forblacks and whites and then between average outcomes for blacks and whites with simi-lar levels of prior educational achievement.1 The major findings of the study reveal that
1. For women with similar levels of prior educational achievement, blacks earnedas much, or more, per year as whites. For men with similar levels of prior educa-tional achievement, black-white gaps in annual earnings were at least two-fifthssmaller than black-white gaps for men as a whole. Black-white disparities inemployment were, for young adults with similar levels of prior educationalachievement, at least one-half smaller than black-white employment disparitiesfor young adults as a whole.
2. For young adults with similar levels of prior educational achievement, blackswere more likely to attend college than whites. Among college attendees withsimilar levels of prior educational achievement, blacks’ college completion rateswere as high as, or higher than, the college completion rates of whites.
3. Throughout elementary and secondary school, blacks scored lower, overall, onmathematics and reading tests than whites. Even for children with similar testscores one or two grades earlier, blacks generally scored lower in mathematicsand reading than whites.
The black-white mathematics gap differed in size across grades, in a manner con-sistent with, but not necessarily demonstrating, a narrowing of the gap duringelementary school, followed by a widening of the gap during junior high schooland little change during senior high school. The black-white reading gap also dif-fered in size across grades, but not in an entirely consistent manner; it grew widerbetween grades within two elementary school cohorts, but was narrower forcohorts observed in grades 9 and 12 than for a cohort observed in grade 2.
In general, the findings show that, for children and young adults with similar levels ofprior educational achievement, the educational and economic performance of blacks rel-ative to whites was substantially greater than the performance of blacks relative to whitesas a whole. While blacks have lower levels of educational achievement, educational attain-ment, and earnings than whites, these disparities are frequently smaller, and are some-times entirely absent, for individuals with similar levels of prior educational achievement.Factors other than differences in prior educational achievement may contribute to black-white gaps in achievement, employment, and earnings; nonetheless, blacks’ relative edu-
Executive Summary v
1Comparisons between individuals with similar levels of prior educational achievement involved (i)whites as a whole, and (ii) blacks with prior educational achievement similar to that for whites.
cational achievement during elementary and secondary school appeared to be highly cor-related with their relative success in the academy and the economy.
Note: This study does not attempt to isolate the causal relationship between educationalachievement and subsequent educational and economic outcomes. Rather, using educa-tional achievement as an indicator for the cognitive backgrounds of children and youngadults, it investigates the extent to which black-white disparities are present for individu-als with similar levels of prior educational achievement. The comparison of outcomes forblacks and whites with similar levels of educational achievement does not indicate whatoutcomes for all blacks would be if their average achievement were raised to the level forwhites. Educational achievement differences are correlated with many other possiblesources of black-white disparities, some measured in survey data, others unmeasured.
II. BACKGROUND
Over the past quarter-century, black Americans have made important gains in narrow-ing the gaps in educational and economic performance between themselves and whites.Between 1973 and 1996, for example, average scores of black 17-year-olds on the math-ematics portion of the National Assessment of Education Progress (NAEP) grew by 6 percent, while average scores of white 17-year-olds remained about the same (NCES1997b). Black-white gaps in NAEP reading scores also narrowed over this period.Further, in 1974, the high school dropout rate for 15- through 24-year-old blacks wastwice the corresponding rate for whites; but by 1997, blacks and whites in this agebracket remained in high school at similar rates (NCES 1999).
Despite progress in reducing black-white gaps in mathematics and reading achieve-ment, blacks have continued to score lower on the NAEP than whites (NCES 1997b).And, despite the convergence in high school completion rates of blacks and whites, theblack-white gap in 4-year college completion rates of high school graduates 25–29 yearsold has increased slightly over the past quarter century. Between 1975 and 1998 this gapincreased from 13 to 17 percentage points (NCES 1999).
In recent years black-white disparities have also persisted—and have sometimes grownlarger—for labor market outcomes such as labor force participation,2 unemployment,3
and hourly wages. Between 1973 and 1993, black-white differences in the labor forceparticipation rates of 25- through 34-year-olds widened by 3.4 percentage points formen and 19 percentage points for women, and the corresponding black-white gaps inunemployment rates widened by about 2.4 percentage points for both men and women.Over the same time period, the black-white gap in hourly wages narrowed by one-thirdfor 25- through 34-year-old men, but more than doubled for 25- through 34-year-oldwomen (Bernstein 1995).
Recent studies have revealed a strong relationship between differences in prior educa-tional achievement and black-white disparities in college attendance and earnings. Withblack-white disparities remaining in both educational and economic outcomes, it isimportant to understand the relationship between educational achievement during ele-mentary and secondary school and subsequent academic and labor market performance.
vi Executive Summary
2The labor force participation rate is defined as the percentage of noninstitutionalized civilians who areemployed, otherwise with a job, or looking for a job.
3The unemployment rate is defined as the percentage of labor force participants who are without a job.
III. THE PRESENT STUDY
The study documented in this report used multiple datasets to confirm and extend ear-lier findings. Specifically, this study included three sets of analyses designed to investi-gate the relationship between black-white differences in prior educational achievementand a variety of subsequent outcomes:4
• The first set of analyses considered the extent to which black-white differences inlabor market outcomes were present for young adults as a whole and for youngadults with similar levels of prior educational achievement.
• The second set of analyses considered the extent to which black-white differencesin educational attainment were present for young adults as a whole and for youngadults with similar levels of prior educational achievement.
• The final set of analyses considered the extent to which black-white differencesin mathematics and reading achievement were present for children as a whole andfor children with similar levels of prior educational achievement. These analysesalso considered the extent to which black-white achievement gaps varied in sizeduring elementary and secondary school.
IV. BLACK-WHITE DIFFERENCES IN LABOR MARKETOUTCOMES
A. Main FindingsAnalyses of labor market outcomes between 1979 and 19925 indicate that, for youngadults with similar levels of prior educational achievement, the economic performanceof blacks relative to whites was substantially greater than for young adults as a whole.For young adults with similar levels of prior educational achievement, black-white gapsin unemployment rates were at least one-half smaller than for young adults as a whole.Among men with similar levels of prior educational achievement, black-white gaps inannual earnings were at least two-fifths smaller than for men as a whole. Black womenwith levels of prior educational achievement similar to white women earned as muchas, or more than, their white counterparts.
Executive Summary vii
4Prior educational achievement is defined as prior mathematics and/or reading achievement. Theaccompanying figures indicate outcomes for all whites, all blacks, and blacks at whites’ level of prior edu-cational achievement.
5The analyses of labor market outcomes focused on four samples of young adults: (1) young adultswho were high school seniors in 1972 and who were observed 7 years later through the NationalLongitudinal Study of the High School Class of 1972 (“the 1979 sample”); (2) young adults who were highschool seniors between 1976 and 1982 and who were observed 7 years later through the NationalLongitudinal Survey of Youth (“the 1983–1989 sample”); (3) young adults who were high school sopho-mores between 1974 and 1980 and who were observed 12 years later through the National LongitudinalSurvey of Youth (“the 1986–1992 sample”); and (4) young adults who were high school sophomores in1980 and who were observed 12 years later through the High School and Beyond Survey (“the 1992 sam-ple”). High school sophomores and seniors were generally identified as of the spring of each year.Educational achievement was measured in 1972 for the 1979 samples and in 1980 for the other samples.
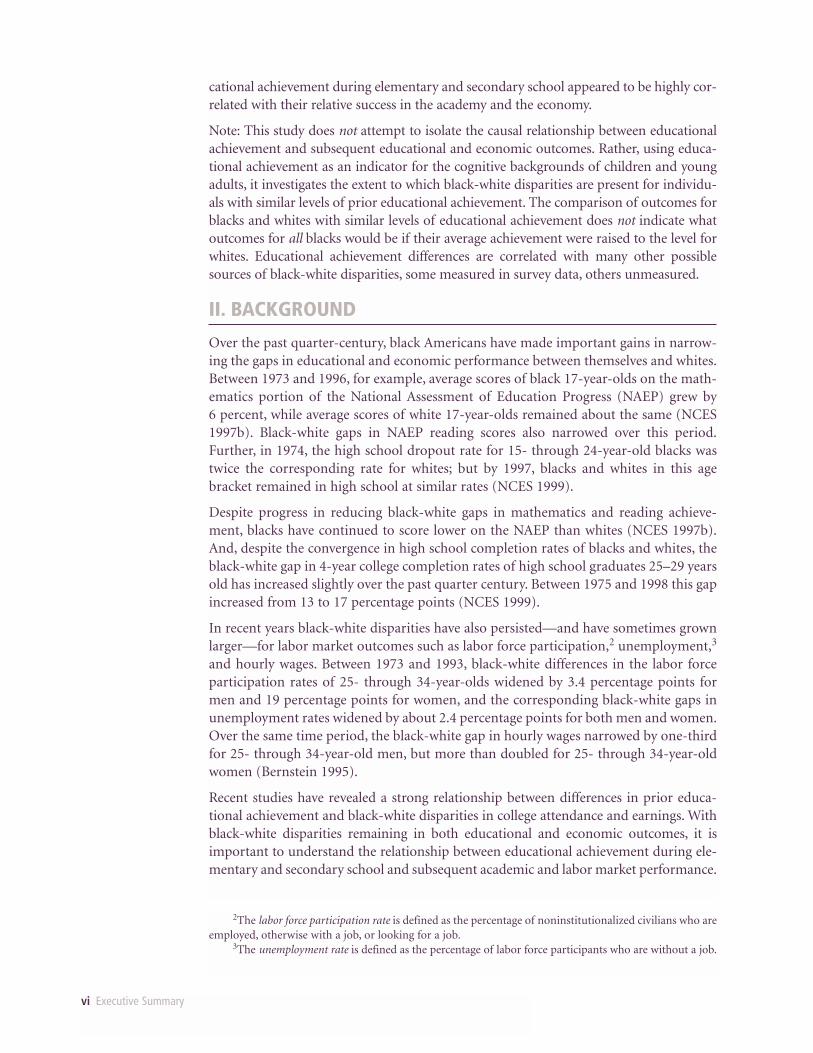
B. Unemployment RatesFor the samples of young adults studied, there were no consistent differences betweenblacks and whites in terms of labor force participation, but black labor force partici-pants were more likely to be unemployed than white labor force participants (figure 1).The absolute black-white gaps in unemployment rates ranged between 4 and 10 per-centage points, and were similar in size for men and women. These gaps were at leastone-half smaller for young adults with similar levels of prior educational achievementthan for young adults as a whole.
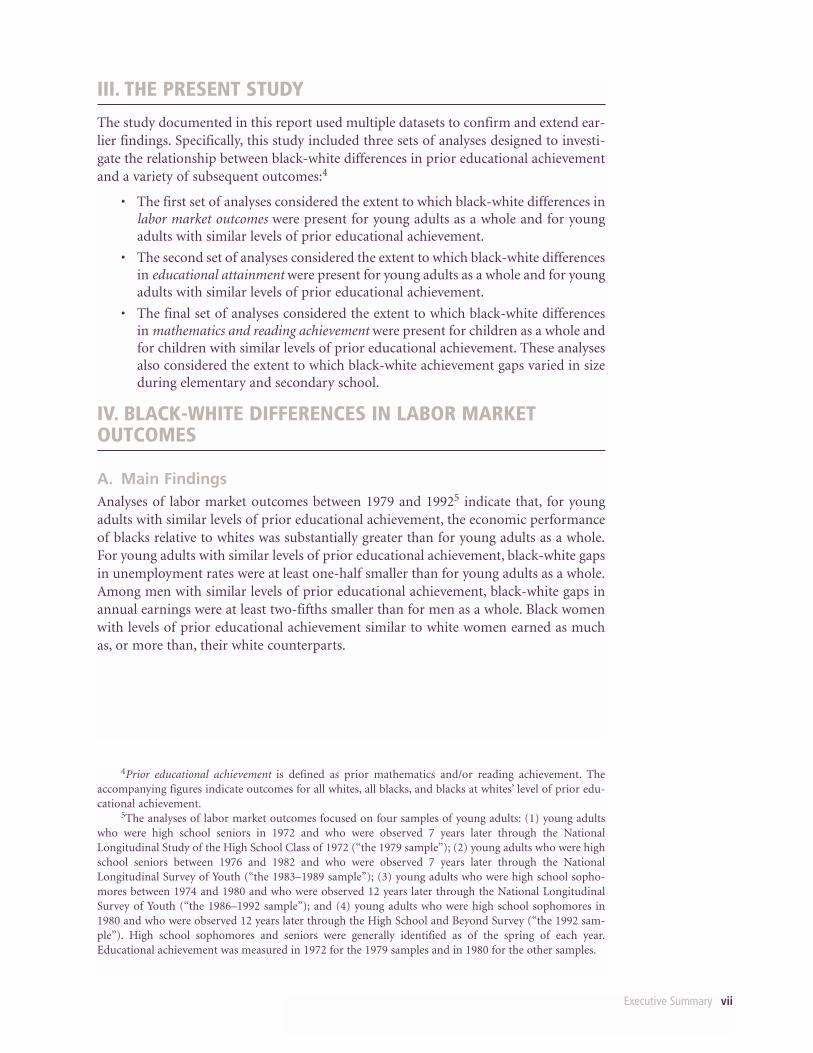
C. Annual EarningsFor the samples of young adults studied, blacks generally earned less per year thanwhites (figure 2).6 Black-white gaps in annual earnings for men ranged from 16 percentin the 1979 sample to about 32 percent in the 1983-1989 and 1986–1992 samples. In the1979 and 1992 samples, black women and white women had similar earnings. In the1986–1992 sample, the black-white earnings gap for women was about two-thirdssmaller than the corresponding gap for men.
viii Executive Summary
Figure 1—Unemployment rates for black and white young adults, 1979–1992
6The pattern of black-white gaps in hourly wages—reported in every sample except the 1992 HighSchool and Beyond sample—was generally similar to the pattern of gaps in annual earnings.
NOTE: Samples restricted to civilian labor force participants; higher end of gray range is for blacks.
SOURCE: U. S. Department of Education, National Center for Education Statistics, National Longitudinal Study of the High School Class of 1972 (1979 sample, 7 years after grade 12), High School and Beyond (1992 sample, 12 years after grade 10); and U. S. Department of Labor, Bureau of Labor Statistics, National Longitudinal Survey of Youth (1983-89 sample, 7 years after grade 12, and 1986-92 sample, 12 years after grade 10)
18
16
14
12
10
8
6
4
2
Perc
enta
ge p
oint
s
Year(s)in 1983–1989
(W)
(B)
in 1986–1992
(W)
(B)
in 1992
(W)
(B)
in 1979
(B)
(W)
All blacks/all whitesBlacks with prior educationalachievement similar to whites'
For men with similar levels of prior educational achievement, the black-white gap inannual earnings was measured imprecisely in the 1979 sample, such that it was distin-guishable neither from zero, nor from the gap for men as a whole. In the 1983-1989,1986-1992, and 1992 samples, the black-white earnings gap for men with similar edu-cational achievement was over two-fifths smaller than for men as a whole.
For women with similar levels of prior educational achievement, blacks earned 12 percentmore per year than whites in the 1979 sample, 22 percent more per year than whites in the1992 sample, and about the same as whites in the 1983-1989 and 1986-1992 samples.
D. Additional Sources of Disparities in Labor Market OutcomesSince differences in educational achievement can predict only a portion of black-whitedifferences in employment and men’s earnings, other factors must contribute to racialdisparities in these outcomes. Possible reasons for the remainder of these gaps includea relative shortage of jobs in areas where blacks live, fewer job networks for blacks, andthe existence of labor market discrimination against blacks. Unmeasured skill differ-ences between labor force participants of different racial backgrounds may also con-tribute to the remaining black-white disparities in employment and men’s earnings.
Executive Summary ix
24
22
20
18
16
14
12
10
8
Thou
sand
s of
199
2 D
olla
rs
Year(s)
(B)
(W)
All whites/all blacksBlacks with prior educationalachievement similar to whites'
NOTE: Samples restricted to civilians reporting some earnings; higher end of gray range is for whites, except in the case of women in 1992.
SOURCE: U.S. Department of Education, National Center for Education Statistics, National Longitudinal Study of the High School of 1972 (1979 sample, 7 years after grade 12), High School and Beyond (1992 sample, 12 years after grade 10); and U.S. Department of Labor, Bureau of Labor Statistics, National Survey of Youth (1983-89 sample, 7 years after grade 12, and 1986-92 sample, 12 years
in 1979 in 1983- 1989
in 1986- 1992
in 1992 in 1979 in 1983- 1989
in 1986- 1992
in 1992
(B)
(W)
(B)
(W) (B)
(W)
(B)(W)
(B)
(W)
(B)(W)
(B)
(W)
Men Women
Figure 2—Average annual earnings for black and white young men and women, 1979-1992
V. BLACK-WHITE DIFFERENCES IN EDUCATIONAL ATTAINMENT
A. Main FindingsBlacks having similar levels of prior educational achievement as whites had received ahigh school diploma or General Educational Development (GED) certificate at an equalor higher rate than whites. For young adults with similar levels of prior educationalachievement in the same four samples observed between 1979 and 1992, the postsec-ondary educational attainment of blacks was as high as, or higher than, that of whites.7
For such young adults, the college attendance rate was higher for blacks than for whites.Further, black college attendees with levels of prior educational achievement similar tothose for whites completed college at rates similar to, or higher than, the rates for whitecollege attendees.
B. High School/GED Completion RatesBlack-white differences in high school/GED completion rates could be compared forevery sample of young adults except the 1979 sample.8 A black-white gap in highschool/GED completion rates (in the range of 2 to 8 percentage points) was evident inthe 1983–1989, 1986–1992, and 1992 samples. For young adults with similar levels ofprior educational achievement, blacks received high school diplomas or GED certifi-cates at a rate similar to or higher than whites.
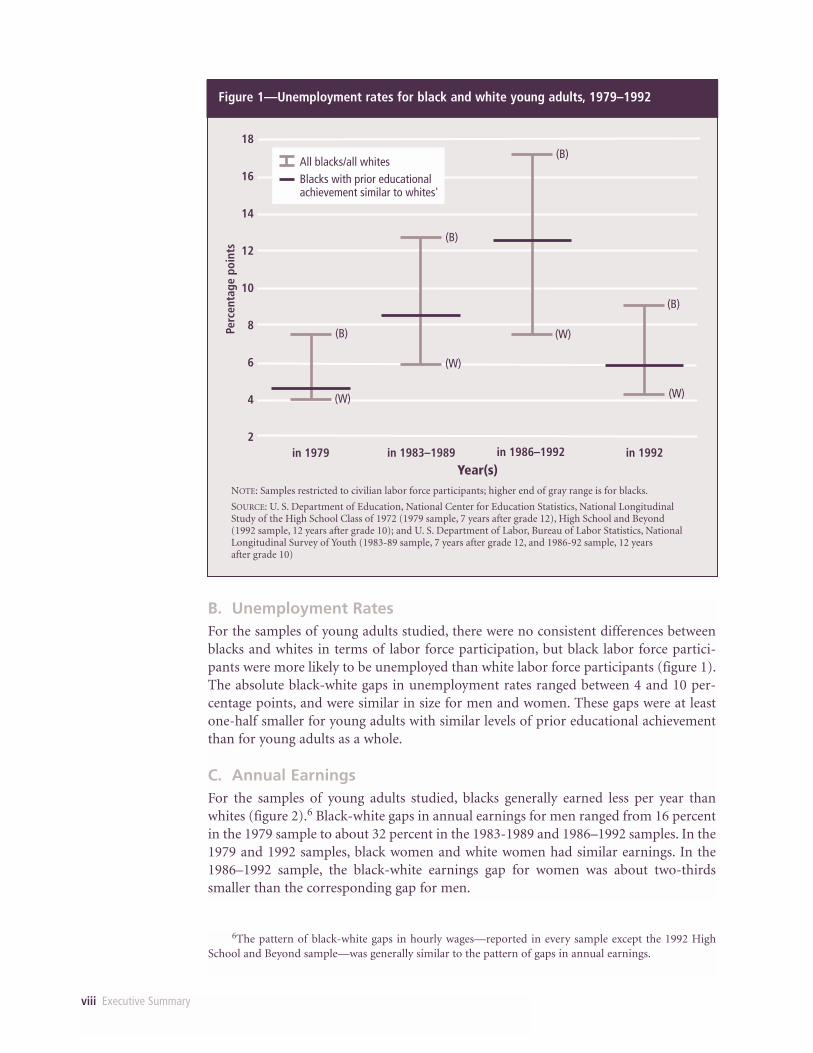
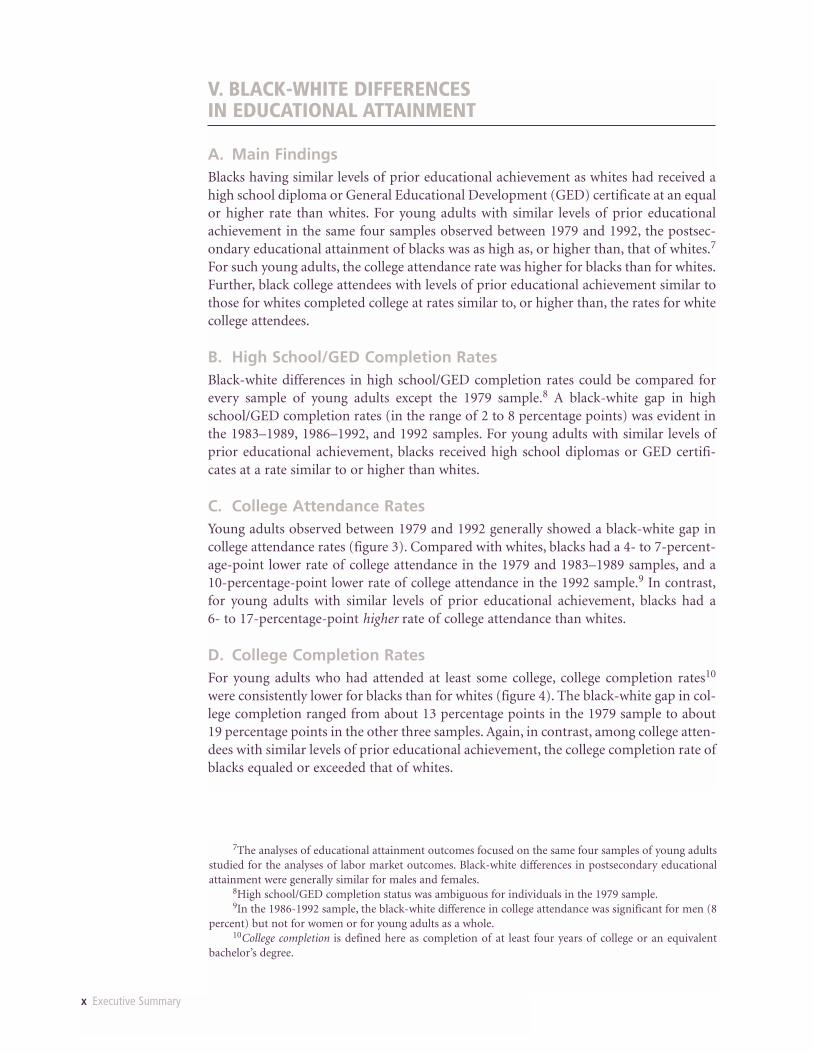
C. College Attendance RatesYoung adults observed between 1979 and 1992 generally showed a black-white gap incollege attendance rates (figure 3). Compared with whites, blacks had a 4- to 7-percent-age-point lower rate of college attendance in the 1979 and 1983–1989 samples, and a 10-percentage-point lower rate of college attendance in the 1992 sample.9 In contrast,for young adults with similar levels of prior educational achievement, blacks had a 6- to 17-percentage-point higher rate of college attendance than whites.
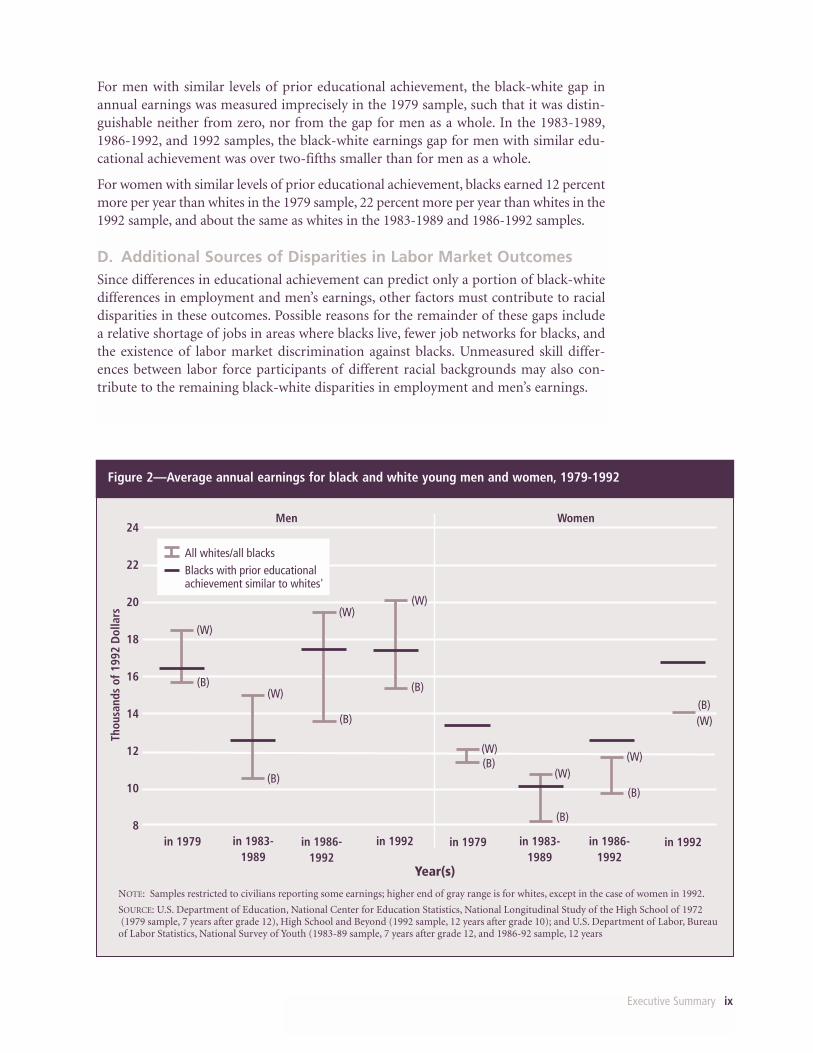
D. College Completion RatesFor young adults who had attended at least some college, college completion rates10
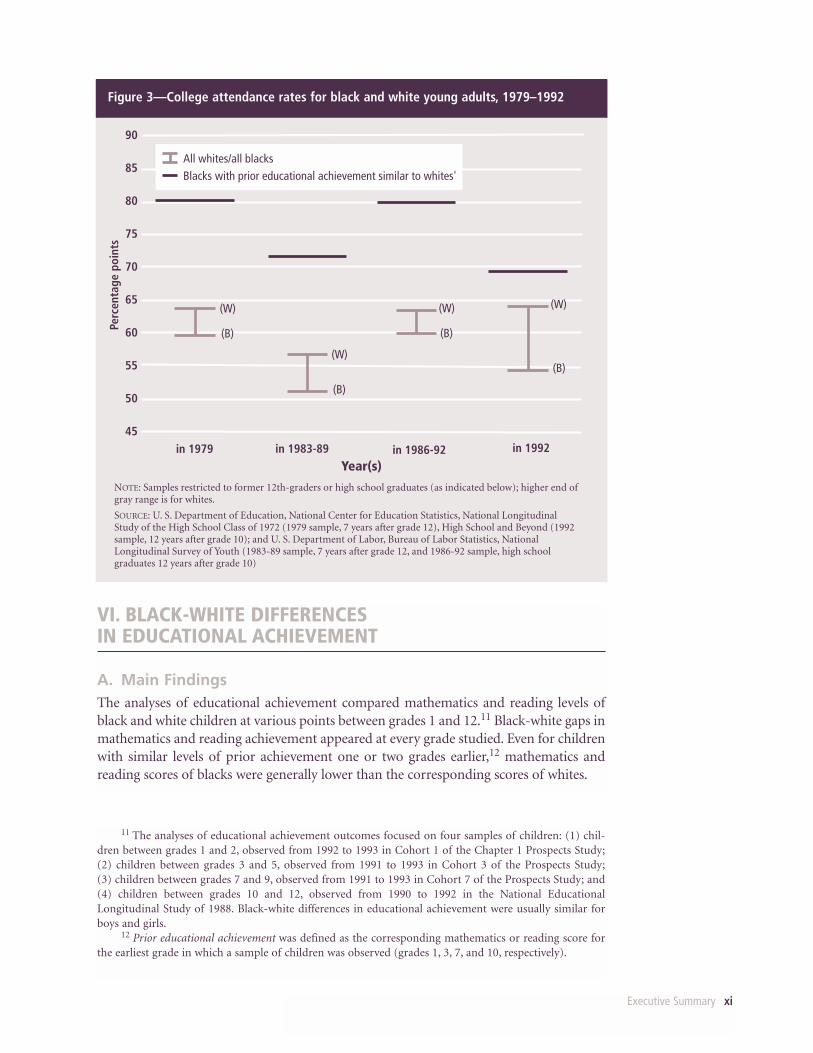
were consistently lower for blacks than for whites (figure 4). The black-white gap in col-lege completion ranged from about 13 percentage points in the 1979 sample to about19 percentage points in the other three samples. Again, in contrast, among college atten-dees with similar levels of prior educational achievement, the college completion rate ofblacks equaled or exceeded that of whites.
x Executive Summary
7The analyses of educational attainment outcomes focused on the same four samples of young adultsstudied for the analyses of labor market outcomes. Black-white differences in postsecondary educationalattainment were generally similar for males and females.
8High school/GED completion status was ambiguous for individuals in the 1979 sample.9In the 1986-1992 sample, the black-white difference in college attendance was significant for men (8
percent) but not for women or for young adults as a whole.10College completion is defined here as completion of at least four years of college or an equivalent
bachelor’s degree.
Executive Summary xi
VI. BLACK-WHITE DIFFERENCES IN EDUCATIONAL ACHIEVEMENT
A. Main FindingsThe analyses of educational achievement compared mathematics and reading levels ofblack and white children at various points between grades 1 and 12.11 Black-white gaps inmathematics and reading achievement appeared at every grade studied. Even for childrenwith similar levels of prior achievement one or two grades earlier,12 mathematics andreading scores of blacks were generally lower than the corresponding scores of whites.
11 The analyses of educational achievement outcomes focused on four samples of children: (1) chil-dren between grades 1 and 2, observed from 1992 to 1993 in Cohort 1 of the Chapter 1 Prospects Study;(2) children between grades 3 and 5, observed from 1991 to 1993 in Cohort 3 of the Prospects Study;(3) children between grades 7 and 9, observed from 1991 to 1993 in Cohort 7 of the Prospects Study; and(4) children between grades 10 and 12, observed from 1990 to 1992 in the National EducationalLongitudinal Study of 1988. Black-white differences in educational achievement were usually similar forboys and girls.
12 Prior educational achievement was defined as the corresponding mathematics or reading score forthe earliest grade in which a sample of children was observed (grades 1, 3, 7, and 10, respectively).
Figure 3—College attendance rates for black and white young adults, 1979–1992
90
85
80
75
70
65
60
55
50
45
Perc
enta
ge p
oint
s
Year(s)
(B)
(W)
in 1979 in 1983-89 in 1986-92 in 1992
All whites/all blacksBlacks with prior educational achievement similar to whites'
(B)
(W)
(B)
(W)
(B)
(W)
NOTE: Samples restricted to former 12th-graders or high school graduates (as indicated below); higher end of gray range is for whites.
SOURCE: U. S. Department of Education, National Center for Education Statistics, National Longitudinal Study of the High School Class of 1972 (1979 sample, 7 years after grade 12), High School and Beyond (1992 sample, 12 years after grade 10); and U. S. Department of Labor, Bureau of Labor Statistics, National Longitudinal Survey of Youth (1983-89 sample, 7 years after grade 12, and 1986-92 sample, high school graduates 12 years after grade 10)
Comparisons of the size of black-white achievement gaps were possible between near-by grades within the same sample of children, as well as across different samples of chil-dren from grades 1 to 12. The black-white mathematics gap differed in size acrossgrades, in a manner consistent with a narrowing of the gap during elementary school,followed by a widening of the gap during junior high school and little change duringsenior high school. The black-white reading gap also differed in size across grades, butnot in an entirely consistent manner; it grew wider between grades within two elemen-tary school cohorts, but was narrower in cohorts observed in grades 9 and 12 than in acohort observed in grade 2.
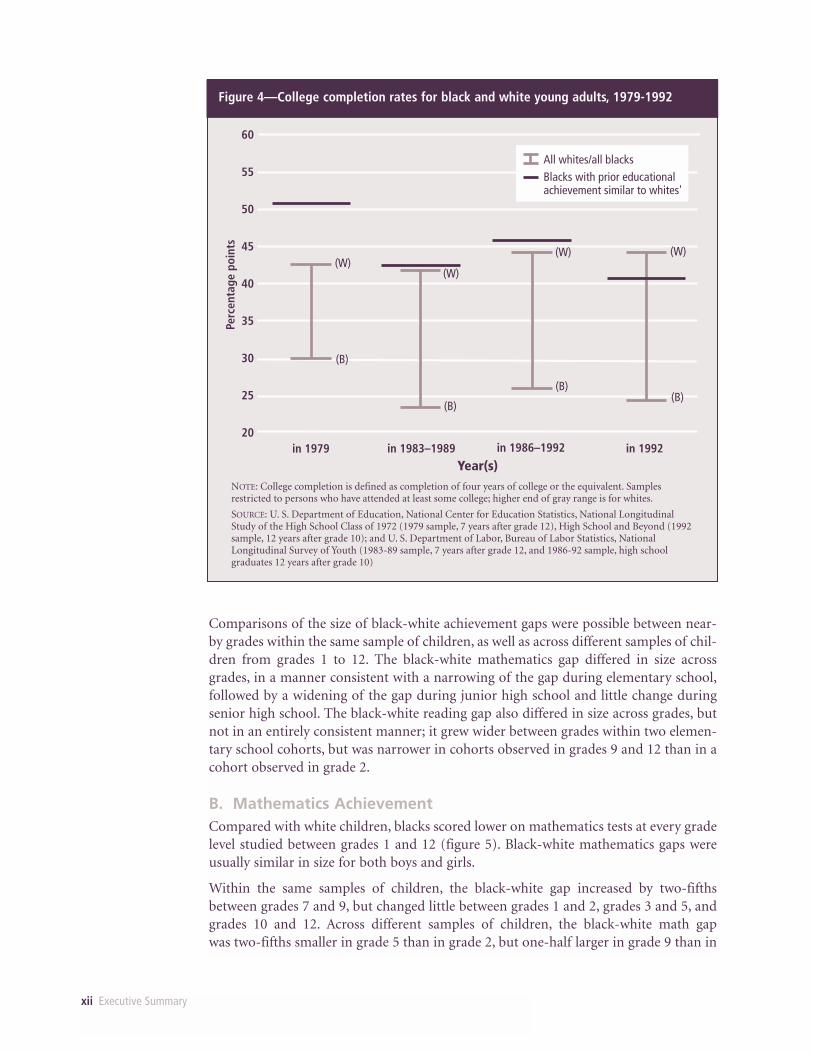
B. Mathematics AchievementCompared with white children, blacks scored lower on mathematics tests at every gradelevel studied between grades 1 and 12 (figure 5). Black-white mathematics gaps wereusually similar in size for both boys and girls.
Within the same samples of children, the black-white gap increased by two-fifthsbetween grades 7 and 9, but changed little between grades 1 and 2, grades 3 and 5, andgrades 10 and 12. Across different samples of children, the black-white math gap was two-fifths smaller in grade 5 than in grade 2, but one-half larger in grade 9 than in
xii Executive Summary
Figure 4—College completion rates for black and white young adults, 1979-1992
NOTE: College completion is defined as completion of four years of college or the equivalent. Samples restricted to persons who have attended at least some college; higher end of gray range is for whites.
SOURCE: U. S. Department of Education, National Center for Education Statistics, National LongitudinalStudy of the High School Class of 1972 (1979 sample, 7 years after grade 12), High School and Beyond (1992 sample, 12 years after grade 10); and U. S. Department of Labor, Bureau of Labor Statistics, National Longitudinal Survey of Youth (1983-89 sample, 7 years after grade 12, and 1986-92 sample, high school graduates 12 years after grade 10)
60
55
50
45
40
35
30
25
20
Perc
enta
ge p
oint
s
Year(s)
(W)
(B)
in 1979
All whites/all blacksBlacks with prior educationalachievement similar to whites'
in 1983–1989 in 1986–1992 in 1992
(W)
(B)
(W)
(B)
(W)
(B)
grade 5, and about the same size in grade 12 as in grade 9. Between the grade 2 andgrade 12 samples there was no difference in the size of the black-white math gap, sug-gesting that any narrowing of the gap between grades 2 and 5 was largely negated by thewidening of the gap between grades 5 and 9.13
Even for children who had similar math scores one or two grades earlier,a black-whitemathematics gap usually appeared. A black-white mathematics gap was present in grade2, even for children with similar math scores in grade 1; in grade 5, even for childrenwith similar math scores in grade 3; in grade 9, even for children with similar mathscores in grade 7. These gaps were 59 to 70 percent smaller than the correspondingmathematics gaps for children as a whole. (Black and white children with similar mathscores in grade 10 had similar math scores in grade 12.)
Executive Summary xiii
13 Note that comparisons of the grade 2, grade 5, grade 9, and grade 12 gaps involve four separate sam-ples of children, which, while generally similar in observed family background characteristics, may differ interms of unobserved family background and school characteristics. For the sample of children observedbetween grades 10 and 12, however, there is corroborating evidence of a widening of the black-white math-ematics gap by about one-fifth between grades 8 and 10.
Figure 5—Average mathematics achievement scores for black and white children,1990-1993
2
1
0
-1
-2
-3
-4
-5
-6
8th
grad
e st
anda
rd d
evia
tion
uni
ts
Grade
(W)
(B)
1
All whites/all blacksBlacks with prior educationalachievement similar to whites'
2 3 4 5 6 7 8 9 10 11 12
NOTE: Prior mathematics achievement refers to mathematics achievement one grade earlier for grade 2 sample and two grades earlier for the grade 5, grade 9, and grade 12 samples. Mathematics scores are normalized so the grade 8 score for children of all races has mean 0 and standard deviation 1 in the grade 9 and grade 12 samples. Higher end of gray range is for whites.
SOURCE: U. S. Department of Education, Chapter 1 Prospects Study (1992-1993 sample of 1st- through 2nd- graders, and 1991-1993 samples of 3rd- through 5th- graders and 7th- through 9th- graders), and National Educational Longitudinal Study of 1988 (1990-1992 sample of 10th- through 12th- graders).
(W)
(B)
(W)
(B)
(W)
(B)
(W)
(B)
(W)
(B)
(W)
(B)
(W)
(B)
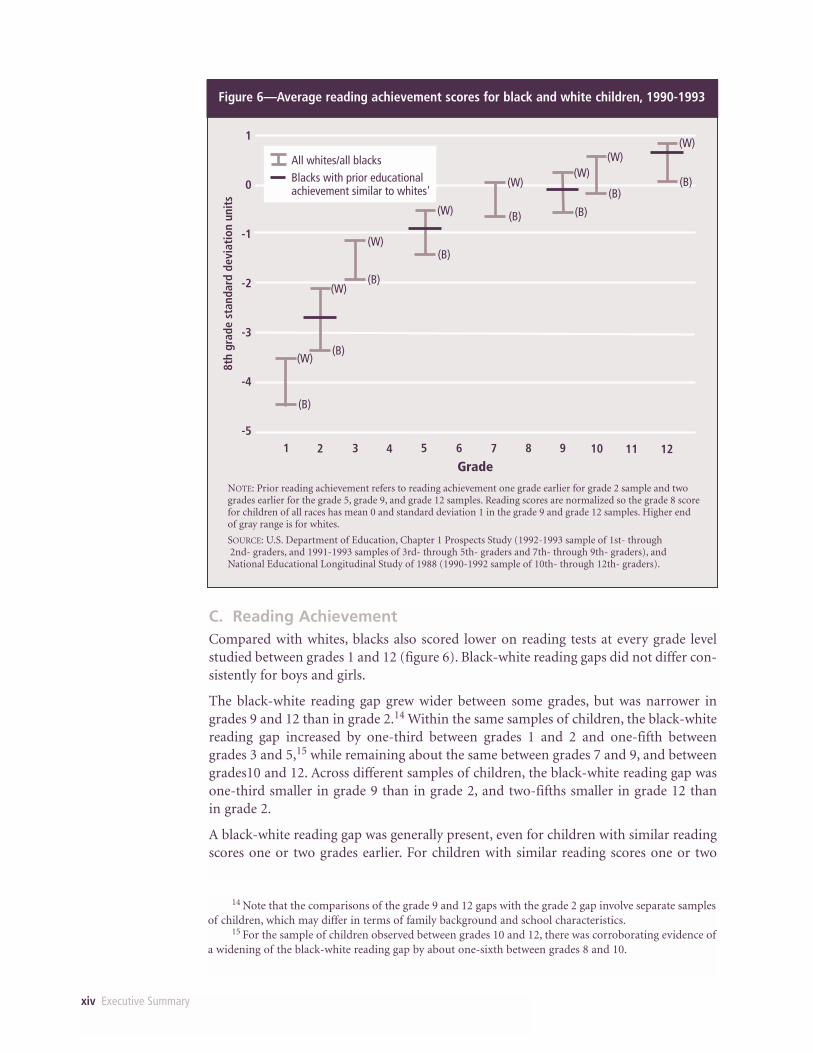
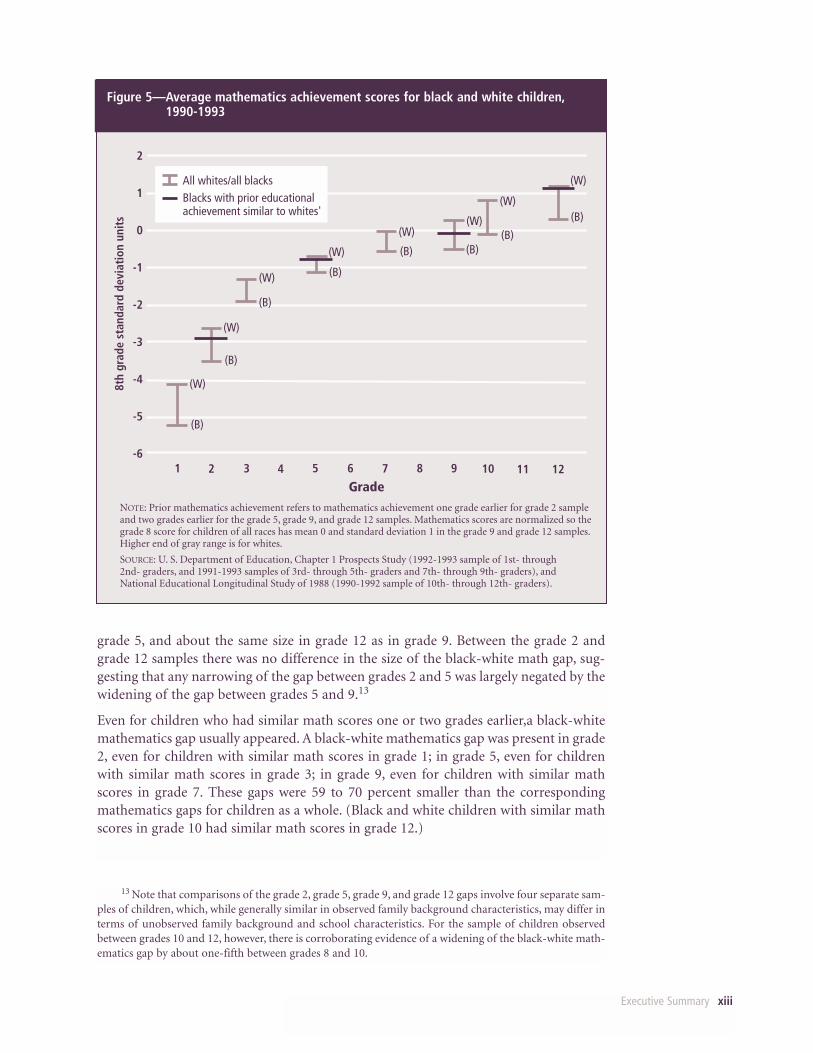
C. Reading AchievementCompared with whites, blacks also scored lower on reading tests at every grade levelstudied between grades 1 and 12 (figure 6). Black-white reading gaps did not differ con-sistently for boys and girls.
The black-white reading gap grew wider between some grades, but was narrower ingrades 9 and 12 than in grade 2.14 Within the same samples of children, the black-whitereading gap increased by one-third between grades 1 and 2 and one-fifth betweengrades 3 and 5,15 while remaining about the same between grades 7 and 9, and betweengrades10 and 12. Across different samples of children, the black-white reading gap wasone-third smaller in grade 9 than in grade 2, and two-fifths smaller in grade 12 than in grade 2.
A black-white reading gap was generally present, even for children with similar readingscores one or two grades earlier. For children with similar reading scores one or two
xiv Executive Summary
14 Note that the comparisons of the grade 9 and 12 gaps with the grade 2 gap involve separate samplesof children, which may differ in terms of family background and school characteristics.
15 For the sample of children observed between grades 10 and 12, there was corroborating evidence ofa widening of the black-white reading gap by about one-sixth between grades 8 and 10.
Figure 6—Average reading achievement scores for black and white children, 1990-1993
1
0
-1
-2
-3
-4
-5
8th
grad
e st
anda
rd d
evia
tion
uni
ts
Grade
(W)
(B)
1
All whites/all blacksBlacks with prior educationalachievement similar to whites'
2 3 4 5 6 7 8 9 10 11 12
(W)
(B)
(W)
(B)
(W)
(B)
(W)
(B)
(W)
(B)
(W)
(B)
(W)
(B)
NOTE: Prior reading achievement refers to reading achievement one grade earlier for grade 2 sample and two grades earlier for the grade 5, grade 9, and grade 12 samples. Reading scores are normalized so the grade 8 score for children of all races has mean 0 and standard deviation 1 in the grade 9 and grade 12 samples. Higher end of gray range is for whites.
SOURCE: U.S. Department of Education, Chapter 1 Prospects Study (1992-1993 sample of 1st- through 2nd- graders, and 1991-1993 samples of 3rd- through 5th- graders and 7th- through 9th- graders), and National Educational Longitudinal Study of 1988 (1990-1992 sample of 10th- through 12th- graders).
grades earlier, respectively, the black-white reading gap was 58 to 77 percent smallerthan the corresponding black-white reading gap for children as a whole.
While findings within the same samples of children would, by themselves, suggest awidening of the black-white reading gap as children progressed through school, find-ings across different samples suggest an overall narrowing of the black-white readinggap between grades 2 and 9, with this narrowing persisting through grade 12. This dif-ference in findings may be consistent with the actual experiences of children as theyprogressed through school, or it may arise from the use of different cohorts of childrenin the comparisons. The collection and analysis of longitudinal data following the samesample of children all the way from grade 2 through grade 12 would help to furtheraddress the question of how the black-white reading gap changes over the course of theschool years.
D. Additional Sources of Disparities in Educational AchievementOn average, blacks in grade 1 had lower mathematics and reading scores than whites,and blacks in grade 12 also had lower mathematics and reading scores than whites.Among children with similar test scores one or two grades earlier, blacks generallyacquired fewer reading skills than whites, and usually acquired fewer mathematics skillsas well. These findings imply that black-white disparities in educational achievementcan widen as students progress through elementary or secondary school. Possible expla-nations for these differences in achievement growth include differences in the school orhome environments of children of different racial backgrounds that make it more dif-ficult for blacks to acquire math or reading skills at the same pace as whites.
VII. CONCLUSION
The findings of this study imply that, over the past two decades, black-white differencesin educational achievement have been strongly associated with black-white disparitiesin a variety of educational and economic outcomes. Achievement differences do notnecessarily cause gaps in educational attainment, employment, or earnings, but theyreflect a set of circumstances responsible for black-white disparities in both the acade-my and the economy. Addressing the contributing causes of black-white achievementdifferences will be important in efforts to narrow black-white gaps in educational per-formance, and perhaps also in subsequent labor market outcomes.
Executive Summary xv
xvii
CONTENTSAcknowledgments . . . . . . . . . . . . . . . . . . . . . . . . . . . . . . . . . . . . . . . . . . . . . . . . . . iii
Executive Summary . . . . . . . . . . . . . . . . . . . . . . . . . . . . . . . . . . . . . . . . . . . . . . . . . v
Chapter 1. Prior Research on Black-White Differences in Educational and Economic Outcomes . . . . . . . . . . . . . . . . . . . . . . . . . . . 1
I. Labor Market Outcomes. . . . . . . . . . . . . . . . . . . . . . . . . . . . . . . . . . . . . . . . . . . . . 1
A. Labor Force Participation and Unemployment . . . . . . . . . . . . . . . . . . . . . . . . 2
B. Earnings . . . . . . . . . . . . . . . . . . . . . . . . . . . . . . . . . . . . . . . . . . . . . . . . . . . . . . 3
II. Educational Attainment . . . . . . . . . . . . . . . . . . . . . . . . . . . . . . . . . . . . . . . . . . . . . 4
A. High School/GED Completion . . . . . . . . . . . . . . . . . . . . . . . . . . . . . . . . . . . . 4
B. College Attendance and Completion . . . . . . . . . . . . . . . . . . . . . . . . . . . . . . . . 5
III. Educational Achievement . . . . . . . . . . . . . . . . . . . . . . . . . . . . . . . . . . . . . . . . . . . . 6
A. Measures of Educational Achievement . . . . . . . . . . . . . . . . . . . . . . . . . . . . . . 6
B. Explanations of the Relative Educational Achievement of Black Students . . . 7
IV. Conclusion . . . . . . . . . . . . . . . . . . . . . . . . . . . . . . . . . . . . . . . . . . . . . . . . . . . . . . . 9
Chapter 2. Black-White Differences in Labor Market Outcomes . . . . . . . . . . . . . . . . . . . . . . . . . . . . . . . . . . . . . . . . . . 11
I. Labor Force Participation . . . . . . . . . . . . . . . . . . . . . . . . . . . . . . . . . . . . . . . . . . . . 12
A. Labor Force Participation Rates . . . . . . . . . . . . . . . . . . . . . . . . . . . . . . . . . . . . 12
B. Relating Educational Achievement to Labor Force Participation Rates . . . . . 14
II. Unemployment . . . . . . . . . . . . . . . . . . . . . . . . . . . . . . . . . . . . . . . . . . . . . . . . . . . . 14
A. Unemployment Rates . . . . . . . . . . . . . . . . . . . . . . . . . . . . . . . . . . . . . . . . . . . . 15
B. Relating Achievement to Unemployment Rates. . . . . . . . . . . . . . . . . . . . . . . . 15
III. Earnings . . . . . . . . . . . . . . . . . . . . . . . . . . . . . . . . . . . . . . . . . . . . . . . . . . . . . . . . . 17
A. Annual Earnings . . . . . . . . . . . . . . . . . . . . . . . . . . . . . . . . . . . . . . . . . . . . . . . . 17
B. Relating Achievement to Annual Earnings. . . . . . . . . . . . . . . . . . . . . . . . . . . . 19
C. Hourly Wages . . . . . . . . . . . . . . . . . . . . . . . . . . . . . . . . . . . . . . . . . . . . . . . . . . 19
D. Relating Achievement to Hourly Wages . . . . . . . . . . . . . . . . . . . . . . . . . . . . . . 20
IV. Conclusion . . . . . . . . . . . . . . . . . . . . . . . . . . . . . . . . . . . . . . . . . . . . . . . . . . . . . . . 21
Chapter 3. Black-White Differences in Educational Attainment . . . . . . . . . . . . . . . . . . . . . . . . . . . . . . . . . . . . . . . . . . 23
I. High School/GED Completion. . . . . . . . . . . . . . . . . . . . . . . . . . . . . . . . . . . . . . . . 23
A. High School/GED Completion Rates. . . . . . . . . . . . . . . . . . . . . . . . . . . . . . . . 24
B. Relating Achievement to High School/GED Completion Rates . . . . . . . . . . . 24
II. College Attendance and Completion . . . . . . . . . . . . . . . . . . . . . . . . . . . . . . . . . . . 24
A. College Attendance Rates . . . . . . . . . . . . . . . . . . . . . . . . . . . . . . . . . . . . . . . . . 26
B. Relating Achievement to College Attendance Rates. . . . . . . . . . . . . . . . . . . . . 26
C. College Completion Rates . . . . . . . . . . . . . . . . . . . . . . . . . . . . . . . . . . . . . . . . 26
D. Relating Achievement to College Completion Rates . . . . . . . . . . . . . . . . . . . . 26
III. Conclusion . . . . . . . . . . . . . . . . . . . . . . . . . . . . . . . . . . . . . . . . . . . . . . . . . . . . . . . 29
xviii
Chapter 4. Black-White Differences in Educational Achievement . . . . . . . . . . . . . . . . . . . . . . . . . . . . . . . . . . . . . . . . 31
I. Mathematics Achievement . . . . . . . . . . . . . . . . . . . . . . . . . . . . . . . . . . . . . . . . . . . 32
A. Mathematics Achievement in Grades 1 to 5. . . . . . . . . . . . . . . . . . . . . . . . . . . 32
B. Mathematics Achievement in Grades 7 to 12. . . . . . . . . . . . . . . . . . . . . . . . . . 34
C. Mathematics Achievement in Grades 2 to 12. . . . . . . . . . . . . . . . . . . . . . . . . . 34
II. Reading Achievement . . . . . . . . . . . . . . . . . . . . . . . . . . . . . . . . . . . . . . . . . . . . . . . 37
A. Reading Achievement in Grades 1 to 5 . . . . . . . . . . . . . . . . . . . . . . . . . . . . . . 37
B. Reading Achievement in Grades 7 to 12 . . . . . . . . . . . . . . . . . . . . . . . . . . . . . 39
C. Reading Achievement in Grades 2 to 12 . . . . . . . . . . . . . . . . . . . . . . . . . . . . . 39
III. Conclusion . . . . . . . . . . . . . . . . . . . . . . . . . . . . . . . . . . . . . . . . . . . . . . . . . . . . . . . 42
References . . . . . . . . . . . . . . . . . . . . . . . . . . . . . . . . . . . . . . . . . . . . . . . . . . . . . . . . . . . . 43
Appendix A. Sample Definitions and Treatment of Missing Data . . . . . . . . . . . . . . . . . . . . . . . . . . . . . . . . . . . . . 47
I. Multiple Imputation of Missing Data . . . . . . . . . . . . . . . . . . . . . . . . . . . . . . . . . . 47
II. Data Used in the Analyses of Labor Market Outcomes . . . . . . . . . . . . . . . . . . . . . 48
A. Samples . . . . . . . . . . . . . . . . . . . . . . . . . . . . . . . . . . . . . . . . . . . . . . . . . . . . . . 48
B. Variable Definitions. . . . . . . . . . . . . . . . . . . . . . . . . . . . . . . . . . . . . . . . . . . . . . 49
C. Sample Sizes . . . . . . . . . . . . . . . . . . . . . . . . . . . . . . . . . . . . . . . . . . . . . . . . . . . 50
D. Multiple Imputation of Missing Data . . . . . . . . . . . . . . . . . . . . . . . . . . . . . . . 50
E. Characteristics of Cases with Missing Data . . . . . . . . . . . . . . . . . . . . . . . . . . . 53
III. Data Used in the Analyses of Educational Attainment Outcomes . . . . . . . . . . . . 59
A. Samples . . . . . . . . . . . . . . . . . . . . . . . . . . . . . . . . . . . . . . . . . . . . . . . . . . . . . . 59
B. Variable Definitions. . . . . . . . . . . . . . . . . . . . . . . . . . . . . . . . . . . . . . . . . . . . . . 59
C. Sample Sizes and Multiple Imputation of Missing Data . . . . . . . . . . . . . . . . . 60
IV. Data Used in the Analyses of Educational Achievement Outcomes . . . . . . . . . . . 61
A. Samples . . . . . . . . . . . . . . . . . . . . . . . . . . . . . . . . . . . . . . . . . . . . . . . . . . . . . . 61
B. Variable Definitions. . . . . . . . . . . . . . . . . . . . . . . . . . . . . . . . . . . . . . . . . . . . . . 61
C. Sample Sizes . . . . . . . . . . . . . . . . . . . . . . . . . . . . . . . . . . . . . . . . . . . . . . . . . . . 62
D. Multiple Imputation of Missing Data . . . . . . . . . . . . . . . . . . . . . . . . . . . . . . . 63
E. Characteristics of Cases with Missing Data . . . . . . . . . . . . . . . . . . . . . . . . . . . 65
Appendix B. Sample Comparisons . . . . . . . . . . . . . . . . . . . . . . . . . . . . . . . . . 71
I. Comparisons of Samples Used in Analyses of Labor Market and
Attainment Outcomes . . . . . . . . . . . . . . . . . . . . . . . . . . . . . . . . . . . . . . . . . . . . . . 71
II. Comparisons of Samples Used in Analyses of Educational
Achievement Outcomes . . . . . . . . . . . . . . . . . . . . . . . . . . . . . . . . . . . . . . . . . . . . . 74
Appendix C. Analysis Methodology . . . . . . . . . . . . . . . . . . . . . . . . . . . . . . . . 83
I. Approach to Estimation of Black-White Differences in Outcomes. . . . . . . . . . . . 83
II. Effects of Sample Selection on Estimates of Black-White Differences . . . . . . . . . 86
III. Effects of Measurement Error on Estimates of Black-White Differences . . . . . . . 86
Appendix D. Sample Sizes and Standard Errors for Tables in Chapters 2, 3, and 4 . . . . . . . . . . . . . . . . . . . . . . . . . . . . . . . . . . . 87
xix
Appendix E. The Sensitivity of Black-White Differences in High School Completion to Variable and Sample Definitions . . . . . . . . . . . . . . . . . . . . . . . . . . . . . . . . . . . . . . . . . . . . . . . . . . . 101
I. High School Completion Rates When GEDs Are Not Counted
as High School Equivalents . . . . . . . . . . . . . . . . . . . . . . . . . . . . . . . . . . . . . . . . . . 101
II. High School/GED Completion Rates Including Institutionalized Persons. . . . . . 102
TABLES
2.1 Black-white differences in labor force participation rates for young adults
in 4 samples, 1979–1992 . . . . . . . . . . . . . . . . . . . . . . . . . . . . . . . . . . . . . . . . . . . . . . 13
2.2 Black-white differences in unemployment rates for young adults
in 4 samples, 1979–1992 . . . . . . . . . . . . . . . . . . . . . . . . . . . . . . . . . . . . . . . . . . . . . . 16
2.3 Black-white differences in average annual earnings for young adults
in 4 samples, 1979–1992 . . . . . . . . . . . . . . . . . . . . . . . . . . . . . . . . . . . . . . . . . . . . . . 18
2.4 Black-white differences in hourly wages for young adults in 3 samples,
1979–1992 . . . . . . . . . . . . . . . . . . . . . . . . . . . . . . . . . . . . . . . . . . . . . . . . . . . . . . . . . 20
3.1 Black-white differences in high school/GED completion rates for young
adults in 3 samples, 1983–1992. . . . . . . . . . . . . . . . . . . . . . . . . . . . . . . . . . . . . . . . . 25
3.2 Black-white differences in college attendance rates for young adults
in 4 samples, 1979–1992 . . . . . . . . . . . . . . . . . . . . . . . . . . . . . . . . . . . . . . . . . . . . . . 27
3.3 Black-white differences in college completion rates for young adults
in 4 samples, 1979–1992 . . . . . . . . . . . . . . . . . . . . . . . . . . . . . . . . . . . . . . . . . . . . . . 28
4.1 Black-white differences in average mathematics achievement
in grades 1 to 2 and 3 to 5 for 2 samples of children, 1991–1993 . . . . . . . . . . . . . . 33
4.2 Black-white differences in average mathematics achievement
in grades 7 to 9 and 10 to 12 for 2 samples of children, 1990–1993 . . . . . . . . . . . . 35
4.3 Black-white differences in average mathematics achievement
in grades 2, 5, 9, and 12 for 4 samples of children, 1992–1993 . . . . . . . . . . . . . . . . 36
4.4 Black-white differences in average reading achievement in grades 1 to 2
and 3 to 5 for 2 samples of children, 1991–1993 . . . . . . . . . . . . . . . . . . . . . . . . . . . 38
4.5 Black-white differences in average reading achievement in grades 7 to 9
and 10 to 12 for 2 samples of children, 1990–1993 . . . . . . . . . . . . . . . . . . . . . . . . . 40
4.6 Black-white differences in average reading achievement in grades 2, 5, 9,
and 12 for 4 samples of children, 1992–1993 . . . . . . . . . . . . . . . . . . . . . . . . . . . . . . 41
A.1 Total sample size and excluded cases (labor market/attainment datasets) . . . . . . . 51
A.2 Sample sizes by race/sex category (labor market/attainment datasets) . . . . . . . . . . 52
A.3 Comparison of black and white young adults in NLS:72, by presence
of all variables . . . . . . . . . . . . . . . . . . . . . . . . . . . . . . . . . . . . . . . . . . . . . . . . . . . . . . 54
A.4 Comparison of black and white young adults in NLSY, 7 years after grade 12,
by presence of all variables . . . . . . . . . . . . . . . . . . . . . . . . . . . . . . . . . . . . . . . . . . . . 55
A.5 Comparison of black and white young adults in NLSY observed 12 years
after grade 10, by presence of all variables . . . . . . . . . . . . . . . . . . . . . . . . . . . . . . . . 56
A.6 Comparison of black and white young adults in HSB observed 12 years
after grade 10, by presence of all variables . . . . . . . . . . . . . . . . . . . . . . . . . . . . . . . . 57
A.7 Comparison of black and white young adults in NLSY observed 12 years
after grade 10, by presence of all variables (in 1992 only) . . . . . . . . . . . . . . . . . . . . 58
xx
A.8 Total sample sizes and excluded cases (achievement datasets) . . . . . . . . . . . . . . . . 63
A.9 Sample sizes by race/sex category (achievement datasets) . . . . . . . . . . . . . . . . . . . . 64
A.10 Comparison of black and white children in Prospects Cohort 1, by presence
of SES and test score data . . . . . . . . . . . . . . . . . . . . . . . . . . . . . . . . . . . . . . . . . . . . . 66
A.11 Comparison of black and white children in Prospects Cohort 3, by presence
of SES and test score data . . . . . . . . . . . . . . . . . . . . . . . . . . . . . . . . . . . . . . . . . . . . . 67
A.12 Comparison of black and white children in Prospects Cohort 7, by presence
of SES and test score data . . . . . . . . . . . . . . . . . . . . . . . . . . . . . . . . . . . . . . . . . . . . . 68
A.13 Comparison of black and white children in NELS:88, by presence of SES
and test score data . . . . . . . . . . . . . . . . . . . . . . . . . . . . . . . . . . . . . . . . . . . . . . . . . . . 69
B.1 Comparison of black and white young adults in two datasets observed
7 years after grade 12. . . . . . . . . . . . . . . . . . . . . . . . . . . . . . . . . . . . . . . . . . . . . . . . . 72
B.2 Comparison of black and white young adults in two datasets observed
12 years after grade 10. . . . . . . . . . . . . . . . . . . . . . . . . . . . . . . . . . . . . . . . . . . . . . . . 73
B.3 Comparison of black and white young adults in two datasets observed
12 years after grade 10 (in 1992 only) . . . . . . . . . . . . . . . . . . . . . . . . . . . . . . . . . . . 75
B.4 Comparison of black and white children in Prospects Cohort 1 with black
and white children in Prospects Cohort 3 . . . . . . . . . . . . . . . . . . . . . . . . . . . . . . . . 77
B.5 Comparison of black and white children in Prospects Cohort 1 with black
and white children in Prospects Cohort 7 . . . . . . . . . . . . . . . . . . . . . . . . . . . . . . . . 78
B.6 Comparison of black and white children in Prospects Cohort 1 with black
and white children in NELS:88 . . . . . . . . . . . . . . . . . . . . . . . . . . . . . . . . . . . . . . . . . 79
B.7 Comparison of black and white children in Prospects Cohort 3 with black
and white children in Prospects Cohort 7 . . . . . . . . . . . . . . . . . . . . . . . . . . . . . . . . 80
B.8 Comparison of black and white children in Prospects Cohort 3 with black
and white children in NELS:88 . . . . . . . . . . . . . . . . . . . . . . . . . . . . . . . . . . . . . . . . . 81
B.9 Comparison of black and white children in Prospects Cohort 7 with black
and white children in NELS:88 . . . . . . . . . . . . . . . . . . . . . . . . . . . . . . . . . . . . . . . . . 82
D.1 Standard errors for Table 2.1: Black-white differences in labor force
participation rates for young adults in 4 samples, 1979–1992 . . . . . . . . . . . . . . . . . 88
D.2 Standard errors for Table 2.2: Black-white differences in unemployment rates
for young adults in 4 samples, 1979–1992 . . . . . . . . . . . . . . . . . . . . . . . . . . . . . . . . 89
D.3 Standard errors for Table 2.3: Black-white differences in average annual
earnings for young adults in 4 samples, 1979–1992 . . . . . . . . . . . . . . . . . . . . . . . . . 90
D.4 Standard errors for Table 2.4: Black-white differences in hourly wages
for young adults in 3 samples, 1979–1992 . . . . . . . . . . . . . . . . . . . . . . . . . . . . . . . . 91
D.5 Standard errors for Table 3.1: Black-white differences in high school/GED
completion rates for young adults in 3 samples, 1983–1992 . . . . . . . . . . . . . . . . . . 92
D.6 Standard errors for Table 3.2: Black-white differences in college attendance
rates for young adults in 4 samples, 1979–1992 . . . . . . . . . . . . . . . . . . . . . . . . . . . . 93
D.7 Standard errors for Table 3.3: Black-white differences in college completion
rates for young adults in 4 samples, 1979–1992 . . . . . . . . . . . . . . . . . . . . . . . . . . . . 94
D.8 Standard errors for Table 4.1: Black-white differences in average
mathematics achievement in grades 1 to 2 and 3 to 5 for 2 samples
of children, 1991–1993 . . . . . . . . . . . . . . . . . . . . . . . . . . . . . . . . . . . . . . . . . . . . . . . 95
xxi
D.9 Standard errors for Table 4.2: Black-white differences in average
mathematics achievement in grades 7 to 9 and 10 to 12 for 2 samples
of children, 1990–1993 . . . . . . . . . . . . . . . . . . . . . . . . . . . . . . . . . . . . . . . . . . . . . . . 96
D.10 Standard errors for Table 4.3: Black-white differences in average
mathematics achievement in grades 2, 5, 9, and 12 for 4 samples
of children, 1992–1993 . . . . . . . . . . . . . . . . . . . . . . . . . . . . . . . . . . . . . . . . . . . . . . . 97
D.11 Standard errors for Table 4.4: Black-white differences in average reading
achievement in grades 1 to 2 and 3 to 5 for 2 samples of children,
1991–1993 . . . . . . . . . . . . . . . . . . . . . . . . . . . . . . . . . . . . . . . . . . . . . . . . . . . . . . . . . 98
D.12 Standard errors for Table 4.5: Black-white differences in average reading
achievement in grades 7 to 9 and 10 to 12 for 2 samples of children,
1990–1993 . . . . . . . . . . . . . . . . . . . . . . . . . . . . . . . . . . . . . . . . . . . . . . . . . . . . . . . . . 99
D.13 Standard errors for Table 4.6: Black-white differences in average reading
achievement in grades 2, 5, 9, and 12 for 4 samples of children,
1992–1993 . . . . . . . . . . . . . . . . . . . . . . . . . . . . . . . . . . . . . . . . . . . . . . . . . . . . . . . . . 100
FIGURES
1 Unemployment rates for black and white young adults, 1979–1992 . . . . . . . . . . . . iv
2 Average annual earnings for black and white young men and women,
1979–1992 . . . . . . . . . . . . . . . . . . . . . . . . . . . . . . . . . . . . . . . . . . . . . . . . . . . . . . . . . v
3 College attendance rates for black and white young adults, 1979–1992 . . . . . . . . . vii
4 College completion rates for black and white young adults, 1979–1992. . . . . . . . . viii
5 Average mathematics achievement scores for black and white children,
1990–1993 . . . . . . . . . . . . . . . . . . . . . . . . . . . . . . . . . . . . . . . . . . . . . . . . . . . . . . . . . ix
6 Average reading achievement scores for black and white children, 1990–1993. . . . x
E.1 High school completion rates for 28-year-olds (distinguishing high school
diplomas from GEDs) . . . . . . . . . . . . . . . . . . . . . . . . . . . . . . . . . . . . . . . . . . . . . . . . 102
E.2 High school/GED completion rates for 28-year-olds (with and without
institutionalized persons) . . . . . . . . . . . . . . . . . . . . . . . . . . . . . . . . . . . . . . . . . . . . . 103

1. Prior Research on Black-White Differences in Educational and Economic Outcomes 1
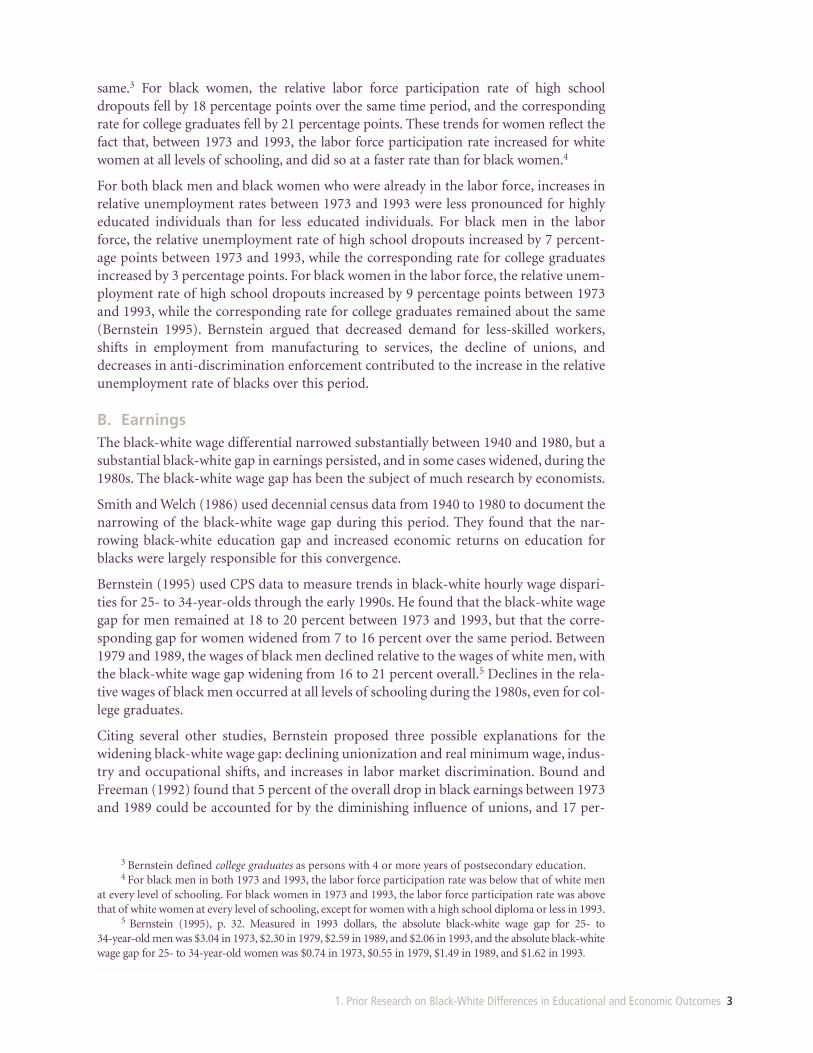
1.PRIOR RESEARCHON BLACK-WHITEDIFFERENCES IN EDUCATIONALAND ECONOMICOUTCOMESSubstantial progress has been made since the early 1970s in narrowing black-white gapsin educational achievement, high school completion, and earnings. During the 1980s,however, progress slowed, giving rise to such questions as: Why do gaps in educationalachievement and earnings persist? Why are blacks still less likely to attend and completecollege than whites? Are black-white gaps associated primarily with differences in prioreducational achievement, or are they related to other factors? To what extent can thesegaps be attributed to educational differences, and to what extent can they be attributedto factors not related to education?
This chapter draws on a substantial body of research literature related to such questions.Only a brief overview of this literature is presented here, with a particular focus on doc-umenting what is known about black-white differences in education-related outcomes.More specifically, the chapter discusses recent findings on racial differences in labormarket outcomes and in educational achievement.
I. LABOR MARKET OUTCOMES
• Black-white gaps in employment and earnings increased during the 1980s forboth men and women.
• Recent research suggests that black-white differences in educational achievementaccount for much of the black-white wage gap for men, and all of the black-whitewage gap for women.
Main Findings: Evidence on Labor Market Outcomes
Labor market outcomes, such as employment and earnings, are important measures ofthe relative social progress of blacks. Improved employment prospects and earningscapacity are not the only purposes of education, of course; but they are probably the pri-mary reason why most Americans pursue schooling for a period of time longer than isrequired by law.
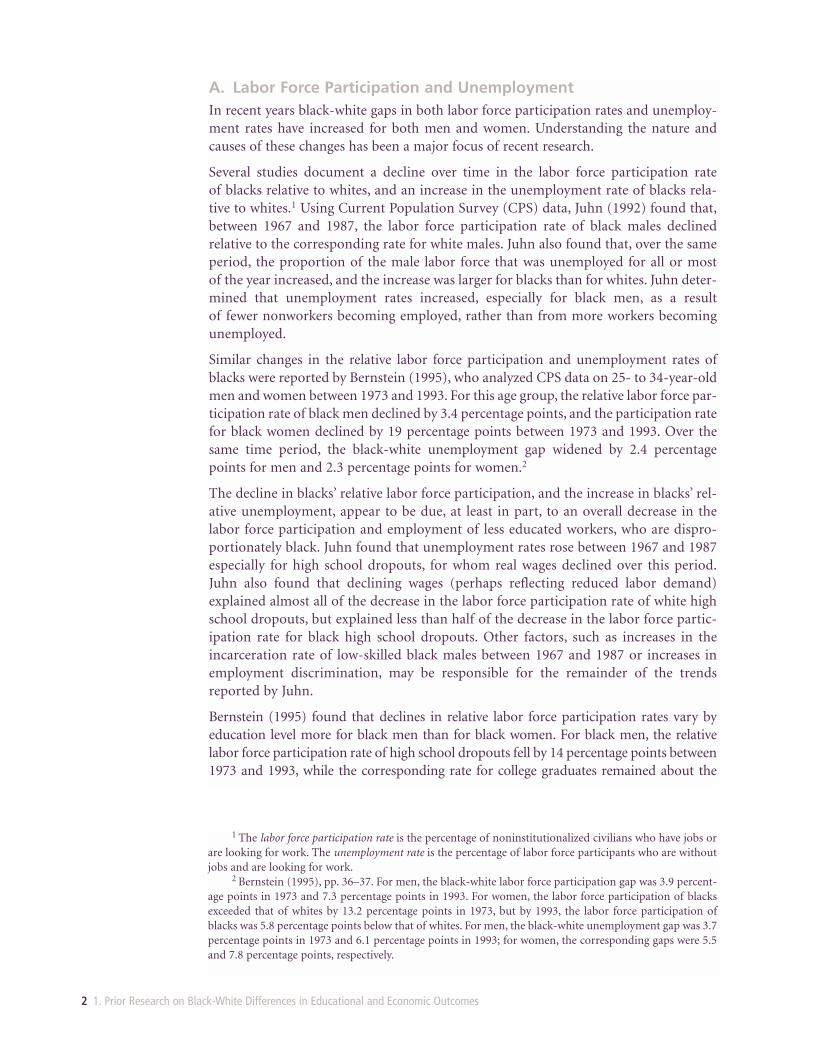
A. Labor Force Participation and UnemploymentIn recent years black-white gaps in both labor force participation rates and unemploy-ment rates have increased for both men and women. Understanding the nature andcauses of these changes has been a major focus of recent research.
Several studies document a decline over time in the labor force participation rate of blacks relative to whites, and an increase in the unemployment rate of blacks rela-tive to whites.1 Using Current Population Survey (CPS) data, Juhn (1992) found that,between 1967 and 1987, the labor force participation rate of black males declined relative to the corresponding rate for white males. Juhn also found that, over the sameperiod, the proportion of the male labor force that was unemployed for all or most of the year increased, and the increase was larger for blacks than for whites. Juhn deter-mined that unemployment rates increased, especially for black men, as a result of fewer nonworkers becoming employed, rather than from more workers becomingunemployed.
Similar changes in the relative labor force participation and unemployment rates ofblacks were reported by Bernstein (1995), who analyzed CPS data on 25- to 34-year-oldmen and women between 1973 and 1993. For this age group, the relative labor force par-ticipation rate of black men declined by 3.4 percentage points, and the participation ratefor black women declined by 19 percentage points between 1973 and 1993. Over thesame time period, the black-white unemployment gap widened by 2.4 percentagepoints for men and 2.3 percentage points for women.2
The decline in blacks’ relative labor force participation, and the increase in blacks’ rel-ative unemployment, appear to be due, at least in part, to an overall decrease in thelabor force participation and employment of less educated workers, who are dispro-portionately black. Juhn found that unemployment rates rose between 1967 and 1987especially for high school dropouts, for whom real wages declined over this period.Juhn also found that declining wages (perhaps reflecting reduced labor demand)explained almost all of the decrease in the labor force participation rate of white highschool dropouts, but explained less than half of the decrease in the labor force partic-ipation rate for black high school dropouts. Other factors, such as increases in theincarceration rate of low-skilled black males between 1967 and 1987 or increases inemployment discrimination, may be responsible for the remainder of the trendsreported by Juhn.
Bernstein (1995) found that declines in relative labor force participation rates vary byeducation level more for black men than for black women. For black men, the relativelabor force participation rate of high school dropouts fell by 14 percentage points between1973 and 1993, while the corresponding rate for college graduates remained about the
2 1. Prior Research on Black-White Differences in Educational and Economic Outcomes
1 The labor force participation rate is the percentage of noninstitutionalized civilians who have jobs orare looking for work. The unemployment rate is the percentage of labor force participants who are withoutjobs and are looking for work.
2 Bernstein (1995), pp. 36–37. For men, the black-white labor force participation gap was 3.9 percent-age points in 1973 and 7.3 percentage points in 1993. For women, the labor force participation of blacksexceeded that of whites by 13.2 percentage points in 1973, but by 1993, the labor force participation ofblacks was 5.8 percentage points below that of whites. For men, the black-white unemployment gap was 3.7percentage points in 1973 and 6.1 percentage points in 1993; for women, the corresponding gaps were 5.5and 7.8 percentage points, respectively.
same.3 For black women, the relative labor force participation rate of high schooldropouts fell by 18 percentage points over the same time period, and the correspondingrate for college graduates fell by 21 percentage points. These trends for women reflect thefact that, between 1973 and 1993, the labor force participation rate increased for whitewomen at all levels of schooling, and did so at a faster rate than for black women.4
For both black men and black women who were already in the labor force, increases inrelative unemployment rates between 1973 and 1993 were less pronounced for highlyeducated individuals than for less educated individuals. For black men in the laborforce, the relative unemployment rate of high school dropouts increased by 7 percent-age points between 1973 and 1993, while the corresponding rate for college graduatesincreased by 3 percentage points. For black women in the labor force, the relative unem-ployment rate of high school dropouts increased by 9 percentage points between 1973and 1993, while the corresponding rate for college graduates remained about the same(Bernstein 1995). Bernstein argued that decreased demand for less-skilled workers,shifts in employment from manufacturing to services, the decline of unions, anddecreases in anti-discrimination enforcement contributed to the increase in the relativeunemployment rate of blacks over this period.
B. EarningsThe black-white wage differential narrowed substantially between 1940 and 1980, but asubstantial black-white gap in earnings persisted, and in some cases widened, during the1980s. The black-white wage gap has been the subject of much research by economists.
Smith and Welch (1986) used decennial census data from 1940 to 1980 to document thenarrowing of the black-white wage gap during this period. They found that the nar-rowing black-white education gap and increased economic returns on education forblacks were largely responsible for this convergence.
Bernstein (1995) used CPS data to measure trends in black-white hourly wage dispari-ties for 25- to 34-year-olds through the early 1990s. He found that the black-white wagegap for men remained at 18 to 20 percent between 1973 and 1993, but that the corre-sponding gap for women widened from 7 to 16 percent over the same period. Between1979 and 1989, the wages of black men declined relative to the wages of white men, withthe black-white wage gap widening from 16 to 21 percent overall.5 Declines in the rela-tive wages of black men occurred at all levels of schooling during the 1980s, even for col-lege graduates.
Citing several other studies, Bernstein proposed three possible explanations for thewidening black-white wage gap: declining unionization and real minimum wage, indus-try and occupational shifts, and increases in labor market discrimination. Bound andFreeman (1992) found that 5 percent of the overall drop in black earnings between 1973and 1989 could be accounted for by the diminishing influence of unions, and 17 per-
1. Prior Research on Black-White Differences in Educational and Economic Outcomes 3
3 Bernstein defined college graduates as persons with 4 or more years of postsecondary education.4 For black men in both 1973 and 1993, the labor force participation rate was below that of white men
at every level of schooling. For black women in 1973 and 1993, the labor force participation rate was abovethat of white women at every level of schooling, except for women with a high school diploma or less in 1993.
5 Bernstein (1995), p. 32. Measured in 1993 dollars, the absolute black-white wage gap for 25- to 34-year-old men was $3.04 in 1973, $2.30 in 1979, $2.59 in 1989, and $2.06 in 1993, and the absolute black-whitewage gap for 25- to 34-year-old women was $0.74 in 1973, $0.55 in 1979, $1.49 in 1989, and $1.62 in 1993.
cent could be accounted for by a decline in the real minimum wage. (For black highschool dropouts, the effects are more dramatic; the two factors account for 23 percentand 98 percent of the widening gap, respectively.) Reardon (1993) estimated that theportion of the black-white wage gap attributable to black-white differences in industryand occupation rose from 17 to 28 percent between 1980 and 1990. During the 1980s,black men moved from the higher-paying manufacturing sector to the lower-payingservice sector at a faster rate than white men. Bernstein (1995) also cited several studiesdocumenting either decreased enforcement of anti-discrimination laws over time or thecontinuation of labor market discrimination against black workers.
Bernstein analyzed black-white trends separately for workers with different levels of edu-cational attainment, but he did not account for different levels of educational achieve-ment, since this information is not reported in the CPS. Several recent studies using theNational Longitudinal Survey of Youth (NLSY) have found that between two-thirds andthree-quarters of the black-white wage gap for men can be explained by either achieve-ment alone or by a combination of achievement and educational attainment. Ferguson(1991) and Maxwell (1994) estimated that about two-thirds of the black-white wage gapfor men in the NLSY can be explained by differences in scores on the Armed ForcesQualifying Test (AFQT), which is the NLSY’s measure of educational achievement.O’Neill (1990) found that differences in both AFQT scores and years of schooling explainthree-quarters of the black-white wage gap for men, and argued that this gap increasedin the 1980s because of an increased wage premium for higher-skilled workers. Johnsonand Neal (1996) found that the AFQT score differences explain three-quarters of theblack-white wage gap for men, and all of the black-white wage gap for women.
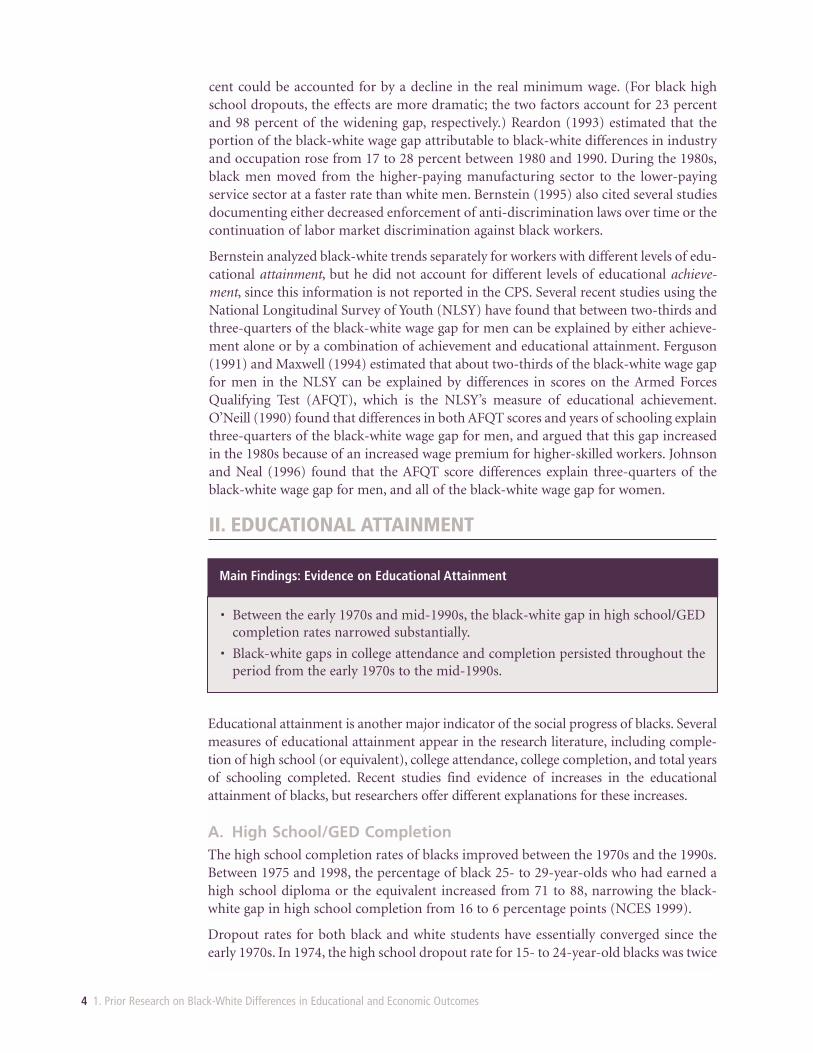
II. EDUCATIONAL ATTAINMENT
4 1. Prior Research on Black-White Differences in Educational and Economic Outcomes
• Between the early 1970s and mid-1990s, the black-white gap in high school/GEDcompletion rates narrowed substantially.
• Black-white gaps in college attendance and completion persisted throughout theperiod from the early 1970s to the mid-1990s.
Main Findings: Evidence on Educational Attainment
Educational attainment is another major indicator of the social progress of blacks. Severalmeasures of educational attainment appear in the research literature, including comple-tion of high school (or equivalent), college attendance, college completion, and total yearsof schooling completed. Recent studies find evidence of increases in the educationalattainment of blacks, but researchers offer different explanations for these increases.
A. High School/GED CompletionThe high school completion rates of blacks improved between the 1970s and the 1990s.Between 1975 and 1998, the percentage of black 25- to 29-year-olds who had earned ahigh school diploma or the equivalent increased from 71 to 88, narrowing the black-white gap in high school completion from 16 to 6 percentage points (NCES 1999).
Dropout rates for both black and white students have essentially converged since theearly 1970s. In 1974, the high school dropout rate for 15- to 24-year-old blacks was twice
the corresponding rate for whites (12 versus 6 percentage points). By 1997, 15- to 24-year-old blacks and 15- to 24-year-old whites remained in high school at similarrates, with dropout rates of 5.0 and 3.6 percentage points, respectively (NCES 1999).
The National Research Council (NRC) (1989) speculated that at least some of the nar-rowing of the black-white high school completion gap in recent years has been due tohigher rates of completion of GEDs (General Educational Development certificates) byblacks. Using data from the NLSY, Cameron and Heckman (1991) found that althoughonly 7 percent of white 25-year-olds with a high school diploma or equivalent had a GED,13 percent of black 25-year-olds with a high school diploma or equivalent had a GED.Appendix E uses the NLSY to examine how variable and sample definitions relate to esti-mated differences in black-white high school/GED completion between 1985 and 1992.
B. College Attendance and CompletionThe evidence on recent trends in college attendance and completion by blacks is moremixed than the evidence on recent trends in high school completion. In absolute terms,the college attendance rate, measured as a percentage of the population of 18- to 24-year-old high school graduates, increased for black youth, from 27 percent in 1972 to 39 per-cent in 1997. On a relative scale, however, the college attendance rate for blacks remainedconstant at about 83 to 85 percent of the rate for whites.6 Between 1975 and 1998, theblack-white gap in the 4-year college completion rate of 25- to 29-year-old high schoolgraduates increased slightly from about 13 to about 17 percentage points (NCES 1999).7
The NRC (1989) identified several hypotheses that explain why the relative collegeattendance rates of blacks actually declined between the mid-1970s and mid-1980s.Rather than attribute this trend to data problems or economic changes, the NRC iden-tified changes in financial aid and attitudes toward the military as the most importantcauses of this shift. Between 1976 and 1985, the portion of financial aid awards repre-sented by grants decreased from 80 to 46 percent, while the portion represented by loansincreased from 17 to 50 percent. Between 1977 and 1985, the percentage of black malehigh school seniors with plans to enter the military increased from 37 percent to 50 per-cent, compared with an increase from 17 percent to 21 percent for white male seniors(NRC 1989). The NRC argued that black youth perceived lower returns on educationthan white youth and were therefore less likely to finance a college education throughborrowing and more likely to pursue a career in the military.
Several studies have tested competing theories explaining the recent trends in the edu-cational attainment of blacks. Using data from the National Longitudinal Study of theHigh School Class of 1972 (NLS:72), Clayton et al. (1990) concluded that black stu-dents’ progress was more likely than that of white students to be based on past educa-tional performance as opposed to opportunities and expenditures in school systems.Using NLSY data, Cameron and Heckman (1992) found that, while schooling choiceswere sensitive to tuition costs, the availability of alternatives to schooling in the labormarket, and observed family background characteristics, differences in these factorsexplained little of black-white differences in educational attainment. In contrast, Kane
1. Prior Research on Black-White Differences in Educational and Economic Outcomes 5
6 The college attendance rate for 18- to 24-year-old white high school graduates was 33 percent in 1972and 46 percent in 1997 (NCES 1999, p. 142).
7 The college completion rate for 25- to 29-year-old white high school graduates was 28 percent in1975 and 35 percent in 1998 (NCES 1999, p. 152).
(1992), using pooled CPS cross-sections from 1973 to 1988, found that higher tuitioncosts were responsible for declines in college enrollment rates during the 1980s, and thatincreases in parental education have increased relative college enrollment rates forblacks. Kane interpreted this latter effect as a long-term consequence of the opening ofeducational opportunities for blacks during the 1950s and 1960s.
Most researchers have found that, for youth with similar levels of family income andeducational achievement, blacks’ educational attainment is at least as high as whites’.McMillen et al. (1993) used both the CPS and the National Educational LongitudinalStudy (NELS:88) to document changes in high school dropout and retention rates since1972. They concluded that, for 16- to 24-year-olds with similar family income levels,blacks are no more likely to drop out of high school than whites. Altonjii (1988) ana-lyzed NLS:72 data and concluded that, for youth similar in terms of family background,educational aptitude, and achievement, the schooling completed by blacks actuallyexceeds by 0.4 year the schooling completed by whites. Myers (1987) analyzed data fromthe High School and Beyond (HSB) study and concluded that, for youth with similarlevels of educational achievement, blacks were just as likely to attend college as whites.
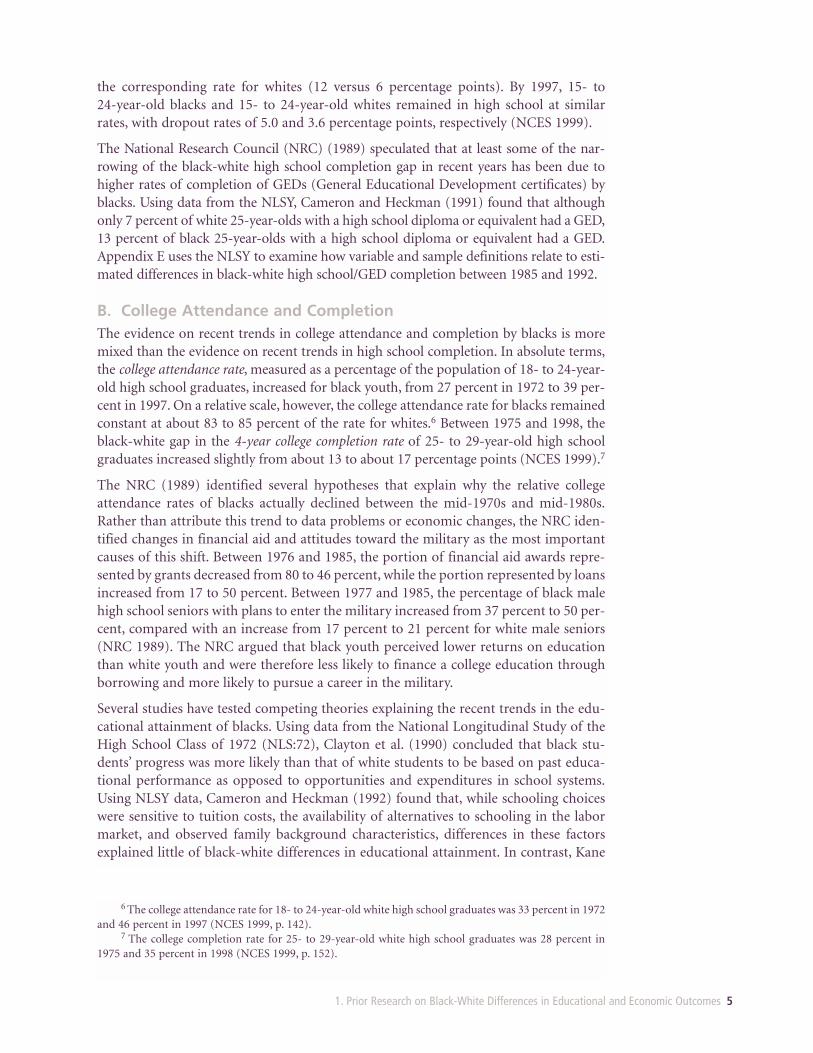
III. EDUCATIONAL ACHIEVEMENT
6 1. Prior Research on Black-White Differences in Educational and Economic Outcomes
• Black-white gaps in mathematics and reading achievement narrowed between theearly 1970s and the mid-1990s.
• Recent research suggests that differences in parental background, and differencesin school quality, account for at least some of the remaining black-white differ-ences in educational achievement.
Main Findings: Evidence on Educational Achievement
Educational achievement is a third indicator of the social progress of blacks. Since theearly 1970s, standardized tests in subjects such as reading and mathematics have becomeone of the most common indicators of the educational progress of black students rela-tive to white students.
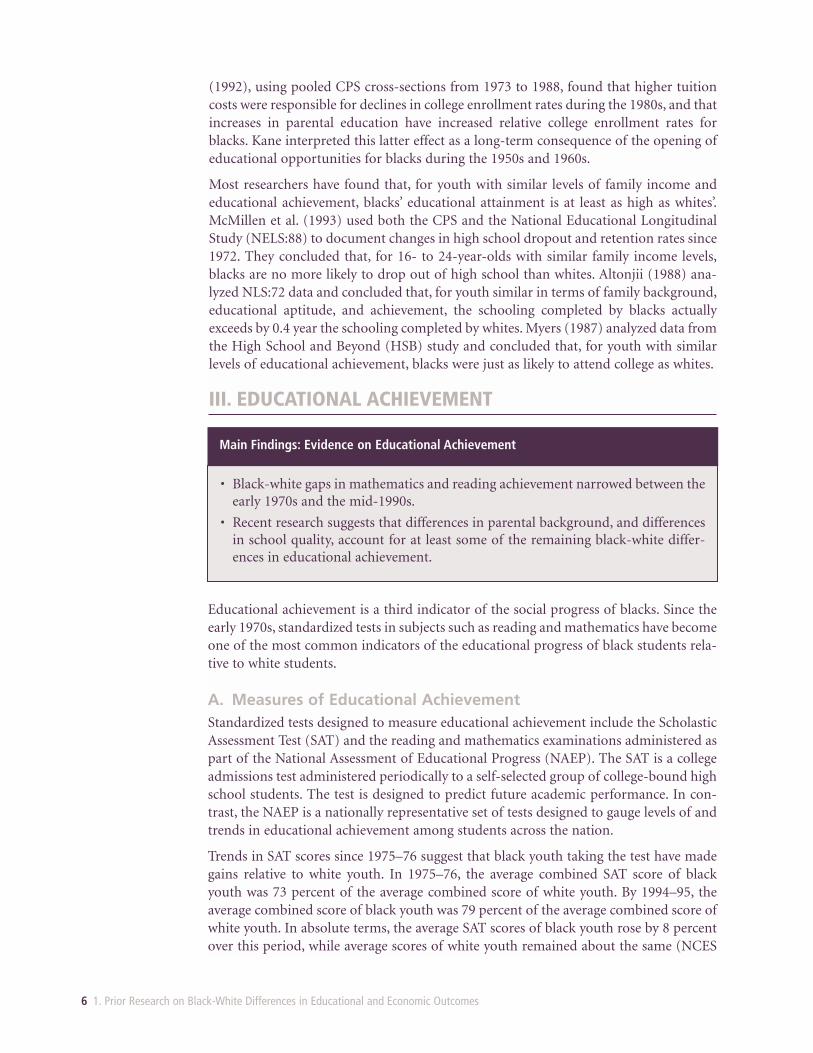
A. Measures of Educational AchievementStandardized tests designed to measure educational achievement include the ScholasticAssessment Test (SAT) and the reading and mathematics examinations administered aspart of the National Assessment of Educational Progress (NAEP). The SAT is a collegeadmissions test administered periodically to a self-selected group of college-bound highschool students. The test is designed to predict future academic performance. In con-trast, the NAEP is a nationally representative set of tests designed to gauge levels of andtrends in educational achievement among students across the nation.
Trends in SAT scores since 1975–76 suggest that black youth taking the test have madegains relative to white youth. In 1975–76, the average combined SAT score of blackyouth was 73 percent of the average combined score of white youth. By 1994–95, theaverage combined score of black youth was 79 percent of the average combined score ofwhite youth. In absolute terms, the average SAT scores of black youth rose by 8 percentover this period, while average scores of white youth remained about the same (NCES
1996).8 Since the SAT is not required of all students, trends in these test scores do notnecessarily indicate progress for the whole population of black youth because not allyouth take the test. Between 1980 and 1985, for example, the average SAT scores of blackyouth rose by 5 percent (NCES 1995), but the number of blacks taking the SAT declinedby 9 percent (NRC 1989).
Compared with SAT scores, NAEP scores are a better indicator of the educationalachievement of the overall population of youth, since the NAEP samples are national-ly representative. Trends in NAEP scores indicate both relative and absolute progressfor black youth since the early 1970s. Between 1973 and 1996, the average NAEP math-ematics scores of black 17-year-olds grew by 6 percent, while the average math scoresof white 17-year-olds remained about the same (NCES 1997b). Similarly, between1971 and 1996, the average NAEP reading scores of black 17-year-olds grew by 11 per-cent, while the average reading scores of white 17-year-olds remained about the same(NCES 1997b).9 Bernstein (1995) reported that the NAEP score gains realized by blackstudents are evident both in the South and in metropolitan areas throughout theUnited States.
Several studies have used data besides the NAEP to confirm the narrowing of the black-white test score gap over time. Hedges and Nowell (1997) studied test scores of blacks andwhites in five surveys besides the NAEP,10 and found consistent evidence of decreasingblack-white test score gaps over time. Hauser and Huang (1996) reported evidence fromthe General Social Survey (GSS) vocabulary test administered since the early 1970s thatindicates a longer-term convergence in test scores for black and white adults born between1909 and 1974. Using data from eight national surveys,11 Phillips et al. (1997) found thatthe black-white test score gap narrowed over time for children born between 1948 and1978, but remained constant or widened for children born between 1979 and 1985.
B. Explanations of the Relative Educational Achievement of Black Students
The absolute differences in the test scores of black and white youth are a major themein the research literature. Many studies have investigated the extent to which factorssuch as family background and school characteristics can account for black-white dif-ferences in educational achievement and for changes in the black-white achievementgap over time.
1. Prior Research on Black-White Differences in Educational and Economic Outcomes 7
8 Average combined SAT scores for blacks were 686 in 1975–76 and 744 in 1994–95; and average com-bined SAT scores for whites were 944 in 1975–76 and 946 in 1994–95 (NCES 1996, p. 240).
9 Average NAEP mathematics scores for black 17-year-olds were 270 in 1973 and 286 in 1996; averageNAEP mathematics scores for white 17-year-olds were 310 in 1973 and 313 in 1996 (NCES 1997b, p. 123).Average NAEP reading scores for black 17-year-olds were 239 in 1971 and 265 in 1996; average NAEP read-ing scores for white 17-year-olds were 291 in 1971 and 294 in 1996 (NCES 1997b, p. 114).
10 The six surveys studied were: the NAEP, the Equality of Educational Opportunity (EEO) survey, theNational Longitudinal Study of the High School Class of 1972 (NLS:72), the High School and Beyond(HSB) survey, the National Longitudinal Survey of Youth (NLSY), and the National EducationalLongitudinal Study of 1988 (NELS:88).
11 The eight surveys studied were: the NAEP, the EEO survey, the HSB survey, the NLSY, the Childrenof the National Longitudinal Survey of Youth (CNLSY), the NELS:88, the Longitudinal Study of AmericanYouth (LSAY), and the Chapter 1 Prospects Study.
Since the 1960s, several studies using cross-sectional data have identified differences infamily background characteristics as a major reason for the relatively lower averageachievement of black students. Using data from the Equality of EducationalOpportunity (EEO) survey, Coleman et al. (1966) found that, for children with similarfamily backgrounds, differences in measured school resources explained little of black-white differences in educational achievement. More recently, O’Connor (1989) synthe-sized literature published since the early 1970s and identified the use of Black Englishvernacular by black youth as a major contributing factor to differential test performanceby blacks. More recently, Fuchs and Reklis (1994) analyzed average 1992 NAEP mathe-matics scores of 13-year-olds by state and concluded that child and household charac-teristics explain much more of the black-white difference in test scores than can beexplained by school characteristics.
Differences in black-white achievement may also be attributable to differences in schoolpreparedness. The National Center for Education Statistics (1997) reported that thepreschool enrollment of black children has been declining over time relative to the pre-school enrollment of white children. In 1975, the preschool enrollment rate for bothblack and white students was about 25 percent. By 1991, 31 percent of black 3- and 4-year-olds were enrolled in preschool, compared with 40 percent of white 3- and 4-year-olds. The NCES indicated that preschool enrollment may be an important pre-dictor of subsequent academic success, especially for disadvantaged students. Currieand Thomas (1995) concluded that participation in the Head Start program for disad-vantaged preschoolers leads to short-term academic gains for both black and white chil-dren, but long-term gains for white children only.
Several other studies test hypotheses about the role of school desegregation in black-white differences in achievement over time. Koretz (1987) concluded that neither schooldesegregation nor increases in Head Start and Chapter 1 compensatory education fund-ing has had a large effect on the average test scores of black youth since the 1960s. TheNRC (1989) noted that, while school desegregation was more likely to occur in ruralareas, NAEP scores also improved for black youth in urban regions.
Several researchers have argued that changes in socioeconomic status, as indicated byparental education and income, are the major reasons for the narrowing of black-whitetest score gaps over time. Pointing to the lack of evidence that desegregation raisesachievement, Armor (1992) proposed the alternative hypothesis that an improvementin the educational attainment of black parents is largely responsible for the increase inNAEP scores since the early 1970s. Looking at evidence over time from multiple sur-veys, Hedges and Nowell (1997) concluded that the narrowing of black-white differ-ences in parental education and income was the primary reason for the partial conver-gence over time in the test scores of blacks and whites. In another study (1996), Armorreported that the relative NAEP scores of 13- and 17-year-old blacks declined slightlybetween 1988 and 1992, and that this decline was associated with a relative decline inblacks’ socioeconomic status, measured by parental education, family structure, andhome reading items.
Not all studies have concluded that recent trends in differences in family backgroundare the primary explanation for recent trends in differences in black-white achievement.Grissmer et al. (1996) studied NAEP trends and found that black students made relativegains despite their increasing disadvantage as measured by changes in single-parentfamilies and economic status. On the basis of these findings, the researchers concluded
8 1. Prior Research on Black-White Differences in Educational and Economic Outcomes
that nonfamily factors, such as changes in educational spending and programs, led todisproportionate increases in the relative NAEP scores of black students.
IV. CONCLUSION
Since the early 1970s, as reported in the research literature, blacks have made gains innarrowing the educational and economic gaps between themselves and whites, particu-larly in the areas of educational achievement and high school completion.Notwithstanding this progress, blacks continue to lag behind whites in terms of collegeattendance and completion. Black-white disparities have also persisted, and sometimeswidened, for labor market outcomes such as labor force participation, employment, andearnings. Researchers have identified a variety of explanations for these trends, some ofwhich center on changes in the economy and culture, and others on changes in publicpolicy. A growing body of research has established a strong link between black-whitedifferences in prior educational achievement and black-white differences in subsequentoutcomes such as educational attainment and earnings.
The following chapters describe the original analyses that were the focus of the presentstudy. The findings from the present study confirm and also extend the findings fromthe literature on the relationships between achievement differences and black-whiteinequality in educational and economic outcomes.
1. Prior Research on Black-White Differences in Educational and Economic Outcomes 9
2. Black-White Differences in Labor Market Outcomes 11
2.BLACK-WHITEDIFFERENCES IN LABOR MARKETOUTCOMESThe evidence reported in chapter 1 indicates that, since the early 1970s, the relative educa-tional achievement and high school attainment of black youth has improved. With regardto labor market outcomes, however, there is little indication that the relative unemploymentrates or earnings of young black men and women have improved substantially between the1970s and the 1990s. Indeed, there is some evidence that black-white labor market dispari-ties have increased, especially for women. Recent research findings have disagreed on theextent to which such persistent black-white labor market disparities can be attributed toskills differences or to other factors such as employment or wage discrimination.
This chapter compares the labor market outcomes of black and white young adults infour samples observed between 1979 and 1992.1 The analyses addressed several key ques-tions: Do labor market outcomes differ for blacks and whites? Are black-white dispari-ties larger for men than for women? To what extent do black-white labor market differ-ences change after restricting the comparisons to young adults similar in terms of edu-cational achievement and related factors?2 Are there unexplained disparities in the labormarket outcomes of whites and blacks, which could be evidence of unobserved differ-ences in skills between blacks and whites or perhaps of labor market discrimination?
In the sections that follow, this chapter discusses black-white differences in four labormarket outcomes: labor force participation rates, unemployment rates, annual earnings,and hourly wages. A final section offers some general observations.
1 Appendix A discusses the data sources and treatment of missing data for these analyses; appendix Bdiscuss comparability of data; appendix C discusses the analysis methodology; and appendix D presentsstandard errors for the results in this chapter.
2 These comparisons, described in appendix C, involve the estimation of analytic models to distinguishhow outcomes vary by race when factors such as achievement are held constant. Our analyses compare allwhites with blacks similar to whites in terms of background characteristics, rather than vice versa. In gen-eral, the pattern of results is similar when we compare all blacks with whites similar to blacks in terms ofbackground characteristics.
12 2. Black-White Differences in Labor Market Outcomes
I. LABOR FORCE PARTICIPATION
A. Labor Force Participation RatesThe black-white gap in labor force participation rates3 was not consistent across thefour samples4 studied (table 2.1). For women in the 1979 sample, the labor force par-ticipation rate was 10 percentage points higher for blacks than for whites; but in theother three samples, the labor force participation rate was similar for black womenand white women. Black men and white men had similar labor force participationrates in the 1979 and 1983-1989 samples, but in the 1986–1992 and 1992 samples, thelabor force participation rate was 5 to 8 percentage points lower for black men thanfor white men.
The decline in the relative labor force participation rate of black women between the1979 and 1983–1989 samples is consistent with the trends in black and white women’slabor force participation rates during the 1980s.5
For example, as measured by Bernstein (1995) using Bureau of Labor Statistics data,the labor force participation rate of 25- to 34-year-old white women rose between1979 and 1989, while the rate for black women in that age bracket remained level overthe same period. Bernstein also found that the relative labor force participation ratefor blacks continued to decline between 1989 and 1993. In the present study, howev-er, a comparison of the 1986–1992 and 1992 samples revealed no clear difference inthe black-white gap in labor force participation between the two samples. It is possi-ble that differences in the design of the 1986–1992 and 1992 samples are responsiblefor this result.
3 The labor force participation rate is the percentage of civilians who, at the time of the interview, areeither working, not at work but have a job, or looking for work. The unemployment rate is the percentageof civilian labor force participants who are without a job.
4 We compared labor market outcomes for blacks and whites in four samples of young adults; partic-ipants in the National Longitudinal Study of the High School Class of 1972, observed in 1979, 7 years afterGrade 12 (“the 1979 sample”); participants in the National Longitudinal Survey of Youth who were highschool seniors between 1976 and 1982, observed between 1983 and 1989, 7 years after Grade 12 (“the1983–1989 sample”); participants in the National Longitudinal Survey of Youth who were high schoolsophomores between 1974 and 1980, observed between 1986 and 1992, 12 years after Grade 10 (“the1986–1992 sample”); and participants in the High School and Beyond Survey of 1980 high school sopho-mores, observed in 1992, 12 years after Grade 10 (“the 1992 sample”). See appendix A and B for details.
5 The comparison of the 1979 and 1983-1989 samples assumes that the two underlying samples ofyoung adults are truly comparable, an assumption that is discussed in appendix B.
• Labor force participation rates did not differ consistently across samples forblacks and whites.
• For young adults with similar levels of prior educational achievement, blacks wereat least as likely to participate in the labor force as whites.
Main Findings: Labor Force Participation
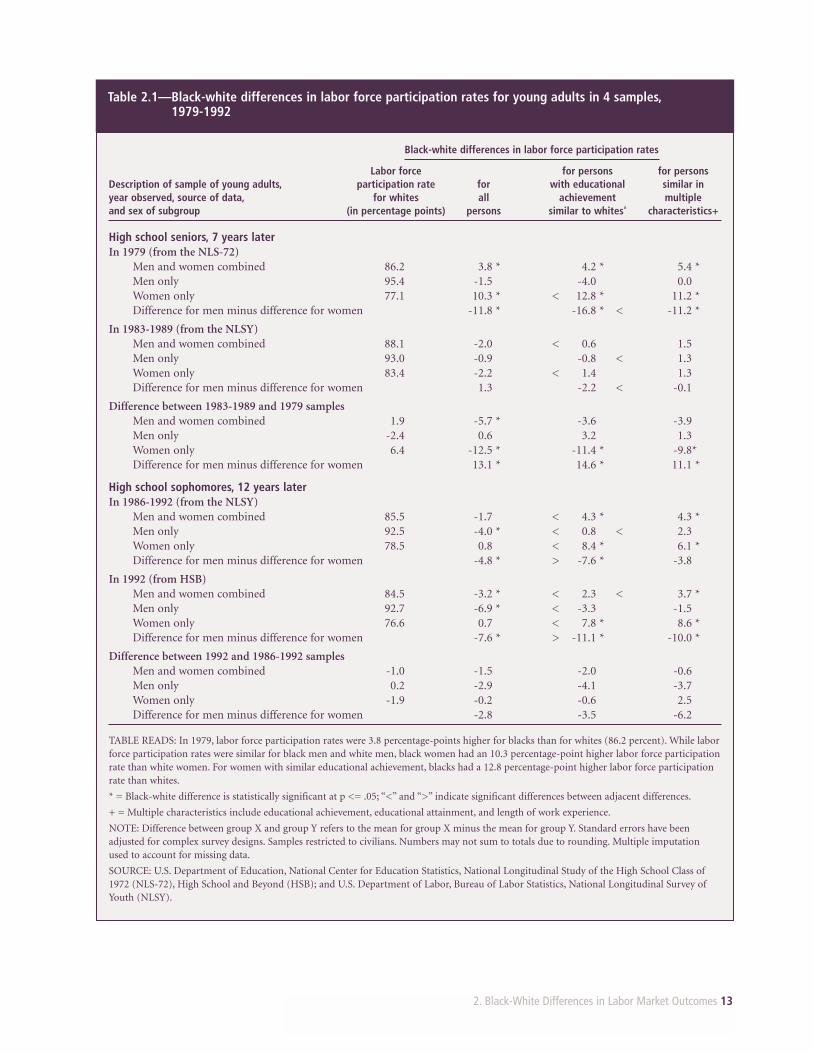
2. Black-White Differences in Labor Market Outcomes 13
Black-white differences in labor force participation rates
Labor force for persons for personsDescription of sample of young adults, participation rate for with educational similar inyear observed, source of data, for whites all achievement multipleand sex of subgroup (in percentage points) persons similar to whites' characteristics+
High school seniors, 7 years laterIn 1979 (from the NLS-72)
Men and women combined 86.2 3.8 * 4.2 * 5.4 *Men only 95.4 -1.5 -4.0 0.0Women only 77.1 10.3 * < 12.8 * 11.2 *Difference for men minus difference for women -11.8 * -16.8 * < -11.2 *
In 1983-1989 (from the NLSY)Men and women combined 88.1 -2.0 < 0.6 1.5Men only 93.0 -0.9 -0.8 < 1.3Women only 83.4 -2.2 < 1.4 1.3Difference for men minus difference for women 1.3 -2.2 < -0.1
Difference between 1983-1989 and 1979 samplesMen and women combined 1.9 -5.7 * -3.6 -3.9Men only -2.4 0.6 3.2 1.3Women only 6.4 -12.5 * -11.4 * -9.8*Difference for men minus difference for women 13.1 * 14.6 * 11.1 *
High school sophomores, 12 years laterIn 1986-1992 (from the NLSY)
Men and women combined 85.5 -1.7 < 4.3 * 4.3 *Men only 92.5 -4.0 * < 0.8 < 2.3Women only 78.5 0.8 < 8.4 * 6.1 *Difference for men minus difference for women -4.8 * > -7.6 * -3.8
In 1992 (from HSB)Men and women combined 84.5 -3.2 * < 2.3 < 3.7 *Men only 92.7 -6.9 * < -3.3 -1.5Women only 76.6 0.7 < 7.8 * 8.6 *Difference for men minus difference for women -7.6 * > -11.1 * -10.0 *
Difference between 1992 and 1986-1992 samplesMen and women combined -1.0 -1.5 -2.0 -0.6Men only 0.2 -2.9 -4.1 -3.7Women only -1.9 -0.2 -0.6 2.5Difference for men minus difference for women -2.8 -3.5 -6.2
TABLE READS: In 1979, labor force participation rates were 3.8 percentage-points higher for blacks than for whites (86.2 percent). While laborforce participation rates were similar for black men and white men, black women had an 10.3 percentage-point higher labor force participationrate than white women. For women with similar educational achievement, blacks had a 12.8 percentage-point higher labor force participationrate than whites.
* = Black-white difference is statistically significant at p <= .05; “<” and “>” indicate significant differences between adjacent differences.
+ = Multiple characteristics include educational achievement, educational attainment, and length of work experience.
NOTE: Difference between group X and group Y refers to the mean for group X minus the mean for group Y. Standard errors have beenadjusted for complex survey designs. Samples restricted to civilians. Numbers may not sum to totals due to rounding. Multiple imputationused to account for missing data.
SOURCE: U.S. Department of Education, National Center for Education Statistics, National Longitudinal Study of the High School Class of1972 (NLS-72), High School and Beyond (HSB); and U.S. Department of Labor, Bureau of Labor Statistics, National Longitudinal Survey ofYouth (NLSY).
Table 2.1—Black-white differences in labor force participation rates for young adults in 4 samples,1979-1992
14 2. Black-White Differences in Labor Market Outcomes
B. Relating Educational Achievement to Labor Force Participation Rates
In comparisons of young adults with similar levels of prior educational achievement,blacks were at least as likely as whites to participate in the labor force (table 2.1). In the1979 sample, the labor force participation rate was higher for black women than forwhite women, and higher still for black women with prior educational achievementsimilar to that for white women.6 In the 1986–1992 and 1992 samples, black men hadlower labor force participation rates than white men, but black and white men with sim-ilar levels of prior educational achievement had similar rates of labor force participa-tion. Moreover, in these two samples, while black women and white women had similarrates of labor force participation overall, black women with similar prior educationalachievement as white women had higher rates of labor force participation.
For young adults with similar prior educational achievement, educational attainment,and work experience, labor force participation rates were generally no lower for blacksthan for whites. Among men, blacks similar to whites in these characteristics had simi-lar rates of labor force participation, while among women, blacks similar to whites inthese characteristics usually had higher rates of labor force participation.
The change in the relative labor force participation rates of black women between the1979 and 1983–1989 samples was about the same, regardless of whether the change wasfor women as a whole, or women similar in terms of educational background and workexperience. The fact that the relatively lower labor force participation rates in the 1983-1989 samples is not accounted for by differences in educational background or workexperience suggests that other factors may be responsible for the lower relative laborforce participation rate of black women in the more recent sample.
II. UNEMPLOYMENT
6 These comparisons, described in appendix C, involve the estimation of analytic models to distinguish howoutcomes vary by race when factors such as achievement are held constant. Our analyses compare all whites withblacks similar to whites in terms of background characteristics, rather than vice versa. In general, the pattern ofresults is similar when we compare all blacks with whites similar to blacks in terms of background characteristics.
• Unemployment rates for black labor force participants were 4 to 10 percentagepoints higher than for white labor force participants.
• For young adults with similar levels of prior educational achievement, the black-white gap in unemployment rates was at least one-half smaller than for youngadults as a whole.
Main Findings: Unemployment
2. Black-White Differences in Labor Market Outcomes 15
This section investigates black-white differences in the unemployment rates of civilianlabor force participants.7 Four samples of young adults, observed between 1979 and1992, were studied.8
A. Unemployment RatesOverall, black labor force participants had unemployment rates 4 to 10 percentagepoints higher than white labor force participants (table 2.2). The overall black-whiteunemployment gap was about 3 percentage points larger for the 1983–1989 sample thanfor the 1979 sample, a gap consistent with time-series evidence reported in chapter 1.However, the overall black-white gap in unemployment was 5 percentage points small-er for the 1992 sample than for the 1989–1992 sample. It is not clear whether the latterfinding reflects a trend from the 1980s to the early 1990s or merely reflects differencesin the samples of young adults studied.
B. Relating Achievement to Unemployment RatesIn comparisons among young adults with similar levels of prior educational achieve-ment, black-white gaps in unemployment rates were at least one-half smaller than thegaps for young adults as a whole (table 2.2). In the 1979 and 1992 samples, blacks withsimilar educational achievement as whites had similar unemployment rates. In the1983-1989 and 1986-1992 samples, for young adults with similar prior educationalachievement, the black-white gap in unemployment rates was one-half to three-fifthssmaller than for young adults as whole. Factors possibly contributing to the remainingdifference in unemployment rates include skill differences not captured by achievementmeasures, differences in the regional availability of jobs, differences in access to job net-works, and outright employment discrimination against black labor force participants.9
In general, among young adults with similar educational achievement, educationalattainment, and work experience, blacks and whites had similar unemployment rates.
7 The labor force participation rate is the percentage of civilians who, at the time of the interview, areeither working, not at work but have a job, or looking for work. The unemployment rate is the percentageof civilian labor force participants who are without a job.
8 We compared labor market outcomes for blacks and whites in four samples of young adults: partic-ipants in the National Longitudinal Study of the High School Class of 1972, observed in 1979, 7 years afterGrade 12 ("the 1979 sample"); participants in the National Longitudinal Survey of Youth who were highschool seniors between 1976 and 1982, observed between 1983 and 1989, 7 years after Grade 12 ("the1983–1989 sample"); participants in the National Longitudinal Survey of Youth who were high schoolsophomores between 1974 and 1980, observed between 1986 and 1992, 12 years after Grade 10 ("the1986–1992 sample"); and participants in the High School and Beyond Survey of 1980 high school sopho-mores, observed in 1992, 12 years after Grade 10 ("the 1992 sample"). See appendix A for details.
9 See Johnson and Neal [1997] for a discussion of these hypotheses.
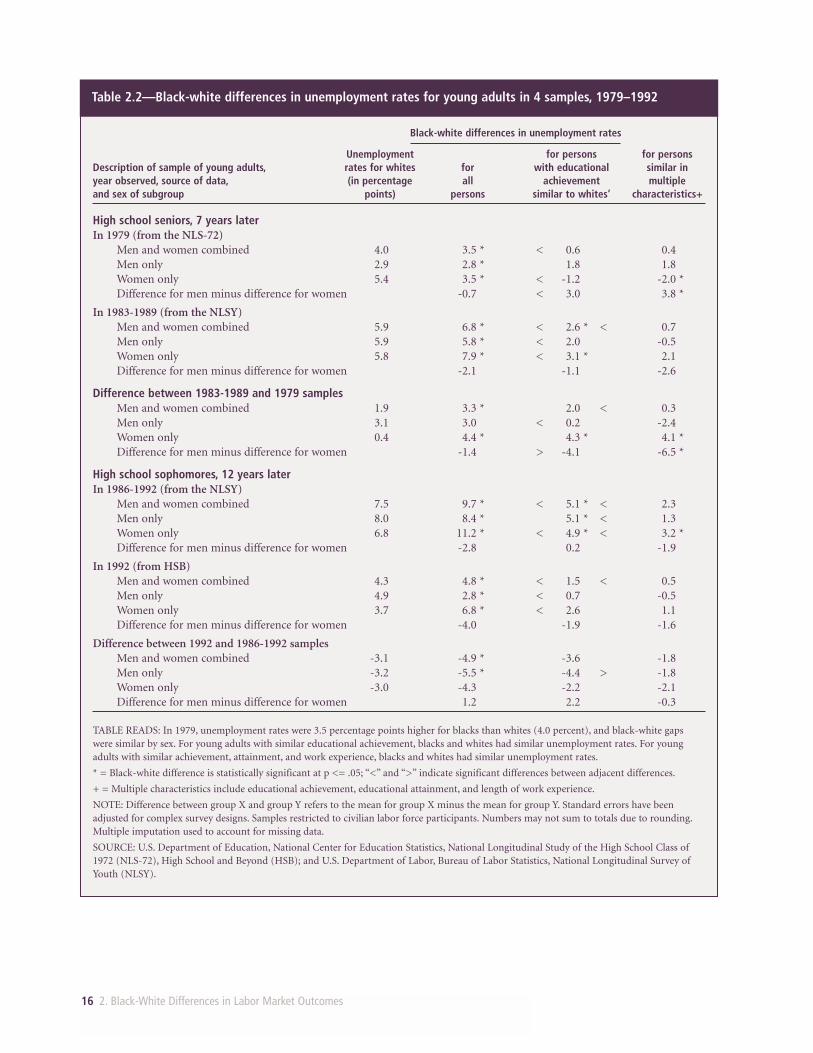
16 2. Black-White Differences in Labor Market Outcomes
Black-white differences in unemployment rates
Unemployment for persons for personsDescription of sample of young adults, rates for whites for with educational similar inyear observed, source of data, (in percentage all achievement multipleand sex of subgroup points) persons similar to whites’ characteristics+
High school seniors, 7 years laterIn 1979 (from the NLS-72)
Men and women combined 4.0 3.5 * < 0.6 0.4Men only 2.9 2.8 * 1.8 1.8Women only 5.4 3.5 * < -1.2 -2.0 *Difference for men minus difference for women -0.7 < 3.0 3.8 *
In 1983-1989 (from the NLSY)Men and women combined 5.9 6.8 * < 2.6 * < 0.7Men only 5.9 5.8 * < 2.0 -0.5Women only 5.8 7.9 * < 3.1 * 2.1Difference for men minus difference for women -2.1 -1.1 -2.6
Difference between 1983-1989 and 1979 samplesMen and women combined 1.9 3.3 * 2.0 < 0.3Men only 3.1 3.0 < 0.2 -2.4Women only 0.4 4.4 * 4.3 * 4.1 *Difference for men minus difference for women -1.4 > -4.1 -6.5 *
High school sophomores, 12 years laterIn 1986-1992 (from the NLSY)
Men and women combined 7.5 9.7 * < 5.1 * < 2.3Men only 8.0 8.4 * 5.1 * < 1.3Women only 6.8 11.2 * < 4.9 * < 3.2 *Difference for men minus difference for women -2.8 0.2 -1.9
In 1992 (from HSB)Men and women combined 4.3 4.8 * < 1.5 < 0.5Men only 4.9 2.8 * < 0.7 -0.5Women only 3.7 6.8 * < 2.6 1.1Difference for men minus difference for women -4.0 -1.9 -1.6
Difference between 1992 and 1986-1992 samplesMen and women combined -3.1 -4.9 * -3.6 -1.8Men only -3.2 -5.5 * -4.4 > -1.8Women only -3.0 -4.3 -2.2 -2.1Difference for men minus difference for women 1.2 2.2 -0.3
TABLE READS: In 1979, unemployment rates were 3.5 percentage points higher for blacks than whites (4.0 percent), and black-white gapswere similar by sex. For young adults with similar educational achievement, blacks and whites had similar unemployment rates. For youngadults with similar achievement, attainment, and work experience, blacks and whites had similar unemployment rates.
* = Black-white difference is statistically significant at p <= .05; “<” and “>” indicate significant differences between adjacent differences.
+ = Multiple characteristics include educational achievement, educational attainment, and length of work experience.
NOTE: Difference between group X and group Y refers to the mean for group X minus the mean for group Y. Standard errors have beenadjusted for complex survey designs. Samples restricted to civilian labor force participants. Numbers may not sum to totals due to rounding.Multiple imputation used to account for missing data.
SOURCE: U.S. Department of Education, National Center for Education Statistics, National Longitudinal Study of the High School Class of1972 (NLS-72), High School and Beyond (HSB); and U.S. Department of Labor, Bureau of Labor Statistics, National Longitudinal Survey ofYouth (NLSY).
Table 2.2—Black-white differences in unemployment rates for young adults in 4 samples, 1979–1992
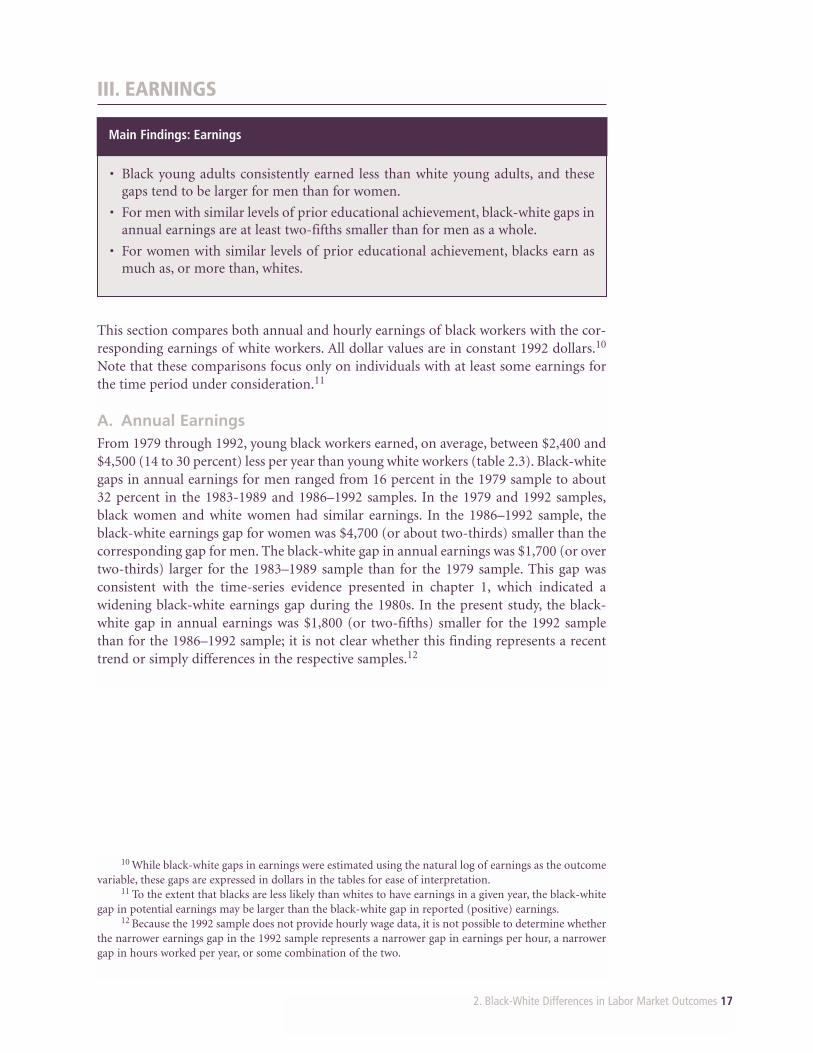
2. Black-White Differences in Labor Market Outcomes 17
10 While black-white gaps in earnings were estimated using the natural log of earnings as the outcomevariable, these gaps are expressed in dollars in the tables for ease of interpretation.
11 To the extent that blacks are less likely than whites to have earnings in a given year, the black-whitegap in potential earnings may be larger than the black-white gap in reported (positive) earnings.
12 Because the 1992 sample does not provide hourly wage data, it is not possible to determine whetherthe narrower earnings gap in the 1992 sample represents a narrower gap in earnings per hour, a narrowergap in hours worked per year, or some combination of the two.
III. EARNINGS
This section compares both annual and hourly earnings of black workers with the cor-responding earnings of white workers. All dollar values are in constant 1992 dollars.10
Note that these comparisons focus only on individuals with at least some earnings forthe time period under consideration.11
A. Annual EarningsFrom 1979 through 1992, young black workers earned, on average, between $2,400 and$4,500 (14 to 30 percent) less per year than young white workers (table 2.3). Black-whitegaps in annual earnings for men ranged from 16 percent in the 1979 sample to about 32 percent in the 1983-1989 and 1986–1992 samples. In the 1979 and 1992 samples,black women and white women had similar earnings. In the 1986–1992 sample, theblack-white earnings gap for women was $4,700 (or about two-thirds) smaller than thecorresponding gap for men. The black-white gap in annual earnings was $1,700 (or overtwo-thirds) larger for the 1983–1989 sample than for the 1979 sample. This gap wasconsistent with the time-series evidence presented in chapter 1, which indicated awidening black-white earnings gap during the 1980s. In the present study, the black-white gap in annual earnings was $1,800 (or two-fifths) smaller for the 1992 samplethan for the 1986–1992 sample; it is not clear whether this finding represents a recenttrend or simply differences in the respective samples.12
• Black young adults consistently earned less than white young adults, and thesegaps tend to be larger for men than for women.
• For men with similar levels of prior educational achievement, black-white gaps inannual earnings are at least two-fifths smaller than for men as a whole.
• For women with similar levels of prior educational achievement, blacks earn asmuch as, or more than, whites.
Main Findings: Earnings

18 2. Black-White Differences in Labor Market Outcomes
Table 2.3—Black-white differences in average annual earnings for young adults in 4 samples, 1979-1992
Black-white differences in average annual earnings
Average annual for persons with for personsDescription of sample of young adults, earnings for whites for educational similar in year observed, source of data, (thousands of all achievement multipleand sex of subgroup dollars/year) persons similar to whites’ characteristics+
High school seniors, 7 years laterIn 1979 (from the NLS-72)
Men and women combined 16.6 -2.4 * < -0.4 < 0.9Men only 20.4 -3.3 * -2.4 < -0.9Women only 12.9 -0.8 < 1.6 * < 2.6 *Difference for men minus difference for women -2.5 > -4.0 * -3.6 *
In 1983-1989 (from the NLSY)Men and women combined 13.6 -4.1 * < -1.8 * < -0.8Men only 16.2 -5.3 * < -2.8 * < -1.2Women only 11.3 -3.1 * < -0.8 -0.6Difference for men minus difference for women -2.2 -2.0 -0.6
Difference between 1983-1989 and 1979 samplesMen and women combined -3.0 -1.7 * < -1.4 * -1.8Men only -4.2 -2.0 * < -0.4 -0.2Women only -1.6 -2.3 * -2.4 * -3.2 *Difference for men minus difference for women 0.2 2.0 3.0
High school sophomores, 12 years laterIn 1986-1992 (from the NLSY)
Men and women combined 16.6 -4.5 * < -0.5 -0.6Men only 21.6 -7.0 * < -2.5 * -1.9Women only 12.4 -2.4 * < 1.1 0.5Difference for men minus difference for women -4.7 * -3.7 * -2.4
In 1992 (from HSB)Men and women combined 18.7 -2.6 * < 0.3 0.4Men only 22.3 -5.6 * < -3.1 * -2.6 *Women only 15.3 0.1 < 3.4 * 3.1 *Difference for men minus difference for women -5.6 * -6.6 * -5.7 *
Difference between 1992 and 1986-1992 samplesMen and women combined 2.0 1.8 * > 0.9 1.0Men only 0.7 1.5 > -0.6 -0.8Women only 2.8 2.4 * > 2.3 2.5Difference for men minus difference for women -0.9 -2.9 -3.3
TABLE READS: In 1979, annual earnings averaged $2400 less for blacks than whites ($16,600). A black-white gap was evident for men ($3300)but not for women. For young adults with similar educational achievement, black women earned $1600 more per year than white women,while the black-white earnings gap for men was not significant. For young adults with similar achievement, attainment, and work experience,black women earned $2600 more per year than white women, and black men earned about the same as white men.
* = Black-white difference is statistically significant at p <= .05; “<” and “>” indicate significant differences between adjacent differences.
+ = Multiple characteristics include educational achievement, educational attainment, and length of work experience.
NOTE: Difference between group X and group Y refers to the mean for group X minus the mean for group Y. Standard errors have beenadjusted for complex survey designs. Samples restricted to employed civilians. Numbers may not sum to totals due to rounding. Multipleimputation used to account for missing data.
SOURCE: U.S. Department of Education, National Center for Education Statistics, National Longitudinal Study of the High School Class of1972 (NLS-72), High School and Beyond (HSB); and U.S. Department of Labor, Bureau of Labor Statistics, National Longitudinal Survey ofYouth (NLSY).
B. Relating Achievement to Annual EarningsIn comparisons between young workers with similar levels of prior educational achieve-ment, the black-white deficit in annual earnings was generally smaller than for youngadults as a whole. In the 1979 sample, there was no significant difference in annual earn-ings for blacks and whites with similar prior educational achievement. In the other threesamples, for men with similar levels of prior educational achievement, the black-white gapin annual earnings was $2,500 to $3,100 (or two-fifths to two-thirds) smaller than for menas a whole. In the 1983–1989 and 1986–1992 samples, among women with similar levelsof prior educational achievement, blacks earned as much as whites. In the 1979 and 1992sample, black women with levels of prior educational achievement similar to those forwhite women earned 12 and 22 percent more per year than white women, respectively.
In the 1979, 1983–1989. and 1986–1992 samples, among men with similar levels of allthree factors—prior educational achievement, educational attainment, and work expe-rience—blacks and whites earned about the same per year. In the 1992 sample, howev-er, black men similar to white men in terms of educational background and work expe-rience earned $2,600 (or 12 percent) less per year than white men.
For young workers with similar levels of prior educational achievement, black-white gapsin annual earnings were similar for men in the 1979 and 1983-1989 samples, and for bothmen and women in the 1986-1992 and 1992 samples. Appendix B indicates that the black-white differences in educational achievement were similar in the 1979 and 1983-1989samples, but smaller in the 1992 sample than in the 1986-1992 sample. Taken together,these findings suggest that the larger black-white earnings gap for men in the 1983–1989sample compared with the 1979 sample may be related to a higher economic return onachievement in the 1980s than in 1979. In contrast, the narrower earnings gap in the 1992sample compared with the 1986–1992 sample may be related, at least in part, to the rela-tively higher achievement of blacks that was characteristic of the 1992 sample.
C. Hourly WagesThe hourly wage is arguably the most precise measure of the earnings capacity of work-ers because, unlike annual earnings, it distinguishes a worker’s rate of pay from thenumber of hours worked. In the present study, hourly earnings information was avail-able for three of the four samples of young adults studied.13
Between 1979 and 1992, the hourly earnings of black young adults were between $0.99 and$1.65 (8 to 17 percent) lower than the hourly earnings of white young adults (table 2.4).Black-white wage gaps were generally larger for men than for women. The black-whitewage gap for men ranged from $1.35 (10 percent of the average white man’s wages) in the1979 sample to $2.21 (20 percent of the average white man’s wages) in the 1986–1992 sam-ple. In contrast, in the 1979 sample, black women and white women had similar wages; andin the 1983–1989 and 1986–1992 samples, black-white wage gaps for women were $0.83 to$1.18 (or two-fifths to one-half) smaller than the corresponding gaps for men.
In the present study, black-white wage gaps were larger in the 1983–1989 sample thanin the 1979 sample, by $0.55 for men and $0.94 for women. This finding is consistent
2. Black-White Differences in Labor Market Outcomes 19
13 The 1992 follow-up of the High School and Beyond sample (“the 1992 sample”) did not includehourly earnings information, so the discussion of hourly earnings is confined to the 1979 sample from theNLS:72 and the 1983–1989 and 1986–1992 samples from the NLSY.
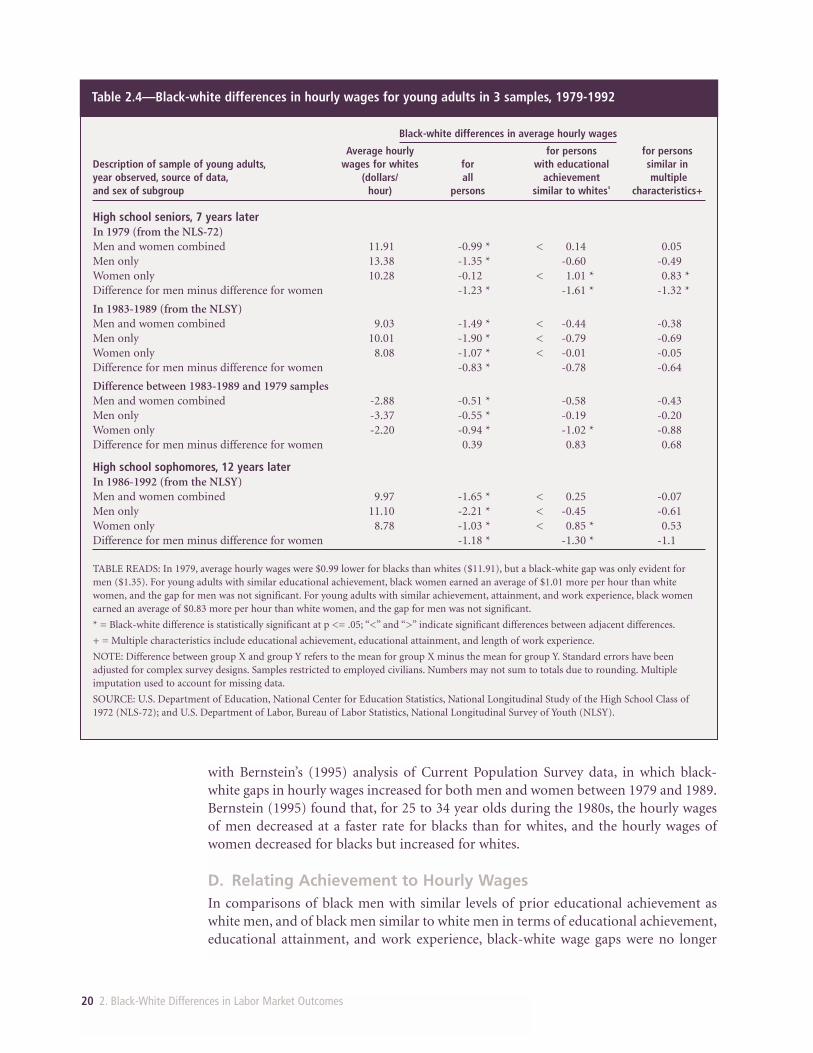
20 2. Black-White Differences in Labor Market Outcomes
Table 2.4—Black-white differences in hourly wages for young adults in 3 samples, 1979-1992
Black-white differences in average hourly wages
Average hourly for persons for personsDescription of sample of young adults, wages for whites for with educational similar inyear observed, source of data, (dollars/ all achievement multipleand sex of subgroup hour) persons similar to whites' characteristics+
High school seniors, 7 years laterIn 1979 (from the NLS-72)Men and women combined 11.91 -0.99 * < 0.14 0.05Men only 13.38 -1.35 * -0.60 -0.49Women only 10.28 -0.12 < 1.01 * 0.83 *Difference for men minus difference for women -1.23 * -1.61 * -1.32 *
In 1983-1989 (from the NLSY)Men and women combined 9.03 -1.49 * < -0.44 -0.38Men only 10.01 -1.90 * < -0.79 -0.69Women only 8.08 -1.07 * < -0.01 -0.05Difference for men minus difference for women -0.83 * -0.78 -0.64
Difference between 1983-1989 and 1979 samplesMen and women combined -2.88 -0.51 * -0.58 -0.43Men only -3.37 -0.55 * -0.19 -0.20Women only -2.20 -0.94 * -1.02 * -0.88Difference for men minus difference for women 0.39 0.83 0.68
High school sophomores, 12 years laterIn 1986-1992 (from the NLSY)Men and women combined 9.97 -1.65 * < 0.25 -0.07Men only 11.10 -2.21 * < -0.45 -0.61Women only 8.78 -1.03 * < 0.85 * 0.53Difference for men minus difference for women -1.18 * -1.30 * -1.1
TABLE READS: In 1979, average hourly wages were $0.99 lower for blacks than whites ($11.91), but a black-white gap was only evident formen ($1.35). For young adults with similar educational achievement, black women earned an average of $1.01 more per hour than whitewomen, and the gap for men was not significant. For young adults with similar achievement, attainment, and work experience, black womenearned an average of $0.83 more per hour than white women, and the gap for men was not significant.
* = Black-white difference is statistically significant at p <= .05; “<” and “>” indicate significant differences between adjacent differences.
+ = Multiple characteristics include educational achievement, educational attainment, and length of work experience.
NOTE: Difference between group X and group Y refers to the mean for group X minus the mean for group Y. Standard errors have beenadjusted for complex survey designs. Samples restricted to employed civilians. Numbers may not sum to totals due to rounding. Multipleimputation used to account for missing data.
SOURCE: U.S. Department of Education, National Center for Education Statistics, National Longitudinal Study of the High School Class of1972 (NLS-72); and U.S. Department of Labor, Bureau of Labor Statistics, National Longitudinal Survey of Youth (NLSY).
with Bernstein’s (1995) analysis of Current Population Survey data, in which black-white gaps in hourly wages increased for both men and women between 1979 and 1989.Bernstein (1995) found that, for 25 to 34 year olds during the 1980s, the hourly wagesof men decreased at a faster rate for blacks than for whites, and the hourly wages ofwomen decreased for blacks but increased for whites.
D. Relating Achievement to Hourly WagesIn comparisons of black men with similar levels of prior educational achievement aswhite men, and of black men similar to white men in terms of educational achievement,educational attainment, and work experience, black-white wage gaps were no longer
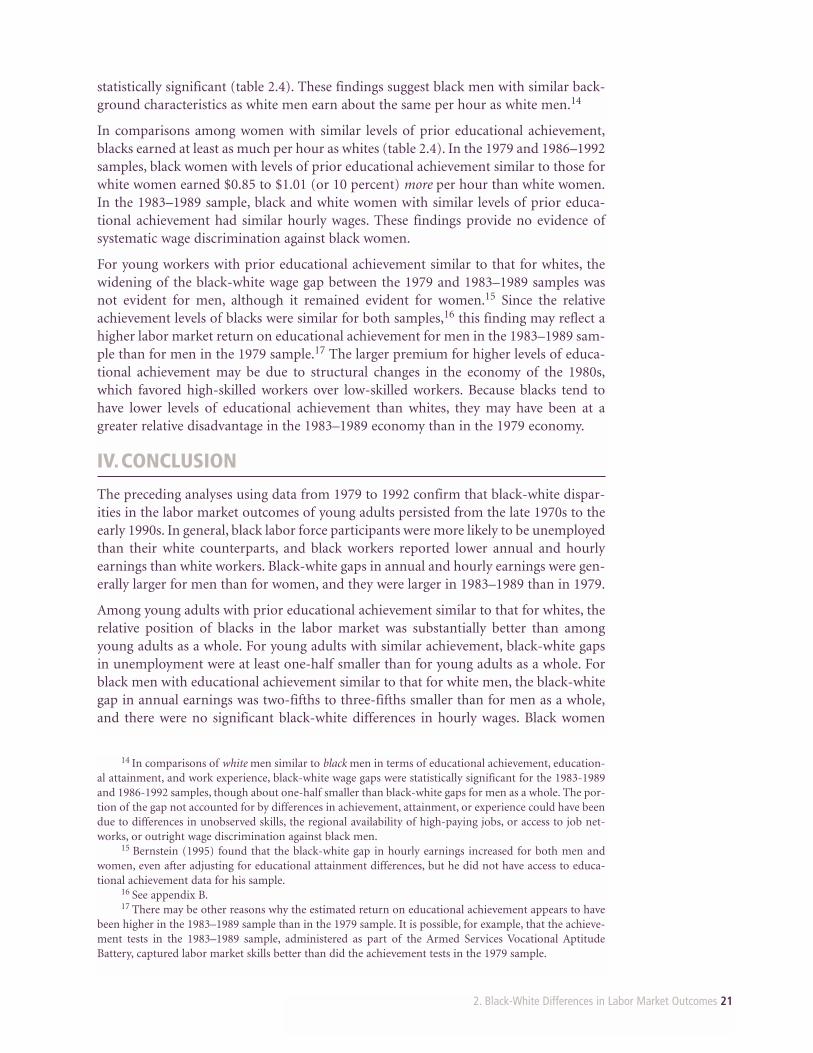
2. Black-White Differences in Labor Market Outcomes 21
14 In comparisons of white men similar to black men in terms of educational achievement, education-al attainment, and work experience, black-white wage gaps were statistically significant for the 1983-1989and 1986-1992 samples, though about one-half smaller than black-white gaps for men as a whole. The por-tion of the gap not accounted for by differences in achievement, attainment, or experience could have beendue to differences in unobserved skills, the regional availability of high-paying jobs, or access to job net-works, or outright wage discrimination against black men.
15 Bernstein (1995) found that the black-white gap in hourly earnings increased for both men andwomen, even after adjusting for educational attainment differences, but he did not have access to educa-tional achievement data for his sample.
16 See appendix B.17 There may be other reasons why the estimated return on educational achievement appears to have
been higher in the 1983–1989 sample than in the 1979 sample. It is possible, for example, that the achieve-ment tests in the 1983–1989 sample, administered as part of the Armed Services Vocational AptitudeBattery, captured labor market skills better than did the achievement tests in the 1979 sample.
statistically significant (table 2.4). These findings suggest black men with similar back-ground characteristics as white men earn about the same per hour as white men.14
In comparisons among women with similar levels of prior educational achievement,blacks earned at least as much per hour as whites (table 2.4). In the 1979 and 1986–1992samples, black women with levels of prior educational achievement similar to those forwhite women earned $0.85 to $1.01 (or 10 percent) more per hour than white women.In the 1983–1989 sample, black and white women with similar levels of prior educa-tional achievement had similar hourly wages. These findings provide no evidence ofsystematic wage discrimination against black women.
For young workers with prior educational achievement similar to that for whites, thewidening of the black-white wage gap between the 1979 and 1983–1989 samples wasnot evident for men, although it remained evident for women.15 Since the relativeachievement levels of blacks were similar for both samples,16 this finding may reflect ahigher labor market return on educational achievement for men in the 1983–1989 sam-ple than for men in the 1979 sample.17 The larger premium for higher levels of educa-tional achievement may be due to structural changes in the economy of the 1980s,which favored high-skilled workers over low-skilled workers. Because blacks tend tohave lower levels of educational achievement than whites, they may have been at agreater relative disadvantage in the 1983–1989 economy than in the 1979 economy.
IV.CONCLUSION
The preceding analyses using data from 1979 to 1992 confirm that black-white dispar-ities in the labor market outcomes of young adults persisted from the late 1970s to theearly 1990s. In general, black labor force participants were more likely to be unemployedthan their white counterparts, and black workers reported lower annual and hourlyearnings than white workers. Black-white gaps in annual and hourly earnings were gen-erally larger for men than for women, and they were larger in 1983–1989 than in 1979.
Among young adults with prior educational achievement similar to that for whites, therelative position of blacks in the labor market was substantially better than amongyoung adults as a whole. For young adults with similar achievement, black-white gapsin unemployment were at least one-half smaller than for young adults as a whole. Forblack men with educational achievement similar to that for white men, the black-whitegap in annual earnings was two-fifths to three-fifths smaller than for men as a whole,and there were no significant black-white differences in hourly wages. Black women
22 2. Black-White Differences in Labor Market Outcomes
with prior educational achievement similar to that for white women earned as least asmuch per year (and per hour) as their white counterparts.
Why is achievement such a powerful predictor of black-white differences in labor mar-ket outcomes, especially for women? One possible explanation is that higher levels ofeducational achievement indicate the presence of skills required for high-wage jobs inthe modern economy. Another possible explanation is that young adults with higherlevels of educational achievement have better access to job networks than young adultswith lower levels of achievement have.
The preceding analyses do not establish the extent to which either of these explanationsis true, and they do not rule out the possibility of some employment discriminationagainst black labor force participants, or some wage discrimination against black men.The chief usefulness of the analyses reported here is not that they explain the precisecausal relationship between educational achievement, race, and labor market outcomes,but that they confirm educational achievement as a powerful predictor of black-whitedifferences in labor market performance.
3. Black-White Differences in Educational Attainment 23
3.BLACK-WHITEDIFFERENCES IN EDUCATIONALATTAINMENTChapter 1 reviewed evidence that the black-white gap in high school completion nar-rowed substantially between 1971 and 1998, such that blacks and whites now remain inhigh school at similar rates, and black young adults now have nearly the same highschool completion rate as white young adults. At the same time, sizable black-white dis-parities in college attendance and completion have persisted since the mid-1970s.
This chapter presents findings on black-white differences in educational attainment infour samples of young adults.1 The analyses investigate the extent to which black-whitedifferences in educational attainment are present for all young adults, for young adultswith similar levels of prior educational achievement, and for young adults similar interms of prior educational achievement, parental socioeconomic status (SES),2 and cen-sus region.3 The outcomes analyzed include the completion of a high school diploma oran equivalent General Educational Development (GED) certificate, college attendance,and college completion.
I. HIGH SCHOOL/GED COMPLETION
1 Appendix A discusses the data sources and treatment of missing data for these analyses; appendix Bdiscuss comparability of data; appendix C discusses the analysis methodology; appendix D presents stan-dard errors for the results in this chapter; and appendix E describes some additional analyses of high schoolcompletion outcomes.
2 SES is a composite variable including father’s years of schooling, mother’s years of schooling, father’soccupational status, mother’s occupational status, and family income.
3 These comparisons, described in appendix C, involve the estimation of analytic models to distinguishhow outcomes vary by race when factors such as achievement are held constant. Our analyses compare allwhites with blacks similar to whites in terms of background characteristics, rather than vice versa. In gen-eral, the pattern of results is similar when we compare all blacks with whites similar to blacks in terms ofbackground characteristics.
• Black-white gaps in high school/GED completion rates were present for youngadults observed during 1983–1989, 1986–1992, and 1992. These gaps were small-er in the 1992 sample than in the 1986-1992 sample.
• Among young adults with similar levels of prior educational achievement, blacksare at least as likely as whites to complete a high school diploma or GED certificate.
Main Findings: High School/GED Completion
24 3. Black-White Differences in Educational Attainment
This section presents analyses of black-white differences in high school and GED com-pletion for three samples of young adults from 1983 through 1992.4 For the purpose ofthese analyses, we treated high school diplomas and GED certificates as equivalent.5
A. High School/GED Completion RatesBlack-white gaps in high school/GED completion were present in all three samples studied(table 3.1). This gap ranged from 2 percentage points in the 1992 sample to 9 percentage points in the 1986–1992 sample. In each of the three samples studied, black-white gaps in high school/GED completion rates were about the same for men and forwomen. The narrowing of the black-white gap in high school/GED completion between the1986–1992 and 1992 samples is consistent with the historical trends discussed in chapter 1.
B. Relating Achievement to High School/GED Completion RatesAmong young adults with similar levels of prior educational achievement, highschool/GED completion rates were at least as high for blacks as for whites (table 3.1).6
In the 1983–1989 sample, blacks and whites with similar levels of achievement had sim-ilar high school/GED completion rates. In the 1986–1992 sample, for young adults withsimilar levels of achievement, blacks had a 4 percentage-point higher rates of highschool/GED completion than whites. In the 1992 sample, for young adults with similarlevels of prior achievement, blacks had a 2 percentage-point higher rates of highschool/GED completion than whites.
II. COLLEGE ATTENDANCE AND COMPLETION
4 We analyzed the black-white gap in high school/GED completion for three samples of young adults:participants in the National Longitudinal Survey of Youth (NLSY) who were high school seniors between1976 and 1982, observed between 1983 and 1989, 7 years after grade 12 (“the 1983–1989 sample”); partic-ipants in the NLSY who were high school sophomores between 1974 and 1980, observed between 1986 and1992, 12 years after grade 10 (“the 1986–1992 sample”); and participants in the High School and BeyondSurvey of 1980 high school sophomores, observed in 1992, 12 years after grade 10 (“the 1992 sample”). Nocomparable high school completion information was available in 1979 for the members of the NationalLongitudinal Study of the High School Class of 1972, since questions on high school completion were notincluded in the 1979 follow-up survey.
5 Appendix E presents evidence on whether the black-white gap in high school completion is differentfrom the black-white gap in high school/GED completion, and whether black-white gaps in high school/GEDcompletion rates differ when prisoners and other institutionalized persons are included in the sample.
6 Members of the 1983–1989 and 1986–1992 samples took achievement tests in 1980, after about two-thirds of each sample had already finished high school. The measurement of achievement after high schoolfor a large portion of these samples implies that one should be cautious in interpreting achievement as the“cause” of high school or GED completion. In contrast, for the 1979 and 1992 samples, the achievementtests were administered in grades 12 and 10, respectively, prior to high school completion.
• Blacks are less likely to attend college than whites, and black college attendees areless likely to complete college than white college attendees.
• Among young adults with similar levels of educational achievement, collegeattendance rates are higher for blacks than whites, and college completion rates ofblack college attendees are at least as high as college completion rates of white col-lege attendees.
Main Findings: College Attendance and Completion
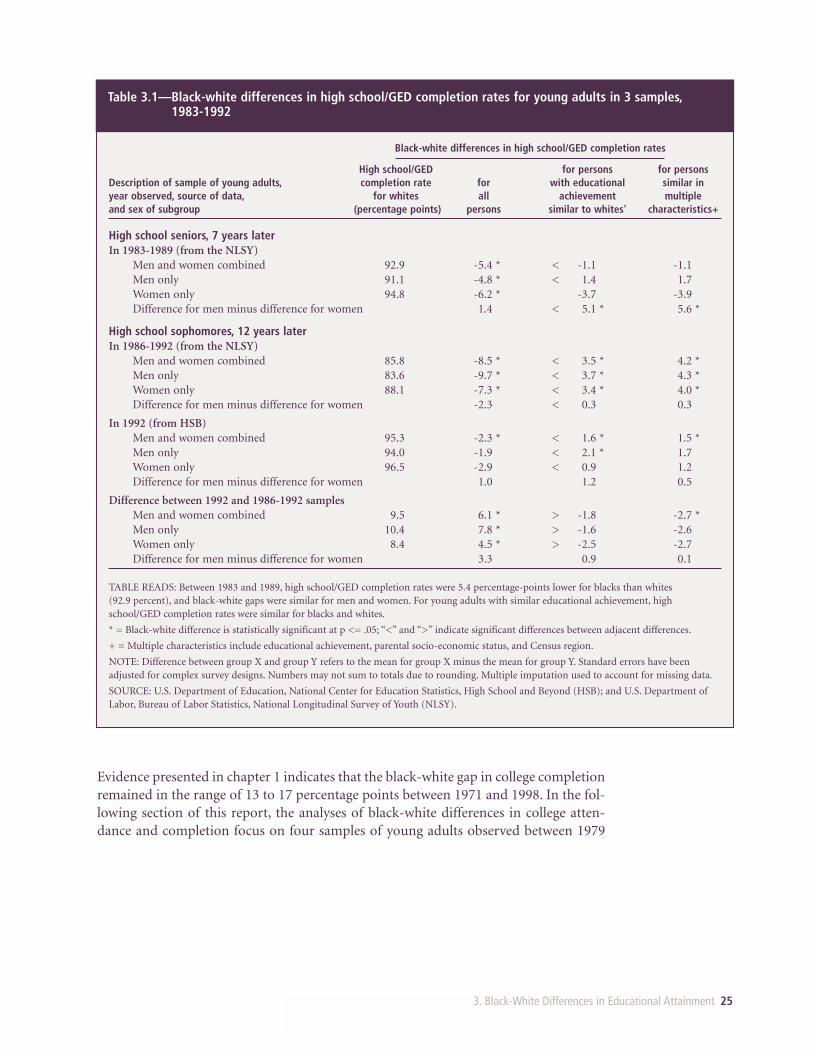
3. Black-White Differences in Educational Attainment 25
Table 3.1—Black-white differences in high school/GED completion rates for young adults in 3 samples,1983-1992
Black-white differences in high school/GED completion rates
High school/GED for persons for persons Description of sample of young adults, completion rate for with educational similar in year observed, source of data, for whites all achievement multipleand sex of subgroup (percentage points) persons similar to whites' characteristics+
High school seniors, 7 years laterIn 1983-1989 (from the NLSY)
Men and women combined 92.9 -5.4 * < -1.1 -1.1Men only 91.1 -4.8 * < 1.4 1.7Women only 94.8 -6.2 * -3.7 -3.9Difference for men minus difference for women 1.4 < 5.1 * 5.6 *
High school sophomores, 12 years laterIn 1986-1992 (from the NLSY)
Men and women combined 85.8 -8.5 * < 3.5 * 4.2 *Men only 83.6 -9.7 * < 3.7 * 4.3 *Women only 88.1 -7.3 * < 3.4 * 4.0 *Difference for men minus difference for women -2.3 < 0.3 0.3
In 1992 (from HSB)Men and women combined 95.3 -2.3 * < 1.6 * 1.5 *Men only 94.0 -1.9 < 2.1 * 1.7Women only 96.5 -2.9 < 0.9 1.2Difference for men minus difference for women 1.0 1.2 0.5
Difference between 1992 and 1986-1992 samplesMen and women combined 9.5 6.1 * > -1.8 -2.7 *Men only 10.4 7.8 * > -1.6 -2.6Women only 8.4 4.5 * > -2.5 -2.7Difference for men minus difference for women 3.3 0.9 0.1
TABLE READS: Between 1983 and 1989, high school/GED completion rates were 5.4 percentage-points lower for blacks than whites (92.9 percent), and black-white gaps were similar for men and women. For young adults with similar educational achievement, highschool/GED completion rates were similar for blacks and whites.
* = Black-white difference is statistically significant at p <= .05; “<” and “>” indicate significant differences between adjacent differences.
+ = Multiple characteristics include educational achievement, parental socio-economic status, and Census region.
NOTE: Difference between group X and group Y refers to the mean for group X minus the mean for group Y. Standard errors have beenadjusted for complex survey designs. Numbers may not sum to totals due to rounding. Multiple imputation used to account for missing data.
SOURCE: U.S. Department of Education, National Center for Education Statistics, High School and Beyond (HSB); and U.S. Department ofLabor, Bureau of Labor Statistics, National Longitudinal Survey of Youth (NLSY).
Evidence presented in chapter 1 indicates that the black-white gap in college completionremained in the range of 13 to 17 percentage points between 1971 and 1998. In the fol-lowing section of this report, the analyses of black-white differences in college atten-dance and completion focus on four samples of young adults observed between 1979
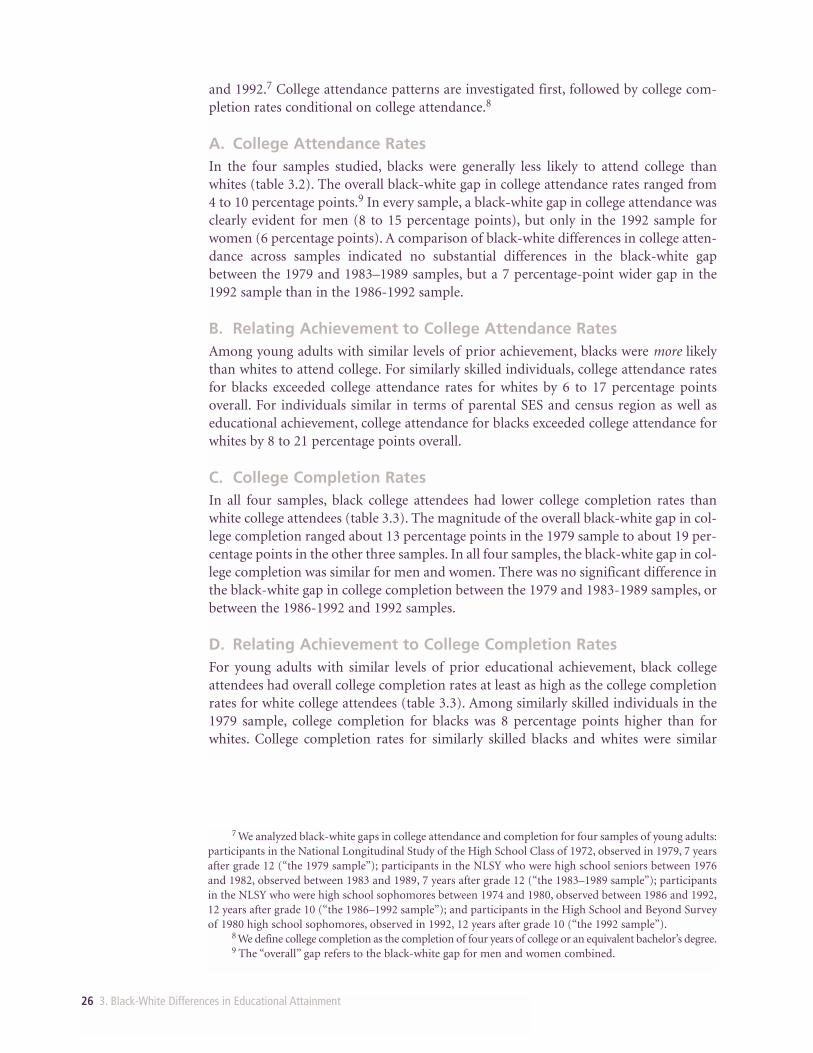
26 3. Black-White Differences in Educational Attainment
and 1992.7 College attendance patterns are investigated first, followed by college com-pletion rates conditional on college attendance.8
A. College Attendance RatesIn the four samples studied, blacks were generally less likely to attend college thanwhites (table 3.2). The overall black-white gap in college attendance rates ranged from4 to 10 percentage points.9 In every sample, a black-white gap in college attendance wasclearly evident for men (8 to 15 percentage points), but only in the 1992 sample forwomen (6 percentage points). A comparison of black-white differences in college atten-dance across samples indicated no substantial differences in the black-white gapbetween the 1979 and 1983–1989 samples, but a 7 percentage-point wider gap in the1992 sample than in the 1986-1992 sample.
B. Relating Achievement to College Attendance RatesAmong young adults with similar levels of prior achievement, blacks were more likelythan whites to attend college. For similarly skilled individuals, college attendance ratesfor blacks exceeded college attendance rates for whites by 6 to 17 percentage pointsoverall. For individuals similar in terms of parental SES and census region as well aseducational achievement, college attendance for blacks exceeded college attendance forwhites by 8 to 21 percentage points overall.
C. College Completion RatesIn all four samples, black college attendees had lower college completion rates thanwhite college attendees (table 3.3). The magnitude of the overall black-white gap in col-lege completion ranged about 13 percentage points in the 1979 sample to about 19 per-centage points in the other three samples. In all four samples, the black-white gap in col-lege completion was similar for men and women. There was no significant difference inthe black-white gap in college completion between the 1979 and 1983-1989 samples, orbetween the 1986-1992 and 1992 samples.
D. Relating Achievement to College Completion RatesFor young adults with similar levels of prior educational achievement, black collegeattendees had overall college completion rates at least as high as the college completionrates for white college attendees (table 3.3). Among similarly skilled individuals in the1979 sample, college completion for blacks was 8 percentage points higher than forwhites. College completion rates for similarly skilled blacks and whites were similar
7 We analyzed black-white gaps in college attendance and completion for four samples of young adults:participants in the National Longitudinal Study of the High School Class of 1972, observed in 1979, 7 yearsafter grade 12 (“the 1979 sample”); participants in the NLSY who were high school seniors between 1976and 1982, observed between 1983 and 1989, 7 years after grade 12 (“the 1983–1989 sample”); participantsin the NLSY who were high school sophomores between 1974 and 1980, observed between 1986 and 1992,12 years after grade 10 (“the 1986–1992 sample”); and participants in the High School and Beyond Surveyof 1980 high school sophomores, observed in 1992, 12 years after grade 10 (“the 1992 sample”).
8 We define college completion as the completion of four years of college or an equivalent bachelor’s degree.9 The “overall” gap refers to the black-white gap for men and women combined.
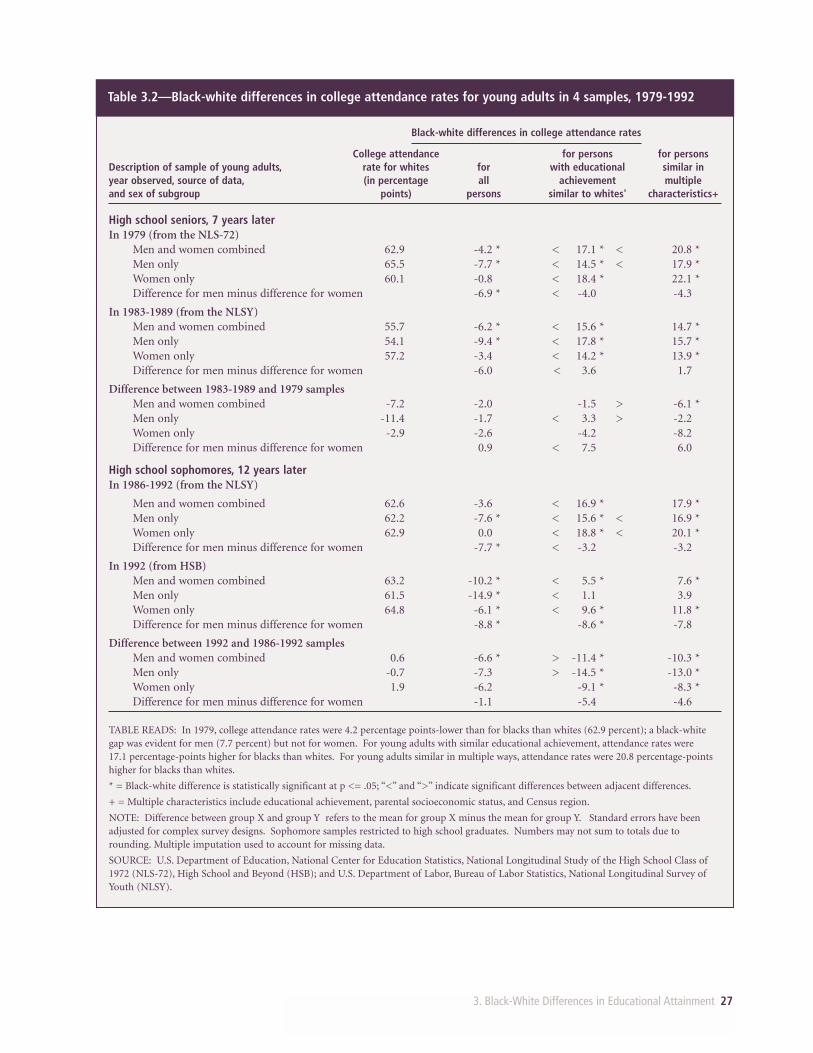
3. Black-White Differences in Educational Attainment 27
Table 3.2—Black-white differences in college attendance rates for young adults in 4 samples, 1979-1992
Black-white differences in college attendance rates
College attendance for persons for personsDescription of sample of young adults, rate for whites for with educational similar in year observed, source of data, (in percentage all achievement multipleand sex of subgroup points) persons similar to whites' characteristics+
High school seniors, 7 years laterIn 1979 (from the NLS-72)
Men and women combined 62.9 -4.2 * < 17.1 * < 20.8 *Men only 65.5 -7.7 * < 14.5 * < 17.9 *Women only 60.1 -0.8 < 18.4 * 22.1 *Difference for men minus difference for women -6.9 * < -4.0 -4.3
In 1983-1989 (from the NLSY)Men and women combined 55.7 -6.2 * < 15.6 * 14.7 *Men only 54.1 -9.4 * < 17.8 * 15.7 *Women only 57.2 -3.4 < 14.2 * 13.9 *Difference for men minus difference for women -6.0 < 3.6 1.7
Difference between 1983-1989 and 1979 samplesMen and women combined -7.2 -2.0 -1.5 > -6.1 *Men only -11.4 -1.7 < 3.3 > -2.2Women only -2.9 -2.6 -4.2 -8.2Difference for men minus difference for women 0.9 < 7.5 6.0
High school sophomores, 12 years laterIn 1986-1992 (from the NLSY)
Men and women combined 62.6 -3.6 < 16.9 * 17.9 *Men only 62.2 -7.6 * < 15.6 * < 16.9 *Women only 62.9 0.0 < 18.8 * < 20.1 *Difference for men minus difference for women -7.7 * < -3.2 -3.2
In 1992 (from HSB)Men and women combined 63.2 -10.2 * < 5.5 * 7.6 *Men only 61.5 -14.9 * < 1.1 3.9Women only 64.8 -6.1 * < 9.6 * 11.8 *Difference for men minus difference for women -8.8 * -8.6 * -7.8
Difference between 1992 and 1986-1992 samplesMen and women combined 0.6 -6.6 * > -11.4 * -10.3 *Men only -0.7 -7.3 > -14.5 * -13.0 *Women only 1.9 -6.2 -9.1 * -8.3 *Difference for men minus difference for women -1.1 -5.4 -4.6
TABLE READS: In 1979, college attendance rates were 4.2 percentage points-lower than for blacks than whites (62.9 percent); a black-whitegap was evident for men (7.7 percent) but not for women. For young adults with similar educational achievement, attendance rates were 17.1 percentage-points higher for blacks than whites. For young adults similar in multiple ways, attendance rates were 20.8 percentage-pointshigher for blacks than whites.
* = Black-white difference is statistically significant at p <= .05; “<” and “>” indicate significant differences between adjacent differences.
+ = Multiple characteristics include educational achievement, parental socioeconomic status, and Census region.
NOTE: Difference between group X and group Y refers to the mean for group X minus the mean for group Y. Standard errors have beenadjusted for complex survey designs. Sophomore samples restricted to high school graduates. Numbers may not sum to totals due torounding. Multiple imputation used to account for missing data.
SOURCE: U.S. Department of Education, National Center for Education Statistics, National Longitudinal Study of the High School Class of1972 (NLS-72), High School and Beyond (HSB); and U.S. Department of Labor, Bureau of Labor Statistics, National Longitudinal Survey ofYouth (NLSY).
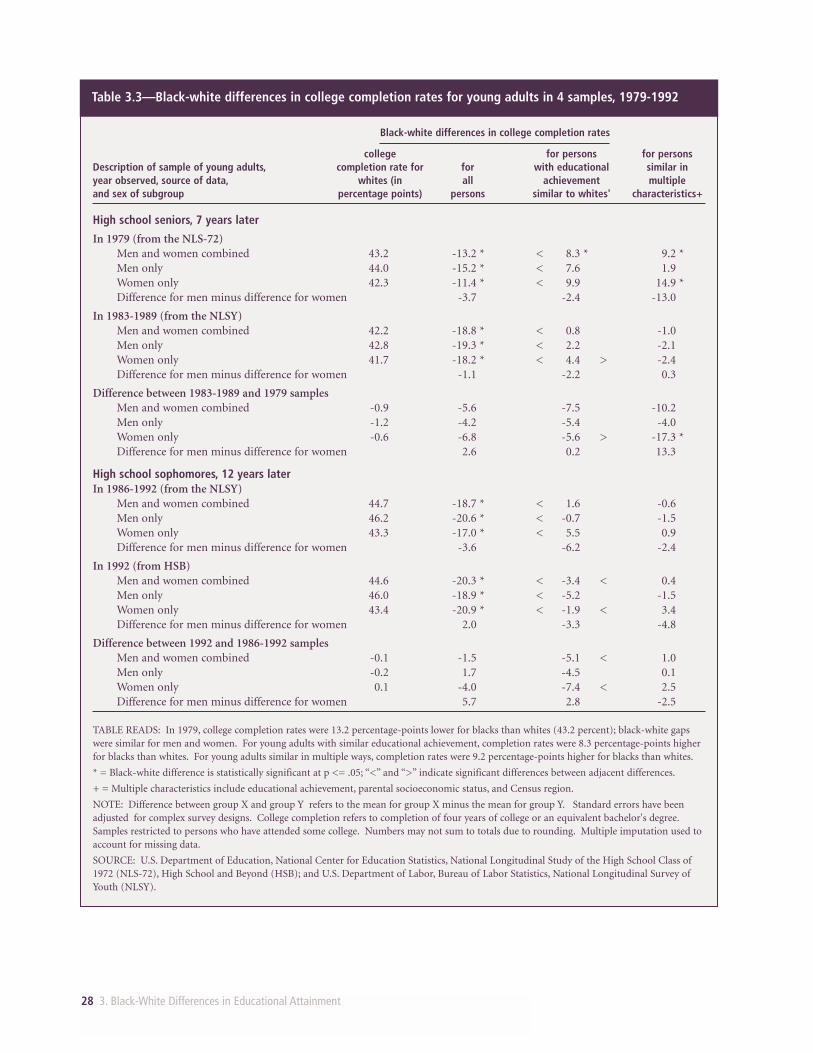
28 3. Black-White Differences in Educational Attainment
Table 3.3—Black-white differences in college completion rates for young adults in 4 samples, 1979-1992
Black-white differences in college completion rates
college for persons for personsDescription of sample of young adults, completion rate for for with educational similar in year observed, source of data, whites (in all achievement multipleand sex of subgroup percentage points) persons similar to whites' characteristics+
High school seniors, 7 years later
In 1979 (from the NLS-72)Men and women combined 43.2 -13.2 * < 8.3 * 9.2 *Men only 44.0 -15.2 * < 7.6 1.9Women only 42.3 -11.4 * < 9.9 14.9 *Difference for men minus difference for women -3.7 -2.4 -13.0
In 1983-1989 (from the NLSY)Men and women combined 42.2 -18.8 * < 0.8 -1.0Men only 42.8 -19.3 * < 2.2 -2.1Women only 41.7 -18.2 * < 4.4 > -2.4Difference for men minus difference for women -1.1 -2.2 0.3
Difference between 1983-1989 and 1979 samplesMen and women combined -0.9 -5.6 -7.5 -10.2Men only -1.2 -4.2 -5.4 -4.0Women only -0.6 -6.8 -5.6 > -17.3 *Difference for men minus difference for women 2.6 0.2 13.3
High school sophomores, 12 years laterIn 1986-1992 (from the NLSY)
Men and women combined 44.7 -18.7 * < 1.6 -0.6Men only 46.2 -20.6 * < -0.7 -1.5Women only 43.3 -17.0 * < 5.5 0.9Difference for men minus difference for women -3.6 -6.2 -2.4
In 1992 (from HSB)Men and women combined 44.6 -20.3 * < -3.4 < 0.4Men only 46.0 -18.9 * < -5.2 -1.5Women only 43.4 -20.9 * < -1.9 < 3.4Difference for men minus difference for women 2.0 -3.3 -4.8
Difference between 1992 and 1986-1992 samplesMen and women combined -0.1 -1.5 -5.1 < 1.0Men only -0.2 1.7 -4.5 0.1Women only 0.1 -4.0 -7.4 < 2.5Difference for men minus difference for women 5.7 2.8 -2.5
TABLE READS: In 1979, college completion rates were 13.2 percentage-points lower for blacks than whites (43.2 percent); black-white gapswere similar for men and women. For young adults with similar educational achievement, completion rates were 8.3 percentage-points higherfor blacks than whites. For young adults similar in multiple ways, completion rates were 9.2 percentage-points higher for blacks than whites.
* = Black-white difference is statistically significant at p <= .05; “<” and “>” indicate significant differences between adjacent differences.
+ = Multiple characteristics include educational achievement, parental socioeconomic status, and Census region.
NOTE: Difference between group X and group Y refers to the mean for group X minus the mean for group Y. Standard errors have beenadjusted for complex survey designs. College completion refers to completion of four years of college or an equivalent bachelor's degree.Samples restricted to persons who have attended some college. Numbers may not sum to totals due to rounding. Multiple imputation used toaccount for missing data.
SOURCE: U.S. Department of Education, National Center for Education Statistics, National Longitudinal Study of the High School Class of1972 (NLS-72), High School and Beyond (HSB); and U.S. Department of Labor, Bureau of Labor Statistics, National Longitudinal Survey ofYouth (NLSY).
3. Black-White Differences in Educational Attainment 29
within each of the three other samples. These findings run counter to the claim that “thedeficit in test scores...doesn’t begin to explain why black students are more likely to dropout...once they begin college” (Steele 1995).10 For individuals similar in terms ofparental SES and census region as well as educational achievement, college completionfor blacks exceeded college completion for whites by 9 percentage points overall in the1979 sample. Within the other samples, blacks and whites similar in these areas had sim-ilar college completion rates.
III. CONCLUSION
The analyses documented in this chapter provide strong evidence that differences ineducational achievement, even when measured as early as the sophomore year of highschool, are a powerful predictor of black-white disparities in postsecondary education-al attainment. Among young adults with similar levels of prior educational achieve-ment, blacks have rates of high school/GED completion, college attendance, and collegecompletion at least as high as the corresponding rates for whites.
One possible reason for the correlation between differences in achievement and attain-ment is that students’ relative educational achievement through high school contributesdirectly to their relative postsecondary attainment. Another possible reason for this cor-relation is that the same (unobserved) factors that contribute to students’ relative educa-tional achievement also happen to contribute to their relative postsecondary attainment.To the extent that the first explanation is true, differences in achievement are an impor-tant cause of differences in attainment. To the extent that the second explanation is true,differences in achievement are an important indicator of differences in attainment. It islikely that achievement differences are both a cause and an indicator of attainment dif-ferences. The next chapter analyzes black-white differences in educational achievementfor four samples of children observed at various stages between grades 1 and 12.
10 Steele’s observation could still be correct if, among young adults with similar test scores, blacks aremore likely than whites to drop out of a particular college, but just as likely to complete a college degree.
4. Black-White Differences in Educational Achievement 31
4.BLACK-WHITEDIFFERENCES IN EDUCATIONALACHIEVEMENTFindings discussed in the preceding chapters show that the labor market performanceand educational attainment of blacks relative to whites were substantially greater foryoung adults with similar levels of prior educational achievement than for young adultsas a whole. Nonetheless, black-white disparities in economic and educational outcomeshave persisted in the United States, where the average educational achievement of blackstudents has been consistently below the average educational achievement of white stu-dents. Historical data from the NAEP show this gap to have narrowed somewhat overtime, but black-white differences in educational achievement remain.
Given the strong association between black-white differences in educational achieve-ment and black-white differences in subsequent educational and economic outcomes,it is important to understand the nature of the achievement gap throughout elementaryand secondary school. Much research has been done on the magnitude of this gap incross-sectional surveys, but little is known of the extent to which the black-whiteachievement gap changes for the same group of students as they advance through ele-mentary or secondary school. Evidence of a changing black-white achievement gap forthe same group of students would suggest that changes in students’ environments—including their homes, neighborhoods, and schools—may influence the magnitude ofthe achievement gap, as well as the disparities in subsequent outcomes.
This chapter describes findings on the black-white achievement gap in mathematics andin reading, beginning with samples of children from elementary school and concludingwith samples from secondary school.1 The description of the analyses of outcomeswithin each sample is followed by a description of analyses of black-white differences inachievement across samples from elementary and secondary school. General findingsare discussed in a concluding section at the end of the chapter.
Achievement test scores are expressed in eighth grade standard deviation units (SDUs).This metric enables test scores to be compared across samples and across a wide range ofgrades. An average mathematics or reading score for eighth graders was subtracted fromeach student’s score, and the resulting difference was divided by the standard deviation
1 Appendix A discusses the data sources and treatment of missing data for these analyses; appendix Bdiscuss comparability of data; appendix C discusses the analysis methodology; and appendix D presentsstandard errors for the results in this chapter.
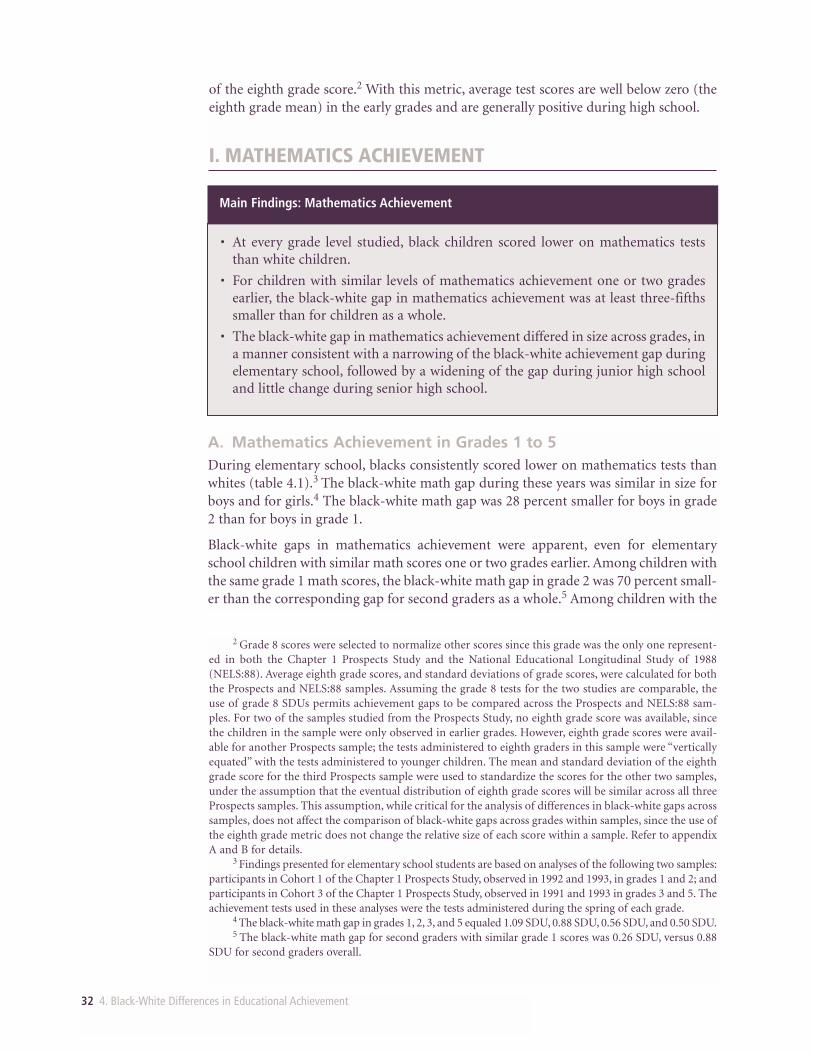
32 4. Black-White Differences in Educational Achievement
of the eighth grade score.2 With this metric, average test scores are well below zero (theeighth grade mean) in the early grades and are generally positive during high school.
I. MATHEMATICS ACHIEVEMENT
2 Grade 8 scores were selected to normalize other scores since this grade was the only one represent-ed in both the Chapter 1 Prospects Study and the National Educational Longitudinal Study of 1988(NELS:88). Average eighth grade scores, and standard deviations of grade scores, were calculated for boththe Prospects and NELS:88 samples. Assuming the grade 8 tests for the two studies are comparable, theuse of grade 8 SDUs permits achievement gaps to be compared across the Prospects and NELS:88 sam-ples. For two of the samples studied from the Prospects Study, no eighth grade score was available, sincethe children in the sample were only observed in earlier grades. However, eighth grade scores were avail-able for another Prospects sample; the tests administered to eighth graders in this sample were “verticallyequated” with the tests administered to younger children. The mean and standard deviation of the eighthgrade score for the third Prospects sample were used to standardize the scores for the other two samples,under the assumption that the eventual distribution of eighth grade scores will be similar across all threeProspects samples. This assumption, while critical for the analysis of differences in black-white gaps acrosssamples, does not affect the comparison of black-white gaps across grades within samples, since the use ofthe eighth grade metric does not change the relative size of each score within a sample. Refer to appendixA and B for details.
3 Findings presented for elementary school students are based on analyses of the following two samples:participants in Cohort 1 of the Chapter 1 Prospects Study, observed in 1992 and 1993, in grades 1 and 2; andparticipants in Cohort 3 of the Chapter 1 Prospects Study, observed in 1991 and 1993 in grades 3 and 5. Theachievement tests used in these analyses were the tests administered during the spring of each grade.
4 The black-white math gap in grades 1, 2, 3, and 5 equaled 1.09 SDU, 0.88 SDU, 0.56 SDU, and 0.50 SDU.5 The black-white math gap for second graders with similar grade 1 scores was 0.26 SDU, versus 0.88
SDU for second graders overall.
A. Mathematics Achievement in Grades 1 to 5During elementary school, blacks consistently scored lower on mathematics tests thanwhites (table 4.1).3 The black-white math gap during these years was similar in size forboys and for girls.4 The black-white math gap was 28 percent smaller for boys in grade2 than for boys in grade 1.
Black-white gaps in mathematics achievement were apparent, even for elementaryschool children with similar math scores one or two grades earlier. Among children withthe same grade 1 math scores, the black-white math gap in grade 2 was 70 percent small-er than the corresponding gap for second graders as a whole.5 Among children with the
• At every grade level studied, black children scored lower on mathematics teststhan white children.
• For children with similar levels of mathematics achievement one or two gradesearlier, the black-white gap in mathematics achievement was at least three-fifthssmaller than for children as a whole.
• The black-white gap in mathematics achievement differed in size across grades, ina manner consistent with a narrowing of the black-white achievement gap duringelementary school, followed by a widening of the gap during junior high schooland little change during senior high school.
Main Findings: Mathematics Achievement
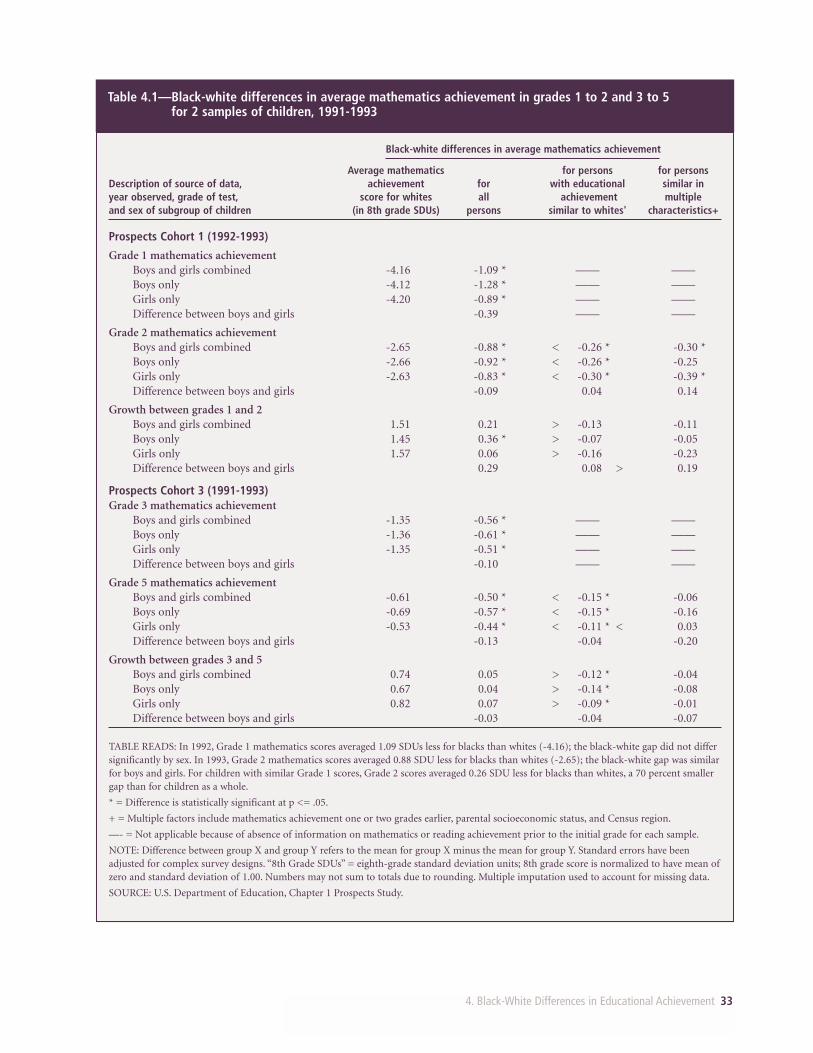
4. Black-White Differences in Educational Achievement 33
Table 4.1—Black-white differences in average mathematics achievement in grades 1 to 2 and 3 to 5 for 2 samples of children, 1991-1993
Black-white differences in average mathematics achievement
Average mathematics for persons for personsDescription of source of data, achievement for with educational similar in year observed, grade of test, score for whites all achievement multipleand sex of subgroup of children (in 8th grade SDUs) persons similar to whites' characteristics+
Prospects Cohort 1 (1992-1993)
Grade 1 mathematics achievementBoys and girls combined -4.16 -1.09 * —— ——Boys only -4.12 -1.28 * —— ——Girls only -4.20 -0.89 * —— ——Difference between boys and girls -0.39 —— ——
Grade 2 mathematics achievementBoys and girls combined -2.65 -0.88 * < -0.26 * -0.30 *Boys only -2.66 -0.92 * < -0.26 * -0.25Girls only -2.63 -0.83 * < -0.30 * -0.39 *Difference between boys and girls -0.09 0.04 0.14
Growth between grades 1 and 2Boys and girls combined 1.51 0.21 > -0.13 -0.11Boys only 1.45 0.36 * > -0.07 -0.05Girls only 1.57 0.06 > -0.16 -0.23Difference between boys and girls 0.29 0.08 > 0.19
Prospects Cohort 3 (1991-1993)Grade 3 mathematics achievement
Boys and girls combined -1.35 -0.56 * —— ——Boys only -1.36 -0.61 * —— ——Girls only -1.35 -0.51 * —— ——Difference between boys and girls -0.10 —— ——
Grade 5 mathematics achievementBoys and girls combined -0.61 -0.50 * < -0.15 * -0.06Boys only -0.69 -0.57 * < -0.15 * -0.16Girls only -0.53 -0.44 * < -0.11 * < 0.03Difference between boys and girls -0.13 -0.04 -0.20
Growth between grades 3 and 5Boys and girls combined 0.74 0.05 > -0.12 * -0.04Boys only 0.67 0.04 > -0.14 * -0.08Girls only 0.82 0.07 > -0.09 * -0.01Difference between boys and girls -0.03 -0.04 -0.07
TABLE READS: In 1992, Grade 1 mathematics scores averaged 1.09 SDUs less for blacks than whites (-4.16); the black-white gap did not differsignificantly by sex. In 1993, Grade 2 mathematics scores averaged 0.88 SDU less for blacks than whites (-2.65); the black-white gap was similarfor boys and girls. For children with similar Grade 1 scores, Grade 2 scores averaged 0.26 SDU less for blacks than whites, a 70 percent smallergap than for children as a whole.
* = Difference is statistically significant at p <= .05.
+ = Multiple factors include mathematics achievement one or two grades earlier, parental socioeconomic status, and Census region.
—- = Not applicable because of absence of information on mathematics or reading achievement prior to the initial grade for each sample.
NOTE: Difference between group X and group Y refers to the mean for group X minus the mean for group Y. Standard errors have beenadjusted for complex survey designs. “8th Grade SDUs” = eighth-grade standard deviation units; 8th grade score is normalized to have mean ofzero and standard deviation of 1.00. Numbers may not sum to totals due to rounding. Multiple imputation used to account for missing data.
SOURCE: U.S. Department of Education, Chapter 1 Prospects Study.
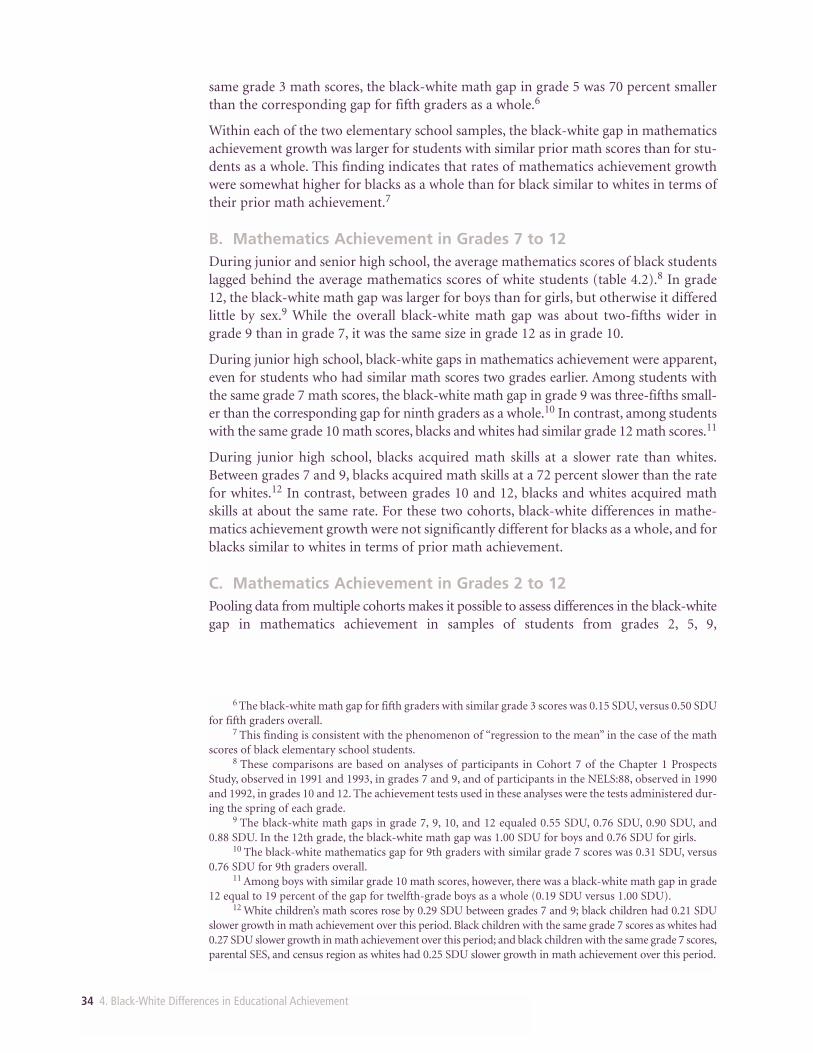
34 4. Black-White Differences in Educational Achievement
same grade 3 math scores, the black-white math gap in grade 5 was 70 percent smallerthan the corresponding gap for fifth graders as a whole.6
Within each of the two elementary school samples, the black-white gap in mathematicsachievement growth was larger for students with similar prior math scores than for stu-dents as a whole. This finding indicates that rates of mathematics achievement growthwere somewhat higher for blacks as a whole than for black similar to whites in terms oftheir prior math achievement.7
B. Mathematics Achievement in Grades 7 to 12During junior and senior high school, the average mathematics scores of black studentslagged behind the average mathematics scores of white students (table 4.2).8 In grade12, the black-white math gap was larger for boys than for girls, but otherwise it differedlittle by sex.9 While the overall black-white math gap was about two-fifths wider ingrade 9 than in grade 7, it was the same size in grade 12 as in grade 10.
During junior high school, black-white gaps in mathematics achievement were apparent,even for students who had similar math scores two grades earlier. Among students withthe same grade 7 math scores, the black-white math gap in grade 9 was three-fifths small-er than the corresponding gap for ninth graders as a whole.10 In contrast, among studentswith the same grade 10 math scores, blacks and whites had similar grade 12 math scores.11
During junior high school, blacks acquired math skills at a slower rate than whites.Between grades 7 and 9, blacks acquired math skills at a 72 percent slower than the ratefor whites.12 In contrast, between grades 10 and 12, blacks and whites acquired mathskills at about the same rate. For these two cohorts, black-white differences in mathe-matics achievement growth were not significantly different for blacks as a whole, and forblacks similar to whites in terms of prior math achievement.
C. Mathematics Achievement in Grades 2 to 12Pooling data from multiple cohorts makes it possible to assess differences in the black-whitegap in mathematics achievement in samples of students from grades 2, 5, 9,
6 The black-white math gap for fifth graders with similar grade 3 scores was 0.15 SDU, versus 0.50 SDUfor fifth graders overall.
7 This finding is consistent with the phenomenon of “regression to the mean” in the case of the mathscores of black elementary school students.
8 These comparisons are based on analyses of participants in Cohort 7 of the Chapter 1 ProspectsStudy, observed in 1991 and 1993, in grades 7 and 9, and of participants in the NELS:88, observed in 1990and 1992, in grades 10 and 12. The achievement tests used in these analyses were the tests administered dur-ing the spring of each grade.
9 The black-white math gaps in grade 7, 9, 10, and 12 equaled 0.55 SDU, 0.76 SDU, 0.90 SDU, and 0.88 SDU. In the 12th grade, the black-white math gap was 1.00 SDU for boys and 0.76 SDU for girls.
10 The black-white mathematics gap for 9th graders with similar grade 7 scores was 0.31 SDU, versus0.76 SDU for 9th graders overall.
11 Among boys with similar grade 10 math scores, however, there was a black-white math gap in grade12 equal to 19 percent of the gap for twelfth-grade boys as a whole (0.19 SDU versus 1.00 SDU).
12 White children’s math scores rose by 0.29 SDU between grades 7 and 9; black children had 0.21 SDUslower growth in math achievement over this period. Black children with the same grade 7 scores as whites had0.27 SDU slower growth in math achievement over this period; and black children with the same grade 7 scores,parental SES, and census region as whites had 0.25 SDU slower growth in math achievement over this period.
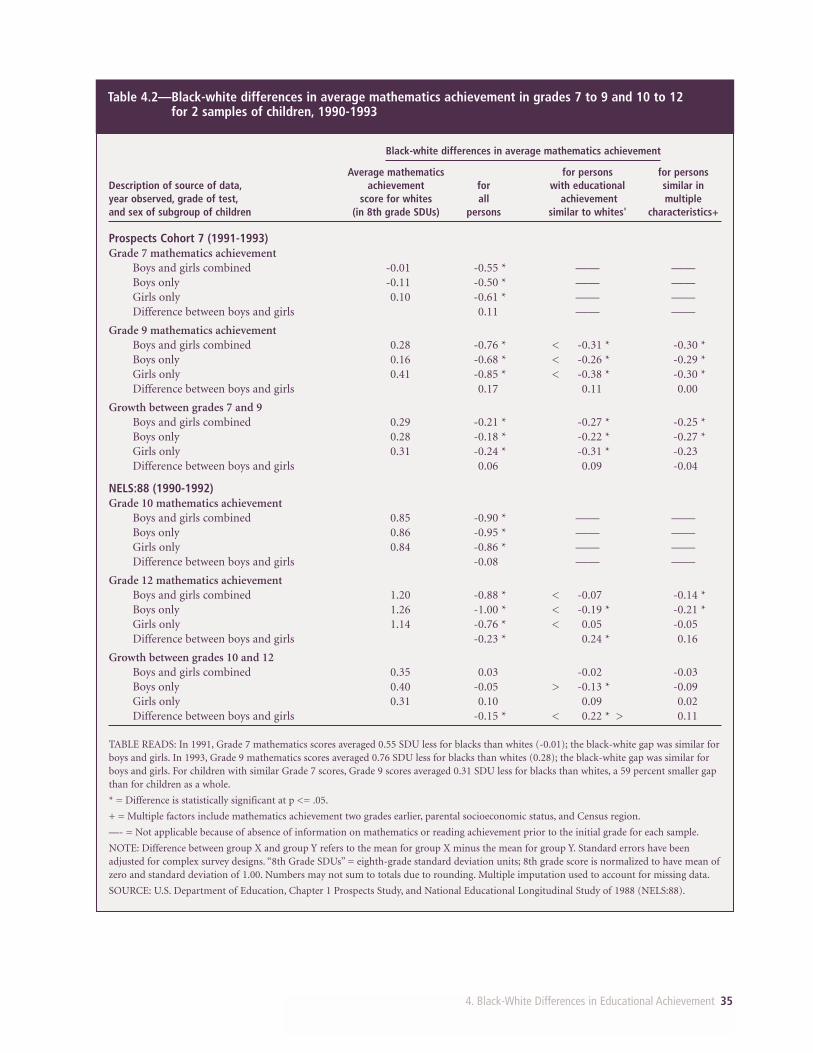
4. Black-White Differences in Educational Achievement 35
Table 4.2—Black-white differences in average mathematics achievement in grades 7 to 9 and 10 to 12 for 2 samples of children, 1990-1993
Black-white differences in average mathematics achievement
Average mathematics for persons for personsDescription of source of data, achievement for with educational similar in year observed, grade of test, score for whites all achievement multipleand sex of subgroup of children (in 8th grade SDUs) persons similar to whites' characteristics+
Prospects Cohort 7 (1991-1993)Grade 7 mathematics achievement
Boys and girls combined -0.01 -0.55 * —— ——Boys only -0.11 -0.50 * —— ——Girls only 0.10 -0.61 * —— ——Difference between boys and girls 0.11 —— ——
Grade 9 mathematics achievementBoys and girls combined 0.28 -0.76 * < -0.31 * -0.30 *Boys only 0.16 -0.68 * < -0.26 * -0.29 *Girls only 0.41 -0.85 * < -0.38 * -0.30 *Difference between boys and girls 0.17 0.11 0.00
Growth between grades 7 and 9Boys and girls combined 0.29 -0.21 * -0.27 * -0.25 *Boys only 0.28 -0.18 * -0.22 * -0.27 *Girls only 0.31 -0.24 * -0.31 * -0.23Difference between boys and girls 0.06 0.09 -0.04
NELS:88 (1990-1992)Grade 10 mathematics achievement
Boys and girls combined 0.85 -0.90 * —— ——Boys only 0.86 -0.95 * —— ——Girls only 0.84 -0.86 * —— ——Difference between boys and girls -0.08 —— ——
Grade 12 mathematics achievementBoys and girls combined 1.20 -0.88 * < -0.07 -0.14 *Boys only 1.26 -1.00 * < -0.19 * -0.21 *Girls only 1.14 -0.76 * < 0.05 -0.05Difference between boys and girls -0.23 * 0.24 * 0.16
Growth between grades 10 and 12Boys and girls combined 0.35 0.03 -0.02 -0.03Boys only 0.40 -0.05 > -0.13 * -0.09Girls only 0.31 0.10 0.09 0.02Difference between boys and girls -0.15 * < 0.22 * > 0.11
TABLE READS: In 1991, Grade 7 mathematics scores averaged 0.55 SDU less for blacks than whites (-0.01); the black-white gap was similar forboys and girls. In 1993, Grade 9 mathematics scores averaged 0.76 SDU less for blacks than whites (0.28); the black-white gap was similar forboys and girls. For children with similar Grade 7 scores, Grade 9 scores averaged 0.31 SDU less for blacks than whites, a 59 percent smaller gapthan for children as a whole.
* = Difference is statistically significant at p <= .05.
+ = Multiple factors include mathematics achievement two grades earlier, parental socioeconomic status, and Census region.
—- = Not applicable because of absence of information on mathematics or reading achievement prior to the initial grade for each sample.
NOTE: Difference between group X and group Y refers to the mean for group X minus the mean for group Y. Standard errors have beenadjusted for complex survey designs. “8th Grade SDUs” = eighth-grade standard deviation units; 8th grade score is normalized to have mean ofzero and standard deviation of 1.00. Numbers may not sum to totals due to rounding. Multiple imputation used to account for missing data.
SOURCE: U.S. Department of Education, Chapter 1 Prospects Study, and National Educational Longitudinal Study of 1988 (NELS:88).
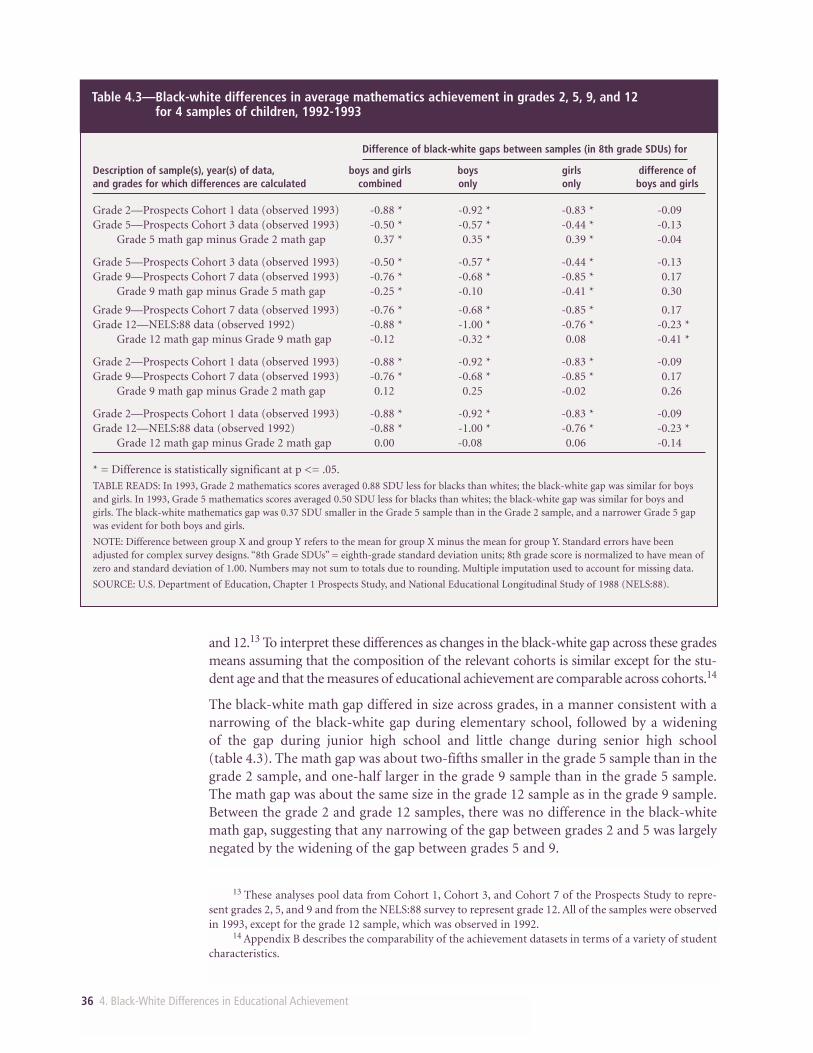
36 4. Black-White Differences in Educational Achievement
13 These analyses pool data from Cohort 1, Cohort 3, and Cohort 7 of the Prospects Study to repre-sent grades 2, 5, and 9 and from the NELS:88 survey to represent grade 12. All of the samples were observedin 1993, except for the grade 12 sample, which was observed in 1992.
14 Appendix B describes the comparability of the achievement datasets in terms of a variety of studentcharacteristics.
Table 4.3—Black-white differences in average mathematics achievement in grades 2, 5, 9, and 12 for 4 samples of children, 1992-1993
Difference of black-white gaps between samples (in 8th grade SDUs) for
Description of sample(s), year(s) of data, boys and girls boys girls difference ofand grades for which differences are calculated combined only only boys and girls
Grade 2—Prospects Cohort 1 data (observed 1993) -0.88 * -0.92 * -0.83 * -0.09 Grade 5—Prospects Cohort 3 data (observed 1993) -0.50 * -0.57 * -0.44 * -0.13
Grade 5 math gap minus Grade 2 math gap 0.37 * 0.35 * 0.39 * -0.04
Grade 5—Prospects Cohort 3 data (observed 1993) -0.50 * -0.57 * -0.44 * -0.13 Grade 9—Prospects Cohort 7 data (observed 1993) -0.76 * -0.68 * -0.85 * 0.17
Grade 9 math gap minus Grade 5 math gap -0.25 * -0.10 -0.41 * 0.30
Grade 9—Prospects Cohort 7 data (observed 1993) -0.76 * -0.68 * -0.85 * 0.17 Grade 12—NELS:88 data (observed 1992) -0.88 * -1.00 * -0.76 * -0.23 *
Grade 12 math gap minus Grade 9 math gap -0.12 -0.32 * 0.08 -0.41 *
Grade 2—Prospects Cohort 1 data (observed 1993) -0.88 * -0.92 * -0.83 * -0.09 Grade 9—Prospects Cohort 7 data (observed 1993) -0.76 * -0.68 * -0.85 * 0.17
Grade 9 math gap minus Grade 2 math gap 0.12 0.25 -0.02 0.26
Grade 2—Prospects Cohort 1 data (observed 1993) -0.88 * -0.92 * -0.83 * -0.09 Grade 12—NELS:88 data (observed 1992) -0.88 * -1.00 * -0.76 * -0.23 *
Grade 12 math gap minus Grade 2 math gap 0.00 -0.08 0.06 -0.14
* = Difference is statistically significant at p <= .05.
TABLE READS: In 1993, Grade 2 mathematics scores averaged 0.88 SDU less for blacks than whites; the black-white gap was similar for boysand girls. In 1993, Grade 5 mathematics scores averaged 0.50 SDU less for blacks than whites; the black-white gap was similar for boys andgirls. The black-white mathematics gap was 0.37 SDU smaller in the Grade 5 sample than in the Grade 2 sample, and a narrower Grade 5 gapwas evident for both boys and girls.
NOTE: Difference between group X and group Y refers to the mean for group X minus the mean for group Y. Standard errors have beenadjusted for complex survey designs. “8th Grade SDUs” = eighth-grade standard deviation units; 8th grade score is normalized to have mean ofzero and standard deviation of 1.00. Numbers may not sum to totals due to rounding. Multiple imputation used to account for missing data.
SOURCE: U.S. Department of Education, Chapter 1 Prospects Study, and National Educational Longitudinal Study of 1988 (NELS:88).
and 12.13 To interpret these differences as changes in the black-white gap across these gradesmeans assuming that the composition of the relevant cohorts is similar except for the stu-dent age and that the measures of educational achievement are comparable across cohorts.14
The black-white math gap differed in size across grades, in a manner consistent with anarrowing of the black-white gap during elementary school, followed by a widening of the gap during junior high school and little change during senior high school (table 4.3). The math gap was about two-fifths smaller in the grade 5 sample than in thegrade 2 sample, and one-half larger in the grade 9 sample than in the grade 5 sample.The math gap was about the same size in the grade 12 sample as in the grade 9 sample.Between the grade 2 and grade 12 samples, there was no difference in the black-whitemath gap, suggesting that any narrowing of the gap between grades 2 and 5 was largelynegated by the widening of the gap between grades 5 and 9.
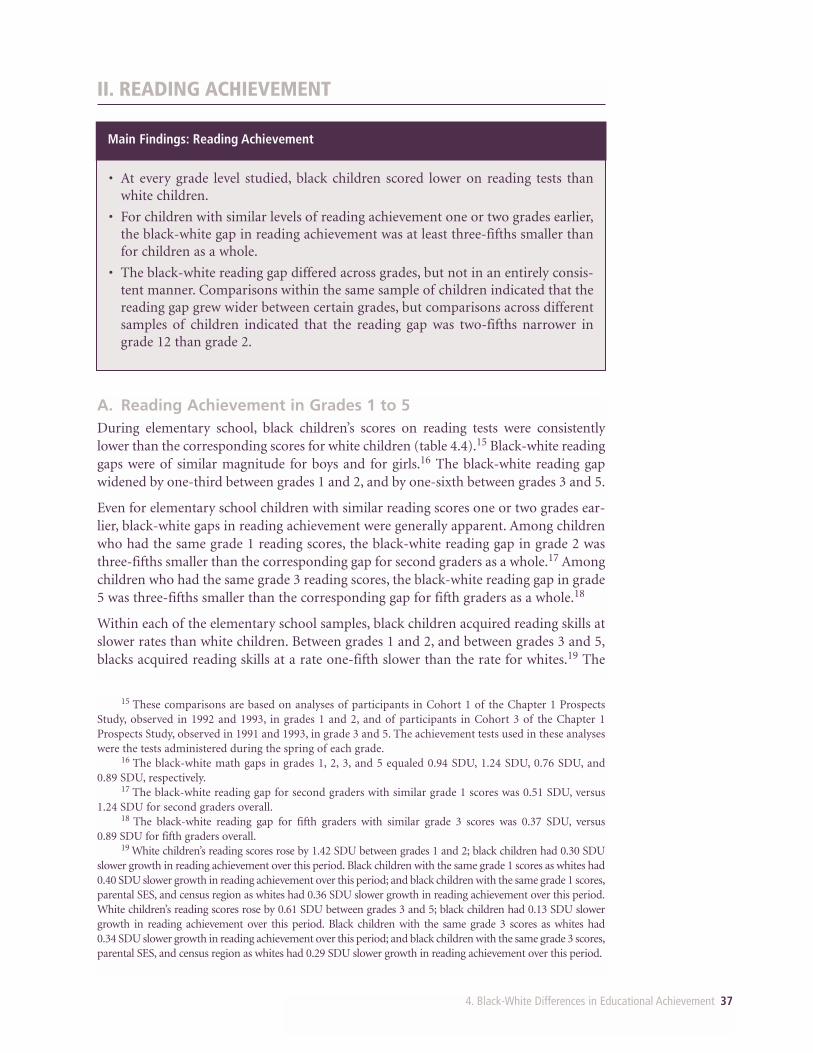
4. Black-White Differences in Educational Achievement 37
II. READING ACHIEVEMENT
15 These comparisons are based on analyses of participants in Cohort 1 of the Chapter 1 ProspectsStudy, observed in 1992 and 1993, in grades 1 and 2, and of participants in Cohort 3 of the Chapter 1Prospects Study, observed in 1991 and 1993, in grade 3 and 5. The achievement tests used in these analyseswere the tests administered during the spring of each grade.
16 The black-white math gaps in grades 1, 2, 3, and 5 equaled 0.94 SDU, 1.24 SDU, 0.76 SDU, and 0.89 SDU, respectively.
17 The black-white reading gap for second graders with similar grade 1 scores was 0.51 SDU, versus1.24 SDU for second graders overall.
18 The black-white reading gap for fifth graders with similar grade 3 scores was 0.37 SDU, versus 0.89 SDU for fifth graders overall.
19 White children’s reading scores rose by 1.42 SDU between grades 1 and 2; black children had 0.30 SDUslower growth in reading achievement over this period. Black children with the same grade 1 scores as whites had0.40 SDU slower growth in reading achievement over this period; and black children with the same grade 1 scores,parental SES, and census region as whites had 0.36 SDU slower growth in reading achievement over this period.White children’s reading scores rose by 0.61 SDU between grades 3 and 5; black children had 0.13 SDU slowergrowth in reading achievement over this period. Black children with the same grade 3 scores as whites had 0.34 SDU slower growth in reading achievement over this period; and black children with the same grade 3 scores,parental SES, and census region as whites had 0.29 SDU slower growth in reading achievement over this period.
• At every grade level studied, black children scored lower on reading tests thanwhite children.
• For children with similar levels of reading achievement one or two grades earlier,the black-white gap in reading achievement was at least three-fifths smaller thanfor children as a whole.
• The black-white reading gap differed across grades, but not in an entirely consis-tent manner. Comparisons within the same sample of children indicated that thereading gap grew wider between certain grades, but comparisons across differentsamples of children indicated that the reading gap was two-fifths narrower ingrade 12 than grade 2.
Main Findings: Reading Achievement
A. Reading Achievement in Grades 1 to 5During elementary school, black children’s scores on reading tests were consistentlylower than the corresponding scores for white children (table 4.4).15 Black-white readinggaps were of similar magnitude for boys and for girls.16 The black-white reading gapwidened by one-third between grades 1 and 2, and by one-sixth between grades 3 and 5.
Even for elementary school children with similar reading scores one or two grades ear-lier, black-white gaps in reading achievement were generally apparent. Among childrenwho had the same grade 1 reading scores, the black-white reading gap in grade 2 wasthree-fifths smaller than the corresponding gap for second graders as a whole.17 Amongchildren who had the same grade 3 reading scores, the black-white reading gap in grade5 was three-fifths smaller than the corresponding gap for fifth graders as a whole.18
Within each of the elementary school samples, black children acquired reading skills atslower rates than white children. Between grades 1 and 2, and between grades 3 and 5,blacks acquired reading skills at a rate one-fifth slower than the rate for whites.19 The
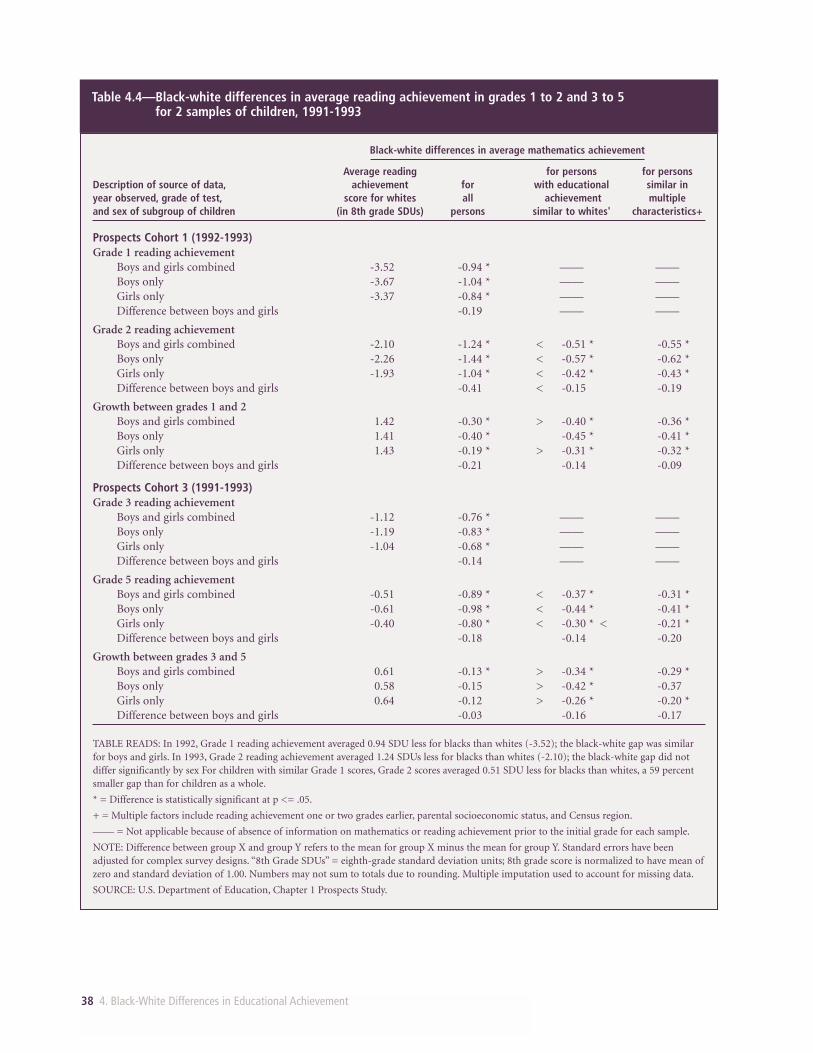
38 4. Black-White Differences in Educational Achievement
Table 4.4—Black-white differences in average reading achievement in grades 1 to 2 and 3 to 5 for 2 samples of children, 1991-1993
Black-white differences in average mathematics achievement
Average reading for persons for personsDescription of source of data, achievement for with educational similar in year observed, grade of test, score for whites all achievement multipleand sex of subgroup of children (in 8th grade SDUs) persons similar to whites' characteristics+
Prospects Cohort 1 (1992-1993)Grade 1 reading achievement
Boys and girls combined -3.52 -0.94 * —— ——Boys only -3.67 -1.04 * —— ——Girls only -3.37 -0.84 * —— ——Difference between boys and girls -0.19 —— ——
Grade 2 reading achievementBoys and girls combined -2.10 -1.24 * < -0.51 * -0.55 *Boys only -2.26 -1.44 * < -0.57 * -0.62 *Girls only -1.93 -1.04 * < -0.42 * -0.43 *Difference between boys and girls -0.41 < -0.15 -0.19
Growth between grades 1 and 2Boys and girls combined 1.42 -0.30 * > -0.40 * -0.36 *Boys only 1.41 -0.40 * -0.45 * -0.41 *Girls only 1.43 -0.19 * > -0.31 * -0.32 *Difference between boys and girls -0.21 -0.14 -0.09
Prospects Cohort 3 (1991-1993)Grade 3 reading achievement
Boys and girls combined -1.12 -0.76 * —— ——Boys only -1.19 -0.83 * —— ——Girls only -1.04 -0.68 * —— ——Difference between boys and girls -0.14 —— ——
Grade 5 reading achievementBoys and girls combined -0.51 -0.89 * < -0.37 * -0.31 *Boys only -0.61 -0.98 * < -0.44 * -0.41 *Girls only -0.40 -0.80 * < -0.30 * < -0.21 *Difference between boys and girls -0.18 -0.14 -0.20
Growth between grades 3 and 5Boys and girls combined 0.61 -0.13 * > -0.34 * -0.29 *Boys only 0.58 -0.15 > -0.42 * -0.37Girls only 0.64 -0.12 > -0.26 * -0.20 *Difference between boys and girls -0.03 -0.16 -0.17
TABLE READS: In 1992, Grade 1 reading achievement averaged 0.94 SDU less for blacks than whites (-3.52); the black-white gap was similarfor boys and girls. In 1993, Grade 2 reading achievement averaged 1.24 SDUs less for blacks than whites (-2.10); the black-white gap did notdiffer significantly by sex For children with similar Grade 1 scores, Grade 2 scores averaged 0.51 SDU less for blacks than whites, a 59 percentsmaller gap than for children as a whole.
* = Difference is statistically significant at p <= .05.
+ = Multiple factors include reading achievement one or two grades earlier, parental socioeconomic status, and Census region.
—— = Not applicable because of absence of information on mathematics or reading achievement prior to the initial grade for each sample.
NOTE: Difference between group X and group Y refers to the mean for group X minus the mean for group Y. Standard errors have beenadjusted for complex survey designs. “8th Grade SDUs” = eighth-grade standard deviation units; 8th grade score is normalized to have mean ofzero and standard deviation of 1.00. Numbers may not sum to totals due to rounding. Multiple imputation used to account for missing data.
SOURCE: U.S. Department of Education, Chapter 1 Prospects Study.

4. Black-White Differences in Educational Achievement 39
black-white gap in reading achievement growth was larger for students with similarprior reading scores than for students as a whole. This finding indicates that rates ofreading achievement growth were somewhat higher for blacks as a whole than for blacksimilar to whites in terms of their prior reading achievement.20
B. Reading Achievement in Grades 7 to 12In junior and senior high school, as in elementary school, the average reading scores ofblack students lagged behind the average reading scores of white students overall (table4.5).21 During high school, black-white reading gaps were of similar size for both boysand girls.22 The black-white reading gap remained about the same size between grades7 and 9, and grades 10 and 12.
Even for high school students who had similar reading scores two grades earlier, black-white gaps in reading achievement were generally apparent. Among children with the samereading scores in grade 7, the black-white reading gap in grade 9 was three-fifths smallerthan the corresponding gap for ninth graders as a whole.23 Among students who had thesame reading scores in grade 10, the black-white reading gap in grade 12 reading scores wasthree-quarters smaller than the corresponding gap for twelfth graders as a whole.24
During junior and senior high school, the black-white gap in reading achievementgrowth was larger for students with similar prior reading scores than for students as awhole. This finding indicates that rates of reading achievement growth were somewhathigher for blacks as a whole than for black similar to whites in terms of their prior read-ing achievement.25
C. Reading Achievement in Grades 2 to 12Pooling data from multiple samples of students makes it possible to assess differencesin the black-white gap in reading achievement in samples of students from grades 2, 5,9, and 12.26 These analyses found some evidence that the black-white reading gap wasnarrower in the junior and senior high school samples than in the early elementaryschool sample (table 4.6). Overall, the black-white reading gap was one-third smaller inthe grade 9 sample than in the grade 2 sample, and two-fifths smaller in the grade 12
20 This finding is consistent with the phenomenon of “regression to the mean” in the case of the read-ing scores of black elementary school students.
21 These comparisons are based on analyses of participants in Cohort 7 of the Chapter 1 ProspectsStudy, observed in 1991 and 1993, in grades 7 and 9, and of participants in the NELS:88, observed in 1990and 1992, in grade 10 and 12. The achievement tests used in these analyses were the tests administered dur-ing the spring of each grade.
22 The black-white reading gaps in grades 7, 9, 10, and 12 equaled 0.70 SDU, 0.81 SDU, 0.77 SDU, and0.78 SDU, respectively.
23 The black-white reading gap for ninth graders with similar grade 7 scores was 0.34 SDU, versus 0.81 SDU for ninth graders overall.
24 The black-white reading gap for twelfth graders with similar grade 10 scores was 0.18 SDU, versus0.78 SDU for twelfth graders overall.
25 This finding is consistent with the phenomenon of “regression to the mean” in the case of the read-ing scores of black junior and senior high school students.
26 In the analyses that follow, data were pooled from Cohort 1, Cohort 3, and Cohort 7 of the ProspectsStudy to represent grades 2, 5, and 9 and from the NELS:88 survey to represent grade 12. All of the sampleswere observed in 1993, except for the grade 12 sample, which was observed in 1992. The same qualifica-tions apply for these analyses as for the analyses of mathematics achievement in grades 2 , 5, 9, and 12. Seeappendix B for a discussion of the comparability of the different achievement datasets.
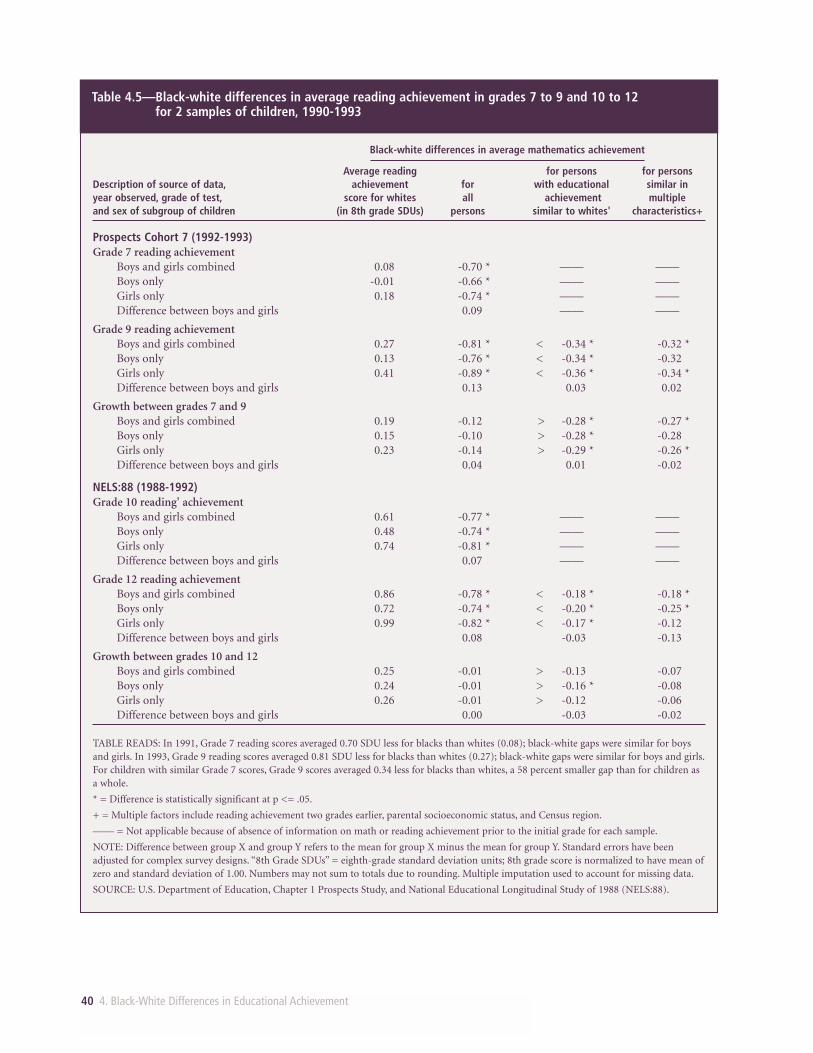
40 4. Black-White Differences in Educational Achievement
Table 4.5—Black-white differences in average reading achievement in grades 7 to 9 and 10 to 12 for 2 samples of children, 1990-1993
Black-white differences in average mathematics achievement
Average reading for persons for personsDescription of source of data, achievement for with educational similar in year observed, grade of test, score for whites all achievement multipleand sex of subgroup of children (in 8th grade SDUs) persons similar to whites' characteristics+
Prospects Cohort 7 (1992-1993)Grade 7 reading achievement
Boys and girls combined 0.08 -0.70 * —— ——Boys only -0.01 -0.66 * —— ——Girls only 0.18 -0.74 * —— ——Difference between boys and girls 0.09 —— ——
Grade 9 reading achievementBoys and girls combined 0.27 -0.81 * < -0.34 * -0.32 *Boys only 0.13 -0.76 * < -0.34 * -0.32Girls only 0.41 -0.89 * < -0.36 * -0.34 *Difference between boys and girls 0.13 0.03 0.02
Growth between grades 7 and 9Boys and girls combined 0.19 -0.12 > -0.28 * -0.27 *Boys only 0.15 -0.10 > -0.28 * -0.28Girls only 0.23 -0.14 > -0.29 * -0.26 *Difference between boys and girls 0.04 0.01 -0.02
NELS:88 (1988-1992)Grade 10 reading' achievement
Boys and girls combined 0.61 -0.77 * —— ——Boys only 0.48 -0.74 * —— ——Girls only 0.74 -0.81 * —— ——Difference between boys and girls 0.07 —— ——
Grade 12 reading achievementBoys and girls combined 0.86 -0.78 * < -0.18 * -0.18 *Boys only 0.72 -0.74 * < -0.20 * -0.25 *Girls only 0.99 -0.82 * < -0.17 * -0.12Difference between boys and girls 0.08 -0.03 -0.13
Growth between grades 10 and 12Boys and girls combined 0.25 -0.01 > -0.13 -0.07Boys only 0.24 -0.01 > -0.16 * -0.08Girls only 0.26 -0.01 > -0.12 -0.06Difference between boys and girls 0.00 -0.03 -0.02
TABLE READS: In 1991, Grade 7 reading scores averaged 0.70 SDU less for blacks than whites (0.08); black-white gaps were similar for boysand girls. In 1993, Grade 9 reading scores averaged 0.81 SDU less for blacks than whites (0.27); black-white gaps were similar for boys and girls.For children with similar Grade 7 scores, Grade 9 scores averaged 0.34 less for blacks than whites, a 58 percent smaller gap than for children asa whole.
* = Difference is statistically significant at p <= .05.
+ = Multiple factors include reading achievement two grades earlier, parental socioeconomic status, and Census region.
—— = Not applicable because of absence of information on math or reading achievement prior to the initial grade for each sample.
NOTE: Difference between group X and group Y refers to the mean for group X minus the mean for group Y. Standard errors have beenadjusted for complex survey designs. “8th Grade SDUs” = eighth-grade standard deviation units; 8th grade score is normalized to have mean ofzero and standard deviation of 1.00. Numbers may not sum to totals due to rounding. Multiple imputation used to account for missing data.
SOURCE: U.S. Department of Education, Chapter 1 Prospects Study, and National Educational Longitudinal Study of 1988 (NELS:88).
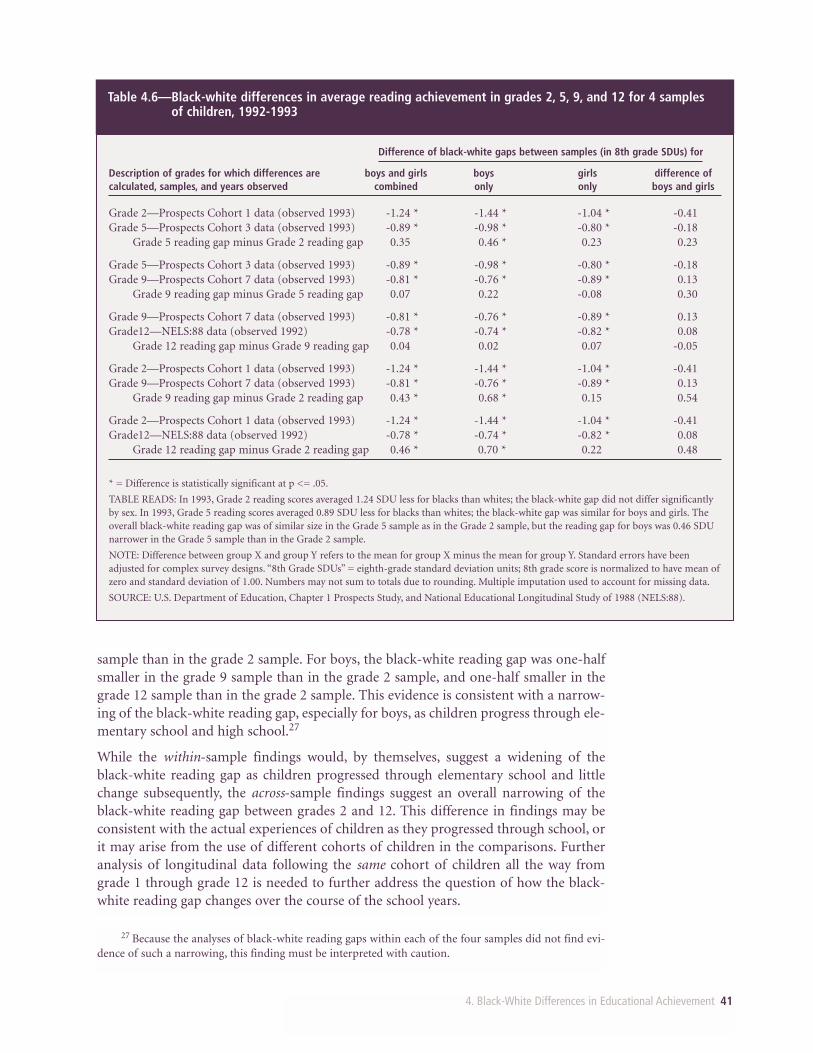
4. Black-White Differences in Educational Achievement 41
sample than in the grade 2 sample. For boys, the black-white reading gap was one-halfsmaller in the grade 9 sample than in the grade 2 sample, and one-half smaller in thegrade 12 sample than in the grade 2 sample. This evidence is consistent with a narrow-ing of the black-white reading gap, especially for boys, as children progress through ele-mentary school and high school.27
While the within-sample findings would, by themselves, suggest a widening of theblack-white reading gap as children progressed through elementary school and littlechange subsequently, the across-sample findings suggest an overall narrowing of theblack-white reading gap between grades 2 and 12. This difference in findings may beconsistent with the actual experiences of children as they progressed through school, orit may arise from the use of different cohorts of children in the comparisons. Furtheranalysis of longitudinal data following the same cohort of children all the way fromgrade 1 through grade 12 is needed to further address the question of how the black-white reading gap changes over the course of the school years.
27 Because the analyses of black-white reading gaps within each of the four samples did not find evi-dence of such a narrowing, this finding must be interpreted with caution.
Table 4.6—Black-white differences in average reading achievement in grades 2, 5, 9, and 12 for 4 samples of children, 1992-1993
Difference of black-white gaps between samples (in 8th grade SDUs) for
Description of grades for which differences are boys and girls boys girls difference ofcalculated, samples, and years observed combined only only boys and girls
Grade 2—Prospects Cohort 1 data (observed 1993) -1.24 * -1.44 * -1.04 * -0.41 Grade 5—Prospects Cohort 3 data (observed 1993) -0.89 * -0.98 * -0.80 * -0.18
Grade 5 reading gap minus Grade 2 reading gap 0.35 0.46 * 0.23 0.23
Grade 5—Prospects Cohort 3 data (observed 1993) -0.89 * -0.98 * -0.80 * -0.18 Grade 9—Prospects Cohort 7 data (observed 1993) -0.81 * -0.76 * -0.89 * 0.13
Grade 9 reading gap minus Grade 5 reading gap 0.07 0.22 -0.08 0.30
Grade 9—Prospects Cohort 7 data (observed 1993) -0.81 * -0.76 * -0.89 * 0.13 Grade12—NELS:88 data (observed 1992) -0.78 * -0.74 * -0.82 * 0.08
Grade 12 reading gap minus Grade 9 reading gap 0.04 0.02 0.07 -0.05
Grade 2—Prospects Cohort 1 data (observed 1993) -1.24 * -1.44 * -1.04 * -0.41 Grade 9—Prospects Cohort 7 data (observed 1993) -0.81 * -0.76 * -0.89 * 0.13
Grade 9 reading gap minus Grade 2 reading gap 0.43 * 0.68 * 0.15 0.54
Grade 2—Prospects Cohort 1 data (observed 1993) -1.24 * -1.44 * -1.04 * -0.41 Grade12—NELS:88 data (observed 1992) -0.78 * -0.74 * -0.82 * 0.08
Grade 12 reading gap minus Grade 2 reading gap 0.46 * 0.70 * 0.22 0.48
* = Difference is statistically significant at p <= .05.
TABLE READS: In 1993, Grade 2 reading scores averaged 1.24 SDU less for blacks than whites; the black-white gap did not differ significantlyby sex. In 1993, Grade 5 reading scores averaged 0.89 SDU less for blacks than whites; the black-white gap was similar for boys and girls. Theoverall black-white reading gap was of similar size in the Grade 5 sample as in the Grade 2 sample, but the reading gap for boys was 0.46 SDUnarrower in the Grade 5 sample than in the Grade 2 sample.
NOTE: Difference between group X and group Y refers to the mean for group X minus the mean for group Y. Standard errors have beenadjusted for complex survey designs. “8th Grade SDUs” = eighth-grade standard deviation units; 8th grade score is normalized to have mean ofzero and standard deviation of 1.00. Numbers may not sum to totals due to rounding. Multiple imputation used to account for missing data.
SOURCE: U.S. Department of Education, Chapter 1 Prospects Study, and National Educational Longitudinal Study of 1988 (NELS:88).
42 4. Black-White Differences in Educational Achievement
III. CONCLUSION
On average, blacks in first grade have lower mathematics and reading scores thanwhites, and blacks in the twelfth grade have lower mathematics and reading scores thanwhites. While some narrowing of black-white achievement differences may occur dur-ing elementary or secondary school, blacks with levels of prior achievement similar towhites still frequently score lower on mathematics and reading tests than whites.
The reasons for black-white disparities in mathematics and reading achievement mayinclude differences in family background not captured by parental SES, as well as dif-ferences in peer group characteristics, school resources, and the manner in which chil-dren are treated in their classrooms. Whatever the causes of black-white gaps in educa-tional achievement, the perpetuation of a large portion of these gaps throughout ele-mentary and secondary school leaves blacks at a relative disadvantage as they preparefor college and/or the labor market. The existence of a smaller black-white reading gapin grade 12 than in grade 2 suggests that these gaps are not immutable, and that appro-priately designed public policies can reduce the educational disparities between blackand white children.
References 43
REFERENCESAltonjii, Joseph G. “The Effects of Family Background and School Characteristics on
Education and Labor Market Outcomes.” Unpublished paper. New York: NationalCenter on Education and Employment, Teachers College, Columbia University,December 1988.
Armor, David J. “Race and Socioeconomic Effects on Academic Achievement.”Unpublished paper. Fairfax, VA: George Mason University, July 1996.
Armor, David J.“Why Is Black Educational Achievement Rising?” The Public Interest, no.108, Summer 1992, pp. 65–80.
Barnard, John, and Donald B. Rubin, “Small Sample Degrees of Freedom with MultipleImputation,” April 9, 1999 (forthcoming in Biometrika).
Bernstein, Jared. Where’s the Payoff? The Gap Between Black Academic Progress andEconomic Gains. Washington, DC: Economic Policy Institute, 1995.
Bound, John, and Richard Freeman. “What Went Wrong? The Erosion of RelativeEarnings and Employment Among Young Black Men in the 1980s.” The QuarterlyJournal of Economics, vol. 107, no. 1, February, 1992, pp. 201–232.
Cameron, Stephen, and James Heckman. “The Dynamics of Educational Attainment for Blacks, Whites and Hispanics.” Unpublished paper. Chicago: University ofChicago, 1992.
Cameron, Stephen, and James Heckman. “The Non-Equivalence of High SchoolEquivalents.” Working Paper No. 3804. National Bureau of Economic ResearchWorking Paper Series. Cambridge, MA: NBER, August 1991.
Clayton, O., et al. “Race Differences in College Attendance in the U.S.: Two CompetingTheories.” Canadian Journal of Education, vol. 15, no. 3, Summer 1990, pp. 245–263.
Clogg, Clifford, Eva Petkova, and Tzuwei Cheng. “Reply to Allison: More on ComparingRegression Coefficients.” In Symposium on Applied Regression, “StatisticalMethods for Comparing Regression Coefficients between Models.” AmericanJournal of Statistics, vol. 100, no. 5, March 1995, pp. 1309–1310.
Coleman, James S., Ernest Q. Campbell, et al. Equality of Educational Opportunity.Washington, DC: U.S. Government Printing Office, 1966.
Currie, Janet, and Duncan Thomas. “Does Head Start Make a Difference?” AmericanEconomic Review, vol. 85, no. 3, June 1995, pp. 341–364.
Ferguson, Ronald. “Racial Patterns in How School and Teacher Quality AffectAchievement and Earnings.” Challenge: A Journal of Research on Black Men, vol. 2,no. 1, May 1991, pp. 3–35.
Fuchs, Victor, and Diane Reklis. “Mathematical Achievement in Eighth Grade: Interstateand Racial Differences.” Working Paper No. 4784. National Bureau of EconomicResearch Working Paper Series. Cambridge, MA: NBER, June 1994.
Grissmer, David W., Sheila Nataraj Kirby, Mark Berends, and Stephanie Williamson.“Student Achievement and the Changing American Family.” Santa Monica, CA:RAND, 1994.
Guthrie, John T., et al. “Minority Reading Achievement: Motivational, Instructional andFamilial Variables for Black and White Males and Females.” Paper presented at AnnualMeeting of the American Educational Research Association, Chicago, April 1991.
Hauser, Robert M., and Min-Hsiung Huang. “Trends in Black-White Test-Score Dif-ferentials.” Institute for Research on Poverty Discussion Paper no. 1110–96. Madison,WI: Institute for Research on Poverty, University of Wisconsin, October 1996.
Hedges, Larry V., and Amy Nowell. “Black-White Test Score Convergence: Can Socioeco-nomic Changes Explain the Trend?” Chapter 3 in The Black-White Test Score Gap, edit-ed by Christopher Jencks and Meredith Phillips. Unpublished manuscript, June 3, 1997.
Johnson, William R., and Derek Neal. “Basic Skills and the Black-White Earnings Gap.”Chapter 10 in The Black-White Test Score Gap, edited by Christopher Jencks andMeredith Phillips. Unpublished manuscript, June 3, 1997.
Juhn, Chinhui. “Decline of Male Labor Market Participation: The Role of DecliningMarket Opportunities.” The Quarterly Journal of Economics, vol. 107, no. 1, February1992, pp. 79–122.
Kane, Thomas J. “College Entry by Blacks Since 1970: The Role of College Costs, FamilyBackground and the Returns to Education.” Unpublished paper. Cambridge, MA:Kennedy School of Government, February 1992.
Koretz, Daniel. Educational Achievement: Explanations and Implications of RecentTrends. Washington, DC: Congressional Budget Office, August 1987.
Maxwell, Nan. “The Effect on Black-White Wages of Differences in the Quantity andQuality of Education.” Industrial and Labor Relations Review, vol. 47, no. 2, January1994, pp. 249–264.
McMillen, Marilyn, Philip Kaufman, Elvie Germino Hausken, and Denise Bradby.Dropout Rates in the United States: 1992. Washington, DC: National Center forEducation Statistics, September 1993.
Myers, David E. “Changes in Achievement Levels and Attendance in PostsecondarySchools: A Technical Note.” Washington, DC: Decision Resources Corporation, 1987.
National Center for Education Statistics. The Condition of Education, 1999 Edition.Washington, DC: NCES, June 1999.
National Center for Education Statistics. The Condition of Education, 1997 Edition.Washington, DC: NCES, June 1997.
National Center for Education Statistics. The Condition of Education, 1996 Edition.Washington, DC: NCES, June 1996.
National Center for Education Statistics. The Condition of Education, 1994 Edition.Washington, DC: NCES, August 1994.
National Center for Education Statistics. Digest of Education Statistics 1997. Washington,DC: NCES, December 1997b.
National Center for Education Statistics. Digest of Education Statistics 1995. Washington,DC: NCES, October 1995a.
National Center for Education Statistics. National Education Longitudinal Study of 1988,Second Follow-Up: Transcript Component Data File User’s Manual. Washington, DC:NCEES, March 1995b.
National Research Council. A Common Destiny: Blacks and American Society.Washington, DC: National Academy Press, 1989.
Neal, Derek A., and William R. Johnson. “The Role of Premarket Factors in Black-WhiteWage Differences.” Journal of Political Economy, vol. 104, no. 5, October 1996,pp. 869–895.
O’Connor, Mary Catherine. “Aspects of Differential Performance of Minorities onStandardized Tests.” In Test Policy and Test Performance, edited by Bernard Gifford.Boston: Kluwer Academic Publishers, 1989.
O’Neill, June. “The Role of Human Capital Earnings Differences Between Black andWhite Men.” Journal of Economic Perspectives, vol. 4, no. 4, Fall 1990, pp. 25–45.
Phillips, Meredith, James Crouse, and John Ralph. “Does the Black-White Test ScoreGap Widen After Children Enter School?” Chapter 6 in The Black-White Test ScoreGap, edited by Christopher Jencks and Meredith Phillips. Unpublished manuscript,June 3, 1997.
44 References
References 45
Reardon, Elaine. Demand and Supply Factors in Black Economic Progress, 1940–90.Dissertation. Chicago, IL: University of Chicago, Harris School of Public Policy, 1993.
Rosenbaum, Paul R., and Donald B. Rubin. “Reducing Bias in Observational StudiesUsing Subclassification on the Propensity Score.” Journal of American StatisticalAssociation, vol. 79, no. 387 (1984), pp. 516-524.
Rubin, Donald B. Multiple Imputation for Nonresponse in Surveys. New York: J. Wileyand Sons, 1987.
Rubin, Donald B. “Multiple Imputation After 18+ Years.” Journal of American StatisticalAssociation, vol. 91 (1996), pp. 473-489.
Rubin, Donald B. “Estimating Causal Effects from Large Data Sets Using PropensityScores.” Annals of Internal Medicine, vol. 127, no. 8 (October 1997), pp. 757-763.
Schafer, Joseph L. Analysis of Incomplete Multivariate Data. London, Chapman and Hall,1997.
Schafer, Joseph L., and Maren K. Olsen. “Multiple Imputation for Multivariate Missing-Data Problems: A Data Analyst’s Perspective.” Pennsylvania State University,March 9, 1998.
Smith, James, and Finis Welch. Closing the Gap: Forty Years of Economic Progress. SantaMonica, CA: RAND, February 1986.
Stata Reference Manual, Release 5, Volume 3, P–Z. College Station, TX: Stata Press, 1997.Steele, Claude M., “Black Students Live Down to Expectations.” The New York Times
(August 31, 1995), p. A25.
Appendix A: Sample Definitions and Treatment of Missing Data 47
APPENDIX A:SAMPLEDEFINITIONS ANDTREATMENT OFMISSING DATATo study black-white differences in educational and economic outcomes, efforts weremade to construct comparable samples using longitudinal survey data. For the study oflabor market outcomes, four samples were defined. These same samples were also usedin the study of educational attainment outcomes, together with two additional samplesused for the analyses described in appendix E. For the study of educational achievementoutcomes, four samples were defined. Each of these samples, and the variables withinthem, are discussed in this appendix.
In these samples, key analysis variables are missing for a large proportion of cases.Excluding these cases from the analysis would greatly reduce the sample size and couldpotentially bias the results.1 Missing data for key variables were imputed using multipleimputation. Section I describes this approach briefly, while subsequent sections providefurther details.
I. MULTIPLE IMPUTATION OF MISSING DATA
The simplest way to deal with missing data is to drop cases with missing values from theanalysis. This approach can lead to two problems; the sample size is greatly reduced,leading to less precise estimates, and the estimates will be biased if the cases with miss-ing data are not a random sample of all cases.
Multiple imputation addresses both of these problems. By substituting imputed valuesfor the missing data, the entire sample may be used in the analysis. Careful modeling ofthe relationships among variables yields imputed values that reflect differences betweencomplete cases and cases with missing values. Multiple imputation has the addedadvantage of dealing with the uncertainty introduced through imputation. Rather thansubstituting a single value for each missing value, several plausible values are chosen.Estimates are produced using each of the different imputed values, and the variabilityamong the estimates is incorporated into the standard errors of the estimates. These cal-culations are described in detail in appendix C, and in Schafer (1997).
1 In fact, after performing multiple imputation to account for missing data, and redoing our analy-ses, we obtained similar results as when we used only complete cases, suggesting that any bias from miss-ing data was small.

48 Appendix A: Sample Definitions and Treatment of Missing Data
Imputed data may be obtained using an algorithm known as “data augmentation”(Tanner and Wong 1987). Data augmentation is an iterative process that alternatesbetween estimating the parameters of the distribution of the data, and simulating ran-dom variables from this distribution which are substituted for the missing data. Thesetwo steps are repeated many times, until the process converges in distribution. At thispoint the values substituted for the missing data are independent draws from the pre-dictive distribution of the missing data, and may be treated as imputed values.
II. DATA USED IN THE ANALYSES OF LABOR MARKET OUTCOMES
A. SamplesFour samples were used to compare the labor market outcomes of black and whiteyoung adults. Two of the samples were defined from school-based surveys: the NationalLongitudinal Study of the High School Class of 1972 (NLS:72), first conducted in 1972,with follow-up surveys in 1973, 1974, 1976, 1979, and 1986; and the High School andBeyond (HSB) survey of high school sophomores, first conducted in 1980, with follow-up surveys in 1982, 1984, 1986, and 1992.
The other two samples were defined from a household-based survey, the NationalLongitudinal Survey of Youth (NLSY), first administered in 1979, with annual follow-up surveys thereafter. The first NLSY sample was constructed to be comparable to theNLS:72 sample of high school seniors; the second NLSY sample was constructed to becomparable to the HSB sample of high school sophomores. Individuals in the NLSYwere identified as being in grade 12 between 1976 and 1982, and in grade 10 between1974 and 1980.2 To distinguish the two NLSY samples, we refer below to the sample ofhigh school seniors as the NLSY senior sample and to the sample of high school soph-omores as the NLSY sophomore sample.3
To allow individuals a considerable length of time to complete their schooling and enterthe labor market, employment and earnings were observed several years after highschool. Labor market outcomes for the two samples of high school seniors were takenfrom follow-up surveys occurring 7 years after grade 12, that is, in 1979 for the NLS:72,and between 1983 and 1989 for the NLSY senior sample.
Analysis samples were restricted to cases with known sex and Census region, and whichwere identified as either non-Hispanic black or non-Hispanic white. The key compari-son in this study, black/white differences in the labor market outcomes, relies on report-ed race, so Hispanics, Asians, Pacific Islanders, and individuals who did not report theirrace were excluded from the sample.4
2 Because NLSY participants were sampled in 1979 on the basis of age, rather than on the basis of grade 10or grade 12 attendance, certain individuals may be missing from the NLSY samples who were present in theNLS:72 or HSB samples. For example, individuals who immigrated to the United States after 1979 and were highschool sophomores in 1980 or high school seniors between 1980 and 1982 would be excluded from the sample,as would individuals who were high school sophomores in 1974-1978 or high school seniors in 1976-1978 whoeither had died before 1979 or were not age 14-21 in 1979. This lack of coverage by the NLSY means that com-parison between the NLSY samples and the NLS:72 and HSB samples should be interpreted with caution.
3 There is considerable overlap between the two NLSY samples; 82 percent of the individuals in theNLSY sophomore sample also appear in the NLSY senior sample.
4 Individuals with unknown race were combined with other races (Hispanic, Asian, or PacificIslanders) for the purposes of multiple imputation.
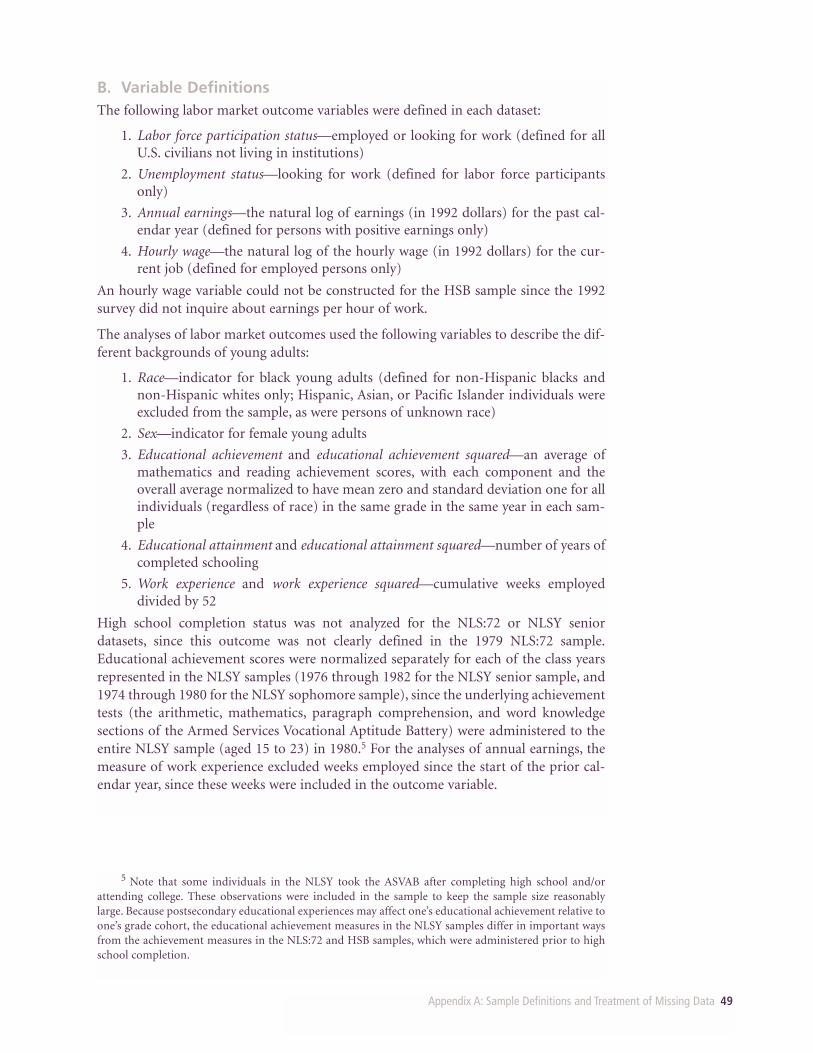
Appendix A: Sample Definitions and Treatment of Missing Data 49
B. Variable DefinitionsThe following labor market outcome variables were defined in each dataset:
1. Labor force participation status—employed or looking for work (defined for allU.S. civilians not living in institutions)
2. Unemployment status—looking for work (defined for labor force participantsonly)
3. Annual earnings—the natural log of earnings (in 1992 dollars) for the past cal-endar year (defined for persons with positive earnings only)
4. Hourly wage—the natural log of the hourly wage (in 1992 dollars) for the cur-rent job (defined for employed persons only)
An hourly wage variable could not be constructed for the HSB sample since the 1992survey did not inquire about earnings per hour of work.
The analyses of labor market outcomes used the following variables to describe the dif-ferent backgrounds of young adults:
1. Race—indicator for black young adults (defined for non-Hispanic blacks andnon-Hispanic whites only; Hispanic, Asian, or Pacific Islander individuals wereexcluded from the sample, as were persons of unknown race)
2. Sex—indicator for female young adults
3. Educational achievement and educational achievement squared—an average ofmathematics and reading achievement scores, with each component and theoverall average normalized to have mean zero and standard deviation one for allindividuals (regardless of race) in the same grade in the same year in each sam-ple
4. Educational attainment and educational attainment squared—number of years ofcompleted schooling
5. Work experience and work experience squared—cumulative weeks employeddivided by 52
High school completion status was not analyzed for the NLS:72 or NLSY seniordatasets, since this outcome was not clearly defined in the 1979 NLS:72 sample.Educational achievement scores were normalized separately for each of the class yearsrepresented in the NLSY samples (1976 through 1982 for the NLSY senior sample, and1974 through 1980 for the NLSY sophomore sample), since the underlying achievementtests (the arithmetic, mathematics, paragraph comprehension, and word knowledgesections of the Armed Services Vocational Aptitude Battery) were administered to theentire NLSY sample (aged 15 to 23) in 1980.5 For the analyses of annual earnings, themeasure of work experience excluded weeks employed since the start of the prior cal-endar year, since these weeks were included in the outcome variable.
5 Note that some individuals in the NLSY took the ASVAB after completing high school and/orattending college. These observations were included in the sample to keep the sample size reasonablylarge. Because postsecondary educational experiences may affect one’s educational achievement relative toone’s grade cohort, the educational achievement measures in the NLSY samples differ in important waysfrom the achievement measures in the NLS:72 and HSB samples, which were administered prior to highschool completion.
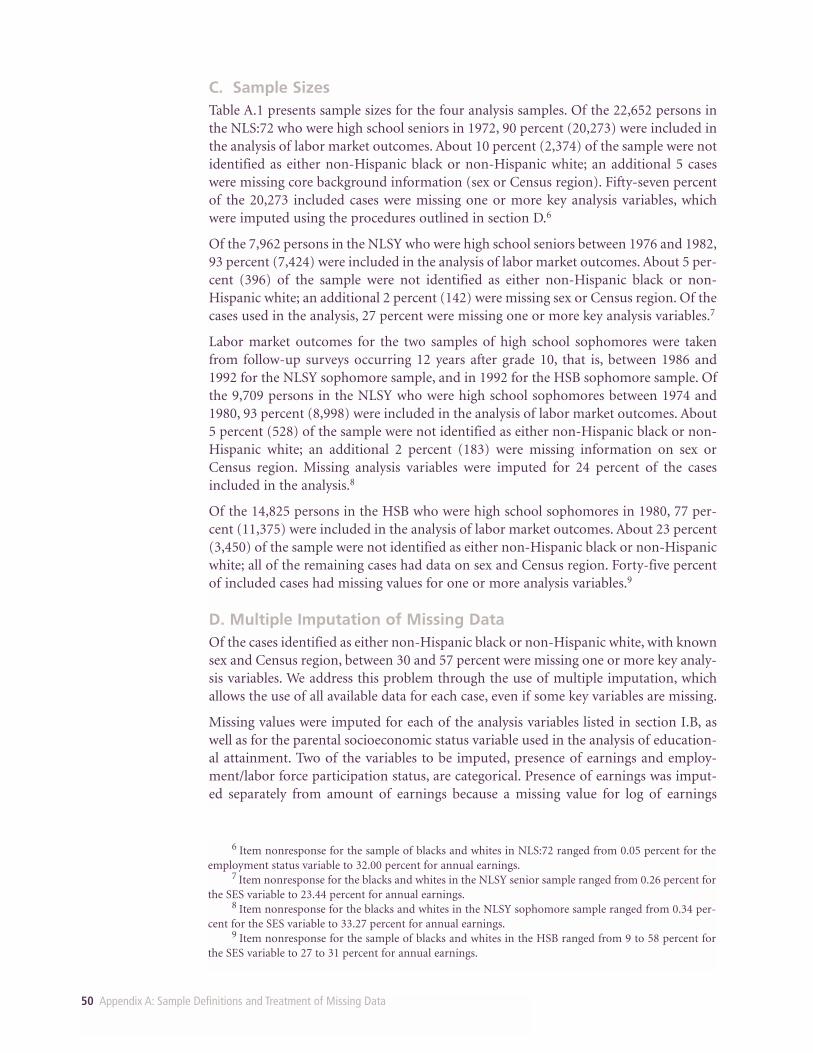
50 Appendix A: Sample Definitions and Treatment of Missing Data
C. Sample SizesTable A.1 presents sample sizes for the four analysis samples. Of the 22,652 persons inthe NLS:72 who were high school seniors in 1972, 90 percent (20,273) were included inthe analysis of labor market outcomes. About 10 percent (2,374) of the sample were notidentified as either non-Hispanic black or non-Hispanic white; an additional 5 caseswere missing core background information (sex or Census region). Fifty-seven percentof the 20,273 included cases were missing one or more key analysis variables, whichwere imputed using the procedures outlined in section D.6
Of the 7,962 persons in the NLSY who were high school seniors between 1976 and 1982,93 percent (7,424) were included in the analysis of labor market outcomes. About 5 per-cent (396) of the sample were not identified as either non-Hispanic black or non-Hispanic white; an additional 2 percent (142) were missing sex or Census region. Of thecases used in the analysis, 27 percent were missing one or more key analysis variables.7
Labor market outcomes for the two samples of high school sophomores were takenfrom follow-up surveys occurring 12 years after grade 10, that is, between 1986 and1992 for the NLSY sophomore sample, and in 1992 for the HSB sophomore sample. Ofthe 9,709 persons in the NLSY who were high school sophomores between 1974 and1980, 93 percent (8,998) were included in the analysis of labor market outcomes. About5 percent (528) of the sample were not identified as either non-Hispanic black or non-Hispanic white; an additional 2 percent (183) were missing information on sex orCensus region. Missing analysis variables were imputed for 24 percent of the casesincluded in the analysis.8
Of the 14,825 persons in the HSB who were high school sophomores in 1980, 77 per-cent (11,375) were included in the analysis of labor market outcomes. About 23 percent(3,450) of the sample were not identified as either non-Hispanic black or non-Hispanicwhite; all of the remaining cases had data on sex and Census region. Forty-five percentof included cases had missing values for one or more analysis variables.9
D. Multiple Imputation of Missing DataOf the cases identified as either non-Hispanic black or non-Hispanic white, with knownsex and Census region, between 30 and 57 percent were missing one or more key analy-sis variables. We address this problem through the use of multiple imputation, whichallows the use of all available data for each case, even if some key variables are missing.
Missing values were imputed for each of the analysis variables listed in section I.B, aswell as for the parental socioeconomic status variable used in the analysis of education-al attainment. Two of the variables to be imputed, presence of earnings and employ-ment/labor force participation status, are categorical. Presence of earnings was imput-ed separately from amount of earnings because a missing value for log of earnings
6 Item nonresponse for the sample of blacks and whites in NLS:72 ranged from 0.05 percent for theemployment status variable to 32.00 percent for annual earnings.
7 Item nonresponse for the blacks and whites in the NLSY senior sample ranged from 0.26 percent forthe SES variable to 23.44 percent for annual earnings.
8 Item nonresponse for the blacks and whites in the NLSY sophomore sample ranged from 0.34 per-cent for the SES variable to 33.27 percent for annual earnings.
9 Item nonresponse for the sample of blacks and whites in the HSB ranged from 9 to 58 percent forthe SES variable to 27 to 31 percent for annual earnings.
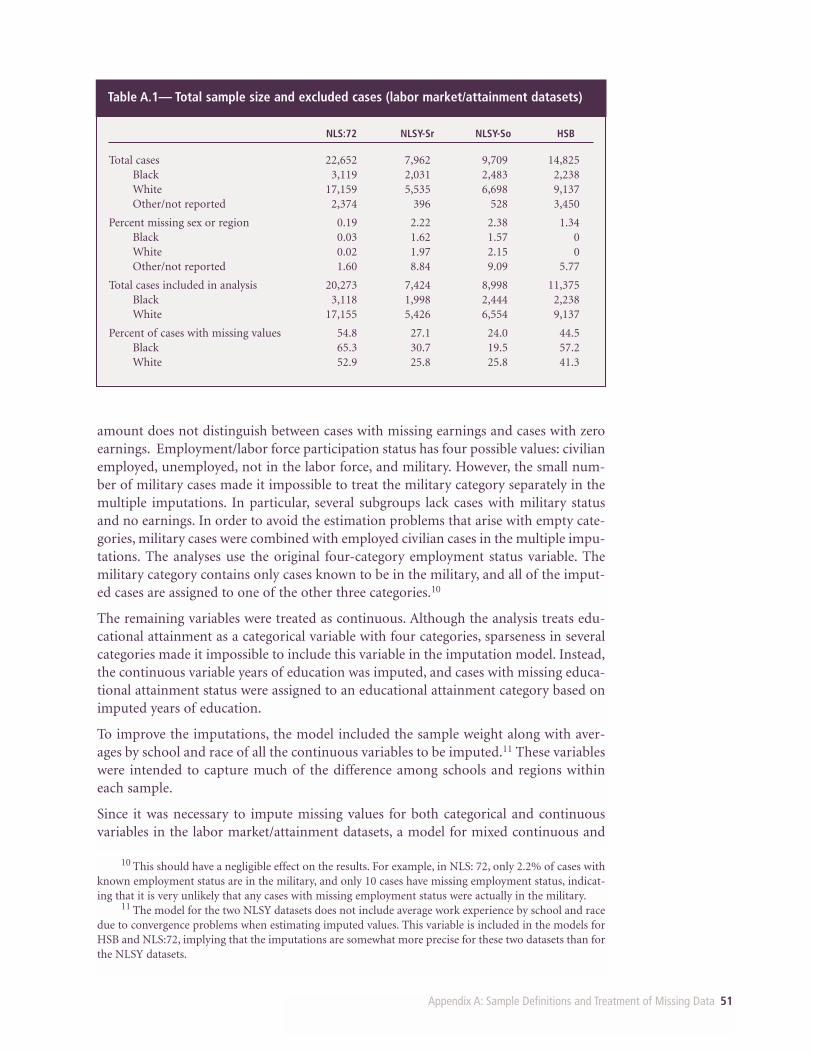
Appendix A: Sample Definitions and Treatment of Missing Data 51
amount does not distinguish between cases with missing earnings and cases with zeroearnings. Employment/labor force participation status has four possible values: civilianemployed, unemployed, not in the labor force, and military. However, the small num-ber of military cases made it impossible to treat the military category separately in themultiple imputations. In particular, several subgroups lack cases with military statusand no earnings. In order to avoid the estimation problems that arise with empty cate-gories, military cases were combined with employed civilian cases in the multiple impu-tations. The analyses use the original four-category employment status variable. Themilitary category contains only cases known to be in the military, and all of the imput-ed cases are assigned to one of the other three categories.10
The remaining variables were treated as continuous. Although the analysis treats edu-cational attainment as a categorical variable with four categories, sparseness in severalcategories made it impossible to include this variable in the imputation model. Instead,the continuous variable years of education was imputed, and cases with missing educa-tional attainment status were assigned to an educational attainment category based onimputed years of education.
To improve the imputations, the model included the sample weight along with aver-ages by school and race of all the continuous variables to be imputed.11 These variableswere intended to capture much of the difference among schools and regions withineach sample.
Since it was necessary to impute missing values for both categorical and continuousvariables in the labor market/attainment datasets, a model for mixed continuous and
10 This should have a negligible effect on the results. For example, in NLS: 72, only 2.2% of cases withknown employment status are in the military, and only 10 cases have missing employment status, indicat-ing that it is very unlikely that any cases with missing employment status were actually in the military.
11 The model for the two NLSY datasets does not include average work experience by school and racedue to convergence problems when estimating imputed values. This variable is included in the models forHSB and NLS:72, implying that the imputations are somewhat more precise for these two datasets than forthe NLSY datasets.
Table A.1— Total sample size and excluded cases (labor market/attainment datasets)
NLS:72 NLSY-Sr NLSY-So HSB
Total cases 22,652 7,962 9,709 14,825Black 3,119 2,031 2,483 2,238White 17,159 5,535 6,698 9,137Other/not reported 2,374 396 528 3,450
Percent missing sex or region 0.19 2.22 2.38 1.34Black 0.03 1.62 1.57 0White 0.02 1.97 2.15 0Other/not reported 1.60 8.84 9.09 5.77
Total cases included in analysis 20,273 7,424 8,998 11,375Black 3,118 1,998 2,444 2,238White 17,155 5,426 6,554 9,137
Percent of cases with missing values 54.8 27.1 24.0 44.5Black 65.3 30.7 19.5 57.2White 52.9 25.8 25.8 41.3
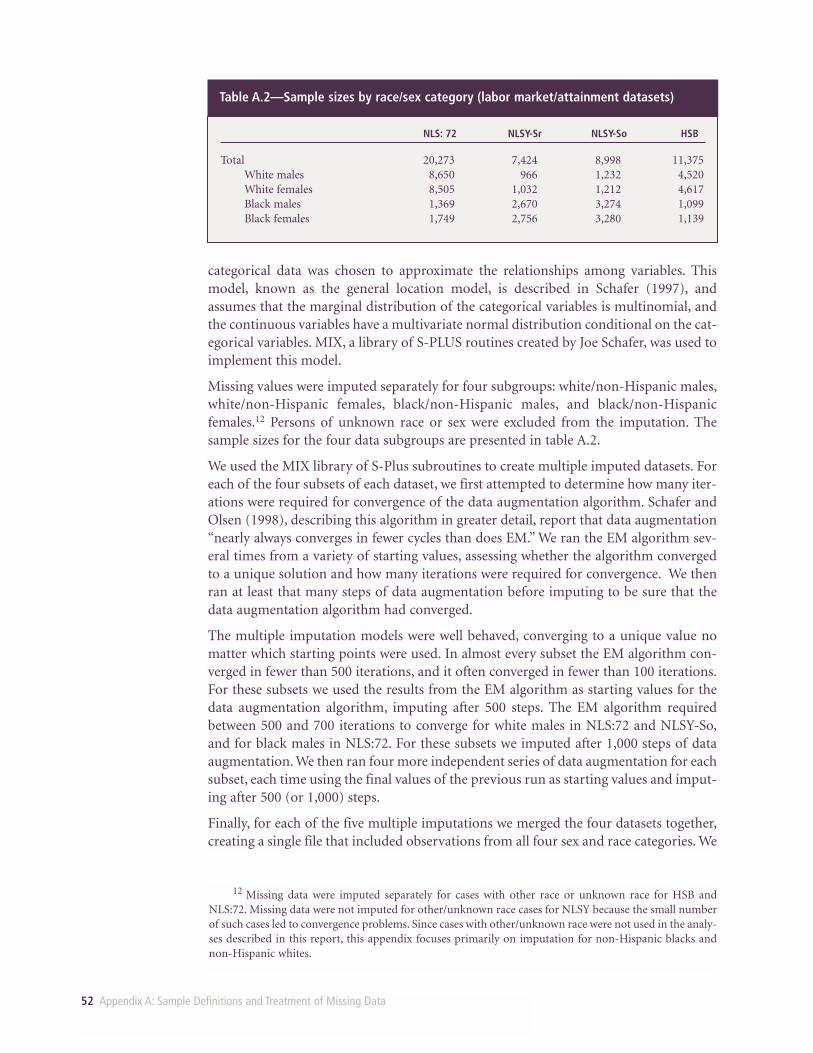
52 Appendix A: Sample Definitions and Treatment of Missing Data
categorical data was chosen to approximate the relationships among variables. Thismodel, known as the general location model, is described in Schafer (1997), andassumes that the marginal distribution of the categorical variables is multinomial, andthe continuous variables have a multivariate normal distribution conditional on the cat-egorical variables. MIX, a library of S-PLUS routines created by Joe Schafer, was used toimplement this model.
Missing values were imputed separately for four subgroups: white/non-Hispanic males,white/non-Hispanic females, black/non-Hispanic males, and black/non-Hispanicfemales.12 Persons of unknown race or sex were excluded from the imputation. Thesample sizes for the four data subgroups are presented in table A.2.
We used the MIX library of S-Plus subroutines to create multiple imputed datasets. Foreach of the four subsets of each dataset, we first attempted to determine how many iter-ations were required for convergence of the data augmentation algorithm. Schafer andOlsen (1998), describing this algorithm in greater detail, report that data augmentation“nearly always converges in fewer cycles than does EM.” We ran the EM algorithm sev-eral times from a variety of starting values, assessing whether the algorithm convergedto a unique solution and how many iterations were required for convergence. We thenran at least that many steps of data augmentation before imputing to be sure that thedata augmentation algorithm had converged.
The multiple imputation models were well behaved, converging to a unique value nomatter which starting points were used. In almost every subset the EM algorithm con-verged in fewer than 500 iterations, and it often converged in fewer than 100 iterations.For these subsets we used the results from the EM algorithm as starting values for thedata augmentation algorithm, imputing after 500 steps. The EM algorithm requiredbetween 500 and 700 iterations to converge for white males in NLS:72 and NLSY-So,and for black males in NLS:72. For these subsets we imputed after 1,000 steps of dataaugmentation. We then ran four more independent series of data augmentation for eachsubset, each time using the final values of the previous run as starting values and imput-ing after 500 (or 1,000) steps.
Finally, for each of the five multiple imputations we merged the four datasets together,creating a single file that included observations from all four sex and race categories. We
12 Missing data were imputed separately for cases with other race or unknown race for HSB andNLS:72. Missing data were not imputed for other/unknown race cases for NLSY because the small numberof such cases led to convergence problems. Since cases with other/unknown race were not used in the analy-ses described in this report, this appendix focuses primarily on imputation for non-Hispanic blacks andnon-Hispanic whites.
Table A.2—Sample sizes by race/sex category (labor market/attainment datasets)
NLS: 72 NLSY-Sr NLSY-So HSB
Total 20,273 7,424 8,998 11,375White males 8,650 966 1,232 4,520White females 8,505 1,032 1,212 4,617Black males 1,369 2,670 3,274 1,099Black females 1,749 2,756 3,280 1,139

Appendix A: Sample Definitions and Treatment of Missing Data 53
merged each imputed dataset onto the original data file and recoded variables that hadbeen standardized to facilitate the imputations.
E. Characteristics of Cases with Missing DataIf there are systematic differences between complete cases and cases with missing data,estimates based on only complete cases may be biased. In particular, if black-white dif-ferences were more (or less) pronounced among complete cases than among cases withmissing data, and estimates of black-white differences were based only on completecases, the results would be misleading. A comparison of complete cases and cases withmissing values reveals several differences, suggesting that an analysis restricted to com-plete cases would be biased.
Tables A.3 through A.7 show summary statistics on the key variables in the analysis ofeducational attainment and labor market outcomes for complete cases and cases withat least some missing variables. We imputed missing data to address the problem ofmissing values, and the tables include the imputed values. Note that, because observa-tions with missing values of some variables often have valid values of other variables, thereported means for observations with missing data include both valid and imputed values.In every instance, the imputation of missing values utilized any valid information forthe observation in question.
For characteristics of black and white young adults, differences between complete casesand cases missing one or more variables tended to be similar across the four datasets.The most striking pattern is that respondents with no missing data are more well-offthan those for whom data had to be imputed. SES, educational achievement, collegeattendance and completion, work experience and earnings are higher for the completecases than for the cases with missing data, for both blacks and whites. The majority ofthese differences are statistically significant.
Several other differences exist between complete cases and cases with missing data. Forexample, the percentage black is higher among cases with missing data, and this differ-ence is statistically significant for three of the four datasets. In NLS:72, the percentagefemale is higher for cases with missing data, for both blacks and whites. However,among black young adults in HSB, the percentage female is higher for complete cases.Some differences in Census region appear as well, although there is no evidence of aconsistent pattern across datasets.
The key concern is whether black-white differences vary according to the presence ofmissing data. Tables A.3 through A7 reveal several characteristics for which this is the case:
• In NLS: 72, blacks are better off relative to whites among cases with missing data,as compared with black-white differences among complete cases. Black-whitedifferences in percentage attending and completing college, earnings, percentagefemale, and percentage in the Midwest Census region were significantly smalleramong cases with missing data. Among cases with missing data, blacks weremore likely than whites to have attended college, participate in the labor force,and have earnings, while the opposite was true for complete cases.
• The pattern is not as clear in the NLSY senior sample. Cases with missing datashow significantly larger black-white differences in socioeconomic status (SES)and percentage with earnings, and significantly smaller black-white differencesin percentage completing college.
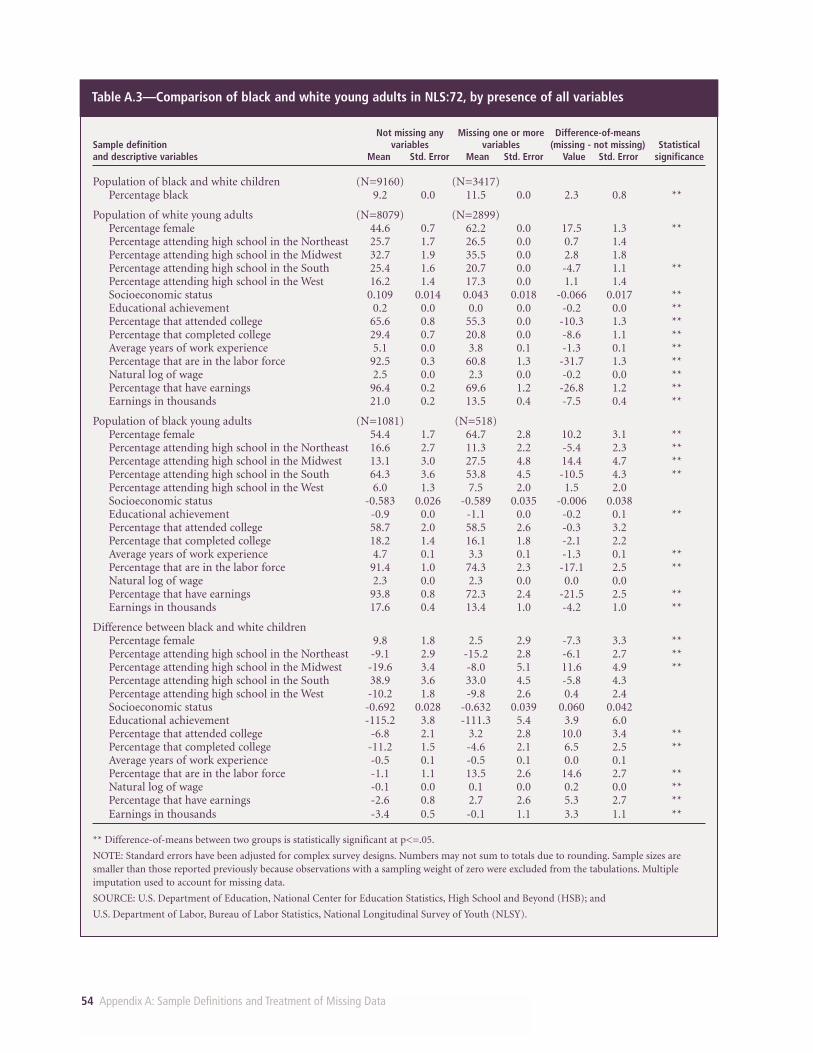
54 Appendix A: Sample Definitions and Treatment of Missing Data
Table A.3—Comparison of black and white young adults in NLS:72, by presence of all variables
Not missing any Missing one or more Difference-of-meansSample definition variables variables (missing - not missing) Statisticaland descriptive variables Mean Std. Error Mean Std. Error Value Std. Error significance
Population of black and white children (N=9160) (N=3417)Percentage black 9.2 0.0 11.5 0.0 2.3 0.8 **
Population of white young adults (N=8079) (N=2899)Percentage female 44.6 0.7 62.2 0.0 17.5 1.3 ** Percentage attending high school in the Northeast 25.7 1.7 26.5 0.0 0.7 1.4Percentage attending high school in the Midwest 32.7 1.9 35.5 0.0 2.8 1.8Percentage attending high school in the South 25.4 1.6 20.7 0.0 -4.7 1.1 ** Percentage attending high school in the West 16.2 1.4 17.3 0.0 1.1 1.4Socioeconomic status 0.109 0.014 0.043 0.018 -0.066 0.017 ** Educational achievement 0.2 0.0 0.0 0.0 -0.2 0.0 ** Percentage that attended college 65.6 0.8 55.3 0.0 -10.3 1.3 ** Percentage that completed college 29.4 0.7 20.8 0.0 -8.6 1.1 ** Average years of work experience 5.1 0.0 3.8 0.1 -1.3 0.1 ** Percentage that are in the labor force 92.5 0.3 60.8 1.3 -31.7 1.3 ** Natural log of wage 2.5 0.0 2.3 0.0 -0.2 0.0 ** Percentage that have earnings 96.4 0.2 69.6 1.2 -26.8 1.2 ** Earnings in thousands 21.0 0.2 13.5 0.4 -7.5 0.4 **
Population of black young adults (N=1081) (N=518)Percentage female 54.4 1.7 64.7 2.8 10.2 3.1 ** Percentage attending high school in the Northeast 16.6 2.7 11.3 2.2 -5.4 2.3 ** Percentage attending high school in the Midwest 13.1 3.0 27.5 4.8 14.4 4.7 ** Percentage attending high school in the South 64.3 3.6 53.8 4.5 -10.5 4.3 ** Percentage attending high school in the West 6.0 1.3 7.5 2.0 1.5 2.0Socioeconomic status -0.583 0.026 -0.589 0.035 -0.006 0.038Educational achievement -0.9 0.0 -1.1 0.0 -0.2 0.1 ** Percentage that attended college 58.7 2.0 58.5 2.6 -0.3 3.2Percentage that completed college 18.2 1.4 16.1 1.8 -2.1 2.2Average years of work experience 4.7 0.1 3.3 0.1 -1.3 0.1 ** Percentage that are in the labor force 91.4 1.0 74.3 2.3 -17.1 2.5 ** Natural log of wage 2.3 0.0 2.3 0.0 0.0 0.0Percentage that have earnings 93.8 0.8 72.3 2.4 -21.5 2.5 ** Earnings in thousands 17.6 0.4 13.4 1.0 -4.2 1.0 **
Difference between black and white childrenPercentage female 9.8 1.8 2.5 2.9 -7.3 3.3 ** Percentage attending high school in the Northeast -9.1 2.9 -15.2 2.8 -6.1 2.7 ** Percentage attending high school in the Midwest -19.6 3.4 -8.0 5.1 11.6 4.9 ** Percentage attending high school in the South 38.9 3.6 33.0 4.5 -5.8 4.3Percentage attending high school in the West -10.2 1.8 -9.8 2.6 0.4 2.4Socioeconomic status -0.692 0.028 -0.632 0.039 0.060 0.042Educational achievement -115.2 3.8 -111.3 5.4 3.9 6.0Percentage that attended college -6.8 2.1 3.2 2.8 10.0 3.4 ** Percentage that completed college -11.2 1.5 -4.6 2.1 6.5 2.5 ** Average years of work experience -0.5 0.1 -0.5 0.1 0.0 0.1Percentage that are in the labor force -1.1 1.1 13.5 2.6 14.6 2.7 ** Natural log of wage -0.1 0.0 0.1 0.0 0.2 0.0 ** Percentage that have earnings -2.6 0.8 2.7 2.6 5.3 2.7 ** Earnings in thousands -3.4 0.5 -0.1 1.1 3.3 1.1 **
** Difference-of-means between two groups is statistically significant at p<=.05.
NOTE: Standard errors have been adjusted for complex survey designs. Numbers may not sum to totals due to rounding. Sample sizes aresmaller than those reported previously because observations with a sampling weight of zero were excluded from the tabulations. Multipleimputation used to account for missing data.
SOURCE: U.S. Department of Education, National Center for Education Statistics, High School and Beyond (HSB); and
U.S. Department of Labor, Bureau of Labor Statistics, National Longitudinal Survey of Youth (NLSY).
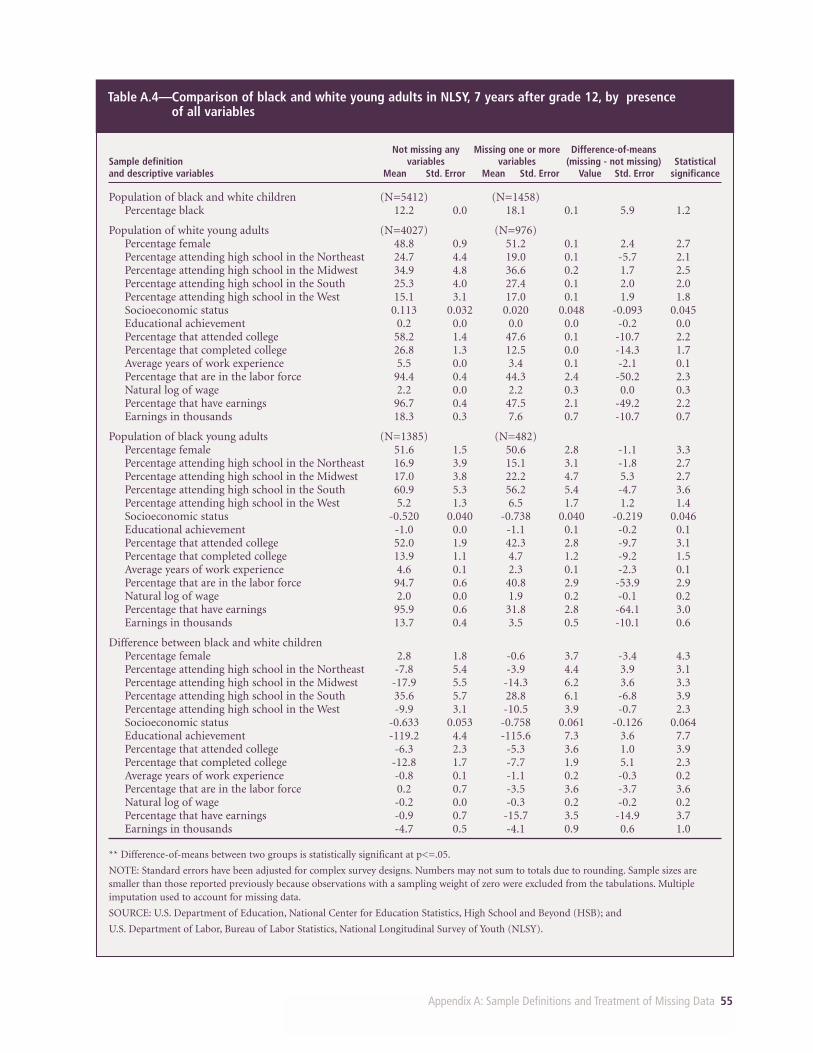
Appendix A: Sample Definitions and Treatment of Missing Data 55
Table A.4—Comparison of black and white young adults in NLSY, 7 years after grade 12, by presence of all variables
Not missing any Missing one or more Difference-of-meansSample definition variables variables (missing - not missing) Statisticaland descriptive variables Mean Std. Error Mean Std. Error Value Std. Error significance
Population of black and white children (N=5412) (N=1458)Percentage black 12.2 0.0 18.1 0.1 5.9 1.2
Population of white young adults (N=4027) (N=976)Percentage female 48.8 0.9 51.2 0.1 2.4 2.7Percentage attending high school in the Northeast 24.7 4.4 19.0 0.1 -5.7 2.1Percentage attending high school in the Midwest 34.9 4.8 36.6 0.2 1.7 2.5Percentage attending high school in the South 25.3 4.0 27.4 0.1 2.0 2.0Percentage attending high school in the West 15.1 3.1 17.0 0.1 1.9 1.8Socioeconomic status 0.113 0.032 0.020 0.048 -0.093 0.045Educational achievement 0.2 0.0 0.0 0.0 -0.2 0.0Percentage that attended college 58.2 1.4 47.6 0.1 -10.7 2.2Percentage that completed college 26.8 1.3 12.5 0.0 -14.3 1.7Average years of work experience 5.5 0.0 3.4 0.1 -2.1 0.1Percentage that are in the labor force 94.4 0.4 44.3 2.4 -50.2 2.3Natural log of wage 2.2 0.0 2.2 0.3 0.0 0.3Percentage that have earnings 96.7 0.4 47.5 2.1 -49.2 2.2Earnings in thousands 18.3 0.3 7.6 0.7 -10.7 0.7
Population of black young adults (N=1385) (N=482)Percentage female 51.6 1.5 50.6 2.8 -1.1 3.3Percentage attending high school in the Northeast 16.9 3.9 15.1 3.1 -1.8 2.7Percentage attending high school in the Midwest 17.0 3.8 22.2 4.7 5.3 2.7Percentage attending high school in the South 60.9 5.3 56.2 5.4 -4.7 3.6Percentage attending high school in the West 5.2 1.3 6.5 1.7 1.2 1.4Socioeconomic status -0.520 0.040 -0.738 0.040 -0.219 0.046Educational achievement -1.0 0.0 -1.1 0.1 -0.2 0.1Percentage that attended college 52.0 1.9 42.3 2.8 -9.7 3.1Percentage that completed college 13.9 1.1 4.7 1.2 -9.2 1.5Average years of work experience 4.6 0.1 2.3 0.1 -2.3 0.1Percentage that are in the labor force 94.7 0.6 40.8 2.9 -53.9 2.9Natural log of wage 2.0 0.0 1.9 0.2 -0.1 0.2Percentage that have earnings 95.9 0.6 31.8 2.8 -64.1 3.0Earnings in thousands 13.7 0.4 3.5 0.5 -10.1 0.6
Difference between black and white childrenPercentage female 2.8 1.8 -0.6 3.7 -3.4 4.3Percentage attending high school in the Northeast -7.8 5.4 -3.9 4.4 3.9 3.1Percentage attending high school in the Midwest -17.9 5.5 -14.3 6.2 3.6 3.3Percentage attending high school in the South 35.6 5.7 28.8 6.1 -6.8 3.9Percentage attending high school in the West -9.9 3.1 -10.5 3.9 -0.7 2.3Socioeconomic status -0.633 0.053 -0.758 0.061 -0.126 0.064Educational achievement -119.2 4.4 -115.6 7.3 3.6 7.7Percentage that attended college -6.3 2.3 -5.3 3.6 1.0 3.9Percentage that completed college -12.8 1.7 -7.7 1.9 5.1 2.3Average years of work experience -0.8 0.1 -1.1 0.2 -0.3 0.2Percentage that are in the labor force 0.2 0.7 -3.5 3.6 -3.7 3.6Natural log of wage -0.2 0.0 -0.3 0.2 -0.2 0.2Percentage that have earnings -0.9 0.7 -15.7 3.5 -14.9 3.7Earnings in thousands -4.7 0.5 -4.1 0.9 0.6 1.0
** Difference-of-means between two groups is statistically significant at p<=.05.
NOTE: Standard errors have been adjusted for complex survey designs. Numbers may not sum to totals due to rounding. Sample sizes aresmaller than those reported previously because observations with a sampling weight of zero were excluded from the tabulations. Multipleimputation used to account for missing data.
SOURCE: U.S. Department of Education, National Center for Education Statistics, High School and Beyond (HSB); and
U.S. Department of Labor, Bureau of Labor Statistics, National Longitudinal Survey of Youth (NLSY).
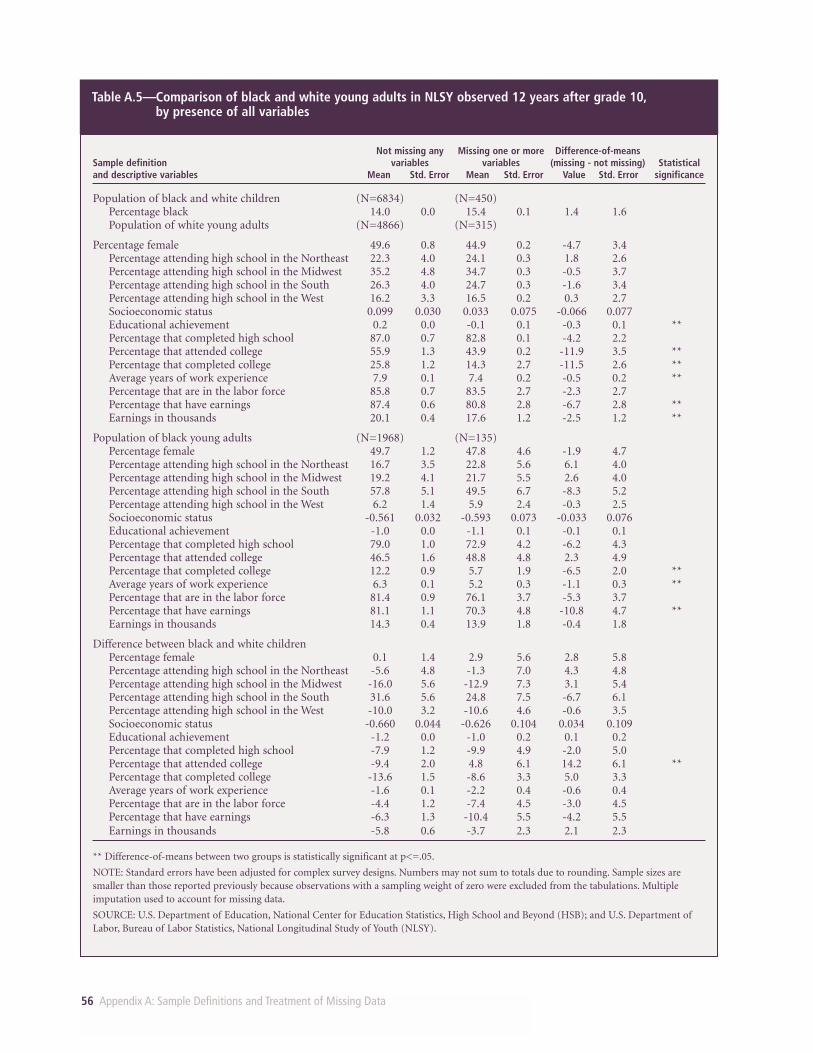
56 Appendix A: Sample Definitions and Treatment of Missing Data
Table A.5—Comparison of black and white young adults in NLSY observed 12 years after grade 10,by presence of all variables
Not missing any Missing one or more Difference-of-meansSample definition variables variables (missing - not missing) Statisticaland descriptive variables Mean Std. Error Mean Std. Error Value Std. Error significance
Population of black and white children (N=6834) (N=450)Percentage black 14.0 0.0 15.4 0.1 1.4 1.6Population of white young adults (N=4866) (N=315)
Percentage female 49.6 0.8 44.9 0.2 -4.7 3.4Percentage attending high school in the Northeast 22.3 4.0 24.1 0.3 1.8 2.6Percentage attending high school in the Midwest 35.2 4.8 34.7 0.3 -0.5 3.7Percentage attending high school in the South 26.3 4.0 24.7 0.3 -1.6 3.4Percentage attending high school in the West 16.2 3.3 16.5 0.2 0.3 2.7Socioeconomic status 0.099 0.030 0.033 0.075 -0.066 0.077Educational achievement 0.2 0.0 -0.1 0.1 -0.3 0.1 ** Percentage that completed high school 87.0 0.7 82.8 0.1 -4.2 2.2Percentage that attended college 55.9 1.3 43.9 0.2 -11.9 3.5 ** Percentage that completed college 25.8 1.2 14.3 2.7 -11.5 2.6 ** Average years of work experience 7.9 0.1 7.4 0.2 -0.5 0.2 ** Percentage that are in the labor force 85.8 0.7 83.5 2.7 -2.3 2.7Percentage that have earnings 87.4 0.6 80.8 2.8 -6.7 2.8 ** Earnings in thousands 20.1 0.4 17.6 1.2 -2.5 1.2 **
Population of black young adults (N=1968) (N=135)Percentage female 49.7 1.2 47.8 4.6 -1.9 4.7Percentage attending high school in the Northeast 16.7 3.5 22.8 5.6 6.1 4.0Percentage attending high school in the Midwest 19.2 4.1 21.7 5.5 2.6 4.0Percentage attending high school in the South 57.8 5.1 49.5 6.7 -8.3 5.2Percentage attending high school in the West 6.2 1.4 5.9 2.4 -0.3 2.5Socioeconomic status -0.561 0.032 -0.593 0.073 -0.033 0.076Educational achievement -1.0 0.0 -1.1 0.1 -0.1 0.1Percentage that completed high school 79.0 1.0 72.9 4.2 -6.2 4.3Percentage that attended college 46.5 1.6 48.8 4.8 2.3 4.9Percentage that completed college 12.2 0.9 5.7 1.9 -6.5 2.0 ** Average years of work experience 6.3 0.1 5.2 0.3 -1.1 0.3 ** Percentage that are in the labor force 81.4 0.9 76.1 3.7 -5.3 3.7Percentage that have earnings 81.1 1.1 70.3 4.8 -10.8 4.7 ** Earnings in thousands 14.3 0.4 13.9 1.8 -0.4 1.8
Difference between black and white childrenPercentage female 0.1 1.4 2.9 5.6 2.8 5.8Percentage attending high school in the Northeast -5.6 4.8 -1.3 7.0 4.3 4.8Percentage attending high school in the Midwest -16.0 5.6 -12.9 7.3 3.1 5.4Percentage attending high school in the South 31.6 5.6 24.8 7.5 -6.7 6.1Percentage attending high school in the West -10.0 3.2 -10.6 4.6 -0.6 3.5Socioeconomic status -0.660 0.044 -0.626 0.104 0.034 0.109Educational achievement -1.2 0.0 -1.0 0.2 0.1 0.2Percentage that completed high school -7.9 1.2 -9.9 4.9 -2.0 5.0Percentage that attended college -9.4 2.0 4.8 6.1 14.2 6.1 ** Percentage that completed college -13.6 1.5 -8.6 3.3 5.0 3.3Average years of work experience -1.6 0.1 -2.2 0.4 -0.6 0.4Percentage that are in the labor force -4.4 1.2 -7.4 4.5 -3.0 4.5Percentage that have earnings -6.3 1.3 -10.4 5.5 -4.2 5.5Earnings in thousands -5.8 0.6 -3.7 2.3 2.1 2.3
** Difference-of-means between two groups is statistically significant at p<=.05.
NOTE: Standard errors have been adjusted for complex survey designs. Numbers may not sum to totals due to rounding. Sample sizes aresmaller than those reported previously because observations with a sampling weight of zero were excluded from the tabulations. Multipleimputation used to account for missing data.
SOURCE: U.S. Department of Education, National Center for Education Statistics, High School and Beyond (HSB); and U.S. Department ofLabor, Bureau of Labor Statistics, National Longitudinal Study of Youth (NLSY).
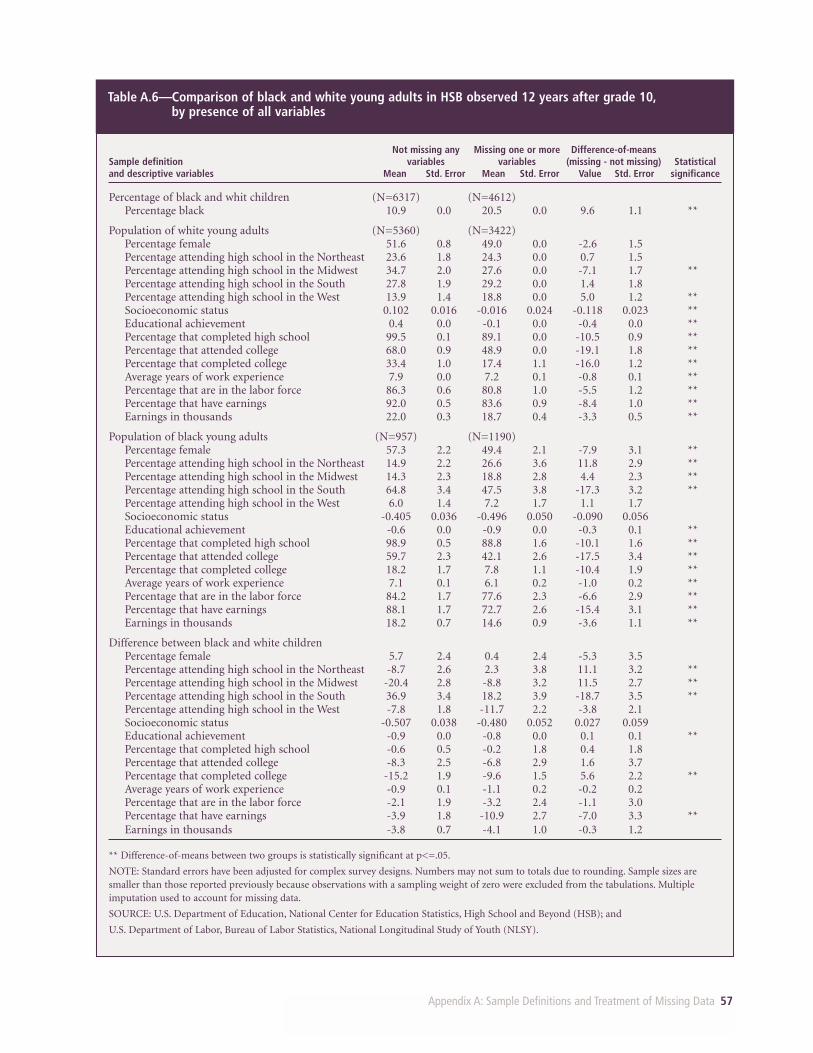
Appendix A: Sample Definitions and Treatment of Missing Data 57
Table A.6—Comparison of black and white young adults in HSB observed 12 years after grade 10,by presence of all variables
Not missing any Missing one or more Difference-of-meansSample definition variables variables (missing - not missing) Statisticaland descriptive variables Mean Std. Error Mean Std. Error Value Std. Error significance
Percentage of black and whit children (N=6317) (N=4612)Percentage black 10.9 0.0 20.5 0.0 9.6 1.1 **
Population of white young adults (N=5360) (N=3422)Percentage female 51.6 0.8 49.0 0.0 -2.6 1.5Percentage attending high school in the Northeast 23.6 1.8 24.3 0.0 0.7 1.5Percentage attending high school in the Midwest 34.7 2.0 27.6 0.0 -7.1 1.7 ** Percentage attending high school in the South 27.8 1.9 29.2 0.0 1.4 1.8Percentage attending high school in the West 13.9 1.4 18.8 0.0 5.0 1.2 ** Socioeconomic status 0.102 0.016 -0.016 0.024 -0.118 0.023 ** Educational achievement 0.4 0.0 -0.1 0.0 -0.4 0.0 ** Percentage that completed high school 99.5 0.1 89.1 0.0 -10.5 0.9 ** Percentage that attended college 68.0 0.9 48.9 0.0 -19.1 1.8 ** Percentage that completed college 33.4 1.0 17.4 1.1 -16.0 1.2 ** Average years of work experience 7.9 0.0 7.2 0.1 -0.8 0.1 ** Percentage that are in the labor force 86.3 0.6 80.8 1.0 -5.5 1.2 ** Percentage that have earnings 92.0 0.5 83.6 0.9 -8.4 1.0 ** Earnings in thousands 22.0 0.3 18.7 0.4 -3.3 0.5 **
Population of black young adults (N=957) (N=1190)Percentage female 57.3 2.2 49.4 2.1 -7.9 3.1 ** Percentage attending high school in the Northeast 14.9 2.2 26.6 3.6 11.8 2.9 ** Percentage attending high school in the Midwest 14.3 2.3 18.8 2.8 4.4 2.3 ** Percentage attending high school in the South 64.8 3.4 47.5 3.8 -17.3 3.2 ** Percentage attending high school in the West 6.0 1.4 7.2 1.7 1.1 1.7Socioeconomic status -0.405 0.036 -0.496 0.050 -0.090 0.056Educational achievement -0.6 0.0 -0.9 0.0 -0.3 0.1 ** Percentage that completed high school 98.9 0.5 88.8 1.6 -10.1 1.6 ** Percentage that attended college 59.7 2.3 42.1 2.6 -17.5 3.4 ** Percentage that completed college 18.2 1.7 7.8 1.1 -10.4 1.9 ** Average years of work experience 7.1 0.1 6.1 0.2 -1.0 0.2 ** Percentage that are in the labor force 84.2 1.7 77.6 2.3 -6.6 2.9 ** Percentage that have earnings 88.1 1.7 72.7 2.6 -15.4 3.1 ** Earnings in thousands 18.2 0.7 14.6 0.9 -3.6 1.1 **
Difference between black and white childrenPercentage female 5.7 2.4 0.4 2.4 -5.3 3.5Percentage attending high school in the Northeast -8.7 2.6 2.3 3.8 11.1 3.2 ** Percentage attending high school in the Midwest -20.4 2.8 -8.8 3.2 11.5 2.7 ** Percentage attending high school in the South 36.9 3.4 18.2 3.9 -18.7 3.5 ** Percentage attending high school in the West -7.8 1.8 -11.7 2.2 -3.8 2.1Socioeconomic status -0.507 0.038 -0.480 0.052 0.027 0.059Educational achievement -0.9 0.0 -0.8 0.0 0.1 0.1 ** Percentage that completed high school -0.6 0.5 -0.2 1.8 0.4 1.8Percentage that attended college -8.3 2.5 -6.8 2.9 1.6 3.7Percentage that completed college -15.2 1.9 -9.6 1.5 5.6 2.2 ** Average years of work experience -0.9 0.1 -1.1 0.2 -0.2 0.2Percentage that are in the labor force -2.1 1.9 -3.2 2.4 -1.1 3.0Percentage that have earnings -3.9 1.8 -10.9 2.7 -7.0 3.3 ** Earnings in thousands -3.8 0.7 -4.1 1.0 -0.3 1.2
** Difference-of-means between two groups is statistically significant at p<=.05.
NOTE: Standard errors have been adjusted for complex survey designs. Numbers may not sum to totals due to rounding. Sample sizes aresmaller than those reported previously because observations with a sampling weight of zero were excluded from the tabulations. Multipleimputation used to account for missing data.
SOURCE: U.S. Department of Education, National Center for Education Statistics, High School and Beyond (HSB); and
U.S. Department of Labor, Bureau of Labor Statistics, National Longitudinal Study of Youth (NLSY).
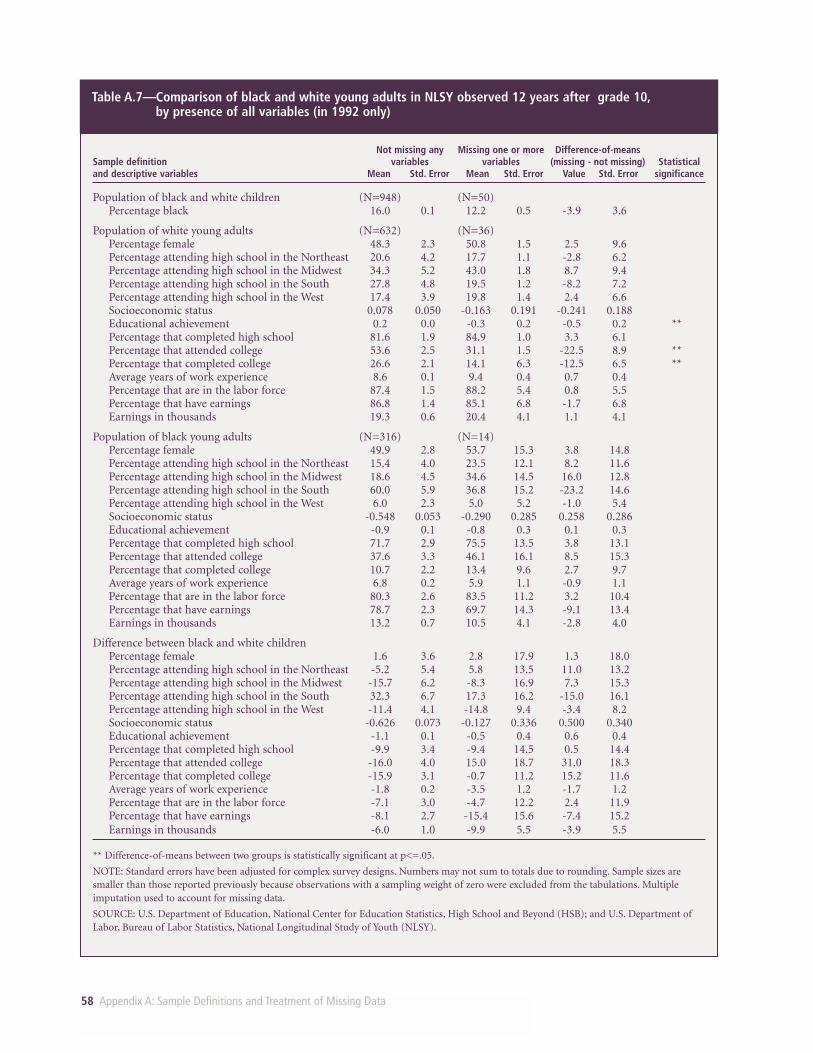
58 Appendix A: Sample Definitions and Treatment of Missing Data
Table A.7—Comparison of black and white young adults in NLSY observed 12 years after grade 10,by presence of all variables (in 1992 only)
Not missing any Missing one or more Difference-of-meansSample definition variables variables (missing - not missing) Statisticaland descriptive variables Mean Std. Error Mean Std. Error Value Std. Error significance
Population of black and white children (N=948) (N=50)Percentage black 16.0 0.1 12.2 0.5 -3.9 3.6
Population of white young adults (N=632) (N=36)Percentage female 48.3 2.3 50.8 1.5 2.5 9.6Percentage attending high school in the Northeast 20.6 4.2 17.7 1.1 -2.8 6.2Percentage attending high school in the Midwest 34.3 5.2 43.0 1.8 8.7 9.4Percentage attending high school in the South 27.8 4.8 19.5 1.2 -8.2 7.2Percentage attending high school in the West 17.4 3.9 19.8 1.4 2.4 6.6Socioeconomic status 0.078 0.050 -0.163 0.191 -0.241 0.188Educational achievement 0.2 0.0 -0.3 0.2 -0.5 0.2 ** Percentage that completed high school 81.6 1.9 84.9 1.0 3.3 6.1Percentage that attended college 53.6 2.5 31.1 1.5 -22.5 8.9 ** Percentage that completed college 26.6 2.1 14.1 6.3 -12.5 6.5 ** Average years of work experience 8.6 0.1 9.4 0.4 0.7 0.4Percentage that are in the labor force 87.4 1.5 88.2 5.4 0.8 5.5Percentage that have earnings 86.8 1.4 85.1 6.8 -1.7 6.8Earnings in thousands 19.3 0.6 20.4 4.1 1.1 4.1
Population of black young adults (N=316) (N=14)Percentage female 49.9 2.8 53.7 15.3 3.8 14.8Percentage attending high school in the Northeast 15.4 4.0 23.5 12.1 8.2 11.6Percentage attending high school in the Midwest 18.6 4.5 34.6 14.5 16.0 12.8Percentage attending high school in the South 60.0 5.9 36.8 15.2 -23.2 14.6Percentage attending high school in the West 6.0 2.3 5.0 5.2 -1.0 5.4Socioeconomic status -0.548 0.053 -0.290 0.285 0.258 0.286Educational achievement -0.9 0.1 -0.8 0.3 0.1 0.3Percentage that completed high school 71.7 2.9 75.5 13.5 3.8 13.1Percentage that attended college 37.6 3.3 46.1 16.1 8.5 15.3Percentage that completed college 10.7 2.2 13.4 9.6 2.7 9.7Average years of work experience 6.8 0.2 5.9 1.1 -0.9 1.1Percentage that are in the labor force 80.3 2.6 83.5 11.2 3.2 10.4Percentage that have earnings 78.7 2.3 69.7 14.3 -9.1 13.4Earnings in thousands 13.2 0.7 10.5 4.1 -2.8 4.0
Difference between black and white childrenPercentage female 1.6 3.6 2.8 17.9 1.3 18.0Percentage attending high school in the Northeast -5.2 5.4 5.8 13.5 11.0 13.2Percentage attending high school in the Midwest -15.7 6.2 -8.3 16.9 7.3 15.3Percentage attending high school in the South 32.3 6.7 17.3 16.2 -15.0 16.1Percentage attending high school in the West -11.4 4.1 -14.8 9.4 -3.4 8.2Socioeconomic status -0.626 0.073 -0.127 0.336 0.500 0.340Educational achievement -1.1 0.1 -0.5 0.4 0.6 0.4Percentage that completed high school -9.9 3.4 -9.4 14.5 0.5 14.4Percentage that attended college -16.0 4.0 15.0 18.7 31.0 18.3Percentage that completed college -15.9 3.1 -0.7 11.2 15.2 11.6Average years of work experience -1.8 0.2 -3.5 1.2 -1.7 1.2Percentage that are in the labor force -7.1 3.0 -4.7 12.2 2.4 11.9Percentage that have earnings -8.1 2.7 -15.4 15.6 -7.4 15.2Earnings in thousands -6.0 1.0 -9.9 5.5 -3.9 5.5
** Difference-of-means between two groups is statistically significant at p<=.05.
NOTE: Standard errors have been adjusted for complex survey designs. Numbers may not sum to totals due to rounding. Sample sizes aresmaller than those reported previously because observations with a sampling weight of zero were excluded from the tabulations. Multipleimputation used to account for missing data.
SOURCE: U.S. Department of Education, National Center for Education Statistics, High School and Beyond (HSB); and U.S. Department ofLabor, Bureau of Labor Statistics, National Longitudinal Study of Youth (NLSY).
Appendix A: Sample Definitions and Treatment of Missing Data 59
• Black-white differences for complete cases in the NLSY sophomore sample aresimilar to black-white differences for cases with missing values. The only signif-icant discrepancy in this sample is that among complete cases, whites were morelikely to complete college than blacks, while the opposite is true for cases withmissing data.
• In HSB, black-white differences tended to be smaller for cases with missing datathan for complete cases for the region, educational achievement, and education-al attainment variables, and larger for the labor market variables.
When comparisons were restricted to only cases from 1992 in the NLSY senior sample(table A.7), differences between complete cases and cases with missing values showed noparticular pattern. This is probably due to the fact that only 50 cases in this subset hadmissing data, so the differences could not be measured precisely. In this subsample,there were no statistically significant differences in black-white gaps between completecases and cases with missing values.
These results suggest that eliminating cases with missing data from the analysis couldbias estimates of black-white differences. Careful imputation of missing values allowsuse of all available observations and should minimize this problem.
III. DATA USED IN THE ANALYSES OF EDUCATIONAL ATTAINMENT OUTCOMES
A. SamplesSix samples were used to compare the educational attainment of black and white youngadults. Two of these samples were constructed for the analyses described in appendix D.First, samples of 2,695 black and white (non-Hispanic) youth (16- to 24-year-olds) and5,421 black and white (non-Hispanic) young adults (25- to 34-year-olds) obtained fromthe 1992 National Adult Literacy Survey (NALS) were used to analyze black-white dif-ferences for both the civilian, noninstitutional population and the population of incar-cerated persons. Next, a sample of 8,306 black and white (non-Hispanic) 28-year-oldswas defined using 1985 to 1992 data from the NLSY to analyze trends in the completionof high school diplomas and equivalents over time, and to include some institutional-ized persons in the sample.
The four remaining samples, the same as those used in the analysis of labor market out-comes, were used in the analysis of black-white differences in educational attainment asa function of black-white differences in educational achievement.
B. Variable DefinitionsThe following educational attainment outcome variables were defined in each sample:
1. High school completion status—indicator for young adults who had obtained ahigh school diploma or equivalent (GED, or General Educational Developmentcertificate)
2. College attendance status—indicator for young adults who had attended at leastsome college (defined for young adults with high school diplomas or GEDs only)
3. College completion status—indicator for young adults who had completed at leastfour years of college or an equivalent bachelor’s degree (defined for college atten-dees only)
60 Appendix A: Sample Definitions and Treatment of Missing Data
Of the various surveys, only the NLSY inquired about the GED completion status of allthe individuals in the sample, including those who subsequently attended college.
The analyses of educational attainment outcomes used the following variables todescribe the different backgrounds of young adults:
1. Race—indicator for black children (defined for non-Hispanic blacks and non-Hispanic whites only; Hispanic, Asian, or Pacific Islander individuals wereexcluded from the sample, as were persons of unknown race)
2. Sex—indicator for girls
3. Census region of high school (Northeast, North Central, South, or West)—definedas of grade 12 for the NLS:72 sample, as of age 14 (and on the basis of the child’sresidence) for the NLSY samples, and as of grade 10 for the HSB sample
4. Parental socioeconomic status (SES) and socioeconomic status squared— a compos-ite variable constructed using any non-missing measures of mother’s education,father’s education, mother’s occupational status (in the NLSY samples only),father’s occupational status, family income, and (in the NLS:72 and HSB samplesonly) the presence of certain household items. For the NLS:72 and HSB samples,the baseline SES measures described by NCES (1997b) were used. For each of theclass years represented in the NLSY samples (1976 through 1982 for the NLSYsenior sample, and 1974 through 1980 for the NLSY sophomore sample), SES wasmeasured as follows. Each non-missing component was normalized to have meanzero and standard deviation one for youth regardless of race. These componentswere then averaged for each youth, and the averages were re-normalized the aver-age to have mean zero and standard deviation one across the entire sample.Education levels were expressed by years of schooling, occupational status by theDuncan index, and family income by the natural log of annual income. SES wasconsidered missing only if all of the components that could be used to constructthe index were missing. These components are assumed to be highly correlatedwith each other, making it possible to compare SES values across observations anddatasets even when specific components may be missing.
5. Educational achievement and educational achievement squared—an average ofmathematics and reading achievement scores, with each component and theoverall average normalized to have mean zero and standard deviation one for allindividuals (regardless of race) in the same grade in the same year in each sample
C. Sample Sizes and Multiple Imputation of Missing DataThe analysis of black-white differences in educational attainment used the same fourdatasets that were used in the analysis of labor market outcomes. Sample sizes for thesedatasets are reported in tables A.1 and A.2 above.
Between 30 and 57 percent of cases have missing values for one or more key analysisvariables. We addressed this problem through multiple imputation. Section I.D abovedescribes the basic approach, and appendix C gives details on the calculation of esti-mates and standard errors using imputed data.
Appendix A: Sample Definitions and Treatment of Missing Data 61
IV. DATA USED IN THE ANALYSES OF EDUCATIONAL ACHIEVEMENT OUTCOMES
A. SamplesFour sources of data were used in the analysis of black-white differences in educationalachievement outcomes. These sources included Cohorts 1, 3, and 7 of the Chapter OneProspects Study, and the National Educational Longitudinal Study of 1988 (NELS:88).
The Prospects Study is a panel study of elementary and junior high school educationthat includes three cohorts distinguished by the grade of students during the base year(grades 1, 3, and 7). Data collection, including mathematics and reading achievementtesting, began in 1991 and 1992 and continued through 1994. When the samples weredefined, 1994 data were unavailable for each cohort, so the Cohort 1 sample onlyincluded data through Grade 2, the Cohort 3 sample only included data through Grade5, and the Cohort 7 sample only included data through Grade 9. For the NELS:88 sam-ple, data were available for grades 8, 10, and 12, in 1988, 1990, and 1992, respectively.
B. Variable DefinitionsThe following educational achievement outcome variables were defined in each sample:
1. Mathematics achievement—mathematics achievement test score, measured ingrade 8 standard deviation units
2. Reading achievement—reading achievement test score, measured in grade 8 stan-dard deviation units
Test scores were converted to grade 8 standard deviation units by subtracting the grade8 mean for all children (regardless of race) from the raw test score, and dividing that dif-ference by the grade 8 standard deviation for all children (regardless of race). Since nograde 8 scores were available for children in the Prospects Cohort 1 and ProspectsCohort 3 samples, means and standard deviations from the Prospects Cohort 7 samplewere used.
The analyses of educational achievement outcomes used the following variables todescribe the different backgrounds of young adults:
1. Race—indicator for black children (defined for non-Hispanic blacks and non-Hispanic whites only; Hispanic, Asian, or Pacific Islander individuals wereexcluded from the sample, as were persons of unknown race)
2. Sex—indicator for girls
3. Census region of school (Northeast, North Central, South, or West)—defined as ofgrades 1, 3, and 7 for the respective Prospects cohorts, and as of grade 8 for theNELS:88 sample
4. Parental socioeconomic status (SES) and socioeconomic status squared—a compos-ite variable constructed using any non-missing measures of mother’s education,father’s education, mother’s occupational status, father’s occupational status, fam-ily income, and (in the NELS:88 sample only) the presence of certain householditems. For the NELS:88, the baseline SES measure described by NCES (1995b)was used. For each of the Prospects samples, SES was measured by normalizingeach non-missing component to have mean zero and standard deviation oneacross the entire sample, averaging these components for each child, and then re-
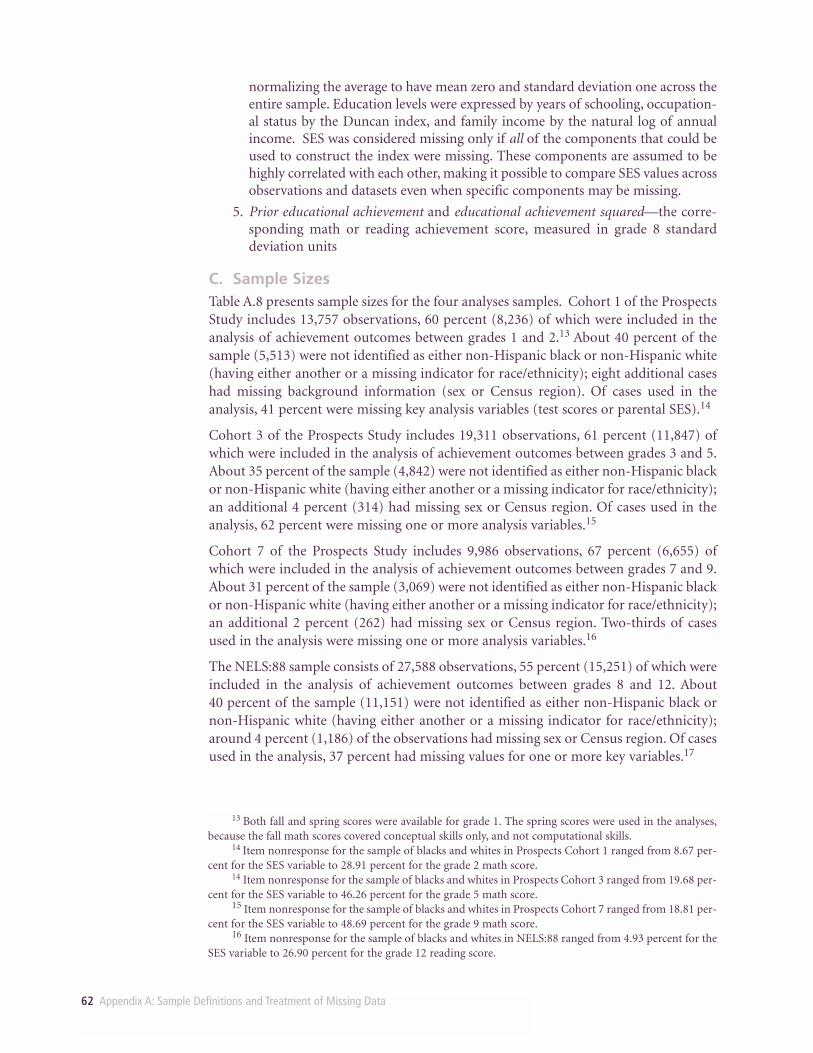
62 Appendix A: Sample Definitions and Treatment of Missing Data
normalizing the average to have mean zero and standard deviation one across theentire sample. Education levels were expressed by years of schooling, occupation-al status by the Duncan index, and family income by the natural log of annualincome. SES was considered missing only if all of the components that could beused to construct the index were missing. These components are assumed to behighly correlated with each other, making it possible to compare SES values acrossobservations and datasets even when specific components may be missing.
5. Prior educational achievement and educational achievement squared—the corre-sponding math or reading achievement score, measured in grade 8 standarddeviation units
C. Sample SizesTable A.8 presents sample sizes for the four analyses samples. Cohort 1 of the ProspectsStudy includes 13,757 observations, 60 percent (8,236) of which were included in theanalysis of achievement outcomes between grades 1 and 2.13 About 40 percent of thesample (5,513) were not identified as either non-Hispanic black or non-Hispanic white(having either another or a missing indicator for race/ethnicity); eight additional caseshad missing background information (sex or Census region). Of cases used in theanalysis, 41 percent were missing key analysis variables (test scores or parental SES).14
Cohort 3 of the Prospects Study includes 19,311 observations, 61 percent (11,847) ofwhich were included in the analysis of achievement outcomes between grades 3 and 5.About 35 percent of the sample (4,842) were not identified as either non-Hispanic blackor non-Hispanic white (having either another or a missing indicator for race/ethnicity);an additional 4 percent (314) had missing sex or Census region. Of cases used in theanalysis, 62 percent were missing one or more analysis variables.15
Cohort 7 of the Prospects Study includes 9,986 observations, 67 percent (6,655) ofwhich were included in the analysis of achievement outcomes between grades 7 and 9.About 31 percent of the sample (3,069) were not identified as either non-Hispanic blackor non-Hispanic white (having either another or a missing indicator for race/ethnicity);an additional 2 percent (262) had missing sex or Census region. Two-thirds of casesused in the analysis were missing one or more analysis variables.16
The NELS:88 sample consists of 27,588 observations, 55 percent (15,251) of which wereincluded in the analysis of achievement outcomes between grades 8 and 12. About 40 percent of the sample (11,151) were not identified as either non-Hispanic black ornon-Hispanic white (having either another or a missing indicator for race/ethnicity);around 4 percent (1,186) of the observations had missing sex or Census region. Of casesused in the analysis, 37 percent had missing values for one or more key variables.17
13 Both fall and spring scores were available for grade 1. The spring scores were used in the analyses,because the fall math scores covered conceptual skills only, and not computational skills.
14 Item nonresponse for the sample of blacks and whites in Prospects Cohort 1 ranged from 8.67 per-cent for the SES variable to 28.91 percent for the grade 2 math score.
14 Item nonresponse for the sample of blacks and whites in Prospects Cohort 3 ranged from 19.68 per-cent for the SES variable to 46.26 percent for the grade 5 math score.
15 Item nonresponse for the sample of blacks and whites in Prospects Cohort 7 ranged from 18.81 per-cent for the SES variable to 48.69 percent for the grade 9 math score.
16 Item nonresponse for the sample of blacks and whites in NELS:88 ranged from 4.93 percent for theSES variable to 26.90 percent for the grade 12 reading score.
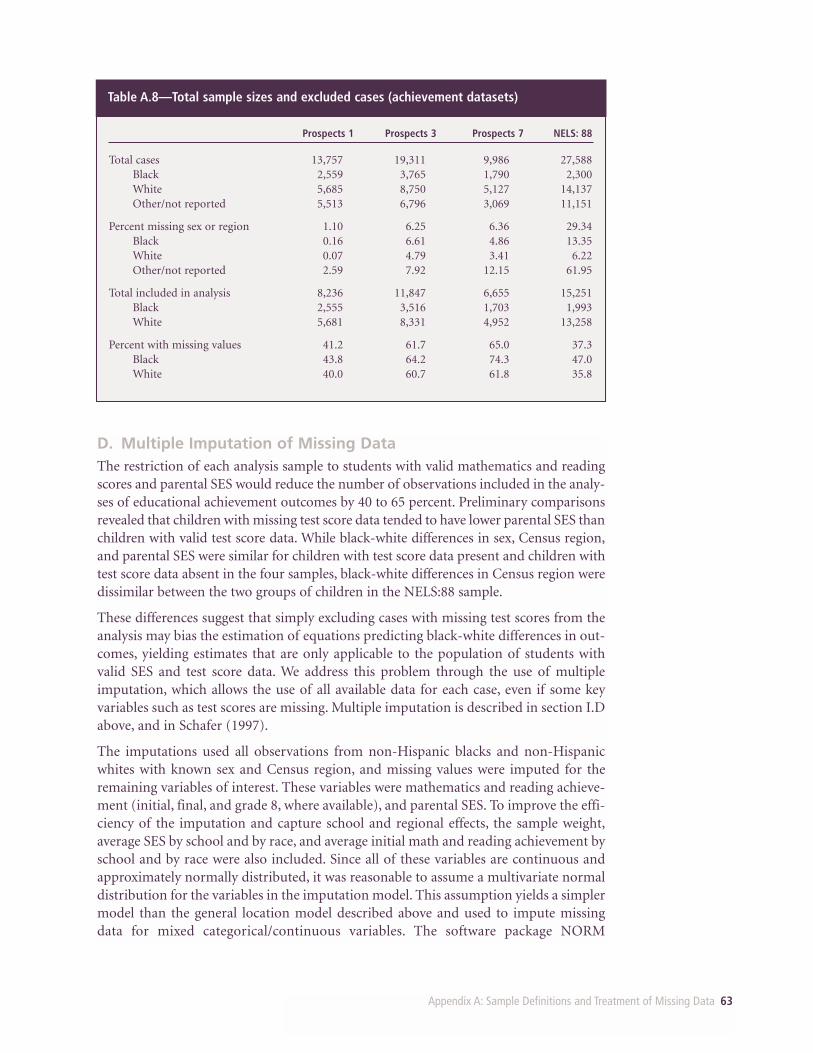
Appendix A: Sample Definitions and Treatment of Missing Data 63
D. Multiple Imputation of Missing DataThe restriction of each analysis sample to students with valid mathematics and readingscores and parental SES would reduce the number of observations included in the analy-ses of educational achievement outcomes by 40 to 65 percent. Preliminary comparisonsrevealed that children with missing test score data tended to have lower parental SES thanchildren with valid test score data. While black-white differences in sex, Census region,and parental SES were similar for children with test score data present and children withtest score data absent in the four samples, black-white differences in Census region weredissimilar between the two groups of children in the NELS:88 sample.
These differences suggest that simply excluding cases with missing test scores from theanalysis may bias the estimation of equations predicting black-white differences in out-comes, yielding estimates that are only applicable to the population of students withvalid SES and test score data. We address this problem through the use of multipleimputation, which allows the use of all available data for each case, even if some keyvariables such as test scores are missing. Multiple imputation is described in section I.Dabove, and in Schafer (1997).
The imputations used all observations from non-Hispanic blacks and non-Hispanicwhites with known sex and Census region, and missing values were imputed for theremaining variables of interest. These variables were mathematics and reading achieve-ment (initial, final, and grade 8, where available), and parental SES. To improve the effi-ciency of the imputation and capture school and regional effects, the sample weight,average SES by school and by race, and average initial math and reading achievement byschool and by race were also included. Since all of these variables are continuous andapproximately normally distributed, it was reasonable to assume a multivariate normaldistribution for the variables in the imputation model. This assumption yields a simplermodel than the general location model described above and used to impute missingdata for mixed categorical/continuous variables. The software package NORM
Table A.8—Total sample sizes and excluded cases (achievement datasets)
Prospects 1 Prospects 3 Prospects 7 NELS: 88
Total cases 13,757 19,311 9,986 27,588Black 2,559 3,765 1,790 2,300White 5,685 8,750 5,127 14,137Other/not reported 5,513 6,796 3,069 11,151
Percent missing sex or region 1.10 6.25 6.36 29.34Black 0.16 6.61 4.86 13.35White 0.07 4.79 3.41 6.22Other/not reported 2.59 7.92 12.15 61.95
Total included in analysis 8,236 11,847 6,655 15,251Black 2,555 3,516 1,703 1,993White 5,681 8,331 4,952 13,258
Percent with missing values 41.2 61.7 65.0 37.3Black 43.8 64.2 74.3 47.0White 40.0 60.7 61.8 35.8
64 Appendix A: Sample Definitions and Treatment of Missing Data
Version 2.0, created by Joe Schafer, was used to create the imputed datasets under themultivariate normal assumption.
Since the relationships among test scores may differ among race, sex, and region categories,missing values were imputed separately for each of the 16 subsets defined by the cross-clas-sification of these variables (2 sexes x 2 races x 4 regions). The sample sizes for these 16 groups are indicated in table A.9. For each of the 16 subsets of NELS:88 and Cohorts 1and 3 of the Prospects Study, we ran a single series of 2,500 iterations of data augmenta-tion, using the default starting values and standard noninformative priors. We checked thisseries for convergence using the diagnostic plots suggested by Schaefer (1997)18. We exam-ined time series and autocorrelation function (ACF) plots for each parameter (means andcovariances for all variables in the imputation model). For all parameters and all subsets ofthe data, the plots indicated convergence of the data augmentation algorithm after a fewhundred iterations. Time series plots for each parameter resembled a horizontal band, andautocorrelations diminished to near zero after a few lags.
Once we were satisfied that the data augmentation series had converged in fewer than500 steps, we imputed missing values after every 500th step, for a total of 5 imputations.The data augmentation routine appeared to take longer to converge on the ProspectsCohort 7 data files. For each of these data files we ran a series of 5,000 steps of data aug-mentation and imputed after every 1,000th step.
For the first of the five multiple imputations, we merged the 16 subsets together, creat-ing a single file that included observations from all sex, race, and region categories. Werepeated this step for each imputation, creating a total of five files for use in the analy-sis. In the case of the Prospects Cohort 7 and NELS:88 datasets, we also imputed miss-
18 Note that the method for assessing convergence is different than that described in section I.D. Thesoftware used for the general location model does not allow saving and plotting of series of parameters.
Table A.9—Sample sizes by race/sex category (achievement datasets)
Cohort 1 Cohort 3 Cohort 7 NELS:88
Total all regions 8,236 11,847 6,655 15,251
White males Northeast 448 814 475 1,407North Central 620 773 596 2,104South 1,179 1,650 1,007 2,179West 655 1,008 505 1,013
White females Northeast 417 780 454 1,397North Central 626 806 582 2,088South 1,160 1,610 916 2,130West 576 890 417 940
Black males Northeast 290 455 250 157North Central 104 145 86 149South 809 958 437 620West 84 185 63 60
Black females Northeast 319 473 251 154North Central 103 155 111 145South 749 977 442 645West 97 168 63 63
Appendix A: Sample Definitions and Treatment of Missing Data 65
ing math and reading test scores for children of other races than black/non-Hispanicand white/non-Hispanic. These additional imputations allowed us to normalize, for thecorresponding imputed datasets, all Prospects and NELS:88 test scores by the mean andstandard deviation for the entire sample of 8th graders.
E. Characteristics of Cases with Missing DataTables A.10 through A.13 show summary statistics on the key variables in the analysisof educational achievement. Some key differences exist between the distributions of thedata for complete cases and cases with missing values. Test scores for reading and mathwere lower among cases with missing values than among complete cases in each of thefour datasets. Among white children, these differences are statistically significant.Differences among black children are similar in magnitude but are not statistically sig-nificant, probably due to the smaller sample sizes for blacks. Cases with missing datahad lower average SES and were more likely to come from the bottom SES quartile. Thisdifference holds for both blacks and whites in each dataset.
Despite the differences in characteristics of complete cases and cases with missing data,the estimated black-white differences were similar for the two groups. There were nosignificant differences in the Prospects samples. In the NELS:88 sample, black-white dif-ferences in the percentage attending high school in the Midwest and South Censusregions were smaller for cases with missing data. These results suggest that restrictinganalysis to complete cases might bias estimates of black-white differences only slightly.Strictly speaking, however, results of an analysis restricted to complete cases could begeneralized only to the population of students with valid data on test scores and SES.Multiple imputation of missing data avoids this problem.

66 Appendix A: Sample Definitions and Treatment of Missing Data
Table A.10—Comparison of black and white children in Prospects Cohort 1, by presence of SES and test score data
SES and test score SES or test score Difference-of-meansSample definition data present data absent (absent - present) Statisticaland descriptive variables Mean Std. Error Mean Std. Error Value Std. Error significance
Population of black and white children (N=4474) (N=3068)Percentage black 18.4 0.0 20.0 0.1 1.6 2.7
Population of white children (N=3205) (N=2074)Percentage female 48.2 1.3 50.1 0.0 1.9 2.4Percentage attending high school in the Northeast 7.6 2.8 6.7 0.0 -1.0 2.3Percentage attending high school in the Midwest 29.2 7.0 26.7 0.2 -2.5 9.1Percentage attending high school in the South 45.8 7.6 41.0 0.2 -4.9 6.8Percentage attending high school in the West 17.3 5.5 25.6 0.2 8.3 6.6Socioeconomic status 0.222 0.060 0.076 0.065 -0.146 0.068 ** Percentage in bottom SES quartile 13.0 1.6 21.5 0.1 8.5 2.5 ** Percentage in lower-middle SES quartile 27.7 2.2 23.2 0.0 -4.5 2.2 ** Percentage in upper-middle SES quartile 30.6 1.7 25.7 0.0 -4.9 2.7Percentage in top SES quartile 28.7 3.0 29.6 0.1 0.9 3.4Mean grade 2 math score -2.6 0.1 -2.8 0.1 -0.2 0.1 ** Mean grade 2 reading score -2.0 0.1 -2.2 0.1 -0.2 0.1 ** Mean initial (grade 1) math score -4.0 0.1 -4.3 0.1 -0.3 0.1 ** Mean initial (grade 1) reading score -3.4 0.1 -3.6 0.1 -0.2 0.1 **
Population of black children (N=1269) (N=994)Percentage female 51.1 3.2 46.7 2.1 -4.4 2.7Percentage attending high school in the Northeast 16.9 7.5 14.5 5.2 -2.4 4.5Percentage attending high school in the Midwest 9.8 4.8 9.1 3.8 -0.7 2.7Percentage attending high school in the South 68.1 8.8 64.0 7.2 -4.1 5.5Percentage attending high school in the West 5.2 2.4 12.4 4.2 7.2 3.0 ** Socioeconomic status -0.479 0.119 -0.681 0.084 -0.202 0.095 ** Percentage in bottom SES quartile 43.4 4.9 51.3 3.2 7.9 4.4Percentage in lower-middle SES quartile 21.9 2.1 21.4 2.0 -0.5 3.0Percentage in upper-middle SES quartile 22.7 3.1 15.0 1.7 -7.6 3.3 ** Percentage in top SES quartile 12.0 3.4 12.3 2.5 0.2 3.0Mean grade 2 math score -3.4 0.1 -3.7 0.2 -0.3 0.1 ** Mean grade 2 reading score -3.2 0.2 -3.5 0.2 -0.3 0.1 ** Mean initial (grade 1) math score -5.2 0.3 -5.4 0.2 -0.2 0.2Mean initial (grade 1) reading score -4.4 0.2 -4.6 0.2 -0.2 0.2
Difference between black and white childrenPercentage female 2.9 3.6 -3.4 2.8 -6.4 3.9Percentage attending high school in the Northeast 9.3 7.6 7.8 5.4 -1.4 4.9Percentage attending high school in the Midwest -19.4 7.1 -17.7 8.9 1.8 8.5Percentage attending high school in the South 22.3 9.8 23.0 8.8 0.7 7.8Percentage attending high school in the West -12.1 5.0 -13.2 6.8 -1.1 7.0Socioeconomic status -0.702 0.111 -0.758 0.096 -0.056 0.108Percentage in bottom SES quartile 30.4 4.7 29.8 3.8 -0.6 4.9Percentage in lower-middle SES quartile -5.8 2.8 -1.8 2.5 4.0 3.5Percentage in upper-middle SES quartile -7.9 3.2 -10.6 2.5 -2.7 4.2Percentage in top SES quartile -16.7 3.3 -17.4 3.8 -0.7 4.2Mean grade 2 math score -0.8 0.1 -0.9 0.1 -0.1 0.2Mean grade 2 reading score -1.2 0.2 -1.3 0.2 -0.1 0.2Mean initial (grade 1) math score -1.1 0.2 -1.0 0.1 0.1 0.2Mean initial (grade 1) reading score -1.0 0.2 -0.9 0.2 0.0 0.2
** Difference-of-means between two groups is statistically significant at p<=.05.
NOTE: Standard errors have been adjusted for complex survey designs. Numbers may not sum to totals due to rounding. Sample sizes aresmaller than those reported in table A.2 because observations with a sampling weight of zero were excluded from the tabulations. Multipleimputation used to account for missing data.
SOURCE: U.S. Department of Education, Chapter 1 Prospects Study.
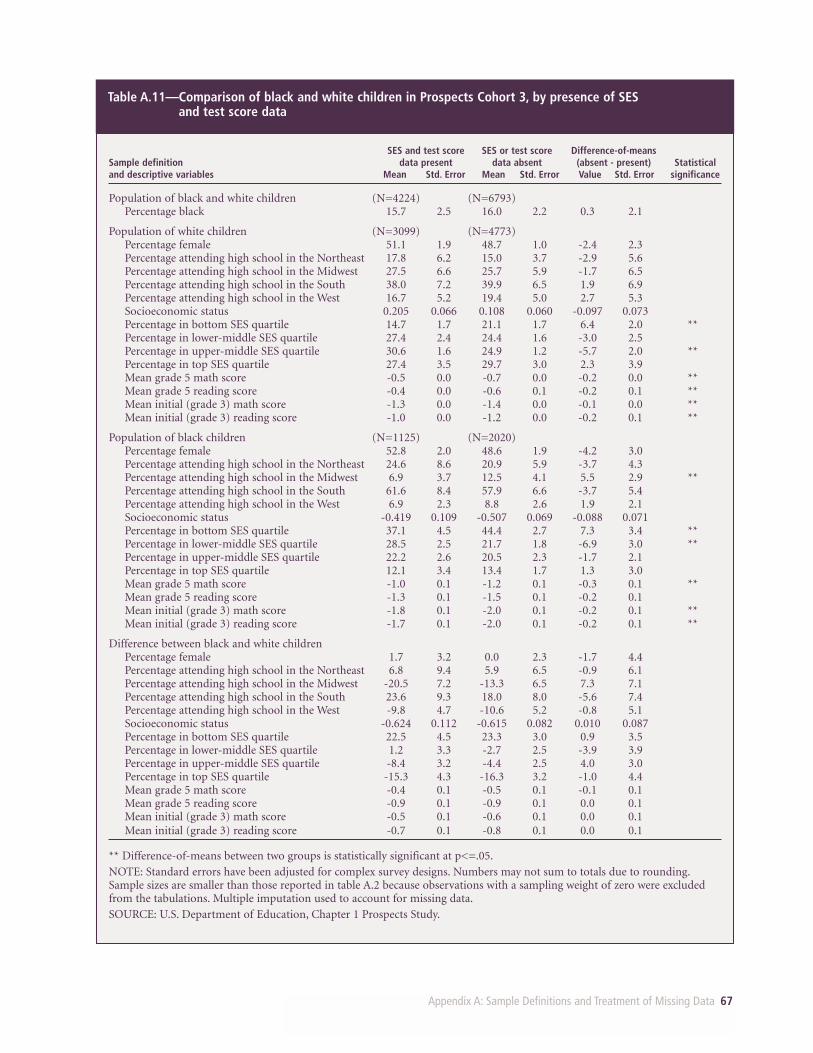
Appendix A: Sample Definitions and Treatment of Missing Data 67
Table A.11—Comparison of black and white children in Prospects Cohort 3, by presence of SES and test score data
SES and test score SES or test score Difference-of-meansSample definition data present data absent (absent - present) Statisticaland descriptive variables Mean Std. Error Mean Std. Error Value Std. Error significance
Population of black and white children (N=4224) (N=6793)Percentage black 15.7 2.5 16.0 2.2 0.3 2.1
Population of white children (N=3099) (N=4773)Percentage female 51.1 1.9 48.7 1.0 -2.4 2.3 Percentage attending high school in the Northeast 17.8 6.2 15.0 3.7 -2.9 5.6 Percentage attending high school in the Midwest 27.5 6.6 25.7 5.9 -1.7 6.5 Percentage attending high school in the South 38.0 7.2 39.9 6.5 1.9 6.9 Percentage attending high school in the West 16.7 5.2 19.4 5.0 2.7 5.3 Socioeconomic status 0.205 0.066 0.108 0.060 -0.097 0.073 Percentage in bottom SES quartile 14.7 1.7 21.1 1.7 6.4 2.0 ** Percentage in lower-middle SES quartile 27.4 2.4 24.4 1.6 -3.0 2.5 Percentage in upper-middle SES quartile 30.6 1.6 24.9 1.2 -5.7 2.0 ** Percentage in top SES quartile 27.4 3.5 29.7 3.0 2.3 3.9 Mean grade 5 math score -0.5 0.0 -0.7 0.0 -0.2 0.0 ** Mean grade 5 reading score -0.4 0.0 -0.6 0.1 -0.2 0.1 ** Mean initial (grade 3) math score -1.3 0.0 -1.4 0.0 -0.1 0.0 ** Mean initial (grade 3) reading score -1.0 0.0 -1.2 0.0 -0.2 0.1 **
Population of black children (N=1125) (N=2020)Percentage female 52.8 2.0 48.6 1.9 -4.2 3.0 Percentage attending high school in the Northeast 24.6 8.6 20.9 5.9 -3.7 4.3 Percentage attending high school in the Midwest 6.9 3.7 12.5 4.1 5.5 2.9 ** Percentage attending high school in the South 61.6 8.4 57.9 6.6 -3.7 5.4 Percentage attending high school in the West 6.9 2.3 8.8 2.6 1.9 2.1 Socioeconomic status -0.419 0.109 -0.507 0.069 -0.088 0.071 Percentage in bottom SES quartile 37.1 4.5 44.4 2.7 7.3 3.4 ** Percentage in lower-middle SES quartile 28.5 2.5 21.7 1.8 -6.9 3.0 ** Percentage in upper-middle SES quartile 22.2 2.6 20.5 2.3 -1.7 2.1 Percentage in top SES quartile 12.1 3.4 13.4 1.7 1.3 3.0 Mean grade 5 math score -1.0 0.1 -1.2 0.1 -0.3 0.1 ** Mean grade 5 reading score -1.3 0.1 -1.5 0.1 -0.2 0.1 Mean initial (grade 3) math score -1.8 0.1 -2.0 0.1 -0.2 0.1 ** Mean initial (grade 3) reading score -1.7 0.1 -2.0 0.1 -0.2 0.1 **
Difference between black and white childrenPercentage female 1.7 3.2 0.0 2.3 -1.7 4.4 Percentage attending high school in the Northeast 6.8 9.4 5.9 6.5 -0.9 6.1 Percentage attending high school in the Midwest -20.5 7.2 -13.3 6.5 7.3 7.1 Percentage attending high school in the South 23.6 9.3 18.0 8.0 -5.6 7.4 Percentage attending high school in the West -9.8 4.7 -10.6 5.2 -0.8 5.1 Socioeconomic status -0.624 0.112 -0.615 0.082 0.010 0.087 Percentage in bottom SES quartile 22.5 4.5 23.3 3.0 0.9 3.5 Percentage in lower-middle SES quartile 1.2 3.3 -2.7 2.5 -3.9 3.9 Percentage in upper-middle SES quartile -8.4 3.2 -4.4 2.5 4.0 3.0 Percentage in top SES quartile -15.3 4.3 -16.3 3.2 -1.0 4.4 Mean grade 5 math score -0.4 0.1 -0.5 0.1 -0.1 0.1 Mean grade 5 reading score -0.9 0.1 -0.9 0.1 0.0 0.1 Mean initial (grade 3) math score -0.5 0.1 -0.6 0.1 0.0 0.1 Mean initial (grade 3) reading score -0.7 0.1 -0.8 0.1 0.0 0.1
** Difference-of-means between two groups is statistically significant at p<=.05.
NOTE: Standard errors have been adjusted for complex survey designs. Numbers may not sum to totals due to rounding.Sample sizes are smaller than those reported in table A.2 because observations with a sampling weight of zero were excludedfrom the tabulations. Multiple imputation used to account for missing data.
SOURCE: U.S. Department of Education, Chapter 1 Prospects Study.
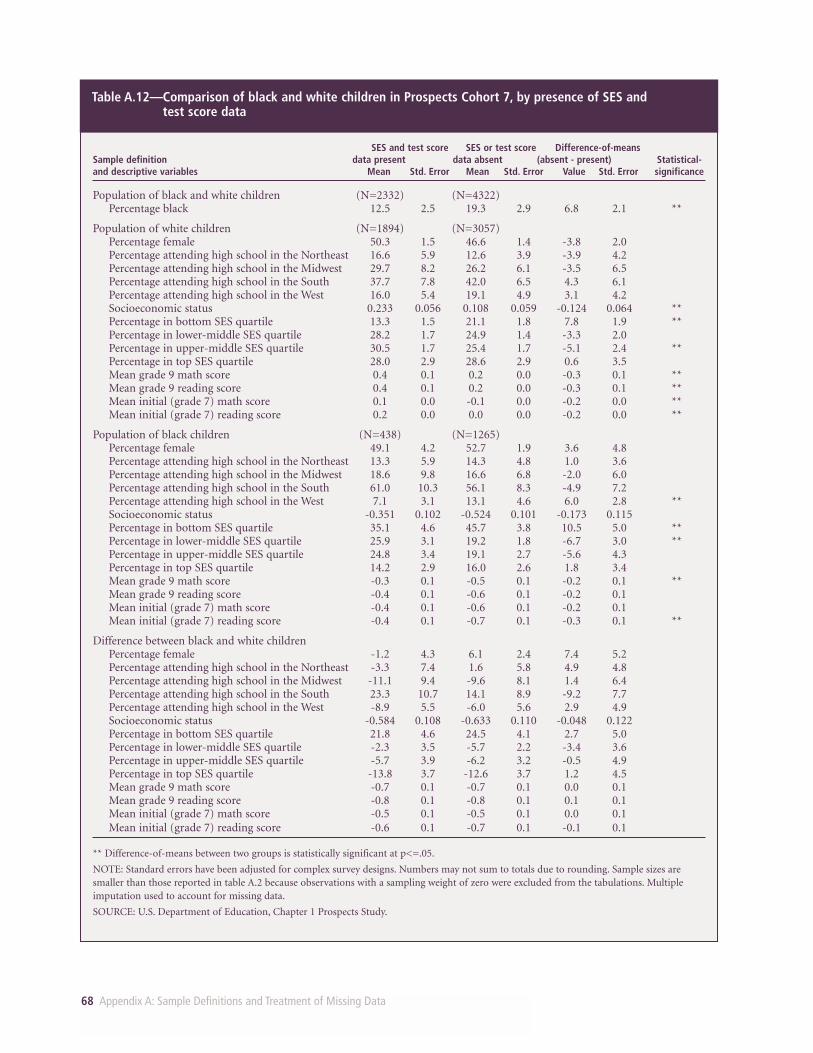
68 Appendix A: Sample Definitions and Treatment of Missing Data
Table A.12—Comparison of black and white children in Prospects Cohort 7, by presence of SES and test score data
SES and test score SES or test score Difference-of-meansSample definition data present data absent (absent - present) Statistical-and descriptive variables Mean Std. Error Mean Std. Error Value Std. Error significance
Population of black and white children (N=2332) (N=4322)Percentage black 12.5 2.5 19.3 2.9 6.8 2.1 **
Population of white children (N=1894) (N=3057)Percentage female 50.3 1.5 46.6 1.4 -3.8 2.0 Percentage attending high school in the Northeast 16.6 5.9 12.6 3.9 -3.9 4.2 Percentage attending high school in the Midwest 29.7 8.2 26.2 6.1 -3.5 6.5 Percentage attending high school in the South 37.7 7.8 42.0 6.5 4.3 6.1 Percentage attending high school in the West 16.0 5.4 19.1 4.9 3.1 4.2 Socioeconomic status 0.233 0.056 0.108 0.059 -0.124 0.064 ** Percentage in bottom SES quartile 13.3 1.5 21.1 1.8 7.8 1.9 ** Percentage in lower-middle SES quartile 28.2 1.7 24.9 1.4 -3.3 2.0 Percentage in upper-middle SES quartile 30.5 1.7 25.4 1.7 -5.1 2.4 ** Percentage in top SES quartile 28.0 2.9 28.6 2.9 0.6 3.5 Mean grade 9 math score 0.4 0.1 0.2 0.0 -0.3 0.1 ** Mean grade 9 reading score 0.4 0.1 0.2 0.0 -0.3 0.1 ** Mean initial (grade 7) math score 0.1 0.0 -0.1 0.0 -0.2 0.0 ** Mean initial (grade 7) reading score 0.2 0.0 0.0 0.0 -0.2 0.0 **
Population of black children (N=438) (N=1265)Percentage female 49.1 4.2 52.7 1.9 3.6 4.8 Percentage attending high school in the Northeast 13.3 5.9 14.3 4.8 1.0 3.6 Percentage attending high school in the Midwest 18.6 9.8 16.6 6.8 -2.0 6.0 Percentage attending high school in the South 61.0 10.3 56.1 8.3 -4.9 7.2 Percentage attending high school in the West 7.1 3.1 13.1 4.6 6.0 2.8 ** Socioeconomic status -0.351 0.102 -0.524 0.101 -0.173 0.115 Percentage in bottom SES quartile 35.1 4.6 45.7 3.8 10.5 5.0 ** Percentage in lower-middle SES quartile 25.9 3.1 19.2 1.8 -6.7 3.0 ** Percentage in upper-middle SES quartile 24.8 3.4 19.1 2.7 -5.6 4.3 Percentage in top SES quartile 14.2 2.9 16.0 2.6 1.8 3.4 Mean grade 9 math score -0.3 0.1 -0.5 0.1 -0.2 0.1 ** Mean grade 9 reading score -0.4 0.1 -0.6 0.1 -0.2 0.1 Mean initial (grade 7) math score -0.4 0.1 -0.6 0.1 -0.2 0.1 Mean initial (grade 7) reading score -0.4 0.1 -0.7 0.1 -0.3 0.1 **
Difference between black and white childrenPercentage female -1.2 4.3 6.1 2.4 7.4 5.2 Percentage attending high school in the Northeast -3.3 7.4 1.6 5.8 4.9 4.8 Percentage attending high school in the Midwest -11.1 9.4 -9.6 8.1 1.4 6.4 Percentage attending high school in the South 23.3 10.7 14.1 8.9 -9.2 7.7 Percentage attending high school in the West -8.9 5.5 -6.0 5.6 2.9 4.9 Socioeconomic status -0.584 0.108 -0.633 0.110 -0.048 0.122 Percentage in bottom SES quartile 21.8 4.6 24.5 4.1 2.7 5.0 Percentage in lower-middle SES quartile -2.3 3.5 -5.7 2.2 -3.4 3.6 Percentage in upper-middle SES quartile -5.7 3.9 -6.2 3.2 -0.5 4.9 Percentage in top SES quartile -13.8 3.7 -12.6 3.7 1.2 4.5 Mean grade 9 math score -0.7 0.1 -0.7 0.1 0.0 0.1 Mean grade 9 reading score -0.8 0.1 -0.8 0.1 0.1 0.1 Mean initial (grade 7) math score -0.5 0.1 -0.5 0.1 0.0 0.1 Mean initial (grade 7) reading score -0.6 0.1 -0.7 0.1 -0.1 0.1
** Difference-of-means between two groups is statistically significant at p<=.05.
NOTE: Standard errors have been adjusted for complex survey designs. Numbers may not sum to totals due to rounding. Sample sizes aresmaller than those reported in table A.2 because observations with a sampling weight of zero were excluded from the tabulations. Multipleimputation used to account for missing data.
SOURCE: U.S. Department of Education, Chapter 1 Prospects Study.
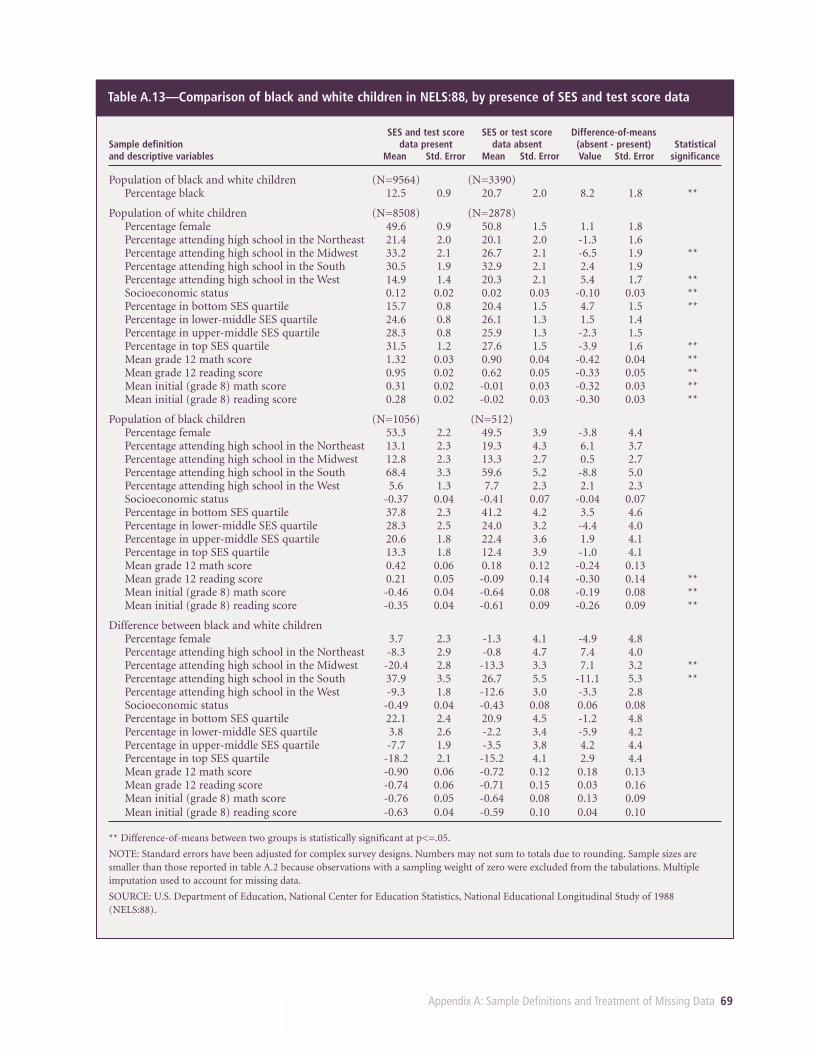
Appendix A: Sample Definitions and Treatment of Missing Data 69
Table A.13—Comparison of black and white children in NELS:88, by presence of SES and test score data
SES and test score SES or test score Difference-of-meansSample definition data present data absent (absent - present) Statisticaland descriptive variables Mean Std. Error Mean Std. Error Value Std. Error significance
Population of black and white children (N=9564) (N=3390)Percentage black 12.5 0.9 20.7 2.0 8.2 1.8 **
Population of white children (N=8508) (N=2878)Percentage female 49.6 0.9 50.8 1.5 1.1 1.8 Percentage attending high school in the Northeast 21.4 2.0 20.1 2.0 -1.3 1.6 Percentage attending high school in the Midwest 33.2 2.1 26.7 2.1 -6.5 1.9 ** Percentage attending high school in the South 30.5 1.9 32.9 2.1 2.4 1.9 Percentage attending high school in the West 14.9 1.4 20.3 2.1 5.4 1.7 ** Socioeconomic status 0.12 0.02 0.02 0.03 -0.10 0.03 ** Percentage in bottom SES quartile 15.7 0.8 20.4 1.5 4.7 1.5 ** Percentage in lower-middle SES quartile 24.6 0.8 26.1 1.3 1.5 1.4 Percentage in upper-middle SES quartile 28.3 0.8 25.9 1.3 -2.3 1.5 Percentage in top SES quartile 31.5 1.2 27.6 1.5 -3.9 1.6 ** Mean grade 12 math score 1.32 0.03 0.90 0.04 -0.42 0.04 ** Mean grade 12 reading score 0.95 0.02 0.62 0.05 -0.33 0.05 ** Mean initial (grade 8) math score 0.31 0.02 -0.01 0.03 -0.32 0.03 ** Mean initial (grade 8) reading score 0.28 0.02 -0.02 0.03 -0.30 0.03 **
Population of black children (N=1056) (N=512)Percentage female 53.3 2.2 49.5 3.9 -3.8 4.4 Percentage attending high school in the Northeast 13.1 2.3 19.3 4.3 6.1 3.7 Percentage attending high school in the Midwest 12.8 2.3 13.3 2.7 0.5 2.7 Percentage attending high school in the South 68.4 3.3 59.6 5.2 -8.8 5.0 Percentage attending high school in the West 5.6 1.3 7.7 2.3 2.1 2.3 Socioeconomic status -0.37 0.04 -0.41 0.07 -0.04 0.07 Percentage in bottom SES quartile 37.8 2.3 41.2 4.2 3.5 4.6 Percentage in lower-middle SES quartile 28.3 2.5 24.0 3.2 -4.4 4.0 Percentage in upper-middle SES quartile 20.6 1.8 22.4 3.6 1.9 4.1 Percentage in top SES quartile 13.3 1.8 12.4 3.9 -1.0 4.1 Mean grade 12 math score 0.42 0.06 0.18 0.12 -0.24 0.13 Mean grade 12 reading score 0.21 0.05 -0.09 0.14 -0.30 0.14 ** Mean initial (grade 8) math score -0.46 0.04 -0.64 0.08 -0.19 0.08 ** Mean initial (grade 8) reading score -0.35 0.04 -0.61 0.09 -0.26 0.09 **
Difference between black and white childrenPercentage female 3.7 2.3 -1.3 4.1 -4.9 4.8 Percentage attending high school in the Northeast -8.3 2.9 -0.8 4.7 7.4 4.0 Percentage attending high school in the Midwest -20.4 2.8 -13.3 3.3 7.1 3.2 ** Percentage attending high school in the South 37.9 3.5 26.7 5.5 -11.1 5.3 ** Percentage attending high school in the West -9.3 1.8 -12.6 3.0 -3.3 2.8 Socioeconomic status -0.49 0.04 -0.43 0.08 0.06 0.08 Percentage in bottom SES quartile 22.1 2.4 20.9 4.5 -1.2 4.8 Percentage in lower-middle SES quartile 3.8 2.6 -2.2 3.4 -5.9 4.2 Percentage in upper-middle SES quartile -7.7 1.9 -3.5 3.8 4.2 4.4 Percentage in top SES quartile -18.2 2.1 -15.2 4.1 2.9 4.4 Mean grade 12 math score -0.90 0.06 -0.72 0.12 0.18 0.13 Mean grade 12 reading score -0.74 0.06 -0.71 0.15 0.03 0.16 Mean initial (grade 8) math score -0.76 0.05 -0.64 0.08 0.13 0.09 Mean initial (grade 8) reading score -0.63 0.04 -0.59 0.10 0.04 0.10
** Difference-of-means between two groups is statistically significant at p<=.05.
NOTE: Standard errors have been adjusted for complex survey designs. Numbers may not sum to totals due to rounding. Sample sizes aresmaller than those reported in table A.2 because observations with a sampling weight of zero were excluded from the tabulations. Multipleimputation used to account for missing data.
SOURCE: U.S. Department of Education, National Center for Education Statistics, National Educational Longitudinal Study of 1988(NELS:88).
Appendix B: Sample Comparisons 71
APPENDIX B:SAMPLECOMPARISONSSeveral samples were constructed in the study of black-white differences in educationaland economic outcomes. While efforts were made to construct comparable samplesfrom different data sources, there are systematic differences among the samples. Thisappendix compares the samples used in analyses of educational achievement, labormarket and attainment outcomes, and describes differences among them. In allinstances, the comparisons rely on both reported and (multiple) imputed data to inferthe characteristics of each sample of individuals.
I. COMPARISONS OF SAMPLES USED IN ANALYSES OF LABOR MARKET AND ATTAINMENT OUTCOMES
Comparison of the core background characteristics and levels of educational attain-ment and work experience in the NLS:72 and NLSY senior samples indicates some dif-ferences between the two samples of young adults (table B.1):
• Blacks represented a larger (weighted) proportion of the NLSY sample than theNLS:72 sample.
• Compared with white young adults in the NLS:72 sample, white young adults inthe NLSY sample were less likely to have attended or completed college, hadmore work experience, and had lower wages and lower earnings.
• Compared with black young adults in the NLS:72 sample, black young adults inthe NLSY sample were more likely to be male, were less likely to have attended orcompleted college, had less work experience, were less likely to participate in thelabor force, and had lower wages and earnings.
The two samples had similar black-white differences in census region, educationalachievement, SES, and college attendance and completion. The two samples haddissimilar black-white differences in sex, work experience, labor force participa-tion, wages, and earnings.
While black young adults represented about the same proportion of the NLSY andHSB sophomore samples, several differences were apparent between these two sam-ples (table B.2):
• Compared with white young adults in the NLSY sample, white young adults inthe HSB sample were more likely to have completed high school, attended col-lege and completed college, and had higher earnings.
• Compared with black young adults in the NLSY sample, black young adults inthe HSB sample had higher parental SES, had higher levels of educationalachievement, were more likely to have completed high school, had more workexperience, and had higher earnings.
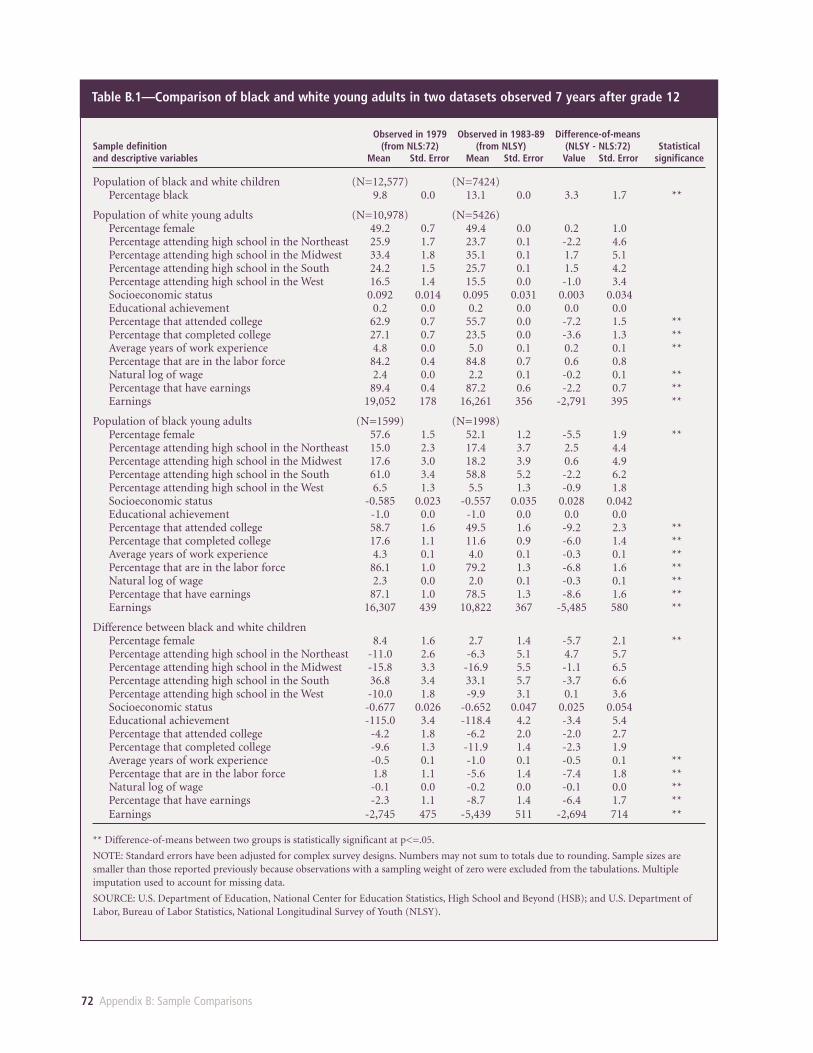
72 Appendix B: Sample Comparisons
Table B.1—Comparison of black and white young adults in two datasets observed 7 years after grade 12
Observed in 1979 Observed in 1983-89 Difference-of-meansSample definition (from NLS:72) (from NLSY) (NLSY - NLS:72) Statisticaland descriptive variables Mean Std. Error Mean Std. Error Value Std. Error significance
Population of black and white children (N=12,577) (N=7424)Percentage black 9.8 0.0 13.1 0.0 3.3 1.7 **
Population of white young adults (N=10,978) (N=5426)Percentage female 49.2 0.7 49.4 0.0 0.2 1.0Percentage attending high school in the Northeast 25.9 1.7 23.7 0.1 -2.2 4.6Percentage attending high school in the Midwest 33.4 1.8 35.1 0.1 1.7 5.1Percentage attending high school in the South 24.2 1.5 25.7 0.1 1.5 4.2Percentage attending high school in the West 16.5 1.4 15.5 0.0 -1.0 3.4Socioeconomic status 0.092 0.014 0.095 0.031 0.003 0.034Educational achievement 0.2 0.0 0.2 0.0 0.0 0.0Percentage that attended college 62.9 0.7 55.7 0.0 -7.2 1.5 ** Percentage that completed college 27.1 0.7 23.5 0.0 -3.6 1.3 ** Average years of work experience 4.8 0.0 5.0 0.1 0.2 0.1 ** Percentage that are in the labor force 84.2 0.4 84.8 0.7 0.6 0.8Natural log of wage 2.4 0.0 2.2 0.1 -0.2 0.1 ** Percentage that have earnings 89.4 0.4 87.2 0.6 -2.2 0.7 ** Earnings 19,052 178 16,261 356 -2,791 395 **
Population of black young adults (N=1599) (N=1998)Percentage female 57.6 1.5 52.1 1.2 -5.5 1.9 ** Percentage attending high school in the Northeast 15.0 2.3 17.4 3.7 2.5 4.4Percentage attending high school in the Midwest 17.6 3.0 18.2 3.9 0.6 4.9Percentage attending high school in the South 61.0 3.4 58.8 5.2 -2.2 6.2Percentage attending high school in the West 6.5 1.3 5.5 1.3 -0.9 1.8Socioeconomic status -0.585 0.023 -0.557 0.035 0.028 0.042Educational achievement -1.0 0.0 -1.0 0.0 0.0 0.0Percentage that attended college 58.7 1.6 49.5 1.6 -9.2 2.3 ** Percentage that completed college 17.6 1.1 11.6 0.9 -6.0 1.4 ** Average years of work experience 4.3 0.1 4.0 0.1 -0.3 0.1 ** Percentage that are in the labor force 86.1 1.0 79.2 1.3 -6.8 1.6 ** Natural log of wage 2.3 0.0 2.0 0.1 -0.3 0.1 ** Percentage that have earnings 87.1 1.0 78.5 1.3 -8.6 1.6 ** Earnings 16,307 439 10,822 367 -5,485 580 **
Difference between black and white childrenPercentage female 8.4 1.6 2.7 1.4 -5.7 2.1 ** Percentage attending high school in the Northeast -11.0 2.6 -6.3 5.1 4.7 5.7Percentage attending high school in the Midwest -15.8 3.3 -16.9 5.5 -1.1 6.5Percentage attending high school in the South 36.8 3.4 33.1 5.7 -3.7 6.6Percentage attending high school in the West -10.0 1.8 -9.9 3.1 0.1 3.6Socioeconomic status -0.677 0.026 -0.652 0.047 0.025 0.054Educational achievement -115.0 3.4 -118.4 4.2 -3.4 5.4Percentage that attended college -4.2 1.8 -6.2 2.0 -2.0 2.7Percentage that completed college -9.6 1.3 -11.9 1.4 -2.3 1.9Average years of work experience -0.5 0.1 -1.0 0.1 -0.5 0.1 ** Percentage that are in the labor force 1.8 1.1 -5.6 1.4 -7.4 1.8 ** Natural log of wage -0.1 0.0 -0.2 0.0 -0.1 0.0 ** Percentage that have earnings -2.3 1.1 -8.7 1.4 -6.4 1.7 ** Earnings -2,745 475 -5,439 511 -2,694 714 **
** Difference-of-means between two groups is statistically significant at p<=.05.
NOTE: Standard errors have been adjusted for complex survey designs. Numbers may not sum to totals due to rounding. Sample sizes aresmaller than those reported previously because observations with a sampling weight of zero were excluded from the tabulations. Multipleimputation used to account for missing data.
SOURCE: U.S. Department of Education, National Center for Education Statistics, High School and Beyond (HSB); and U.S. Department ofLabor, Bureau of Labor Statistics, National Longitudinal Survey of Youth (NLSY).
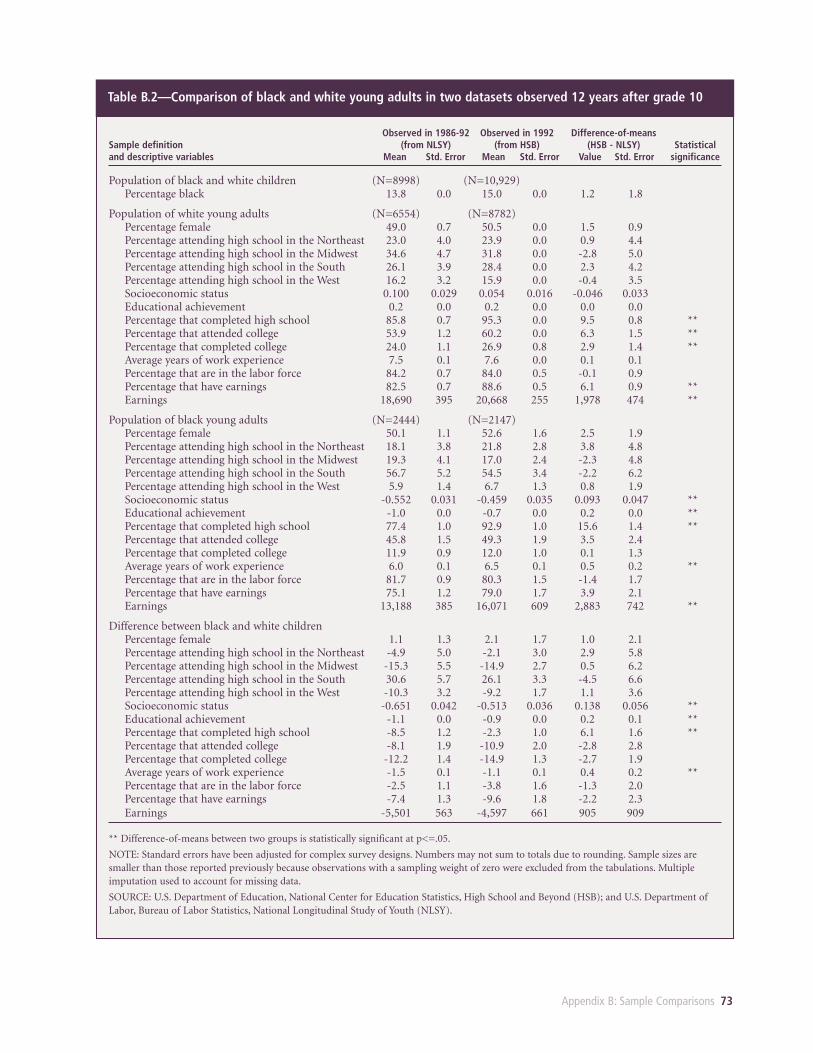
Appendix B: Sample Comparisons 73
Table B.2—Comparison of black and white young adults in two datasets observed 12 years after grade 10
Observed in 1986-92 Observed in 1992 Difference-of-meansSample definition (from NLSY) (from HSB) (HSB - NLSY) Statisticaland descriptive variables Mean Std. Error Mean Std. Error Value Std. Error significance
Population of black and white children (N=8998) (N=10,929)Percentage black 13.8 0.0 15.0 0.0 1.2 1.8
Population of white young adults (N=6554) (N=8782)Percentage female 49.0 0.7 50.5 0.0 1.5 0.9Percentage attending high school in the Northeast 23.0 4.0 23.9 0.0 0.9 4.4Percentage attending high school in the Midwest 34.6 4.7 31.8 0.0 -2.8 5.0Percentage attending high school in the South 26.1 3.9 28.4 0.0 2.3 4.2Percentage attending high school in the West 16.2 3.2 15.9 0.0 -0.4 3.5Socioeconomic status 0.100 0.029 0.054 0.016 -0.046 0.033Educational achievement 0.2 0.0 0.2 0.0 0.0 0.0Percentage that completed high school 85.8 0.7 95.3 0.0 9.5 0.8 ** Percentage that attended college 53.9 1.2 60.2 0.0 6.3 1.5 ** Percentage that completed college 24.0 1.1 26.9 0.8 2.9 1.4 ** Average years of work experience 7.5 0.1 7.6 0.0 0.1 0.1Percentage that are in the labor force 84.2 0.7 84.0 0.5 -0.1 0.9Percentage that have earnings 82.5 0.7 88.6 0.5 6.1 0.9 ** Earnings 18,690 395 20,668 255 1,978 474 **
Population of black young adults (N=2444) (N=2147)Percentage female 50.1 1.1 52.6 1.6 2.5 1.9Percentage attending high school in the Northeast 18.1 3.8 21.8 2.8 3.8 4.8Percentage attending high school in the Midwest 19.3 4.1 17.0 2.4 -2.3 4.8Percentage attending high school in the South 56.7 5.2 54.5 3.4 -2.2 6.2Percentage attending high school in the West 5.9 1.4 6.7 1.3 0.8 1.9Socioeconomic status -0.552 0.031 -0.459 0.035 0.093 0.047 ** Educational achievement -1.0 0.0 -0.7 0.0 0.2 0.0 ** Percentage that completed high school 77.4 1.0 92.9 1.0 15.6 1.4 ** Percentage that attended college 45.8 1.5 49.3 1.9 3.5 2.4Percentage that completed college 11.9 0.9 12.0 1.0 0.1 1.3Average years of work experience 6.0 0.1 6.5 0.1 0.5 0.2 ** Percentage that are in the labor force 81.7 0.9 80.3 1.5 -1.4 1.7Percentage that have earnings 75.1 1.2 79.0 1.7 3.9 2.1Earnings 13,188 385 16,071 609 2,883 742 **
Difference between black and white childrenPercentage female 1.1 1.3 2.1 1.7 1.0 2.1Percentage attending high school in the Northeast -4.9 5.0 -2.1 3.0 2.9 5.8Percentage attending high school in the Midwest -15.3 5.5 -14.9 2.7 0.5 6.2Percentage attending high school in the South 30.6 5.7 26.1 3.3 -4.5 6.6Percentage attending high school in the West -10.3 3.2 -9.2 1.7 1.1 3.6Socioeconomic status -0.651 0.042 -0.513 0.036 0.138 0.056 ** Educational achievement -1.1 0.0 -0.9 0.0 0.2 0.1 ** Percentage that completed high school -8.5 1.2 -2.3 1.0 6.1 1.6 ** Percentage that attended college -8.1 1.9 -10.9 2.0 -2.8 2.8Percentage that completed college -12.2 1.4 -14.9 1.3 -2.7 1.9Average years of work experience -1.5 0.1 -1.1 0.1 0.4 0.2 ** Percentage that are in the labor force -2.5 1.1 -3.8 1.6 -1.3 2.0Percentage that have earnings -7.4 1.3 -9.6 1.8 -2.2 2.3Earnings -5,501 563 -4,597 661 905 909
** Difference-of-means between two groups is statistically significant at p<=.05.
NOTE: Standard errors have been adjusted for complex survey designs. Numbers may not sum to totals due to rounding. Sample sizes aresmaller than those reported previously because observations with a sampling weight of zero were excluded from the tabulations. Multipleimputation used to account for missing data.
SOURCE: U.S. Department of Education, National Center for Education Statistics, High School and Beyond (HSB); and U.S. Department ofLabor, Bureau of Labor Statistics, National Longitudinal Study of Youth (NLSY).
74 Appendix B: Sample Comparisons
Black-white differences in background characteristics were similar between the twosamples in the categories of sex, census region, college attendance and completion, andearnings. Black-white differences in background characteristics were dissimilar betweenthe two samples in the categories of parental SES, educational achievement, high schoolcompletion, and work experience.
Since both the NLSY sophomore sample and the HSB sophomore sample containobservations from the year 1992, it is possible to compare the 1992 portion of the NLSYsample with the HSB sample. In general, the differences between the NLSY subsampleand the HSB sample resemble the differences between the entire NLSY sample and theHSB sample (table B.3):
• Compared with white young adults in the NLSY 1992 sample, white young adultsin the HSB sample were more likely to have completed high school and attendedcollege, had less work experience, and had higher earnings.
• Compared with black young adults in the NLSY 1992 samples, black youngadults in the HSB sample had higher levels of educational achievement, weremore likely to have completed high school and attended college, and had higherearnings.
Black-white differences in background characteristics were similar between the twosamples in the categories of sex, census region, parental SES, college attendance andcompletion, and earnings. Black-white differences in background characteristics weredissimilar between the two samples in the categories of educational achievement, highschool completion, and work experience.
These findings suggest that there were systematic differences between the NLSY andHSB sophomore samples, even for young adults sampled during the same year. Thesedifferences could be due to differences in sample design or in the wording of surveyquestions. Consequently, differences between the NLSY and HSB sophomore samplescannot be attributed to time trends alone. In particular, since blacks appear to have beenless disadvantaged in the HSB sample than in the NLSY sample in 1992, comparisons ofthe entire NLSY sample with the HSB sample may show relative gains for blacksbetween the samples, even though such gains may not have occurred between 1986-1992 and 1992.
Comparisons between NLS:72 and the NLSY senior sample, and HSB and the NLSYsophomore sample both used multiple imputation to account for missing labor marketand attainment outcomes.
II. COMPARISONS OF SAMPLES USED IN ANALYSES OF EDUCATIONAL ACHIEVEMENT OUTCOMES
The across-sample comparisons of black-white differences in educational achievementcompared children across the Prospects and NELS:88 samples. The expression of testscores in grade 8 standard deviation units, and the “vertical equation” of the Prospectsscores across cohorts, enabled these comparisons. With few exceptions, the backgroundcharacteristics of children were similar in all of the Prospects samples and in theProspects and NELS:88 samples.
The Prospects Cohort 1 sample and the Prospects Cohort 3 sample were similar interms of the proportion of the sample that was black. Black and white children in the

Appendix B: Sample Comparisons 75
Table B.3—Comparison of black and white young adults in two datasets observed 12 years after grade 10 (in 1992 only)
Observed in 1992 Observed in 1992 Difference-of-meansSample definition (from NLSY) (from HSB) (HSB - NLSY) Statisticaland descriptive variables Mean Std. Error Mean Std. Error Value Std. Error significance
Population of black and white children (N=1228) (N=10,929)Percentage black 15.7 0.1 15.0 0.0 -0.7 2.2
Population of white young adults (N=857) (N=8782)Percentage female 49.2 2.2 50.5 0.0 1.3 2.3Percentage attending high school in the Northeast 21.3 4.1 23.9 0.0 2.6 4.5Percentage attending high school in the Midwest 34.8 5.1 31.8 0.0 -3.0 5.4Percentage attending high school in the South 26.8 4.4 28.4 0.0 1.6 4.7Percentage attending high school in the West 17.1 3.8 15.9 0.0 -1.2 4.0Socioeconomic status 0.105 0.048 0.054 0.016 -0.051 0.051Educational achievement 0.2 0.0 0.2 0.0 0.0 0.0Percentage that completed high school 80.1 1.7 95.3 0.0 15.2 1.7 ** Percentage that attended college 52.0 2.2 60.2 0.0 8.3 2.3 ** Percentage that completed college 25.3 1.9 26.9 0.8 1.6 2.0Average years of work experience 8.3 0.1 7.6 0.0 -0.7 0.1 ** Percentage that are in the labor force 86.1 1.5 84.0 0.5 -2.0 1.5Percentage that have earnings 82.7 1.5 88.6 0.5 5.9 1.6 ** Earnings 18,407 661 20,668 255 2,261 718 **
Population of black young adults (N=371) (N=2147)Percentage female 48.9 2.7 52.6 1.6 3.7 3.2Percentage attending high school in the Northeast 18.4 4.5 21.8 2.8 3.4 5.3Percentage attending high school in the Midwest 18.9 4.4 17.0 2.4 -1.9 5.0Percentage attending high school in the South 57.6 5.9 54.5 3.4 -3.1 6.7Percentage attending high school in the West 5.1 2.1 6.7 1.3 1.6 2.5Socioeconomic status -0.524 0.049 -0.459 0.035 0.065 0.060Educational achievement -0.9 0.0 -0.7 0.0 0.2 0.1 ** Percentage that completed high school 69.7 2.9 92.9 1.0 23.3 3.0 ** Percentage that attended college 36.0 3.1 49.3 1.9 13.2 3.7 ** Percentage that completed college 10.3 1.9 12.0 1.0 1.7 2.2Average years of work experience 6.4 0.2 6.5 0.1 0.1 0.2Percentage that are in the labor force 80.8 2.5 80.3 1.5 -0.5 2.9Percentage that have earnings 72.5 2.7 79.0 1.7 6.5 3.3 ** Earnings 11,970 697 16,071 609 4,101 933 **
Difference between black and white childrenPercentage female -0.3 3.5 2.1 1.7 2.5 3.9Percentage attending high school in the Northeast -2.9 5.6 -2.1 3.0 0.8 6.3Percentage attending high school in the Midwest -15.9 5.9 -14.9 2.7 1.1 6.5Percentage attending high school in the South 30.8 6.5 26.1 3.3 -4.7 7.3Percentage attending high school in the West -12.0 4.1 -9.2 1.7 2.8 4.4Socioeconomic status -0.629 0.070 -0.513 0.036 0.116 0.078Educational achievement -1.1 0.1 -0.9 0.0 0.2 0.1 ** Percentage that completed high school -10.4 3.3 -2.3 1.0 8.1 3.5 ** Percentage that attended college -15.9 3.7 -10.9 2.0 5.0 4.3Percentage that completed college -15.0 2.8 -14.9 1.3 0.1 3.1Average years of work experience -1.9 0.2 -1.1 0.1 0.8 0.3 ** Percentage that are in the labor force -5.2 2.8 -3.8 1.6 1.5 3.2Percentage that have earnings -10.3 3.1 -9.6 1.8 0.6 3.7Earnings -6,436 969 -4,597 661 1,840 1,234
** Difference-of-means between two groups is statistically significant at p<=.05.
NOTE: Standard errors have been adjusted for complex survey designs. Numbers may not sum to totals due to rounding. Sample sizes aresmaller than those reported previously because observations with a sampling weight of zero were excluded from the tabulations. Multipleimputation used to account for missing data.
SOURCE: U.S. Department of Education, National Center for Education Statistics, High School and Beyond (HSB); and U.S. Department ofLabor, Bureau of Labor Statistics, National Longitudinal Study of Youth (NLSY).
76 Appendix B: Sample Comparisons
Prospects Cohort 3 sample were more likely to live in the Northeast, but otherwise, thecharacteristics of children in both samples were similar (table B.4). The black-white dif-ference in the proportion of the sample in the bottom SES quartile was dissimilarbetween the two samples; black-white differences in background characteristics wereotherwise similar for Cohort 1 and Cohort 3.
The Prospects Cohort 1 sample and the Prospects Cohort 7 sample were similar interms of the proportion of the sample that was black, and the background characteris-tics of children in both samples were similar by race (table B.5). Black-white differencesin background characteristics were similar for Cohort 1 and Cohort 7.
The Prospects Cohort 1 sample and the NELS:88 sample were similar in terms of theproportion of the sample that was black (table B.6). Compared with white children inthe Cohort 1 sample, white children in the NELS:88 sample were more likely to attendschool in the Northeast. Compared with black children in the Cohort 1 sample, blackchildren in the NELS:88 sample were more likely to be in the lower-middle SES quar-tile. The background characteristics of children in the two samples were otherwise sim-ilar by race. The black-white differences in the proportion of the sample living in theNortheast, proportion in the lower-middle SES quartile, and average parental SES weredissimilar between the two samples; otherwise, Cohort 1 and NELS:88 samples weresimilar in black-white differences in background characteristics.
The Prospects Cohort 3 sample and the Prospects Cohort 7 sample were similar interms of the proportion of the sample that was black, and the background characteris-tics of children in both samples were similar by race (table B.7). Black-white differencesin background characteristics were similar for Cohort 3 and Cohort 7.
The Prospects Cohort 3 sample and the NELS:88 sample were similar in terms of theproportion of the sample that was black, the background characteristics of children inboth samples were similar by race (table B.8), and black-white differences in back-ground characteristics were similar for the two samples.
The Prospects Cohort 7 sample and the NELS:88 sample were similar in terms of theproportion of the sample that was black (table B.9). Background characteristics of whitechildren were similar in the two samples. Compared with black children in the Cohort7 sample, black children in the NELS:88 sample were more likely to be in the lower-mid-dle SES quartile. The black-white difference in the proportion of the sample in thelower-middle SES quartile was dissimilar between the two samples; otherwise, black-white differences in background characteristics were similar for Cohort 7 and NELS:88.
With few exceptions, the background characteristics of children were very similar acrossthe four samples used in the analyses of educational achievement. These similaritiessuggest that comparisons of black-white differences in educational achievement acrossthe samples are not biased by systematic differences in the observed characteristics ofeach sample.
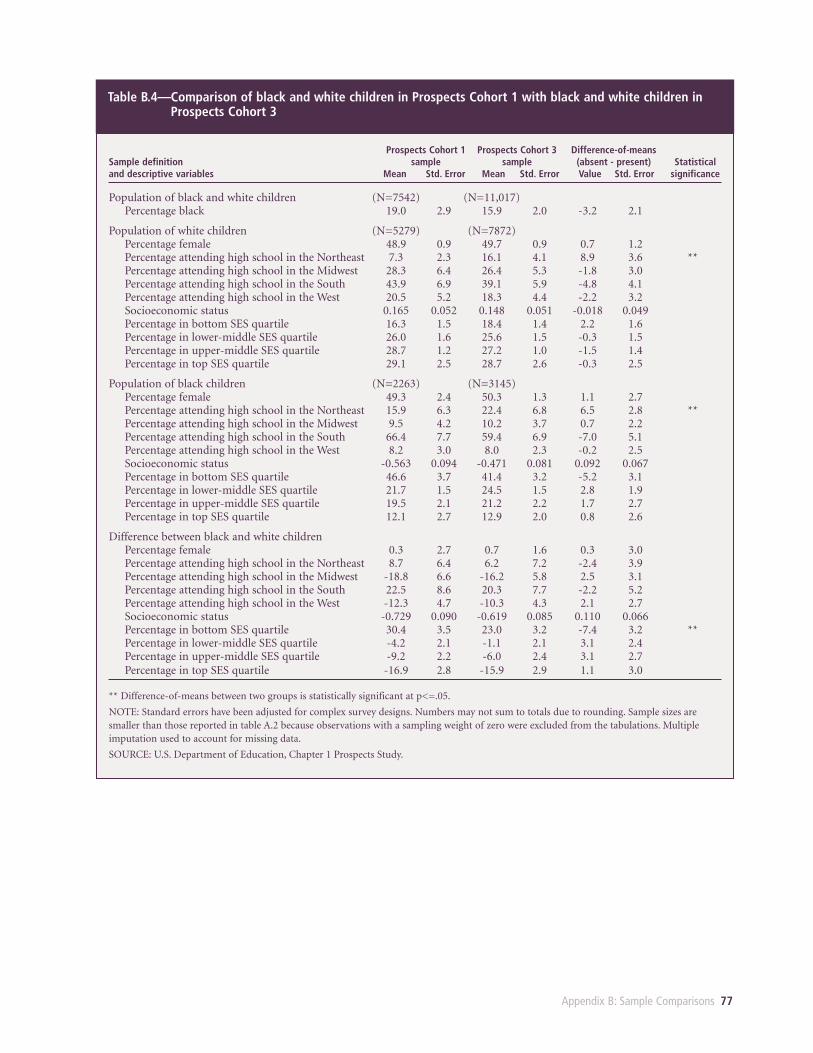
Appendix B: Sample Comparisons 77
Table B.4—Comparison of black and white children in Prospects Cohort 1 with black and white children inProspects Cohort 3
Prospects Cohort 1 Prospects Cohort 3 Difference-of-meansSample definition sample sample (absent - present) Statisticaland descriptive variables Mean Std. Error Mean Std. Error Value Std. Error significance
Population of black and white children (N=7542) (N=11,017)Percentage black 19.0 2.9 15.9 2.0 -3.2 2.1
Population of white children (N=5279) (N=7872)Percentage female 48.9 0.9 49.7 0.9 0.7 1.2Percentage attending high school in the Northeast 7.3 2.3 16.1 4.1 8.9 3.6 ** Percentage attending high school in the Midwest 28.3 6.4 26.4 5.3 -1.8 3.0Percentage attending high school in the South 43.9 6.9 39.1 5.9 -4.8 4.1Percentage attending high school in the West 20.5 5.2 18.3 4.4 -2.2 3.2Socioeconomic status 0.165 0.052 0.148 0.051 -0.018 0.049Percentage in bottom SES quartile 16.3 1.5 18.4 1.4 2.2 1.6Percentage in lower-middle SES quartile 26.0 1.6 25.6 1.5 -0.3 1.5Percentage in upper-middle SES quartile 28.7 1.2 27.2 1.0 -1.5 1.4Percentage in top SES quartile 29.1 2.5 28.7 2.6 -0.3 2.5
Population of black children (N=2263) (N=3145)Percentage female 49.3 2.4 50.3 1.3 1.1 2.7Percentage attending high school in the Northeast 15.9 6.3 22.4 6.8 6.5 2.8 ** Percentage attending high school in the Midwest 9.5 4.2 10.2 3.7 0.7 2.2Percentage attending high school in the South 66.4 7.7 59.4 6.9 -7.0 5.1Percentage attending high school in the West 8.2 3.0 8.0 2.3 -0.2 2.5Socioeconomic status -0.563 0.094 -0.471 0.081 0.092 0.067Percentage in bottom SES quartile 46.6 3.7 41.4 3.2 -5.2 3.1Percentage in lower-middle SES quartile 21.7 1.5 24.5 1.5 2.8 1.9Percentage in upper-middle SES quartile 19.5 2.1 21.2 2.2 1.7 2.7Percentage in top SES quartile 12.1 2.7 12.9 2.0 0.8 2.6
Difference between black and white childrenPercentage female 0.3 2.7 0.7 1.6 0.3 3.0Percentage attending high school in the Northeast 8.7 6.4 6.2 7.2 -2.4 3.9Percentage attending high school in the Midwest -18.8 6.6 -16.2 5.8 2.5 3.1Percentage attending high school in the South 22.5 8.6 20.3 7.7 -2.2 5.2Percentage attending high school in the West -12.3 4.7 -10.3 4.3 2.1 2.7Socioeconomic status -0.729 0.090 -0.619 0.085 0.110 0.066Percentage in bottom SES quartile 30.4 3.5 23.0 3.2 -7.4 3.2 ** Percentage in lower-middle SES quartile -4.2 2.1 -1.1 2.1 3.1 2.4Percentage in upper-middle SES quartile -9.2 2.2 -6.0 2.4 3.1 2.7Percentage in top SES quartile -16.9 2.8 -15.9 2.9 1.1 3.0
** Difference-of-means between two groups is statistically significant at p<=.05.
NOTE: Standard errors have been adjusted for complex survey designs. Numbers may not sum to totals due to rounding. Sample sizes aresmaller than those reported in table A.2 because observations with a sampling weight of zero were excluded from the tabulations. Multipleimputation used to account for missing data.
SOURCE: U.S. Department of Education, Chapter 1 Prospects Study.
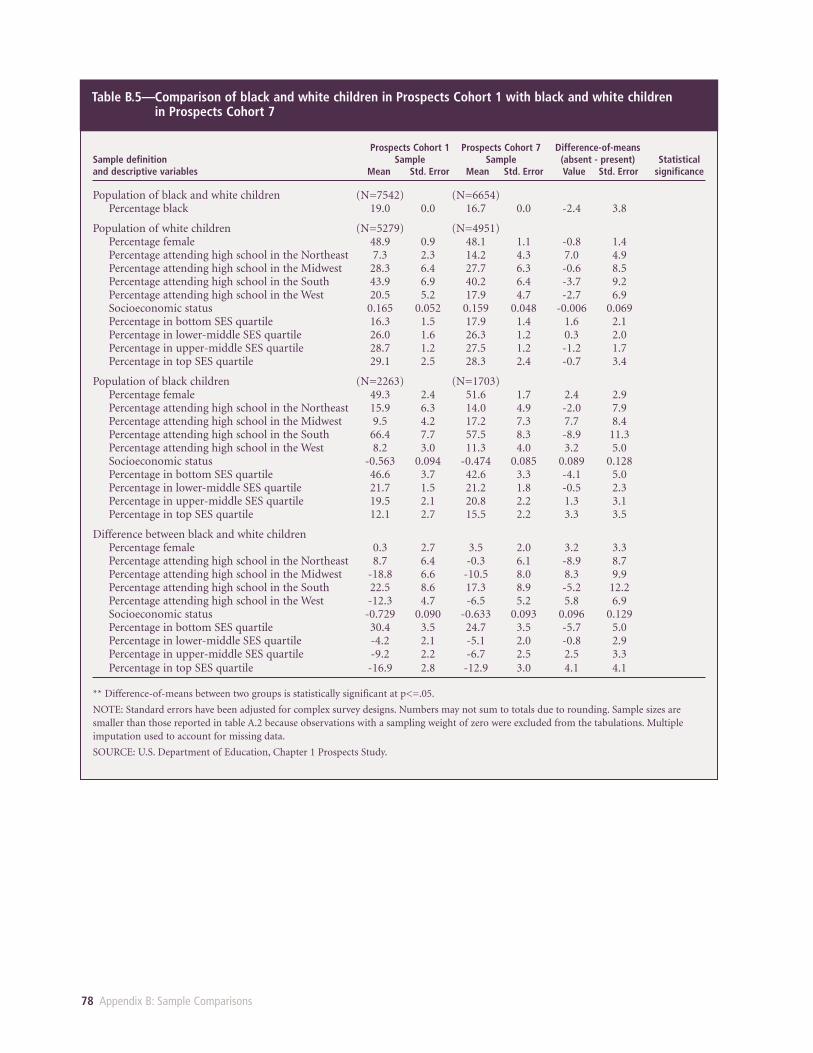
78 Appendix B: Sample Comparisons
Table B.5—Comparison of black and white children in Prospects Cohort 1 with black and white children in Prospects Cohort 7
Prospects Cohort 1 Prospects Cohort 7 Difference-of-meansSample definition Sample Sample (absent - present) Statisticaland descriptive variables Mean Std. Error Mean Std. Error Value Std. Error significance
Population of black and white children (N=7542) (N=6654)Percentage black 19.0 0.0 16.7 0.0 -2.4 3.8
Population of white children (N=5279) (N=4951)Percentage female 48.9 0.9 48.1 1.1 -0.8 1.4Percentage attending high school in the Northeast 7.3 2.3 14.2 4.3 7.0 4.9Percentage attending high school in the Midwest 28.3 6.4 27.7 6.3 -0.6 8.5Percentage attending high school in the South 43.9 6.9 40.2 6.4 -3.7 9.2Percentage attending high school in the West 20.5 5.2 17.9 4.7 -2.7 6.9Socioeconomic status 0.165 0.052 0.159 0.048 -0.006 0.069Percentage in bottom SES quartile 16.3 1.5 17.9 1.4 1.6 2.1Percentage in lower-middle SES quartile 26.0 1.6 26.3 1.2 0.3 2.0Percentage in upper-middle SES quartile 28.7 1.2 27.5 1.2 -1.2 1.7Percentage in top SES quartile 29.1 2.5 28.3 2.4 -0.7 3.4
Population of black children (N=2263) (N=1703)Percentage female 49.3 2.4 51.6 1.7 2.4 2.9Percentage attending high school in the Northeast 15.9 6.3 14.0 4.9 -2.0 7.9Percentage attending high school in the Midwest 9.5 4.2 17.2 7.3 7.7 8.4Percentage attending high school in the South 66.4 7.7 57.5 8.3 -8.9 11.3Percentage attending high school in the West 8.2 3.0 11.3 4.0 3.2 5.0Socioeconomic status -0.563 0.094 -0.474 0.085 0.089 0.128Percentage in bottom SES quartile 46.6 3.7 42.6 3.3 -4.1 5.0Percentage in lower-middle SES quartile 21.7 1.5 21.2 1.8 -0.5 2.3Percentage in upper-middle SES quartile 19.5 2.1 20.8 2.2 1.3 3.1Percentage in top SES quartile 12.1 2.7 15.5 2.2 3.3 3.5
Difference between black and white childrenPercentage female 0.3 2.7 3.5 2.0 3.2 3.3Percentage attending high school in the Northeast 8.7 6.4 -0.3 6.1 -8.9 8.7Percentage attending high school in the Midwest -18.8 6.6 -10.5 8.0 8.3 9.9Percentage attending high school in the South 22.5 8.6 17.3 8.9 -5.2 12.2Percentage attending high school in the West -12.3 4.7 -6.5 5.2 5.8 6.9Socioeconomic status -0.729 0.090 -0.633 0.093 0.096 0.129Percentage in bottom SES quartile 30.4 3.5 24.7 3.5 -5.7 5.0Percentage in lower-middle SES quartile -4.2 2.1 -5.1 2.0 -0.8 2.9Percentage in upper-middle SES quartile -9.2 2.2 -6.7 2.5 2.5 3.3Percentage in top SES quartile -16.9 2.8 -12.9 3.0 4.1 4.1
** Difference-of-means between two groups is statistically significant at p<=.05.
NOTE: Standard errors have been adjusted for complex survey designs. Numbers may not sum to totals due to rounding. Sample sizes aresmaller than those reported in table A.2 because observations with a sampling weight of zero were excluded from the tabulations. Multipleimputation used to account for missing data.
SOURCE: U.S. Department of Education, Chapter 1 Prospects Study.
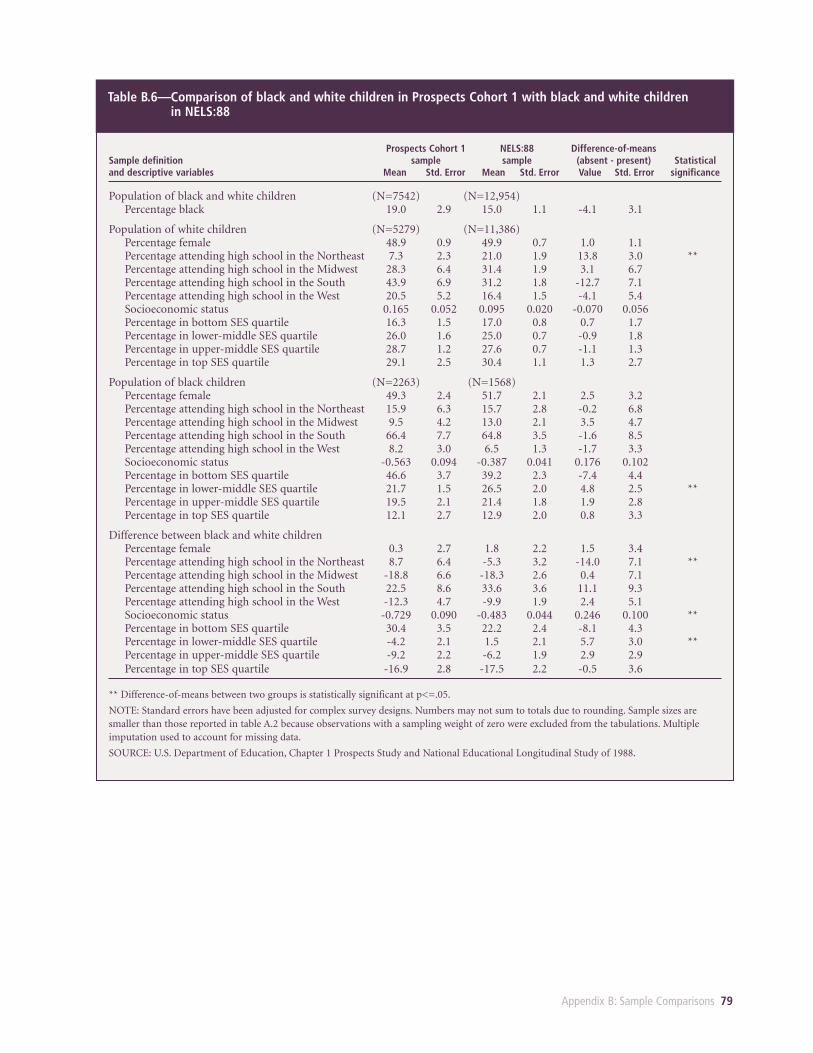
Appendix B: Sample Comparisons 79
Table B.6—Comparison of black and white children in Prospects Cohort 1 with black and white children in NELS:88
Prospects Cohort 1 NELS:88 Difference-of-meansSample definition sample sample (absent - present) Statisticaland descriptive variables Mean Std. Error Mean Std. Error Value Std. Error significance
Population of black and white children (N=7542) (N=12,954)Percentage black 19.0 2.9 15.0 1.1 -4.1 3.1
Population of white children (N=5279) (N=11,386)Percentage female 48.9 0.9 49.9 0.7 1.0 1.1Percentage attending high school in the Northeast 7.3 2.3 21.0 1.9 13.8 3.0 ** Percentage attending high school in the Midwest 28.3 6.4 31.4 1.9 3.1 6.7Percentage attending high school in the South 43.9 6.9 31.2 1.8 -12.7 7.1Percentage attending high school in the West 20.5 5.2 16.4 1.5 -4.1 5.4Socioeconomic status 0.165 0.052 0.095 0.020 -0.070 0.056Percentage in bottom SES quartile 16.3 1.5 17.0 0.8 0.7 1.7Percentage in lower-middle SES quartile 26.0 1.6 25.0 0.7 -0.9 1.8Percentage in upper-middle SES quartile 28.7 1.2 27.6 0.7 -1.1 1.3Percentage in top SES quartile 29.1 2.5 30.4 1.1 1.3 2.7
Population of black children (N=2263) (N=1568)Percentage female 49.3 2.4 51.7 2.1 2.5 3.2Percentage attending high school in the Northeast 15.9 6.3 15.7 2.8 -0.2 6.8Percentage attending high school in the Midwest 9.5 4.2 13.0 2.1 3.5 4.7Percentage attending high school in the South 66.4 7.7 64.8 3.5 -1.6 8.5Percentage attending high school in the West 8.2 3.0 6.5 1.3 -1.7 3.3Socioeconomic status -0.563 0.094 -0.387 0.041 0.176 0.102Percentage in bottom SES quartile 46.6 3.7 39.2 2.3 -7.4 4.4Percentage in lower-middle SES quartile 21.7 1.5 26.5 2.0 4.8 2.5 ** Percentage in upper-middle SES quartile 19.5 2.1 21.4 1.8 1.9 2.8Percentage in top SES quartile 12.1 2.7 12.9 2.0 0.8 3.3
Difference between black and white childrenPercentage female 0.3 2.7 1.8 2.2 1.5 3.4Percentage attending high school in the Northeast 8.7 6.4 -5.3 3.2 -14.0 7.1 ** Percentage attending high school in the Midwest -18.8 6.6 -18.3 2.6 0.4 7.1Percentage attending high school in the South 22.5 8.6 33.6 3.6 11.1 9.3Percentage attending high school in the West -12.3 4.7 -9.9 1.9 2.4 5.1Socioeconomic status -0.729 0.090 -0.483 0.044 0.246 0.100 ** Percentage in bottom SES quartile 30.4 3.5 22.2 2.4 -8.1 4.3Percentage in lower-middle SES quartile -4.2 2.1 1.5 2.1 5.7 3.0 ** Percentage in upper-middle SES quartile -9.2 2.2 -6.2 1.9 2.9 2.9Percentage in top SES quartile -16.9 2.8 -17.5 2.2 -0.5 3.6
** Difference-of-means between two groups is statistically significant at p<=.05.
NOTE: Standard errors have been adjusted for complex survey designs. Numbers may not sum to totals due to rounding. Sample sizes aresmaller than those reported in table A.2 because observations with a sampling weight of zero were excluded from the tabulations. Multipleimputation used to account for missing data.
SOURCE: U.S. Department of Education, Chapter 1 Prospects Study and National Educational Longitudinal Study of 1988.
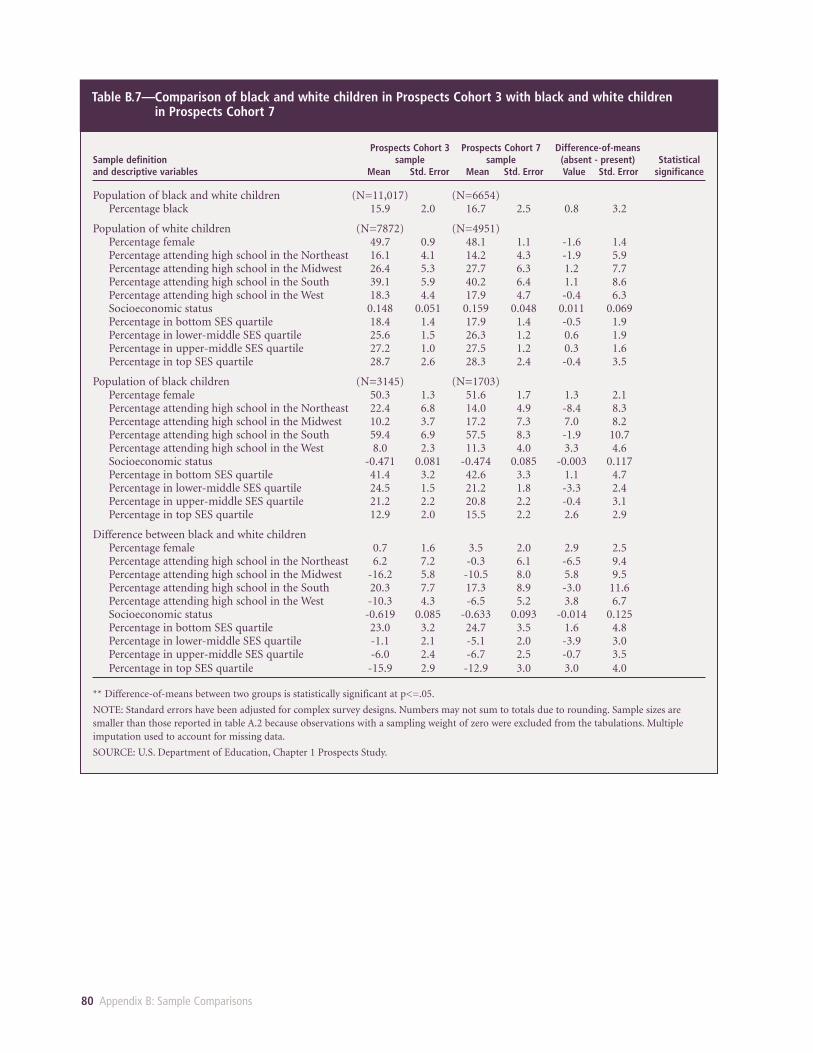
80 Appendix B: Sample Comparisons
Table B.7—Comparison of black and white children in Prospects Cohort 3 with black and white children in Prospects Cohort 7
Prospects Cohort 3 Prospects Cohort 7 Difference-of-meansSample definition sample sample (absent - present) Statisticaland descriptive variables Mean Std. Error Mean Std. Error Value Std. Error significance
Population of black and white children (N=11,017) (N=6654)Percentage black 15.9 2.0 16.7 2.5 0.8 3.2
Population of white children (N=7872) (N=4951)Percentage female 49.7 0.9 48.1 1.1 -1.6 1.4Percentage attending high school in the Northeast 16.1 4.1 14.2 4.3 -1.9 5.9Percentage attending high school in the Midwest 26.4 5.3 27.7 6.3 1.2 7.7Percentage attending high school in the South 39.1 5.9 40.2 6.4 1.1 8.6Percentage attending high school in the West 18.3 4.4 17.9 4.7 -0.4 6.3Socioeconomic status 0.148 0.051 0.159 0.048 0.011 0.069Percentage in bottom SES quartile 18.4 1.4 17.9 1.4 -0.5 1.9Percentage in lower-middle SES quartile 25.6 1.5 26.3 1.2 0.6 1.9Percentage in upper-middle SES quartile 27.2 1.0 27.5 1.2 0.3 1.6Percentage in top SES quartile 28.7 2.6 28.3 2.4 -0.4 3.5
Population of black children (N=3145) (N=1703)Percentage female 50.3 1.3 51.6 1.7 1.3 2.1Percentage attending high school in the Northeast 22.4 6.8 14.0 4.9 -8.4 8.3Percentage attending high school in the Midwest 10.2 3.7 17.2 7.3 7.0 8.2Percentage attending high school in the South 59.4 6.9 57.5 8.3 -1.9 10.7Percentage attending high school in the West 8.0 2.3 11.3 4.0 3.3 4.6Socioeconomic status -0.471 0.081 -0.474 0.085 -0.003 0.117Percentage in bottom SES quartile 41.4 3.2 42.6 3.3 1.1 4.7Percentage in lower-middle SES quartile 24.5 1.5 21.2 1.8 -3.3 2.4Percentage in upper-middle SES quartile 21.2 2.2 20.8 2.2 -0.4 3.1Percentage in top SES quartile 12.9 2.0 15.5 2.2 2.6 2.9
Difference between black and white childrenPercentage female 0.7 1.6 3.5 2.0 2.9 2.5Percentage attending high school in the Northeast 6.2 7.2 -0.3 6.1 -6.5 9.4Percentage attending high school in the Midwest -16.2 5.8 -10.5 8.0 5.8 9.5Percentage attending high school in the South 20.3 7.7 17.3 8.9 -3.0 11.6Percentage attending high school in the West -10.3 4.3 -6.5 5.2 3.8 6.7Socioeconomic status -0.619 0.085 -0.633 0.093 -0.014 0.125Percentage in bottom SES quartile 23.0 3.2 24.7 3.5 1.6 4.8Percentage in lower-middle SES quartile -1.1 2.1 -5.1 2.0 -3.9 3.0Percentage in upper-middle SES quartile -6.0 2.4 -6.7 2.5 -0.7 3.5Percentage in top SES quartile -15.9 2.9 -12.9 3.0 3.0 4.0
** Difference-of-means between two groups is statistically significant at p<=.05.
NOTE: Standard errors have been adjusted for complex survey designs. Numbers may not sum to totals due to rounding. Sample sizes aresmaller than those reported in table A.2 because observations with a sampling weight of zero were excluded from the tabulations. Multipleimputation used to account for missing data.
SOURCE: U.S. Department of Education, Chapter 1 Prospects Study.
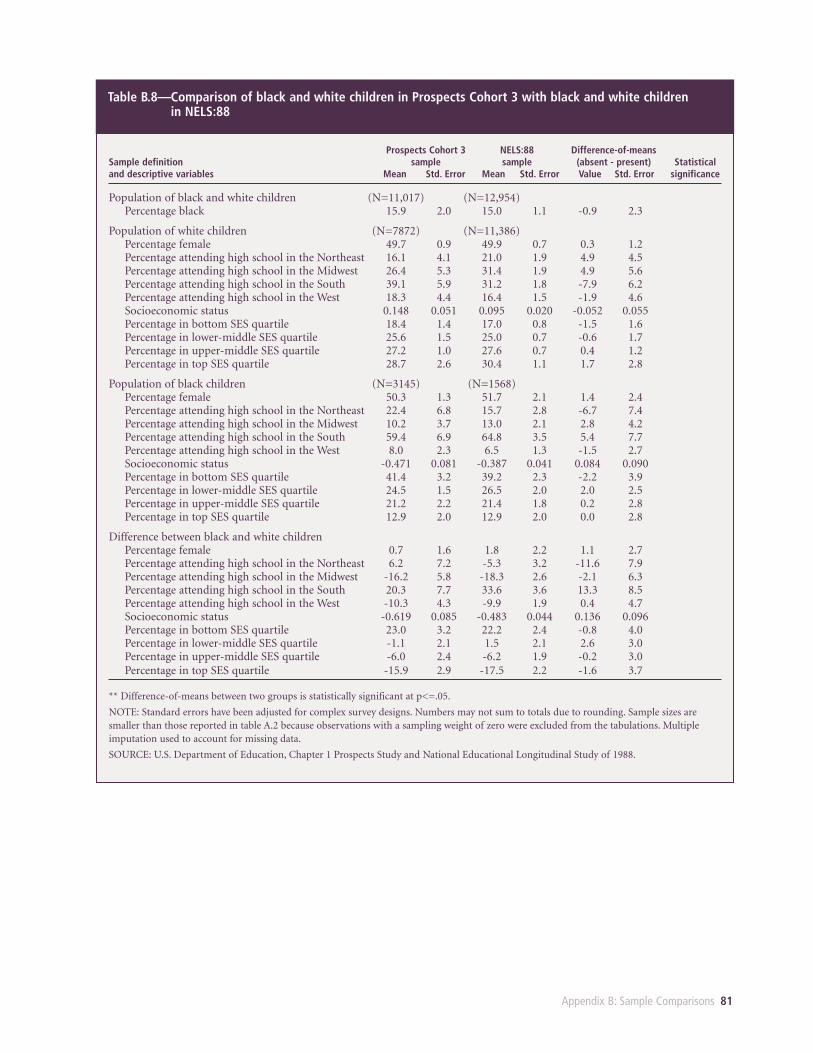
Appendix B: Sample Comparisons 81
Table B.8—Comparison of black and white children in Prospects Cohort 3 with black and white children in NELS:88
Prospects Cohort 3 NELS:88 Difference-of-meansSample definition sample sample (absent - present) Statisticaland descriptive variables Mean Std. Error Mean Std. Error Value Std. Error significance
Population of black and white children (N=11,017) (N=12,954)Percentage black 15.9 2.0 15.0 1.1 -0.9 2.3
Population of white children (N=7872) (N=11,386)Percentage female 49.7 0.9 49.9 0.7 0.3 1.2Percentage attending high school in the Northeast 16.1 4.1 21.0 1.9 4.9 4.5Percentage attending high school in the Midwest 26.4 5.3 31.4 1.9 4.9 5.6Percentage attending high school in the South 39.1 5.9 31.2 1.8 -7.9 6.2Percentage attending high school in the West 18.3 4.4 16.4 1.5 -1.9 4.6Socioeconomic status 0.148 0.051 0.095 0.020 -0.052 0.055Percentage in bottom SES quartile 18.4 1.4 17.0 0.8 -1.5 1.6Percentage in lower-middle SES quartile 25.6 1.5 25.0 0.7 -0.6 1.7Percentage in upper-middle SES quartile 27.2 1.0 27.6 0.7 0.4 1.2Percentage in top SES quartile 28.7 2.6 30.4 1.1 1.7 2.8
Population of black children (N=3145) (N=1568)Percentage female 50.3 1.3 51.7 2.1 1.4 2.4Percentage attending high school in the Northeast 22.4 6.8 15.7 2.8 -6.7 7.4Percentage attending high school in the Midwest 10.2 3.7 13.0 2.1 2.8 4.2Percentage attending high school in the South 59.4 6.9 64.8 3.5 5.4 7.7Percentage attending high school in the West 8.0 2.3 6.5 1.3 -1.5 2.7Socioeconomic status -0.471 0.081 -0.387 0.041 0.084 0.090Percentage in bottom SES quartile 41.4 3.2 39.2 2.3 -2.2 3.9Percentage in lower-middle SES quartile 24.5 1.5 26.5 2.0 2.0 2.5Percentage in upper-middle SES quartile 21.2 2.2 21.4 1.8 0.2 2.8Percentage in top SES quartile 12.9 2.0 12.9 2.0 0.0 2.8
Difference between black and white childrenPercentage female 0.7 1.6 1.8 2.2 1.1 2.7Percentage attending high school in the Northeast 6.2 7.2 -5.3 3.2 -11.6 7.9Percentage attending high school in the Midwest -16.2 5.8 -18.3 2.6 -2.1 6.3Percentage attending high school in the South 20.3 7.7 33.6 3.6 13.3 8.5Percentage attending high school in the West -10.3 4.3 -9.9 1.9 0.4 4.7Socioeconomic status -0.619 0.085 -0.483 0.044 0.136 0.096Percentage in bottom SES quartile 23.0 3.2 22.2 2.4 -0.8 4.0Percentage in lower-middle SES quartile -1.1 2.1 1.5 2.1 2.6 3.0Percentage in upper-middle SES quartile -6.0 2.4 -6.2 1.9 -0.2 3.0Percentage in top SES quartile -15.9 2.9 -17.5 2.2 -1.6 3.7
** Difference-of-means between two groups is statistically significant at p<=.05.
NOTE: Standard errors have been adjusted for complex survey designs. Numbers may not sum to totals due to rounding. Sample sizes aresmaller than those reported in table A.2 because observations with a sampling weight of zero were excluded from the tabulations. Multipleimputation used to account for missing data.
SOURCE: U.S. Department of Education, Chapter 1 Prospects Study and National Educational Longitudinal Study of 1988.
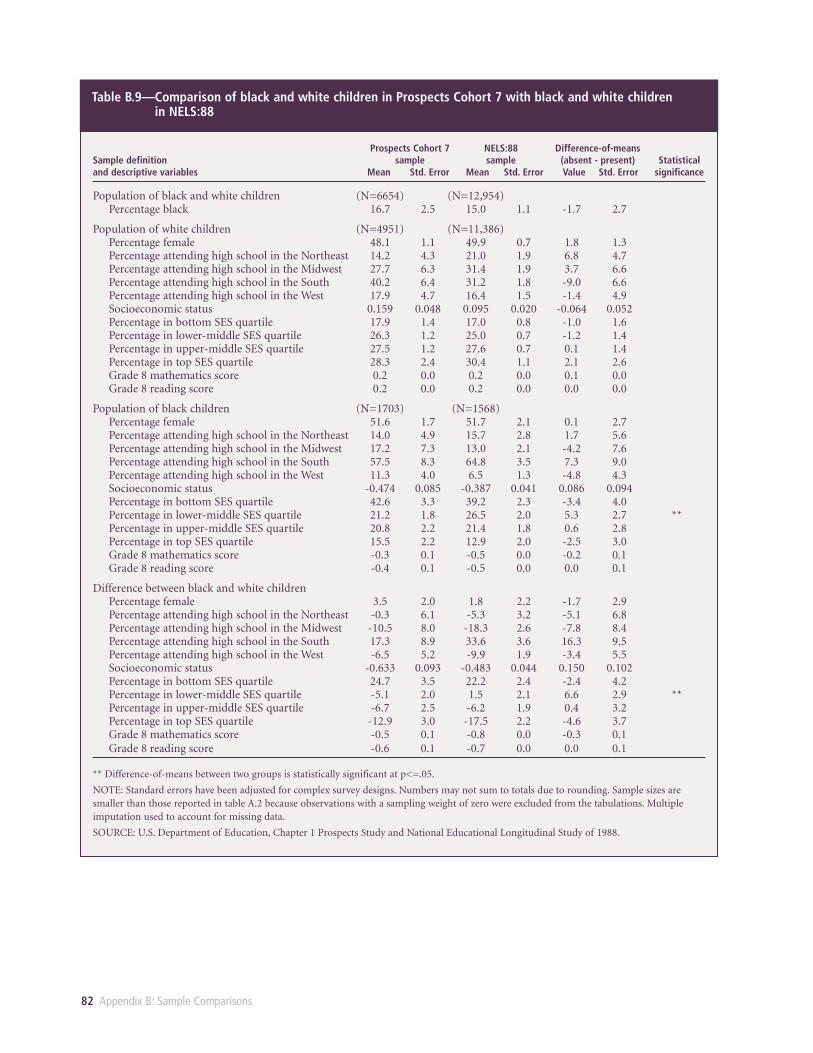
82 Appendix B: Sample Comparisons
Table B.9—Comparison of black and white children in Prospects Cohort 7 with black and white children in NELS:88
Prospects Cohort 7 NELS:88 Difference-of-meansSample definition sample sample (absent - present) Statisticaland descriptive variables Mean Std. Error Mean Std. Error Value Std. Error significance
Population of black and white children (N=6654) (N=12,954)Percentage black 16.7 2.5 15.0 1.1 -1.7 2.7
Population of white children (N=4951) (N=11,386)Percentage female 48.1 1.1 49.9 0.7 1.8 1.3Percentage attending high school in the Northeast 14.2 4.3 21.0 1.9 6.8 4.7Percentage attending high school in the Midwest 27.7 6.3 31.4 1.9 3.7 6.6Percentage attending high school in the South 40.2 6.4 31.2 1.8 -9.0 6.6Percentage attending high school in the West 17.9 4.7 16.4 1.5 -1.4 4.9Socioeconomic status 0.159 0.048 0.095 0.020 -0.064 0.052Percentage in bottom SES quartile 17.9 1.4 17.0 0.8 -1.0 1.6Percentage in lower-middle SES quartile 26.3 1.2 25.0 0.7 -1.2 1.4Percentage in upper-middle SES quartile 27.5 1.2 27.6 0.7 0.1 1.4Percentage in top SES quartile 28.3 2.4 30.4 1.1 2.1 2.6Grade 8 mathematics score 0.2 0.0 0.2 0.0 0.1 0.0Grade 8 reading score 0.2 0.0 0.2 0.0 0.0 0.0
Population of black children (N=1703) (N=1568)Percentage female 51.6 1.7 51.7 2.1 0.1 2.7Percentage attending high school in the Northeast 14.0 4.9 15.7 2.8 1.7 5.6Percentage attending high school in the Midwest 17.2 7.3 13.0 2.1 -4.2 7.6Percentage attending high school in the South 57.5 8.3 64.8 3.5 7.3 9.0Percentage attending high school in the West 11.3 4.0 6.5 1.3 -4.8 4.3Socioeconomic status -0.474 0.085 -0.387 0.041 0.086 0.094Percentage in bottom SES quartile 42.6 3.3 39.2 2.3 -3.4 4.0Percentage in lower-middle SES quartile 21.2 1.8 26.5 2.0 5.3 2.7 ** Percentage in upper-middle SES quartile 20.8 2.2 21.4 1.8 0.6 2.8Percentage in top SES quartile 15.5 2.2 12.9 2.0 -2.5 3.0Grade 8 mathematics score -0.3 0.1 -0.5 0.0 -0.2 0.1Grade 8 reading score -0.4 0.1 -0.5 0.0 0.0 0.1
Difference between black and white childrenPercentage female 3.5 2.0 1.8 2.2 -1.7 2.9Percentage attending high school in the Northeast -0.3 6.1 -5.3 3.2 -5.1 6.8Percentage attending high school in the Midwest -10.5 8.0 -18.3 2.6 -7.8 8.4Percentage attending high school in the South 17.3 8.9 33.6 3.6 16.3 9.5Percentage attending high school in the West -6.5 5.2 -9.9 1.9 -3.4 5.5Socioeconomic status -0.633 0.093 -0.483 0.044 0.150 0.102Percentage in bottom SES quartile 24.7 3.5 22.2 2.4 -2.4 4.2Percentage in lower-middle SES quartile -5.1 2.0 1.5 2.1 6.6 2.9 ** Percentage in upper-middle SES quartile -6.7 2.5 -6.2 1.9 0.4 3.2Percentage in top SES quartile -12.9 3.0 -17.5 2.2 -4.6 3.7Grade 8 mathematics score -0.5 0.1 -0.8 0.0 -0.3 0.1Grade 8 reading score -0.6 0.1 -0.7 0.0 0.0 0.1
** Difference-of-means between two groups is statistically significant at p<=.05.
NOTE: Standard errors have been adjusted for complex survey designs. Numbers may not sum to totals due to rounding. Sample sizes aresmaller than those reported in table A.2 because observations with a sampling weight of zero were excluded from the tabulations. Multipleimputation used to account for missing data.
SOURCE: U.S. Department of Education, Chapter 1 Prospects Study and National Educational Longitudinal Study of 1988.
Appendix C: Analysis Methodology 83
APPENDIX C.ANALYSISMETHODOLOGYI. APPROACH TO ESTIMATION
OF BLACK-WHITE DIFFERENCES IN OUTCOMES
Chapters 2, 3, and 4 involve the analysis of black-white differences in outcomes for indi-viduals similar in terms of prior educational achievement and/or other factors. In gen-eral, this approach involves estimating a series of linear regressions for the same set ofobservations, of the form:
OUTCOMEi=b11+b12*BLACKi+e1i (1)
where OUTCOMEi is the outcome value for student i (for example, growth in education-al achievement between two grades); BLACKi is a variable set equal to one if student i isblack and zero if student i is white; the b’s are individual parameters to be estimated; ande1i is an error term for student i.
For each of the five datasets containing imputed values, we estimated black-white dif-ferences in outcomes. Equation (1) estimates the difference of the outcome for blacksand whites (b12). This difference is compared with the black-white difference in the out-come for individuals with similar levels of prior educational achievement.
The propensity score approach described by Rosenbaum and Rubin (1984) and Rubin(1997) was used to account for prior educational achievement. Essentially, this methodaccounts for differences between two groups of individuals by classifying them into fivegroups, based on their propensity of being in the same group. Propensity scores wereused to classify each sample into five groups based on the likelihood of individuals beingblack. Separate logistic regressions of race on prior achievement and prior achievementsquared were estimated for males and females. The estimated propensity score isdefined as the predicted probability of being black from this logistic regression.Propensity score quintiles were identified from the weighted distribution of the propen-sity scores for whites, and blacks were placed in one of the five groups depending ontheir propensity scores. A linear regression of the outcome variable on race was fit sep-arately to data in each of the five groups:
OUTCOMEij=b21ij+b22ij*BLACKij+e2ij (2)
where j=1 to 5 indexes the 5 subgroups defined by propensity score quintiles. The black-white difference for the outcome in question, after adjusting for achievement, (b22) isestimated by the simple average of the five race coefficients b221 through b225. The vari-ance of this black-white difference was estimated as 1/25 of the sum of the variances of
84 Appendix C: Analysis Methodology
the five race coefficients (since the variance of the average of five independent coeffi-cients equals 1/25 of the sum of the variances of each coefficient).
Estimates of black-white differences for individuals with similar levels of prior achieve-ment plus similar levels of other factors were obtained in a similar fashion. Propensityscores were estimated from a logistic regression of race on prior achievement, priorachievement squared, and other factors. In the analysis of labor market outcomes, theother factors include educational attainment and work experience; in the analyses of edu-cational attainment and achievement outcomes, the other factors include parental socioe-conomic status (in both linear and quadratic terms) and census region of residence. Afterclassifying the sample into five subgroups on the basis of the propensity score quintiles,black-white differences were estimated for each subgroup using equation (3):
OUTCOMEi=b31k+b32k*BLACKi+e3ik (3)
where k=1 to 5 indexes the 5 subgroups defined by propensity score quintiles based onachievement and other factors. The overall estimate of black-white difference afteradjusting for achievement and other factors, b32, is the simple average of the five racecoefficients b321 through b325. The variance of this black-white difference was estimatedas 1/25 of the sum of the variances of the five race coefficients.
Two sorts of statistical tests were performed to analyze the black-white differences esti-mated in equations (1) through (3). First, t-tests were performed to see whether eachestimated black-white difference (b12, b22, and b32)—averaged across quintiles—wasstatistically different from zero. Next, tests were performed to see whether the additionof a particular set of variables to the outcome equation changed the estimate of black-white differences in outcomes. In particular, to test whether the addition of prior edu-cational achievement changes the estimated difference in outcomes, a test was per-formed to determine whether the difference (b22–b12) was significantly different fromzero. Following the work of Clogg, Petkova, and Cheng (1995), the unconditional vari-ance of (b22–b12), which we denote as s2
u(b22–b12), was estimated as follows:
s2u(b22–b12)=s2(b22)+s2(b12)–2s2(b12)*(MSE2/MSE1) (4)
where s2(b22) and s2(b12) are the variances of b22 and b12 , respectively, and MSE1 andMSE2 are the mean-squared errors from equations (1) and (2), respectively. MSE2 isestimated by calculating the variance of the residuals in each of the five propensity scoresubgroups and taking the simple average of the results. The variance estimate is uncon-ditional since it allows the predictor variables (for example, BLACK and ACHIEVE) toinclude random components (that is, it does not treat the predictor variables as fixed).
The use of the Clogg/Petkova/Cheng unconditional variance estimator placed certainconstraints on the estimation of equations predicting educational and economic out-comes. First, since the estimator was only provided for linear regression models, binaryoutcome equations were estimated as linear probability models rather than using pro-bit or logit maximum likelihood procedures. Second, because the estimator tests the dif-ference of individual regression coefficients only, outcome equations were estimatedpooling blacks and whites rather than separately by race. The test of black-white equal-ity in outcomes was therefore the test of black-white equality in the constant term inoutcome equations; other coefficients in these equations (such as those capturing the
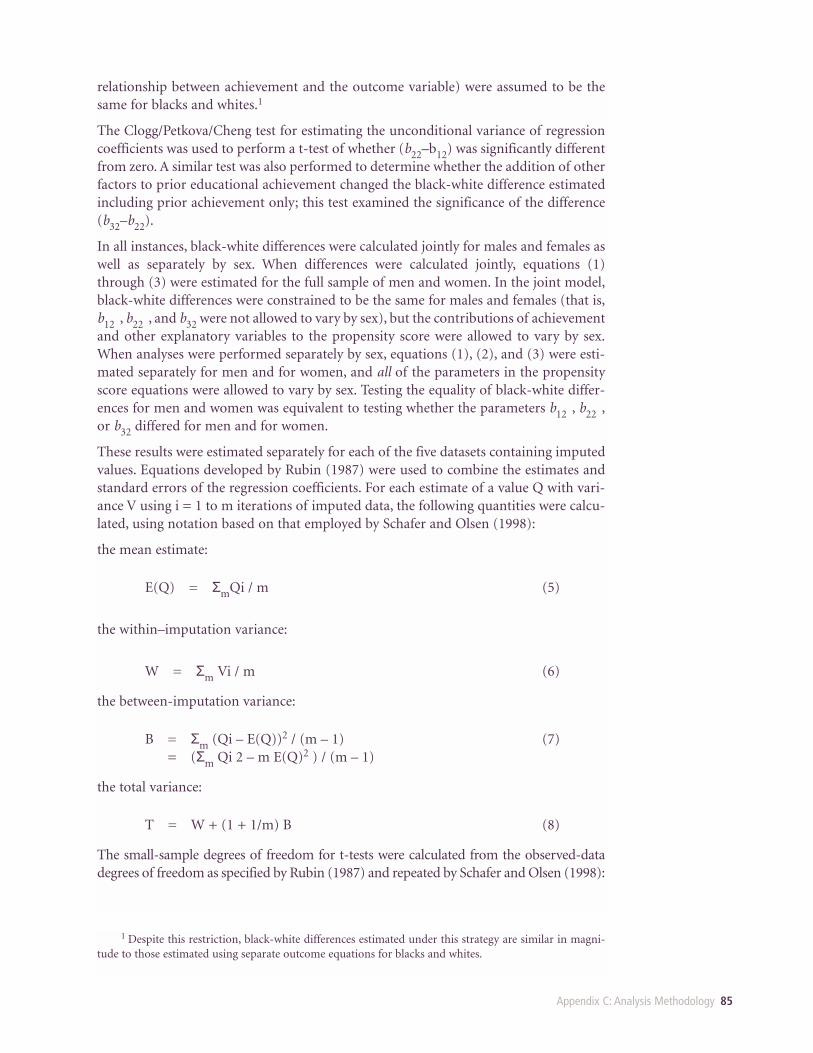
Appendix C: Analysis Methodology 85
relationship between achievement and the outcome variable) were assumed to be thesame for blacks and whites.1
The Clogg/Petkova/Cheng test for estimating the unconditional variance of regressioncoefficients was used to perform a t-test of whether (b22–b12) was significantly differentfrom zero. A similar test was also performed to determine whether the addition of otherfactors to prior educational achievement changed the black-white difference estimatedincluding prior achievement only; this test examined the significance of the difference(b32–b22).
In all instances, black-white differences were calculated jointly for males and females aswell as separately by sex. When differences were calculated jointly, equations (1)through (3) were estimated for the full sample of men and women. In the joint model,black-white differences were constrained to be the same for males and females (that is,b12 , b22 , and b32 were not allowed to vary by sex), but the contributions of achievementand other explanatory variables to the propensity score were allowed to vary by sex.When analyses were performed separately by sex, equations (1), (2), and (3) were esti-mated separately for men and for women, and all of the parameters in the propensityscore equations were allowed to vary by sex. Testing the equality of black-white differ-ences for men and women was equivalent to testing whether the parameters b12 , b22 ,or b32 differed for men and for women.
These results were estimated separately for each of the five datasets containing imputedvalues. Equations developed by Rubin (1987) were used to combine the estimates andstandard errors of the regression coefficients. For each estimate of a value Q with vari-ance V using i = 1 to m iterations of imputed data, the following quantities were calcu-lated, using notation based on that employed by Schafer and Olsen (1998):
the mean estimate:
E(Q) = ΣmQi / m (5)
the within–imputation variance:
W = Σm Vi / m (6)
the between-imputation variance:
B = Σm (Qi – E(Q))2 / (m – 1) (7)= (Σm Qi 2 – m E(Q)2 ) / (m – 1)
the total variance:
T = W + (1 + 1/m) B (8)
The small-sample degrees of freedom for t-tests were calculated from the observed-datadegrees of freedom as specified by Rubin (1987) and repeated by Schafer and Olsen (1998):
1 Despite this restriction, black-white differences estimated under this strategy are similar in magni-tude to those estimated using separate outcome equations for blacks and whites.
86 Appendix C: Analysis Methodology
dfO = (m – 1) [1 + mW / (m + 1) / B] 2 (9)
where m, W, and B are defined above.
Defining gamma as 1 / (1 + mW / (m+1) / B) we can see that
observed-data degrees of freedom: dfO = (m– 1)gamma –2 (10)
Following Barnard and Rubin (1999), the small-sample degrees of freedom (dfS) weredefined as:
dfS = dfC / (1 / lambda / (1 – gamma) + dfC / dfO) (11)
where dfC = the complete-data degrees of freedom and lambda = (dfC +1) / (dfC + 3).Significance tests were performed by comparing the ratio E(Q)/√ T to a Student’s t-distribution with degrees of freedom dfS.
II. EFFECTS OF SAMPLE SELECTION ON ESTIMATES OF BLACK-WHITE DIFFERENCES
The estimation of outcome equations did not include corrections for sample selectionbias. While selection bias arising from missing data was corrected for through multipleimputation, other selection bias arises from the definition of the outcome itself (forexample, college completion for the sample of college attendees, or earnings for indi-viduals with positive earnings). Sample selection models require the identification offactors influencing selection into the sample but not the outcome itself, and these fac-tors are typically difficult to isolate. As long as selection into a sample is random, esti-mated black-white differences should be similar to those differences for the populationas a whole. To the extent that selection into the sample is nonrandom, estimated black-white differences are valid in describing the population over which the estimationoccurs, and reflect black-white differences in selection into the sample.
III. EFFECTS OF MEASUREMENT ERROR ON ESTIMATES OF BLACK-WHITE DIFFERENCES
Because test scores are an imperfect measure of actual educational achievement, andSES values are an imperfect measure of actual socioeconomic status, it is likely thatmeasurement error affects the estimates of the propensity scores described above.However, it is unlikely that this measurement error has a large effect on estimated black-white differences. The propensity scoring method divides cases into subgroups on thebasis of their estimated propensity scores. Even though measurement error in educa-tional achievement and SES result in less precise estimates of the propensity scores, thisonly affects the estimation of black-white differences to the extent that it distorts therank order of the cases by the estimated propensity score. A few cases with propensityscores close to the subgroup cutoffs may be placed in the wrong subgroup, but other-wise the measurement error does not affect the estimation of black-white differences.
Appendix D: Sample Sizes and Standard Errors 87
APPENDIX D:SAMPLE SIZES ANDSTANDARD ERRORSFOR TABLES INCHAPTERS 2,3,AND 4This appendix presents tables of sample sizes and standard errors corresponding to theresults presented in chapters 2, 3, and 4. The standard errors were calculated account-ing for the sample designs of the datasets studied. In particular, adjustments were madefor the clustering of sample observations in the Primary Sampling Units (PSUs) includ-ed in each survey. The “linearization” approach was used, employing a first-order Taylorexpansion to estimate the variance of the parameters of each linear regression equa-tion.1 Because of limited information on the stratification of PSUs in the NLSY andProspects samples, no adjustments were made for stratification of PSUs (or of observa-tions within PSUs). However, comparison of standard errors in the NELS:88 samplewith adjustments for clustering only, and with adjustments for both clustering andstratification, indicated that adding adjustments for stratification increased sampledesign effects by no more than 0.2 percent, making it unlikely that the results of anyhypothesis tests would differ if stratification were accounted for.
1 Details of the estimation procedure used are discussed in the Stata Reference Manual, Release 5,Volume 3, P–Z, pp. 427–429.
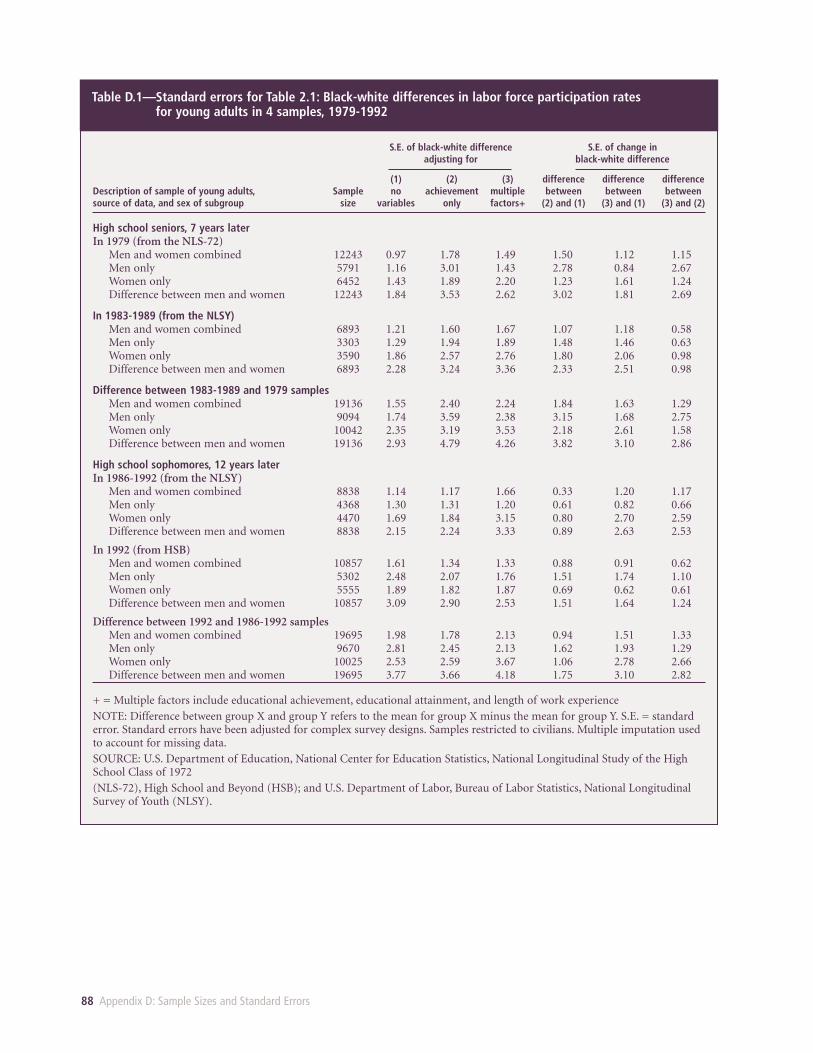
88 Appendix D: Sample Sizes and Standard Errors
Table D.1—Standard errors for Table 2.1: Black-white differences in labor force participation rates for young adults in 4 samples, 1979-1992
S.E. of black-white difference S.E. of change in adjusting for black-white difference
(1) (2) (3) difference difference differenceDescription of sample of young adults, Sample no achievement multiple between between betweensource of data, and sex of subgroup size variables only factors+ (2) and (1) (3) and (1) (3) and (2)
High school seniors, 7 years laterIn 1979 (from the NLS-72)
Men and women combined 12243 0.97 1.78 1.49 1.50 1.12 1.15Men only 5791 1.16 3.01 1.43 2.78 0.84 2.67Women only 6452 1.43 1.89 2.20 1.23 1.61 1.24Difference between men and women 12243 1.84 3.53 2.62 3.02 1.81 2.69
In 1983-1989 (from the NLSY)Men and women combined 6893 1.21 1.60 1.67 1.07 1.18 0.58Men only 3303 1.29 1.94 1.89 1.48 1.46 0.63Women only 3590 1.86 2.57 2.76 1.80 2.06 0.98Difference between men and women 6893 2.28 3.24 3.36 2.33 2.51 0.98
Difference between 1983-1989 and 1979 samplesMen and women combined 19136 1.55 2.40 2.24 1.84 1.63 1.29Men only 9094 1.74 3.59 2.38 3.15 1.68 2.75Women only 10042 2.35 3.19 3.53 2.18 2.61 1.58Difference between men and women 19136 2.93 4.79 4.26 3.82 3.10 2.86
High school sophomores, 12 years laterIn 1986-1992 (from the NLSY)
Men and women combined 8838 1.14 1.17 1.66 0.33 1.20 1.17Men only 4368 1.30 1.31 1.20 0.61 0.82 0.66Women only 4470 1.69 1.84 3.15 0.80 2.70 2.59Difference between men and women 8838 2.15 2.24 3.33 0.89 2.63 2.53
In 1992 (from HSB)Men and women combined 10857 1.61 1.34 1.33 0.88 0.91 0.62Men only 5302 2.48 2.07 1.76 1.51 1.74 1.10Women only 5555 1.89 1.82 1.87 0.69 0.62 0.61Difference between men and women 10857 3.09 2.90 2.53 1.51 1.64 1.24
Difference between 1992 and 1986-1992 samplesMen and women combined 19695 1.98 1.78 2.13 0.94 1.51 1.33Men only 9670 2.81 2.45 2.13 1.62 1.93 1.29Women only 10025 2.53 2.59 3.67 1.06 2.78 2.66Difference between men and women 19695 3.77 3.66 4.18 1.75 3.10 2.82
+ = Multiple factors include educational achievement, educational attainment, and length of work experience
NOTE: Difference between group X and group Y refers to the mean for group X minus the mean for group Y. S.E. = standarderror. Standard errors have been adjusted for complex survey designs. Samples restricted to civilians. Multiple imputation usedto account for missing data.
SOURCE: U.S. Department of Education, National Center for Education Statistics, National Longitudinal Study of the HighSchool Class of 1972
(NLS-72), High School and Beyond (HSB); and U.S. Department of Labor, Bureau of Labor Statistics, National LongitudinalSurvey of Youth (NLSY).
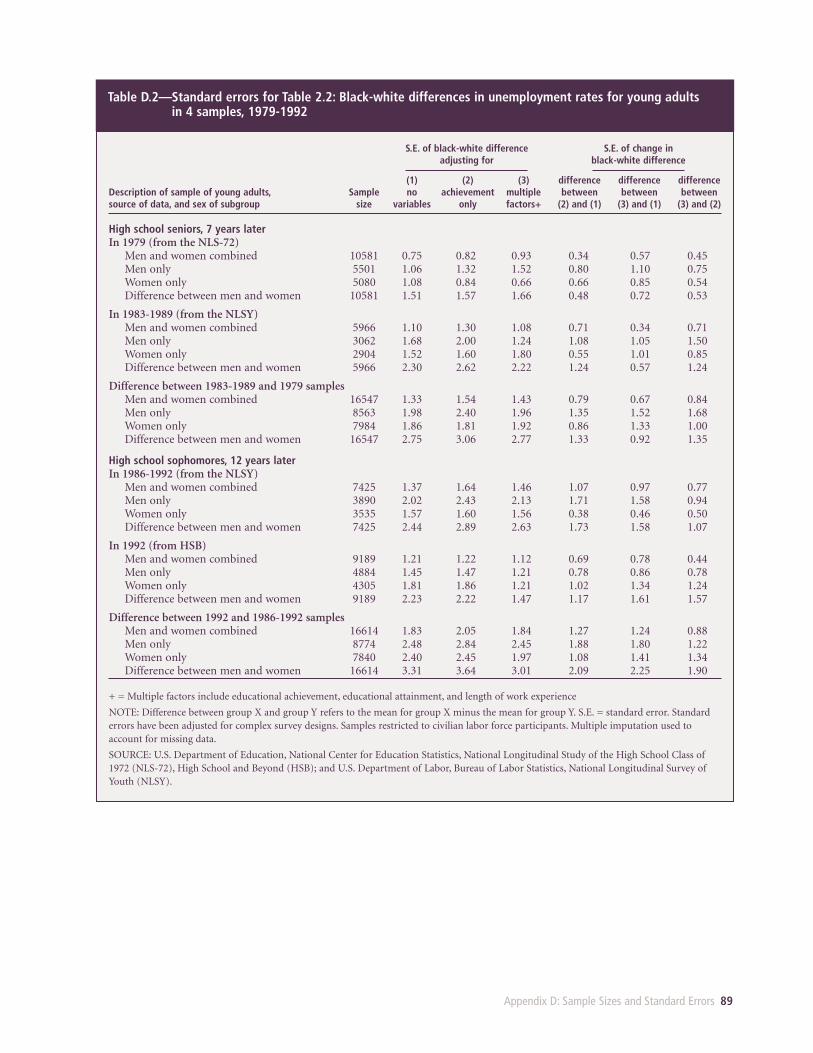
Appendix D: Sample Sizes and Standard Errors 89
Table D.2—Standard errors for Table 2.2: Black-white differences in unemployment rates for young adults in 4 samples, 1979-1992
S.E. of black-white difference S.E. of change in adjusting for black-white difference
(1) (2) (3) difference difference differenceDescription of sample of young adults, Sample no achievement multiple between between betweensource of data, and sex of subgroup size variables only factors+ (2) and (1) (3) and (1) (3) and (2)
High school seniors, 7 years laterIn 1979 (from the NLS-72)
Men and women combined 10581 0.75 0.82 0.93 0.34 0.57 0.45Men only 5501 1.06 1.32 1.52 0.80 1.10 0.75Women only 5080 1.08 0.84 0.66 0.66 0.85 0.54Difference between men and women 10581 1.51 1.57 1.66 0.48 0.72 0.53
In 1983-1989 (from the NLSY)Men and women combined 5966 1.10 1.30 1.08 0.71 0.34 0.71Men only 3062 1.68 2.00 1.24 1.08 1.05 1.50Women only 2904 1.52 1.60 1.80 0.55 1.01 0.85Difference between men and women 5966 2.30 2.62 2.22 1.24 0.57 1.24
Difference between 1983-1989 and 1979 samplesMen and women combined 16547 1.33 1.54 1.43 0.79 0.67 0.84Men only 8563 1.98 2.40 1.96 1.35 1.52 1.68Women only 7984 1.86 1.81 1.92 0.86 1.33 1.00Difference between men and women 16547 2.75 3.06 2.77 1.33 0.92 1.35
High school sophomores, 12 years laterIn 1986-1992 (from the NLSY)
Men and women combined 7425 1.37 1.64 1.46 1.07 0.97 0.77Men only 3890 2.02 2.43 2.13 1.71 1.58 0.94Women only 3535 1.57 1.60 1.56 0.38 0.46 0.50Difference between men and women 7425 2.44 2.89 2.63 1.73 1.58 1.07
In 1992 (from HSB)Men and women combined 9189 1.21 1.22 1.12 0.69 0.78 0.44Men only 4884 1.45 1.47 1.21 0.78 0.86 0.78Women only 4305 1.81 1.86 1.21 1.02 1.34 1.24Difference between men and women 9189 2.23 2.22 1.47 1.17 1.61 1.57
Difference between 1992 and 1986-1992 samplesMen and women combined 16614 1.83 2.05 1.84 1.27 1.24 0.88Men only 8774 2.48 2.84 2.45 1.88 1.80 1.22Women only 7840 2.40 2.45 1.97 1.08 1.41 1.34Difference between men and women 16614 3.31 3.64 3.01 2.09 2.25 1.90
+ = Multiple factors include educational achievement, educational attainment, and length of work experience
NOTE: Difference between group X and group Y refers to the mean for group X minus the mean for group Y. S.E. = standard error. Standarderrors have been adjusted for complex survey designs. Samples restricted to civilian labor force participants. Multiple imputation used toaccount for missing data.
SOURCE: U.S. Department of Education, National Center for Education Statistics, National Longitudinal Study of the High School Class of1972 (NLS-72), High School and Beyond (HSB); and U.S. Department of Labor, Bureau of Labor Statistics, National Longitudinal Survey ofYouth (NLSY).
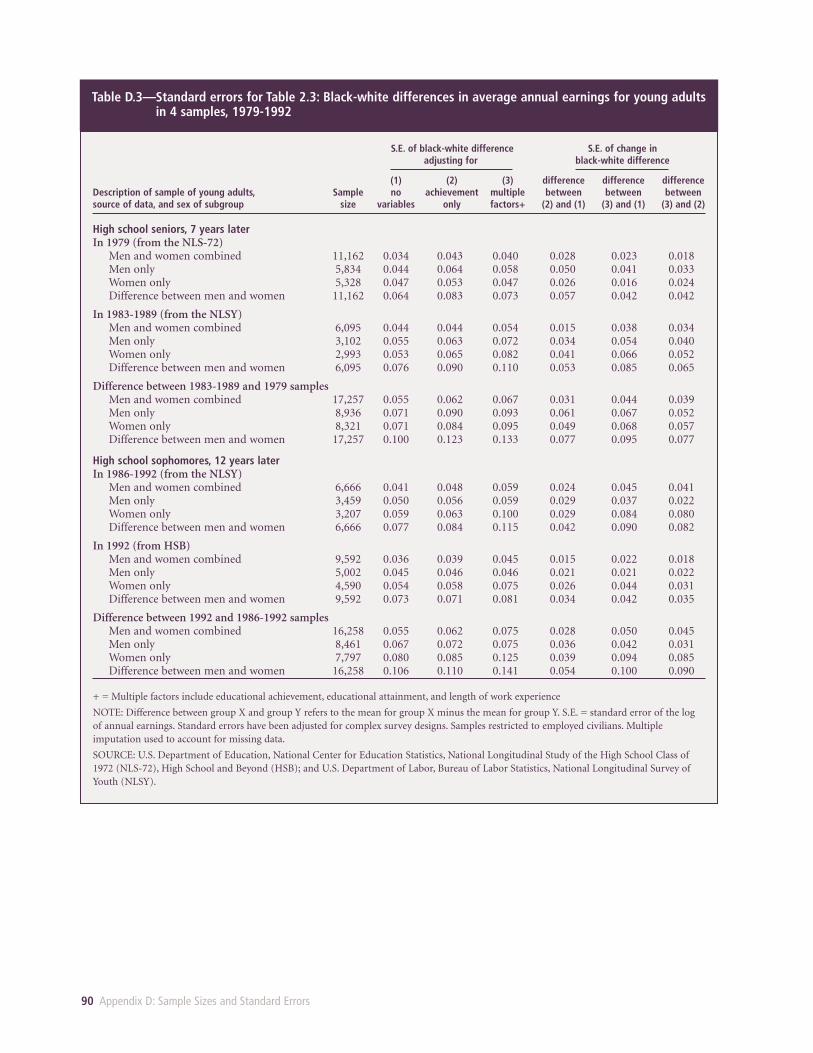
90 Appendix D: Sample Sizes and Standard Errors
Table D.3—Standard errors for Table 2.3: Black-white differences in average annual earnings for young adults in 4 samples, 1979-1992
S.E. of black-white difference S.E. of change inadjusting for black-white difference
(1) (2) (3) difference difference differenceDescription of sample of young adults, Sample no achievement multiple between between betweensource of data, and sex of subgroup size variables only factors+ (2) and (1) (3) and (1) (3) and (2)
High school seniors, 7 years laterIn 1979 (from the NLS-72)
Men and women combined 11,162 0.034 0.043 0.040 0.028 0.023 0.018Men only 5,834 0.044 0.064 0.058 0.050 0.041 0.033Women only 5,328 0.047 0.053 0.047 0.026 0.016 0.024Difference between men and women 11,162 0.064 0.083 0.073 0.057 0.042 0.042
In 1983-1989 (from the NLSY)Men and women combined 6,095 0.044 0.044 0.054 0.015 0.038 0.034Men only 3,102 0.055 0.063 0.072 0.034 0.054 0.040Women only 2,993 0.053 0.065 0.082 0.041 0.066 0.052Difference between men and women 6,095 0.076 0.090 0.110 0.053 0.085 0.065
Difference between 1983-1989 and 1979 samplesMen and women combined 17,257 0.055 0.062 0.067 0.031 0.044 0.039Men only 8,936 0.071 0.090 0.093 0.061 0.067 0.052Women only 8,321 0.071 0.084 0.095 0.049 0.068 0.057Difference between men and women 17,257 0.100 0.123 0.133 0.077 0.095 0.077
High school sophomores, 12 years laterIn 1986-1992 (from the NLSY)
Men and women combined 6,666 0.041 0.048 0.059 0.024 0.045 0.041Men only 3,459 0.050 0.056 0.059 0.029 0.037 0.022Women only 3,207 0.059 0.063 0.100 0.029 0.084 0.080Difference between men and women 6,666 0.077 0.084 0.115 0.042 0.090 0.082
In 1992 (from HSB)Men and women combined 9,592 0.036 0.039 0.045 0.015 0.022 0.018Men only 5,002 0.045 0.046 0.046 0.021 0.021 0.022Women only 4,590 0.054 0.058 0.075 0.026 0.044 0.031Difference between men and women 9,592 0.073 0.071 0.081 0.034 0.042 0.035
Difference between 1992 and 1986-1992 samplesMen and women combined 16,258 0.055 0.062 0.075 0.028 0.050 0.045Men only 8,461 0.067 0.072 0.075 0.036 0.042 0.031Women only 7,797 0.080 0.085 0.125 0.039 0.094 0.085Difference between men and women 16,258 0.106 0.110 0.141 0.054 0.100 0.090
+ = Multiple factors include educational achievement, educational attainment, and length of work experience
NOTE: Difference between group X and group Y refers to the mean for group X minus the mean for group Y. S.E. = standard error of the logof annual earnings. Standard errors have been adjusted for complex survey designs. Samples restricted to employed civilians. Multipleimputation used to account for missing data.
SOURCE: U.S. Department of Education, National Center for Education Statistics, National Longitudinal Study of the High School Class of1972 (NLS-72), High School and Beyond (HSB); and U.S. Department of Labor, Bureau of Labor Statistics, National Longitudinal Survey ofYouth (NLSY).
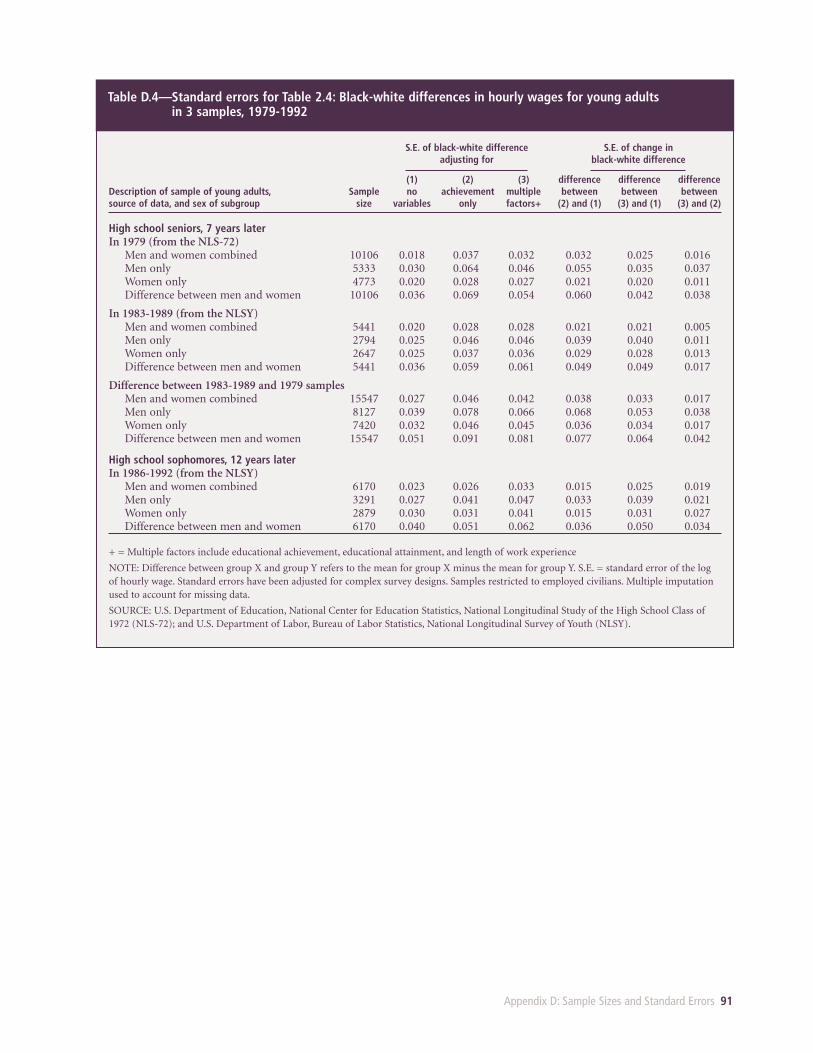
Appendix D: Sample Sizes and Standard Errors 91
Table D.4—Standard errors for Table 2.4: Black-white differences in hourly wages for young adults in 3 samples, 1979-1992
S.E. of black-white difference S.E. of change in adjusting for black-white difference
(1) (2) (3) difference difference differenceDescription of sample of young adults, Sample no achievement multiple between between betweensource of data, and sex of subgroup size variables only factors+ (2) and (1) (3) and (1) (3) and (2)
High school seniors, 7 years laterIn 1979 (from the NLS-72)
Men and women combined 10106 0.018 0.037 0.032 0.032 0.025 0.016Men only 5333 0.030 0.064 0.046 0.055 0.035 0.037Women only 4773 0.020 0.028 0.027 0.021 0.020 0.011Difference between men and women 10106 0.036 0.069 0.054 0.060 0.042 0.038
In 1983-1989 (from the NLSY)Men and women combined 5441 0.020 0.028 0.028 0.021 0.021 0.005Men only 2794 0.025 0.046 0.046 0.039 0.040 0.011Women only 2647 0.025 0.037 0.036 0.029 0.028 0.013Difference between men and women 5441 0.036 0.059 0.061 0.049 0.049 0.017
Difference between 1983-1989 and 1979 samplesMen and women combined 15547 0.027 0.046 0.042 0.038 0.033 0.017Men only 8127 0.039 0.078 0.066 0.068 0.053 0.038Women only 7420 0.032 0.046 0.045 0.036 0.034 0.017Difference between men and women 15547 0.051 0.091 0.081 0.077 0.064 0.042
High school sophomores, 12 years laterIn 1986-1992 (from the NLSY)
Men and women combined 6170 0.023 0.026 0.033 0.015 0.025 0.019Men only 3291 0.027 0.041 0.047 0.033 0.039 0.021Women only 2879 0.030 0.031 0.041 0.015 0.031 0.027Difference between men and women 6170 0.040 0.051 0.062 0.036 0.050 0.034
+ = Multiple factors include educational achievement, educational attainment, and length of work experience
NOTE: Difference between group X and group Y refers to the mean for group X minus the mean for group Y. S.E. = standard error of the logof hourly wage. Standard errors have been adjusted for complex survey designs. Samples restricted to employed civilians. Multiple imputationused to account for missing data.
SOURCE: U.S. Department of Education, National Center for Education Statistics, National Longitudinal Study of the High School Class of1972 (NLS-72); and U.S. Department of Labor, Bureau of Labor Statistics, National Longitudinal Survey of Youth (NLSY).
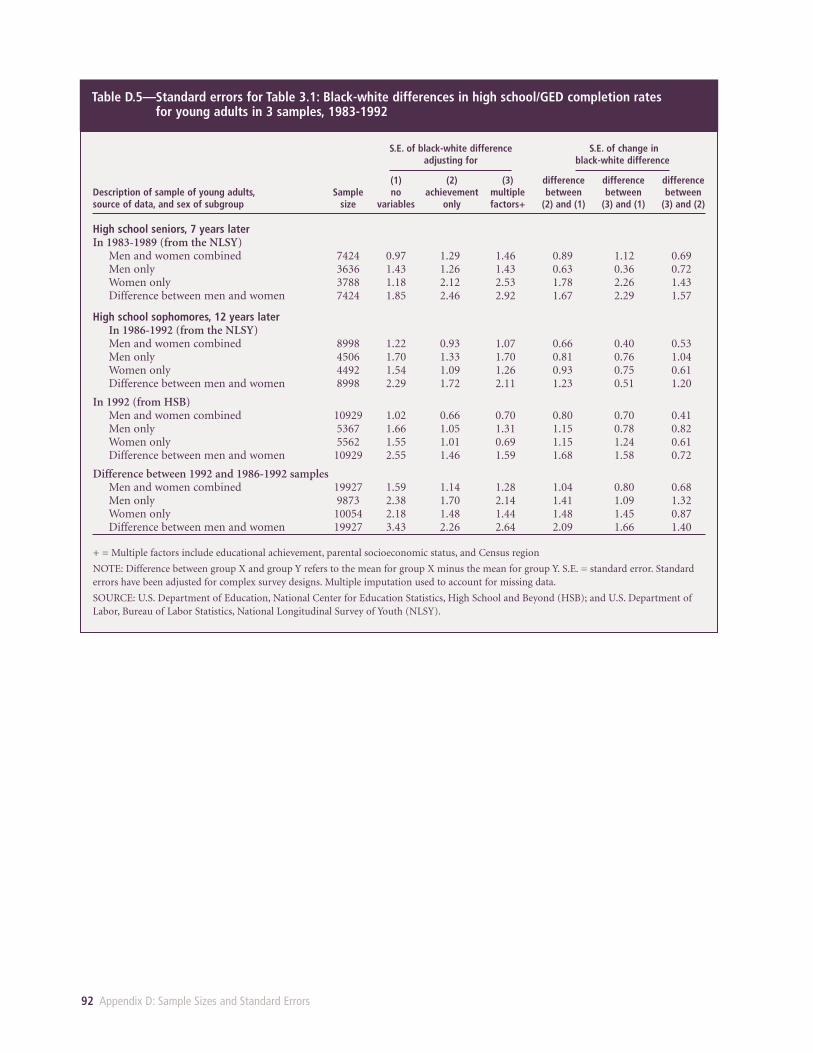
92 Appendix D: Sample Sizes and Standard Errors
Table D.5—Standard errors for Table 3.1: Black-white differences in high school/GED completion ratesfor young adults in 3 samples, 1983-1992
S.E. of black-white difference S.E. of change in adjusting for black-white difference
(1) (2) (3) difference difference differenceDescription of sample of young adults, Sample no achievement multiple between between betweensource of data, and sex of subgroup size variables only factors+ (2) and (1) (3) and (1) (3) and (2)
High school seniors, 7 years laterIn 1983-1989 (from the NLSY)
Men and women combined 7424 0.97 1.29 1.46 0.89 1.12 0.69Men only 3636 1.43 1.26 1.43 0.63 0.36 0.72Women only 3788 1.18 2.12 2.53 1.78 2.26 1.43Difference between men and women 7424 1.85 2.46 2.92 1.67 2.29 1.57
High school sophomores, 12 years laterIn 1986-1992 (from the NLSY)Men and women combined 8998 1.22 0.93 1.07 0.66 0.40 0.53Men only 4506 1.70 1.33 1.70 0.81 0.76 1.04Women only 4492 1.54 1.09 1.26 0.93 0.75 0.61Difference between men and women 8998 2.29 1.72 2.11 1.23 0.51 1.20
In 1992 (from HSB)Men and women combined 10929 1.02 0.66 0.70 0.80 0.70 0.41Men only 5367 1.66 1.05 1.31 1.15 0.78 0.82Women only 5562 1.55 1.01 0.69 1.15 1.24 0.61Difference between men and women 10929 2.55 1.46 1.59 1.68 1.58 0.72
Difference between 1992 and 1986-1992 samplesMen and women combined 19927 1.59 1.14 1.28 1.04 0.80 0.68Men only 9873 2.38 1.70 2.14 1.41 1.09 1.32Women only 10054 2.18 1.48 1.44 1.48 1.45 0.87Difference between men and women 19927 3.43 2.26 2.64 2.09 1.66 1.40
+ = Multiple factors include educational achievement, parental socioeconomic status, and Census region
NOTE: Difference between group X and group Y refers to the mean for group X minus the mean for group Y. S.E. = standard error. Standarderrors have been adjusted for complex survey designs. Multiple imputation used to account for missing data.
SOURCE: U.S. Department of Education, National Center for Education Statistics, High School and Beyond (HSB); and U.S. Department ofLabor, Bureau of Labor Statistics, National Longitudinal Survey of Youth (NLSY).
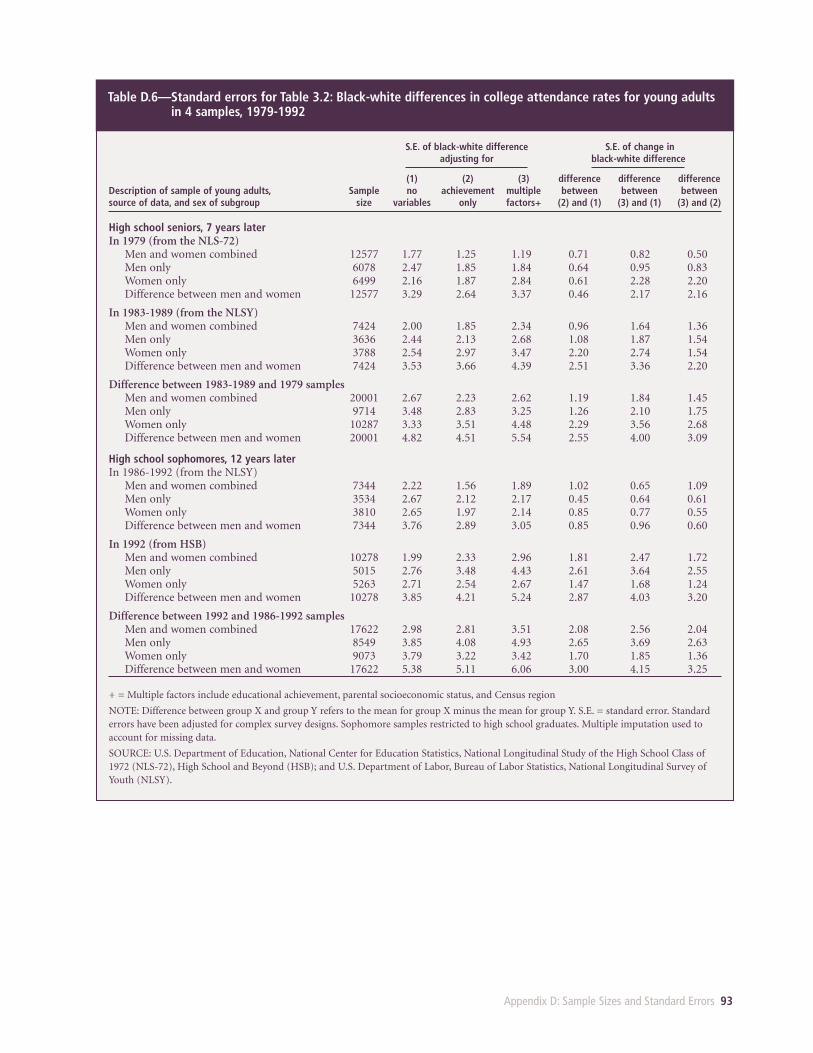
Appendix D: Sample Sizes and Standard Errors 93
Table D.6—Standard errors for Table 3.2: Black-white differences in college attendance rates for young adultsin 4 samples, 1979-1992
S.E. of black-white difference S.E. of change in adjusting for black-white difference
(1) (2) (3) difference difference differenceDescription of sample of young adults, Sample no achievement multiple between between betweensource of data, and sex of subgroup size variables only factors+ (2) and (1) (3) and (1) (3) and (2)
High school seniors, 7 years laterIn 1979 (from the NLS-72)
Men and women combined 12577 1.77 1.25 1.19 0.71 0.82 0.50Men only 6078 2.47 1.85 1.84 0.64 0.95 0.83Women only 6499 2.16 1.87 2.84 0.61 2.28 2.20Difference between men and women 12577 3.29 2.64 3.37 0.46 2.17 2.16
In 1983-1989 (from the NLSY)Men and women combined 7424 2.00 1.85 2.34 0.96 1.64 1.36Men only 3636 2.44 2.13 2.68 1.08 1.87 1.54Women only 3788 2.54 2.97 3.47 2.20 2.74 1.54Difference between men and women 7424 3.53 3.66 4.39 2.51 3.36 2.20
Difference between 1983-1989 and 1979 samplesMen and women combined 20001 2.67 2.23 2.62 1.19 1.84 1.45Men only 9714 3.48 2.83 3.25 1.26 2.10 1.75Women only 10287 3.33 3.51 4.48 2.29 3.56 2.68Difference between men and women 20001 4.82 4.51 5.54 2.55 4.00 3.09
High school sophomores, 12 years laterIn 1986-1992 (from the NLSY)
Men and women combined 7344 2.22 1.56 1.89 1.02 0.65 1.09Men only 3534 2.67 2.12 2.17 0.45 0.64 0.61Women only 3810 2.65 1.97 2.14 0.85 0.77 0.55Difference between men and women 7344 3.76 2.89 3.05 0.85 0.96 0.60
In 1992 (from HSB)Men and women combined 10278 1.99 2.33 2.96 1.81 2.47 1.72Men only 5015 2.76 3.48 4.43 2.61 3.64 2.55Women only 5263 2.71 2.54 2.67 1.47 1.68 1.24Difference between men and women 10278 3.85 4.21 5.24 2.87 4.03 3.20
Difference between 1992 and 1986-1992 samplesMen and women combined 17622 2.98 2.81 3.51 2.08 2.56 2.04Men only 8549 3.85 4.08 4.93 2.65 3.69 2.63Women only 9073 3.79 3.22 3.42 1.70 1.85 1.36Difference between men and women 17622 5.38 5.11 6.06 3.00 4.15 3.25
+ = Multiple factors include educational achievement, parental socioeconomic status, and Census region
NOTE: Difference between group X and group Y refers to the mean for group X minus the mean for group Y. S.E. = standard error. Standarderrors have been adjusted for complex survey designs. Sophomore samples restricted to high school graduates. Multiple imputation used toaccount for missing data.
SOURCE: U.S. Department of Education, National Center for Education Statistics, National Longitudinal Study of the High School Class of1972 (NLS-72), High School and Beyond (HSB); and U.S. Department of Labor, Bureau of Labor Statistics, National Longitudinal Survey ofYouth (NLSY).
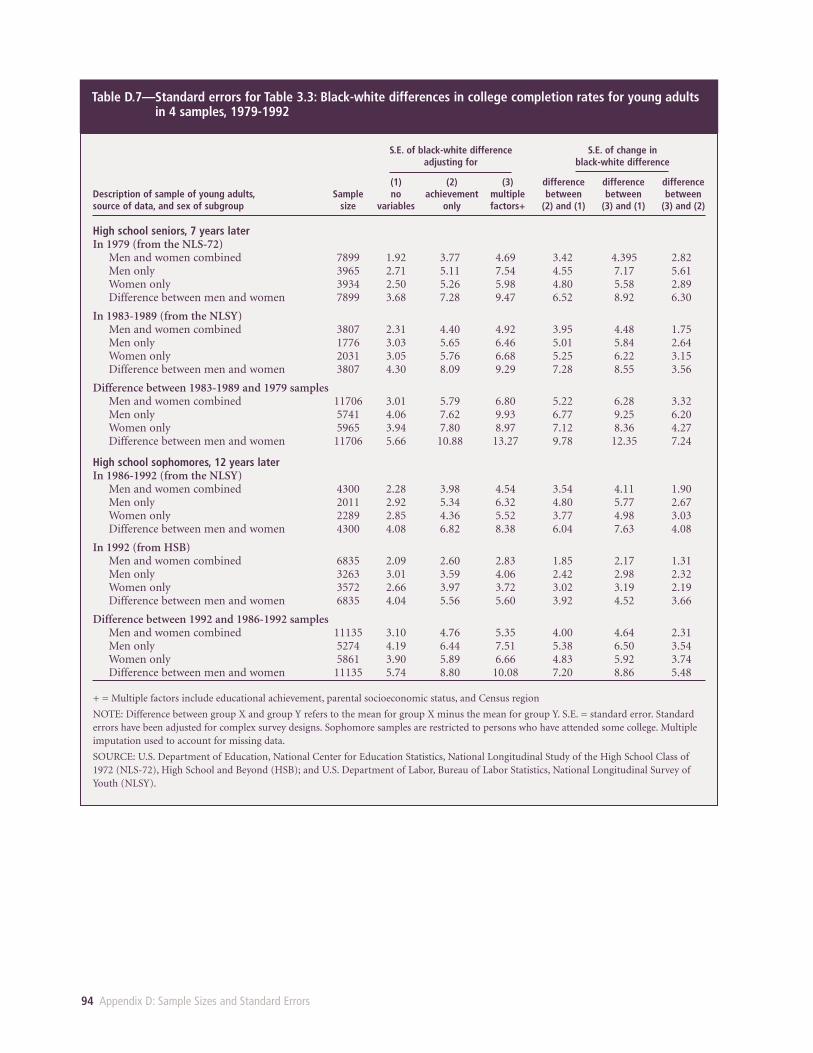
94 Appendix D: Sample Sizes and Standard Errors
Table D.7—Standard errors for Table 3.3: Black-white differences in college completion rates for young adultsin 4 samples, 1979-1992
S.E. of black-white difference S.E. of change in adjusting for black-white difference
(1) (2) (3) difference difference differenceDescription of sample of young adults, Sample no achievement multiple between between betweensource of data, and sex of subgroup size variables only factors+ (2) and (1) (3) and (1) (3) and (2)
High school seniors, 7 years laterIn 1979 (from the NLS-72)
Men and women combined 7899 1.92 3.77 4.69 3.42 4.395 2.82Men only 3965 2.71 5.11 7.54 4.55 7.17 5.61Women only 3934 2.50 5.26 5.98 4.80 5.58 2.89Difference between men and women 7899 3.68 7.28 9.47 6.52 8.92 6.30
In 1983-1989 (from the NLSY)Men and women combined 3807 2.31 4.40 4.92 3.95 4.48 1.75Men only 1776 3.03 5.65 6.46 5.01 5.84 2.64Women only 2031 3.05 5.76 6.68 5.25 6.22 3.15Difference between men and women 3807 4.30 8.09 9.29 7.28 8.55 3.56
Difference between 1983-1989 and 1979 samplesMen and women combined 11706 3.01 5.79 6.80 5.22 6.28 3.32Men only 5741 4.06 7.62 9.93 6.77 9.25 6.20Women only 5965 3.94 7.80 8.97 7.12 8.36 4.27Difference between men and women 11706 5.66 10.88 13.27 9.78 12.35 7.24
High school sophomores, 12 years laterIn 1986-1992 (from the NLSY)
Men and women combined 4300 2.28 3.98 4.54 3.54 4.11 1.90Men only 2011 2.92 5.34 6.32 4.80 5.77 2.67Women only 2289 2.85 4.36 5.52 3.77 4.98 3.03Difference between men and women 4300 4.08 6.82 8.38 6.04 7.63 4.08
In 1992 (from HSB)Men and women combined 6835 2.09 2.60 2.83 1.85 2.17 1.31Men only 3263 3.01 3.59 4.06 2.42 2.98 2.32Women only 3572 2.66 3.97 3.72 3.02 3.19 2.19Difference between men and women 6835 4.04 5.56 5.60 3.92 4.52 3.66
Difference between 1992 and 1986-1992 samplesMen and women combined 11135 3.10 4.76 5.35 4.00 4.64 2.31Men only 5274 4.19 6.44 7.51 5.38 6.50 3.54Women only 5861 3.90 5.89 6.66 4.83 5.92 3.74Difference between men and women 11135 5.74 8.80 10.08 7.20 8.86 5.48
+ = Multiple factors include educational achievement, parental socioeconomic status, and Census region
NOTE: Difference between group X and group Y refers to the mean for group X minus the mean for group Y. S.E. = standard error. Standarderrors have been adjusted for complex survey designs. Sophomore samples are restricted to persons who have attended some college. Multipleimputation used to account for missing data.
SOURCE: U.S. Department of Education, National Center for Education Statistics, National Longitudinal Study of the High School Class of1972 (NLS-72), High School and Beyond (HSB); and U.S. Department of Labor, Bureau of Labor Statistics, National Longitudinal Survey ofYouth (NLSY).
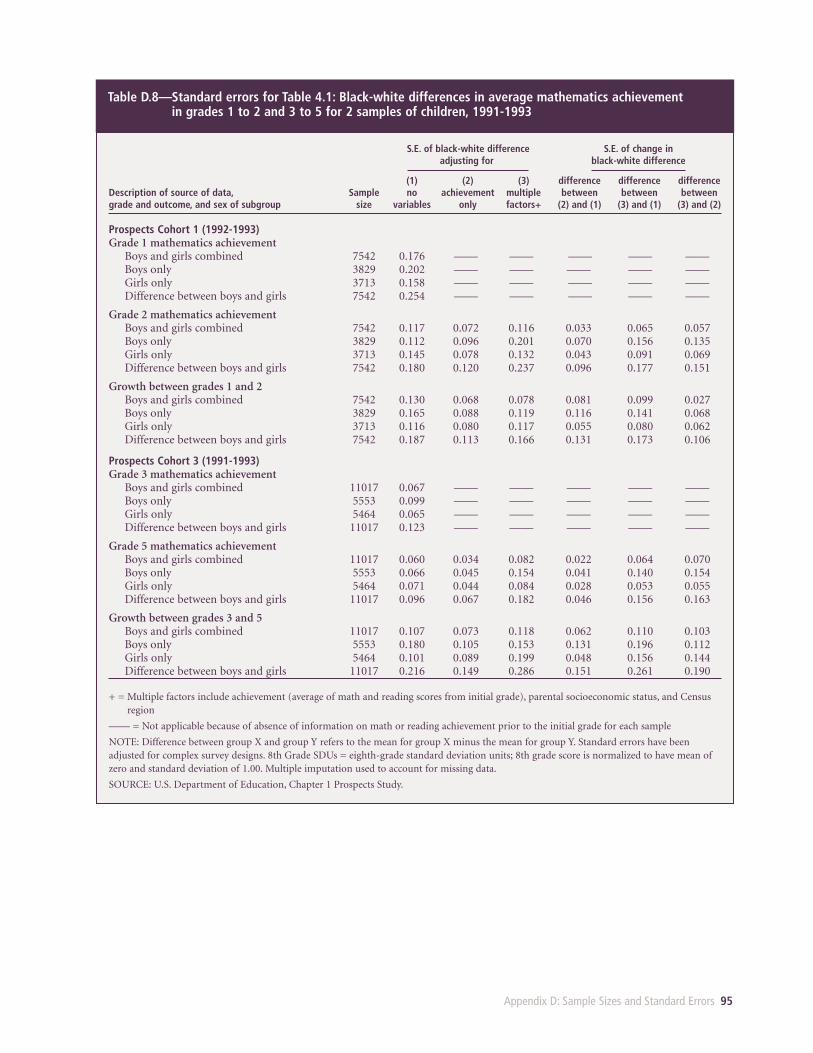
Appendix D: Sample Sizes and Standard Errors 95
Table D.8—Standard errors for Table 4.1: Black-white differences in average mathematics achievement in grades 1 to 2 and 3 to 5 for 2 samples of children, 1991-1993
S.E. of black-white difference S.E. of change in adjusting for black-white difference
(1) (2) (3) difference difference differenceDescription of source of data, Sample no achievement multiple between between betweengrade and outcome, and sex of subgroup size variables only factors+ (2) and (1) (3) and (1) (3) and (2)
Prospects Cohort 1 (1992-1993)Grade 1 mathematics achievement
Boys and girls combined 7542 0.176 —— —— —— —— —— Boys only 3829 0.202 —— —— —— —— —— Girls only 3713 0.158 —— —— —— —— —— Difference between boys and girls 7542 0.254 —— —— —— —— ——
Grade 2 mathematics achievementBoys and girls combined 7542 0.117 0.072 0.116 0.033 0.065 0.057Boys only 3829 0.112 0.096 0.201 0.070 0.156 0.135Girls only 3713 0.145 0.078 0.132 0.043 0.091 0.069Difference between boys and girls 7542 0.180 0.120 0.237 0.096 0.177 0.151
Growth between grades 1 and 2Boys and girls combined 7542 0.130 0.068 0.078 0.081 0.099 0.027Boys only 3829 0.165 0.088 0.119 0.116 0.141 0.068Girls only 3713 0.116 0.080 0.117 0.055 0.080 0.062Difference between boys and girls 7542 0.187 0.113 0.166 0.131 0.173 0.106
Prospects Cohort 3 (1991-1993)Grade 3 mathematics achievement
Boys and girls combined 11017 0.067 —— —— —— —— —— Boys only 5553 0.099 —— —— —— —— —— Girls only 5464 0.065 —— —— —— —— —— Difference between boys and girls 11017 0.123 —— —— —— —— ——
Grade 5 mathematics achievementBoys and girls combined 11017 0.060 0.034 0.082 0.022 0.064 0.070Boys only 5553 0.066 0.045 0.154 0.041 0.140 0.154Girls only 5464 0.071 0.044 0.084 0.028 0.053 0.055Difference between boys and girls 11017 0.096 0.067 0.182 0.046 0.156 0.163
Growth between grades 3 and 5Boys and girls combined 11017 0.107 0.073 0.118 0.062 0.110 0.103Boys only 5553 0.180 0.105 0.153 0.131 0.196 0.112Girls only 5464 0.101 0.089 0.199 0.048 0.156 0.144Difference between boys and girls 11017 0.216 0.149 0.286 0.151 0.261 0.190
+ = Multiple factors include achievement (average of math and reading scores from initial grade), parental socioeconomic status, and Censusregion
—— = Not applicable because of absence of information on math or reading achievement prior to the initial grade for each sample
NOTE: Difference between group X and group Y refers to the mean for group X minus the mean for group Y. Standard errors have beenadjusted for complex survey designs. 8th Grade SDUs = eighth-grade standard deviation units; 8th grade score is normalized to have mean ofzero and standard deviation of 1.00. Multiple imputation used to account for missing data.
SOURCE: U.S. Department of Education, Chapter 1 Prospects Study.
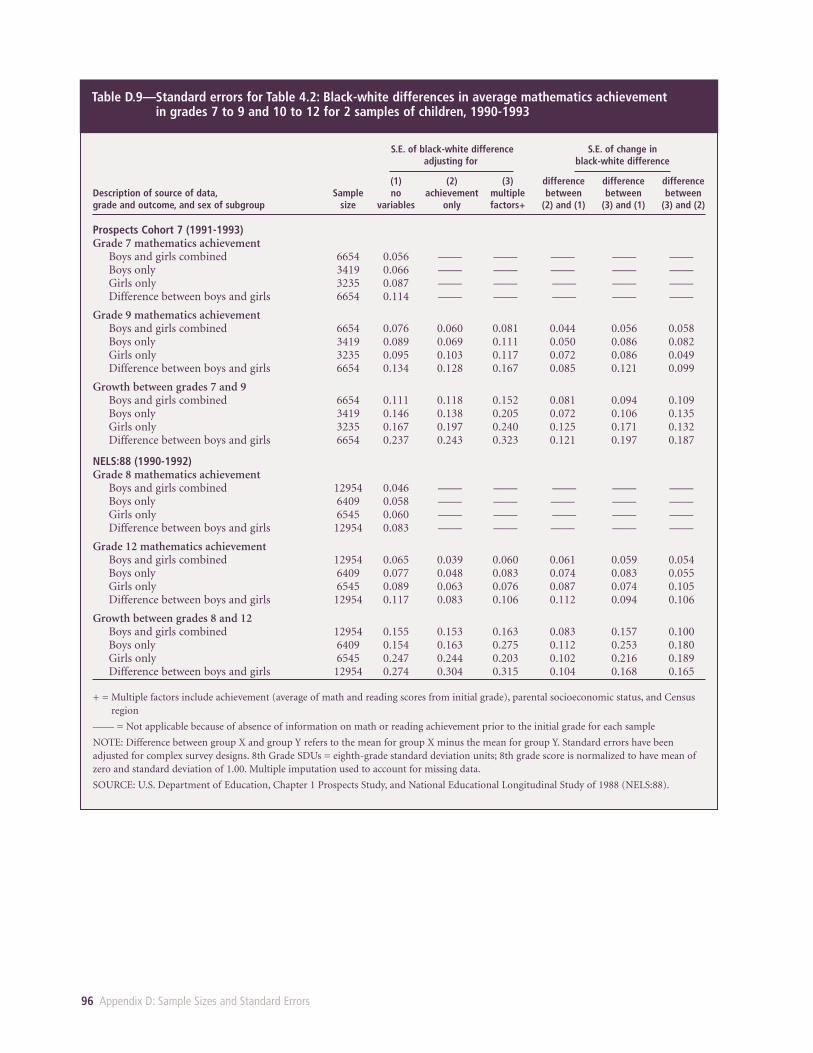
96 Appendix D: Sample Sizes and Standard Errors
Table D.9—Standard errors for Table 4.2: Black-white differences in average mathematics achievement in grades 7 to 9 and 10 to 12 for 2 samples of children, 1990-1993
S.E. of black-white difference S.E. of change in adjusting for black-white difference
(1) (2) (3) difference difference differenceDescription of source of data, Sample no achievement multiple between between betweengrade and outcome, and sex of subgroup size variables only factors+ (2) and (1) (3) and (1) (3) and (2)
Prospects Cohort 7 (1991-1993)Grade 7 mathematics achievement
Boys and girls combined 6654 0.056 —— —— —— —— —— Boys only 3419 0.066 —— —— —— —— —— Girls only 3235 0.087 —— —— —— —— —— Difference between boys and girls 6654 0.114 —— —— —— —— ——
Grade 9 mathematics achievementBoys and girls combined 6654 0.076 0.060 0.081 0.044 0.056 0.058Boys only 3419 0.089 0.069 0.111 0.050 0.086 0.082Girls only 3235 0.095 0.103 0.117 0.072 0.086 0.049Difference between boys and girls 6654 0.134 0.128 0.167 0.085 0.121 0.099
Growth between grades 7 and 9Boys and girls combined 6654 0.111 0.118 0.152 0.081 0.094 0.109Boys only 3419 0.146 0.138 0.205 0.072 0.106 0.135Girls only 3235 0.167 0.197 0.240 0.125 0.171 0.132Difference between boys and girls 6654 0.237 0.243 0.323 0.121 0.197 0.187
NELS:88 (1990-1992)Grade 8 mathematics achievement
Boys and girls combined 12954 0.046 —— —— —— —— —— Boys only 6409 0.058 —— —— —— —— —— Girls only 6545 0.060 —— —— —— —— —— Difference between boys and girls 12954 0.083 —— —— —— —— ——
Grade 12 mathematics achievementBoys and girls combined 12954 0.065 0.039 0.060 0.061 0.059 0.054Boys only 6409 0.077 0.048 0.083 0.074 0.083 0.055Girls only 6545 0.089 0.063 0.076 0.087 0.074 0.105Difference between boys and girls 12954 0.117 0.083 0.106 0.112 0.094 0.106
Growth between grades 8 and 12Boys and girls combined 12954 0.155 0.153 0.163 0.083 0.157 0.100Boys only 6409 0.154 0.163 0.275 0.112 0.253 0.180Girls only 6545 0.247 0.244 0.203 0.102 0.216 0.189Difference between boys and girls 12954 0.274 0.304 0.315 0.104 0.168 0.165
+ = Multiple factors include achievement (average of math and reading scores from initial grade), parental socioeconomic status, and Censusregion
—— = Not applicable because of absence of information on math or reading achievement prior to the initial grade for each sample
NOTE: Difference between group X and group Y refers to the mean for group X minus the mean for group Y. Standard errors have beenadjusted for complex survey designs. 8th Grade SDUs = eighth-grade standard deviation units; 8th grade score is normalized to have mean ofzero and standard deviation of 1.00. Multiple imputation used to account for missing data.
SOURCE: U.S. Department of Education, Chapter 1 Prospects Study, and National Educational Longitudinal Study of 1988 (NELS:88).
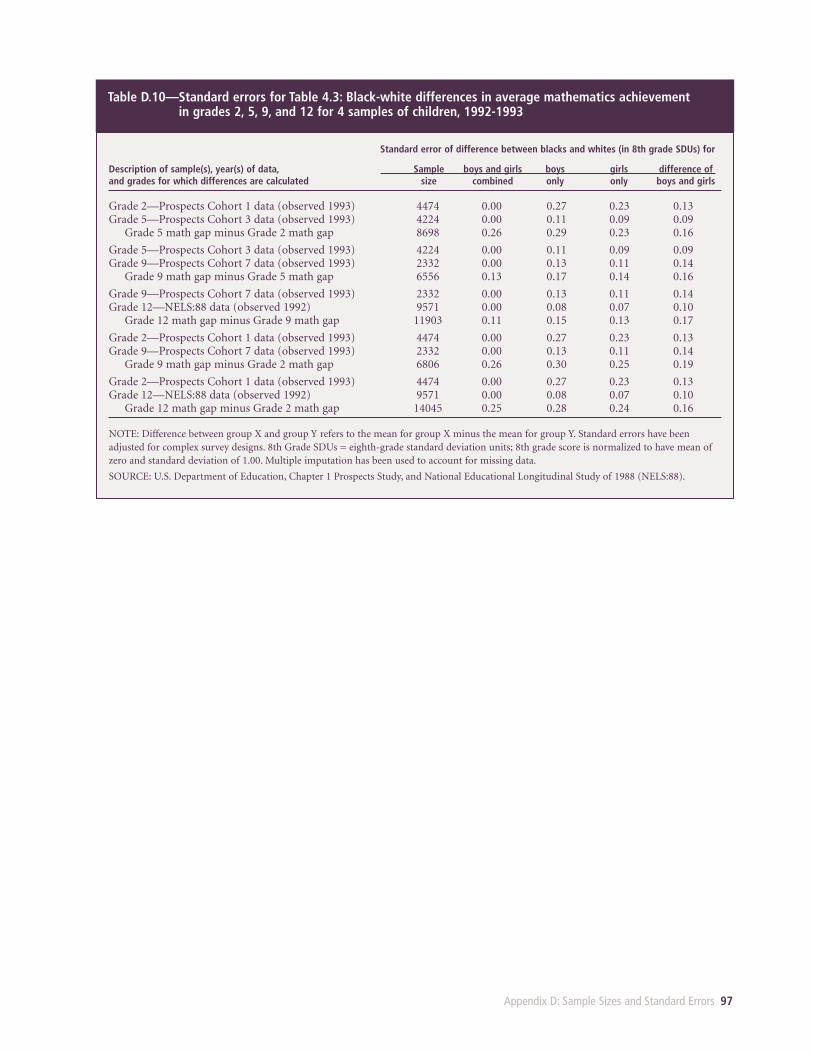
Appendix D: Sample Sizes and Standard Errors 97
Table D.10—Standard errors for Table 4.3: Black-white differences in average mathematics achievement in grades 2, 5, 9, and 12 for 4 samples of children, 1992-1993
Standard error of difference between blacks and whites (in 8th grade SDUs) for
Description of sample(s), year(s) of data, Sample boys and girls boys girls difference ofand grades for which differences are calculated size combined only only boys and girls
Grade 2—Prospects Cohort 1 data (observed 1993) 4474 0.00 0.27 0.23 0.13Grade 5—Prospects Cohort 3 data (observed 1993) 4224 0.00 0.11 0.09 0.09
Grade 5 math gap minus Grade 2 math gap 8698 0.26 0.29 0.23 0.16
Grade 5—Prospects Cohort 3 data (observed 1993) 4224 0.00 0.11 0.09 0.09Grade 9—Prospects Cohort 7 data (observed 1993) 2332 0.00 0.13 0.11 0.14
Grade 9 math gap minus Grade 5 math gap 6556 0.13 0.17 0.14 0.16
Grade 9—Prospects Cohort 7 data (observed 1993) 2332 0.00 0.13 0.11 0.14Grade 12—NELS:88 data (observed 1992) 9571 0.00 0.08 0.07 0.10
Grade 12 math gap minus Grade 9 math gap 11903 0.11 0.15 0.13 0.17
Grade 2—Prospects Cohort 1 data (observed 1993) 4474 0.00 0.27 0.23 0.13Grade 9—Prospects Cohort 7 data (observed 1993) 2332 0.00 0.13 0.11 0.14
Grade 9 math gap minus Grade 2 math gap 6806 0.26 0.30 0.25 0.19
Grade 2—Prospects Cohort 1 data (observed 1993) 4474 0.00 0.27 0.23 0.13Grade 12—NELS:88 data (observed 1992) 9571 0.00 0.08 0.07 0.10
Grade 12 math gap minus Grade 2 math gap 14045 0.25 0.28 0.24 0.16
NOTE: Difference between group X and group Y refers to the mean for group X minus the mean for group Y. Standard errors have beenadjusted for complex survey designs. 8th Grade SDUs = eighth-grade standard deviation units; 8th grade score is normalized to have mean ofzero and standard deviation of 1.00. Multiple imputation has been used to account for missing data.
SOURCE: U.S. Department of Education, Chapter 1 Prospects Study, and National Educational Longitudinal Study of 1988 (NELS:88).
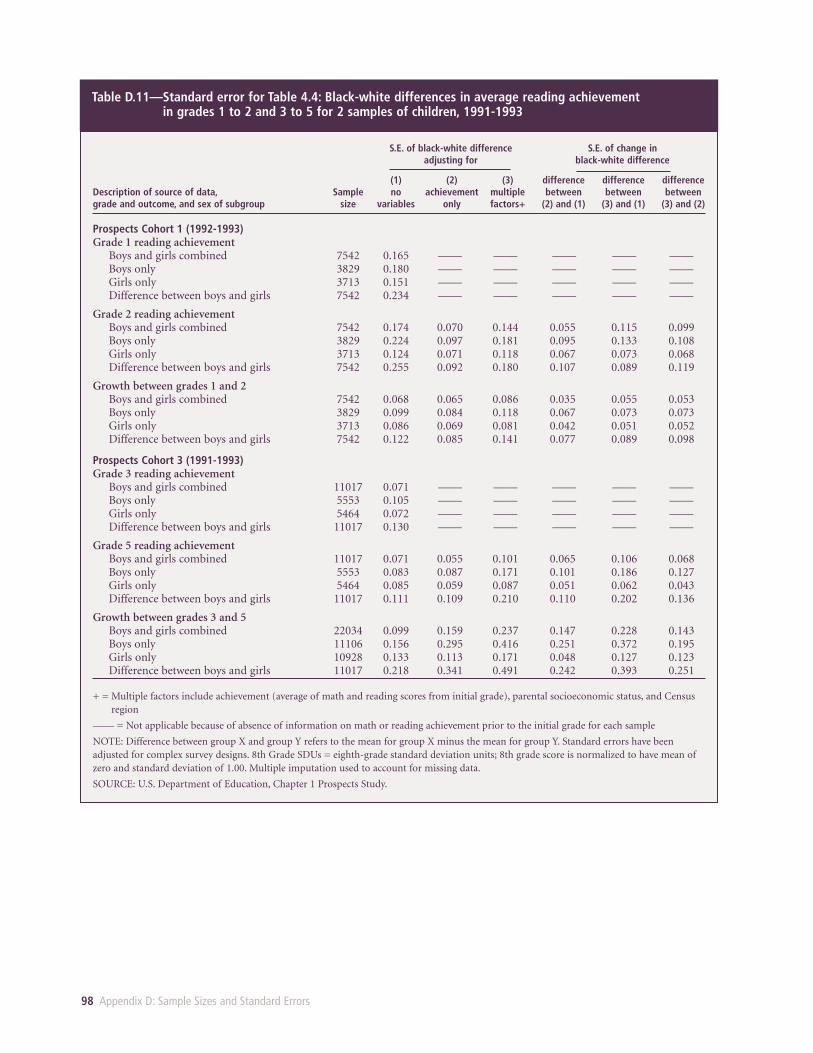
98 Appendix D: Sample Sizes and Standard Errors
Table D.11—Standard error for Table 4.4: Black-white differences in average reading achievement in grades 1 to 2 and 3 to 5 for 2 samples of children, 1991-1993
S.E. of black-white difference S.E. of change in adjusting for black-white difference
(1) (2) (3) difference difference differenceDescription of source of data, Sample no achievement multiple between between betweengrade and outcome, and sex of subgroup size variables only factors+ (2) and (1) (3) and (1) (3) and (2)
Prospects Cohort 1 (1992-1993)Grade 1 reading achievement
Boys and girls combined 7542 0.165 —— —— —— —— —— Boys only 3829 0.180 —— —— —— —— —— Girls only 3713 0.151 —— —— —— —— —— Difference between boys and girls 7542 0.234 —— —— —— —— ——
Grade 2 reading achievementBoys and girls combined 7542 0.174 0.070 0.144 0.055 0.115 0.099Boys only 3829 0.224 0.097 0.181 0.095 0.133 0.108Girls only 3713 0.124 0.071 0.118 0.067 0.073 0.068Difference between boys and girls 7542 0.255 0.092 0.180 0.107 0.089 0.119
Growth between grades 1 and 2Boys and girls combined 7542 0.068 0.065 0.086 0.035 0.055 0.053Boys only 3829 0.099 0.084 0.118 0.067 0.073 0.073Girls only 3713 0.086 0.069 0.081 0.042 0.051 0.052Difference between boys and girls 7542 0.122 0.085 0.141 0.077 0.089 0.098
Prospects Cohort 3 (1991-1993)Grade 3 reading achievement
Boys and girls combined 11017 0.071 —— —— —— —— —— Boys only 5553 0.105 —— —— —— —— —— Girls only 5464 0.072 —— —— —— —— —— Difference between boys and girls 11017 0.130 —— —— —— —— ——
Grade 5 reading achievementBoys and girls combined 11017 0.071 0.055 0.101 0.065 0.106 0.068Boys only 5553 0.083 0.087 0.171 0.101 0.186 0.127Girls only 5464 0.085 0.059 0.087 0.051 0.062 0.043Difference between boys and girls 11017 0.111 0.109 0.210 0.110 0.202 0.136
Growth between grades 3 and 5Boys and girls combined 22034 0.099 0.159 0.237 0.147 0.228 0.143Boys only 11106 0.156 0.295 0.416 0.251 0.372 0.195Girls only 10928 0.133 0.113 0.171 0.048 0.127 0.123Difference between boys and girls 11017 0.218 0.341 0.491 0.242 0.393 0.251
+ = Multiple factors include achievement (average of math and reading scores from initial grade), parental socioeconomic status, and Censusregion
—— = Not applicable because of absence of information on math or reading achievement prior to the initial grade for each sample
NOTE: Difference between group X and group Y refers to the mean for group X minus the mean for group Y. Standard errors have beenadjusted for complex survey designs. 8th Grade SDUs = eighth-grade standard deviation units; 8th grade score is normalized to have mean ofzero and standard deviation of 1.00. Multiple imputation used to account for missing data.
SOURCE: U.S. Department of Education, Chapter 1 Prospects Study.
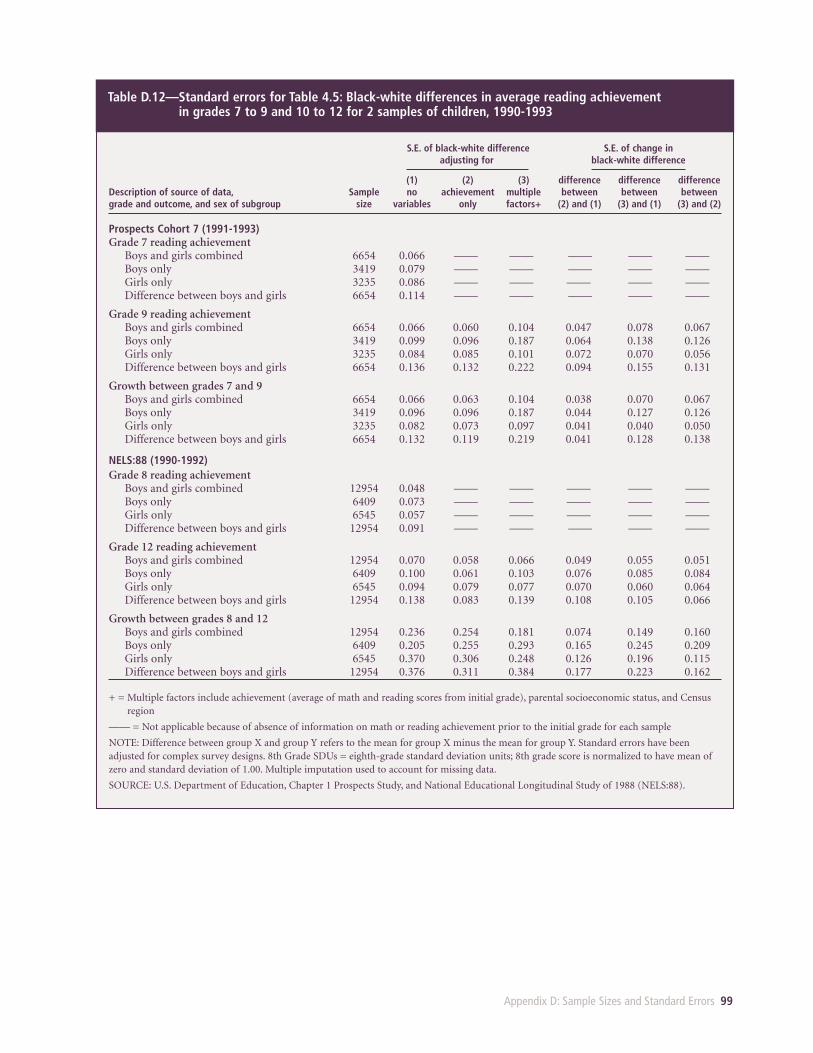
Appendix D: Sample Sizes and Standard Errors 99
Table D.12—Standard errors for Table 4.5: Black-white differences in average reading achievement in grades 7 to 9 and 10 to 12 for 2 samples of children, 1990-1993
S.E. of black-white difference S.E. of change in adjusting for black-white difference
(1) (2) (3) difference difference differenceDescription of source of data, Sample no achievement multiple between between betweengrade and outcome, and sex of subgroup size variables only factors+ (2) and (1) (3) and (1) (3) and (2)
Prospects Cohort 7 (1991-1993)Grade 7 reading achievement
Boys and girls combined 6654 0.066 —— —— —— —— —— Boys only 3419 0.079 —— —— —— —— —— Girls only 3235 0.086 —— —— —— —— —— Difference between boys and girls 6654 0.114 —— —— —— —— ——
Grade 9 reading achievementBoys and girls combined 6654 0.066 0.060 0.104 0.047 0.078 0.067Boys only 3419 0.099 0.096 0.187 0.064 0.138 0.126Girls only 3235 0.084 0.085 0.101 0.072 0.070 0.056Difference between boys and girls 6654 0.136 0.132 0.222 0.094 0.155 0.131
Growth between grades 7 and 9Boys and girls combined 6654 0.066 0.063 0.104 0.038 0.070 0.067Boys only 3419 0.096 0.096 0.187 0.044 0.127 0.126Girls only 3235 0.082 0.073 0.097 0.041 0.040 0.050Difference between boys and girls 6654 0.132 0.119 0.219 0.041 0.128 0.138
NELS:88 (1990-1992)Grade 8 reading achievement
Boys and girls combined 12954 0.048 —— —— —— —— —— Boys only 6409 0.073 —— —— —— —— —— Girls only 6545 0.057 —— —— —— —— —— Difference between boys and girls 12954 0.091 —— —— —— —— ——
Grade 12 reading achievementBoys and girls combined 12954 0.070 0.058 0.066 0.049 0.055 0.051Boys only 6409 0.100 0.061 0.103 0.076 0.085 0.084Girls only 6545 0.094 0.079 0.077 0.070 0.060 0.064Difference between boys and girls 12954 0.138 0.083 0.139 0.108 0.105 0.066
Growth between grades 8 and 12Boys and girls combined 12954 0.236 0.254 0.181 0.074 0.149 0.160Boys only 6409 0.205 0.255 0.293 0.165 0.245 0.209Girls only 6545 0.370 0.306 0.248 0.126 0.196 0.115Difference between boys and girls 12954 0.376 0.311 0.384 0.177 0.223 0.162
+ = Multiple factors include achievement (average of math and reading scores from initial grade), parental socioeconomic status, and Censusregion
—— = Not applicable because of absence of information on math or reading achievement prior to the initial grade for each sample
NOTE: Difference between group X and group Y refers to the mean for group X minus the mean for group Y. Standard errors have beenadjusted for complex survey designs. 8th Grade SDUs = eighth-grade standard deviation units; 8th grade score is normalized to have mean ofzero and standard deviation of 1.00. Multiple imputation used to account for missing data.
SOURCE: U.S. Department of Education, Chapter 1 Prospects Study, and National Educational Longitudinal Study of 1988 (NELS:88).
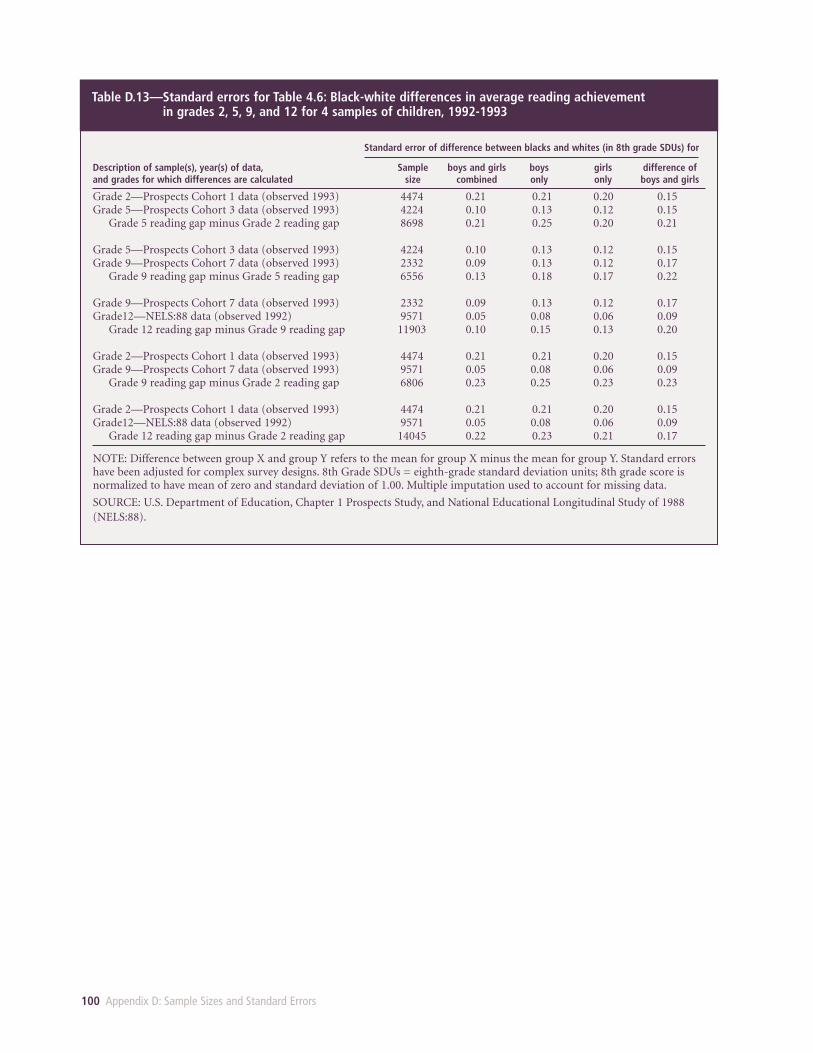
100 Appendix D: Sample Sizes and Standard Errors
Table D.13—Standard errors for Table 4.6: Black-white differences in average reading achievement in grades 2, 5, 9, and 12 for 4 samples of children, 1992-1993
Standard error of difference between blacks and whites (in 8th grade SDUs) for
Description of sample(s), year(s) of data, Sample boys and girls boys girls difference ofand grades for which differences are calculated size combined only only boys and girls
Grade 2—Prospects Cohort 1 data (observed 1993) 4474 0.21 0.21 0.20 0.15 Grade 5—Prospects Cohort 3 data (observed 1993) 4224 0.10 0.13 0.12 0.15
Grade 5 reading gap minus Grade 2 reading gap 8698 0.21 0.25 0.20 0.21
Grade 5—Prospects Cohort 3 data (observed 1993) 4224 0.10 0.13 0.12 0.15 Grade 9—Prospects Cohort 7 data (observed 1993) 2332 0.09 0.13 0.12 0.17
Grade 9 reading gap minus Grade 5 reading gap 6556 0.13 0.18 0.17 0.22
Grade 9—Prospects Cohort 7 data (observed 1993) 2332 0.09 0.13 0.12 0.17 Grade12—NELS:88 data (observed 1992) 9571 0.05 0.08 0.06 0.09
Grade 12 reading gap minus Grade 9 reading gap 11903 0.10 0.15 0.13 0.20
Grade 2—Prospects Cohort 1 data (observed 1993) 4474 0.21 0.21 0.20 0.15 Grade 9—Prospects Cohort 7 data (observed 1993) 9571 0.05 0.08 0.06 0.09
Grade 9 reading gap minus Grade 2 reading gap 6806 0.23 0.25 0.23 0.23
Grade 2—Prospects Cohort 1 data (observed 1993) 4474 0.21 0.21 0.20 0.15 Grade12—NELS:88 data (observed 1992) 9571 0.05 0.08 0.06 0.09
Grade 12 reading gap minus Grade 2 reading gap 14045 0.22 0.23 0.21 0.17
NOTE: Difference between group X and group Y refers to the mean for group X minus the mean for group Y. Standard errorshave been adjusted for complex survey designs. 8th Grade SDUs = eighth-grade standard deviation units; 8th grade score isnormalized to have mean of zero and standard deviation of 1.00. Multiple imputation used to account for missing data.
SOURCE: U.S. Department of Education, Chapter 1 Prospects Study, and National Educational Longitudinal Study of 1988(NELS:88).
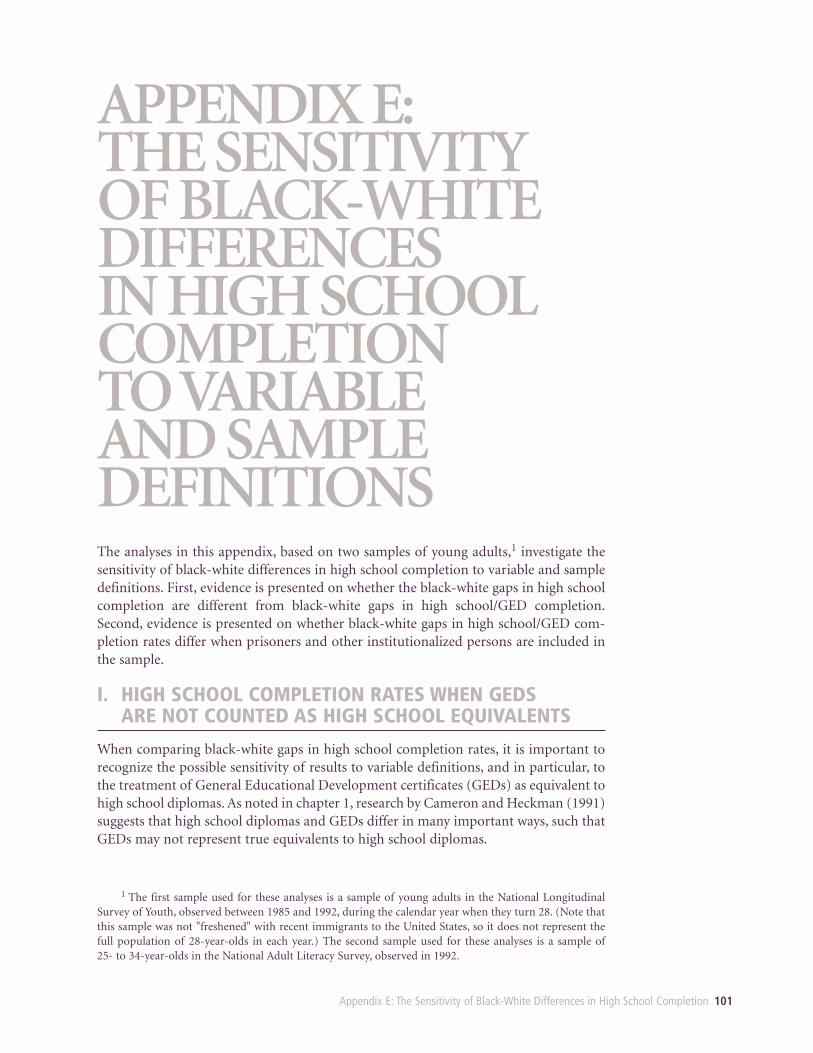
Appendix E: The Sensitivity of Black-White Differences in High School Completion 101
APPENDIX E:THE SENSITIVITYOF BLACK-WHITEDIFFERENCES IN HIGH SCHOOLCOMPLETION TO VARIABLE AND SAMPLEDEFINITIONSThe analyses in this appendix, based on two samples of young adults,1 investigate thesensitivity of black-white differences in high school completion to variable and sampledefinitions. First, evidence is presented on whether the black-white gaps in high schoolcompletion are different from black-white gaps in high school/GED completion.Second, evidence is presented on whether black-white gaps in high school/GED com-pletion rates differ when prisoners and other institutionalized persons are included inthe sample.
I. HIGH SCHOOL COMPLETION RATES WHEN GEDS ARE NOT COUNTED AS HIGH SCHOOL EQUIVALENTS
When comparing black-white gaps in high school completion rates, it is important torecognize the possible sensitivity of results to variable definitions, and in particular, tothe treatment of General Educational Development certificates (GEDs) as equivalent tohigh school diplomas. As noted in chapter 1, research by Cameron and Heckman (1991)suggests that high school diplomas and GEDs differ in many important ways, such thatGEDs may not represent true equivalents to high school diplomas.
1 The first sample used for these analyses is a sample of young adults in the National LongitudinalSurvey of Youth, observed between 1985 and 1992, during the calendar year when they turn 28. (Note thatthis sample was not "freshened" with recent immigrants to the United States, so it does not represent thefull population of 28-year-olds in each year.) The second sample used for these analyses is a sample of25- to 34-year-olds in the National Adult Literacy Survey, observed in 1992.
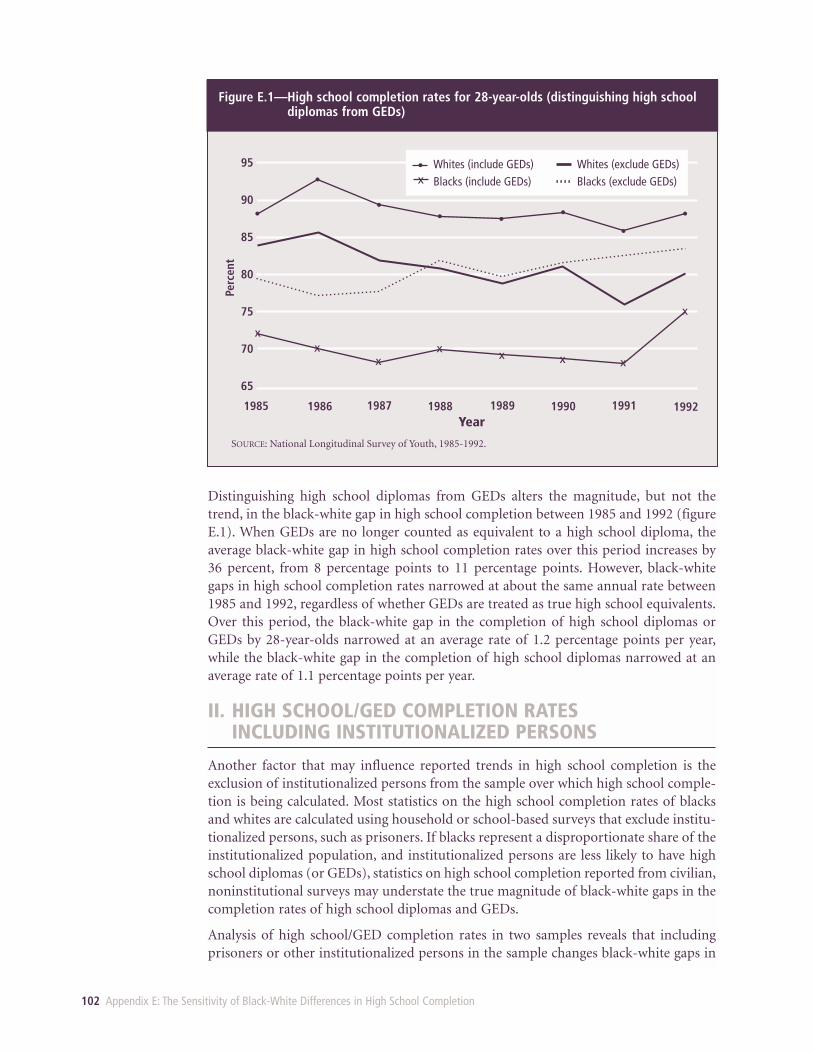
102 Appendix E: The Sensitivity of Black-White Differences in High School Completion
Distinguishing high school diplomas from GEDs alters the magnitude, but not thetrend, in the black-white gap in high school completion between 1985 and 1992 (figureE.1). When GEDs are no longer counted as equivalent to a high school diploma, theaverage black-white gap in high school completion rates over this period increases by 36 percent, from 8 percentage points to 11 percentage points. However, black-whitegaps in high school completion rates narrowed at about the same annual rate between1985 and 1992, regardless of whether GEDs are treated as true high school equivalents.Over this period, the black-white gap in the completion of high school diplomas orGEDs by 28-year-olds narrowed at an average rate of 1.2 percentage points per year,while the black-white gap in the completion of high school diplomas narrowed at anaverage rate of 1.1 percentage points per year.
II. HIGH SCHOOL/GED COMPLETION RATES INCLUDING INSTITUTIONALIZED PERSONS
Another factor that may influence reported trends in high school completion is theexclusion of institutionalized persons from the sample over which high school comple-tion is being calculated. Most statistics on the high school completion rates of blacksand whites are calculated using household or school-based surveys that exclude institu-tionalized persons, such as prisoners. If blacks represent a disproportionate share of theinstitutionalized population, and institutionalized persons are less likely to have highschool diplomas (or GEDs), statistics on high school completion reported from civilian,noninstitutional surveys may understate the true magnitude of black-white gaps in thecompletion rates of high school diplomas and GEDs.
Analysis of high school/GED completion rates in two samples reveals that includingprisoners or other institutionalized persons in the sample changes black-white gaps in
Figure E.1—High school completion rates for 28-year-olds (distinguishing high schooldiplomas from GEDs)
95
90
85
80
75
70
65
Perc
ent
Year1985 19921986 1987 1988 1989 1990 1991
x
xx x x x x
x
Whites (include GEDs) Whites (exclude GEDs)Blacks (include GEDs) Blacks (exclude GEDs)x
SOURCE: National Longitudinal Survey of Youth, 1985-1992.
Appendix E: The Sensitivity of Black-White Differences in High School Completion 103
high school/GED completion rates by very little. While black youth and young adultsare more likely than white youth and young adults to be incarcerated, and prisoners areless likely than nonprisoners to have high school diplomas or GEDs, the proportion ofthe black population that is in prison is about 5 percent for 16- to 24-year-old blacksand about 6 percent for 25- to 34-year-old blacks. Because prisoners represent only asmall fraction of the total population, the black-white gap in high school/GED comple-tion rate is about the same (11 percentage points for 16- to 24-year-olds and 12 per-centage points for 25- to 34-year olds), regardless of whether prisoners are included inthe sample.
Including prisoners and other institutionalized persons in the sample does little to altertrends in black-white differences in high school/GED completion between 1985 and1992 (figure E.2). Between these two years, the black-white gap in high school/GEDcompletion rates of 28-year-olds narrowed at a rate of approximately 1.2 percentagepoints per year for the noninstitutionalized population, and at a rate of approximately8.0 percentage points per year for the institutionalized population. While these tworates are noticeably different, the fact that institutionalized persons represent a smallfraction of the overall population means that the rate of convergence in the highschool/GED completion rates of all 28-year-old blacks and whites was about the sameas for the non-institutionalized population only: 1.2 percentage points per year.
Figure E.2—High school/GED completion rates for 28-year-olds (with and withoutinstitutionalized persons)
95
90
85
80
75
70
65
Perc
ent
Year1985 19921986 1987 1988 1989 1990 1991
Whites (noninst.) Whites (all)Blacks (noninst.) Blacks (all)x
SOURCE: National Longitudinal Survey of Youth, 1985-1992.
xx x
xx
x x x

United StatesDepartment of Education
ED Pubs8242-B Sandy Court
Jessup, MD 20794-1398
Official BusinessPenalty for Private Use, $300
Postage and Fees PaidU.S. Department of Education
Permit No. G–17
Standard Mail (A)