Embed Size (px)
Citation preview
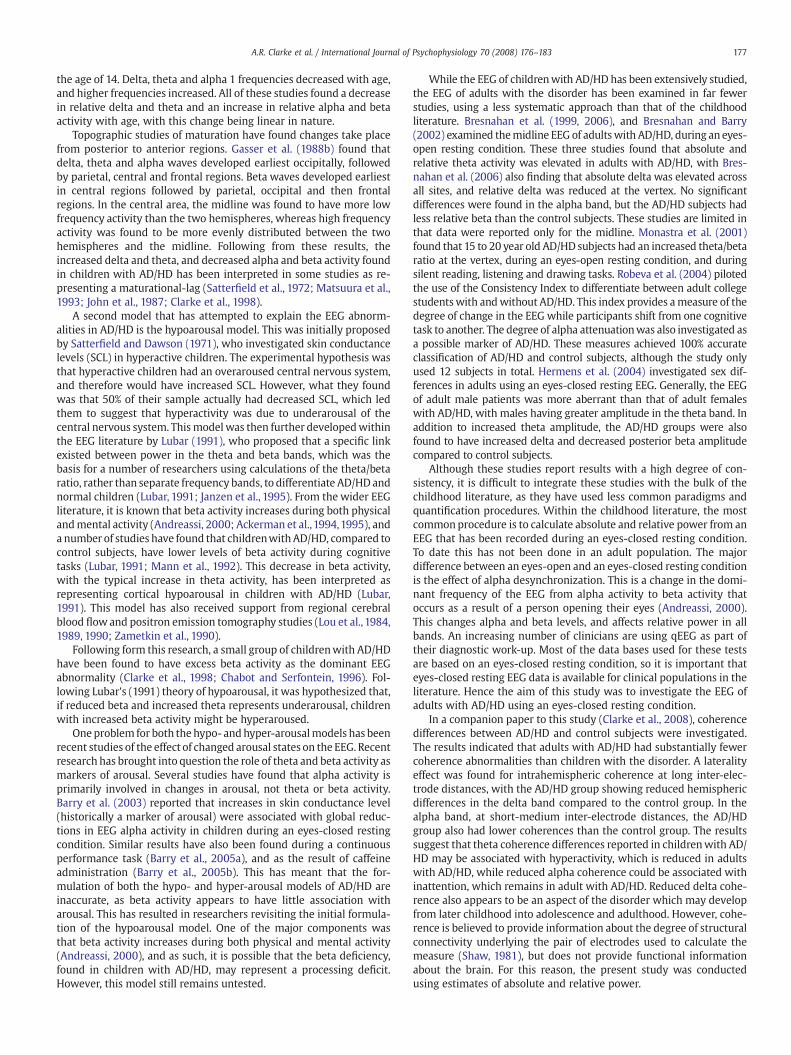
International Journal of Psychophysiology 70 (2008) 176–183
Contents lists available at ScienceDirect
International Journal of Psychophysiology
j ourna l homepage: www.e lsev ie r.com/ locate / i jpsycho
EEG in adults with Attention-Deficit/Hyperactivity Disorder
Adam R. Clarke a,b,⁎, Robert J. Barry a,b, Patrick C.L. Heaven a, Rory McCarthy c,Mark Selikowitz c, Mitchell K. Byrne a
a School of Psychology, University of Wollongong, Wollongong 2522, Australiab Brain & Behaviour Research Institute, University of Wollongong, Wollongong 2522, Australiac Sydney Developmental Clinic, 6/30 Carrington St. Sydney 2000, Australia
⁎ Corresponding author. School of Psychology, Univegong 2522, Australia. Tel.: +61 2 4221 5775; fax: +61 2 4
E-mail address: [email protected] (A.R. Clarke).
0167-8760/$ – see front matter © 2008 Published by Edoi:10.1016/j.ijpsycho.2008.07.001
A B S T R A C T
A R T I C L E I N F OArticle history:
Attention-Deficit/Hyperactiv Received 7 April 2008Received in revised form 11 June 2008Accepted 3 July 2008Available online 9 July 2008Keywords:Attention-Deficit/Hyperactivity DisorderAD/HDAdultsEEG
ity Disorder (AD/HD) is the most common psychiatric disorder of childhood, butit is becoming increasingly apparent that more than half the childhood sufferers will continue to manifestsymptoms of the disorder as adults. While the EEG of children with AD/HD has been extensively examined,comparatively little research has been conducted into the EEG of adults with the disorder. This study thusinvestigated the EEG of 20 adult males with AD/HD, and an age- and gender-matched control group, duringan eyes-closed resting condition. The EEG was Fourier transformed to provide absolute and relative powerestimates for the delta, theta, alpha and beta bands. The AD/HD group had significantly less absolute deltaand more relative theta, across the entire scalp, than the control group. In absolute beta, the AD/HD grouphad less power at the midline, and an enhancement in power in the right posterior region. These results aresimilar to those found in children with AD/HD, and may suggest the presence of a processing deficit. A rightposterior elevation in beta activity was also found, which could be related to the ongoing presence of readingdisabilities in these subjects.
© 2008 Published by Elsevier B.V.
1. Introduction
Attention-Deficit/Hyperactivity Disorder (AD/HD) is one of themost common psychiatric conditions of childhood, affecting between4% and 6% of school-age children (Lindgren et al., 1990; Pelham et al.,1992; APA, 1994). However, it is becoming increasingly recognizedthat while AD/HD might have its origins in childhood, between 40%and 70% of those individuals with childhood AD/HD will continue tosuffer the disorder as adults (Bellak and Black, 1992).
The EEG of children with AD/HD has been extensively studied.Those studies typically report that children with the disorder haveincreased theta activity, which is often maximal in the frontal regions(Satterfield et al., 1972; Janzen et al., 1995; Chabot and Serfontein,1996; Lazzaro et al., 1998; Clarke et al., 1998, 2001a,c; Barry et al.,2003), increased posterior delta (Matousek et al., 1984; Clarke et al.,1998, 2001a,c) and decreased alpha and beta activity (Dykman et al.,1982; Callaway et al., 1983; Barry et al., 2003), also most apparent inthe posterior regions (Clarke et al., 1998, 2001a,c; Lazzaro et al., 1998;Barry et al., 2003).
These EEG abnormalities have been interpreted as representing anumber of different dysfunctions. One model in the literature is thematurational-lag model, which proposes that AD/HD results from a
rsity of Wollongong, Wollon-221 4163.
lsevier B.V.
developmental lag in CNS functioning. Children with AD/HD are de-velopmentally inappropriate for their age, but act in a way that wouldbe normal in younger children (Kinsbourne, 1973). From an electro-physiological perspective, for this model to be accurate, their EEGmeasures would need to be considered as normal in younger children.
With normal maturation, EEG frequencies increase as a function ofage, with slow wave activity apparently being replaced by fasterwaveforms (Matousek and Petersen, 1973; Matthis et al., 1980). Johnet al. (1980) developed 32 linear regression equations predicting thefrequency composition of the EEG as a function of age. The resultsindicated that development of the normal EEG was linear in nature.Benninger et al. (1984), in a longitudinal study of 96 boys and girls,found that theta activity decreased as alpha increased and that thespeed of change in occipital areas was almost twice that of centralareas. Gasser et al. (1988a) found that certain regions of the brainmatured before other regions. Absolute power in delta, theta andalpha 1 frequency bands was found to decrease and amplitudes be-came similar with age. The decline was found to be greatest in poste-rior regions. Frontally, delta and theta amplitudes were found todevelop in parallel, whereas theta dominated delta in all other areas.Alpha activity showed a strong posterior increase. At frontal andcentral regions, the increase started later and remained small. All betaactivity showed a decline in amplitude with age. Except for alpha 2activity, all frequency bands and total power showed a continuousdecrease in amplitude with age. For relative power, a strong com-plementary replacement of theta by alpha 2 activity was found up to
177A.R. Clarke et al. / International Journal of Psychophysiology 70 (2008) 176–183
the age of 14. Delta, theta and alpha 1 frequencies decreased with age,and higher frequencies increased. All of these studies found a decreasein relative delta and theta and an increase in relative alpha and betaactivity with age, with this change being linear in nature.
Topographic studies of maturation have found changes take placefrom posterior to anterior regions. Gasser et al. (1988b) found thatdelta, theta and alpha waves developed earliest occipitally, followedby parietal, central and frontal regions. Beta waves developed earliestin central regions followed by parietal, occipital and then frontalregions. In the central area, the midline was found to have more lowfrequency activity than the two hemispheres, whereas high frequencyactivity was found to be more evenly distributed between the twohemispheres and the midline. Following from these results, theincreased delta and theta, and decreased alpha and beta activity foundin children with AD/HD has been interpreted in some studies as re-presenting a maturational-lag (Satterfield et al., 1972; Matsuura et al.,1993; John et al., 1987; Clarke et al., 1998).
A second model that has attempted to explain the EEG abnorm-alities in AD/HD is the hypoarousal model. This was initially proposedby Satterfield and Dawson (1971), who investigated skin conductancelevels (SCL) in hyperactive children. The experimental hypothesis wasthat hyperactive children had an overaroused central nervous system,and therefore would have increased SCL. However, what they foundwas that 50% of their sample actually had decreased SCL, which ledthem to suggest that hyperactivity was due to underarousal of thecentral nervous system. Thismodelwas then further developedwithinthe EEG literature by Lubar (1991), who proposed that a specific linkexisted between power in the theta and beta bands, which was thebasis for a number of researchers using calculations of the theta/betaratio, rather than separate frequency bands, to differentiate AD/HDandnormal children (Lubar, 1991; Janzen et al., 1995). From the wider EEGliterature, it is known that beta activity increases during both physicalandmental activity (Andreassi, 2000; Ackerman et al.,1994,1995), anda number of studies have found that childrenwithAD/HD, compared tocontrol subjects, have lower levels of beta activity during cognitivetasks (Lubar, 1991; Mann et al., 1992). This decrease in beta activity,with the typical increase in theta activity, has been interpreted asrepresenting cortical hypoarousal in children with AD/HD (Lubar,1991). This model has also received support from regional cerebralblood flow and positron emission tomography studies (Lou et al., 1984,1989, 1990; Zametkin et al., 1990).
Following form this research, a small group of childrenwith AD/HDhave been found to have excess beta activity as the dominant EEGabnormality (Clarke et al., 1998; Chabot and Serfontein, 1996). Fol-lowing Lubar's (1991) theory of hypoarousal, it was hypothesized that,if reduced beta and increased theta represents underarousal, childrenwith increased beta activity might be hyperaroused.
Oneproblem for both the hypo- andhyper-arousalmodels has beenrecent studies of the effect of changed arousal states on the EEG. Recentresearch has brought into question the role of theta and beta activity asmarkers of arousal. Several studies have found that alpha activity isprimarily involved in changes in arousal, not theta or beta activity.Barry et al. (2003) reported that increases in skin conductance level(historically a marker of arousal) were associated with global reduc-tions in EEG alpha activity in children during an eyes-closed restingcondition. Similar results have also been found during a continuousperformance task (Barry et al., 2005a), and as the result of caffeineadministration (Barry et al., 2005b). This has meant that the for-mulation of both the hypo- and hyper-arousal models of AD/HD areinaccurate, as beta activity appears to have little association witharousal. This has resulted in researchers revisiting the initial formula-tion of the hypoarousal model. One of the major components wasthat beta activity increases during both physical and mental activity(Andreassi, 2000), and as such, it is possible that the beta deficiency,found in children with AD/HD, may represent a processing deficit.However, this model still remains untested.
While the EEG of childrenwith AD/HD has been extensively studied,the EEG of adults with the disorder has been examined in far fewerstudies, using a less systematic approach than that of the childhoodliterature. Bresnahan et al. (1999, 2006), and Bresnahan and Barry(2002) examined themidline EEG of adultswith AD/HD, during an eyes-open resting condition. These three studies found that absolute andrelative theta activity was elevated in adults with AD/HD, with Bres-nahan et al. (2006) also finding that absolute delta was elevated acrossall sites, and relative delta was reduced at the vertex. No significantdifferences were found in the alpha band, but the AD/HD subjects hadless relative beta than the control subjects. These studies are limited inthat data were reported only for the midline. Monastra et al. (2001)found that 15 to 20 year old AD/HD subjects had an increased theta/betaratio at the vertex, during an eyes-open resting condition, and duringsilent reading, listening and drawing tasks. Robeva et al. (2004) pilotedthe use of the Consistency Index to differentiate between adult collegestudentswith andwithout AD/HD. This index provides ameasure of thedegree of change in the EEG while participants shift from one cognitivetask to another. The degree of alpha attenuationwas also investigated asa possible marker of AD/HD. These measures achieved 100% accurateclassification of AD/HD and control subjects, although the study onlyused 12 subjects in total. Hermens et al. (2004) investigated sex dif-ferences in adults using an eyes-closed resting EEG. Generally, the EEGof adult male patients was more aberrant than that of adult femaleswith AD/HD, with males having greater amplitude in the theta band. Inaddition to increased theta amplitude, the AD/HD groups were alsofound to have increased delta and decreased posterior beta amplitudecompared to control subjects.
Although these studies report results with a high degree of con-sistency, it is difficult to integrate these studies with the bulk of thechildhood literature, as they have used less common paradigms andquantification procedures. Within the childhood literature, the mostcommonprocedure is to calculate absolute and relative power from anEEG that has been recorded during an eyes-closed resting condition.To date this has not been done in an adult population. The majordifference between an eyes-open and an eyes-closed resting conditionis the effect of alpha desynchronization. This is a change in the domi-nant frequency of the EEG from alpha activity to beta activity thatoccurs as a result of a person opening their eyes (Andreassi, 2000).This changes alpha and beta levels, and affects relative power in allbands. An increasing number of clinicians are using qEEG as part oftheir diagnostic work-up. Most of the data bases used for these testsare based on an eyes-closed resting condition, so it is important thateyes-closed resting EEG data is available for clinical populations in theliterature. Hence the aim of this study was to investigate the EEG ofadults with AD/HD using an eyes-closed resting condition.
In a companion paper to this study (Clarke et al., 2008), coherencedifferences between AD/HD and control subjects were investigated.The results indicated that adults with AD/HD had substantially fewercoherence abnormalities than children with the disorder. A lateralityeffect was found for intrahemispheric coherence at long inter-elec-trode distances, with the AD/HD group showing reduced hemisphericdifferences in the delta band compared to the control group. In thealpha band, at short-medium inter-electrode distances, the AD/HDgroup also had lower coherences than the control group. The resultssuggest that theta coherence differences reported in childrenwith AD/HD may be associated with hyperactivity, which is reduced in adultswith AD/HD, while reduced alpha coherence could be associated withinattention, which remains in adult with AD/HD. Reduced delta cohe-rence also appears to be an aspect of the disorder which may developfrom later childhood into adolescence and adulthood. However, cohe-rence is believed to provide information about the degree of structuralconnectivity underlying the pair of electrodes used to calculate themeasure (Shaw, 1981), but does not provide functional informationabout the brain. For this reason, the present study was conductedusing estimates of absolute and relative power.
178 A.R. Clarke et al. / International Journal of Psychophysiology 70 (2008) 176–183
2. Method
2.1. Subjects
Forty adult males between the ages of 18 and 26 participated inthis study. Twenty subjects met criteria for AD/HD according to DSM-IV criteria (APA, 1994), and 20 as non-AD/HD control subjects. Theseincluded all 18 subjects from each group in the coherence study ofClarke et al. (2008). Inclusion in the AD/HD group was based onpublished criteria for the diagnosis of AD/HD in adults (Adler andCohen, 2004; Montano, 2004; Fargason and Ford, 1994), whichrequires the determination of AD/HD during childhood, and the exis-tence of AD/HD symptoms in adulthood which is ascertained by aclinical interview and AD/HD rating scales. The AD/HD subjects wereall assessed and treated for AD/HD Combined type as children. Theclinical interview that was performedwith the adult subjects includedan assessment of IQ, reading ability, current AD/HD symptoms, de-pression level, and general mental health status. The Conners AdultAD/HD rating scale was also used to determine the presence of AD/HDsymptoms, with a T-Score of greater than 70 on the DSM-IV inat-tentive, hyperactive–impulsive or total subscales being used as theclinical cut off. This assessment resulted in 13 subjects being diag-nosed with the combined type of AD/HD and 7 with the inattentivetype. All subjects in the group were treated as children using Ri-talin exclusively, with the length of treatment varying from between1.5 years to 10 years (mean duration 5 years 3 months).
The control group consisted of age-matched adults who weredrawn from the local community. Inclusion in the control group wasbased on the same assessment as that used in the AD/HD group exceptsubjects had to have an IQ greater that 85 points on the full scale score,perform in the normal range or better for reading ability, score belowthe clinical levels on the symptom checklists, and not report any pro-blems which could be indicative of psychopathology on the clinicalinterview, to be included in the study.
2.2. Procedure
All subjects were tested in a single 4 hour session, but to control forfatigue, breaks were taken as necessary. EEG recording was stopped ifthe subject showed any signs of drowsiness. During this assessment, acomprehensive clinical history was taken which included treatmenthistory for anymental illness, subject's present living arrangements, anyhistory of problems at school including suspensions and expulsions,highest educational level attained, current employment and number ofjobs held, as well as periods of unemployment, legal problems/cri-minality both before and after the age of 18, and present drug use(covering both legal and illegal drugs). A psychometric assessment wasthen performed. This consisted of the Weschler Adult intelligence scaleand the Woodcock Reading Mastery Test— Revised. Subjects also com-pleted the General Health Questionnaire (GHQ-60), the Connors adultADHD rating Scale, and the Center for Epidemiological Studies —
Depression scale.Finally, subjects had an electrophysiological assessment. Subjects
were fitted with an electrocap and the EEG was recorded from 19electrodes in accordance with the International 10–20 system (Jasper,1958), which were subsequently divided into 9 regions for analysis.These were the left frontal (Fp1, F3, F7); frontal midline (Fz); rightfrontal (Fp2, F4, F8); left central (T3, C3); midline central (Cz); right
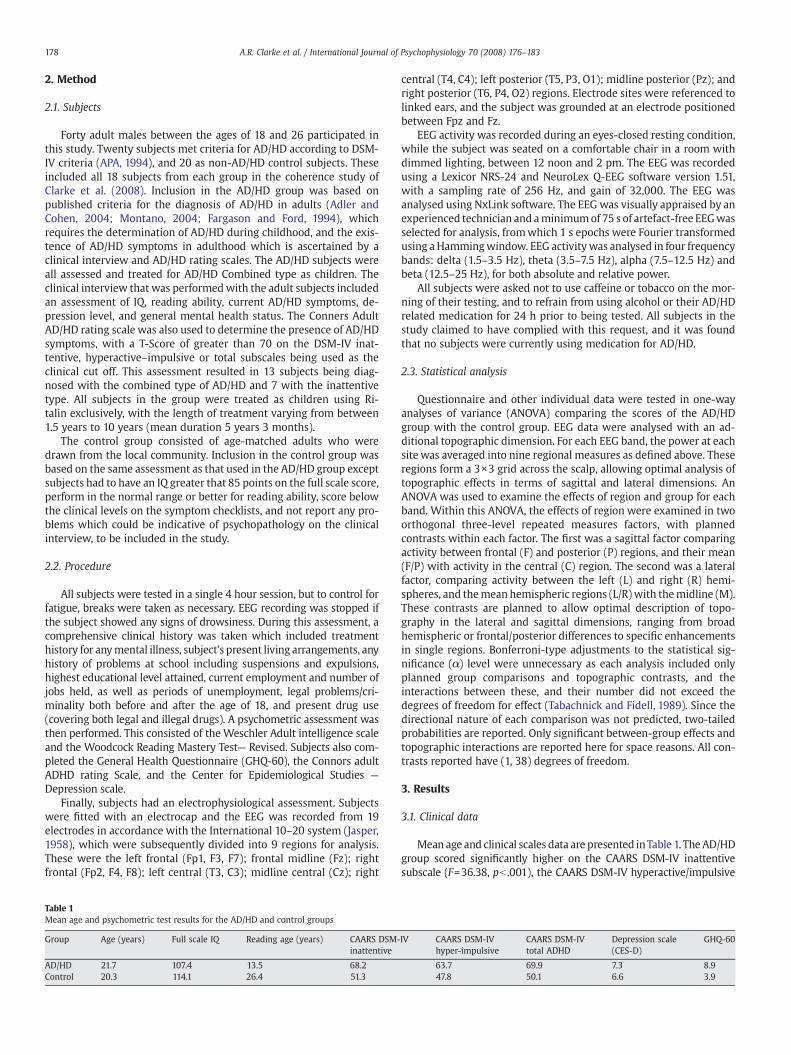
Table 1Mean age and psychometric test results for the AD/HD and control groups
Group Age (years) Full scale IQ Reading age (years) CAARS DSM-inattentive
AD/HD 21.7 107.4 13.5 68.2Control 20.3 114.1 26.4 51.3
central (T4, C4); left posterior (T5, P3, O1); midline posterior (Pz); andright posterior (T6, P4, O2) regions. Electrode sites were referenced tolinked ears, and the subject was grounded at an electrode positionedbetween Fpz and Fz.
EEG activity was recorded during an eyes-closed resting condition,while the subject was seated on a comfortable chair in a room withdimmed lighting, between 12 noon and 2 pm. The EEG was recordedusing a Lexicor NRS-24 and NeuroLex Q-EEG software version 1.51,with a sampling rate of 256 Hz, and gain of 32,000. The EEG wasanalysed using NxLink software. The EEG was visually appraised by anexperienced technician and aminimumof 75 s of artefact-free EEGwasselected for analysis, fromwhich 1 s epochs were Fourier transformedusing aHammingwindow. EEG activitywas analysed in four frequencybands: delta (1.5–3.5 Hz), theta (3.5–7.5 Hz), alpha (7.5–12.5 Hz) andbeta (12.5–25 Hz), for both absolute and relative power.
All subjects were asked not to use caffeine or tobacco on the mor-ning of their testing, and to refrain from using alcohol or their AD/HDrelated medication for 24 h prior to being tested. All subjects in thestudy claimed to have complied with this request, and it was foundthat no subjects were currently using medication for AD/HD.
2.3. Statistical analysis
Questionnaire and other individual data were tested in one-wayanalyses of variance (ANOVA) comparing the scores of the AD/HDgroup with the control group. EEG data were analysed with an ad-ditional topographic dimension. For each EEG band, the power at eachsite was averaged into nine regional measures as defined above. Theseregions form a 3×3 grid across the scalp, allowing optimal analysis oftopographic effects in terms of sagittal and lateral dimensions. AnANOVA was used to examine the effects of region and group for eachband. Within this ANOVA, the effects of region were examined in twoorthogonal three-level repeated measures factors, with plannedcontrasts within each factor. The first was a sagittal factor comparingactivity between frontal (F) and posterior (P) regions, and their mean(F/P) with activity in the central (C) region. The second was a lateralfactor, comparing activity between the left (L) and right (R) hemi-spheres, and themean hemispheric regions (L/R)with themidline (M).These contrasts are planned to allow optimal description of topo-graphy in the lateral and sagittal dimensions, ranging from broadhemispheric or frontal/posterior differences to specific enhancementsin single regions. Bonferroni-type adjustments to the statistical sig-nificance (α) level were unnecessary as each analysis included onlyplanned group comparisons and topographic contrasts, and theinteractions between these, and their number did not exceed thedegrees of freedom for effect (Tabachnick and Fidell, 1989). Since thedirectional nature of each comparison was not predicted, two-tailedprobabilities are reported. Only significant between-group effects andtopographic interactions are reported here for space reasons. All con-trasts reported have (1, 38) degrees of freedom.
3. Results
3.1. Clinical data
Mean age and clinical scales data are presented inTable 1. TheAD/HDgroup scored significantly higher on the CAARS DSM-IV inattentivesubscale (F=36.38, pb .001), the CAARS DSM-IV hyperactive/impulsive
IV CAARS DSM-IVhyper-impulsive
CAARS DSM-IVtotal ADHD
Depression scale(CES-D)
GHQ-60
63.7 69.9 7.3 8.947.8 50.1 6.6 3.9
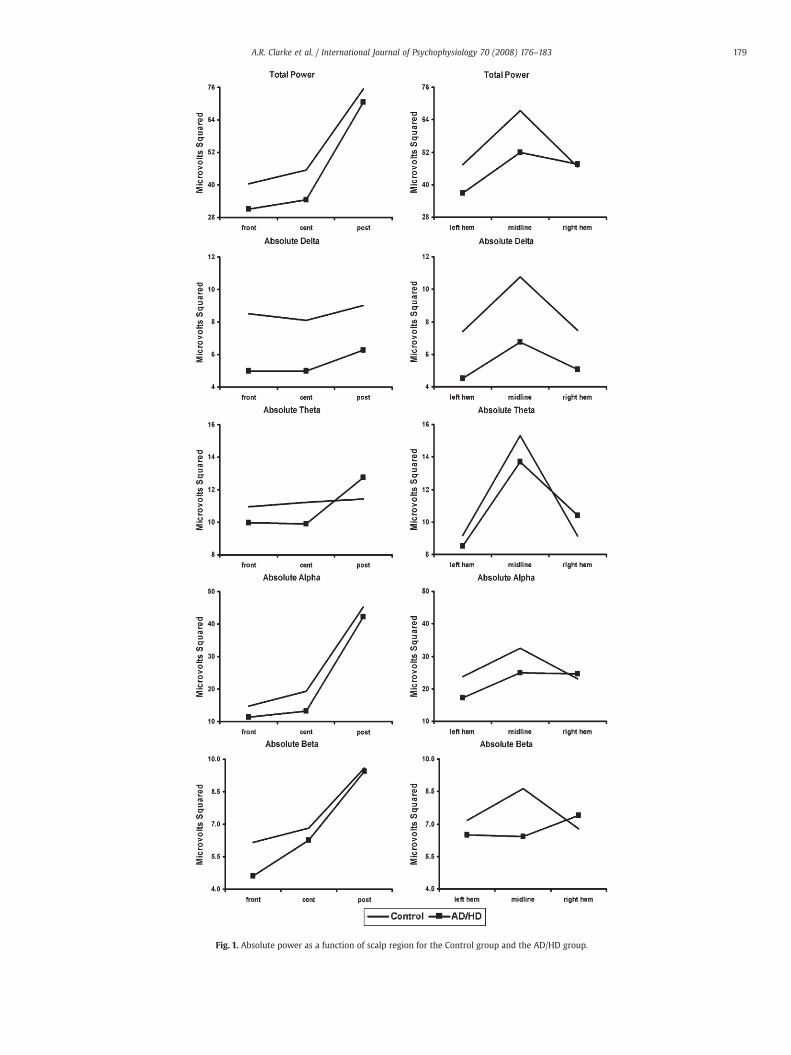
Fig. 1. Absolute power as a function of scalp region for the Control group and the AD/HD group.
179A.R. Clarke et al. / International Journal of Psychophysiology 70 (2008) 176–183
180 A.R. Clarke et al. / International Journal of Psychophysiology 70 (2008) 176–183
subscale (F=28.43, pb .001), and the CAARS DSM-IV total subscale(F=43.75, pb .001), and lower on IQ (F=4.38, pb .05) and reading age(F=90.98, pb .001). No significant differences were found for age, scoreson the GHQ-60, or the level of depression as measured on the CES-D.
3.2. EEG data
Although there appears to be a global reduction in total power inthe AD/HD group (Fig. 1), this failed to reach significance. However,
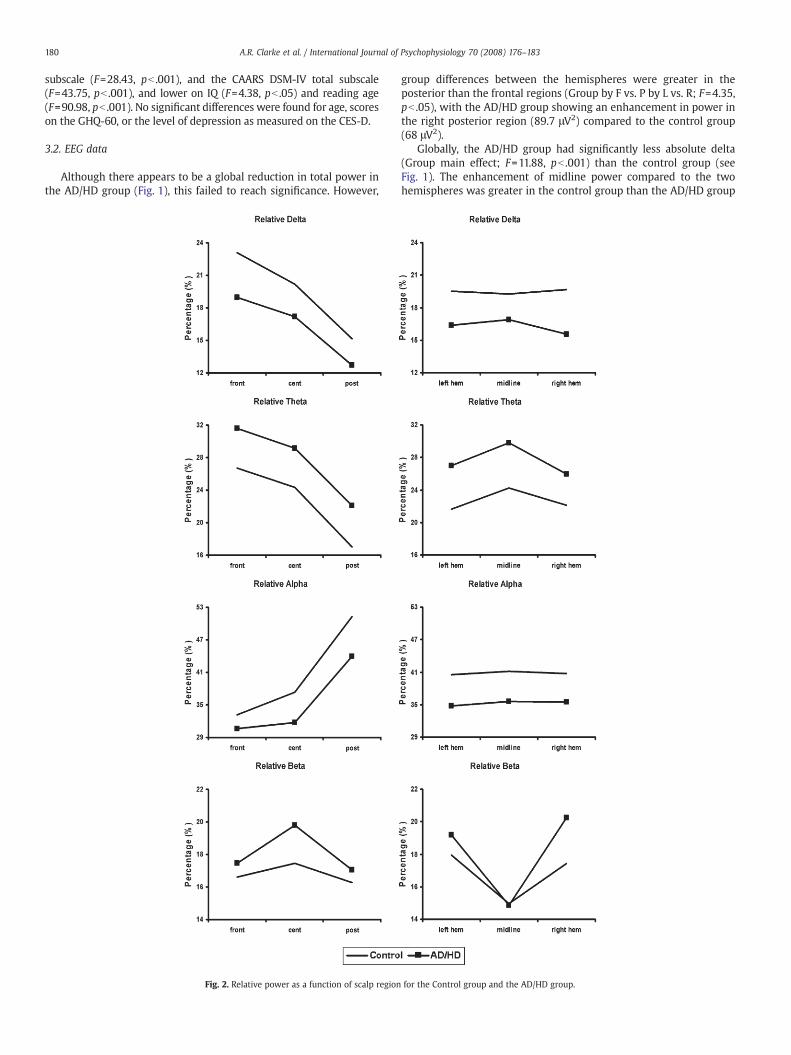
Fig. 2. Relative power as a function of scalp region
group differences between the hemispheres were greater in theposterior than the frontal regions (Group by F vs. P by L vs. R; F=4.35,pb .05), with the AD/HD group showing an enhancement in power inthe right posterior region (89.7 μV2) compared to the control group(68 μV2).
Globally, the AD/HD group had significantly less absolute delta(Group main effect; F=11.88, pb .001) than the control group (seeFig. 1). The enhancement of midline power compared to the twohemispheres was greater in the control group than the AD/HD group
for the Control group and the AD/HD group.
181A.R. Clarke et al. / International Journal of Psychophysiology 70 (2008) 176–183
(Group by L/R vs. M; F=11.78, pb .001). This difference between themidline and the two hemispheres was greater in the posterior regionsthan the frontal regions in the control group, but greater in the frontalregions than the posterior regions for the AD/HD group (Group by L/Rvs. M by F vs. P; F=4.69, pb .05). Group differences in the comparisonof the two hemispheres were greater in the posterior than frontalregions for absolute delta (Group by F vs. P by L vs. R; F=9.82, pb .01).Again, this indicated that the AD/HD group had an enhancement inpower in the right posterior region (right posterior 7.3 μV2, leftposterior 4.8 μV2) compared with controls (right posterior 7.6 μV2, leftposterior 8.3 μV2).
In relative delta (see Fig. 2), the difference between the midlineand the two hemispheres was less in the frontal regions than theposterior regions for the AD/HD group, compared to the control group(Group by F vs. P by L/R vs. M; F=4.34, pb .05).
There were no effects in absolute theta. Globally, the AD/HD grouphad significantly more relative theta (Group main effect; F=6.04,pb .05) than the control group (Fig. 2). This group difference wasgreater in the left hemisphere than in the right (Group by L vs. R;F=4.86, pb .05).
No significant group differences were found in absolute or relativealpha.
In absolute beta (Fig. 1), the control group had more power at themidline than in the two hemispheres, whereas the AD/HD group hadless power at the midline (Group by L/R vs. M; F=4.69, pb .05). Groupdifferences in the comparison of the two hemispheres were greater inthe posterior than the frontal regions (Group by F vs. P by L vs. R;F=4.32, pb .05). This indicated that the AD/HD group again had anenhancement in power in the right posterior region (12.6 μV2 c.f.8.8 μV2 in controls). In relative beta (Fig. 2), both groups had lessmidline power than in the two hemispheres, but this difference wasgreater in the AD/HD group than in the control group (Group by L/R vs.M; F=5.04, pb .05).
3.3. Analysis of covariance with IQ
Due to the significant IQ reduction found in the clinical group, theEEG ANOVAs were re-run using IQ as a covariate. There were nochanges in reported significance levels for any frequency band.
4. Discussion
The current study found that controls had significantly greatermean IQ scores than AD/HD subjects. Although the relationshipbetween EEG activity and intelligence is contentious, there havebeen no direct links between normal intelligence scores and between-subject EEG variability (Ellington,1956; Vogel and Broverman,1964). Anumber of studies have also reported that the greatest between-groupdifference in EEG activity is associated with an AD/HD diagnosis ratherthan intelligence (Chabot and Serfontein, 1996; Clarke et al., 2001b,2005). In the present dataset, the effects of IQ were assessed viacovariance analyses and found to have no effect on significance levels.Hence the obtained group differences in the EEG are not believed to becaused by the existing IQ differences.
The most common EEG abnormality found in childrenwith AD/HDis increased theta activity (Satterfield et al., 1972; Janzen et al., 1995;Chabot and Serfontein, 1996; Lazzaro et al., 1998; Clarke et al., 1998,2001a,c), especially in relative theta (Barry et al., 2003). Increasedtheta activity has also been found in every study of adults that hasused a resting condition (Bresnahan et al., 1999, 2006; Bresnahan andBarry, 2002; Hermens et al., 2004). However, none of these studieshave used paradigms or quantification techniques directly comparablewith the bulk of the childhood literature. In line with the childhoodstudies which have used power analysis, this study found a globalincrease in relative theta. In the absence in the present study of anincrease in absolute theta, relative theta appears to be the most
reliable EEG marker of AD/HD in an eyes-closed resting condition,irrespective of age.
At present it is not fully understood what increased theta activityactually represents. It is known that theta activity is elevated in youngercompared to older children (Matousek and Petersen,1973;Matthis et al.,1980; Gasser et al., 1988a,b; Benninger et al., 1984), which led to thedevelopment of the maturational-lag model of AD/HD. The problemwith this model is that it is not able to adequately account for adult AD/HD, as it is unlikely that these adults could still have a lag in braindevelopment. The second interpretation of increased theta activity inpeople with AD/HD, is that it represents hypoarousal of the centralnervous system (CNS). This model has received considerable support, asit is able to explain the seemingly-paradoxical effect of stimulants in thetreatment of AD/HD. However, the determination of a maturational-lagor underarousal has not been based on the results of a single band alone,but deviations fromnormal in a number of bands. Overall, the results forthe AD/HD group in this study are not as deviant from normal as thosefound in childhood studies, where global abnormalities are often foundin a number of bands. Differences noted here are mainly in the midline,and either the frontal or posterior region of the right hemisphere. Thislack of global differences from control subjects is probably not sur-prising, as the behavioural problems found in adultswith AD/HDare notas severe as those found in children. However, it has not been shown todate that increased behavioural problems are directly related to anincrease in EEG abnormality.
The only other global difference was a reduction in absolute deltain the AD/HD group. Reduced delta activity has been reported pre-viously in children with AD/HD, but this has always been in relativepower, where it has primarily been the result of substantially in-creased theta activity (Clarke et al., 2003, 2007). However, this findingis in direct contradiction to other studies of adult AD/HD (Bresnahanet al., 2006; Hermens et al., 2004), which have found that adults withAD/HD have increased delta activity. Previous studies have foundlocalised increases in delta with increased levels of attention andconcentration during the performance of cognitive tasks (Fernándezet al., 1995; Widago et al., 1998), and as these subjects are known tohave problems with both attention and concentration, it may not besurprising that they have reduced delta activity, but this contradictionin the AD/HD literature requires further investigation.
The adult AD/HD literature typically has not found many differ-ences in the faster frequency bands. Only Bresnahan et al. (2006)reported a global reduction in relative beta activity. The present studyfailed to find any differences for the alpha band, but a decrease inmidline beta activity was found in both absolute and relative power.Themost probable reasonwhy themidline differencewas found in thepresent study, but not in previous adult studies, is that the analysisused here is more sensitive to topographical variations in power thanthose used in other adult AD/HD studies.
One of the most common EEG profiles in the childhood AD/HDliterature is increased theta with normal alpha and decreased betaactivity, which is found in approximately one third of children (Clarkeet al., 2001b). Traditionally this has been seen as representing CNShypoarousal, although this interpretation has recently been ques-tioned, with suggestions that this profile may represent a processingdeficit (Barry et al., 2004, 2005a,b). However, at this stage the exactnature of this deficit is not fully understood. The results of this studysuggest that these subjects have that same basic CNS dysfunction aschildren with AD/HD, persisting into adulthood. This is supportive ofthe hypothesis of Clarke et al. (2001b), that AD/HD children who haveother than a maturational-lag EEG profile will continue to exhibitfeatures of the disorder as adults.
Oneunexpected resultwas a right posterior increase in beta activityin the AD/HD group. Abnormal right posterior EEG activity has beenfound in AD/HD children who also have reading disabilities (Clarkeet al., 2002), although this was a reduction in alpha power. Within thereading literature, there is a general consensus that most reading-
182 A.R. Clarke et al. / International Journal of Psychophysiology 70 (2008) 176–183
related processes occur in the left parietal region (Rebert et al., 1978;Duffy et al., 1979; Harmony et al., 1990; Hynd and Semrud-Clikeman,1989; Flowers,1993), although right posterior regions have been foundtobe associatedwith affective components of language (Bhatnagar andAndy, 1983) and narrative passage reading (Hynd et al., 1987). Theseresults indicate right posterior involvement in some aspects of normalreading. In childrenwith reading disabilities, the right parietal region isbelieved to compensate for the posterior left hemispheric difficulties(Pugh et al., 2000), though this compensation appears to be generallyineffectual. In the present study, most subjects with AD/HD had areading disability (mean reading age 13 years 0 months, c.f. chro-nological age 21 years 5 months), which could be associated with theelevated beta compared to the control group. Beta activity increasesduringmental activity (Andreassi, 2000), and again, the right posteriorregion may be compensating for deficiencies in the left hemisphere.The change fromdecreased alpha (Clarke et al., 2002) to increased betaactivitymay represent a developmental change that has occurred fromchildhood to adults. However, this study did not directly investigatelearning disabilities, so this interpretation should be treated as spe-culative until it is further investigated.
This study investigated EEG abnormalities in adults with AD/HD.Subjects with AD/HD had a global increase in relative theta, with adecrease in absolute delta activity, and midline reductions in betaactivity. These results are similar to those found in children with AD/HD, andmay suggest the presence of a processing deficit, although thismodel needs further testing. A right posterior increase in beta activitywas also found, which could be related to the ongoing presence ofreading disabilities in these subjects.
Acknowledgements
This study was funded by Novartis Pharmaceuticals Australia.
References
Ackerman, P., Dykman, R., Oglesby, D., Newton, J., 1994. EEG power spectra of childrenwith dyslexia, slow learners, and normally reading childrenwith ADD during verbalprocessing. J. Learn. Disabil. 27, 619–630.
Ackerman, P., Dykman, R., Oglesby, D., Newton, J., 1995. EEG power spectra ofdysphonetic and nondysphonetic poor readers. Brain Lang. 49, 140–152.
Adler, L., Cohen, J., 2004. Diagnosis and evaluation of adults with attention-deficit/hyperactivity disorder. Psychiatr. Clin. North Am. 27, 187–201.
American Psychiatric Association, 1994. Diagnostic and Statistical Manual of MentalDisorders, 4th edn. American Psychiatric Association, Washington DC, pp. 78–85.
Andreassi, J., 2000. Psychophysiology, Human Behaviour and Physiological Response,4th edn. Lawrence Erlbaum, Mahwah, NJ, p. 26.
Bhatnagar, S., Andy, O., 1983. Language in the non dominant right hemisphere. Arch.Neurol. 40, 728–731.
Barry, R., Clarke, A., Johnstone, S., 2003. A review of electrophysiology in attention-deficit/hyperactivity disorder: I. Qualitative and quantitative electroencephalogra-phy. Clin. Neurophysiol. 114, 171–183.
Barry, R., Clarke, A., McCarthy, R., Selikowitz, M., Rushby, J., Ploskova, E., 2004. EEGdifferences in children as a function of resting-state arousal level. Clin. Neurophysiol.115 402208.
Barry, R., Clarke, A., McCarthy, R., Selikowitz, M., Rushby, J., 2005a. Arousal andActivitation in a Continous Performance Task: An exploration of state effects innormal children. J. Psychophysiol. 19, 91–99.
Barry, R., Rushby, J., Wallace, M., Clarke, A., Johnstone, S., Ilinka, Z., 2005b. Caffeineeffects on resting-state arousal. Clin. Neurophysiol. 116, 2693–2700.
Bellak, R., Black, R., 1992. Attention-deficit hyperactive disorder in adults. Clin. Therapy14, 138–147.
Benninger, C., Matthis, P., Scheffner, D.,1984. EEG development of healthy boys and girls:results of a longitudinal study. Electroencephalogr. Clin. Neurophysiol. 57, 1–12.
Bresnahan, S., Barry, R., 2002. Specificity of quantitative EEG analysis in adults withattention deficit hyperactivity disorder. Psychiatry Res. 112, 133–144.
Bresnahan, S., Anderson, J., Barry, R., 1999. Age-related changes in quantitative EEG inattention deficit disorder. Biol. Psychiatry 46, 1690–1697.
Bresnahan, S., Barry, R., Clarke, A., Johnstone, S., 2006. Quantitative EEG analysis indexamphetamine-responsive adults with attention-deficit/hyperactivity disorder.Psychiatry Res. 141, 151–159.
Callaway, E., Halliday, R., Naylor, H., 1983. Hyperactive children's event-relatedpotentials fail to support underarousal and maturational-lag theories. Arch. Gen.Psychiatry 40, 1243–1248.
Chabot, R., Serfontein, G., 1996. Quantitative electroencephalographic profiles ofchildren with attention deficit disorder. Biol. Psychiatry 40, 951–963.
Clarke, A., Barry, R., McCarthy, R., Selikowitz, M., 1998. EEG analysis in attention-deficit/hyperactivity disorder: a comparative studyof two subtypes. Psychiatry Res. 81,19–29.
Clarke, A., Barry, R., McCarthy, R., Selikowitz, M., 2001a. Age and sex effects in the EEG:differences in two subtypes of attention-deficit/hyperactivity disorder. Clin. Neuro-physiol. 112, 815–826.
Clarke, A., Barry, R., McCarthy, R., Selikowitz, M., 2001b. EEG-defined subtypes of childrenwith attention-deficit/hyperactivity disorder. Clin. Neurophysiol. 112, 2098–2105.
Clarke, A., Barry, R., McCarthy, R., Selikowitz, M., 2001c. EEG differences in two subtypesof attention-deficit/hyperactivity disorder. Psychophysiology 38, 212–221.
Clarke, A., Barry, R., McCarthy, R., Selikowitz, M., 2002. EEG analysis of children withattention-deficit/hyperactivity disorder and comorbid reading disabilities. J. Learn.Disabil. 35, 276–285.
Clarke, A., Barry, R., McCarthy, R., Selikowitz, M., Clarke, D., Croft, R., 2003. EEG in girlswith attention-deficit/hyperactivity disorder. Clin. Neurophysiol. 114, 319–328.
Clarke, A., Barry, R., McCarthy, R., Selikowitz, M., Johnstone, S., Abbott, I., Croft, R., Magee,C., Hsu, C., Lawrence, C., 2005. Effects of methylphenidate on EEG coherence inattention-deficit/hyperactivity disorder. Int. J. Psychophysiol. 58, 4–11.
Clarke, A., Barry, R., McCarthy, R., Selikowitz, M., Johnstone, S., 2007. Effects of stimulantmedications on the EEG of girls with attention-deficit/hyperactivity disorder. Clin.Neurophysiol. 118, 2700–2708.
Clarke, A., Barry, R., Heaven, P., McCarthy, R., Selikowitz, M., Byrne, M., 2008. EEGcoherence in adults with attention-deficit/hyperactivity disorder. Int. J. Psycho-physiol. 67, 35–40.
Duffy, F., Denckla, M., Bartels, P., Sandini, G., 1979. Dyslexia: regional differences in brainelectrical activity by topographic mapping. Ann. Neurol. 7, 412–420.
Dykman, R., Holcomb, P., Oglesby, D., Ackerman, P., 1982. Electrocortical frequencies inhyperactive, learning-disabled, mixed, and normal children. Biol. Psychiatry 17, 675–685.
Ellington, R., 1956. Brain waves and problems of psychology. Psychol. Bull. 53, 1–34.Fargason, R., Ford, C., 1994. Attention deficit hyperactivity disorder in adults: diagnosis,
treatment, and prognosis. S. Med. J. 87, 302–309.Fernández, T., Harmony, T., Rodriguez, M., Bernal, J., Silva, J., Reyes, A., Marosi, E., 1995. EEG
activationpatterns during the performance of tasks involving different components ofmental calculation. Electroencephalogr. Clin. Neurophysiol. 94, 175–182.
Flowers, D., 1993. Brain basis for dyslexia: a summary of work in progress. J. Learn.Disabil. 26, 575–582.
Gasser, T., Jennen-Steinmetz, C., Sroka, L., Verleger, R., Mocks, J., 1988a. Development ofthe EEG of school age children and adolescents. II. Topography. Electroencephalogr.Clin. Neurophysiol. 69, 100–109.
Gasser, T., Verleger, R., Bacher, P., Sroka, L., 1988b. Development of the EEG of school agechildren and adolescents. I. Analysis of band power. Electroencephalogr. Clin.Neurophysiol. 69, 91–99.
Harmony, T., Hinojosa, G., Marosi, E., Becher, J., Rodriguez, M., Reyes, A., Rocha, C., 1990.Correlation between EEG spectral parameters and an educational evaluation. Int. J.Neurosci. 54, 147–155.
Hermens, F., Williams, L., Lazzaro, I., Whitmont, S., Melkonian, D., Gordon, E., 2004. Sexdifferences in adult ADHD: a double dissociation in brain activity and autonomicarousal. Biol. Psychol. 66, 221–233.
Hynd, G., Semrud-Clikeman, M., 1989. Dyslexia and brain morphology. Psychol. Bull.106, 447–482.
Hynd, G., Hynd, C., Sullivan, H., Kingsbury, T., 1987. Regional cerebral blood flow (rCBF)in developmental dyslexia: activation during reading in a surface and deep dyslexic.J. Learn. Disabil. 20, 294–300.
Janzen, T., Graap, K., Stephanson, S., Marshall, W., Fitzsimmons, G., 1995. Differences inbaseline EEG measures for ADD and normally achieving preadolescent males.Biofeedback Self. Regul. 20, 65–82.
Jasper, H., 1958. Report of the committee on methods of clinical examination in elec-troencephalography. Electroencephalogr. Clin. Neurophysiol. 10, 370–375.
John, E., Ahn, H., Princhep, L., Trepetin, M., Brown, D., Kaye, H., 1980. Developmentalequations of the electroencephalogram. Science 210, 1255–1258.
John, E., Princhep, L., Easton, P., 1987. Normative data banks and neurometrics. Basicconcepts, method and results of norm constructions. In: Gevins, A., Remond, A.(Eds.), Handbook of electroencephalography and clinical neurophysiology, 1.Elsevier, Amsterdam, pp. 919–923.
Kinsbourne, M.,1973. Minimal brain dysfunction as a neurodevelopmental lag. Ann. N.Y.Acad. Sci. 205, 268–273.
Lazzaro, I., Gordon, E., Whitmont, S., Plahn, M., Li, W., Clarke, S., Dosen, A., Meares, R.,1998. Quantified EEG activity in adolescent attention deficit hyperactivity disorder.Clin. Electroencephalogr. 29, 37–42.
Lindgren, S., Wolraich, M., Stromquist, A., Davis, C., Milich, R., Watson, D., 1990.Diagnostic heterogeneity in attention deficit hyperactivity disorder. Presented atthe Fourth Annual NIMH International Research Conference on the Classificationand Treatment of Mental Disorders in General Medical Settings, Bethesda.
Lou, H., Henriksen, L., Bruhn, P., 1984. Focal cerebral hypoperfusion and/or attentiondeficit disorder. Arch Neurol. 41, 825–829.
Lou, H., Henriksen, L., Bruhn, P., Borner, H., Nielsen, J., 1989. Striatal dysfunction inattention deficit and hyperkinetic disorder. Arch Neurol. 46, 48–52.
Lou, H., Henriksen, L., Bruhn, P., 1990. Focal cerebral dysfunction in developmentallearning disabilities. Lancet 335, 8–11.
Lubar, J., 1991. Discourage on the development of EEG diagnostics and biofeedback forattention-deficit/hyperactivity disorders. Biofeedback Self-Regul. 16, 201–225.
Mann, C., Lubar, J., Zimmerman, A., Miller, C., Muenchen, R., 1992. Quantitative analysisof EEG in boys with attention deficit hyperactivity disorder: controlled study withclinical implications. Pediatr. Neurol. 8, 30–36.
Matousek, M., Petersen, I., 1973. Frequency analysis of the EEG in normal children andnormal adolescents. In: Kellaway, P., Petersen, I. (Eds.), Automation of ClinicalElectroencephalography. Ravens Press, New York, pp. 75–102.
183A.R. Clarke et al. / International Journal of Psychophysiology 70 (2008) 176–183
Matousek, M., Rasmussen, P., Gilberg, C., 1984. EEG frequency analysis in children withso-called minimal brain dysfunction and related disorders. Adv. Biol. Psychiatry 15,102–108.
Matsuura, M., Okubo, Y., Toru, M., Kojima, T., He, Y., Hou, Y., Shen, Y., Lee, C., 1993. Across-national EEG study of children with emotional and behavioural problems: AWHO collaborative study in the western pacific region. Biol. Psychiatry 34, 52–58.
Matthis, P., Scheffner, D., Benninger, C., Lipinski, C., Stolzis, L., 1980. Changes in thebackground activity of the electroencephalogram according to age. Electroence-phalogr. Clin. Neurophysiol. 49, 626–635.
Monastra, V., Lubar, J., Linden, M., 2001. The development of a quantitative electro-encephalographic scanning process for attention deficit-hyperactivity disorder:reliability and validity studies. Neuropsychology 15, 136–144.
Montano, B., 2004. Diagnosis and treatment of ADHD in adults in primary care. J. Clin.Psychiatry 65, 18–21.
Pelham, W., Gnagy, E., Greenslade, K., Milich, R., 1992. Teacher ratings of DSM-III-Rsymptoms for the disruptive behaviour disorders. J. Am. Acad. Child Adolesc. Psych.31, 210–218.
Pugh, K., Mencl, W., Jenner, A., Katz, L., Frost, S., Lee, J., Shaywitz, S., Shaywitz, B., 2000.Functional neuroimaging studies of reading and reading disability (developmentaldyslexia). Ment. Retard. Dev. Disabil. Res. Rev. 6, 207–213.
Rebert, C., Wexler, B., Sproul, A., 1978. EEG asymmetry in educationally handicappedchildren. Electroencephalogr. Clin. Neurophysiol. 45, 436–442.
Robeva, R., Penberthy, J., Loboschefski, T., Cox, D., Kovatchev, B., 2004. Sequential psycho-physiological assessment of ADHD: a pilot study of Bayesian probability approachillustrated by appraisal of ADHD in female college students. Appl. Psychophysiol.Biofeedback 29, 1–18.
Satterfield, J., Dawson, M., 1971. Electrodermal correlates of hyperactivity in children.Psychophysiology 8, 191–197.
Satterfield, J., Cantwell, D., Saul, R., Lesser, M., Podsin, R., 1972. Physiological studies ofthe hyperkinetic child: I. Am. J. Psychiatry 128, 102–108.
Shaw, J., 1981. An introduction to the coherence function and its use in EEG signalanalysis. J. Med. Eng. Technol. 5, 279–288.
Tabachnick, B., Fidell, L., 1989. Using Multivariate Statistics. Harper Collins, New York.Vogel, W., Broverman, D., 1964. A reply to “relationship between EEG and test intel-
ligence: a commentary. Psychol. Bull. 65, 99–109.Widago, M., Pierson, J., Helme, R., 1998. Age-related changes in QEEG during cognitive
tasks. Int. J. Neurosci. 95, 63–75.Zametkin, A., Nordahl, T., Gross, M., King, A., Semple, W., Rumsey, J., Hamburger, S.,
Cohen, R., 1990. Cerebral glucose metabolism in adults with hyperactivity ofchildhood onset. New Eng. J. Med. 323, 1361–1366.