Embed Size (px)
Citation preview
CMU.J.Nat.Sci.Special Issue on Agricultural & Natural Resources (2012) Vol.11 (1) 193➔
Effect of Fat Replacer Systems and Maltitol on Qualitiesof Fat and Calorie Reduced Dairy Ice Cream
Aphirak Phianmongkhol*, Hathaitip Rongkom and Tri I. Wirjantoro
Division of Food Science and Technology, Faculty of Agro-Industry, Chiang Mai University, Chiang Mai 50200, Thailand
*Corresponding author. E-mail: [email protected]
ABSTRACT
This research aimed to study the effect fat replacer systems (single and mixed) and con-centration of maltitol on physical, chemical and sensory properties of fat and calorie reduced dairy ice cream. In single fat replacer system, two protein-based fat replacers (i.e. whey protein and soy protein) were studied. Experimental results indicated that whey protein provided the ice cream of higher overrun value and lower meltdown rate as compared with those of soy protein. When mixed fat replacer system (protein-based and carbohydrate-based fat replacers) was used, results revealed that combination of whey protein and Avicel (4:1) (w/w) provided the ice cream with similar value of viscosity, protein content and sensory property to those of control sample (P > 0.05). However, the melting rate and fat content of the ice cream with the mixed fat replacer system were lower while the overrun was higher than the control (P ≤ 0.05). Properties of fat reduced ice cream (used mixture of whey protein: Avicel of 4:1 (w/w) as fat replacer) with 10 % (w/w) maltitol were similar to the control sample (P > 0.05). Based on this ice cream formula, the fat and energy content of the ice cream were measured to be 2.21±0.26 % and 448.97±2.94 kcal/100 g, respectively. The results form this study suggested that the mixed fat replacer system and maltitol had a potential to be used in the fat and calorie reduced ice cream product.
Key words: Dairy ice cream, Fat reduced ice-cream, Maltitol, Fat replacer, Energy value
INTRODUCTION
Ice cream is one of the popular frozen-dessert worldwide. It is a complex colloidal frozen food system which consists of partially coalesced fat droplets, air cells, ice crystals and a viscous aqueous phase. In the aqueous phase, polysaccharides, proteins, lactose and mineral salts are dis-persed (Goff, 1997; Marshall et al., 2003). A typical compositional range for the components used in dairy ice cream mix formulations are as followed: milk fat 10-16%, milk solid-not-fat 9-12%, sucrose 9-12%, corn syrup solids 4-6%, stabilizers/emulsifiers 0-0.5%, total solids 36-45% and water 55-64% (Goff, 1997). According to its contents, ice cream is a high calories and cholesterol food. Consumers have recently shown that they welcome low-fat and low-sugar products as they associ-ate a high consume of dietary fat and sugar with higher risks of obesity, coronary heart disease, diabetes and some types of cancers (Koeferli et al., 1996). Fat and calorie reduction in food products is therefore one of the leading research and de-velopment priorities for food industry. Fat plays a role in both structure and flavor of ice cream. Triglycerides in milk fat possess a wide range of melting temperature (40 to -40°C)(Walstra and Jenness, 1984). Therefore, at refrigeration temperature fat globule is always contained a combina-tion of liquid and crystalline fat. The ratio between solid to liquid at freezer temperature is very important for formation of ice cream structure, as crystalline fat is required for partial coalescence (van Boekel and Walstra, 1981; Boode et al., 1991). However, to reduce the fat content in ice cream formula several fat replacers were studied and introduced for ice cream production. Two major fat replacers normally used in ice cream production are protein-based and carbohydrate-based fat replacers. In general, the protein-based fat replacer provided the ice cream with high overrun and
CMU.J.Nat.Sci.Special Issue on Agricultural & Natural Resources (2012) Vol.11 (1)➔194
smooth texture but also high melting rate. On the other hand, the carbohydrate-based fat replacer provided the ice cream with poor texture properties but good melting characteristic (Muhammet, 2006). Dietary fibers from citrus significantly improved melting quality of ice cream but failed to improve viscosity, overrun and texture of the ice cream (Dervisoglu and Yazici, 2006). Rice flour (Cody et al., 2007) and dietary fiber from oat, wheat, apple and inulin (Soukoulis et al., 2009) were also studied. However, there are a little data dealing with the study of both fat and calories reduction in dairy ice cream products especially an application of polyol sugar as a sweetener in the ice cream. The aim of this study was to evaluate the effects of fat replacer systems (both single and mixed systems) and concentration of maltitol on physical, chemical and sensory properties of fat and calorie reduced dairy ice cream.
MATERIALS AND METHODS
Ice cream preparation The ice cream sample was prepared according to modified procedure previously described by Marshall and Arbuckle (1996). The composition of the control ice cream mix was 76% skim milk (Foremost, Freesland Food Foremost Co.,Ltd., Thailand), 4% skim milk powder (Mission, Mission Health Food Co.,Ltd., Thailand), 7% unsalted-butter (Orchid, Thai Dairy Industry Co.,Ltd., Thailand), 12% sucrose (Lin, Thai Multi-Sugar Industry Co.,Ltd., Thailand), 0.9% gelatin (Jelita, Chiang Mai Bakermart Co.,Ltd, Thailand), 0.2% cornstarch (Knor, Unilever Thai Trading Co.,Ltd., Thailand) and 0.2% vanilla odor (Best Odor, Best Odor Co., Ltd., Thailand). For the fat-reduced ice cream the butter was partially replaced by pre-calculated amount of fat replacer (whey protein isolate obtained from I.P.S. International Co.,Ltd., Thailand; soy protein isolate from Food Equip-ments Co.,Ltd., Thailand; Avicel PH-101 from Fluka, Japan; MT-01 from Adinp Co.,Ltd., Thailand and Alpha Starch from Thai Wa Alpha Starch Co.,Ltd.) to achieve desired fat content percentage. Also for calorie-reduced ice cream, the sugar was replaced by maltitol (MC-TOWA International Sweetener Co.,Ltd., Thailand). The skim milk was heated to 50±2°C and all solid ingredients were added and mixed properly. The mixer was then mixed in blender (Moulinex: model W36, France) at maximum speed for 2 min. After that, the ice cream mix was pasteurized at 80±1°C for 2 min and then cooling down immediately. The vanilla flavour was added and the mix was aged in refrigerator (4±2°C) for 24 h. The ice cream mix was simultaneously agitated and frozen in ice cream making machine (Simac Gelataio: model GC 4000 E, Germany) for 45 min in temperature controlled room of 25°C. The obtained ice cream was then packed in container and put in the freezer at -30±2°C for 24 h before analyzed for its properties.
Analytical methods Physical properties The viscosities of the ice cream mix were measured by viscometer (Brookfield: model LVDV – II +, USA). The overrun was assessed using the method previously described by Arbuckle (1986). Meltdown rate measurement method was modified from Guinard et al., (1997) and Roland et al., (1999). The hardness of the sample was measured by texture analyzer (Texture Analyzer: model TA.XT plus, England). The Hunter color system was measured using chromameter (Minolta: model CR 300, Japan). Chemical properties The pH of the ice cream was measured by pH meter (Atago, Japan). The total soluble solid in the sample was measured by hand refractometer (Atago: model N1 Brix 0-32%, Japan). The fat, protein and sugar content of the ice cream sample were analyzed according to AOAC (2000). The energy content of the ice cream was analyzed by Bomb calorimeter (Gallencamp: model CB-330, England) according to AOAC (2000).
CMU.J.Nat.Sci.Special Issue on Agricultural & Natural Resources (2012) Vol.11 (1) 195➔
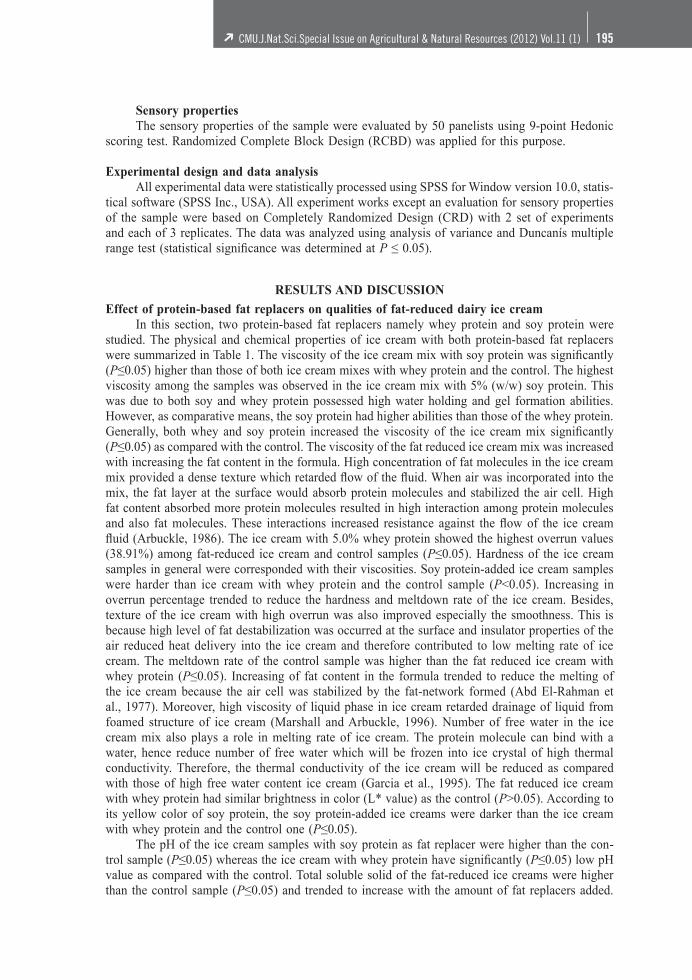
Sensory properties The sensory properties of the sample were evaluated by 50 panelists using 9-point Hedonic scoring test. Randomized Complete Block Design (RCBD) was applied for this purpose.
Experimental design and data analysis All experimental data were statistically processed using SPSS for Window version 10.0, statis-tical software (SPSS Inc., USA). All experiment works except an evaluation for sensory properties of the sample were based on Completely Randomized Design (CRD) with 2 set of experiments and each of 3 replicates. The data was analyzed using analysis of variance and Duncanís multiple range test (statistical significance was determined at P ≤ 0.05).
RESULTS AND DISCUSSION
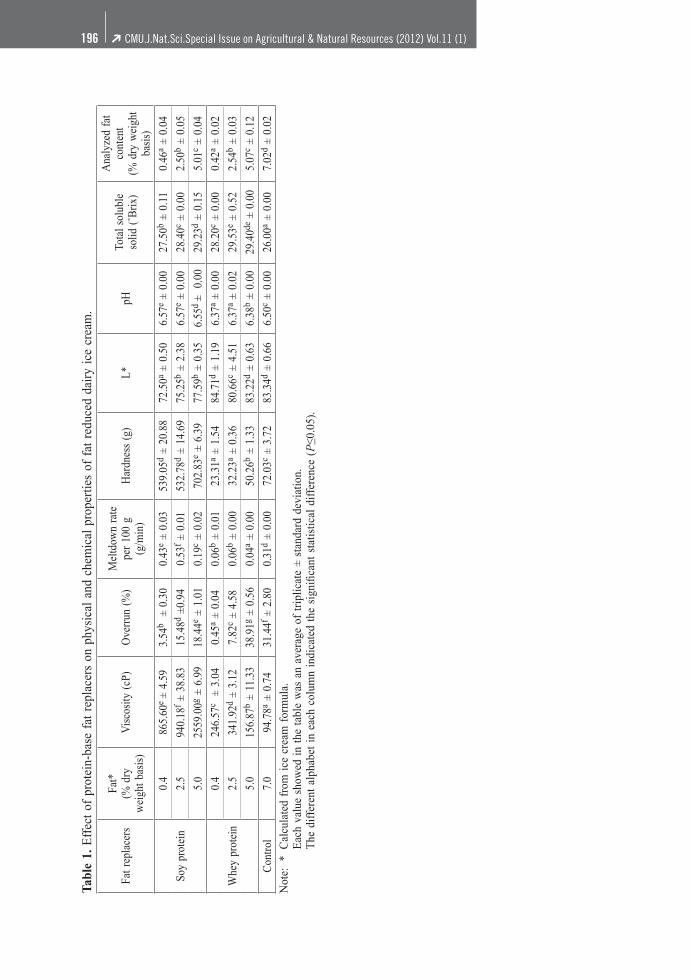
Effect of protein-based fat replacers on qualities of fat-reduced dairy ice cream In this section, two protein-based fat replacers namely whey protein and soy protein were studied. The physical and chemical properties of ice cream with both protein-based fat replacers were summarized in Table 1. The viscosity of the ice cream mix with soy protein was significantly (P≤0.05) higher than those of both ice cream mixes with whey protein and the control. The highest viscosity among the samples was observed in the ice cream mix with 5% (w/w) soy protein. This was due to both soy and whey protein possessed high water holding and gel formation abilities. However, as comparative means, the soy protein had higher abilities than those of the whey protein. Generally, both whey and soy protein increased the viscosity of the ice cream mix significantly (P≤0.05) as compared with the control. The viscosity of the fat reduced ice cream mix was increased with increasing the fat content in the formula. High concentration of fat molecules in the ice cream mix provided a dense texture which retarded flow of the fluid. When air was incorporated into the mix, the fat layer at the surface would absorb protein molecules and stabilized the air cell. High fat content absorbed more protein molecules resulted in high interaction among protein molecules and also fat molecules. These interactions increased resistance against the flow of the ice cream fluid (Arbuckle, 1986). The ice cream with 5.0% whey protein showed the highest overrun values (38.91%) among fat-reduced ice cream and control samples (P≤0.05). Hardness of the ice cream samples in general were corresponded with their viscosities. Soy protein-added ice cream samples were harder than ice cream with whey protein and the control sample (P<0.05). Increasing in overrun percentage trended to reduce the hardness and meltdown rate of the ice cream. Besides, texture of the ice cream with high overrun was also improved especially the smoothness. This is because high level of fat destabilization was occurred at the surface and insulator properties of the air reduced heat delivery into the ice cream and therefore contributed to low melting rate of ice cream. The meltdown rate of the control sample was higher than the fat reduced ice cream with whey protein (P≤0.05). Increasing of fat content in the formula trended to reduce the melting of the ice cream because the air cell was stabilized by the fat-network formed (Abd El-Rahman et al., 1977). Moreover, high viscosity of liquid phase in ice cream retarded drainage of liquid from foamed structure of ice cream (Marshall and Arbuckle, 1996). Number of free water in the ice cream mix also plays a role in melting rate of ice cream. The protein molecule can bind with a water, hence reduce number of free water which will be frozen into ice crystal of high thermal conductivity. Therefore, the thermal conductivity of the ice cream will be reduced as compared with those of high free water content ice cream (Garcia et al., 1995). The fat reduced ice cream with whey protein had similar brightness in color (L* value) as the control (P>0.05). According to its yellow color of soy protein, the soy protein-added ice creams were darker than the ice cream with whey protein and the control one (P≤0.05). The pH of the ice cream samples with soy protein as fat replacer were higher than the con-trol sample (P≤0.05) whereas the ice cream with whey protein have significantly (P≤0.05) low pH value as compared with the control. Total soluble solid of the fat-reduced ice creams were higher than the control sample (P≤0.05) and trended to increase with the amount of fat replacers added.
CMU.J.Nat.Sci.Special Issue on Agricultural & Natural Resources (2012) Vol.11 (1)➔196
Tabl
e 1.
Eff
ect
of p
rote
in-b
ase
fat
repl
acer
s on
phy
sica
l an
d ch
emic
al p
rope
rtie
s of
fat
red
uced
dai
ry i
ce c
ream
.
Fat r
epla
cers
Fat*
(% d
ryw
eigh
t bas
is)
Vis
cosi
ty (
cP)
Ove
rrun
(%
)M
eltd
own
rate
pe
r 10
0 g
(g/m
in)
Har
dnes
s (g
)L*
pHTo
tal s
olub
le
solid
(˚B
rix)
Ana
lyze
d fa
t co
nten
t(%
dry
wei
ght
basi
s)
Soy
prot
ein
0.4
865.
60e
± 4.
59
3.54
b ±
0.3
00.
43e
± 0.
0353
9.05
d ±
20.8
8 72
.50a
± 0.
50
6.57
e ±
0.00
27
.50b
± 0.
110.
46a
± 0.
04
2.5
940.
18f ±
38.
83
15.4
8d ±0
.94
0.53
f ± 0
.01
532.
78d
± 14
.69
75.2
5b ±
2.38
6.
57e
± 0.
00
28.4
0c ±
0.00
2.50
b ±
0.05
5.0
2559
.00g
± 6.
99
18.4
4e ±
1.01
0.19
c ±
0.02
702.
83e
± 6.
39
77.5
9b ±
0.35
6.
55d
± 0
.00
29.2
3d ±
0.15
5.01
c ±
0.04
Whe
y pr
otei
n
0.4
246.
57c
± 3
.04
0.45
a ±
0.04
0.06
b ±
0.01
23.3
1a ±
1.54
84
.71d
± 1.
19
6.37
a ±
0.00
28
.20c
± 0.
000.
42a
± 0.
02
2.5
341.
92d
± 3.
12
7.82
c ±
4.58
0.06
b ±
0.00
32.2
3a ±
0.36
80
.66c
± 4.
516.
37a
± 0.
02
29.5
3e ±
0.52
2.54
b ±
0.03
5.0
156.
87b
± 11
.33
38.9
1g ±
0.56
0.04
a ±
0.00
50.2
6b ±
1.33
83
.22d
± 0.
63
6.38
b ±
0.00
29
.40de
± 0
.00
5.07
c ±
0.12
Con
trol
7.0
94.7
8a ±
0.74
31
.44f ±
2.8
00.
31d
± 0.
0072
.03c
± 3.
72
83.3
4d ±
0.66
6.
50c
± 0.
00
26.0
0a ±
0.00
7.02
d ±
0.02
Not
e: *
Cal
cula
ted
from
ice
cre
am f
orm
ula.
Eac
h va
lue
show
ed i
n th
e ta
ble
was
an
aver
age
of t
ripl
icat
e ±
stan
dard
dev
iatio
n.
The
dif
fere
nt a
lpha
bet
in e
ach
colu
mn
indi
cate
d th
e si
gnifi
cant
sta
tistic
al d
iffe
renc
e (P
≤0.0
5).
CMU.J.Nat.Sci.Special Issue on Agricultural & Natural Resources (2012) Vol.11 (1) 197➔
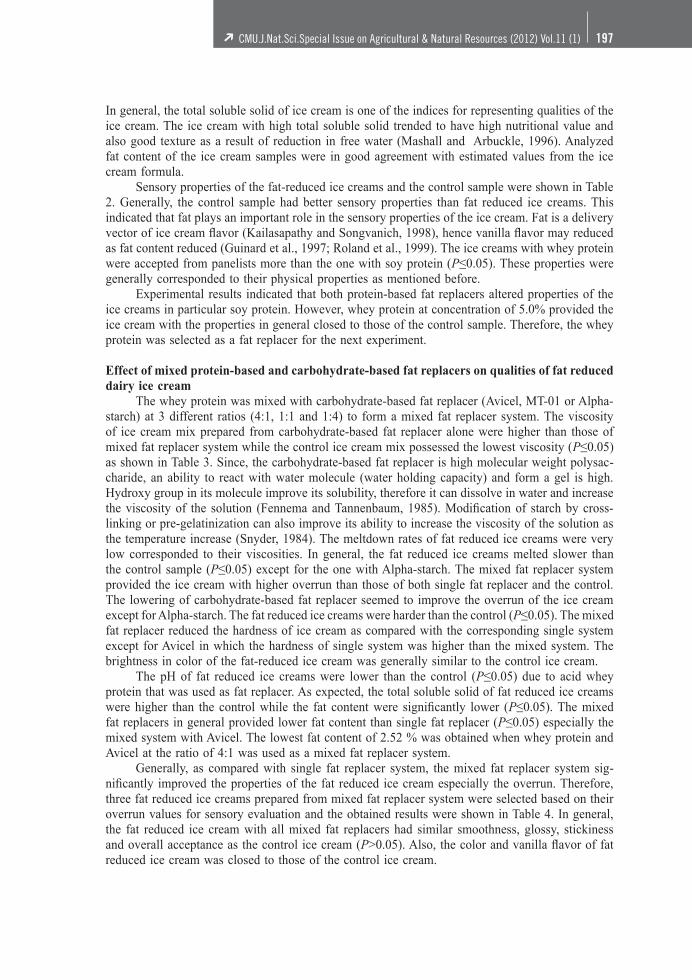
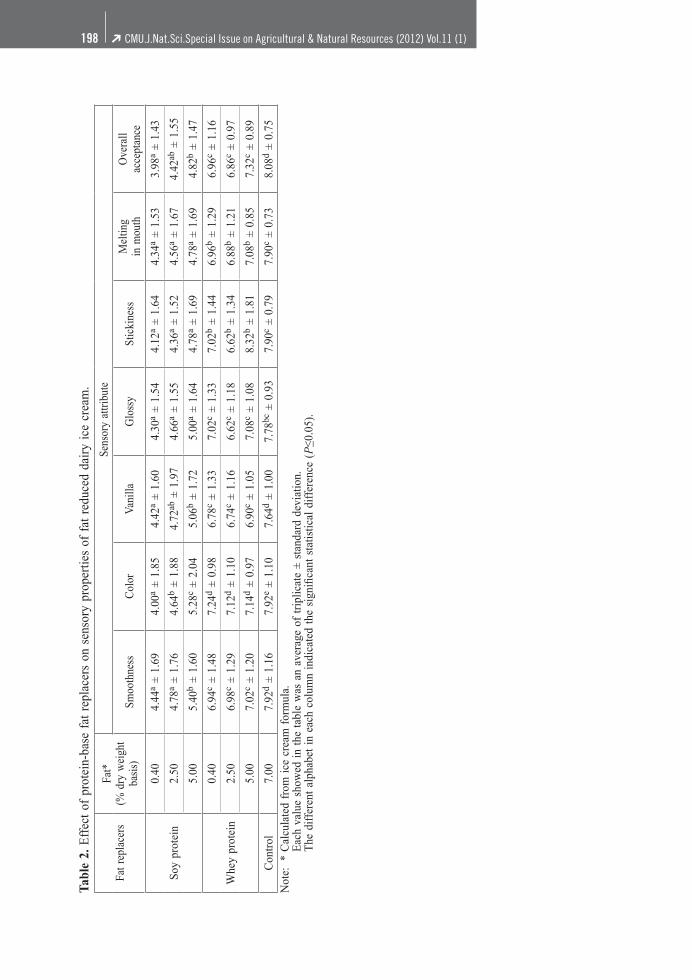
In general, the total soluble solid of ice cream is one of the indices for representing qualities of the ice cream. The ice cream with high total soluble solid trended to have high nutritional value and also good texture as a result of reduction in free water (Mashall and Arbuckle, 1996). Analyzed fat content of the ice cream samples were in good agreement with estimated values from the ice cream formula. Sensory properties of the fat-reduced ice creams and the control sample were shown in Table 2. Generally, the control sample had better sensory properties than fat reduced ice creams. This indicated that fat plays an important role in the sensory properties of the ice cream. Fat is a delivery vector of ice cream flavor (Kailasapathy and Songvanich, 1998), hence vanilla flavor may reduced as fat content reduced (Guinard et al., 1997; Roland et al., 1999). The ice creams with whey protein were accepted from panelists more than the one with soy protein (P≤0.05). These properties were generally corresponded to their physical properties as mentioned before. Experimental results indicated that both protein-based fat replacers altered properties of the ice creams in particular soy protein. However, whey protein at concentration of 5.0% provided the ice cream with the properties in general closed to those of the control sample. Therefore, the whey protein was selected as a fat replacer for the next experiment.
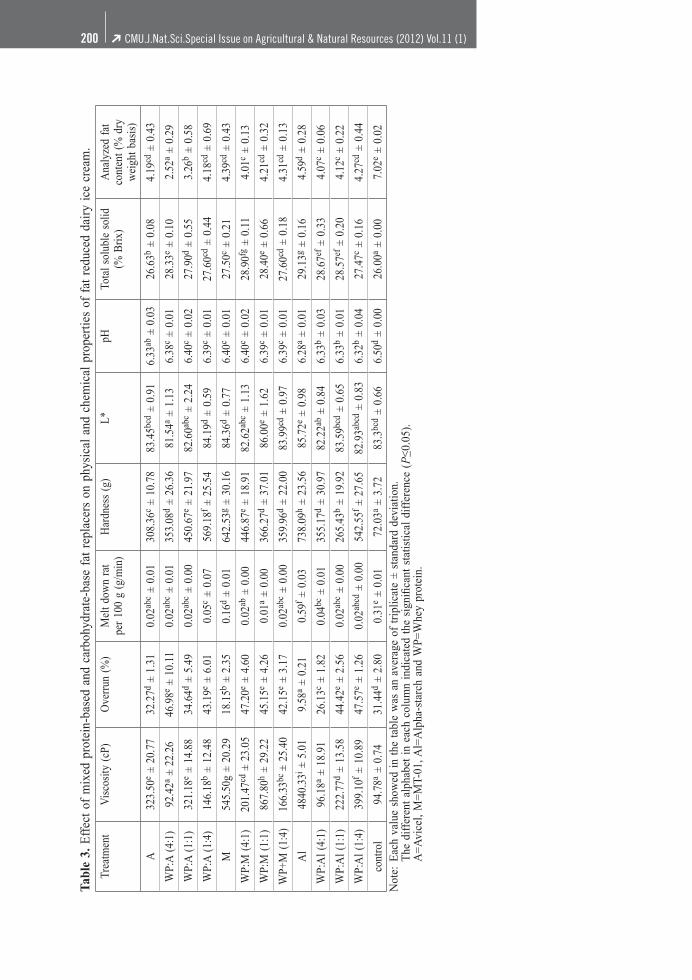
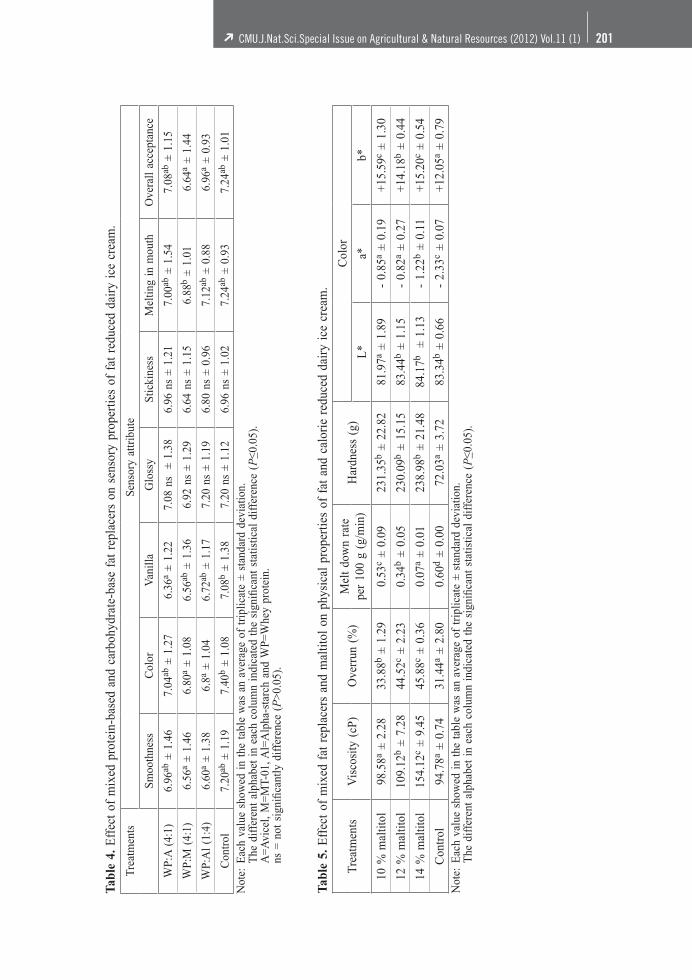
Effect of mixed protein-based and carbohydrate-based fat replacers on qualities of fat reduced dairy ice cream The whey protein was mixed with carbohydrate-based fat replacer (Avicel, MT-01 or Alpha-starch) at 3 different ratios (4:1, 1:1 and 1:4) to form a mixed fat replacer system. The viscosity of ice cream mix prepared from carbohydrate-based fat replacer alone were higher than those of mixed fat replacer system while the control ice cream mix possessed the lowest viscosity (P≤0.05) as shown in Table 3. Since, the carbohydrate-based fat replacer is high molecular weight polysac-charide, an ability to react with water molecule (water holding capacity) and form a gel is high. Hydroxy group in its molecule improve its solubility, therefore it can dissolve in water and increase the viscosity of the solution (Fennema and Tannenbaum, 1985). Modification of starch by cross-linking or pre-gelatinization can also improve its ability to increase the viscosity of the solution as the temperature increase (Snyder, 1984). The meltdown rates of fat reduced ice creams were very low corresponded to their viscosities. In general, the fat reduced ice creams melted slower than the control sample (P≤0.05) except for the one with Alpha-starch. The mixed fat replacer system provided the ice cream with higher overrun than those of both single fat replacer and the control. The lowering of carbohydrate-based fat replacer seemed to improve the overrun of the ice cream except for Alpha-starch. The fat reduced ice creams were harder than the control (P≤0.05). The mixed fat replacer reduced the hardness of ice cream as compared with the corresponding single system except for Avicel in which the hardness of single system was higher than the mixed system. The brightness in color of the fat-reduced ice cream was generally similar to the control ice cream. The pH of fat reduced ice creams were lower than the control (P≤0.05) due to acid whey protein that was used as fat replacer. As expected, the total soluble solid of fat reduced ice creams were higher than the control while the fat content were significantly lower (P≤0.05). The mixed fat replacers in general provided lower fat content than single fat replacer (P≤0.05) especially the mixed system with Avicel. The lowest fat content of 2.52 % was obtained when whey protein and Avicel at the ratio of 4:1 was used as a mixed fat replacer system. Generally, as compared with single fat replacer system, the mixed fat replacer system sig-nificantly improved the properties of the fat reduced ice cream especially the overrun. Therefore, three fat reduced ice creams prepared from mixed fat replacer system were selected based on their overrun values for sensory evaluation and the obtained results were shown in Table 4. In general, the fat reduced ice cream with all mixed fat replacers had similar smoothness, glossy, stickiness and overall acceptance as the control ice cream (P>0.05). Also, the color and vanilla flavor of fat reduced ice cream was closed to those of the control ice cream.
CMU.J.Nat.Sci.Special Issue on Agricultural & Natural Resources (2012) Vol.11 (1)➔198
Tabl
e 2.
Eff
ect
of p
rote
in-b
ase
fat
repl
acer
s on
sen
sory
pro
pert
ies
of f
at r
educ
ed d
airy
ice
cre
am.
Fat r
epla
cers
Fat*
(% d
ry w
eigh
t ba
sis)
Sens
ory
attri
bute
Smoo
thne
ssC
olor
Vani
llaG
loss
ySt
icki
ness
Mel
ting
in m
outh
Ove
rall
acce
ptan
ce
Soy
prot
ein
0.40
4.44
a ±
1.69
4.00
a ±
1.85
4.42
a ±
1.60
4.30
a ±
1.54
4.12
a ±
1.64
4.34
a ±
1.53
3.98
a ±
1.43
2.50
4.78
a ±
1.76
4.64
b ±
1.88
4.72
ab ±
1.9
74.
66a
± 1.
554.
36a
± 1.
524.
56a
± 1.
674.
42ab
± 1
.55
5.00
5.40
b ±
1.60
5.28
c ±
2.04
5.06
b ±
1.72
5.00
a ±
1.64
4.78
a ±
1.69
4.78
a ±
1.69
4.82
b ±
1.47
Whe
y pr
otei
n
0.40
6.94
c ±
1.48
7.24
d ±
0.98
6.78
c ±
1.33
7.02
c ±
1.33
7.02
b ±
1.44
6.96
b ±
1.29
6.96
c ±
1.16
2.50
6.98
c ±
1.29
7.12
d ±
1.10
6.74
c ±
1.16
6.62
c ±
1.18
6.62
b ±
1.34
6.88
b ±
1.21
6.86
c ±
0.97
5.00
7.02
c ±
1.20
7.14
d ±
0.97
6.90
c ±
1.05
7.08
c ±
1.08
8.32
b ±
1.81
7.08
b ±
0.85
7.32
c ±
0.89
Con
trol
7.00
7.92
d ±
1.16
7.92
e ±
1.10
7.64
d ±
1.00
7.78
bc ±
0.9
37.
90c
± 0.
797.
90c
± 0.
738.
08d
± 0.
75N
ote:
* C
alcu
late
d fr
om i
ce c
ream
for
mul
a.
E
ach
valu
e sh
owed
in
the
tabl
e w
as a
n av
erag
e of
tri
plic
ate
± st
anda
rd d
evia
tion.
T
he d
iffe
rent
alp
habe
t in
eac
h co
lum
n in
dica
ted
the
sign
ifica
nt s
tatis
tical
dif
fere
nce
(P≤0
.05)
.
CMU.J.Nat.Sci.Special Issue on Agricultural & Natural Resources (2012) Vol.11 (1) 199➔
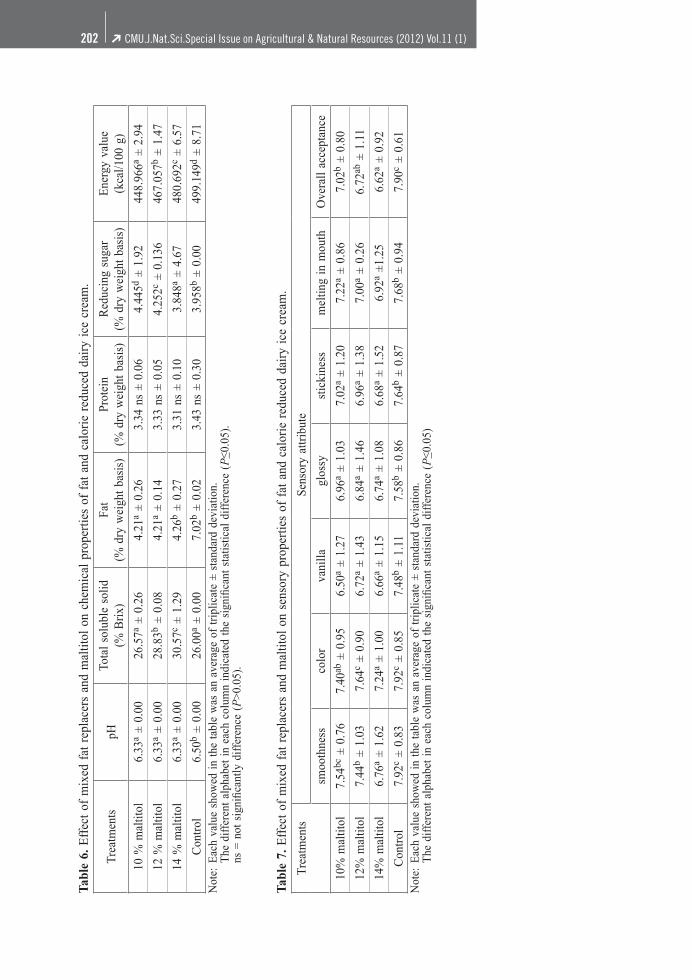
Effect of fat replacer and maltitol on properties of fat and calorie reduced dairy ice cream According to the experimental results from previous section, the mixed fat replacer of whey protein and Avicel at the ratio of 4:1 provided the ice cream with good overall properties espe-cially physical and sensory properties as compared with those of ice creams prepared from others fat replacer systems. Therefore, this fat replacer system was selected for preparing the ice cream sample in this section. Maltitol addition was varied at 3 levels of 10, 12 and 14 % (w/w) and the obtained ice creams were compared with the control ice cream of 12% sucrose. The viscosity of fat and calorie reduced ice creams were increased with amount of maltitol addition which was agreed with previously reported (Akin, 2007). The viscosity of the ice cream with 10% maltitol was not significantly (P>0.05) different from the control sample. The overrun was also increased with the amount of maltitol added. The overrun of fat and calorie reduced ice creams were significantly (P≤0.05) higher than those of the control. The meltdown rates of the ice creams were reduced as the concentrations of maltitol increased which were corresponded with the viscosities. The rates were lower than the control ice cream (P≤0.05). The fat and calorie reduced ice creams had similar hardness which were significantly (P≤0.05) higher than the control sample. Maltitol trended to increase brightness of the ice creams. The a* and b* values of the ice creams with maltitol were higher than the control one (P≤0.05) (Table 5). Addition of maltitol did not affect the pH of the ice cream sample (Table 6). However, the pH of the ice creams with maltitol were lower than those of the control ice cream (P≤0.05). A 10% addition of maltitol provided the ice cream with the same total soluble solid with the control sample and the total soluble solid was increased with increasing of maltitol concentration. Sugar and fat played a role in increasing of the total soluble solid which improved viscosity of the ice cream mix and texture of the ice cream (Specter and Setser, 1994). Also, the maltitol addition did not affect both fat and protein contents in the ice cream. Reducing sugar in the ice cream with maltitol was generally higher than those in the control and the sugar was reduced with increasing of maltitol concentration. As expected, the energy content of the ice cream was increased with the content of maltitol. An addition of 10% maltitol provided the ice cream with the lowest energy value (P≤0.05) of 448.97 kcal/100 g. The sensory properties of the fat and calorie reduced ice creams were shown in Table 7. The smoothness of the ice cream with 10% maltitol was not significant different (P≤0.05) with the control. The score for color appearance of 12% maltitol ice cream was the same as the control one. The scored for vanilla odor, glossy, stickiness and melting in mouth of the ice cream with all concentrations were similar (P>0.05) but lower than those of the control ice cream (P≤0.05). The overall acceptance scored of 10% maltitol ice cream was the highest among the fat and calorie reduced ice creams studied.
CONCLUSION
The properties of fat and calorie reduced dairy ice cream were affected by both fat replacer and amount of sweetener used. For single fat replacer system, the ice cream with 5% fat content using whey protein as a fat replacer generally provided the fat-reduced ice cream with similar properties as the control sample. For the mixed fat replacer system, the mixture of whey protein and Avicel at the ratio of 4:1 provided the fat reduced ice cream with similar properties as the control. At this ratio of the mixed whey protein and Avicel fat replacer, A 10% addition of maltitol provided the low fat and calorie ice cream with similar properties as the control. These experimental results indicated the high potential of both fat replacer and maltitol to be applied in the production of fat and calorie reduced ice cream.
CMU.J.Nat.Sci.Special Issue on Agricultural & Natural Resources (2012) Vol.11 (1)➔200
Tabl
e 3.
Eff
ect
of m
ixed
pro
tein
-bas
ed a
nd c
arbo
hydr
ate-
base
fat
rep
lace
rs o
n ph
ysic
al a
nd c
hem
ical
pro
pert
ies
of f
at r
educ
ed d
airy
ice
cre
am.
Trea
tmen
tV
isco
sity
(cP
)O
verr
un (
%)
Mel
t dow
n ra
tpe
r 10
0 g
(g/m
in)
Har
dnes
s (g
)L*
pHTo
tal s
olub
le s
olid
(%
Brix
)A
naly
zed
fat
cont
ent (
% d
ry
wei
ght b
asis
)
A32
3.50
e ±
20.7
732
.27d
± 1.
310.
02ab
c ±
0.01
308.
36c
± 10
.78
83.4
5bcd
± 0.
916.
33ab
± 0
.03
26.6
3b ±
0.08
4.19
cd ±
0.4
3
WP:
A (
4:1)
92.4
2a ±
22.2
646
.98e
± 10
.11
0.02
abc
± 0.
0135
3.08
d ±
26.3
681
.54a
± 1.
136.
38c
± 0.
0128
.33e
± 0.
102.
52a
± 0.
29
WP:
A (
1:1)
321.
18e
± 14
.88
34.6
4d ±
5.49
0.02
abc
± 0.
0045
0.67
e ±
21.9
782
.60ab
c ±
2.24
6.40
c ±
0.02
27.9
0d ±
0.55
3.26
b ±
0.58
WP:
A (
1:4)
146.
18b
± 12
.48
43.1
9e ±
6.01
0.05
c ±
0.07
569.
18f ±
25.
5484
.19d
± 0.
596.
39c
± 0.
0127
.60cd
± 0
.44
4.18
cd ±
0.6
9
M54
5.50
g ±
20.2
918
.15b
± 2.
350.
16d
± 0.
0164
2.53
g ±
30.1
684
.36d
± 0.
776.
40c
± 0.
0127
.50c
± 0.
214.
39cd
± 0
.43
WP:
M (
4:1)
201.
47cd
± 2
3.05
47.2
0e ±
4.60
0.02
ab ±
0.0
044
6.87
e ±
18.9
182
.62ab
c ±
1.13
6.40
c ±
0.02
28.9
0fg ±
0.1
14.
01c
± 0.
13
WP:
M (
1:1)
867.
80h
± 29
.22
45.1
5e ±
4.26
0.01
a ±
0.00
366.
27d
± 37
.01
86.0
0e ±
1.62
6.39
c ±
0.01
28.4
0e ±
0.66
4.21
cd ±
0.3
2
WP+
M (
1:4)
166.
33bc
± 2
5.40
42.1
5e ±
3.17
0.02
abc
± 0.
0035
9.96
d ±
22.0
083
.99cd
± 0
.97
6.39
c ±
0.01
27.6
0cd ±
0.1
84.
31cd
± 0
.13
Al
4840
.33i ±
5.0
19.
58a
± 0.
210.
59f ±
0.0
373
8.09
h ±
23.5
685
.72e
± 0.
986.
28a
± 0.
0129
.13g
± 0.
164.
59d
± 0.
28
WP:
Al (
4:1)
96.1
8a ±
18.9
126
.13c
± 1.
820.
04bc
± 0
.01
355.
17d
± 30
.97
82.2
2ab ±
0.8
46.
33b
± 0.
0328
.67ef
± 0
.33
4.07
c ±
0.06
WP:
Al (
1:1)
222.
77d
± 13
.58
44.4
2e ±
2.56
0.02
abc
± 0.
0026
5.43
b ±
19.9
283
.59bc
d ±
0.65
6.33
b ±
0.01
28.5
7ef ±
0.2
04.
12c
± 0.
22
WP:
Al (
1:4)
399.
10f ±
10.
8947
.57e
± 1.
260.
02ab
cd ±
0.0
054
2.55
f ± 2
7.65
82.9
3abcd
± 0
.83
6.32
b ±
0.04
27.4
7c ±
0.16
4.27
cd ±
0.4
4
cont
rol
94.7
8a ±
0.74
31.4
4d ±
2.80
0.31
e ±
0.01
72.0
3a ±
3.72
83.3
bcd
± 0.
666.
50d
± 0.
0026
.00a
± 0.
007.
02e
± 0.
02N
ote:
Eac
h va
lue
show
ed i
n th
e ta
ble
was
an
aver
age
of t
ripl
icat
e ±
stan
dard
dev
iatio
n.
T
he d
iffe
rent
alp
habe
t in
eac
h co
lum
n in
dica
ted
the
sign
ifica
nt s
tatis
tical
dif
fere
nce
(P≤0
.05)
.
A
=Avi
cel,
M=M
T-01
, Al=
Alp
ha-s
tarc
h an
d W
P=W
hey
prot
ein.
CMU.J.Nat.Sci.Special Issue on Agricultural & Natural Resources (2012) Vol.11 (1) 201➔
Tabl
e 4.
Eff
ect
of m
ixed
pro
tein
-bas
ed a
nd c
arbo
hydr
ate-
base
fat
rep
lace
rs o
n se
nsor
y pr
oper
ties
of f
at r
educ
ed d
airy
ice
cre
am.
Trea
tmen
tsSe
nsor
y at
trib
ute
Smoo
thne
ssC
olor
Van
illa
Glo
ssy
Stic
kine
ssM
eltin
g in
mou
thO
vera
ll ac
cept
ance
WP:
A (
4:1)
6.96
ab ±
1.4
67.
04ab
± 1
.27
6.36
a ±
1.22
7.08
ns
± 1
.38
6.96
ns
± 1.
217.
00ab
± 1
.54
7.08
ab ±
1.1
5
WP:
M (
4:1)
6.56
a ±
1.46
6.80
a ±
1.08
6.56
ab ±
1.3
66.
92 n
s ±
1.29
6.64
ns
± 1.
156.
88b
± 1.
016.
64a
± 1.
44
WP:
Al
(1:4
)6.
60a
± 1.
386.
8a ±
1.04
6.72
ab ±
1.1
77.
20 n
s ±
1.19
6.80
ns
± 0.
967.
12ab
± 0
.88
6.96
a ±
0.93
Con
trol
7.20
ab ±
1.1
97.
40b
± 1.
087.
08b
± 1.
387.
20 n
s ±
1.12
6.96
ns
± 1.
027.
24ab
± 0
.93
7.24
ab ±
1.0
1N
ote:
Eac
h va
lue
show
ed i
n th
e ta
ble
was
an
aver
age
of t
ripl
icat
e ±
stan
dard
dev
iatio
n.
T
he d
iffe
rent
alp
habe
t in
eac
h co
lum
n in
dica
ted
the
sign
ifica
nt s
tatis
tical
dif
fere
nce
(P≤0
.05)
.
A
=Avi
cel,
M=M
T-01
, Al=
Alp
ha-s
tarc
h an
d W
P=W
hey
prot
ein.
ns =
not
sig
nific
antly
dif
fere
nce
(P>0
.05)
.
Tabl
e 5.
Eff
ect
of m
ixed
fat
rep
lace
rs a
nd m
altit
ol o
n ph
ysic
al p
rope
rtie
s of
fat
and
cal
orie
red
uced
dai
ry i
ce c
ream
.
Trea
tmen
tsV
isco
sity
(cP
)O
verr
un (
%)
Mel
t do
wn
rate
per
100
g (g
/min
)H
ardn
ess
(g)
Col
or
L*
a*b*
10 %
mal
titol
98.5
8a ±
2.28
33.8
8b ±
1.29
0.53
c ±
0.09
231.
35b
± 22
.82
81.9
7a ±
1.89
- 0.
85a
± 0.
19+1
5.59
c ±
1.30
12 %
mal
titol
109.
12b
± 7.
2844
.52c
± 2.
230.
34b
± 0.
0523
0.09
b ±
15.1
583
.44b
± 1.
15-
0.82
a ±
0.27
+14.
18b
± 0.
44
14 %
mal
titol
154.
12c
± 9.
4545
.88c
± 0.
360.
07a
± 0.
0123
8.98
b ±
21.4
884
.17b
± 1
.13
- 1.
22b
± 0.
11+1
5.20
c ±
0.54
Con
trol
94.7
8a ±
0.74
31.4
4a ±
2.80
0.60
d ±
0.00
72.0
3a ±
3.72
83.3
4b ±
0.66
- 2.
33c
± 0.
07+1
2.05
a ±
0.79
Not
e: E
ach
valu
e sh
owed
in
the
tabl
e w
as a
n av
erag
e of
tri
plic
ate
± st
anda
rd d
evia
tion.
The
dif
fere
nt a
lpha
bet
in e
ach
colu
mn
indi
cate
d th
e si
gnifi
cant
sta
tistic
al d
iffe
renc
e (P
≤0.0
5).
CMU.J.Nat.Sci.Special Issue on Agricultural & Natural Resources (2012) Vol.11 (1)➔202
Tabl
e 6.
Eff
ect
of m
ixed
fat
rep
lace
rs a
nd m
altit
ol o
n ch
emic
al p
rope
rtie
s of
fat
and
cal
orie
red
uced
dai
ry i
ce c
ream
.
Trea
tmen
tspH
Tota
l so
lubl
e so
lid(%
Bri
x)Fa
t(%
dry
wei
ght
basi
s)Pr
otei
n(%
dry
wei
ght
basi
s)R
educ
ing
suga
r(%
dry
wei
ght
basi
s)E
nerg
y va
lue
(kca
l/100
g)
10 %
mal
titol
6.33
a ±
0.00
26.5
7a ±
0.26
4.21
a ±
0.26
3.34
ns
± 0.
064.
445d
± 1.
9244
8.96
6a ±
2.94
12 %
mal
titol
6.33
a ±
0.00
28.8
3b ±
0.08
4.21
a ±
0.14
3.33
ns
± 0.
054.
252c
± 0.
136
467.
057b
± 1.
47
14 %
mal
titol
6.33
a ±
0.00
30.5
7c ±
1.29
4.26
b ±
0.27
3.31
ns
± 0.
103.
848a
± 4.
6748
0.69
2c ±
6.57
Con
trol
6.50
b ±
0.00
26.0
0a ±
0.00
7.02
b ±
0.02
3.43
ns
± 0.
303.
958b
± 0.
0049
9.14
9d ±
8.71
Not
e: E
ach
valu
e sh
owed
in
the
tabl
e w
as a
n av
erag
e of
tri
plic
ate
± st
anda
rd d
evia
tion.
The
dif
fere
nt a
lpha
bet
in e
ach
colu
mn
indi
cate
d th
e si
gnifi
cant
sta
tistic
al d
iffe
renc
e (P
≤0.0
5).
ns =
not
sig
nific
antly
dif
fere
nce
(P>0
.05)
.
Tabl
e 7.
Eff
ect
of m
ixed
fat
rep
lace
rs a
nd m
altit
ol o
n se
nsor
y pr
oper
ties
of f
at a
nd c
alor
ie r
educ
ed d
airy
ice
cre
am.
Trea
tmen
tsSe
nsor
y at
trib
ute
smoo
thne
ssco
lor
vani
llagl
ossy
stic
kine
ssm
eltin
g in
mou
thO
vera
ll ac
cept
ance
10%
mal
titol
7.54
bc ±
0.7
67.
40ab
± 0
.95
6.50
a ±
1.27
6.96
a ±
1.03
7.02
a ±
1.20
7.22
a ±
0.86
7.02
b ±
0.80
12%
mal
titol
7.44
b ±
1.03
7.64
c ±
0.90
6.72
a ±
1.43
6.84
a ±
1.46
6.96
a ±
1.38
7.00
a ±
0.26
6.72
ab ±
1.1
1
14%
mal
titol
6.76
a ±
1.62
7.24
a ±
1.00
6.66
a ±
1.15
6.74
a ±
1.08
6.68
a ±
1.52
6.92
a ±1
.25
6.62
a ±
0.92
Con
trol
7.92
c ±
0.83
7.92
c ±
0.85
7.48
b ±
1.11
7.58
b ±
0.86
7.64
b ±
0.87
7.68
b ±
0.94
7.90
c ±
0.61
Not
e: E
ach
valu
e sh
owed
in
the
tabl
e w
as a
n av
erag
e of
tri
plic
ate
± st
anda
rd d
evia
tion.
The
dif
fere
nt a
lpha
bet
in e
ach
colu
mn
indi
cate
d th
e si
gnifi
cant
sta
tistic
al d
iffe
renc
e (P
≤0.0
5)
CMU.J.Nat.Sci.Special Issue on Agricultural & Natural Resources (2012) Vol.11 (1) 203➔
ACKNOWLEDGEMENTS
The authors would like to thanks the National Research Council of Thailand (NRCT) for partially supported this project and also the Faculty of Agro-Industry, Chiang Mai University for all facilities in laboratory works.
REFERENCES
Abd El-Rahman, A.M., Madkor, S.A., Ibrahim, F.S., and A. Kilara. 1997. Physical characteristics of frozen desserts made with cream, anhydrous milk fat, or milk fat fractions. Journal of Dairy Science 80(9): 1926-1935.
AOAC. 2000. Offificial methods of analysis of AOAC international. 17th ed. AOAC International, Gaithersburg, MD.
Arbuckle, W.S. 1986. Ice cream. 4th ed. The AVI Publishing Company, Westport.Akin, M.B., M.S. Akin, and Z. Kirmaci. 2007. Effects of inulin and sugar levels on the viability
of yogurt and probiotic bacteria and the physical and sensory characteristics in probiotic ice-cream. Food Chemistry 104: 93-99.
Boode, K., C. Bisperink, and P. Walstra. 1991. Destabilization of O/W emulsions containing fat crystals by temperature cycling. Colloids Surfaces 61: 55-74.
Cody, T.L., A. Olabi, A.G. Pettingell, P.S. Tong, and J.H. Walker. 2007. Evaluation of rice flour for use in vanilla ice cream. Journal of Dairy Science 90: 4575-4585.
Dervisoglu, M., and F. Yazici. 2006. The effect of citrus fibre on the physical, chemical and sensory properties of ice cream. Food Science and Technology International 12: 159-164.
Fennema, O.R., and S.R. Tannenbaum. 1985. Introduction to food chemistry. Marcel Dekker, New York.
Garcia, R.S., R.T. Marshall, and A. Heyman. 1995. Low fat ice cream form freeze concentrated nonfat milk solid. Journal of Dairy Science 78: 2345-2351.
Goff, H.D. 1997. Colloidal aspects of ice cream - A review. International Dairy Journal 7: 363-373.
Guinard, J.X., C. Zoumas-Morse, L. Mori, B. Uatoni, D. Panyam, and A. Kilara. 1997. Sugar and fat effects on sensory properties of ice cream. Journal of Food Science 62: 1087-1094.
Kailasapathy, K., and W. Songvanich. 1998. Effect of replacing fat in ice cream with fat mimetics. Food Australia (50)4: 169-173.
Koeferli, C.R.S., P. Piccinali, and S. Sigrist. 1996. The influence of fat, sugar and non-fat milk solids on selected taste, flavor and texture parameters of vanilla-ice cream. Food Quality and Preference 7(2): 69-79.
Marshall, R.T., and W.S. Arbuckle. 1996. Ice cream. 5th ed. International Thomson Publishing, New York.
Marshall, R.T., H.D. Goff, and R.W. Hartel. 2003. Ice cream. 3rd ed. Aspen Publishers, New York.
Muhammet, D. 2006. Influence of hazelnut flour and skin addition on the physical, chemical and sensory properties of vanilla ice cream. International Journal of Food Science and Techno-logy 41: 657-661.
Roland, A.M., L.G. Phillips, and K.J. Boor. 1999. Effects of fat content on the sensory properties, melting, color, and hardness of ice cream. Journal of Dairy Science 82: 32-38.
Snyder, E.M. 1984. Industrial microscopy of starchs. p. 661-673. In R.L. Whistler, J.N. Bemiller and E.F. Paschall (eds) Starch: Chemistry and technology. 2nd ed. Academic Press, New York.
Soukoulis, C., D. Lebesi, and C. Tzia. 2009. Enrichment of ice cream with dietary fibre: Effects on rheological properties, ice crystallisation and glass transition phenomena. Food Chemistry 115: 665-671.
Specter, S.E., and C.S. Setser. 1994. Sensory and physical properties of a reduced calorie frozen dessert system made with milk fat and sucrose substitute. Journal of Dairy Science 77: 707-717.

CMU.J.Nat.Sci.Special Issue on Agricultural & Natural Resources (2012) Vol.11 (1)➔204
van Boekel, M.A.J.S., and P. Walstra. 1981. Stability of oil in water emulsions with crystals in the disperse phase. Colloids and Surfaces 3: 109-l18.
Walstra, P., and R. Jenness. 1984. Dairy chemistry and physics. John Wiley and Sons, New York.