Embed Size (px)
Citation preview
P O S I V A O Y
FI -27160 OLKILUOTO, F INLAND
Tel +358-2-8372 31
Fax +358-2-8372 3709
Pau la Keto
P i r j o Kuu la -Vä i sänen
J a a k k o R u u s k a n e n
May 2006
Work ing Repor t 2006 -34
Effect of Material Parameterson the Compactibility of Backfill Materials
May 2006
Working Reports contain information on work in progress
or pending completion.
The conclusions and viewpoints presented in the report
are those of author(s) and do not necessarily
coincide with those of Posiva.
Pau la Keto
Saan io & R iekko la Oy
P i r jo Kuu la -Vä isänen
Tampere Un ive rs i t y o f Techno logy
Jaakko Ruuskanen
Metso Mine ra l s (Tampere ) Oy
Work ing Report 2006 -34
Effect of Material Parameterson the Compactibility of Backfill Materials

EFFECT OF MATERIAL PARAMETERS ON THE COMPACTIBILITY OF BACKFILL MATERIALS ABSTRACT The effect of different parameters on compactibility of mixture of bentonite and ballast as well as Friedland-clay was studied in laboratory with two different types of compaction tests. The material parameters varied were grain size distribution of the ballast material, grain shape, water ratio and bentonite content (15/30%). The other parameters varied were salinity of the mixing water, mixing process and compaction method & energy. Ballast materials with varying grain size distributions were produced from Olkiluoto mica-gneiss with different type of crushing processes. In addition, sand was chosen for ballast material due to its uniform grain size distribution and rounded grain shape. The maximum grain size of the ballast materials was between 5-10 mm. When comparing the compactibility of ballast materials, the highest dry densities were gained for ballast materials with graded grain size distribution. The compaction behaviour of the tested bentonite ballast mixtures is dominated by the bentonite content. The other parameters varied did not have significant effect on the compactibility of the mixtures with bentonite content of 30%. This can be explained with the amount of bentonite that is higher than what is needed to fill up the volume between the ballast grains. The results gained with the two different compaction tests are comparable. Both the bentonite/ballast mixtures and the Friedland clay behaved similarly when compacted with three different compaction pressures (180, 540 & 980 kPa). Keywords: Compactibility, material parameters, grain size distribution, maximum dry density, crushing process

MATERIAALIPARAMETRIEN VAIKUTUS TÄYTEAINEEN TIIVISTETTÄVYY-TEEN TIIVISTELMÄ Erilaisten parametrien vaikutusta bentoniitti-murskeseoksen ja Friedland-saven tiivistet-tävyyteen tutkittiin laboratoriossa kahdella erilaisella tiivistyskokeella. Varioituja mate-riaaliparametrejä olivat runkoaineen raekokojakauma, raemuoto, vesipitoisuus ja bento-niitin määrä (15/30%). Muita varioituja parametrejä olivat massaan sekoitetun veden suolapitoisuus, sekoitusprosessi sekä tiivistystapa ja –energia. Varioimalla murskausprosessia tuotettiin Olkiluodon kiille-gneissistä runkoaineita, joil-la oli toisistaan poikkeava raekokojakauma. Lisäksi yhdeksi runkoaineeksi valittiin hiekka sen lajittuneen raekokojakauman ja pyöreän raemuodon perusteella. Runkoainei-den maksimiraekoko oli 5-10 mm. Vertailtaessa eri runkoaineiden tiivistettävyyttä ha-vaittiin, että kaikista suurimmat kuivatiheydet saavutettiin runkoaineilla, joilla oli lajit-tumaton raeokokojakauma. Bentoniitti-murskeseosten tiivistyskäyttäytyminen määräytyi bentoniitin määrän mu-kaan. Muilla varioiduilla parametreillä ei ollut merkittävää vaikutusta tiivistettävyyteen kun bentoniitin määrä seoksessa oli 30%. Tämä voidaan selittää bentoniitin määrällä, joka oli suurempi kuin mitä tarvitaan runkoaineen rakeiden välisen tilavuuden täyttämi-seen. Kahdella eri tiivistyskokeella saavutetut tulokset olivat vertailukelpoisia. Sekä 30/70-seokset että Friedland-savi käyttäytyivät samalla tavalla kun niitä tiivistettiin kolmella eri tiivistyspaineella (180, 540 ja 980 kPa). Avainsanat: tiivistettävyys, materiaaliparametrit, raekokojaukauma, maksimi kuivati-heys, murskausprosessi

1
TABLE OF CONTENTS
ABSTRACT
TIIVISTELMÄ
TABLE OF CONTENTS.................................................................................................. 1
LIST OF SYMBOLS........................................................................................................ 3
PREFACE....................................................................................................................... 5
1 INTRODUCTION................................................................................................... 7
2 MATERIALS .......................................................................................................... 9
3 METHODS .......................................................................................................... 13
4 SIMULATION OF CRUSHING PROCESSES..................................................... 17 4.1 Introduction ................................................................................................ 17 4.2 Crushing tests & proposed crushing processes......................................... 18 4.3 Feed fraction .............................................................................................. 23 4.4 Grading curves & flakiness index............................................................... 25 4.5 Capacities & energies ................................................................................ 27 4.6 Conclusions................................................................................................ 27
5 RESULTS FOR CONCEPT A ............................................................................. 31 5.1 Ballast materials......................................................................................... 31
5.1.1 Grain size characteristics ............................................................... 31 5.1.2 Optimum water content and maximum dry density ........................ 33 5.1.3 Porosity........................................................................................... 34
5.2 Mixtures...................................................................................................... 34 5.2.1 Optimum water content and maximum dry density ........................ 35 5.2.2 Effective clay dry density (ECDD) .................................................. 36
5.3 Effect of different parameters on compactibility ......................................... 37 5.3.1 Effect of grain size characteristics .................................................. 37 5.3.2 Effect of compaction method and energy ....................................... 38 5.3.3 Effect of bentonite content.............................................................. 40 5.3.4 Effect of ballast material ................................................................. 42 5.3.5 Effect of mixing procedure.............................................................. 42 5.3.6 Effect of saline mixing water........................................................... 43
5.4 Hydraulic conductivity ................................................................................ 44 5.5 Discussion on laboratory methods ............................................................. 45 5.6 Workability of materials in laboratory conditions ........................................ 46
6 RESULTS FOR CONCEPT B ............................................................................. 47 6.1 Optimum water content and maximum dry density .................................... 47 6.2 Effect of compaction energy....................................................................... 47

2
7 DISCUSSION AND CONCLUSIONS .................................................................. 49
LIST OF REFERENCES............................................................................................... 53
LIST OF APPENDICES................................................................................................ 55
3
LIST OF SYMBOLS Cu Uniformity coefficient (d60/d10), used for expressing the grain size
characteristics of the sample, (dimensionless) D Grain size (mm) d10 Effective grain size (mm), 10% of the particles are smaller and 90%
larger than this grain size d50 Average grain size (mm), 50% of the grains are smaller and 50% larger
than this grain size d60 60% of the grains are smaller and 40% larger than this grain size d90 90% of the grains are smaller and 10% larger than this grain size ECDD Effective clay dry density (mdry (clay)/Vclay + Vvoids) FI Flakiness index (of crushed rock) Fi Flakiness index of a fraction K Hydraulic conductivity (m/s) K20 Average hydraulic conductivity of two parallel samples (m/s) mdry dry mass of clay/solids (kg) n Porosity (Vv/V) Q Discharge (m3/s) Vclay Volume of clay particles (m3) Vv Volume of voids (m3) w-% Weight percent ρdry Dry density (kg/m3)

4
5
PREFACE The crushing tests of different types of ballast materials for the WP2 step 1 tests were performed in the rock laboratory of Metso Minerals (Tampere) Oy. The laboratory crushing processes were designed by Research Engineer Jaakko Ruuskanen, Metso Minerals (Tampere) Oy. The laboratory studies concerning compaction properties were performed at Laboratory of Engineering Geology at Tampere University of Technology under supervision of Research Scientist Pirjo-Kuula Väisänen. The tests were designed by the project group leader Paula Keto (Saanio & Riekkola Oy) with the help of SKB and Posiva and the persons mentioned above. The project was supervised by the project steering group and the project managers David Gunnarsson (SKB) and Johanna Hansen (Posiva Oy) who also participated in coordinating of the project. The people nominated to the expert group of the BACLO project took part in reviewing the work.

6
7
1 INTRODUCTION The work is a part of the second phase of the joint SKB and Posiva project “Backfilling and Closure of the Deep Repository” (BACLO) consisting of four different phases. Six preliminary backfilling concepts were evaluated in the first phase of the project in order to choose the most promising ones to laboratory-scale experiments and more profound analyses. The aim of the second phase of the project is to select 1-2 main alternatives for pilot tests (phase 3) and finally one concept for a large-scale field test (phase 4). The backfilling concepts chosen for the second phase were (Gunnarsson et al. 2004): - Concept A: in situ compacted mixture of bentonite and ballast (30:70) - Concept B: in situ compacted natural swelling clay - Concept D: pre-compacted blocks (various material properties) The second phase was divided into seven different work packages (WP) concerning the following issues: - WP 1: Geotechnical properties and water inflow/sealing ability tests. - WP 2: Material properties affecting the compactibility and optimisation of
compaction techniques for in situ concepts A & B - WP 3: Compaction properties of backfill materials concerning block pressing - WP 4: Technology study block emplacement - WP 5: Technology study block pressing - WP 6: Supporting activities - WP7: Assessment of the concepts, reporting and planning of the next phase. This study belongs to first step of the Work package 2 (WP2). The aim of the work is to study which material parameters affect its compactibility and to optimise them in order to reach the highest possible dry density for the material during in situ compaction. For mixture of bentonite and ballast (concept A) it is also necessary to gain high dry density for the bentonite between the ballast grains. If the effective clay dry density of the bentonite clay between the grains of ballast material is not high enough, it is probable that the material cannot fulfil the requirements concerning low enough hydraulic conductivity (< 1E-10 m/s) and high enough swelling pressure (> 100 kPa) at groundwater salinity of 3.5%. The effective clay dry density (ECDD) is determined as (Equation 1-1) (Dixon 2000):
voidsofvolumeclaybyoccupiedvolumeclayofmassdryECDD
+= (Eq.1-1)
According to various laboratory studies (i.e. Karnland 1998, Dixon 2000, 2002), the ECDD should be > 1 000 kg/m3. In addition to high ECDD, some other material parameters may also affect the hydraulic conductivity of the bentonite/ballast mixture, for example the homogeneity of the mixture and the maximum grain size of the ballast material. Another important issue that needs to be taken into account is the compressibility of the material. Although the
8
material would have high enough effective clay dry density to fulfil the requirement of hydraulic conductivity and swelling pressure, it does not necessarily mean that the compressibility of the material would be acceptable. An example of this is the Friedland clay (Gunnarsson et al. 2004). The required backfill density for fulfilling the requirements for permeability, swelling pressure and compressibility are studied in WP1 by Johannesson & Nilsson (2005). To be able to compare the results, same materials are studied both in WP1 and WP2. The compaction properties of the backfill material also effect the selection of compaction method and the working capacity of the backfilling process. The effect of following material parameters was evaluated in order to study their effect on the compactibility of the mixture of bentonite and ballast (concept A): - Grain size distribution of the ballast material - Maximum grain size - Bentonite content - Type of the ballast material (sand or crushed rock). The other parameters that varied were: - Salinity of the water added to the mixture - Type of the mixer (Eirich mixer or a normal laboratory mixer for soil samples) - Compaction force. The compaction pressure was varied in order to study the compaction behaviour of the material in general and to evaluate the force required to reach the maximum dry density. The same test was done also for Friedland-clay (concept B). The materials studied are described in chapter 2 and the laboratory methods used in chapters 3 and 4. The results are reported in chapters 5 (concept A) and 6 (concept B). Discussion and conclusions on the study are presented in chapter 7.
9
2 MATERIALS Ballast materials Three batches of crushed rock with different types of grain size distributions were prepared with laboratory scale crushers at the Metso Minerals rock laboratory in Tampere. Further, in order to provide test material for another BACLO project, one batch was prepared at Eurajoki by Interrock Oy with full-scale crushing equipment. This material was also included in this study. The crushing processes used are described in chapter 4. The feed material for the crushed rock was Olkiluoto mica-gneiss excavated from an open cut. The rock that will be excavated deep from the underground repository may have somewhat different properties compared to this rock. However, the effect of these differences to the ballast material properties can be assumed to be insignificant. The test materials were chosen so that the grain size distribution of the tested materials would differ from each other as much as possible. The maximum grain size of the test materials was limited to 5-10 mm due to two reasons: - According to previous experience gained by SKB, it is easier to achieve good
homogeneity for the mixture when the ballast material has maximum grain size lower than 20 mm. The homogeneity of the mixture may affect the hydraulic conductivity of the material in case the ballast grains are not evenly distributed in the material and they form small water conductive pathways through the material.
- The laboratory technique used for testing the hydraulic conductivity of the samples
allowed maximum grain size of 5 mm in WP1 and 10 mm in WP2 due to size of the testing cells.
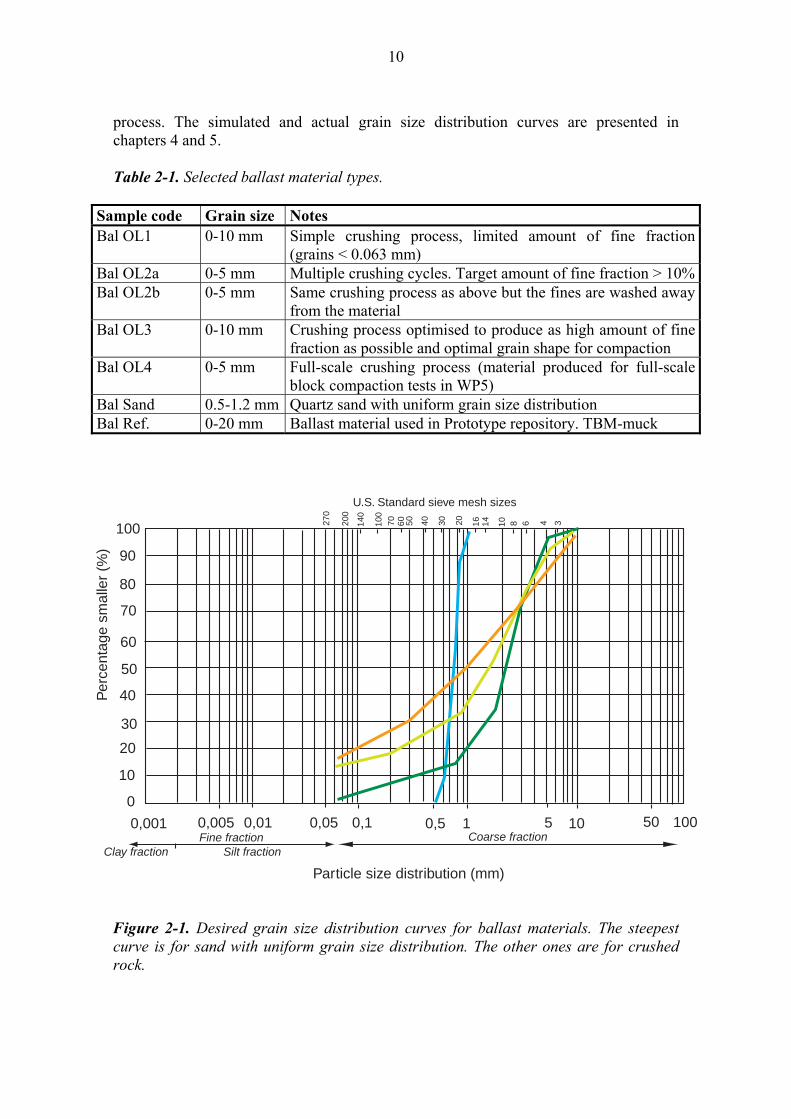
The majority of the ballast materials consisted of crushed rock with different type of grain size distributions (see table 2-1). One of the ballast materials was quartz sand with uniform grain size distribution (0.5-1.2 mm, Bal Sand). Crushed rock with wide grain size distribution and relatively high amount of fine fraction (< 0.063 mm) (Bal OL3) and the sand (Bal Sand) with narrow grading and no fines are supposed to present end members in the variety of ballast materials tested. Mixture used in the Prototype repository (Bal Ref) was chosen as a reference material. This material consists of mixture of bentonite and crushed TBM-muck with intended maximum grain size of 20 mm. However, due to the oblong shape of the TBM-muck, the material may also include some bigger grains with length of around 50 mm. The bentonite used in Prototype repository was Na-converted Ca-bentonite from Milos, Greece. The aim was to produce distinctive difference between the grain size distributions of the ballast materials in similar manner as presented in figure 2-1. In general, the more crushing cycles are used to produce the material, the gentler the profile of the curve is. In other words, the amount of crushing cycles controls the proportion of fine particles with respect to coarse particles. The actual grain size distribution depends on the crushability of the rock (rock type, mineralogy, texture etc.) and on the crushing
10
process. The simulated and actual grain size distribution curves are presented in chapters 4 and 5. Table 2-1. Selected ballast material types.
Sample code Grain size Notes Bal OL1 0-10 mm Simple crushing process, limited amount of fine fraction
(grains < 0.063 mm) Bal OL2a 0-5 mm Multiple crushing cycles. Target amount of fine fraction > 10%Bal OL2b 0-5 mm Same crushing process as above but the fines are washed away
from the material Bal OL3 0-10 mm Crushing process optimised to produce as high amount of fine
fraction as possible and optimal grain shape for compaction Bal OL4 0-5 mm Full-scale crushing process (material produced for full-scale
block compaction tests in WP5) Bal Sand 0.5-1.2 mm Quartz sand with uniform grain size distribution Bal Ref. 0-20 mm Ballast material used in Prototype repository. TBM-muck
Figure 2-1. Desired grain size distribution curves for ballast materials. The steepest curve is for sand with uniform grain size distribution. The other ones are for crushed rock.
100
Per
cent
age
smal
ler
(%)
Particle size distribution (mm)
U.S. Standard sieve mesh sizes
5010510,50,10,050,010,0050,001
0
10
20
30
40
50
60
70
80
90
100 270
200
140
100
70 60 50 40 30 20 16 14 10 8 6 4 3
Clay fraction Silt fractionFine fraction Coarse fraction
11
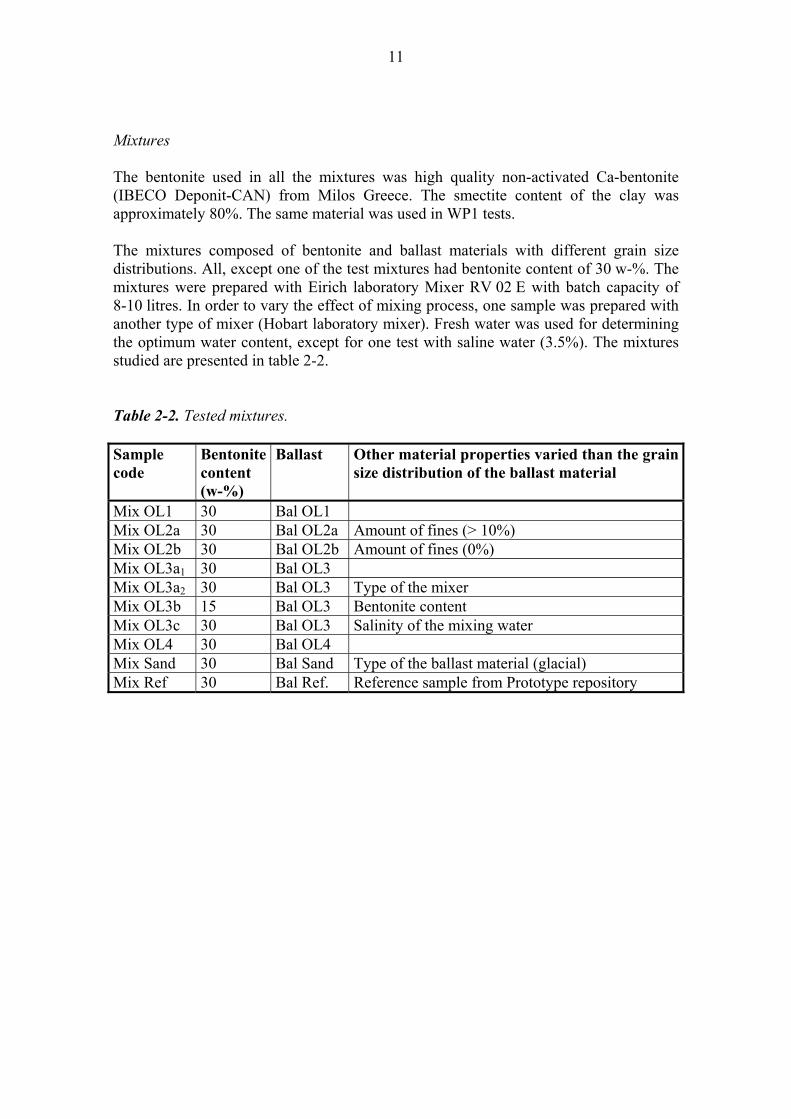
Mixtures The bentonite used in all the mixtures was high quality non-activated Ca-bentonite (IBECO Deponit-CAN) from Milos Greece. The smectite content of the clay was approximately 80%. The same material was used in WP1 tests. The mixtures composed of bentonite and ballast materials with different grain size distributions. All, except one of the test mixtures had bentonite content of 30 w-%. The mixtures were prepared with Eirich laboratory Mixer RV 02 E with batch capacity of 8-10 litres. In order to vary the effect of mixing process, one sample was prepared with another type of mixer (Hobart laboratory mixer). Fresh water was used for determining the optimum water content, except for one test with saline water (3.5%). The mixtures studied are presented in table 2-2. Table 2-2. Tested mixtures. Sample code
Bentonite content (w-%)
Ballast Other material properties varied than the grain size distribution of the ballast material
Mix OL1 30 Bal OL1 Mix OL2a 30 Bal OL2a Amount of fines (> 10%) Mix OL2b 30 Bal OL2b Amount of fines (0%) Mix OL3a1 30 Bal OL3 Mix OL3a2 30 Bal OL3 Type of the mixer Mix OL3b 15 Bal OL3 Bentonite content Mix OL3c 30 Bal OL3 Salinity of the mixing water Mix OL4 30 Bal OL4 Mix Sand 30 Bal Sand Type of the ballast material (glacial) Mix Ref 30 Bal Ref. Reference sample from Prototype repository

12
13
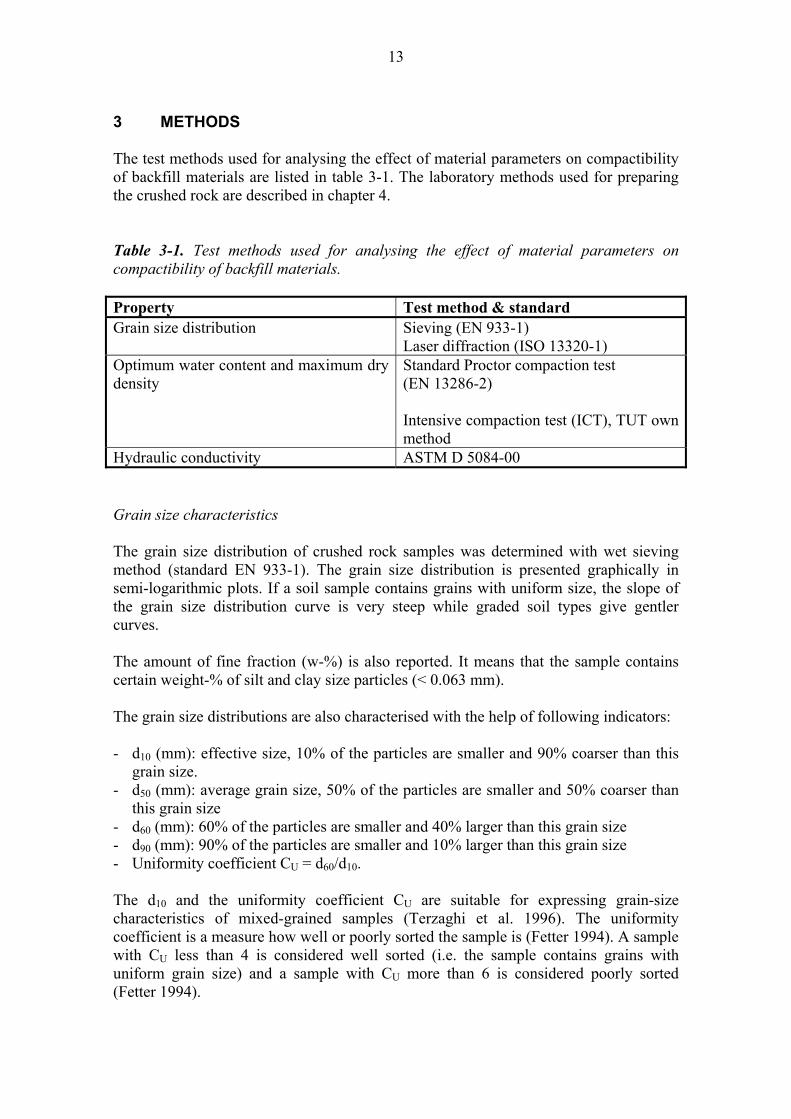
3 METHODS The test methods used for analysing the effect of material parameters on compactibility of backfill materials are listed in table 3-1. The laboratory methods used for preparing the crushed rock are described in chapter 4. Table 3-1. Test methods used for analysing the effect of material parameters on compactibility of backfill materials. Property Test method & standard Grain size distribution Sieving (EN 933-1)
Laser diffraction (ISO 13320-1) Optimum water content and maximum dry density
Standard Proctor compaction test (EN 13286-2) Intensive compaction test (ICT), TUT own method
Hydraulic conductivity ASTM D 5084-00 Grain size characteristics The grain size distribution of crushed rock samples was determined with wet sieving method (standard EN 933-1). The grain size distribution is presented graphically in semi-logarithmic plots. If a soil sample contains grains with uniform size, the slope of the grain size distribution curve is very steep while graded soil types give gentler curves. The amount of fine fraction (w-%) is also reported. It means that the sample contains certain weight-% of silt and clay size particles (< 0.063 mm). The grain size distributions are also characterised with the help of following indicators: - d10 (mm): effective size, 10% of the particles are smaller and 90% coarser than this
grain size. - d50 (mm): average grain size, 50% of the particles are smaller and 50% coarser than
this grain size - d60 (mm): 60% of the particles are smaller and 40% larger than this grain size - d90 (mm): 90% of the particles are smaller and 10% larger than this grain size - Uniformity coefficient CU = d60/d10. The d10 and the uniformity coefficient CU are suitable for expressing grain-size characteristics of mixed-grained samples (Terzaghi et al. 1996). The uniformity coefficient is a measure how well or poorly sorted the sample is (Fetter 1994). A sample with CU less than 4 is considered well sorted (i.e. the sample contains grains with uniform grain size) and a sample with CU more than 6 is considered poorly sorted (Fetter 1994).
14
Laser diffraction measurement is based on standard ISO 13320-1 (Particle size analysis – Laser diffraction methods Part 1: General principles). The calculation algorithm of the equipment used in this study (Sympatec laser diffraction analyser) is based on Fraunhofer diffraction theory. The equipment was used for measuring the size of bentonite granules (and not the actual particle size) in dry conditions. Porosity The porosity (n) was determined as the ratio of the volume of the voids (Vv) and the total volume (V) of the sample (Eq. 3-1):
(%)VV
n v= (Eq. 3-1)
Effective clay dry density ECDD The effective clay dry density was determined as (Eq. 3-2):
voidsofvolumeclaybyoccupiedvolumeclayofmassdryECDD
+=
(Eq. 3-2)
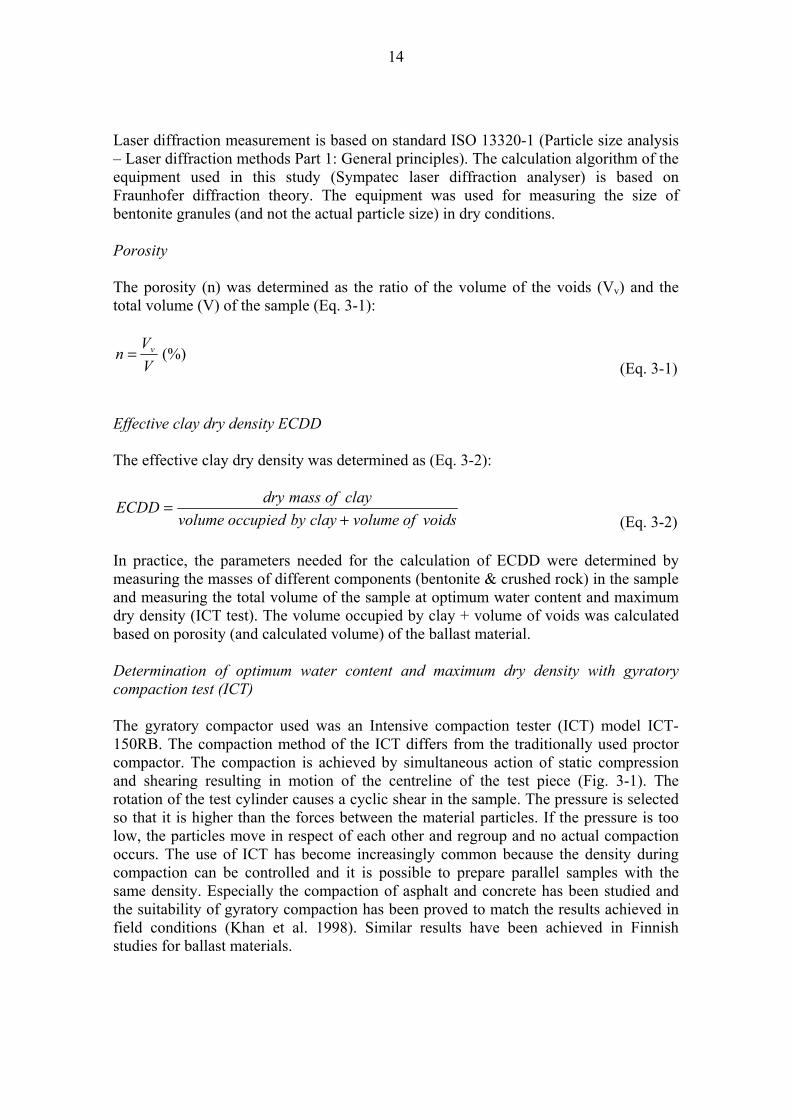
In practice, the parameters needed for the calculation of ECDD were determined by measuring the masses of different components (bentonite & crushed rock) in the sample and measuring the total volume of the sample at optimum water content and maximum dry density (ICT test). The volume occupied by clay + volume of voids was calculated based on porosity (and calculated volume) of the ballast material. Determination of optimum water content and maximum dry density with gyratory compaction test (ICT) The gyratory compactor used was an Intensive compaction tester (ICT) model ICT-150RB. The compaction method of the ICT differs from the traditionally used proctor compactor. The compaction is achieved by simultaneous action of static compression and shearing resulting in motion of the centreline of the test piece (Fig. 3-1). The rotation of the test cylinder causes a cyclic shear in the sample. The pressure is selected so that it is higher than the forces between the material particles. If the pressure is too low, the particles move in respect of each other and regroup and no actual compaction occurs. The use of ICT has become increasingly common because the density during compaction can be controlled and it is possible to prepare parallel samples with the same density. Especially the compaction of asphalt and concrete has been studied and the suitability of gyratory compaction has been proved to match the results achieved in field conditions (Khan et al. 1998). Similar results have been achieved in Finnish studies for ballast materials.
15
Figure 3-1. Priciple of gyratory compaction. Three different compression pressures were applied for 100 mm samples: 180, 540 and 980 kPa. Due to large grain size, the reference sample was prepared in a cell with diameter of 150 mm and the pressures used were 180, 360 and 540 kPa. During the ICT-compaction, the height of the sample and the shear force (Nm) between the metal plates in both ends of the samples were recorded. Determination of optimum water content and maximum dry density with Proctor compaction test Standard proctor compaction test has been used widely for the determination of optimum water content and maximum dry density. Various studies have showed that both ICT and proctor method can be used for these determinations, although the compaction principle is different. According to EN 13286-2, the energy used during standard proctor compaction test is 0,6 MJ/m3. The amount of compression energy can be varied by changing the amount of rammer blows on the sample. However, the actual compression process can not be controlled during the test. Hydraulic conductivity The determination of hydraulic conductivity K (m/s) is based on Darcy’s law and it is calculated with the following equation (Fetter 1994) (Eq. 3-3):
)/( dldhAQK −=
(Eq. 3-3)
Q = discharge (m3/s) A = area of the sample (m2) dh/dl = hydraulic gradient (m/m) The hydraulic conductivity was determined with a flexible wall permeameter (ASTM standard D 5084-00: Standard Test Methods for Measurement of Hydraulic Conductivity of Saturated Porous Materials Using a Flexible Wall Permeameter). The
16
permeameter has diameter of 200 mm. In general, the diameter of the sample can be 38-150 mm while the maximum height is 250 mm. In this particular case the diameter of the sample was 100 mm and the height was 112 mm. The sample is isolated from the liquid inside the test cell with a tight rubber membrane. The cell pressure is set to a sufficient level ensuring that there will not be any boundary flow between the sample and the rubber membrane. Front- and backpressure cells are used for creating hydraulic gradient over the sample. The disadvantage of this method is that when the hydraulic conductivity of the sample is lower than 1E-10 m/s, the accuracy of the results is not necessarily very good. Another thing that need to be taken into account when evaluating the results is that water permeability tests in laboratory conditions usually give a decade lower results compared to in-situ circumstances. Mixing and sample preparation Mixing of bentonite and ballast was performed with Eirich mixer model RV02E. Sampling and sample preparation was performed according to EN 932-1 and EN 932-2. The mixtures were prepared by adding first the dry components into the mixer. After mixing for 2 minutes, the water was added gradually to ensure a stable mix. The mixing time after the water addition was 5 minutes.
17
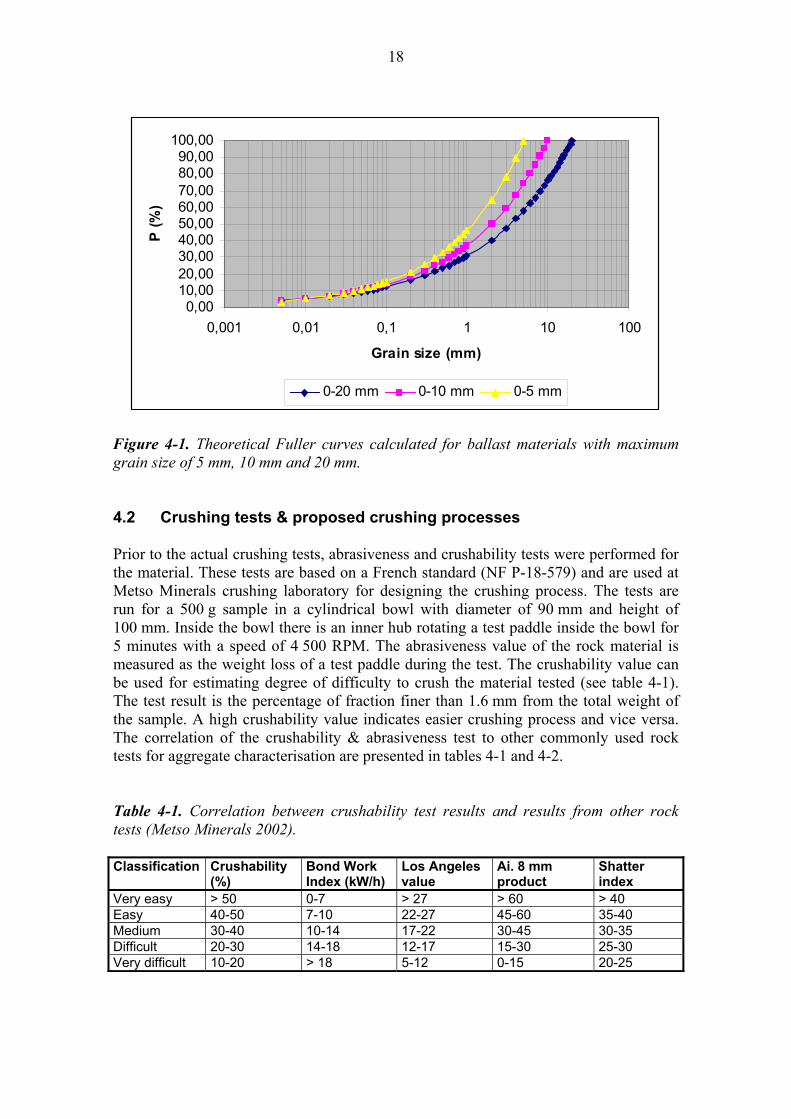
4 SIMULATION OF CRUSHING PROCESSES 4.1 Introduction The preliminary purpose was to point out the influence of crushing process on the product filling properties. The filling property means in this case the bulk densities of the individual crushing process end products. The bulk density of crushed particles can be described as the relation of the mass and the volume of randomly organised loosened material. The bulk density of granular material is always smaller than the density of single particles, because there are always voids between particles. The bulk density of a sample with narrow grading is smaller than of a sample with the wide grading. In addition, specific gravity, the shape of particles, limited size of the volume relation to particle size, friction between the particles (due to material moisture-cohesion) and the form of the particle surface have effect on bulk density. Based on quality requirements presented for the backfill ballast material, the grain size distribution curve should follow the Fuller curve and the grain size (d5) corresponding to value 5% passing (P) should be 0.01 mm for a material with maximum grain size of 20 mm (Pusch 1995, Tolppanen 1998). The corresponding Fuller curves for material with maximum grain size of 5 and 10 mm are presented in figure 4-1. The curves were calculated based on equation 4-1. The shape parameters were determined assuming that d5 = 0.01 mm.
n
DdP )(100max
= (Eq. 4-1)
P = Percentage of material passing the sieve (%) d = Grain size (mm) Dmax = Maximum grain size Since the aim was to gain the highest possible density for the bentonite fraction, it was questioned whether another type of ballast gradation than the Fueller type on could produce better packing for the clay fraction. The analogue was taken from clay rich basal tills having low permeability and good bearing capacity due to extremely wide grading and effective packing. The second target was to produce crushed test material for the other laboratory tests (see chapter 5). The basic idea was to produce ballast materials with different type of grain size distributions (narrow grading versus wide grading) and test the differences in the compactibility between the different ballasts and bentonite/ballast mixtures.
18
0,0010,0020,0030,0040,0050,0060,0070,0080,0090,00
100,00
0,001 0,01 0,1 1 10 100
Grain size (mm)
P (%
)
0-20 mm 0-10 mm 0-5 mm
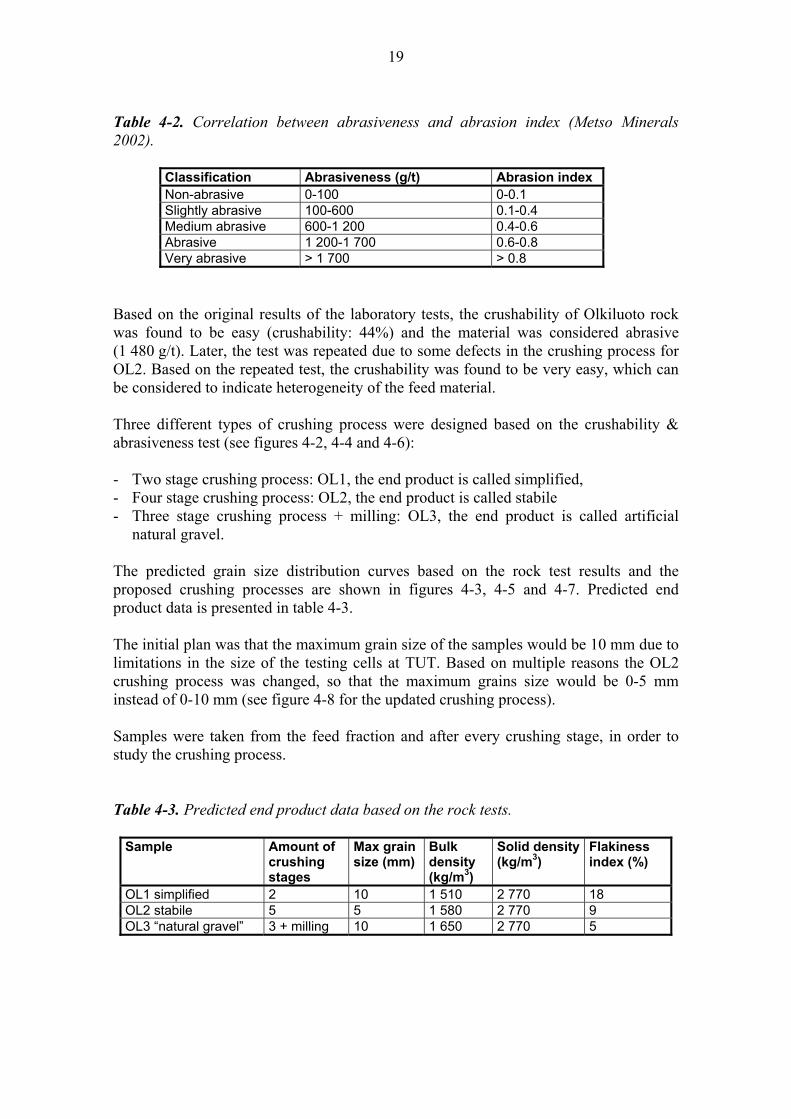
Figure 4-1. Theoretical Fuller curves calculated for ballast materials with maximum grain size of 5 mm, 10 mm and 20 mm. 4.2 Crushing tests & proposed crushing processes Prior to the actual crushing tests, abrasiveness and crushability tests were performed for the material. These tests are based on a French standard (NF P-18-579) and are used at Metso Minerals crushing laboratory for designing the crushing process. The tests are run for a 500 g sample in a cylindrical bowl with diameter of 90 mm and height of 100 mm. Inside the bowl there is an inner hub rotating a test paddle inside the bowl for 5 minutes with a speed of 4 500 RPM. The abrasiveness value of the rock material is measured as the weight loss of a test paddle during the test. The crushability value can be used for estimating degree of difficulty to crush the material tested (see table 4-1). The test result is the percentage of fraction finer than 1.6 mm from the total weight of the sample. A high crushability value indicates easier crushing process and vice versa. The correlation of the crushability & abrasiveness test to other commonly used rock tests for aggregate characterisation are presented in tables 4-1 and 4-2. Table 4-1. Correlation between crushability test results and results from other rock tests (Metso Minerals 2002). Classification Crushability
(%) Bond Work Index (kW/h)
Los Angeles value
Ai. 8 mm product
Shatter index
Very easy > 50 0-7 > 27 > 60 > 40 Easy 40-50 7-10 22-27 45-60 35-40 Medium 30-40 10-14 17-22 30-45 30-35 Difficult 20-30 14-18 12-17 15-30 25-30 Very difficult 10-20 > 18 5-12 0-15 20-25
19
Table 4-2. Correlation between abrasiveness and abrasion index (Metso Minerals 2002).
Classification Abrasiveness (g/t) Abrasion index Non-abrasive 0-100 0-0.1 Slightly abrasive 100-600 0.1-0.4 Medium abrasive 600-1 200 0.4-0.6 Abrasive 1 200-1 700 0.6-0.8 Very abrasive > 1 700 > 0.8
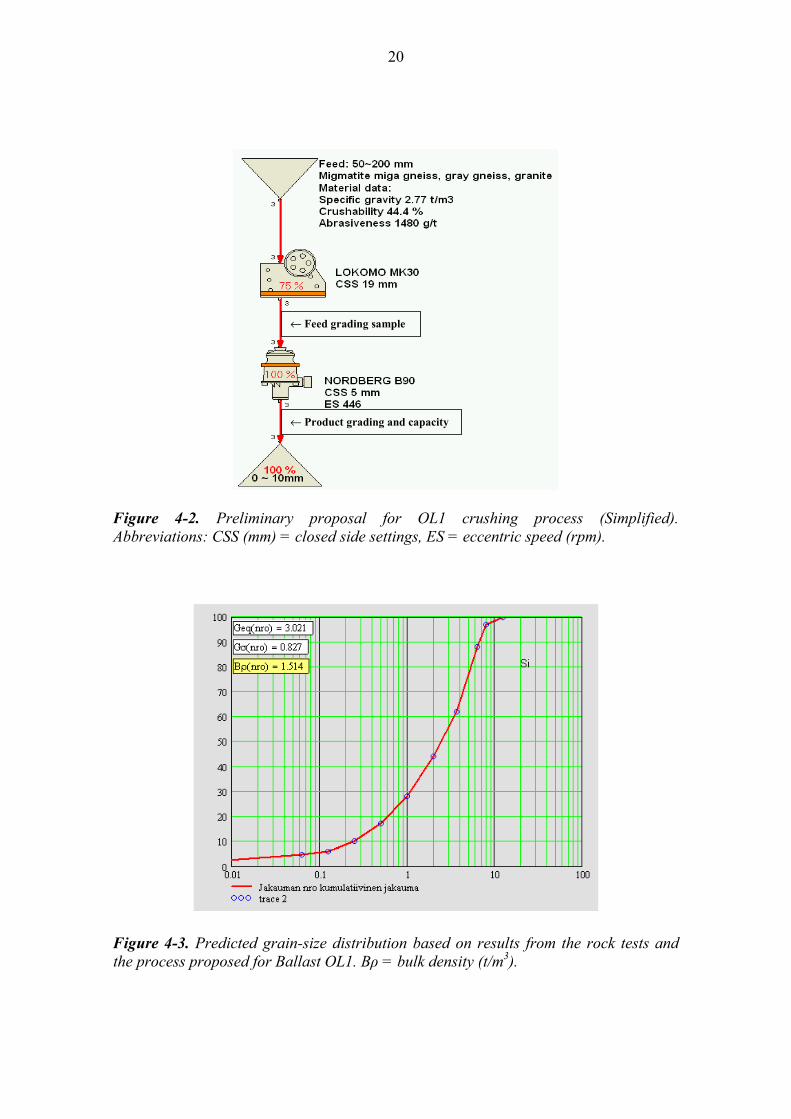
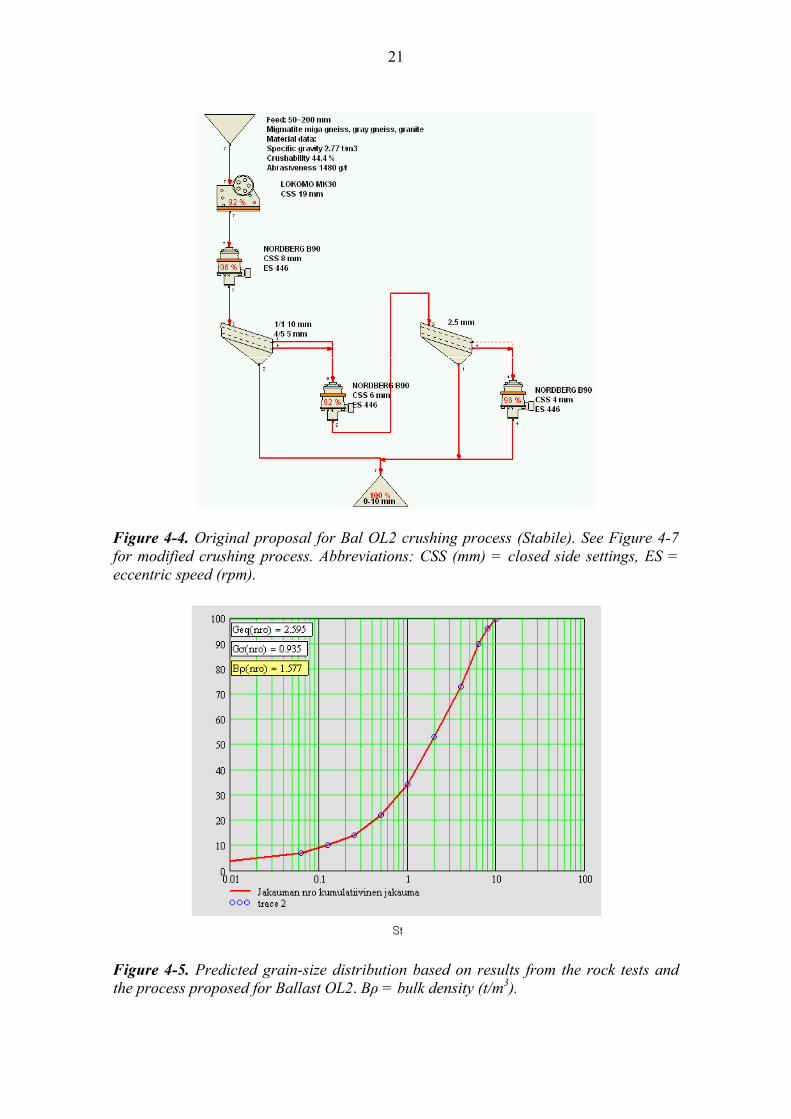
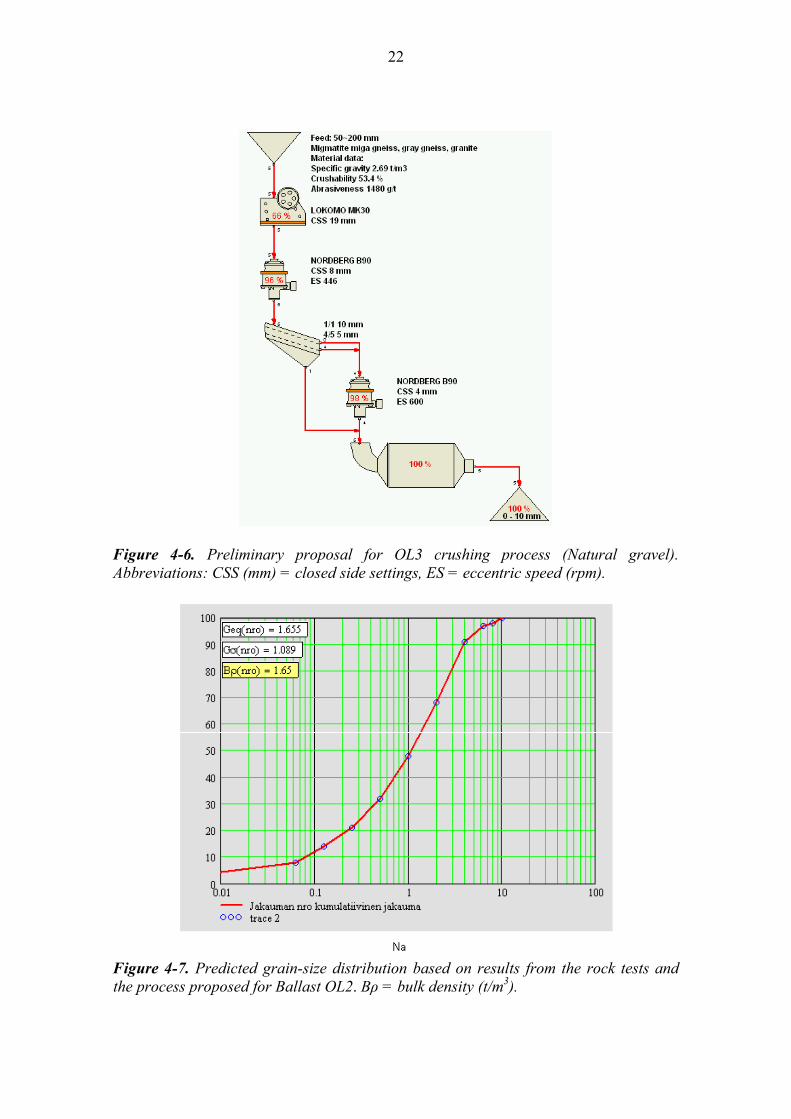
Based on the original results of the laboratory tests, the crushability of Olkiluoto rock was found to be easy (crushability: 44%) and the material was considered abrasive (1 480 g/t). Later, the test was repeated due to some defects in the crushing process for OL2. Based on the repeated test, the crushability was found to be very easy, which can be considered to indicate heterogeneity of the feed material. Three different types of crushing process were designed based on the crushability & abrasiveness test (see figures 4-2, 4-4 and 4-6): - Two stage crushing process: OL1, the end product is called simplified, - Four stage crushing process: OL2, the end product is called stabile - Three stage crushing process + milling: OL3, the end product is called artificial
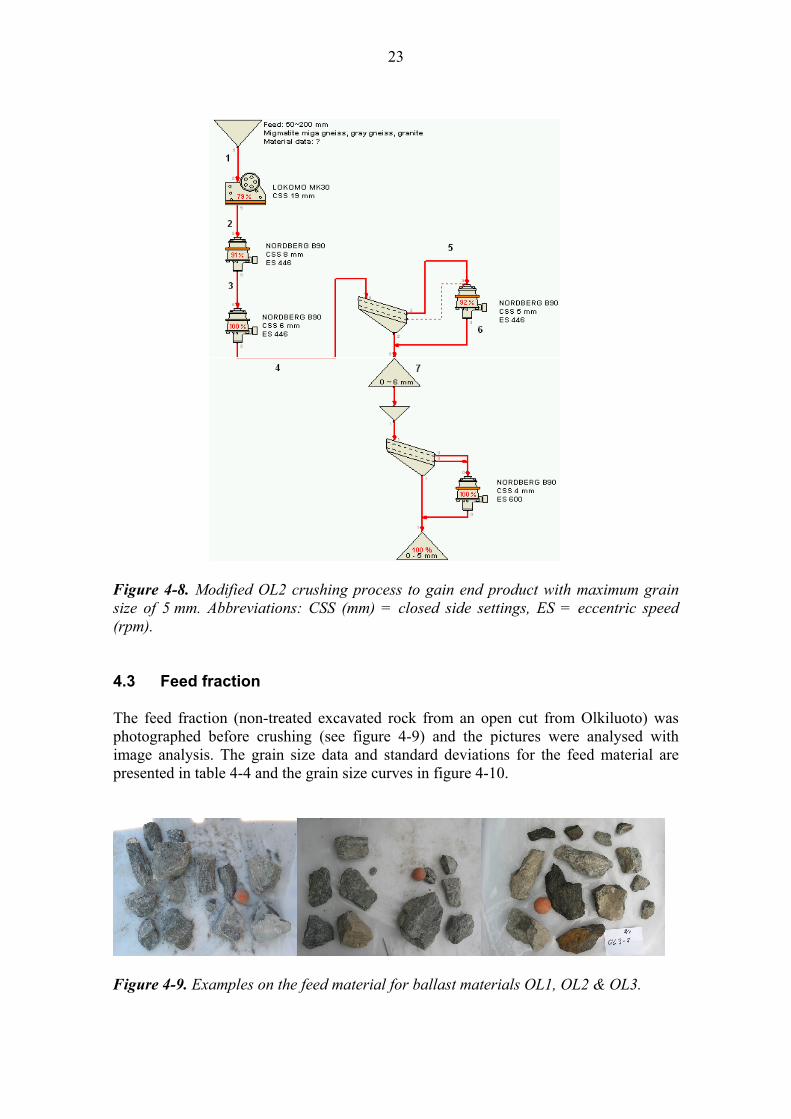
natural gravel. The predicted grain size distribution curves based on the rock test results and the proposed crushing processes are shown in figures 4-3, 4-5 and 4-7. Predicted end product data is presented in table 4-3. The initial plan was that the maximum grain size of the samples would be 10 mm due to limitations in the size of the testing cells at TUT. Based on multiple reasons the OL2 crushing process was changed, so that the maximum grains size would be 0-5 mm instead of 0-10 mm (see figure 4-8 for the updated crushing process). Samples were taken from the feed fraction and after every crushing stage, in order to study the crushing process. Table 4-3. Predicted end product data based on the rock tests.
Sample Amount of crushing stages
Max grain size (mm)
Bulk density (kg/m3)
Solid density (kg/m3)
Flakiness index (%)
OL1 simplified 2 10 1 510 2 770 18 OL2 stabile 5 5 1 580 2 770 9 OL3 “natural gravel” 3 + milling 10 1 650 2 770 5
20
Figure 4-2. Preliminary proposal for OL1 crushing process (Simplified). Abbreviations: CSS (mm) = closed side settings, ES = eccentric speed (rpm).
Figure 4-3. Predicted grain-size distribution based on results from the rock tests and the process proposed for Ballast OL1. Bρ = bulk density (t/m3).
← Feed grading sample
← Product grading and capacity
21
Figure 4-4. Original proposal for Bal OL2 crushing process (Stabile). See Figure 4-7 for modified crushing process. Abbreviations: CSS (mm) = closed side settings, ES = eccentric speed (rpm).
Figure 4-5. Predicted grain-size distribution based on results from the rock tests and the process proposed for Ballast OL2. Bρ = bulk density (t/m3).
22
Figure 4-6. Preliminary proposal for OL3 crushing process (Natural gravel). Abbreviations: CSS (mm) = closed side settings, ES = eccentric speed (rpm).
Figure 4-7. Predicted grain-size distribution based on results from the rock tests and the process proposed for Ballast OL2. Bρ = bulk density (t/m3).
23
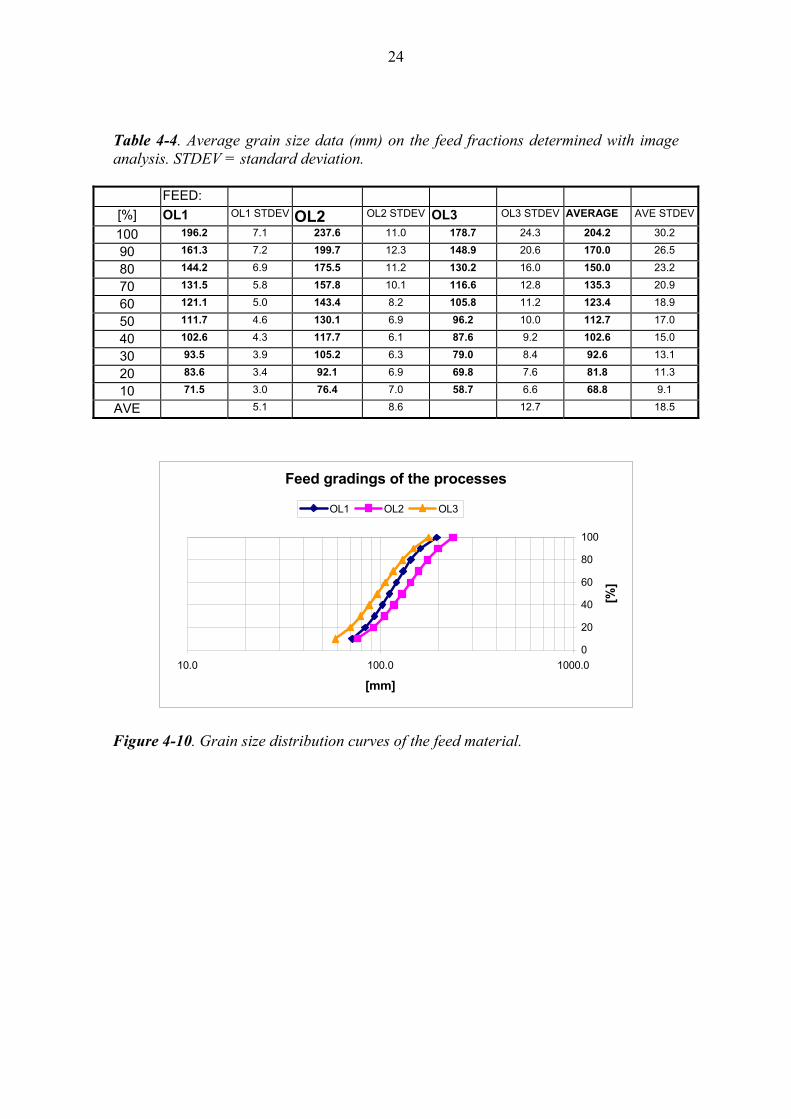
Figure 4-8. Modified OL2 crushing process to gain end product with maximum grain size of 5 mm. Abbreviations: CSS (mm) = closed side settings, ES = eccentric speed (rpm). 4.3 Feed fraction The feed fraction (non-treated excavated rock from an open cut from Olkiluoto) was photographed before crushing (see figure 4-9) and the pictures were analysed with image analysis. The grain size data and standard deviations for the feed material are presented in table 4-4 and the grain size curves in figure 4-10.
Figure 4-9. Examples on the feed material for ballast materials OL1, OL2 & OL3.
24
Table 4-4. Average grain size data (mm) on the feed fractions determined with image analysis. STDEV = standard deviation.
FEED: [%] OL1 OL1 STDEV OL2 OL2 STDEV OL3 OL3 STDEV AVERAGE AVE STDEV
100 196.2 7.1 237.6 11.0 178.7 24.3 204.2 30.2
90 161.3 7.2 199.7 12.3 148.9 20.6 170.0 26.5
80 144.2 6.9 175.5 11.2 130.2 16.0 150.0 23.2
70 131.5 5.8 157.8 10.1 116.6 12.8 135.3 20.9
60 121.1 5.0 143.4 8.2 105.8 11.2 123.4 18.9
50 111.7 4.6 130.1 6.9 96.2 10.0 112.7 17.0
40 102.6 4.3 117.7 6.1 87.6 9.2 102.6 15.0
30 93.5 3.9 105.2 6.3 79.0 8.4 92.6 13.1
20 83.6 3.4 92.1 6.9 69.8 7.6 81.8 11.3
10 71.5 3.0 76.4 7.0 58.7 6.6 68.8 9.1
AVE 5.1 8.6 12.7 18.5
Feed gradings of the processes
0
20
40
60
80
100
10.0 100.0 1000.0
[mm]
[%]
OL1 OL2 OL3
Figure 4-10. Grain size distribution curves of the feed material.
25
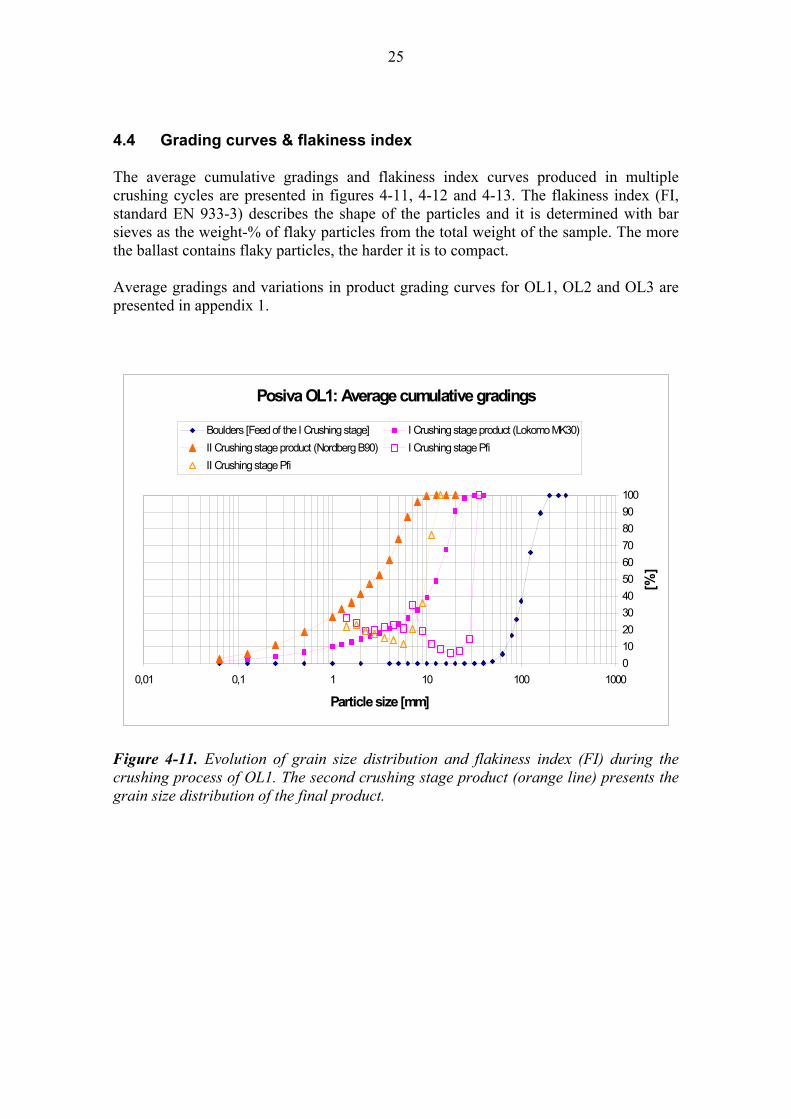
4.4 Grading curves & flakiness index The average cumulative gradings and flakiness index curves produced in multiple crushing cycles are presented in figures 4-11, 4-12 and 4-13. The flakiness index (FI, standard EN 933-3) describes the shape of the particles and it is determined with bar sieves as the weight-% of flaky particles from the total weight of the sample. The more the ballast contains flaky particles, the harder it is to compact. Average gradings and variations in product grading curves for OL1, OL2 and OL3 are presented in appendix 1.
Figure 4-11. Evolution of grain size distribution and flakiness index (FI) during the crushing process of OL1. The second crushing stage product (orange line) presents the grain size distribution of the final product.
Posiva OL1: Average cumulative gradings
0102030405060708090100
0,01 0,1 1 10 100 1000
Particle size [mm]
[%]
Boulders [Feed of the I Crushing stage] I Crushing stage product (Lokomo MK30)II Crushing stage product (Nordberg B90) I Crushing stage PfiII Crushing stage Pfi
26
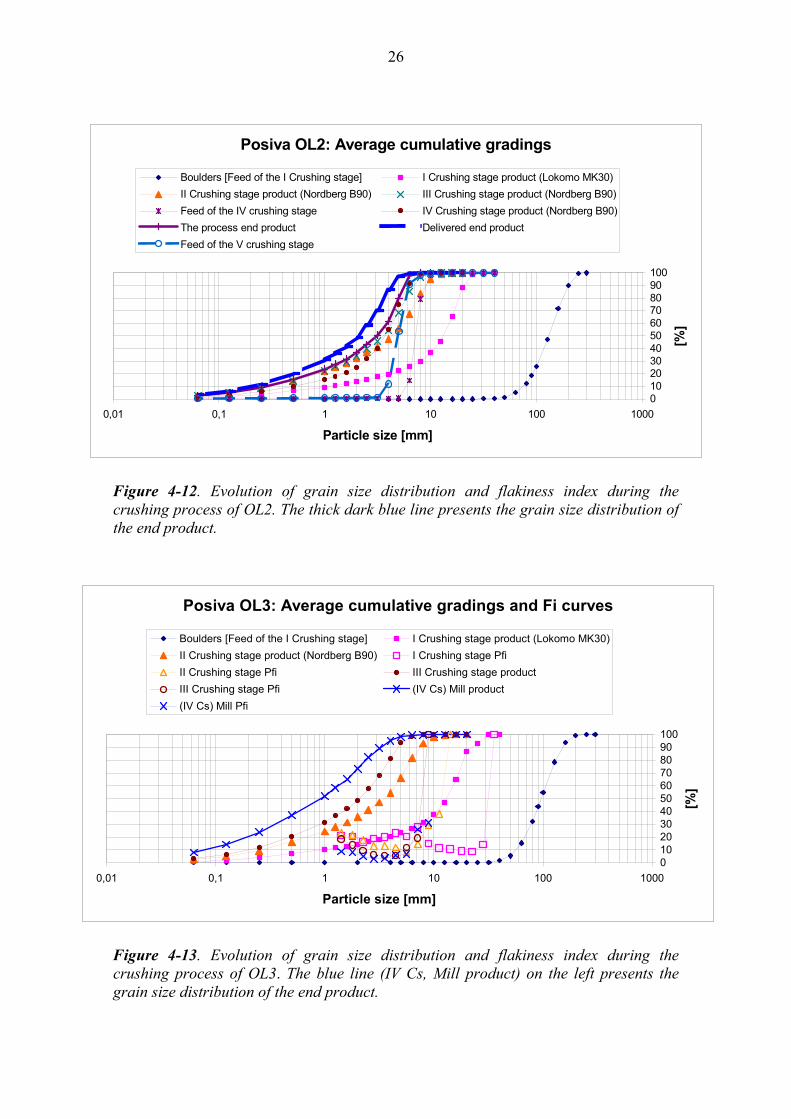
Figure 4-12. Evolution of grain size distribution and flakiness index during the crushing process of OL2. The thick dark blue line presents the grain size distribution of the end product.
Figure 4-13. Evolution of grain size distribution and flakiness index during the crushing process of OL3. The blue line (IV Cs, Mill product) on the left presents the grain size distribution of the end product.
Posiva OL2: Average cumulative gradings
0102030405060708090100
0,01 0,1 1 10 100 1000
Particle size [mm]
[%]
Boulders [Feed of the I Crushing stage] I Crushing stage product (Lokomo MK30)II Crushing stage product (Nordberg B90) III Crushing stage product (Nordberg B90)Feed of the IV crushing stage IV Crushing stage product (Nordberg B90)The process end product Delivered end productFeed of the V crushing stage
Posiva OL3: Average cumulative gradings and Fi curves
0102030405060708090100
0,01 0,1 1 10 100 1000
Particle size [mm]
[%]
Boulders [Feed of the I Crushing stage] I Crushing stage product (Lokomo MK30)II Crushing stage product (Nordberg B90) I Crushing stage PfiII Crushing stage Pfi III Crushing stage productIII Crushing stage Pfi (IV Cs) Mill product(IV Cs) Mill Pfi
27
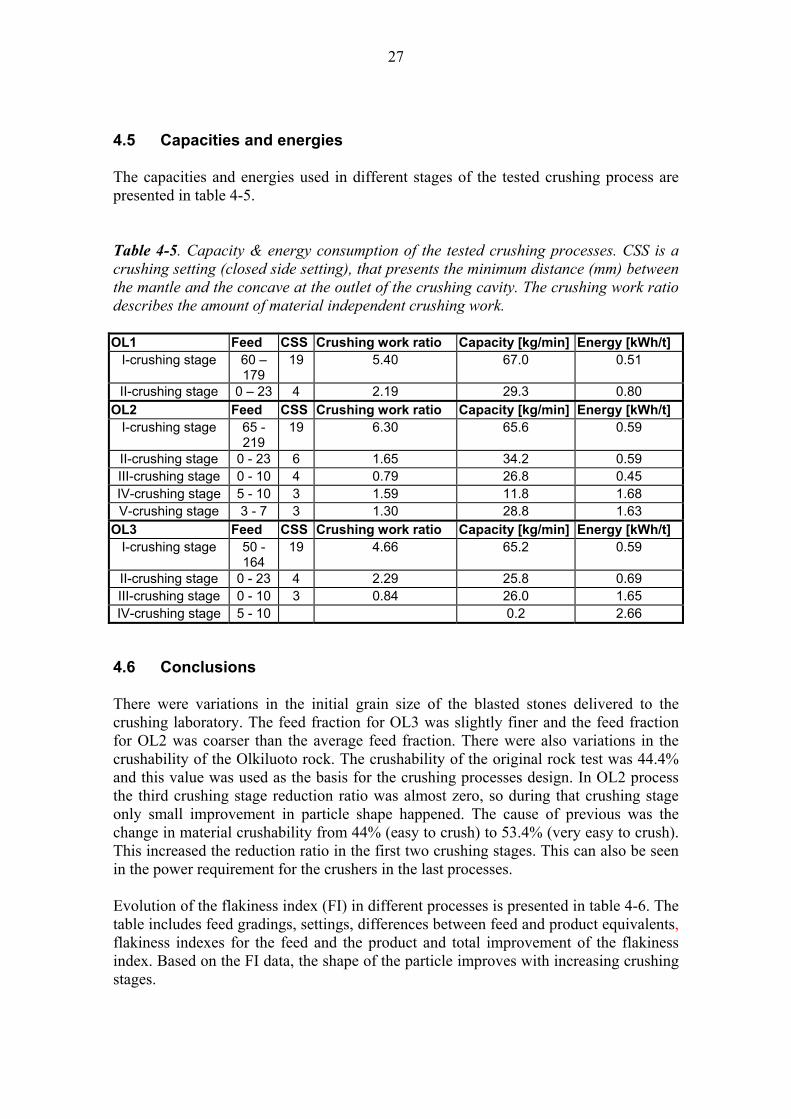
4.5 Capacities and energies The capacities and energies used in different stages of the tested crushing process are presented in table 4-5. Table 4-5. Capacity & energy consumption of the tested crushing processes. CSS is a crushing setting (closed side setting), that presents the minimum distance (mm) between the mantle and the concave at the outlet of the crushing cavity. The crushing work ratio describes the amount of material independent crushing work. OL1 Feed CSS Crushing work ratio Capacity [kg/min] Energy [kWh/t]
I-crushing stage 60 – 179
19 5.40 67.0 0.51
II-crushing stage 0 – 23 4 2.19 29.3 0.80 OL2 Feed CSS Crushing work ratio Capacity [kg/min] Energy [kWh/t]
I-crushing stage 65 - 219
19 6.30 65.6 0.59
II-crushing stage 0 - 23 6 1.65 34.2 0.59 III-crushing stage 0 - 10 4 0.79 26.8 0.45 IV-crushing stage 5 - 10 3 1.59 11.8 1.68 V-crushing stage 3 - 7 3 1.30 28.8 1.63
OL3 Feed CSS Crushing work ratio Capacity [kg/min] Energy [kWh/t] I-crushing stage 50 -
164 19 4.66 65.2 0.59
II-crushing stage 0 - 23 4 2.29 25.8 0.69 III-crushing stage 0 - 10 3 0.84 26.0 1.65 IV-crushing stage 5 - 10 0.2 2.66
4.6 Conclusions There were variations in the initial grain size of the blasted stones delivered to the crushing laboratory. The feed fraction for OL3 was slightly finer and the feed fraction for OL2 was coarser than the average feed fraction. There were also variations in the crushability of the Olkiluoto rock. The crushability of the original rock test was 44.4% and this value was used as the basis for the crushing processes design. In OL2 process the third crushing stage reduction ratio was almost zero, so during that crushing stage only small improvement in particle shape happened. The cause of previous was the change in material crushability from 44% (easy to crush) to 53.4% (very easy to crush). This increased the reduction ratio in the first two crushing stages. This can also be seen in the power requirement for the crushers in the last processes. Evolution of the flakiness index (FI) in different processes is presented in table 4-6. The table includes feed gradings, settings, differences between feed and product equivalents, flakiness indexes for the feed and the product and total improvement of the flakiness index. Based on the FI data, the shape of the particle improves with increasing crushing stages.
28
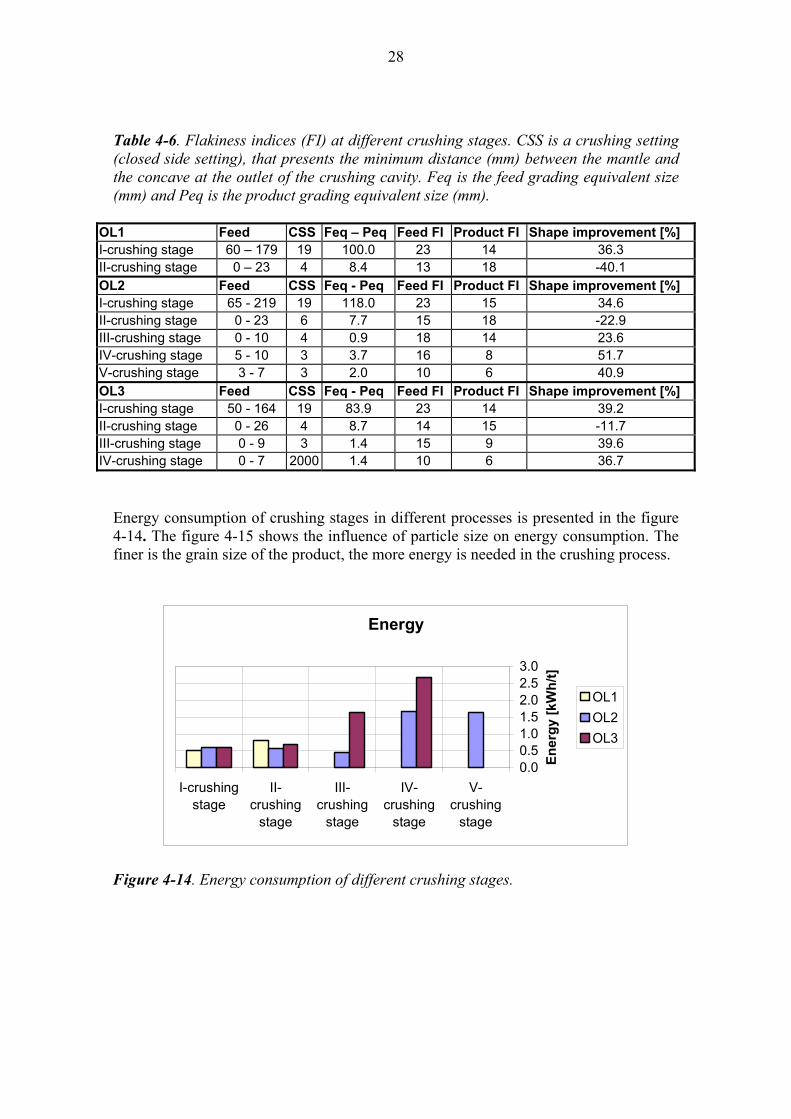
Table 4-6. Flakiness indices (FI) at different crushing stages. CSS is a crushing setting (closed side setting), that presents the minimum distance (mm) between the mantle and the concave at the outlet of the crushing cavity. Feq is the feed grading equivalent size (mm) and Peq is the product grading equivalent size (mm).
OL1 Feed CSS Feq – Peq Feed FI Product FI Shape improvement [%] I-crushing stage 60 – 179 19 100.0 23 14 36.3 II-crushing stage 0 – 23 4 8.4 13 18 -40.1 OL2 Feed CSS Feq - Peq Feed FI Product FI Shape improvement [%] I-crushing stage 65 - 219 19 118.0 23 15 34.6 II-crushing stage 0 - 23 6 7.7 15 18 -22.9 III-crushing stage 0 - 10 4 0.9 18 14 23.6 IV-crushing stage 5 - 10 3 3.7 16 8 51.7 V-crushing stage 3 - 7 3 2.0 10 6 40.9 OL3 Feed CSS Feq - Peq Feed FI Product FI Shape improvement [%] I-crushing stage 50 - 164 19 83.9 23 14 39.2 II-crushing stage 0 - 26 4 8.7 14 15 -11.7 III-crushing stage 0 - 9 3 1.4 15 9 39.6 IV-crushing stage 0 - 7 2000 1.4 10 6 36.7
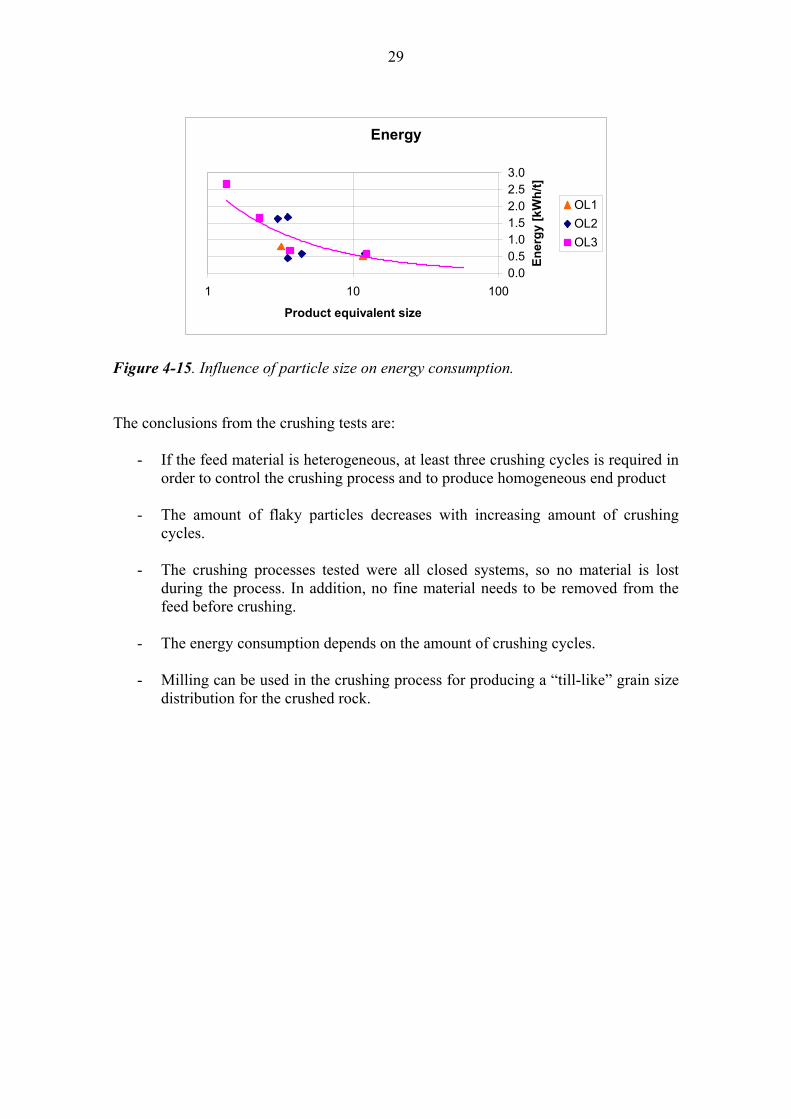
Energy consumption of crushing stages in different processes is presented in the figure 4-14. The figure 4-15 shows the influence of particle size on energy consumption. The finer is the grain size of the product, the more energy is needed in the crushing process.
Energy
0.00.51.01.52.02.53.0
I-crushingstage
II-crushing
stage
III-crushing
stage
IV-crushing
stage
V-crushing
stage
Ener
gy [k
Wh/
t]
OL1OL2OL3
Figure 4-14. Energy consumption of different crushing stages.
29
Energy
0.00.51.01.52.02.53.0
1 10 100
Product equivalent size
Ener
gy [k
Wh/
t]
OL1OL2OL3
Figure 4-15. Influence of particle size on energy consumption. The conclusions from the crushing tests are:
- If the feed material is heterogeneous, at least three crushing cycles is required in order to control the crushing process and to produce homogeneous end product
- The amount of flaky particles decreases with increasing amount of crushing
cycles.
- The crushing processes tested were all closed systems, so no material is lost during the process. In addition, no fine material needs to be removed from the feed before crushing.
- The energy consumption depends on the amount of crushing cycles.
- Milling can be used in the crushing process for producing a “till-like” grain size
distribution for the crushed rock.

30
31
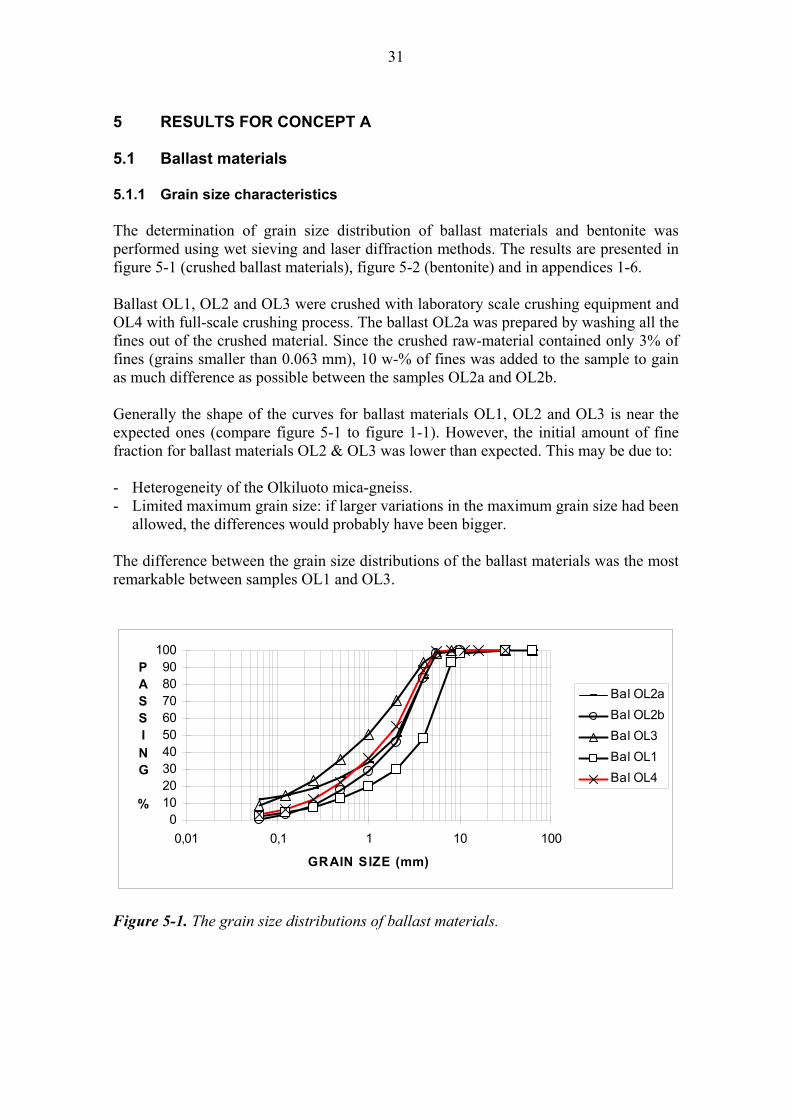
5 RESULTS FOR CONCEPT A 5.1 Ballast materials 5.1.1 Grain size characteristics The determination of grain size distribution of ballast materials and bentonite was performed using wet sieving and laser diffraction methods. The results are presented in figure 5-1 (crushed ballast materials), figure 5-2 (bentonite) and in appendices 1-6. Ballast OL1, OL2 and OL3 were crushed with laboratory scale crushing equipment and OL4 with full-scale crushing process. The ballast OL2a was prepared by washing all the fines out of the crushed material. Since the crushed raw-material contained only 3% of fines (grains smaller than 0.063 mm), 10 w-% of fines was added to the sample to gain as much difference as possible between the samples OL2a and OL2b. Generally the shape of the curves for ballast materials OL1, OL2 and OL3 is near the expected ones (compare figure 5-1 to figure 1-1). However, the initial amount of fine fraction for ballast materials OL2 & OL3 was lower than expected. This may be due to: - Heterogeneity of the Olkiluoto mica-gneiss. - Limited maximum grain size: if larger variations in the maximum grain size had been
allowed, the differences would probably have been bigger. The difference between the grain size distributions of the ballast materials was the most remarkable between samples OL1 and OL3.
0102030405060708090
100
0,01 0,1 1 10 100
GRAIN SIZE (mm)
PASSING
%
Bal OL2aBal OL2bBal OL3Bal OL1Bal OL4
Figure 5-1. The grain size distributions of ballast materials.
32
0102030405060708090
100
1 10 100 1000
Grain size (µm)
Cum
ulat
ive
dist
ribut
ion
(%
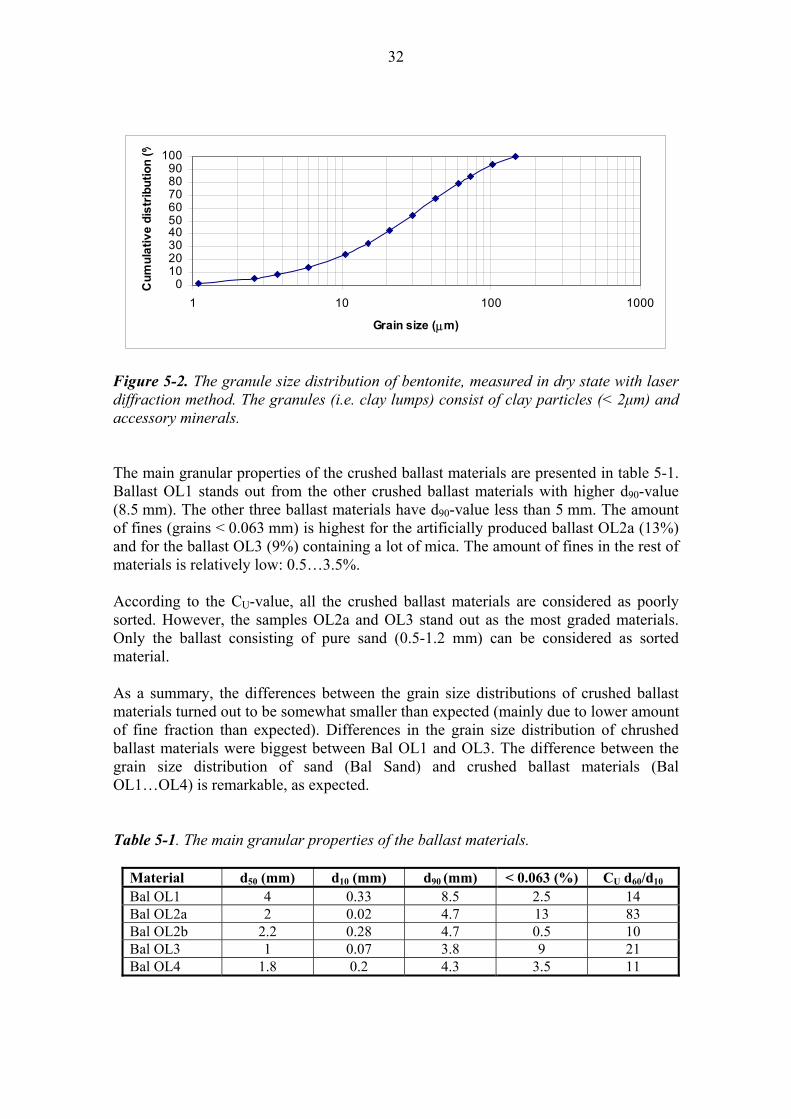
Figure 5-2. The granule size distribution of bentonite, measured in dry state with laser diffraction method. The granules (i.e. clay lumps) consist of clay particles (< 2µm) and accessory minerals. The main granular properties of the crushed ballast materials are presented in table 5-1. Ballast OL1 stands out from the other crushed ballast materials with higher d90-value (8.5 mm). The other three ballast materials have d90-value less than 5 mm. The amount of fines (grains < 0.063 mm) is highest for the artificially produced ballast OL2a (13%) and for the ballast OL3 (9%) containing a lot of mica. The amount of fines in the rest of materials is relatively low: 0.5…3.5%. According to the CU-value, all the crushed ballast materials are considered as poorly sorted. However, the samples OL2a and OL3 stand out as the most graded materials. Only the ballast consisting of pure sand (0.5-1.2 mm) can be considered as sorted material. As a summary, the differences between the grain size distributions of crushed ballast materials turned out to be somewhat smaller than expected (mainly due to lower amount of fine fraction than expected). Differences in the grain size distribution of chrushed ballast materials were biggest between Bal OL1 and OL3. The difference between the grain size distribution of sand (Bal Sand) and crushed ballast materials (Bal OL1…OL4) is remarkable, as expected. Table 5-1. The main granular properties of the ballast materials.
Material d50 (mm) d10 (mm) d90 (mm) < 0.063 (%) CU d60/d10 Bal OL1 4 0.33 8.5 2.5 14 Bal OL2a 2 0.02 4.7 13 83 Bal OL2b 2.2 0.28 4.7 0.5 10 Bal OL3 1 0.07 3.8 9 21 Bal OL4 1.8 0.2 4.3 3.5 11
33
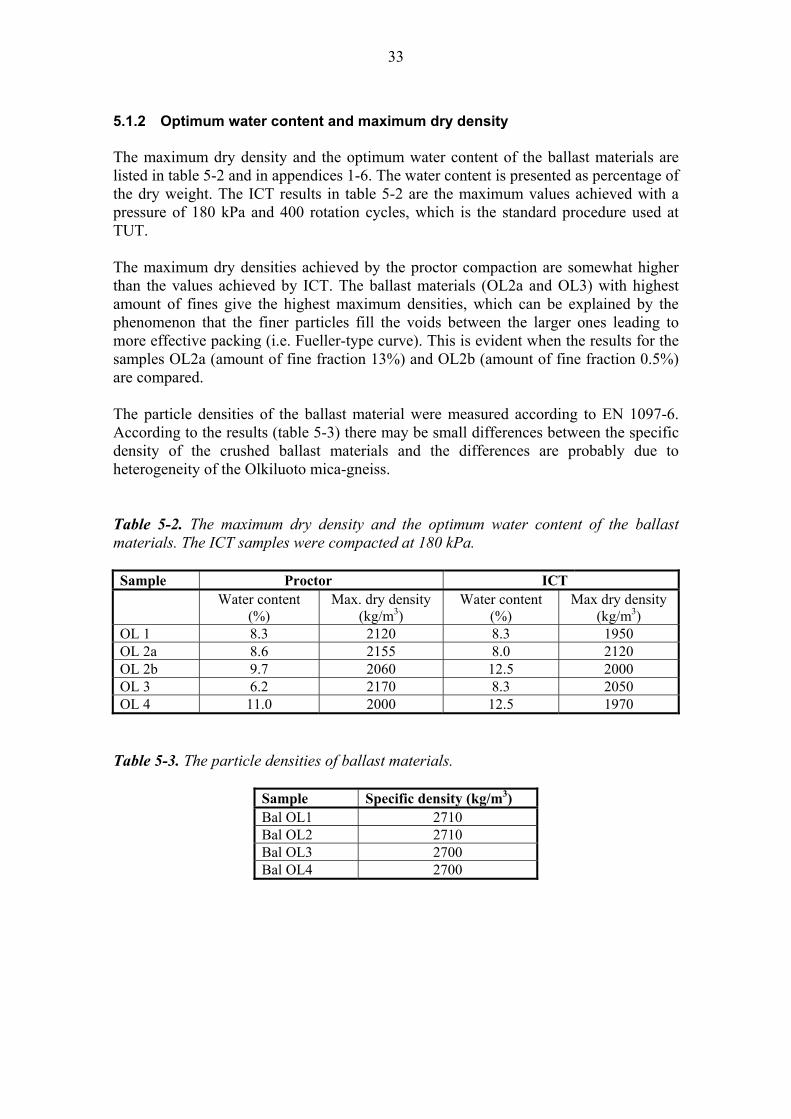
5.1.2 Optimum water content and maximum dry density The maximum dry density and the optimum water content of the ballast materials are listed in table 5-2 and in appendices 1-6. The water content is presented as percentage of the dry weight. The ICT results in table 5-2 are the maximum values achieved with a pressure of 180 kPa and 400 rotation cycles, which is the standard procedure used at TUT. The maximum dry densities achieved by the proctor compaction are somewhat higher than the values achieved by ICT. The ballast materials (OL2a and OL3) with highest amount of fines give the highest maximum densities, which can be explained by the phenomenon that the finer particles fill the voids between the larger ones leading to more effective packing (i.e. Fueller-type curve). This is evident when the results for the samples OL2a (amount of fine fraction 13%) and OL2b (amount of fine fraction 0.5%) are compared. The particle densities of the ballast material were measured according to EN 1097-6. According to the results (table 5-3) there may be small differences between the specific density of the crushed ballast materials and the differences are probably due to heterogeneity of the Olkiluoto mica-gneiss. Table 5-2. The maximum dry density and the optimum water content of the ballast materials. The ICT samples were compacted at 180 kPa. Sample Proctor ICT
Water content
(%) Max. dry density
(kg/m3) Water content
(%) Max dry density
(kg/m3) OL 1 8.3 2120 8.3 1950 OL 2a 8.6 2155 8.0 2120 OL 2b 9.7 2060 12.5 2000 OL 3 6.2 2170 8.3 2050 OL 4 11.0 2000 12.5 1970
Table 5-3. The particle densities of ballast materials.
Sample Specific density (kg/m3) Bal OL1 2710 Bal OL2 2710 Bal OL3 2700 Bal OL4 2700
34
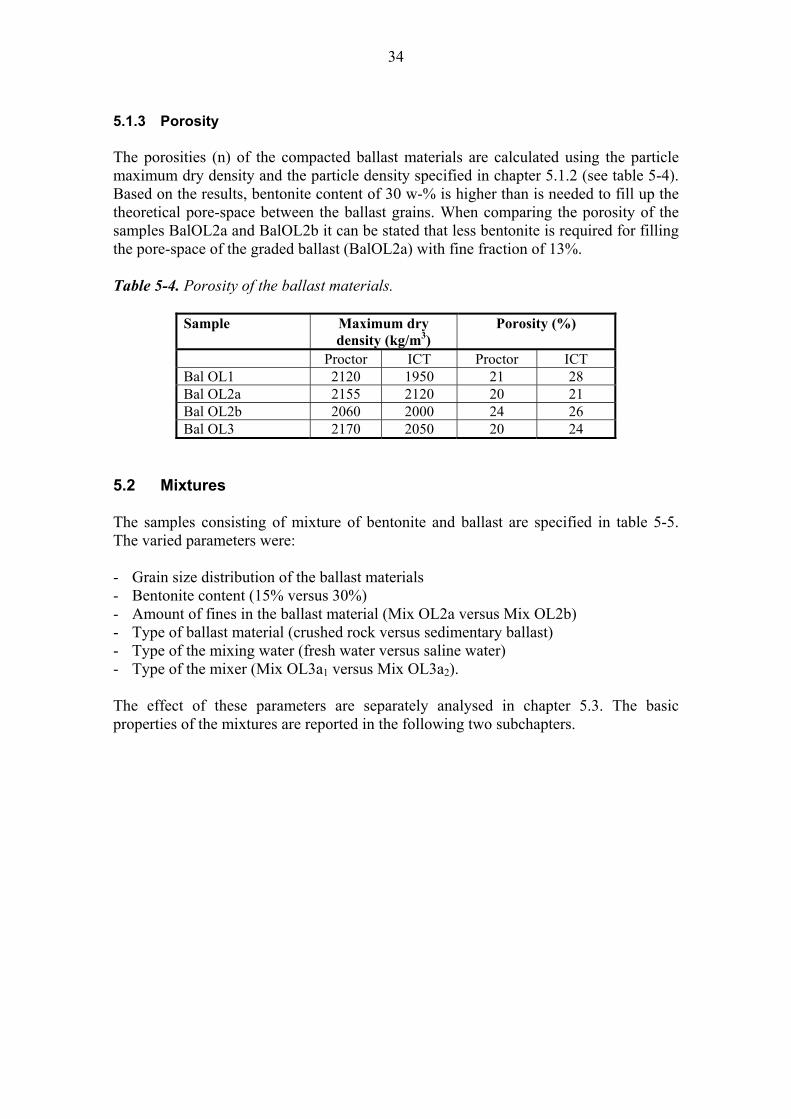
5.1.3 Porosity The porosities (n) of the compacted ballast materials are calculated using the particle maximum dry density and the particle density specified in chapter 5.1.2 (see table 5-4). Based on the results, bentonite content of 30 w-% is higher than is needed to fill up the theoretical pore-space between the ballast grains. When comparing the porosity of the samples BalOL2a and BalOL2b it can be stated that less bentonite is required for filling the pore-space of the graded ballast (BalOL2a) with fine fraction of 13%. Table 5-4. Porosity of the ballast materials.
Sample Maximum dry density (kg/m3)
Porosity (%)
Proctor ICT Proctor ICT Bal OL1 2120 1950 21 28 Bal OL2a 2155 2120 20 21 Bal OL2b 2060 2000 24 26 Bal OL3 2170 2050 20 24
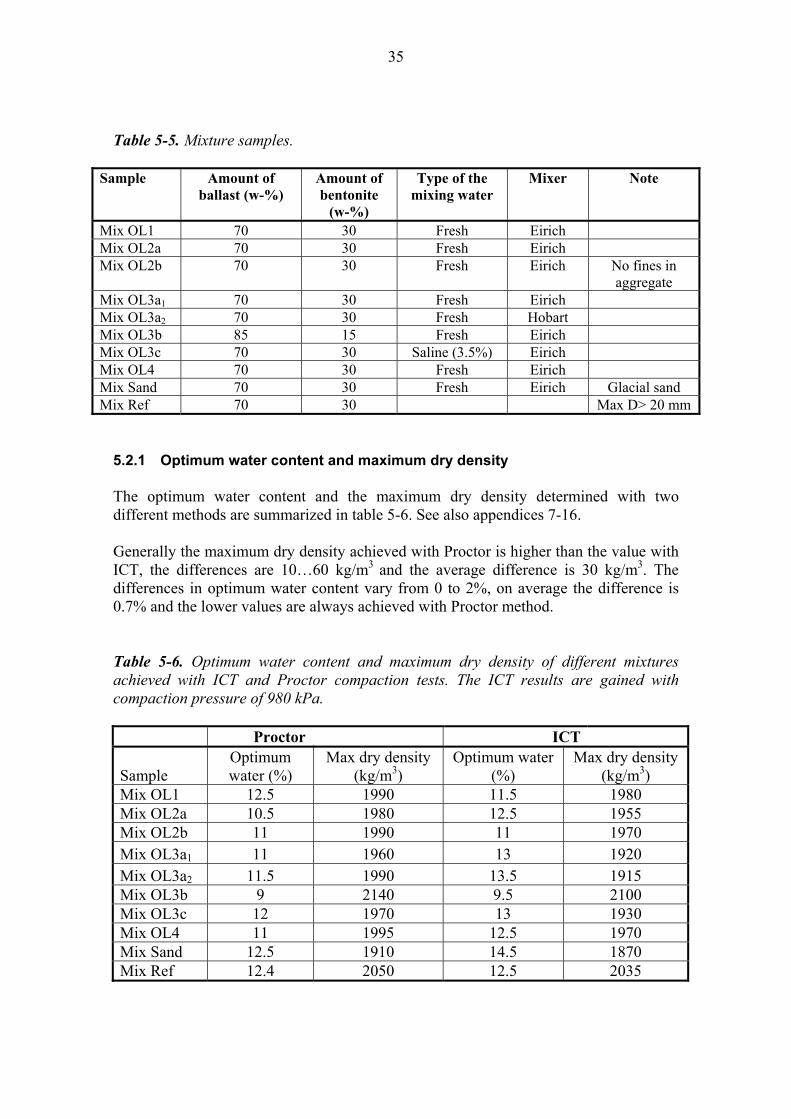
5.2 Mixtures The samples consisting of mixture of bentonite and ballast are specified in table 5-5. The varied parameters were: - Grain size distribution of the ballast materials - Bentonite content (15% versus 30%) - Amount of fines in the ballast material (Mix OL2a versus Mix OL2b) - Type of ballast material (crushed rock versus sedimentary ballast) - Type of the mixing water (fresh water versus saline water) - Type of the mixer (Mix OL3a1 versus Mix OL3a2). The effect of these parameters are separately analysed in chapter 5.3. The basic properties of the mixtures are reported in the following two subchapters.
35
Table 5-5. Mixture samples.
Sample Amount of ballast (w-%)
Amount of bentonite
(w-%)
Type of the mixing water
Mixer Note
Mix OL1 70 30 Fresh Eirich Mix OL2a 70 30 Fresh Eirich Mix OL2b 70 30 Fresh Eirich No fines in
aggregate Mix OL3a1 70 30 Fresh Eirich Mix OL3a2 70 30 Fresh Hobart Mix OL3b 85 15 Fresh Eirich Mix OL3c 70 30 Saline (3.5%) Eirich Mix OL4 70 30 Fresh Eirich Mix Sand 70 30 Fresh Eirich Glacial sand Mix Ref 70 30 Max D> 20 mm
5.2.1 Optimum water content and maximum dry density The optimum water content and the maximum dry density determined with two different methods are summarized in table 5-6. See also appendices 7-16. Generally the maximum dry density achieved with Proctor is higher than the value with ICT, the differences are 10…60 kg/m3 and the average difference is 30 kg/m3. The differences in optimum water content vary from 0 to 2%, on average the difference is 0.7% and the lower values are always achieved with Proctor method. Table 5-6. Optimum water content and maximum dry density of different mixtures achieved with ICT and Proctor compaction tests. The ICT results are gained with compaction pressure of 980 kPa. Proctor ICT
Sample Optimum water (%)
Max dry density (kg/m3)
Optimum water (%)
Max dry density (kg/m3)
Mix OL1 12.5 1990 11.5 1980 Mix OL2a 10.5 1980 12.5 1955 Mix OL2b 11 1990 11 1970 Mix OL3a1 11 1960 13 1920 Mix OL3a2 11.5 1990 13.5 1915 Mix OL3b 9 2140 9.5 2100 Mix OL3c 12 1970 13 1930 Mix OL4 11 1995 12.5 1970 Mix Sand 12.5 1910 14.5 1870 Mix Ref 12.4 2050 12.5 2035
36
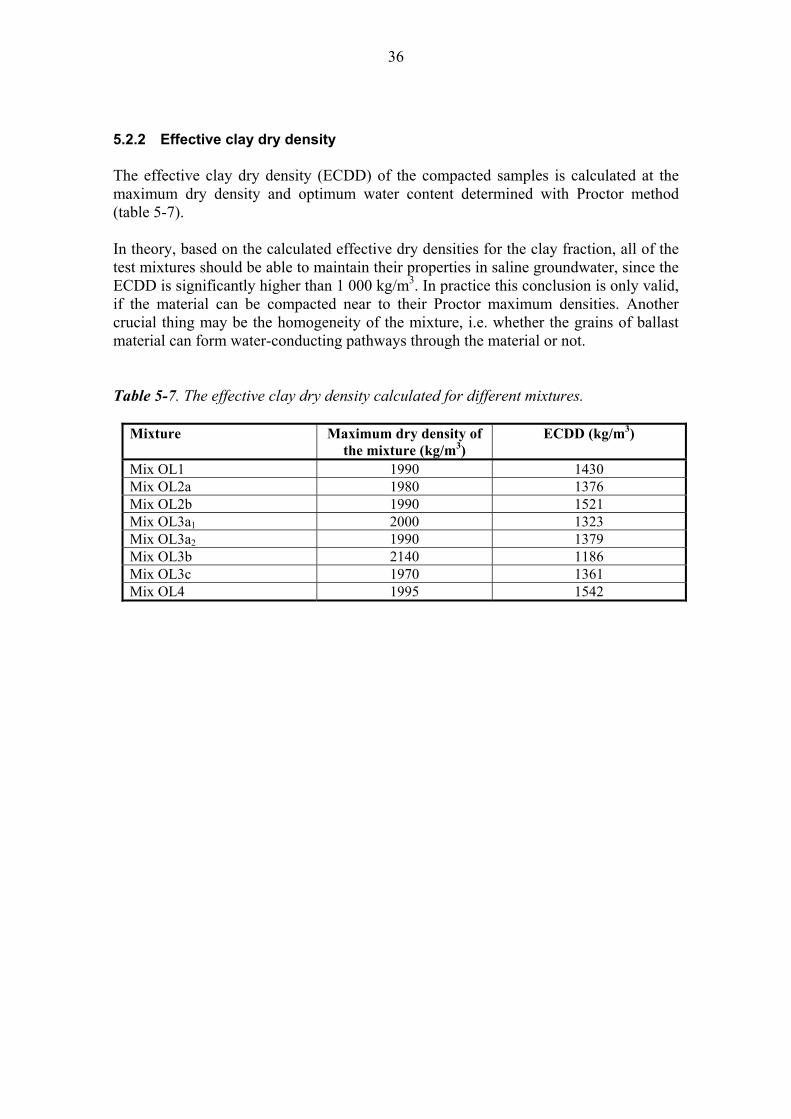
5.2.2 Effective clay dry density The effective clay dry density (ECDD) of the compacted samples is calculated at the maximum dry density and optimum water content determined with Proctor method (table 5-7). In theory, based on the calculated effective dry densities for the clay fraction, all of the test mixtures should be able to maintain their properties in saline groundwater, since the ECDD is significantly higher than 1 000 kg/m3. In practice this conclusion is only valid, if the material can be compacted near to their Proctor maximum densities. Another crucial thing may be the homogeneity of the mixture, i.e. whether the grains of ballast material can form water-conducting pathways through the material or not. Table 5-7. The effective clay dry density calculated for different mixtures.
Mixture Maximum dry density of the mixture (kg/m3)
ECDD (kg/m3)
Mix OL1 1990 1430 Mix OL2a 1980 1376 Mix OL2b 1990 1521 Mix OL3a1 2000 1323 Mix OL3a2 1990 1379 Mix OL3b 2140 1186 Mix OL3c 1970 1361 Mix OL4 1995 1542
37
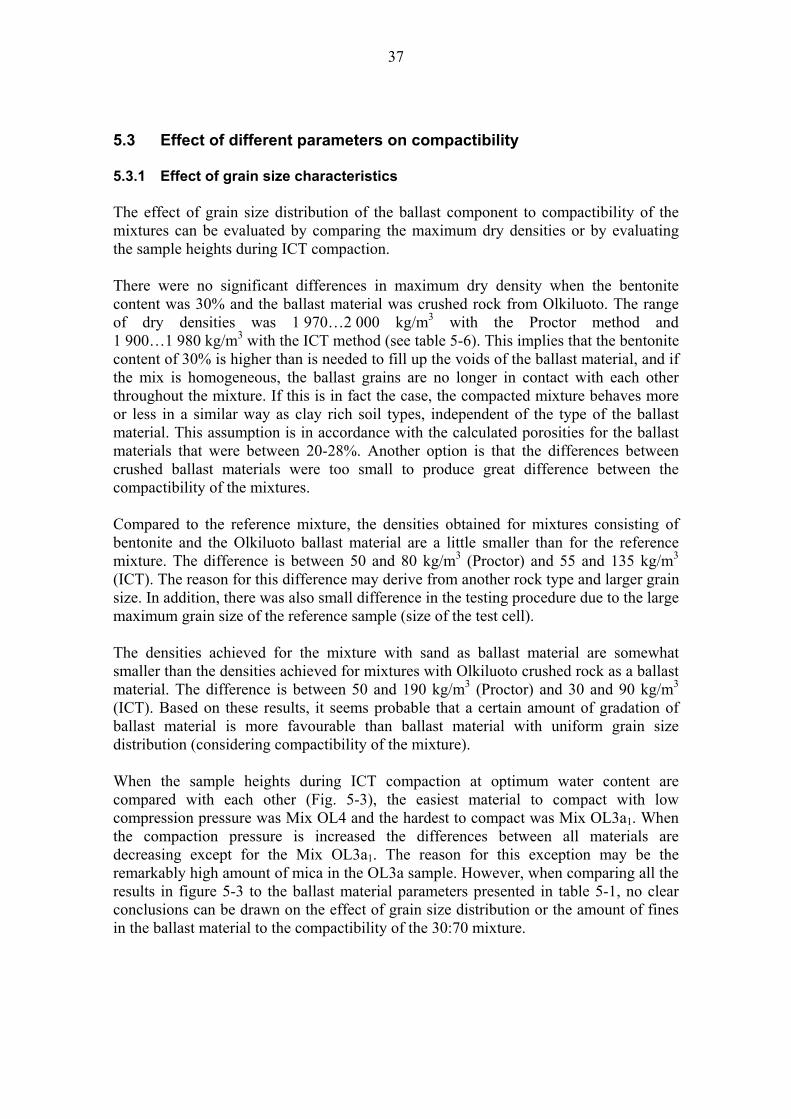
5.3 Effect of different parameters on compactibility 5.3.1 Effect of grain size characteristics The effect of grain size distribution of the ballast component to compactibility of the mixtures can be evaluated by comparing the maximum dry densities or by evaluating the sample heights during ICT compaction. There were no significant differences in maximum dry density when the bentonite content was 30% and the ballast material was crushed rock from Olkiluoto. The range of dry densities was 1 970…2 000 kg/m3 with the Proctor method and 1 900…1 980 kg/m3 with the ICT method (see table 5-6). This implies that the bentonite content of 30% is higher than is needed to fill up the voids of the ballast material, and if the mix is homogeneous, the ballast grains are no longer in contact with each other throughout the mixture. If this is in fact the case, the compacted mixture behaves more or less in a similar way as clay rich soil types, independent of the type of the ballast material. This assumption is in accordance with the calculated porosities for the ballast materials that were between 20-28%. Another option is that the differences between crushed ballast materials were too small to produce great difference between the compactibility of the mixtures. Compared to the reference mixture, the densities obtained for mixtures consisting of bentonite and the Olkiluoto ballast material are a little smaller than for the reference mixture. The difference is between 50 and 80 kg/m3 (Proctor) and 55 and 135 kg/m3 (ICT). The reason for this difference may derive from another rock type and larger grain size. In addition, there was also small difference in the testing procedure due to the large maximum grain size of the reference sample (size of the test cell). The densities achieved for the mixture with sand as ballast material are somewhat smaller than the densities achieved for mixtures with Olkiluoto crushed rock as a ballast material. The difference is between 50 and 190 kg/m3 (Proctor) and 30 and 90 kg/m3 (ICT). Based on these results, it seems probable that a certain amount of gradation of ballast material is more favourable than ballast material with uniform grain size distribution (considering compactibility of the mixture). When the sample heights during ICT compaction at optimum water content are compared with each other (Fig. 5-3), the easiest material to compact with low compression pressure was Mix OL4 and the hardest to compact was Mix OL3a1. When the compaction pressure is increased the differences between all materials are decreasing except for the Mix OL3a1. The reason for this exception may be the remarkably high amount of mica in the OL3a sample. However, when comparing all the results in figure 5-3 to the ballast material parameters presented in table 5-1, no clear conclusions can be drawn on the effect of grain size distribution or the amount of fines in the ballast material to the compactibility of the 30:70 mixture.
38
180 kPa at optimum water content
120
130
140
150
160
170
0 100 200 300 400 500
Number of cycles
Sam
ple
heig
ht (m
m)
Mix OL4Mix OL1Mix OL3a1Mix OL2bMix OL2a
980 kPa at optimum water content
105
110
115
120
125
130
0 50 100 150 200 250
Number of cycles
Sam
ple
heig
ht (m
m)
Mix OL2aMix OL4Mix OL2bMix OL3a1Mix OL1
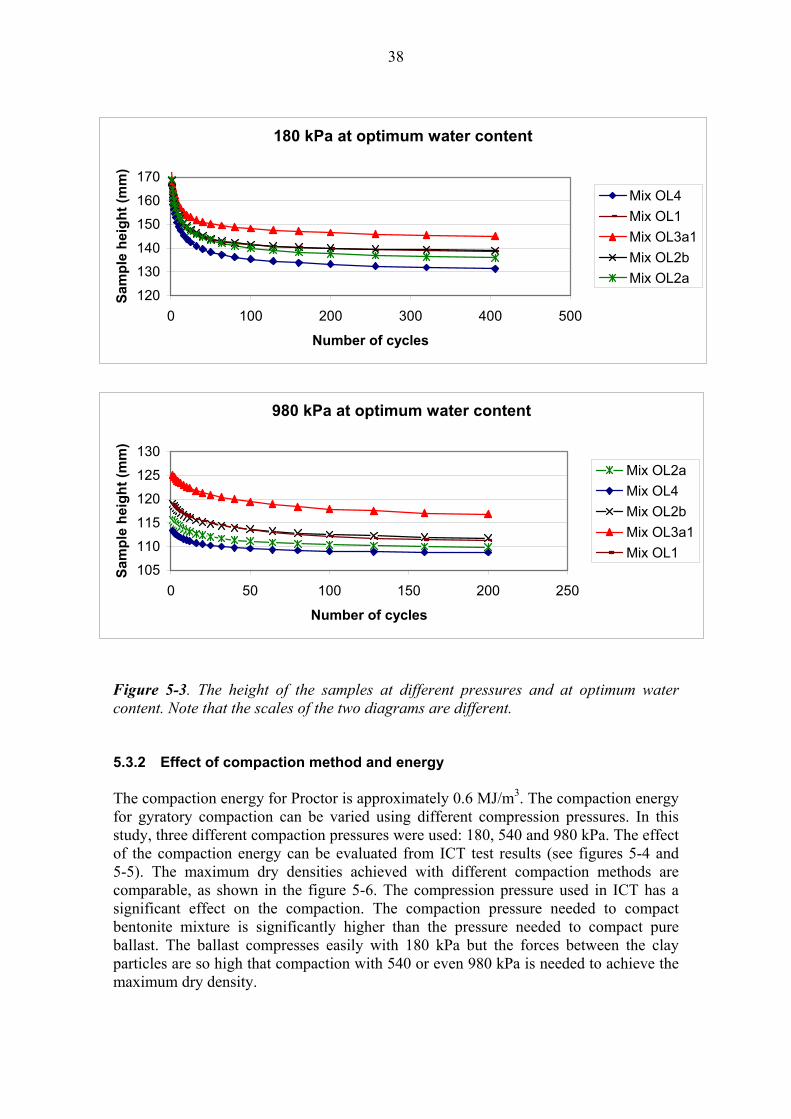
Figure 5-3. The height of the samples at different pressures and at optimum water content. Note that the scales of the two diagrams are different. 5.3.2 Effect of compaction method and energy The compaction energy for Proctor is approximately 0.6 MJ/m3. The compaction energy for gyratory compaction can be varied using different compression pressures. In this study, three different compaction pressures were used: 180, 540 and 980 kPa. The effect of the compaction energy can be evaluated from ICT test results (see figures 5-4 and 5-5). The maximum dry densities achieved with different compaction methods are comparable, as shown in the figure 5-6. The compression pressure used in ICT has a significant effect on the compaction. The compaction pressure needed to compact bentonite mixture is significantly higher than the pressure needed to compact pure ballast. The ballast compresses easily with 180 kPa but the forces between the clay particles are so high that compaction with 540 or even 980 kPa is needed to achieve the maximum dry density.
39
ICT 180 kPa
90011001300150017001900
0 200 400 600
Number of cycles
Dry
dens
ity (k
g/m
3)Bal OL1Mix OL1Friedland
Figure 5-4. The dry densities of ballast, mixture and clay during compaction at 180 kPa at optimum water content.
1300
1400
1500
1600
1700
1800
1900
0 50 100 150
Number of cycles
Dry
den
sity
(kg/
m3
Bal OL1 540 kPaMix OL1 540 kPaBal OL1 180 kPaMix OL1 180 kPa
Figure 5-5. The effect of compression pressure on compactibility of ballast and mixture OL1 at different compression pressures.
40
17001750180018501900195020002050210021502200
Mix San
d
Mix OL3
a2
Mix OL3
c
Mix OL2
a
Mix OL1
Mix OL2
b
Mix OL4
Mix OL3
a1
Mix Ref
Mix OL3
b
Dry
den
sity
(kg/
m3
Proctor
ICT
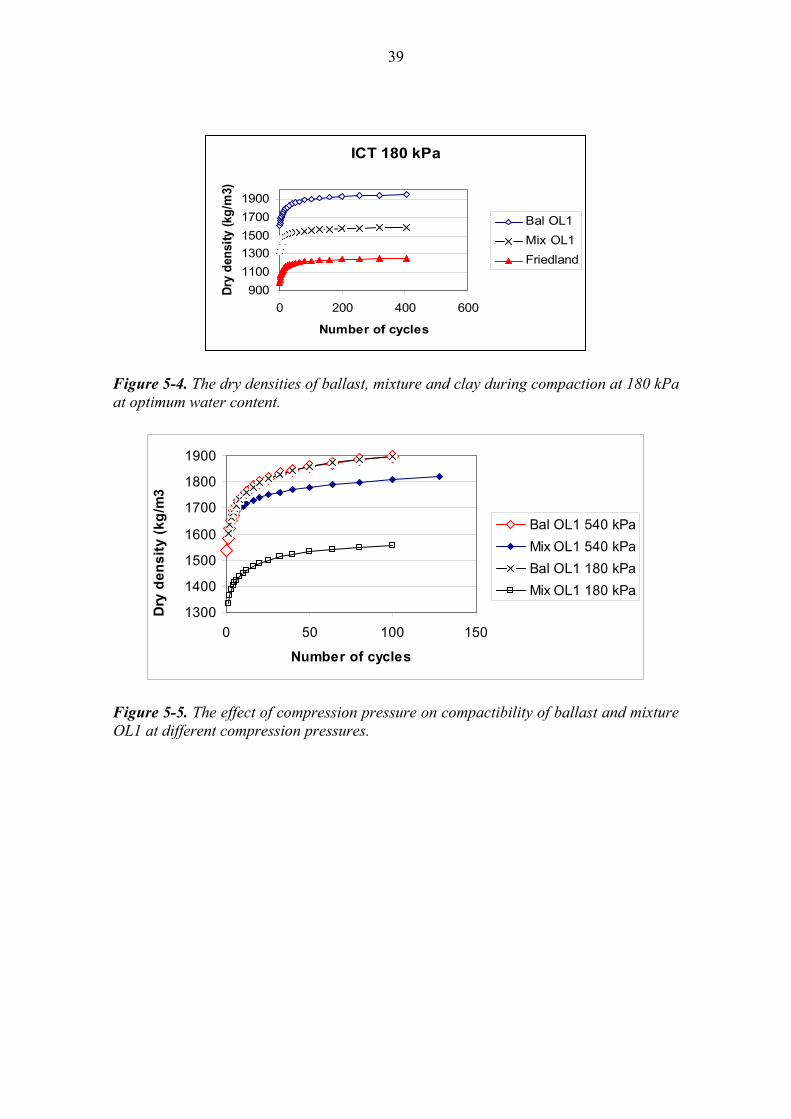
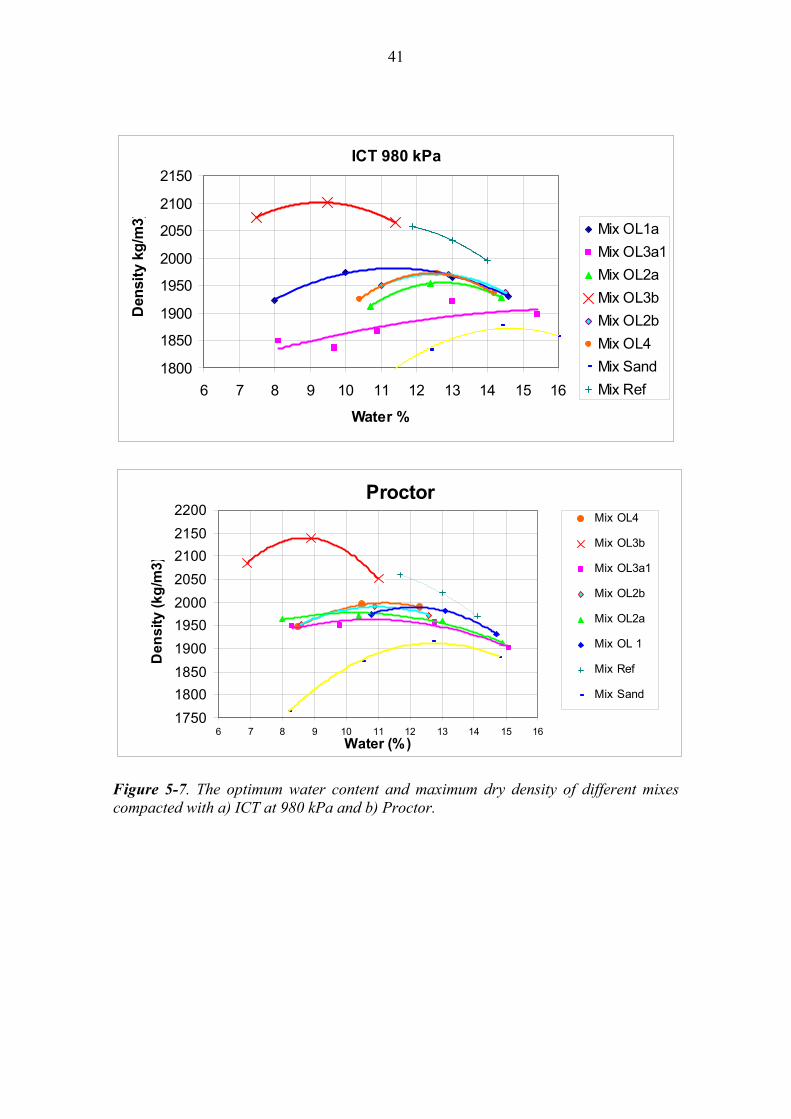
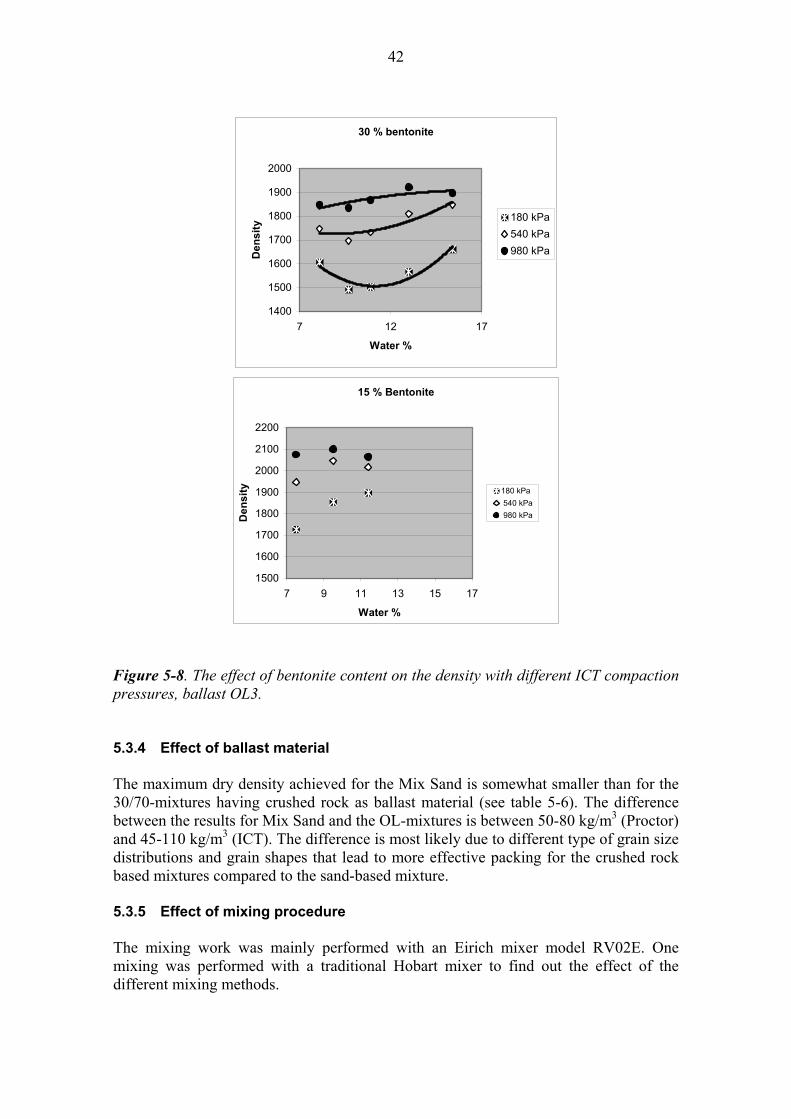
Figure 5-6. The maximum dry densities achieved with different compaction methods. The difference between the two methods is in most cases less than 50 kg/m3. The big difference in Mix OL3a2 can be explained by the heterogeneity of the mixture, because the traditional mixing method did not mix the material properly and the compaction of inhomogeneous material is harder in ICT that it is in Proctor. 5.3.3 Effect of bentonite content Bentonite content is the major property affecting the maximum dry density of the mixtures (see Fig. 5-7). This is obvious when comparing the different mixtures consisting of bentonite and crushed rock from Olkiluoto. In general, the maximum dry density increases when the amount of bentonite decreases. When the amount of bentonite is 15% (sample OL3b), the maximum dry density is remarkably higher compared to the 30/70 mixtures (OL1, OL2, OL3a and OL4). As already stated before, when the amount of bentonite is 30%, it dominates the compaction behaviour of the mixture. Therefore it can be stated that the effect of ballast material on the compaction behaviour of the mixture is stronger the less bentonite the mixture contains. In order to gain the typical shape of the compaction curve with ICT, samples with clay content of 30% require higher compaction pressure than the sample OL3b with 15% bentonite content (see Fig. 5-8). In addition, when compacting the 30/70 mixture with low pressures (180 kPa and 540 kPa), the material tends to compact more easily with increasing water content, which is not the case when the compression pressure is as high (980 kPa) as it is the Proctor compaction test. The compactibility results of the Friedland clay showed similar phenomena: the pressure should exceed a certain limit before the optimum water content can be evaluated in a traditional way. This dependence of the compaction method and the optimum water content should be taken into account when compacting the materials in the field. Generally field tests are recommended (in addition to standard laboratory tests) in order to determine the optimal moisture content for certain compaction method (Terzaghi et al. 1996).
41
ICT 980 kPa
1800
1850
1900
1950
2000
2050
2100
2150
6 7 8 9 10 11 12 13 14 15 16
Water %
Den
sity
kg/
m3) Mix OL1a
Mix OL3a1Mix OL2aMix OL3bMix OL2bMix OL4Mix SandMix Ref
Proctor
1750180018501900195020002050210021502200
6 7 8 9 10 11 12 13 14 15 16Water (%)
Den
sity
(kg/
m3)
Mix OL4
Mix OL3b
Mix OL3a1
Mix OL2b
Mix OL2a
Mix OL 1
Mix Ref
Mix Sand
Figure 5-7. The optimum water content and maximum dry density of different mixes compacted with a) ICT at 980 kPa and b) Proctor.
42
30 % bentonite
1400
1500
1600
1700
1800
1900
2000
7 12 17
Water %
Den
sity
180 kPa540 kPa980 kPa
15 % Bentonite
1500
1600
1700
1800
1900
2000
2100
2200
7 9 11 13 15 17
Water %
Den
sity 180 kPa
540 kPa 980 kPa
Figure 5-8. The effect of bentonite content on the density with different ICT compaction pressures, ballast OL3. 5.3.4 Effect of ballast material The maximum dry density achieved for the Mix Sand is somewhat smaller than for the 30/70-mixtures having crushed rock as ballast material (see table 5-6). The difference between the results for Mix Sand and the OL-mixtures is between 50-80 kg/m3 (Proctor) and 45-110 kg/m3 (ICT). The difference is most likely due to different type of grain size distributions and grain shapes that lead to more effective packing for the crushed rock based mixtures compared to the sand-based mixture. 5.3.5 Effect of mixing procedure The mixing work was mainly performed with an Eirich mixer model RV02E. One mixing was performed with a traditional Hobart mixer to find out the effect of the different mixing methods.
43
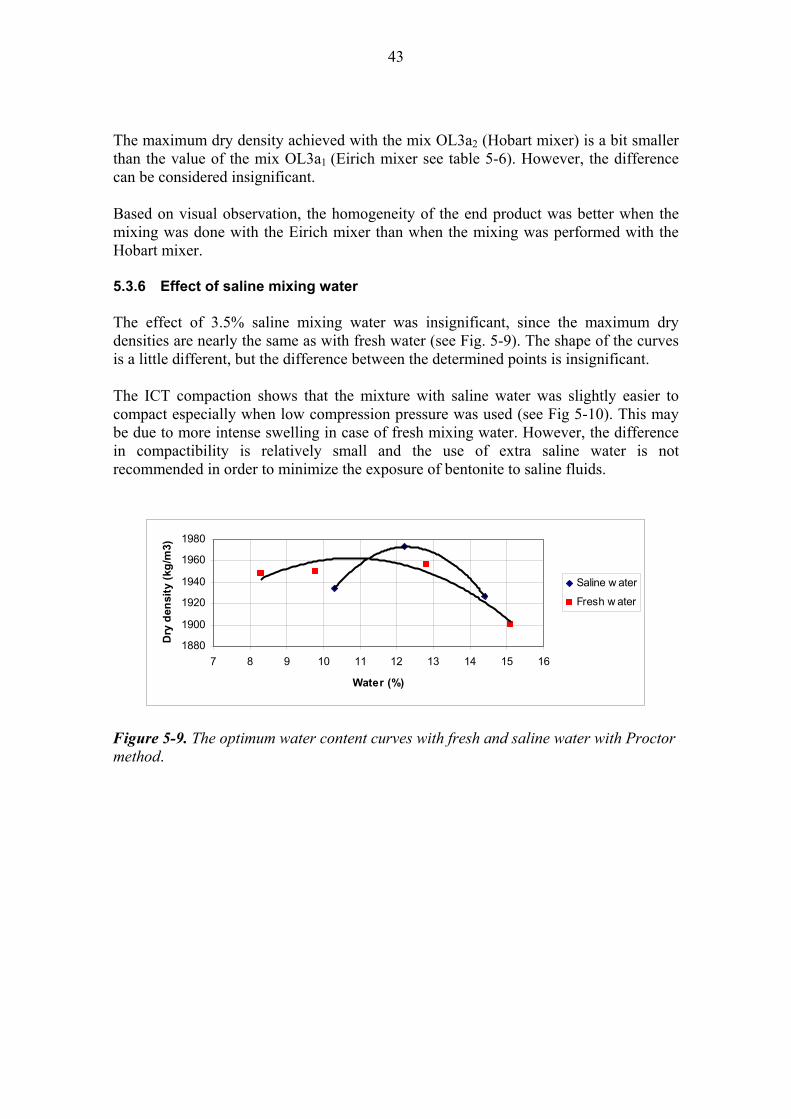
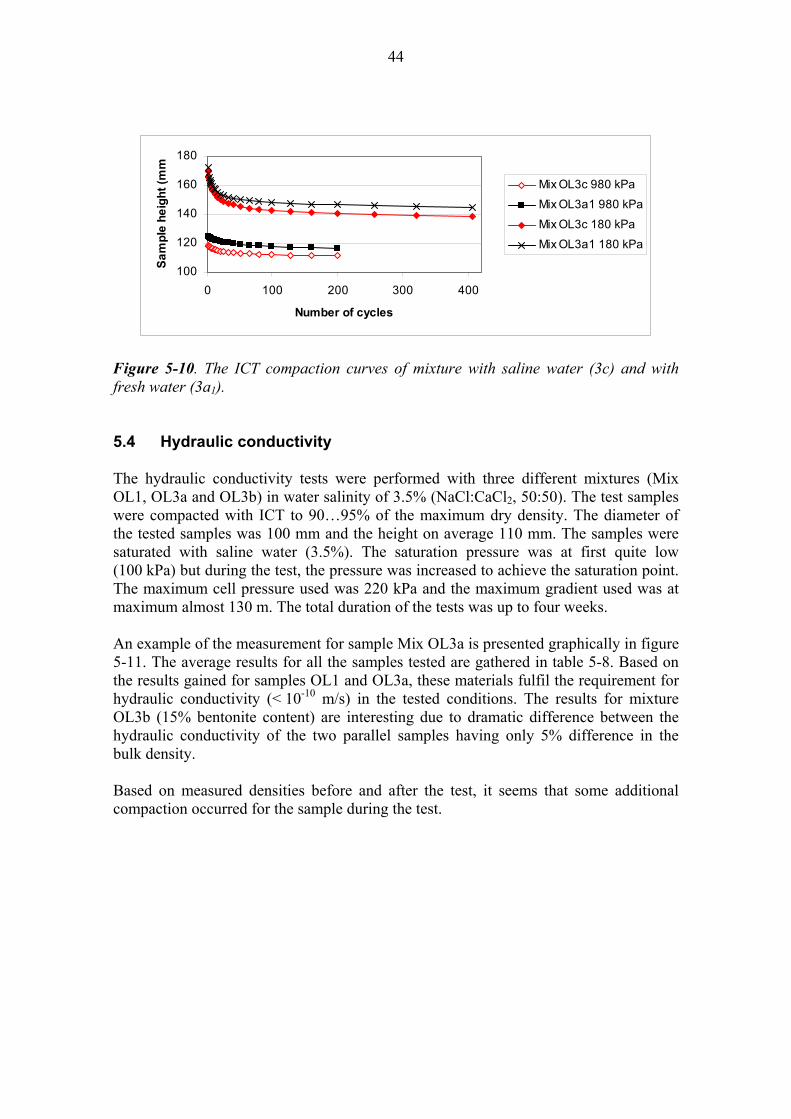
The maximum dry density achieved with the mix OL3a2 (Hobart mixer) is a bit smaller than the value of the mix OL3a1 (Eirich mixer see table 5-6). However, the difference can be considered insignificant. Based on visual observation, the homogeneity of the end product was better when the mixing was done with the Eirich mixer than when the mixing was performed with the Hobart mixer. 5.3.6 Effect of saline mixing water The effect of 3.5% saline mixing water was insignificant, since the maximum dry densities are nearly the same as with fresh water (see Fig. 5-9). The shape of the curves is a little different, but the difference between the determined points is insignificant. The ICT compaction shows that the mixture with saline water was slightly easier to compact especially when low compression pressure was used (see Fig 5-10). This may be due to more intense swelling in case of fresh mixing water. However, the difference in compactibility is relatively small and the use of extra saline water is not recommended in order to minimize the exposure of bentonite to saline fluids.
1880
1900
1920
1940
1960
1980
7 8 9 10 11 12 13 14 15 16
Water (%)
Dry
den
sity
(kg/
m3)
Saline w ater
Fresh w ater
Figure 5-9. The optimum water content curves with fresh and saline water with Proctor method.
44
100
120
140
160
180
0 100 200 300 400
Number of cycles
Sam
ple
heig
ht (m
m
Mix OL3c 980 kPa
Mix OL3a1 980 kPa
Mix OL3c 180 kPa
Mix OL3a1 180 kPa
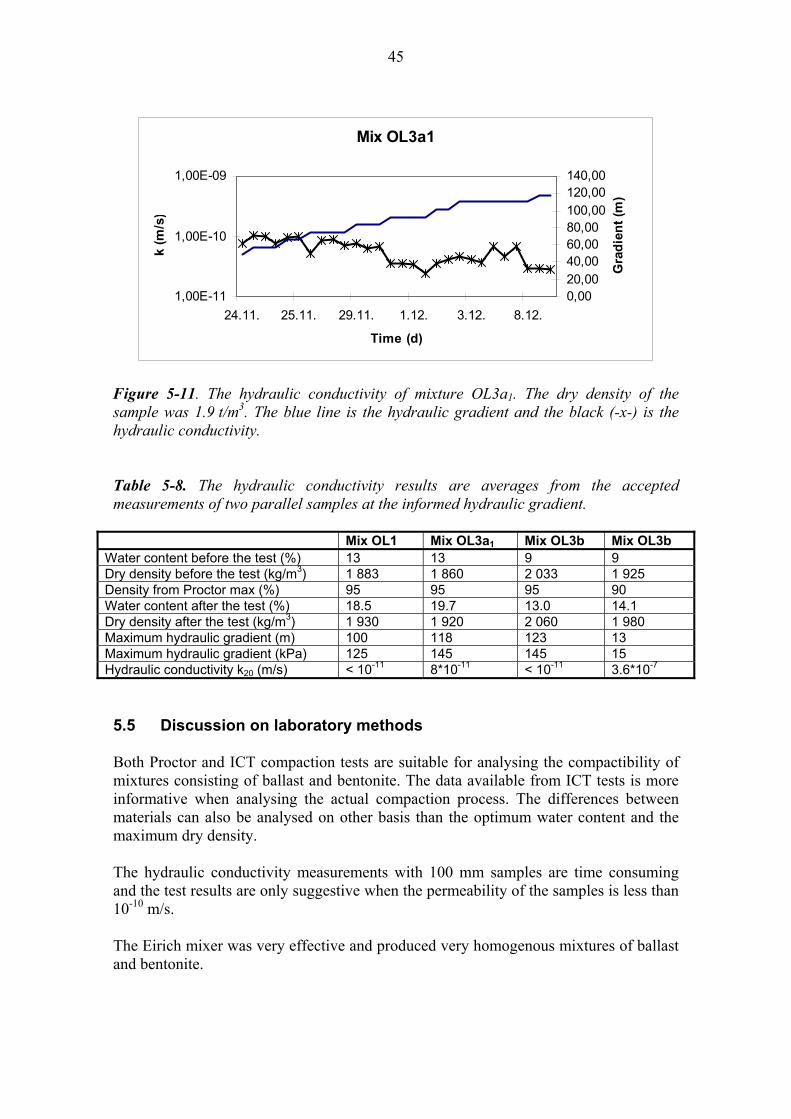
Figure 5-10. The ICT compaction curves of mixture with saline water (3c) and with fresh water (3a1). 5.4 Hydraulic conductivity The hydraulic conductivity tests were performed with three different mixtures (Mix OL1, OL3a and OL3b) in water salinity of 3.5% (NaCl:CaCl2, 50:50). The test samples were compacted with ICT to 90…95% of the maximum dry density. The diameter of the tested samples was 100 mm and the height on average 110 mm. The samples were saturated with saline water (3.5%). The saturation pressure was at first quite low (100 kPa) but during the test, the pressure was increased to achieve the saturation point. The maximum cell pressure used was 220 kPa and the maximum gradient used was at maximum almost 130 m. The total duration of the tests was up to four weeks. An example of the measurement for sample Mix OL3a is presented graphically in figure 5-11. The average results for all the samples tested are gathered in table 5-8. Based on the results gained for samples OL1 and OL3a, these materials fulfil the requirement for hydraulic conductivity (< 10-10 m/s) in the tested conditions. The results for mixture OL3b (15% bentonite content) are interesting due to dramatic difference between the hydraulic conductivity of the two parallel samples having only 5% difference in the bulk density. Based on measured densities before and after the test, it seems that some additional compaction occurred for the sample during the test.
45
Mix OL3a1
1,00E-11
1,00E-10
1,00E-09
24.11. 25.11. 29.11. 1.12. 3.12. 8.12.
Time (d)
k (m
/s)
0,0020,0040,0060,0080,00100,00120,00140,00
Gra
dien
t (m
)
Figure 5-11. The hydraulic conductivity of mixture OL3a1. The dry density of the sample was 1.9 t/m3. The blue line is the hydraulic gradient and the black (-x-) is the hydraulic conductivity. Table 5-8. The hydraulic conductivity results are averages from the accepted measurements of two parallel samples at the informed hydraulic gradient.
Mix OL1 Mix OL3a1 Mix OL3b Mix OL3b Water content before the test (%) 13 13 9 9 Dry density before the test (kg/m3) 1 883 1 860 2 033 1 925 Density from Proctor max (%) 95 95 95 90 Water content after the test (%) 18.5 19.7 13.0 14.1 Dry density after the test (kg/m3) 1 930 1 920 2 060 1 980 Maximum hydraulic gradient (m) 100 118 123 13 Maximum hydraulic gradient (kPa) 125 145 145 15 Hydraulic conductivity k20 (m/s) < 10-11 8*10-11 < 10-11 3.6*10-7
5.5 Discussion on laboratory methods Both Proctor and ICT compaction tests are suitable for analysing the compactibility of mixtures consisting of ballast and bentonite. The data available from ICT tests is more informative when analysing the actual compaction process. The differences between materials can also be analysed on other basis than the optimum water content and the maximum dry density. The hydraulic conductivity measurements with 100 mm samples are time consuming and the test results are only suggestive when the permeability of the samples is less than 10-10 m/s. The Eirich mixer was very effective and produced very homogenous mixtures of ballast and bentonite.
46
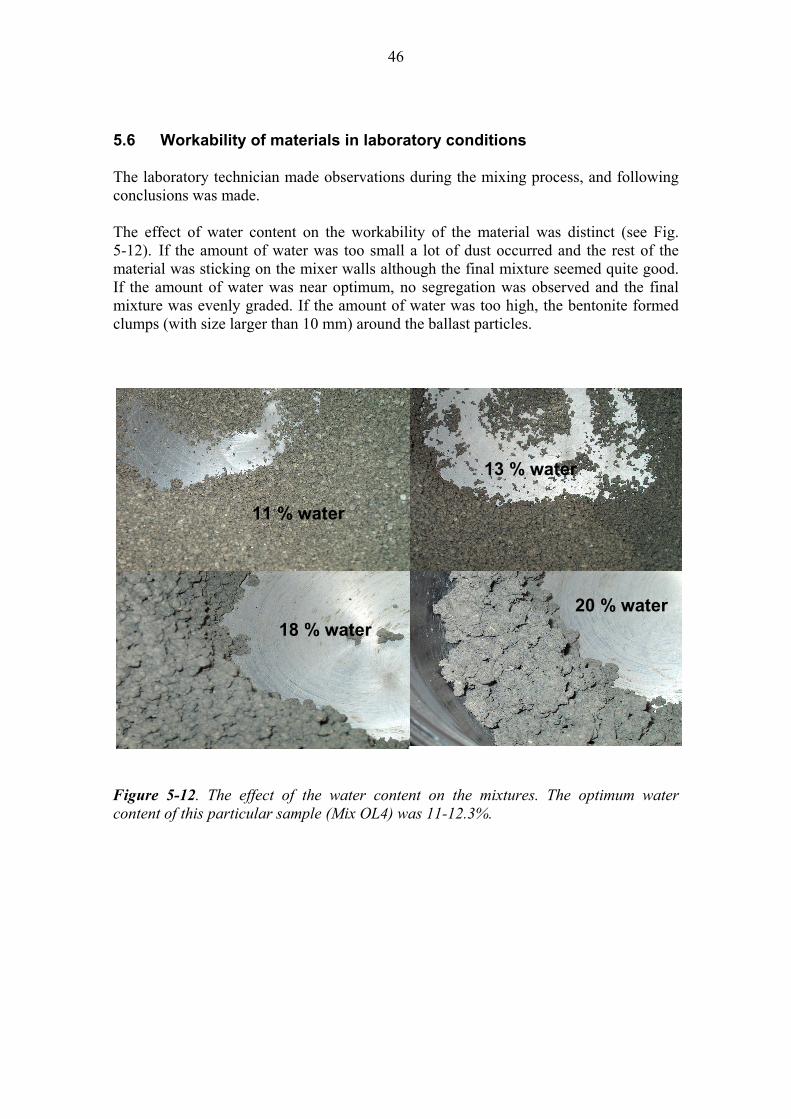
5.6 Workability of materials in laboratory conditions The laboratory technician made observations during the mixing process, and following conclusions was made. The effect of water content on the workability of the material was distinct (see Fig. 5-12). If the amount of water was too small a lot of dust occurred and the rest of the material was sticking on the mixer walls although the final mixture seemed quite good. If the amount of water was near optimum, no segregation was observed and the final mixture was evenly graded. If the amount of water was too high, the bentonite formed clumps (with size larger than 10 mm) around the ballast particles.
Figure 5-12. The effect of the water content on the mixtures. The optimum water content of this particular sample (Mix OL4) was 11-12.3%.
11 % water
13 % water
18 % water20 % water
47
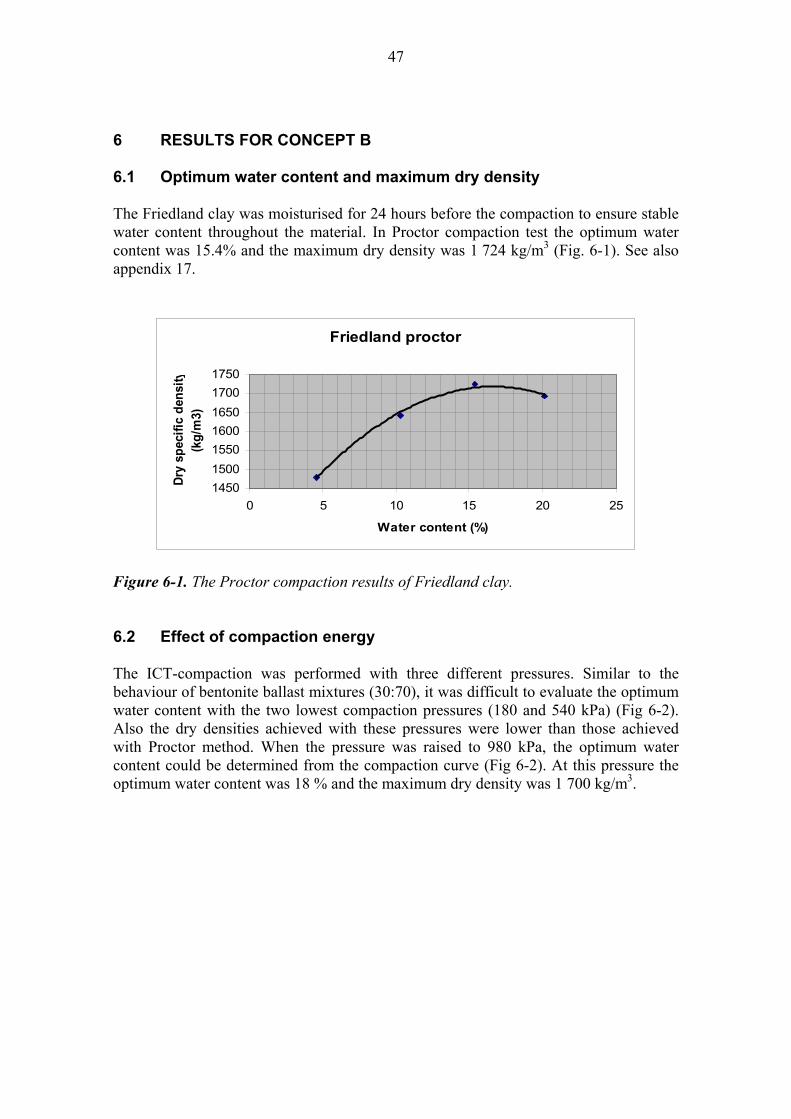
6 RESULTS FOR CONCEPT B 6.1 Optimum water content and maximum dry density The Friedland clay was moisturised for 24 hours before the compaction to ensure stable water content throughout the material. In Proctor compaction test the optimum water content was 15.4% and the maximum dry density was 1 724 kg/m3 (Fig. 6-1). See also appendix 17.
Friedland proctor
1450150015501600165017001750
0 5 10 15 20 25
Water content (%)
Dry
spec
ific
dens
ity(k
g/m
3)
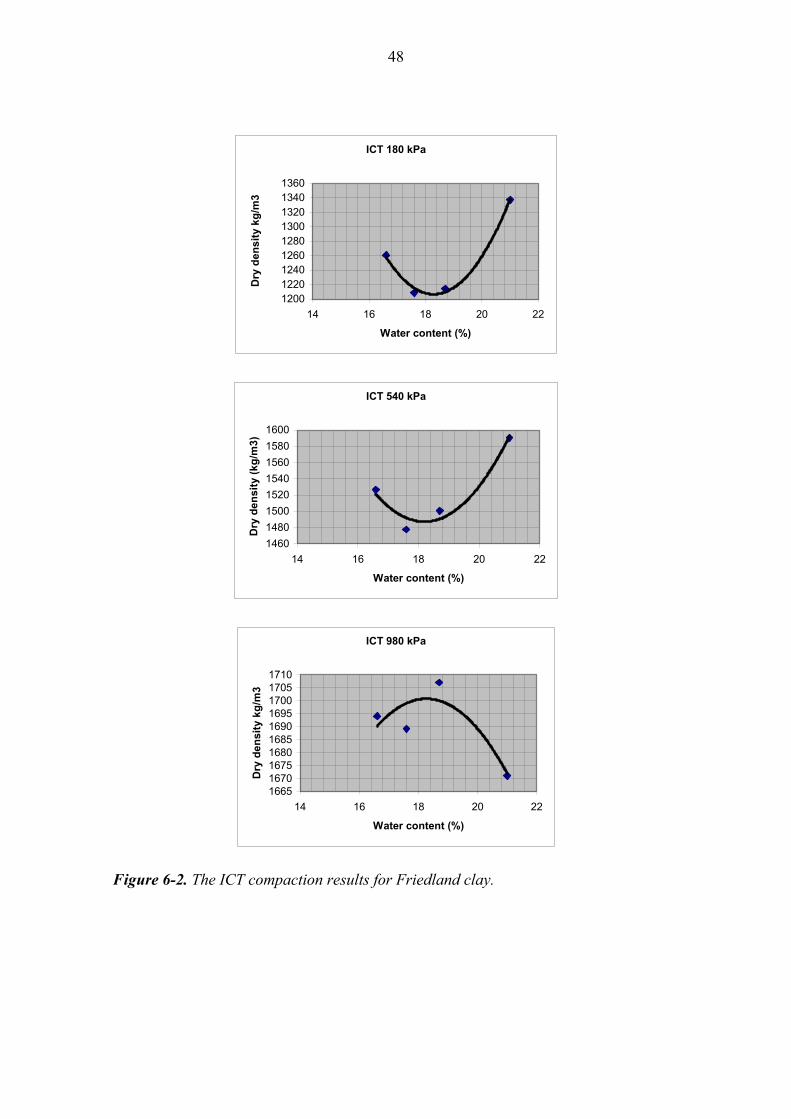
Figure 6-1. The Proctor compaction results of Friedland clay. 6.2 Effect of compaction energy The ICT-compaction was performed with three different pressures. Similar to the behaviour of bentonite ballast mixtures (30:70), it was difficult to evaluate the optimum water content with the two lowest compaction pressures (180 and 540 kPa) (Fig 6-2). Also the dry densities achieved with these pressures were lower than those achieved with Proctor method. When the pressure was raised to 980 kPa, the optimum water content could be determined from the compaction curve (Fig 6-2). At this pressure the optimum water content was 18 % and the maximum dry density was 1 700 kg/m3.
48
ICT 180 kPa
120012201240126012801300132013401360
14 16 18 20 22
Water content (%)
Dry
den
sity
kg/
m3
ICT 540 kPa
14601480150015201540156015801600
14 16 18 20 22
Water content (%)
Dry
den
sity
(kg/
m3)
ICT 980 kPa
1665167016751680168516901695170017051710
14 16 18 20 22
Water content (%)
Dry
den
sity
kg/
m3
Figure 6-2. The ICT compaction results for Friedland clay.
49
7 DISCUSSION AND CONCLUSIONS Properties of the ballast material and certain other parameters were varied in order to evaluate their effect on the compactibility of bentonite-ballast mixture. In order to vary the grain size distribution of the ballast material, four different types of crushed rock were prepared from Olkiluoto mica-gneiss. In addition, sand with uniform grain size distribution and rounded grain shape was tested as ballast material. The other variables were: bentonite content, compaction method & energy, mixing process and salinity of the mixing water. Three different crushing processes were simulated and tested at Metso Minerals crushing laboratory. Heterogeneity of the Olkiluoto rock was observed in the crushing tests due to variations in the crushability of the feed material. The amount of crushing cycles had influence on the energy consumption and on the flakiness index (FI) of the produced ballast materials. At least three crushing cycles are recommended to produce ballast material from Olkiluoto rock. The three different crushing processes were designed with the aim to produce differences between the grain size distributions of the ballast materials Bal OL1, OL2 and OL3. Two versions of ballast material OL2 were artificially prepared: fines were added to sample Bal OL2a and fines were washed away from Bal OL2b in order to test the effect of amount of fines to the compactibility of the mixture. Ballast OL4 was produced with a full-scale crushing process. The actual differences between the grain size distributions of crushed ballast materials OL1, OL2, OL3 & OL4 were somewhat smaller than expected. This can be explained with the limited maximum grain size for the ballast. If larger differences in the maximum grain sizes had been allowed the differences would have probably been more distinct. In addition, the heterogeneity of the Olkiluoto mica-gneiss was apparent when comparing the produced ballast materials. The highest maximum densities were achieved for ballast materials having the widest grain size distribution and highest amount of fines compared to those with low amount of fines. The maximum dry densities determined for ballast materials with Proctor test were 2 000…2 170 kg/m3. The densities achieved with ICT (180 kPa) were a little smaller. The optimum water content of the ballast materials was relatively high, 8-11%. The porosity of the ballast materials varied between 21 and 28% depending on the amount of fines in the material. In theory this means that, in case the bentonite content is 30%, there is surplus of bentonite and the ballast grains are no longer in contact with each other throughout the material. This is assumed to affect the compaction behaviour of the material as well as other physical properties of the material (hydraulic conductivity, compressibility etc.). When the bentonite content of the mixtures is 30%, the grain size distribution of crushed ballast materials has no significant effect on the compactibility of the mixture. This can be explained by the surplus of bentonite that dominates the behaviour of the material. However, this conclusion is not necessarily valid in case the maximum grain size of the ballast is >>10 mm. The dry density of the sample having only 15% bentonite content was remarkably higher than dry densities achieved for 30/70 mixtures.
50
This confirms the assumption that the main factor affecting the compaction behaviour of bentonite/ballast mixtures is the bentonite content. From the compaction point of view, the ballast produced with the simplest crushing process is as suitable as the ballast produced with a multi-phased crushing process, assuming that the bentonite content is 30% or more. In addition the flakiness index (FI) describing the shape of the individual particles of the ballast material did not have remarkable effect on the compactibility of the mixture. However, the importance of grain size distribution and FI of the ballast material increases with decreasing bentonite content. The maximum dry densities achieved for mixture of sand and bentonite were a little lower than the maximum dry densities achieved for crushed rock based mixtures. Since the sand had uniform grain size distribution and all crushed ballast materials were unsorted, it can be concluded that certain amount of gradation for the ballast material is favourable also in case of 30/70 mixtures. In addition, the grain shape seems to affect the packing of bentonite/ballast mixtures. The maximum dry densities achieved for the bentonite-ballast mixtures (30/70) with Proctor compaction test were 1 910-2 050 kg/m3 while the optimum water content was between 11-12.5%. The average extra water needed to compact the mixtures was only 3% compared to water content of pure ballast materials. The compaction pressures applied with ICT were 180, 540 and 980 kPa. The compaction curve achieved for 30/70 mixtures with the highest pressure corresponds to the pressure applied in the Proctor compaction test. When compacted with the two lower pressures, the shape of the curve was almost reverse compared to the normal compaction curve and the density increased with increasing water content. Based on this result, the two lower compaction pressures were not high enough to exceed the forces between particles in the 30/70 mixture. Similar behaviour was observed in the ICT test for Friedland-clay, while the pure ballast materials compacted nicely also with the lowest pressure. Therefore, it can be concluded that the bentonite-ballast mixture (30/70) is a cohesive to semi-cohesive material requiring higher compaction energy than non-cohesive soil types. The mixing process does not have any effect on the compactibility of the mixture. However, the mixing procedure most likely affects the homogeneity of the mixture. Eirich type of mixer is recommended also in large scale. Based on the test results, there is no significant advantage in using saline water when mixing the sample into optimum water content. The workability of the mixture depends mainly on the water content of the mixture. Small maximum grain size of the ballast seems to reduce the risk of segregation of the bentonite and ballast component. Based on the hydraulic conductivity results obtained for two 30/70 mixtures (Mix OL1 and Mix OL3a) the requirement of hydraulic conductivity can be reached if the samples
51
are compacted to 90-95% from the Proctor maximum density. The hydraulic conductivity of sample Mix OL3b with 15% bentonite content had acceptable hydraulic conductivity in density of 95% from the Proctor maximum, but only 5% drop in density increased the hydraulic conductivity of this sample to non-acceptable level. The dry densities of the tested samples varied between 1 900-1 980 kg/m3 (OL1 and OL3a) and 1 930-2 030 kg/m3 (OL3b). The tests were performed in salinity of 3.5% (NaCl:CaCl2, 50:50). The calculated effective clay dry density (ECDD) for the 30/70 mixtures varied between 1 320-1 540 kg/m3. The ECDD for the 15/85 sample was 1 186 kg/m3. Since the requirement for ECDD is > 1 000 kg/m3, the calculated values in Proctor maximum density are all above this limit. The ICT test done with three different compaction pressures revealed that the compaction behaviour of Friedland-clay is very similar to the compaction behaviour of the tested 30/70-mixtures. The compaction pressure needs to be as high as 980 kPa before the ICT results can be compared to Proctor results. When compacting with lower pressures higher water content (than achieved with 980 kPa) is required in order to compact the material. The optimum water content and maximum dry density determined with Proctor method was 15,4% and 1 724 kg/m3. The corresponding values achieved with ICT-test (980 kPa) were 18% and 1 700 kg/m3. As a summary, the importance of the ballast material on the compactibility of the backfill mixture diminishes with increasing bentonite content. The behaviour of the bentonite-ballast mixture (30:70) is dominated by the clay fraction and the material can be considered cohesive (or semi-cohesive). Ballast material with maximum grain size ≤ 10 mm seems to form a homogeneous mixture with bentonite when the water content is near optimum. From economical point of view it should be studied what are the material properties of bentonite-ballast mixtures with bentonite content just enough to fill up the pore-space between the ballast grains. In this case the ballast material could be optimized to minimize the proportion of bentonite within the mixture.

52
53
LIST OF REFERENCES Fetter, C.W. 1994. Applied Hydrogeology, 3rd edition. Prentice-Hall, Inc. New Jersey, USA. ISBN 0-02-336490-4. 691 pages. Dixon, D. 2000. Porewater salinity and the development of swelling pressure in bentonite-based buffer and backfill materials. Posiva Oy, Helsinki. POSIVA 2000-04. Dixon, D. 2002. The influence of groundwater salinity and interfaces on the performance of potential backfilling materials. 6th International Workshop on Design and Construction of Final Repositories. “Backfilling in Radioactive Waste Disposal.” ONDRAF/NIRAS Brussels, 11-13 March 2002. Transactions, Session IV, paper 9. Gunnarsson, D., Börgesson, L., Keto, P., Tolppanen, P. & Hansen, J. 2004. Backfilling of the Deep Repository. Posiva Oy, Eurajoki. Working Report 2003-77. Johannesson, L-E. & Nilsson, U. 2005. Geotechnical properties of candidate backfill materials for the deep repository. Laboratory tests for determining material performance. Swedish Nuclear Fuel and Waste Management Co (SKB), Stockholm. Technical Report (in print). Karnland, O. 1998. Bentonite swelling pressure in strong NaCl solutions. Posiva Oy, Helsinki. POSIVA 98-01. Khan, Z., Al-Abdul, H., Asi, I. & Ramadhan, R. 1998. Comparative study of asphalt concrete laboratory compaction methods to simulate field compaction. Construction and Building Materials 12 (1998), pages 373-384. Metso Minerals 2002. Metso Minerals instructions (Toimintaohjeet) (in Finnish). Internal publication. Pusch, R. 1995. Consequences of using crushed crystalline rock as a ballast in KBS-3 tunnels instead of rounded quartz particles. Swedish Nuclear Fuel and Waste Management Co (SKB), Stockholm. Technical Report 95-14. Tolppanen, P. 1998. Use and crushing of excavated rock (in Finnish). Posiva Oy, Helsinki. Working Report 98-40. Terzaghi, K., Peck, R. & Gholamreza, M. 1996. Soil Mechanics in Engineering Practice. Third Edition. A Wiley-Interscience Publication. John Wiley & Sons, Inc. New York, Chichester, Brisbane, Toronto, Singapore. ISBN 0-471-08658-4. 549 pages.

54
55
LIST OF APPENDICES Appendix 1. Average gradings and variations in the product grading curves for
ballast materials OL1, OL2 & OL3. Appendix 2. Ballast OL1: grain size distribution data and results from Proctor &
ICT compaction tests. Appendix 3. Ballast OL2a: grain size distribution data and results from Proctor &
ICT compaction tests. Appendix 4. Ballast OL2b: grain size distribution data and results from Proctor &
ICT compaction tests. Appendix 5. Ballast OL3: grain size distribution data and results from Proctor &
ICT compaction tests. Appendix 6. Ballast OL4: grain size distribution data. Appendix 7. Mix REF: results from Proctor & ICT compaction tests Appendix 8. Mix OL1: results from Proctor & ICT compaction tests Appendix 9. Mix OL2a: results from Proctor & ICT compaction tests Appendix 10. Mix OL2b: results from Proctor & ICT compaction tests Appendix 11. Mix OL3a1: results from Proctor & ICT compaction tests Appendix 12. Mix OL3a2: results from Proctor & ICT compaction tests Appendix 13. Mix OL3b: results from Proctor & ICT compaction tests Appendix 14. Mix OL3c: results from Proctor & ICT compaction tests Appendix 15. Mix OL4: results from Proctor & ICT compaction tests Appendix 16. Mix Sand: results from Proctor & ICT compaction tests Appendix 17. Mix REF: results from Proctor & ICT compaction tests
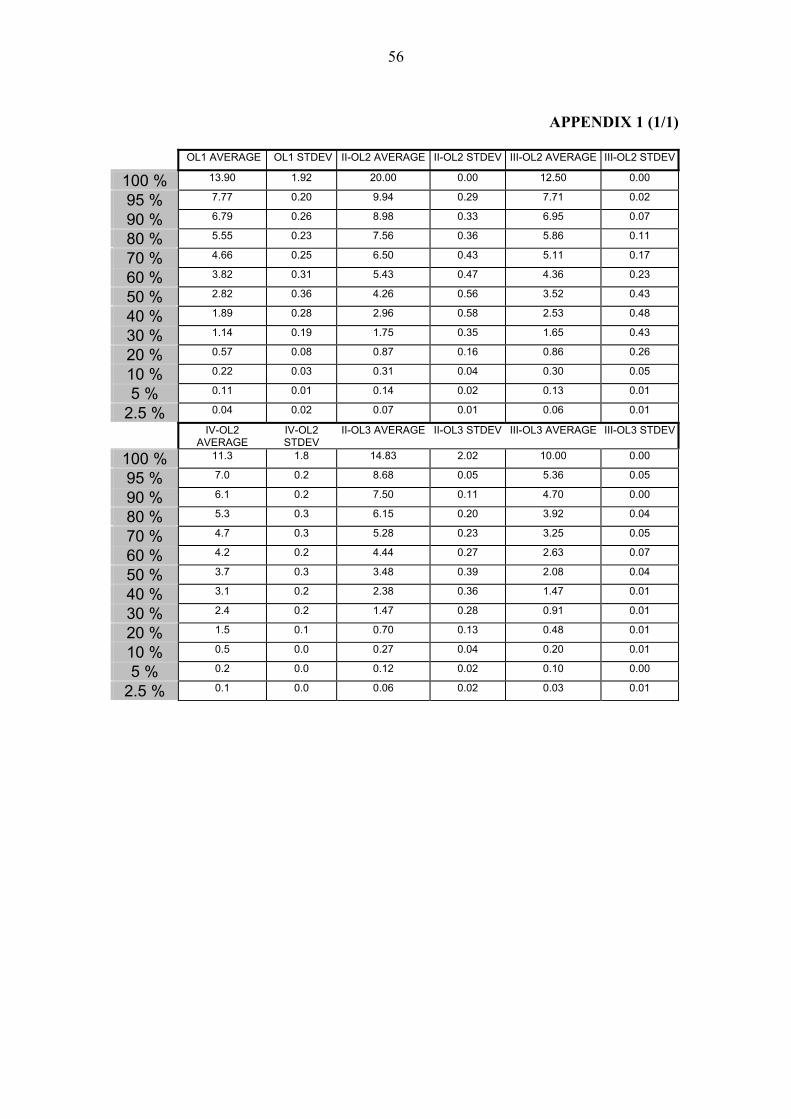
56
APPENDIX 1 (1/1)
OL1 AVERAGE OL1 STDEV II-OL2 AVERAGE II-OL2 STDEV III-OL2 AVERAGE III-OL2 STDEV
100 % 13.90 1.92 20.00 0.00 12.50 0.00
95 % 7.77 0.20 9.94 0.29 7.71 0.02
90 % 6.79 0.26 8.98 0.33 6.95 0.07
80 % 5.55 0.23 7.56 0.36 5.86 0.11
70 % 4.66 0.25 6.50 0.43 5.11 0.17
60 % 3.82 0.31 5.43 0.47 4.36 0.23
50 % 2.82 0.36 4.26 0.56 3.52 0.43
40 % 1.89 0.28 2.96 0.58 2.53 0.48
30 % 1.14 0.19 1.75 0.35 1.65 0.43
20 % 0.57 0.08 0.87 0.16 0.86 0.26
10 % 0.22 0.03 0.31 0.04 0.30 0.05
5 % 0.11 0.01 0.14 0.02 0.13 0.01
2.5 % 0.04 0.02 0.07 0.01 0.06 0.01
IV-OL2 AVERAGE
IV-OL2 STDEV
II-OL3 AVERAGE II-OL3 STDEV III-OL3 AVERAGE III-OL3 STDEV
100 % 11.3 1.8 14.83 2.02 10.00 0.00
95 % 7.0 0.2 8.68 0.05 5.36 0.05
90 % 6.1 0.2 7.50 0.11 4.70 0.00
80 % 5.3 0.3 6.15 0.20 3.92 0.04
70 % 4.7 0.3 5.28 0.23 3.25 0.05
60 % 4.2 0.2 4.44 0.27 2.63 0.07
50 % 3.7 0.3 3.48 0.39 2.08 0.04
40 % 3.1 0.2 2.38 0.36 1.47 0.01
30 % 2.4 0.2 1.47 0.28 0.91 0.01
20 % 1.5 0.1 0.70 0.13 0.48 0.01
10 % 0.5 0.0 0.27 0.04 0.20 0.01
5 % 0.2 0.0 0.12 0.02 0.10 0.00
2.5 % 0.1 0.0 0.06 0.02 0.03 0.01
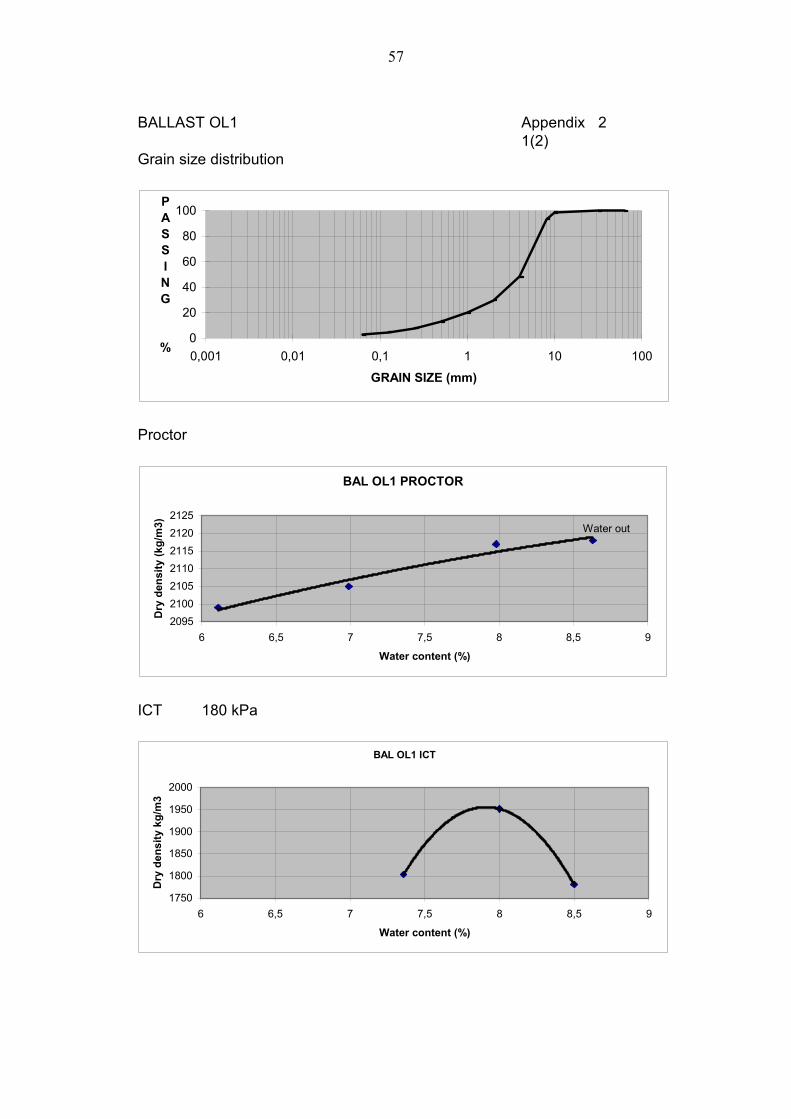
57
BALLAST OL1 Appendix 21(2)
Grain size distribution
Proctor
ICT 180 kPa
0
20
40
60
80
100
0,001 0,01 0,1 1 10 100
GRAIN SIZE (mm)
PASSING
%
BAL OL1 PROCTOR
2095210021052110211521202125
6 6,5 7 7,5 8 8,5 9
Water content (%)
Dry
den
sity
(kg/
m3) Water out
BAL OL1 ICT
1750
1800
1850
1900
1950
2000
6 6,5 7 7,5 8 8,5 9
Water content (%)
Dry
den
sity
kg/
m3
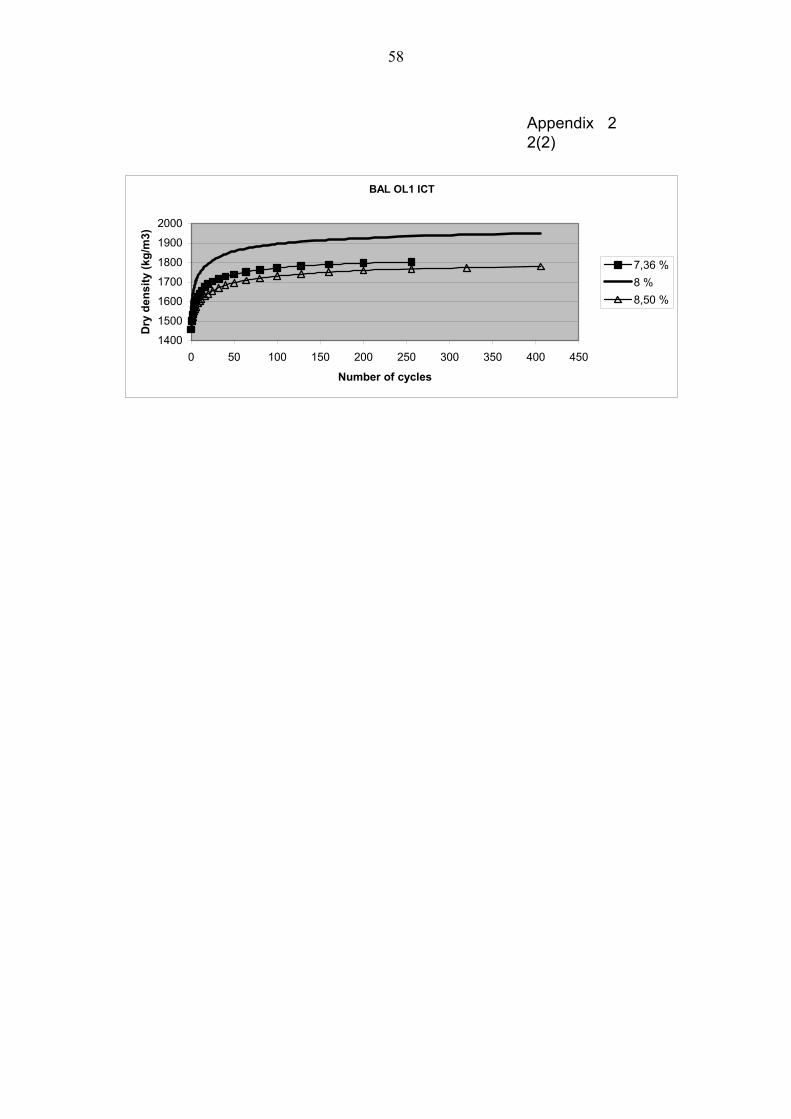
58
Appendix 22(2)
BAL OL1 ICT
1400
1500
1600
1700
1800
1900
2000
0 50 100 150 200 250 300 350 400 450
Number of cycles
Dry
den
sity
(kg/
m3)
7,36 %8 %8,50 %
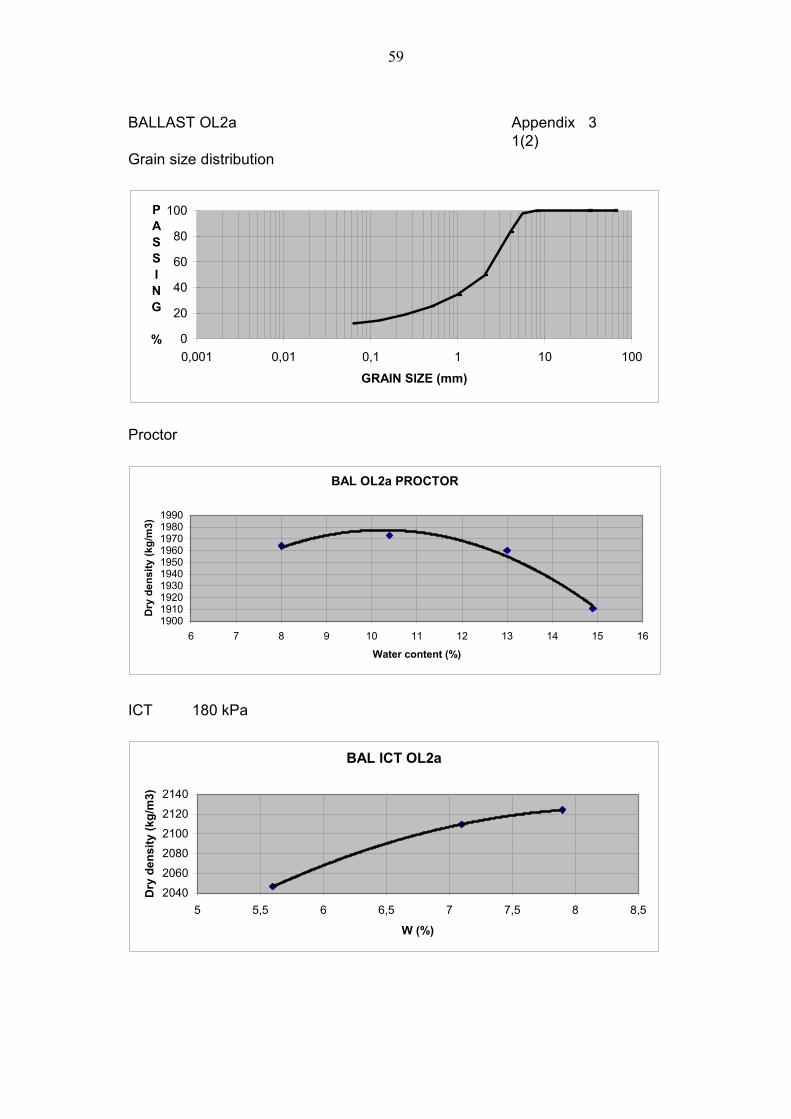
59
BALLAST OL2a Appendix 31(2)
Grain size distribution
Proctor
ICT 180 kPa
BAL ICT OL2a
2040
2060
2080
2100
2120
2140
5 5,5 6 6,5 7 7,5 8 8,5
W (%)
Dry
den
sity
(kg/
m3)
BAL OL2a PROCTOR
1900191019201930194019501960197019801990
6 7 8 9 10 11 12 13 14 15 16
Water content (%)
Dry
den
sity
(kg/
m3)
0
20
40
60
80
100
0,001 0,01 0,1 1 10 100
GRAIN SIZE (mm)
PASSING
%
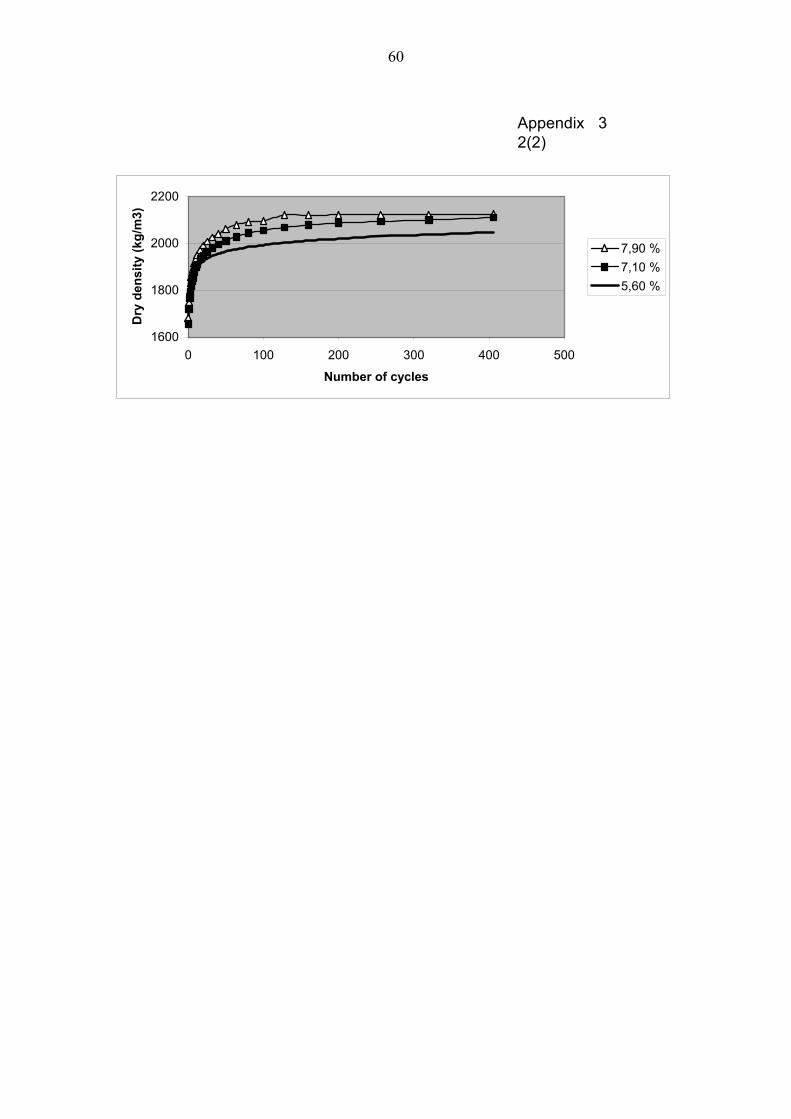
60
Appendix 32(2)
1600
1800
2000
2200
0 100 200 300 400 500
Number of cycles
Dry
den
sity
(kg/
m3)
7,90 %7,10 %5,60 %
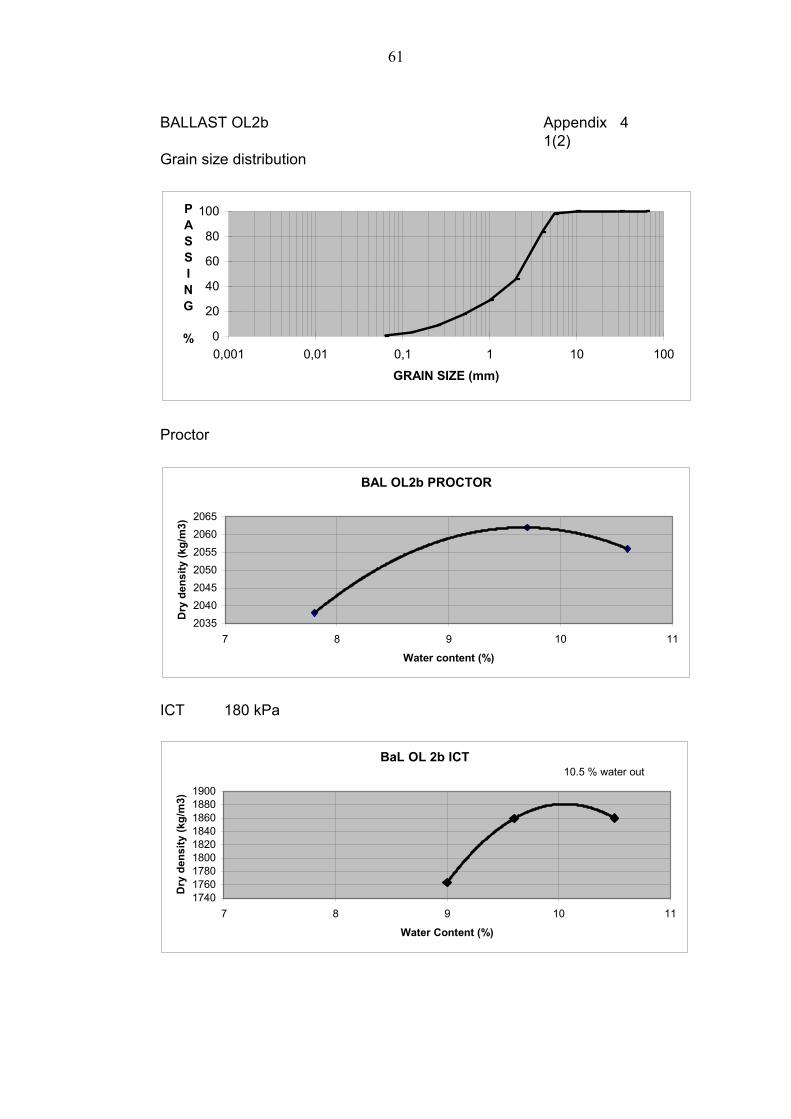
61
BALLAST OL2b Appendix 41(2)
Grain size distribution
Proctor
ICT 180 kPa
0
20
40
60
80
100
0,001 0,01 0,1 1 10 100
GRAIN SIZE (mm)
PASSING
%
BAL OL2b PROCTOR
2035204020452050205520602065
7 8 9 10 11
Water content (%)
Dry
den
sity
(kg/
m3)
BaL OL 2b ICT
174017601780180018201840186018801900
7 8 9 10 11
Water Content (%)
Dry
den
sity
(kg/
m3)
10.5 % water out
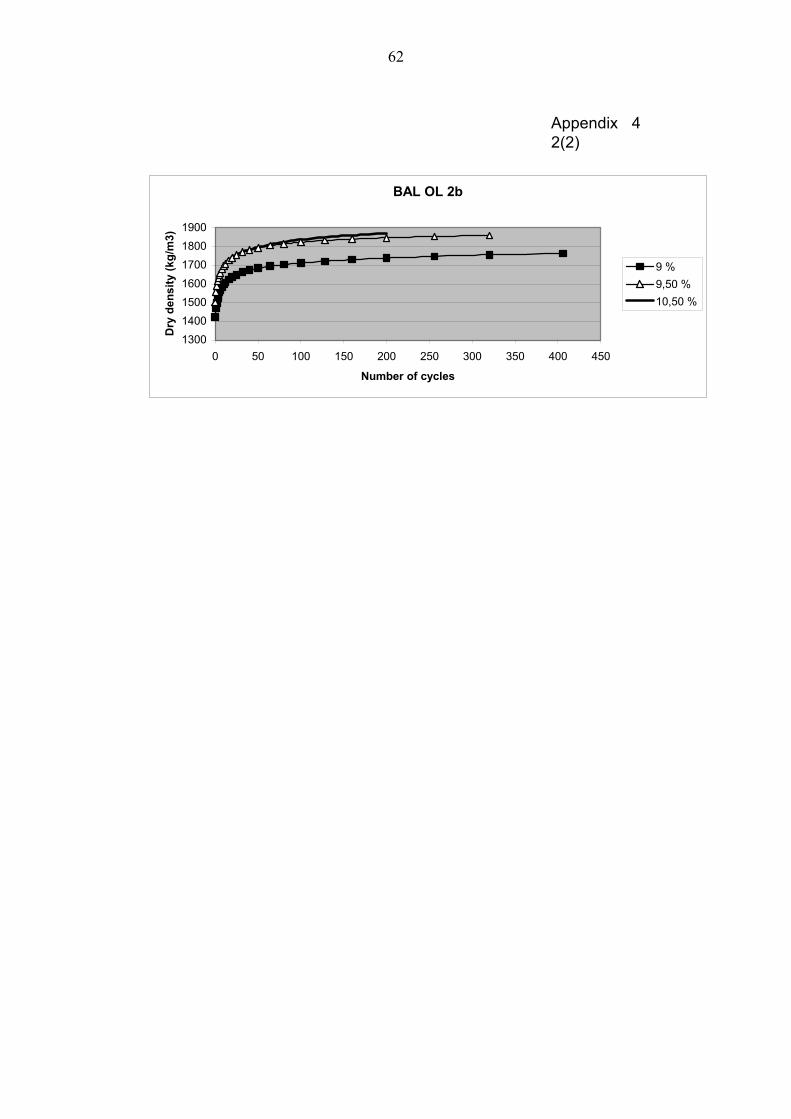
62
Appendix 42(2)
BAL OL 2b
1300140015001600170018001900
0 50 100 150 200 250 300 350 400 450
Number of cycles
Dry
den
sity
(kg/
m3)
9 %9,50 %10,50 %
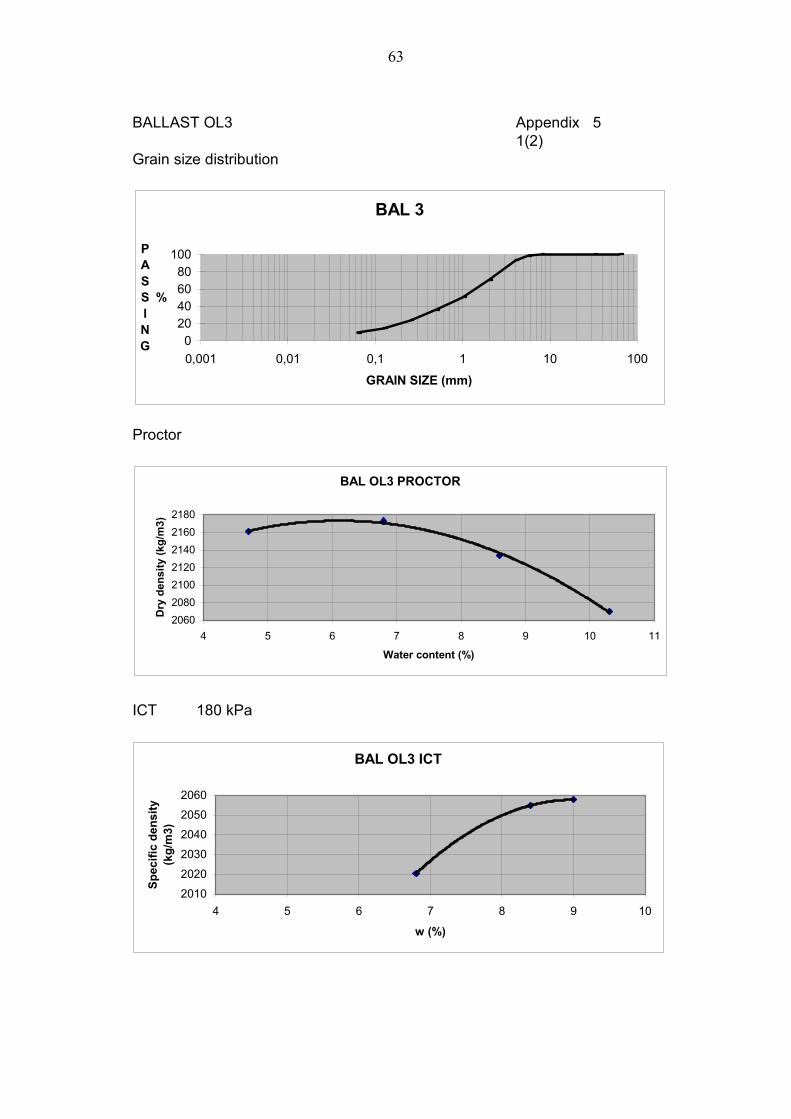
63
BALLAST OL3 Appendix 51(2)
Grain size distribution
Proctor
ICT 180 kPa
BAL 3
020406080
100
0,001 0,01 0,1 1 10 100
GRAIN SIZE (mm)
PASSING
%
BAL OL3 PROCTOR
2060208021002120214021602180
4 5 6 7 8 9 10 11
Water content (%)
Dry
den
sity
(kg/
m3)
BAL OL3 ICT
2010
2020
2030
2040
2050
2060
4 5 6 7 8 9 10
w (%)
Spec
ific
dens
ity
(kg/
m3)
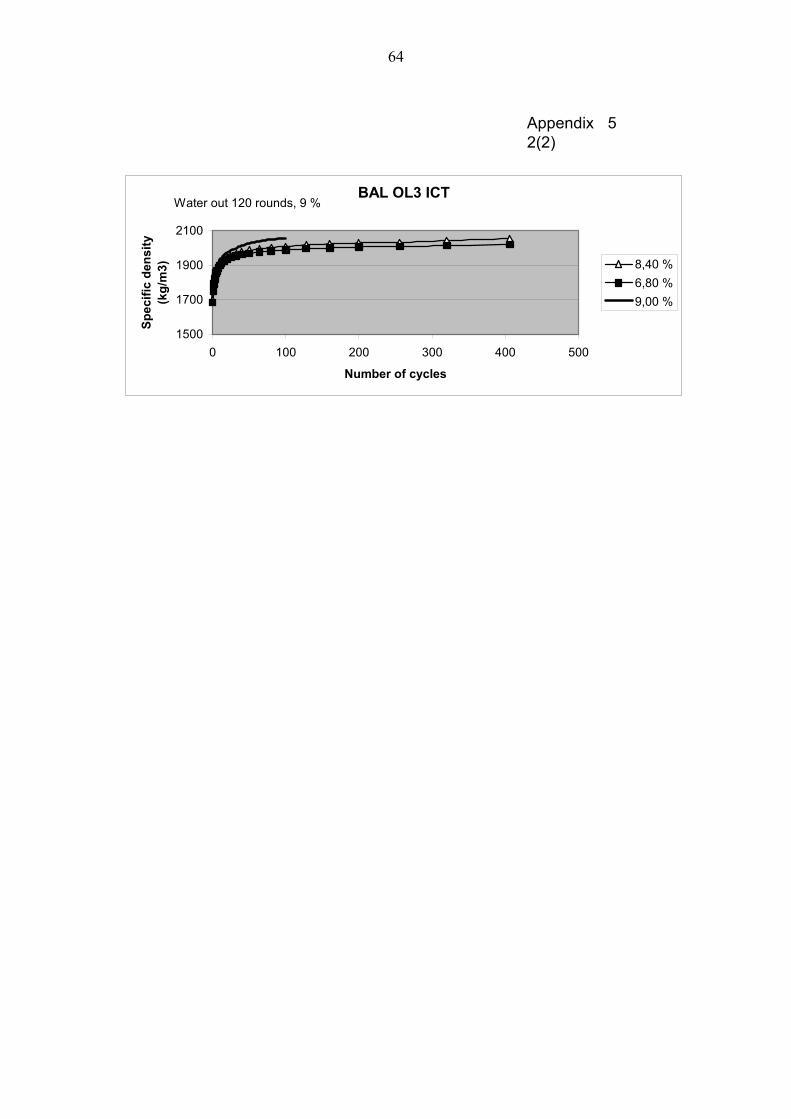
64
Appendix 52(2)
BAL OL3 ICT
1500
1700
1900
2100
0 100 200 300 400 500
Number of cycles
Spec
ific
dens
ity
(kg/
m3) 8,40 %
6,80 %9,00 %
Water out 120 rounds, 9 %
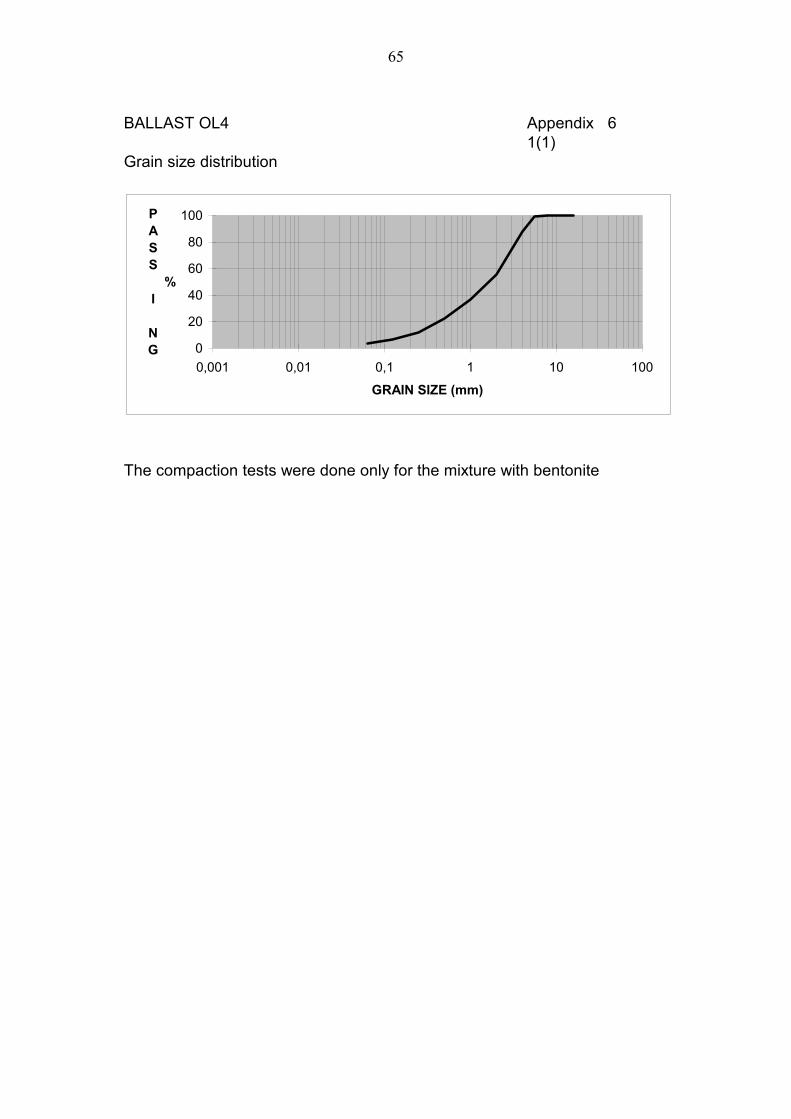
65
BALLAST OL4 Appendix 61(1)
Grain size distribution
The compaction tests were done only for the mixture with bentonite
0
20
40
60
80
100
0,001 0,01 0,1 1 10 100
GRAIN SIZE (mm)
PASS I NG
%
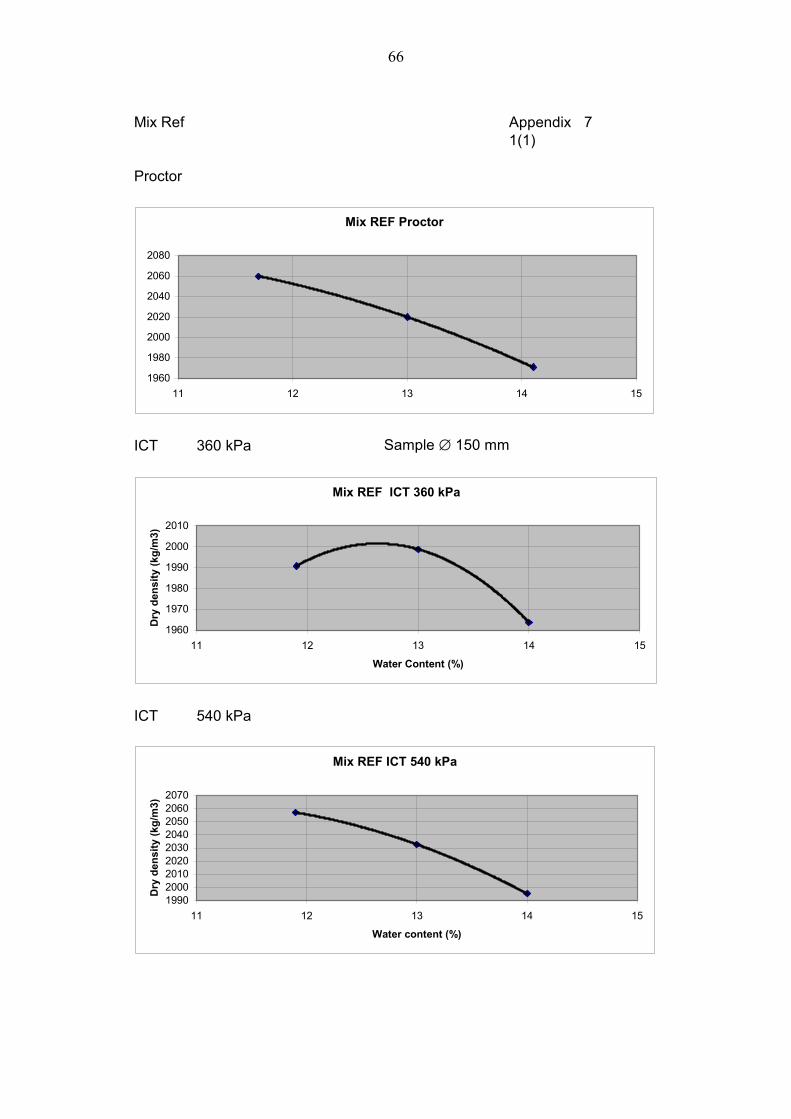
66
Mix Ref Appendix 71(1)
Proctor
ICT 360 kPa Sample ∅ 150 mm
ICT 540 kPa
Mix REF ICT 360 kPa
1960
1970
1980
1990
2000
2010
11 12 13 14 15
Water Content (%)
Dry
den
sity
(kg/
m3)
Mix REF ICT 540 kPa
199020002010202020302040205020602070
11 12 13 14 15
Water content (%)
Dry
den
sity
(kg/
m3)
Mix REF Proctor
1960
1980
2000
2020
2040
2060
2080
11 12 13 14 15
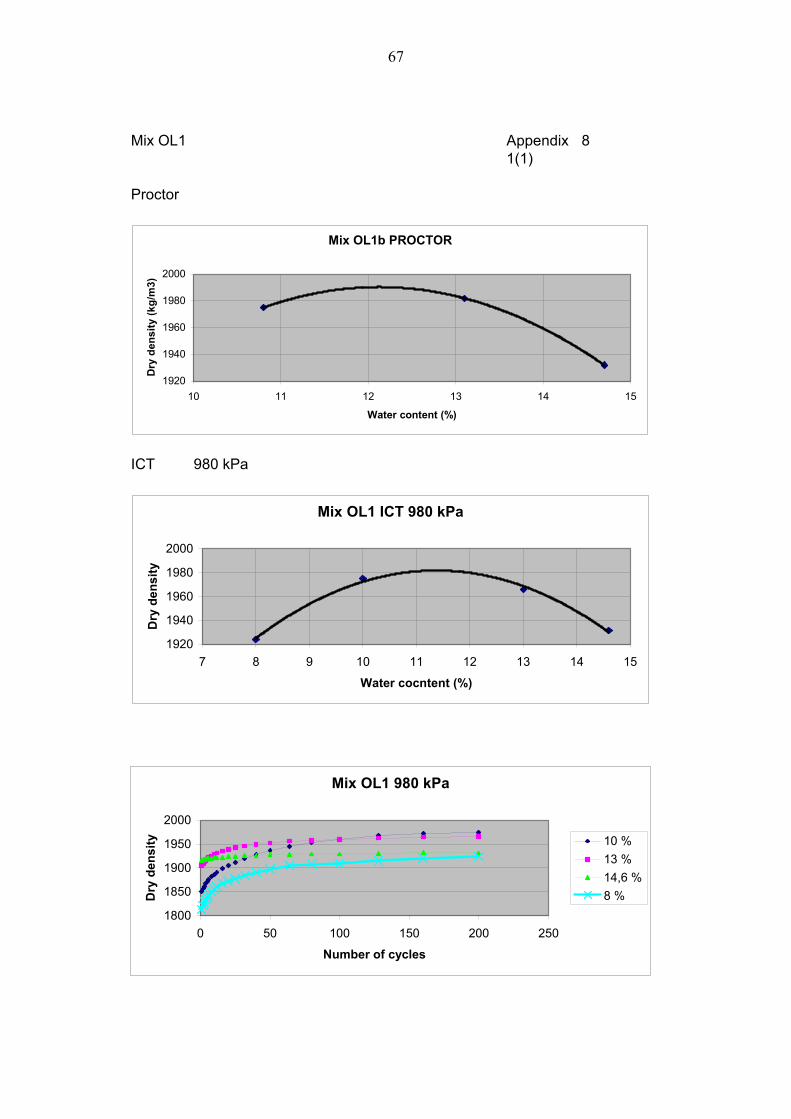
67
Mix OL1 Appendix 8
1(1)
Proctor
ICT 980 kPa
Mix OL1 980 kPa
1800
1850
1900
1950
2000
0 50 100 150 200 250
Number of cycles
Dry
den
sity 10 %
13 %14,6 %8 %
Mix OL1 ICT 980 kPa
1920
1940
1960
1980
2000
7 8 9 10 11 12 13 14 15
Water cocntent (%)
Dry
den
sity
Mix OL1b PROCTOR
1920
1940
1960
1980
2000
10 11 12 13 14 15
Water content (%)
Dry
den
sity
(kg/
m3)
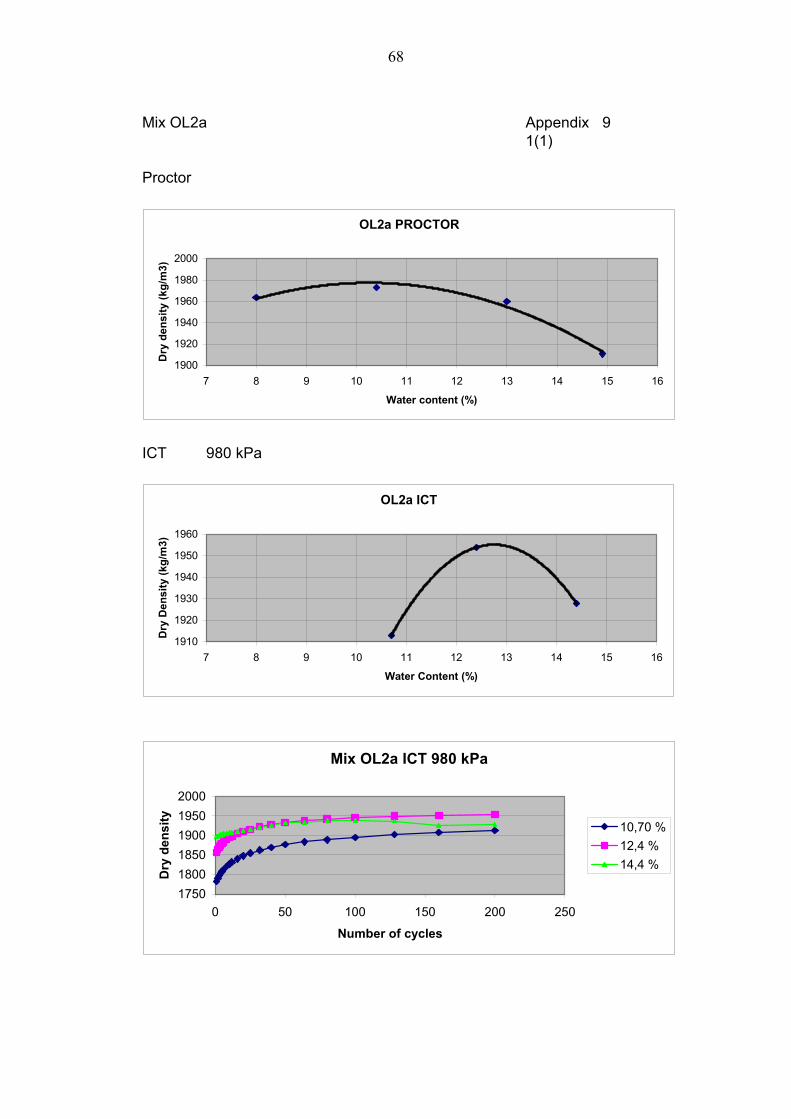
68
Mix OL2a Appendix 91(1)
Proctor
ICT 980 kPa
OL2a PROCTOR
1900
1920
1940
1960
1980
2000
7 8 9 10 11 12 13 14 15 16
Water content (%)
Dry
den
sity
(kg/
m3)
OL2a ICT
1910
1920
1930
1940
1950
1960
7 8 9 10 11 12 13 14 15 16
Water Content (%)
Dry
Den
sity
(kg/
m3)
Mix OL2a ICT 980 kPa
175018001850190019502000
0 50 100 150 200 250
Number of cycles
Dry
den
sity
10,70 %12,4 %14,4 %
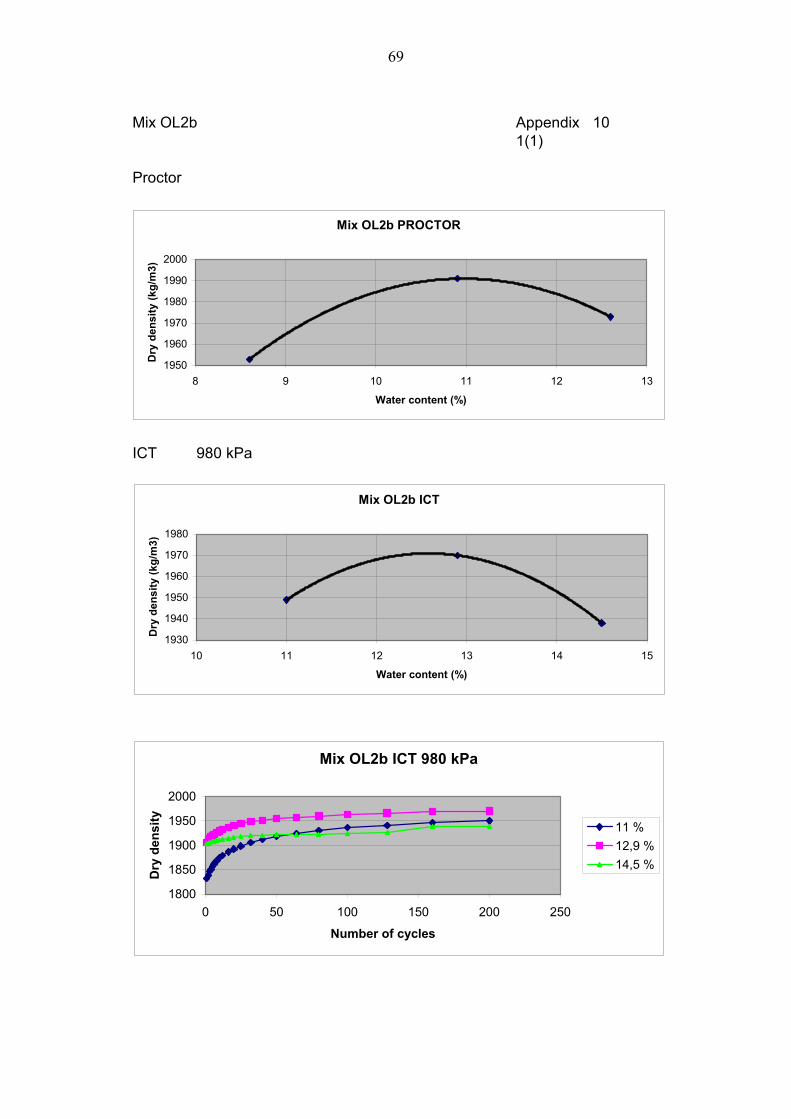
69
Mix OL2b Appendix 101(1)
Proctor
ICT 980 kPa
Mix OL2b ICT
1930
1940
1950
1960
1970
1980
10 11 12 13 14 15
Water content (%)
Dry
den
sity
(kg/
m3)
Mix OL2b ICT 980 kPa
1800
1850
1900
1950
2000
0 50 100 150 200 250
Number of cycles
Dry
den
sity
11 %12,9 %14,5 %
Mix OL2b PROCTOR
1950
1960
1970
1980
1990
2000
8 9 10 11 12 13
Water content (%)
Dry
den
sity
(kg/
m3)
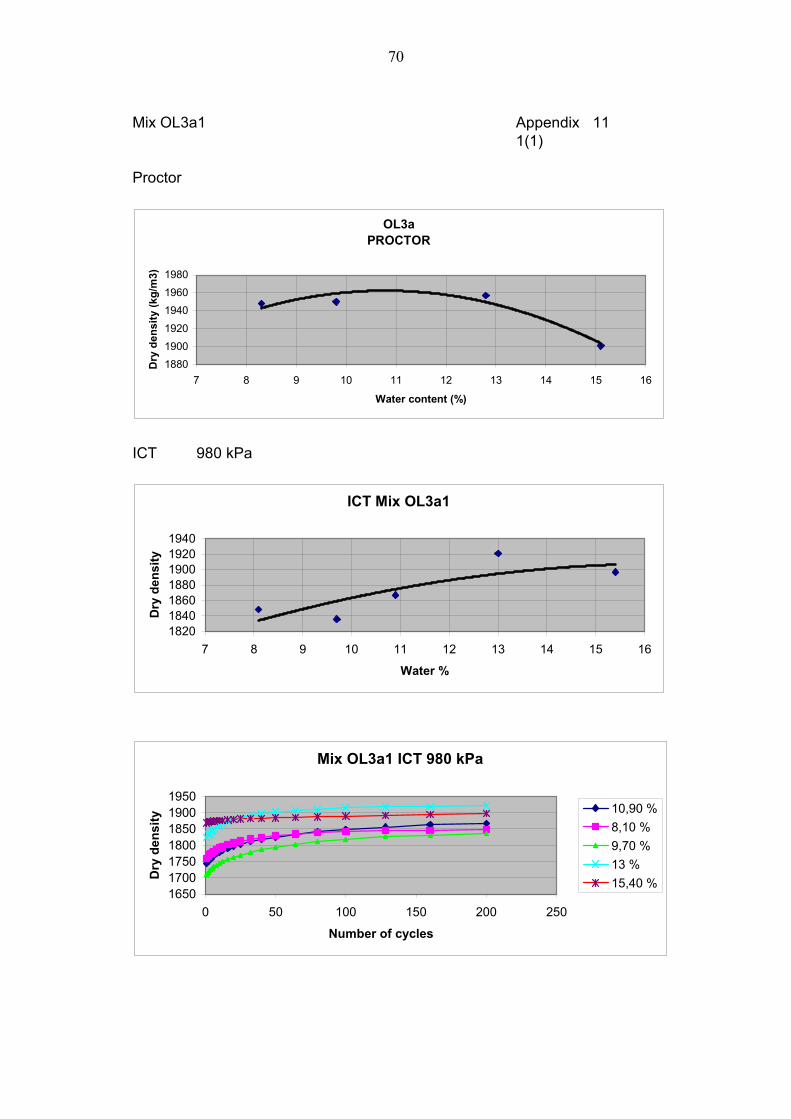
70
Mix OL3a1 Appendix 111(1)
Proctor
ICT 980 kPa
ICT Mix OL3a1
1820184018601880190019201940
7 8 9 10 11 12 13 14 15 16
Water %
Dry
den
sity
OL3a PROCTOR
18801900
1920
19401960
1980
7 8 9 10 11 12 13 14 15 16
Water content (%)
Dry
den
sity
(kg/
m3)
Mix OL3a1 ICT 980 kPa
1650170017501800185019001950
0 50 100 150 200 250
Number of cycles
Dry
den
sity
10,90 %8,10 %9,70 %13 %15,40 %
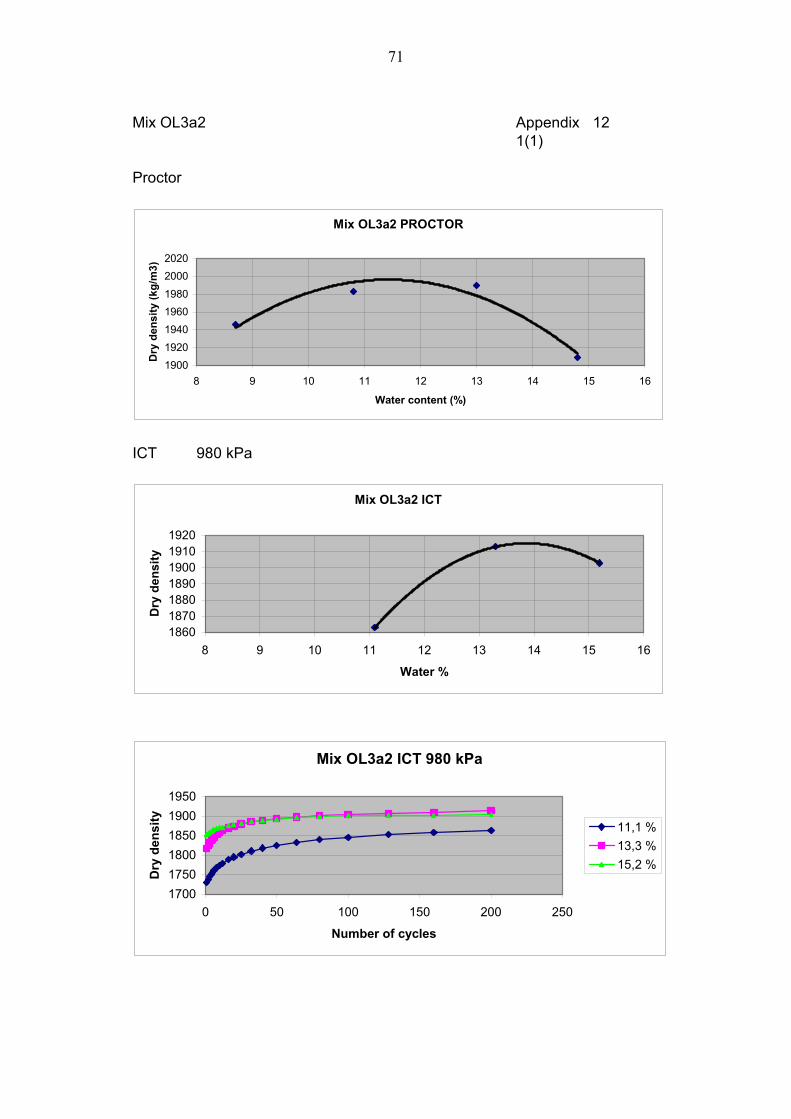
71
Mix OL3a2 Appendix 121(1)
Proctor
ICT 980 kPa
Mix OL3a2 ICT
1860187018801890190019101920
8 9 10 11 12 13 14 15 16
Water %
Dry
den
sity
Mix OL3a2 PROCTOR
19001920194019601980
20002020
8 9 10 11 12 13 14 15 16
Water content (%)
Dry
den
sity
(kg/
m3)
Mix OL3a2 ICT 980 kPa
170017501800185019001950
0 50 100 150 200 250
Number of cycles
Dry
den
sity
11,1 %13,3 %15,2 %
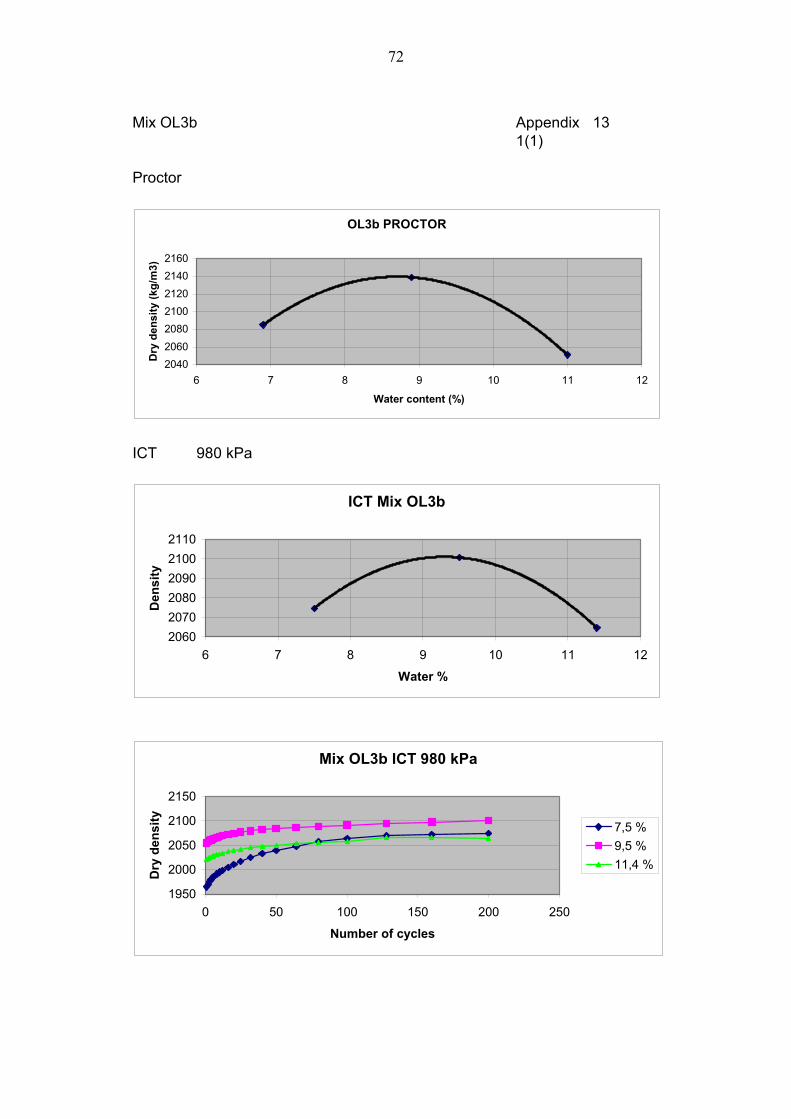
72
Mix OL3b Appendix 131(1)
Proctor
ICT 980 kPa
ICT Mix OL3b
206020702080209021002110
6 7 8 9 10 11 12
Water %
Den
sity
OL3b PROCTOR
2040206020802100212021402160
6 7 8 9 10 11 12
Water content (%)
Dry
den
sity
(kg/
m3)
Mix OL3b ICT 980 kPa
1950
2000
2050
2100
2150
0 50 100 150 200 250
Number of cycles
Dry
den
sity
7,5 %9,5 %11,4 %
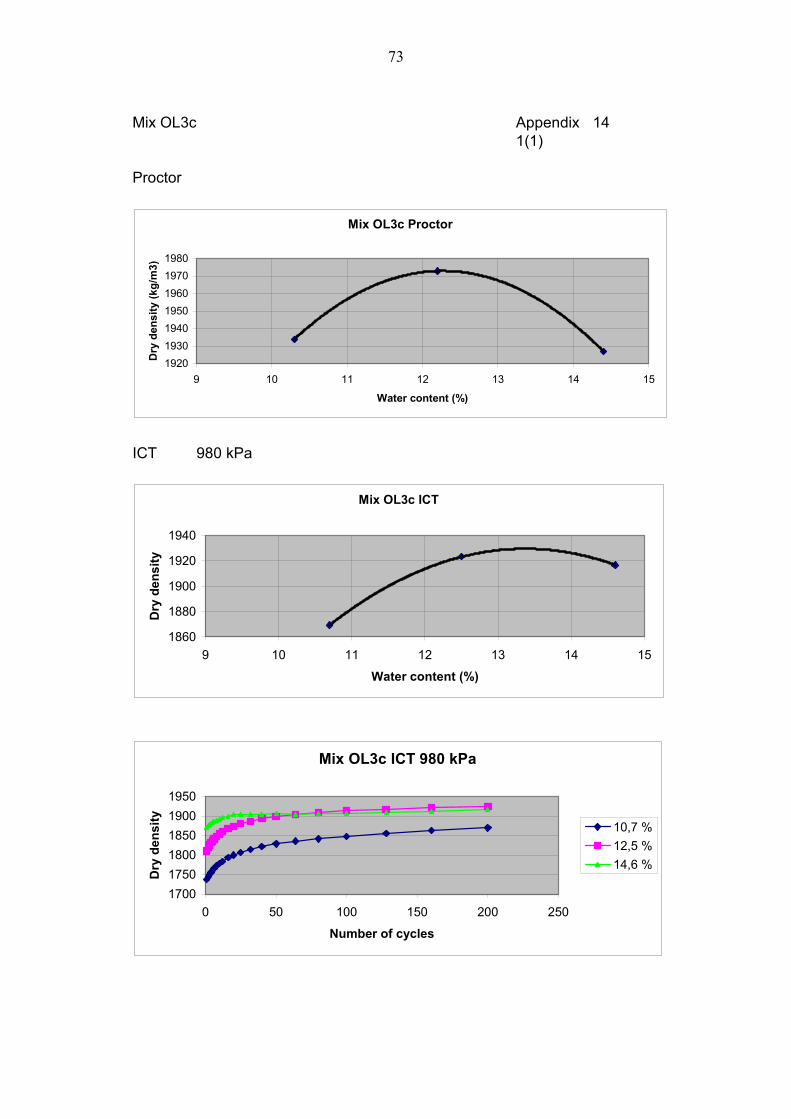
73
Mix OL3c Appendix 141(1)
Proctor
ICT 980 kPa
Mix OL3c ICT
1860
1880
1900
1920
1940
9 10 11 12 13 14 15
Water content (%)
Dry
den
sity
Mix OL3c Proctor
1920193019401950196019701980
9 10 11 12 13 14 15
Water content (%)
Dry
den
sity
(kg/
m3)
Mix OL3c ICT 980 kPa
170017501800185019001950
0 50 100 150 200 250
Number of cycles
Dry
den
sity
10,7 %12,5 %14,6 %
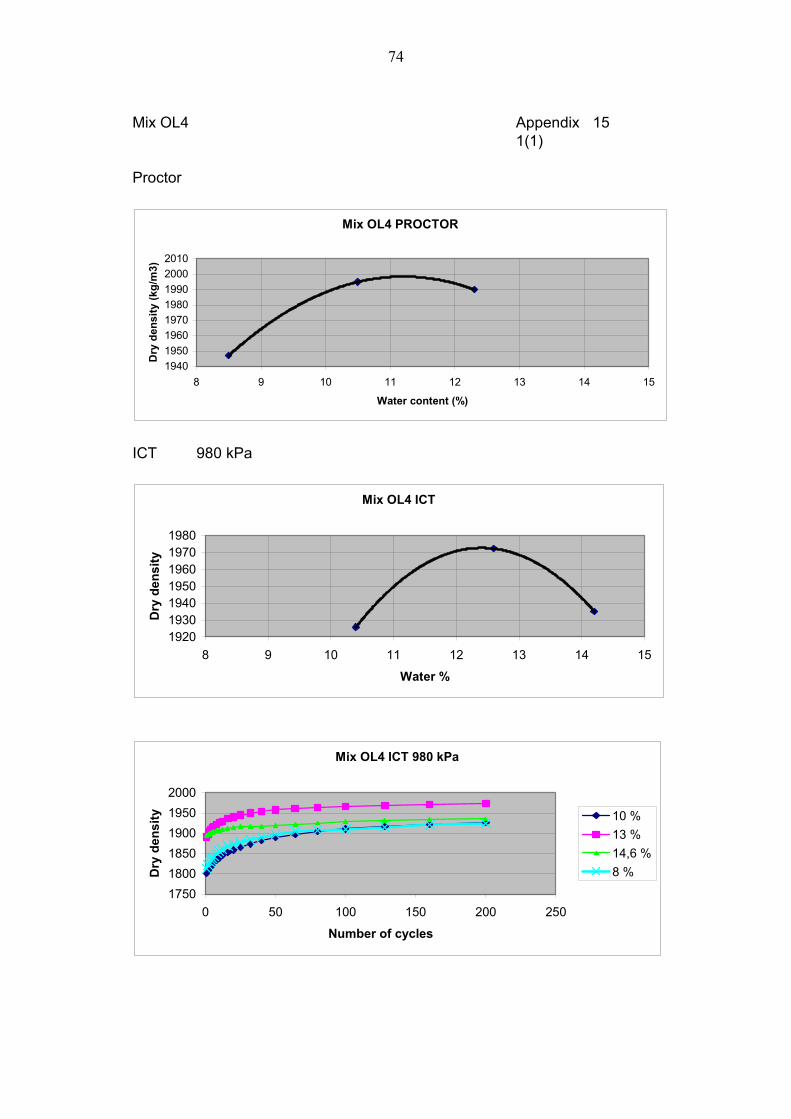
74
Mix OL4 Appendix 151(1)
Proctor
ICT 980 kPa
Mix OL4 ICT
1920193019401950196019701980
8 9 10 11 12 13 14 15
Water %
Dry
den
sity
Mix OL4 PROCTOR
19401950196019701980199020002010
8 9 10 11 12 13 14 15
Water content (%)
Dry
den
sity
(kg/
m3)
Mix OL4 ICT 980 kPa
175018001850190019502000
0 50 100 150 200 250
Number of cycles
Dry
den
sity 10 %
13 %14,6 %8 %
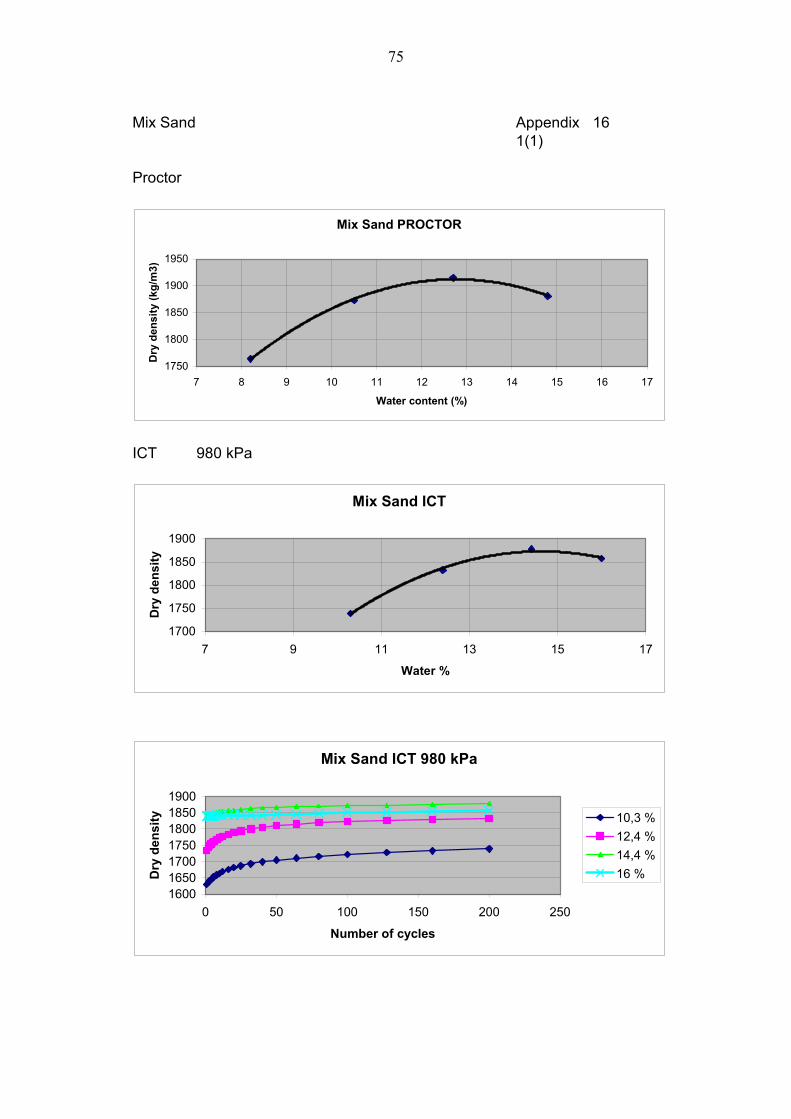
75
Mix Sand Appendix 161(1)
Proctor
ICT 980 kPa
Mix Sand ICT
1700
1750
1800
1850
1900
7 9 11 13 15 17
Water %
Dry
den
sity
Mix Sand PROCTOR
1750
1800
1850
1900
1950
7 8 9 10 11 12 13 14 15 16 17
Water content (%)
Dry
den
sity
(kg/
m3)
Mix Sand ICT 980 kPa
1600165017001750180018501900
0 50 100 150 200 250
Number of cycles
Dry
den
sity 10,3 %
12,4 %14,4 %16 %
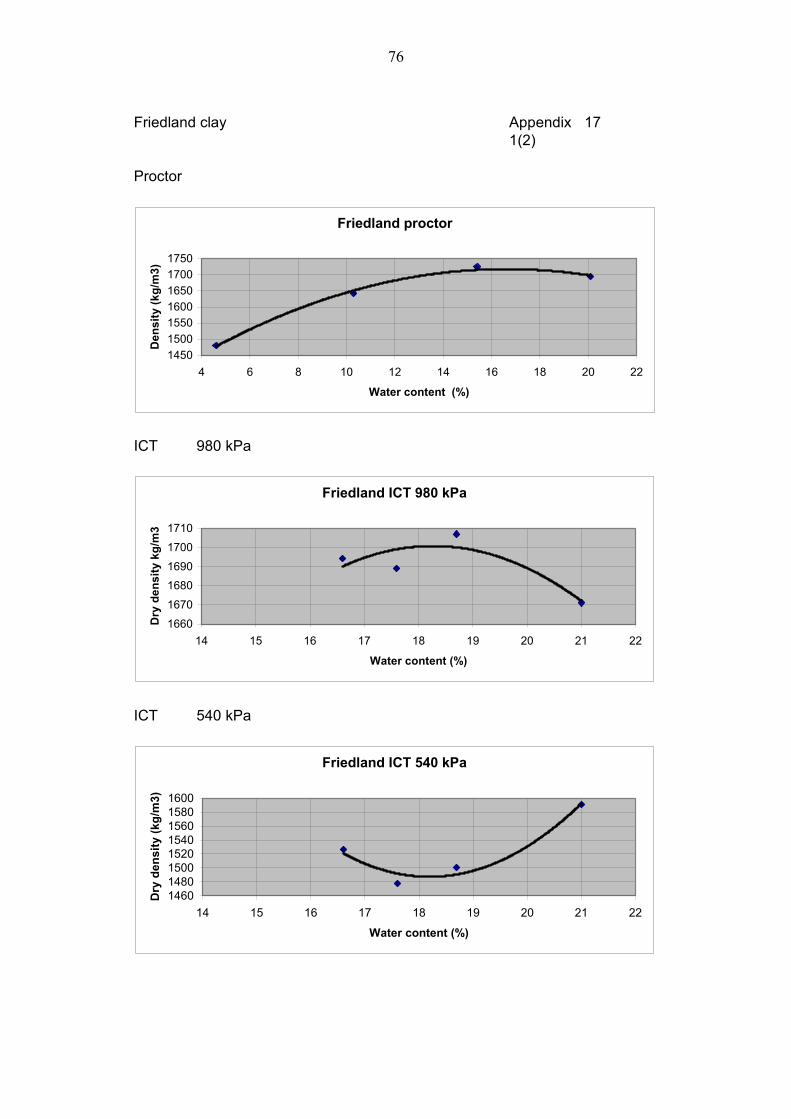
76
Friedland clay Appendix 171(2)
Proctor
ICT 980 kPa
ICT 540 kPa
Friedland proctor
1450150015501600165017001750
4 6 8 10 12 14 16 18 20 22
Water content (%)
Den
sity
(kg/
m3)
Friedland ICT 980 kPa
1660
1670
16801690
1700
1710
14 15 16 17 18 19 20 21 22
Water content (%)
Dry
den
sity
kg/
m3
Friedland ICT 540 kPa
14601480150015201540156015801600
14 15 16 17 18 19 20 21 22
Water content (%)
Dry
den
sity
(kg/
m3)
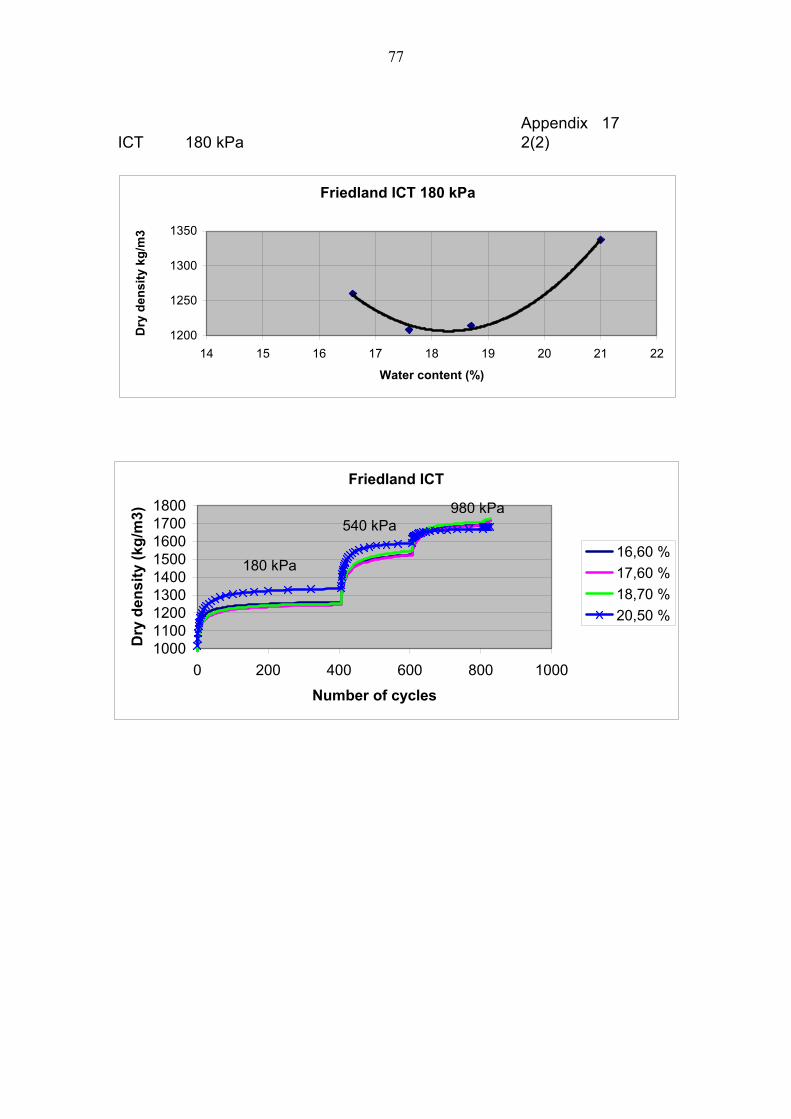
77
Appendix 17ICT 180 kPa 2(2)
Friedland ICT 180 kPa
1200
1250
1300
1350
14 15 16 17 18 19 20 21 22
Water content (%)
Dry
den
sity
kg/
m3
Friedland ICT
100011001200130014001500160017001800
0 200 400 600 800 1000
Number of cycles
Dry
den
sity
(kg/
m3)
16,60 %17,60 %18,70 %20,50 %
180 kPa
540 kPa980 kPa