Embed Size (px)
Citation preview
Effect of Case Carburizing on Mechanical Properties And Fatigue Endurance Limits of P/M Steels
George Fillari*, Thomas Murphy*, Igor Gabrielov**
*Hoeganaes CorporationCinnaminson, NJ 08077
**Borg Warner Automotive Livonia, MI 48150
ABSTRACT
Case carburizing has long been a basic technique for the improvement of the wear and fatigue resistance and of PM steel components. The key to the successful improvement in carburizing, however, is understanding, and interpreting the microstructure of the carburized case. The main area for growth in the PM industry is in the high performance gearing applications. The success of penetrating this area depends upon the ability to understand the key components that effect the fatigue endurance limits of PM materials. This paper will examine and illustrate how tensile properties and the fatigue endurance limits of a P/M hybrid alloy are affected by alloying additions and carburizing.
INTRODUCTION
Carburizing is the addition of carbon to the surface of low-carbon steels at temperatures generally between 850 °C and 950 °C (1560 °F and 1740 °F), at which austenite, with its high solubility for carbon, is the stable crystal structure. Hardening is accomplished when the high-carbon surface layer is quenched to form martensite so that a high-carbon martensitic case with good wear and fatigue resistance is superimposed on a tough, low-carbon steel core. [1]
Case depth of carburized steel is a function of carburizing time and the available carbon potential at the surface. [2] When prolonged carburizing times are used for deep case depths, a high carbon potential produces a high surface-carbon content, which may thus result in excessive retained austenite or free carbides. These two microstructural elements both have adverse effects on the distribution of residual stress in the casehardened part. Consequently, a high carbon potential may be suitable for short carburizing times but not for prolonged carburizing.
In regards to fatigue properties, Low retained austenite content and fine austenitic grain sizes, which create a microstructure of finely dispersed retained austenite and tempered martensite, prevent nucleation of fatigue cracks, or retard fatigue crack initiation until very high stress levels are reached. In contrast, low-stress applications that fracture at low cycles is related to high retained austenite levels and coarse austenite grain sizes. [1]
TEST PROGRAM The test program was intended to investigate the performance levels achievable on tensile properties and rotating bend fatigue response of a hybrid PM steel by using a secondary heat-treatments such as case carburizing. This program was divided into three parts. 1. Investigate alloying elements such as graphite and nickel on mechanical properties. 2. To investigate the effect of carburizing times on properties. 3. To estimate the percentage of retained austenite in the carburized case. EXPERIMENTAL PROCEDURE The compositions of the test materials that were evaluated in this study are listed in Table I. The base powder was water atomized and pre-alloyed with 0.85 w/o molybdenum. The 85HP was premixed with nickel and graphite. The nickel used was INCO 123 and the graphite was Asbury 3203H. Each premix contained 0.75 w/o Lonza Acrawax C as the lubricant system.
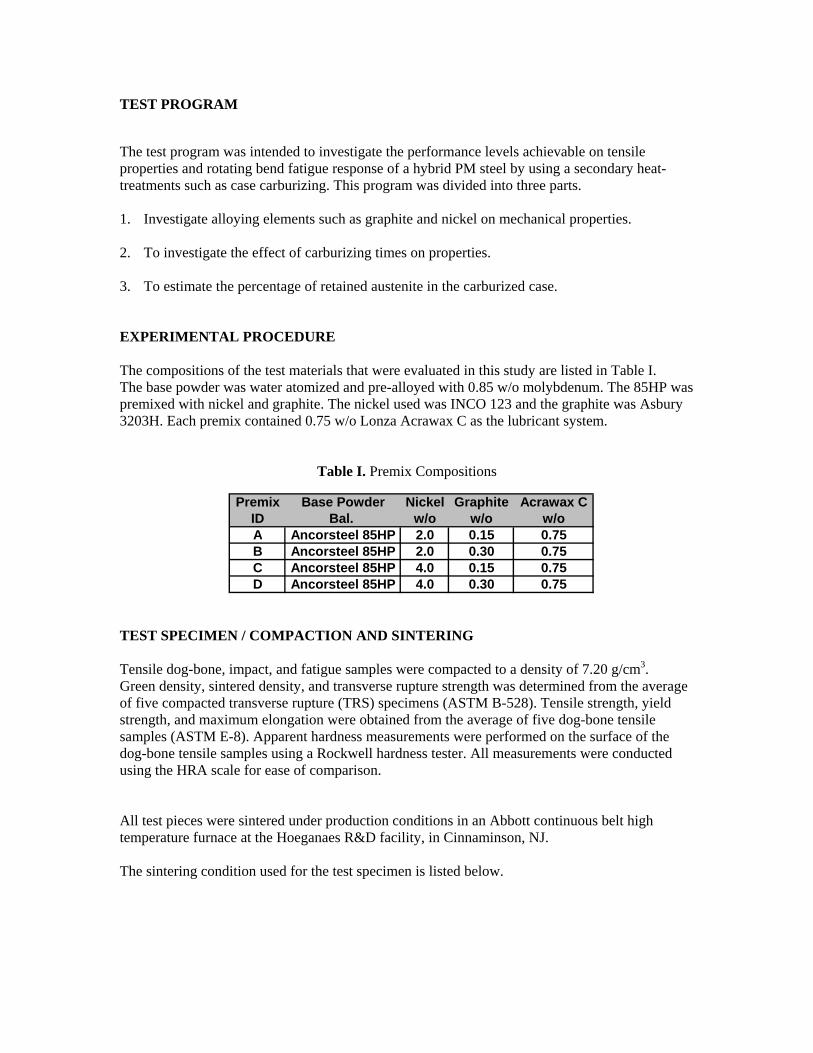
Table I. Premix Compositions
Premix Base Powder Nickel Graphite Acrawax CID Bal. w/o w/o w/oA Ancorsteel 85HP 2.0 0.15 0.75B Ancorsteel 85HP 2.0 0.30 0.75C Ancorsteel 85HP 4.0 0.15 0.75D Ancorsteel 85HP 4.0 0.30 0.75
TEST SPECIMEN / COMPACTION AND SINTERING Tensile dog-bone, impact, and fatigue samples were compacted to a density of 7.20 g/cm3. Green density, sintered density, and transverse rupture strength was determined from the average of five compacted transverse rupture (TRS) specimens (ASTM B-528). Tensile strength, yield strength, and maximum elongation were obtained from the average of five dog-bone tensile samples (ASTM E-8). Apparent hardness measurements were performed on the surface of the dog-bone tensile samples using a Rockwell hardness tester. All measurements were conducted using the HRA scale for ease of comparison. All test pieces were sintered under production conditions in an Abbott continuous belt high temperature furnace at the Hoeganaes R&D facility, in Cinnaminson, NJ. The sintering condition used for the test specimen is listed below.
SINTERING CYCLE Sintering Temperature: 1150 °C (2100 °F) (1260 °C (2300 °F) for premix 3) Atmosphere: 90 v/o N2 - 10 v/o H2Time in Hot Zone: 20 minutes For the samples that were carburized, the parameters are listed below. CARBURIZING CYCLE 1 Temperature: 925 °C (1700 °F) vacuum furnace Time at Temperature 180 minutes, Quench: Pressure / Nitrogen CARBURIZING CYCLE 2 Temperature: 925 °C (1700 °F) Time at Temperature 240 minutes, Quench: Pressure / Nitrogen All samples were tempered at 204 °C (400 °F) in air for 1hr. prior to testing. Tensile testing were performed on a 267,000 N (60,000 lb.) Tinius Olsen universal testing machine with a cross-head speed of 0.635 mm/min (0.025 in/min). Elongation values were determined by utilizing an extensometer with a range of 0 - 20%. The extensometer was attached to the samples up to failure. Rotating bending fatigue samples were pressed to a density of 7.20 g/cm3, and machined from blanks that were sintered at 1150 °C (2100 °F) under an atmosphere of 90 v/o N2 -10 v/o H2. The heat treated fatigue samples were rough machined following sintering then heat treated, finished ground, and polished to size. The dimensions of the specimen used for this analysis, along with allowable dimensional tolerances, are shown in Figure 1. Fatigue testing was performed on six randomly selected Fatigue Dynamics RBF-200 machines at a rotational speed of 8000 rpm. These rotating bending machines are of the mechanical and non-resonant type and are an efficient means of inducing fatigue in a specimen of round cross section. [3]. A staircase method was used utilizing 30 samples and a run-out limit of 107 cycles. The staircase method of testing was regulated so that there were both failures and run-outs at a minimum of two stress levels. [4] The percentage of failures for each stress level was calculated and plotted on a log-normal graph. From these plots, the fatigue endurance limit (FEL) at 50% and 90% was determined by linear extrapolation. The 50% FEL represents the stress level where 50% of the specimens will break and 50% will run-out. The 90% FEL represents the stress level where 90% of the specimens will run-out and 10% will break.
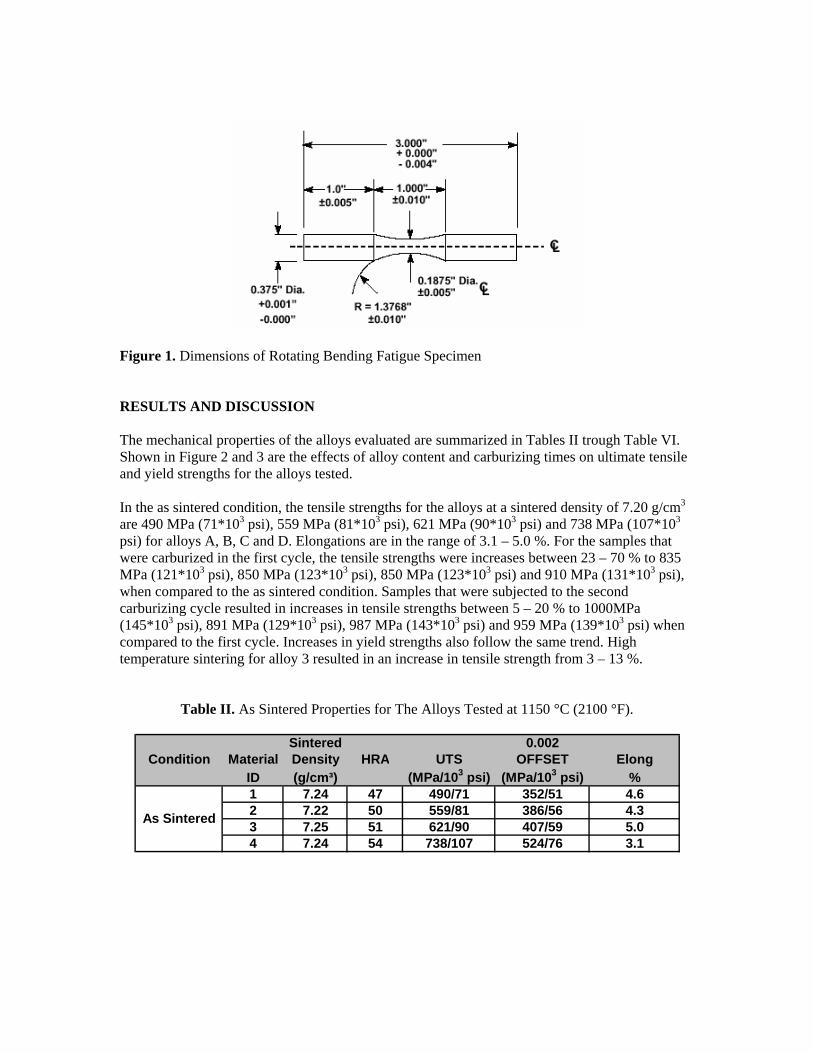
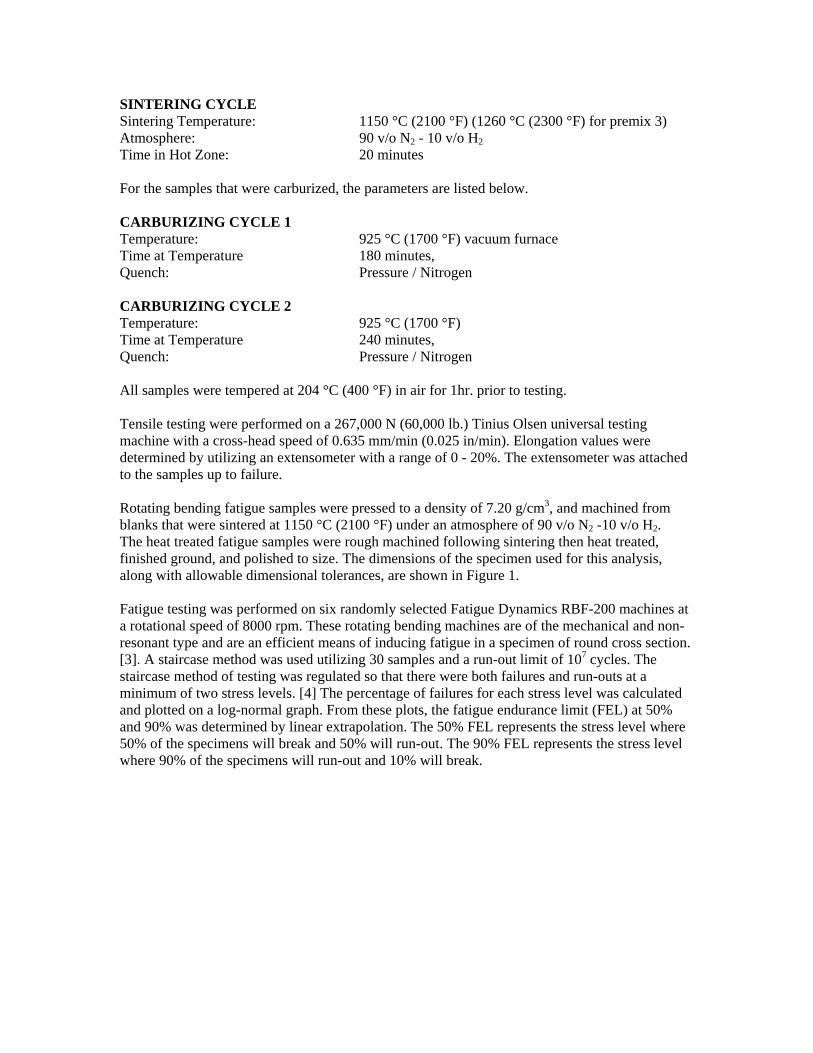
Figure 1. Dimensions of Rotating Bending Fatigue Specimen RESULTS AND DISCUSSION The mechanical properties of the alloys evaluated are summarized in Tables II trough Table VI. Shown in Figure 2 and 3 are the effects of alloy content and carburizing times on ultimate tensile and yield strengths for the alloys tested. In the as sintered condition, the tensile strengths for the alloys at a sintered density of 7.20 g/cm3 are 490 MPa (71*103 psi), 559 MPa (81*103 psi), 621 MPa (90*103 psi) and 738 MPa (107*103 psi) for alloys A, B, C and D. Elongations are in the range of 3.1 – 5.0 %. For the samples that were carburized in the first cycle, the tensile strengths were increases between 23 – 70 % to 835 MPa (121*103 psi), 850 MPa (123*103 psi), 850 MPa (123*103 psi) and 910 MPa (131*103 psi), when compared to the as sintered condition. Samples that were subjected to the second carburizing cycle resulted in increases in tensile strengths between 5 – 20 % to 1000MPa (145*103 psi), 891 MPa (129*103 psi), 987 MPa (143*103 psi) and 959 MPa (139*103 psi) when compared to the first cycle. Increases in yield strengths also follow the same trend. High temperature sintering for alloy 3 resulted in an increase in tensile strength from 3 – 13 %.
Table II. As Sintered Properties for The Alloys Tested at 1150 °C (2100 °F).
Sintered 0.002Condition Material Density HRA UTS OFFSET Elong
ID (g/cm³) (MPa/103 psi) (MPa/103 psi) %1 7.24 47 490/71 352/51 4.62 7.22 50 559/81 386/56 4.33 7.25 51 621/90 407/59 5.04 7.24 54 738/107 524/76 3.1
As Sintered
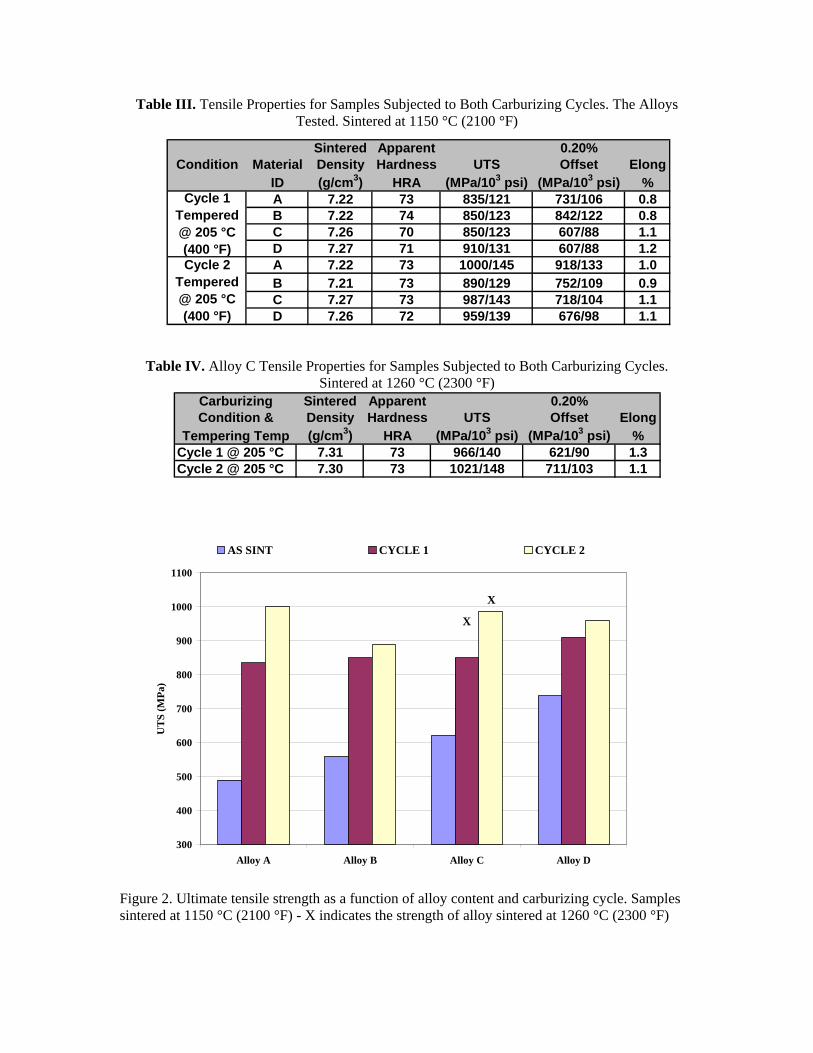
Table III. Tensile Properties for Samples Subjected to Both Carburizing Cycles. The Alloys Tested. Sintered at 1150 °C (2100 °F)
Sintered Apparent 0.20%Condition Material Density Hardness UTS Offset Elong
ID (g/cm3) HRA (MPa/103 psi) (MPa/103 psi) %A 7.22 73 835/121 731/106 0.8B 7.22 74 850/123 842/122 0.8C 7.26 70 850/123 607/88 1.1D 7.27 71 910/131 607/88 1.2A 7.22 73 1000/145 918/133 1.0B 7.21 73 890/129 752/109 0.9C 7.27 73 987/143 718/104 1.1D 7.26 72 959/139 676/98 1.1
Cycle 1 Tempered @ 205 °C (400 °F) Cycle 2
Tempered @ 205 °C (400 °F)
Table IV. Alloy C Tensile Properties for Samples Subjected to Both Carburizing Cycles. Sintered at 1260 °C (2300 °F)
Carburizing Sintered Apparent 0.20%Condition & Density Hardness UTS Offset Elong
Tempering Temp (g/cm3) HRA (MPa/103 psi) (MPa/103 psi) %Cycle 1 @ 205 °C 7.31 73 966/140 621/90 1.3Cycle 2 @ 205 °C 7.30 73 1021/148 711/103 1.1
300
400
500
600
700
800
900
1000
1100
Alloy A Alloy B Alloy C Alloy D
UT
S (M
Pa)
AS SINT CYCLE 1 CYCLE 2
X
X
Figure 2. Ultimate tensile strength as a function of alloy content and carburizing cycle. Samples sintered at 1150 °C (2100 °F) - X indicates the strength of alloy sintered at 1260 °C (2300 °F)
200
300
400
500
600
700
800
900
1000
Alloy A Alloy B Alloy C Alloy D
Yie
ld S
tren
gth
(MPa
)
AS SINT CYCLE 1 CYCLE 2
X
X
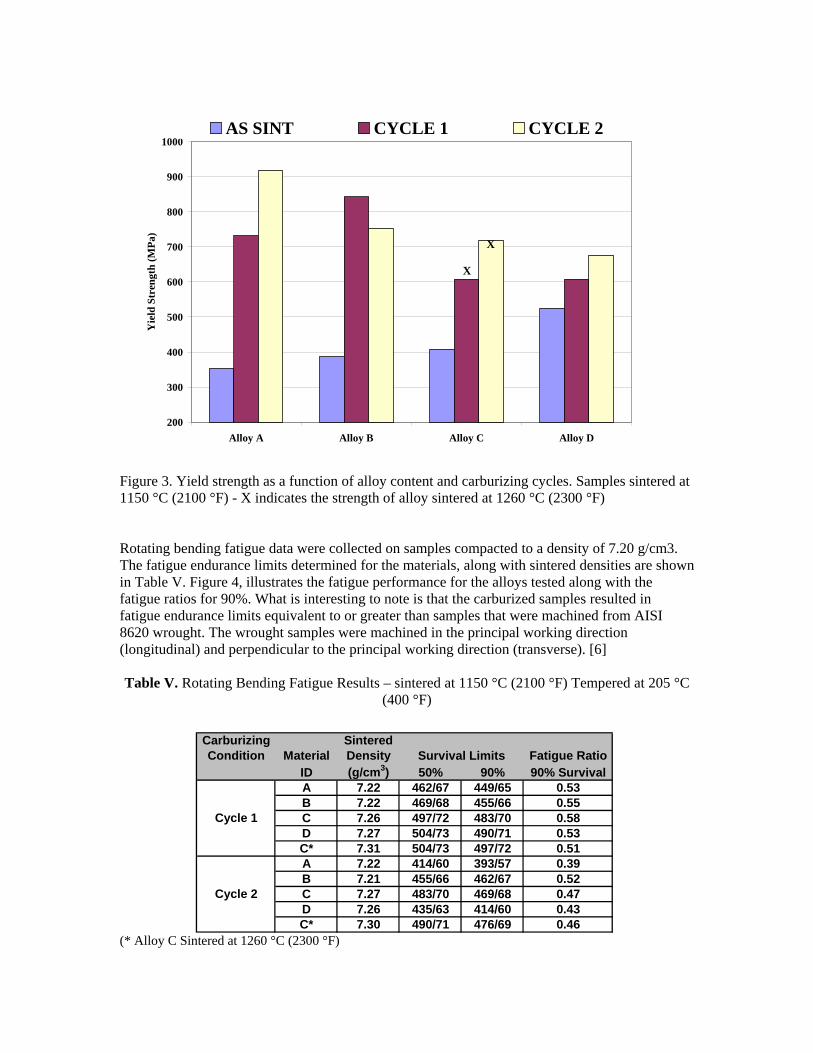
Figure 3. Yield strength as a function of alloy content and carburizing cycles. Samples sintered at 1150 °C (2100 °F) - X indicates the strength of alloy sintered at 1260 °C (2300 °F)
Rotating bending fatigue data were collected on samples compacted to a density of 7.20 g/cm3. The fatigue endurance limits determined for the materials, along with sintered densities are shown in Table V. Figure 4, illustrates the fatigue performance for the alloys tested along with the fatigue ratios for 90%. What is interesting to note is that the carburized samples resulted in fatigue endurance limits equivalent to or greater than samples that were machined from AISI 8620 wrought. The wrought samples were machined in the principal working direction (longitudinal) and perpendicular to the principal working direction (transverse). [6]
Table V. Rotating Bending Fatigue Results – sintered at 1150 °C (2100 °F) Tempered at 205 °C
(400 °F)
Carburizing SinteredCondition Material Density Fatigue Ratio
ID (g/cm3) 50% 90% 90% SurvivalA 7.22 462/67 449/65 0.53B 7.22 469/68 455/66 0.55C 7.26 497/72 483/70 0.58D 7.27 504/73 490/71 0.53C* 7.31 504/73 497/72 0.51A 7.22 414/60 393/57 0.39B 7.21 455/66 462/67 0.52C 7.27 483/70 469/68 0.47D 7.26 435/63 414/60 0.43C* 7.30 490/71 476/69 0.46
Survival Limits
Cycle 1
Cycle 2
(* Alloy C Sintered at 1260 °C (2300 °F)
300
350
400
450
500
550
600
800 900 1000 1100 1200 1300 1400
Tensile Strength (MPa)
Fatig
ue E
ndur
ance
Lim
it (M
Pa)
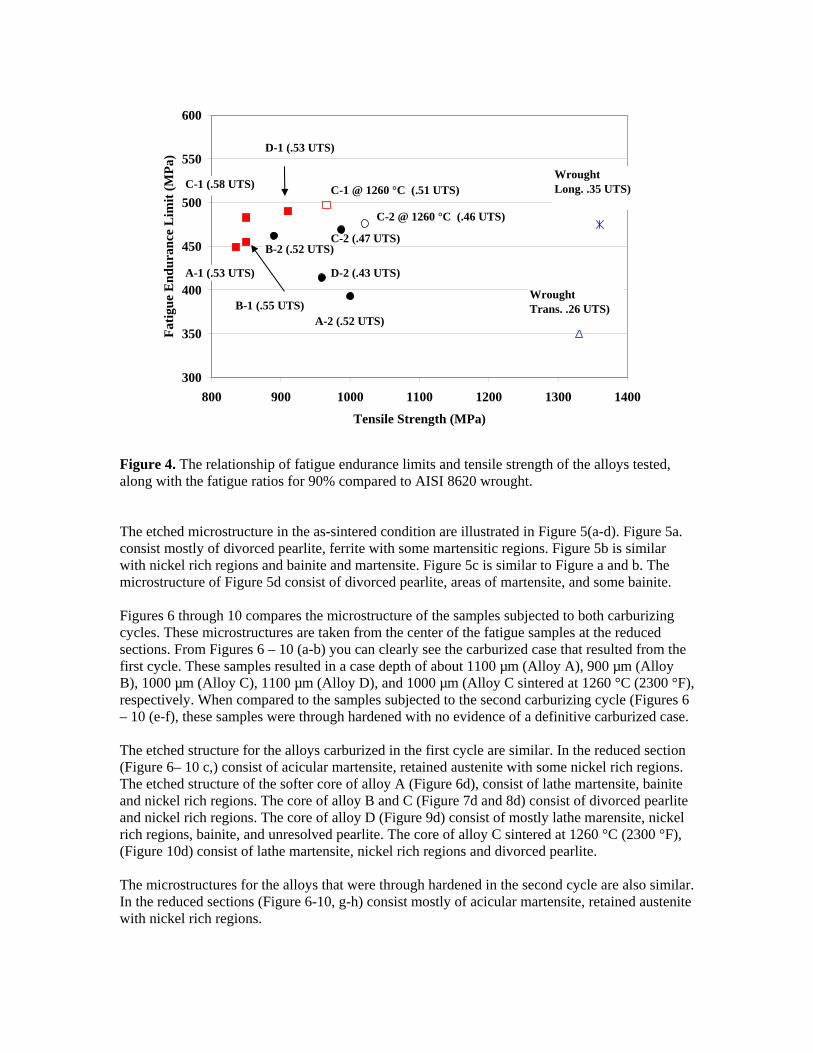
A-1 (.53 UTS)
B-1 (.55 UTS)
C-1 (.58 UTS)
D-1 (.53 UTS)
B-2 (.52 UTS)
C-1 @ 1260 °C (.51 UTS)
C-2 (.47 UTS)
C-2 @ 1260 °C (.46 UTS)
D-2 (.43 UTS)
A-2 (.52 UTS)
WroughtLong. .35 UTS)
WroughtTrans. .26 UTS)
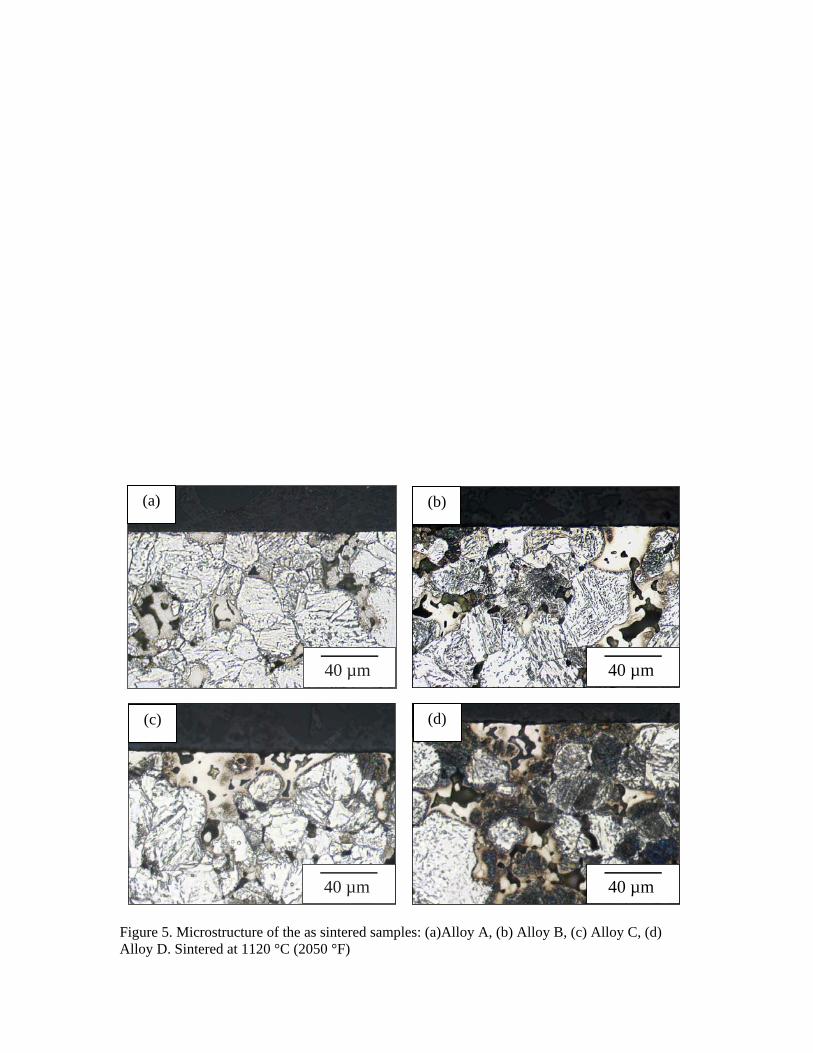
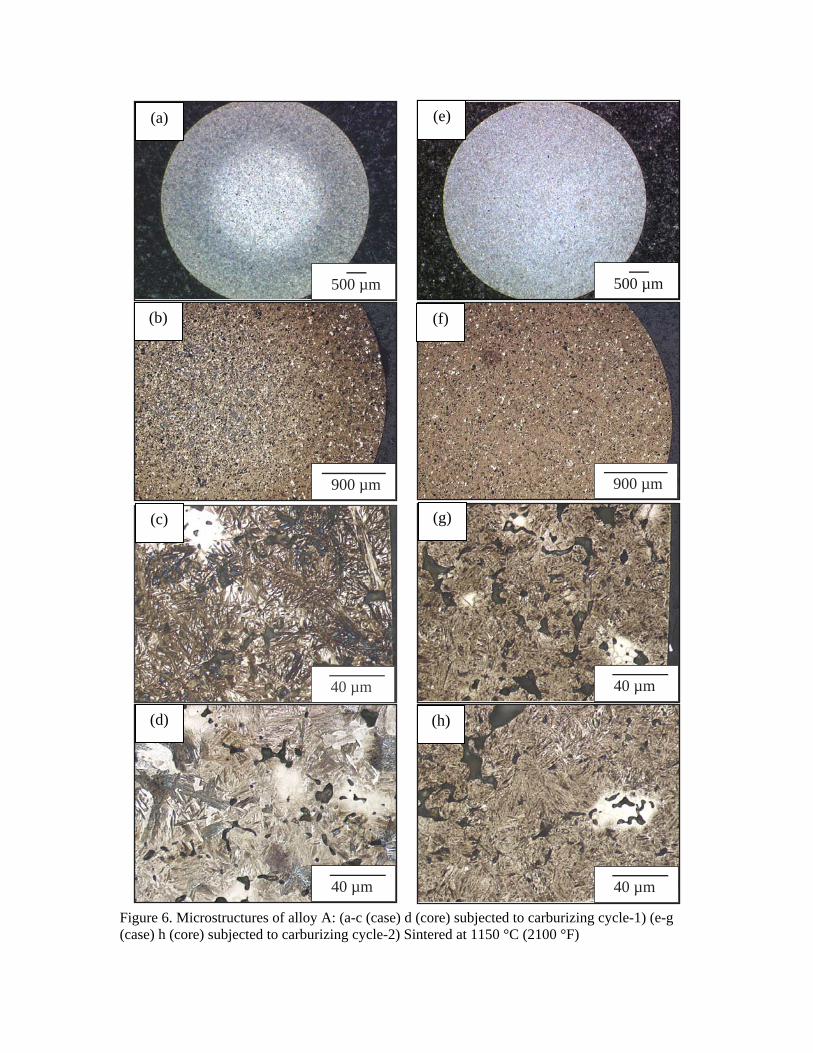
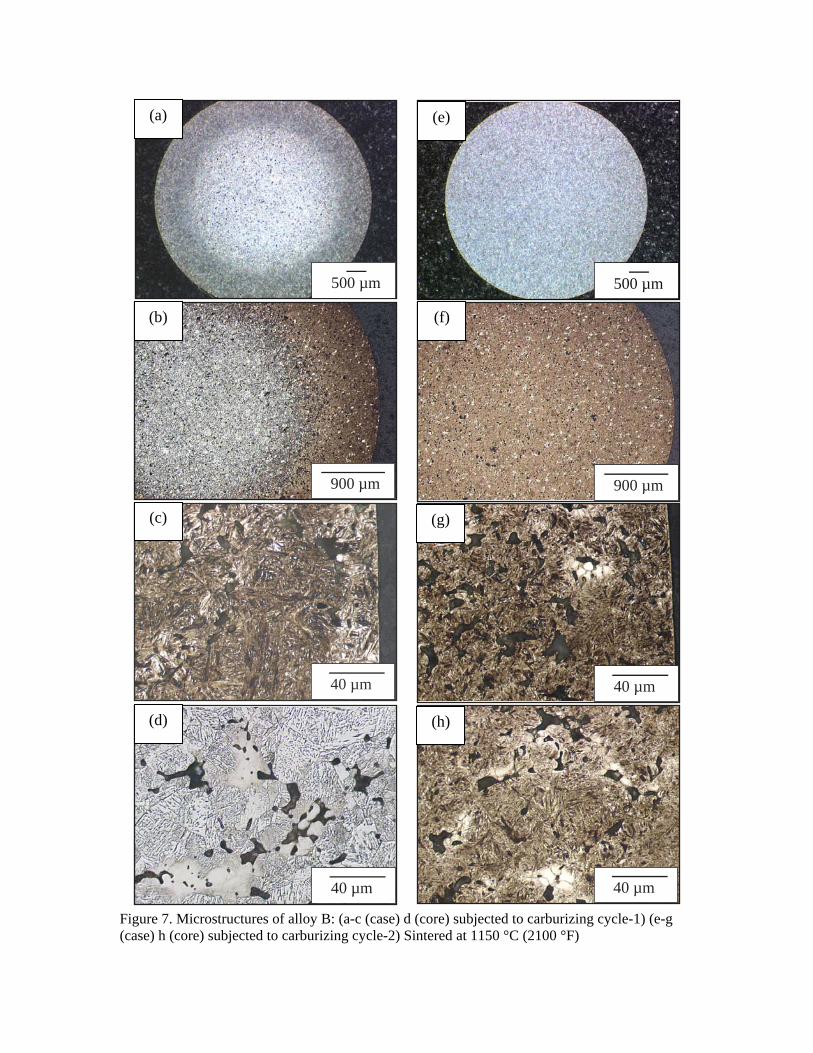
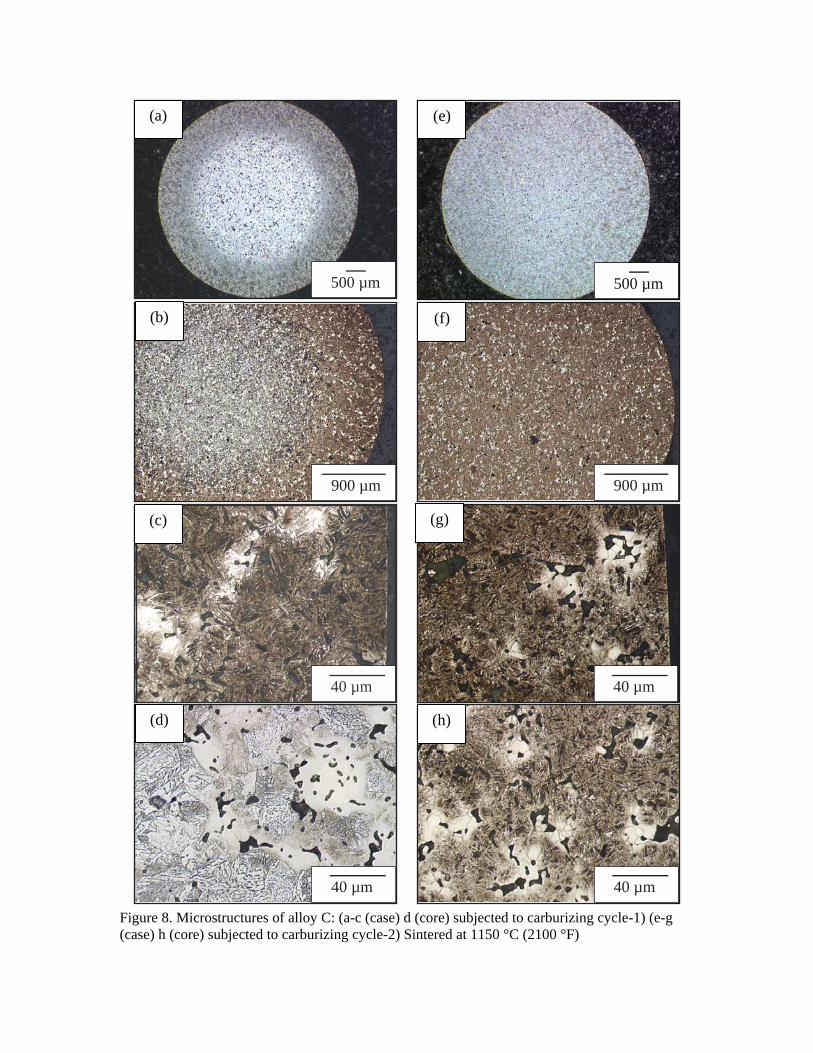
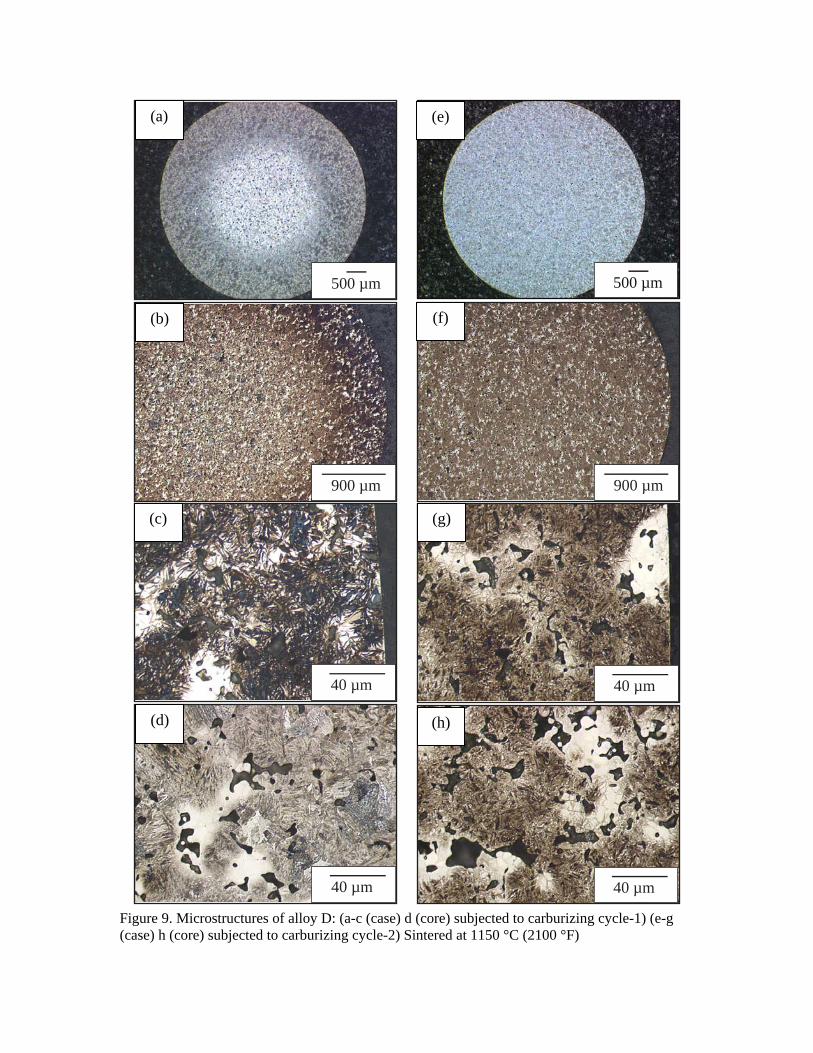
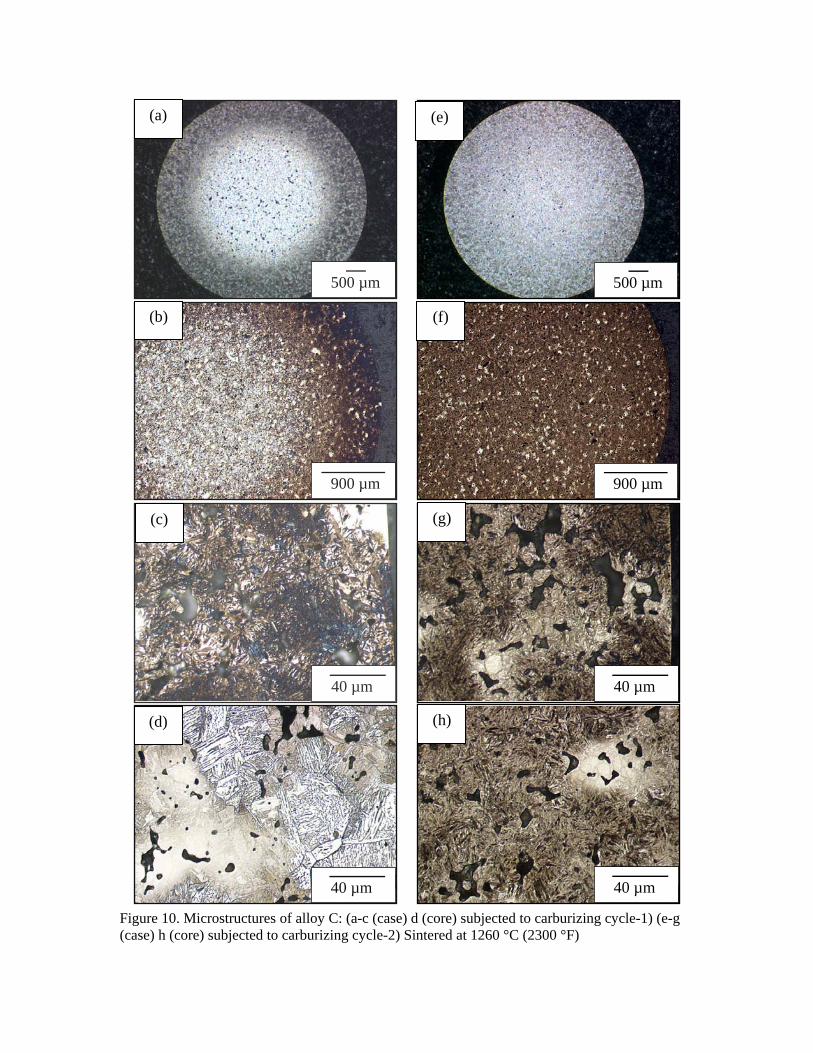
Figure 4. The relationship of fatigue endurance limits and tensile strength of the alloys tested, along with the fatigue ratios for 90% compared to AISI 8620 wrought. The etched microstructure in the as-sintered condition are illustrated in Figure 5(a-d). Figure 5a. consist mostly of divorced pearlite, ferrite with some martensitic regions. Figure 5b is similar with nickel rich regions and bainite and martensite. Figure 5c is similar to Figure a and b. The microstructure of Figure 5d consist of divorced pearlite, areas of martensite, and some bainite. Figures 6 through 10 compares the microstructure of the samples subjected to both carburizing cycles. These microstructures are taken from the center of the fatigue samples at the reduced sections. From Figures 6 – 10 (a-b) you can clearly see the carburized case that resulted from the first cycle. These samples resulted in a case depth of about 1100 µm (Alloy A), 900 µm (Alloy B), 1000 µm (Alloy C), 1100 µm (Alloy D), and 1000 µm (Alloy C sintered at 1260 °C (2300 °F), respectively. When compared to the samples subjected to the second carburizing cycle (Figures 6 – 10 (e-f), these samples were through hardened with no evidence of a definitive carburized case. The etched structure for the alloys carburized in the first cycle are similar. In the reduced section (Figure 6– 10 c,) consist of acicular martensite, retained austenite with some nickel rich regions. The etched structure of the softer core of alloy A (Figure 6d), consist of lathe martensite, bainite and nickel rich regions. The core of alloy B and C (Figure 7d and 8d) consist of divorced pearlite and nickel rich regions. The core of alloy D (Figure 9d) consist of mostly lathe marensite, nickel rich regions, bainite, and unresolved pearlite. The core of alloy C sintered at 1260 °C (2300 °F), (Figure 10d) consist of lathe martensite, nickel rich regions and divorced pearlite. The microstructures for the alloys that were through hardened in the second cycle are also similar. In the reduced sections (Figure 6-10, g-h) consist mostly of acicular martensite, retained austenite with nickel rich regions.
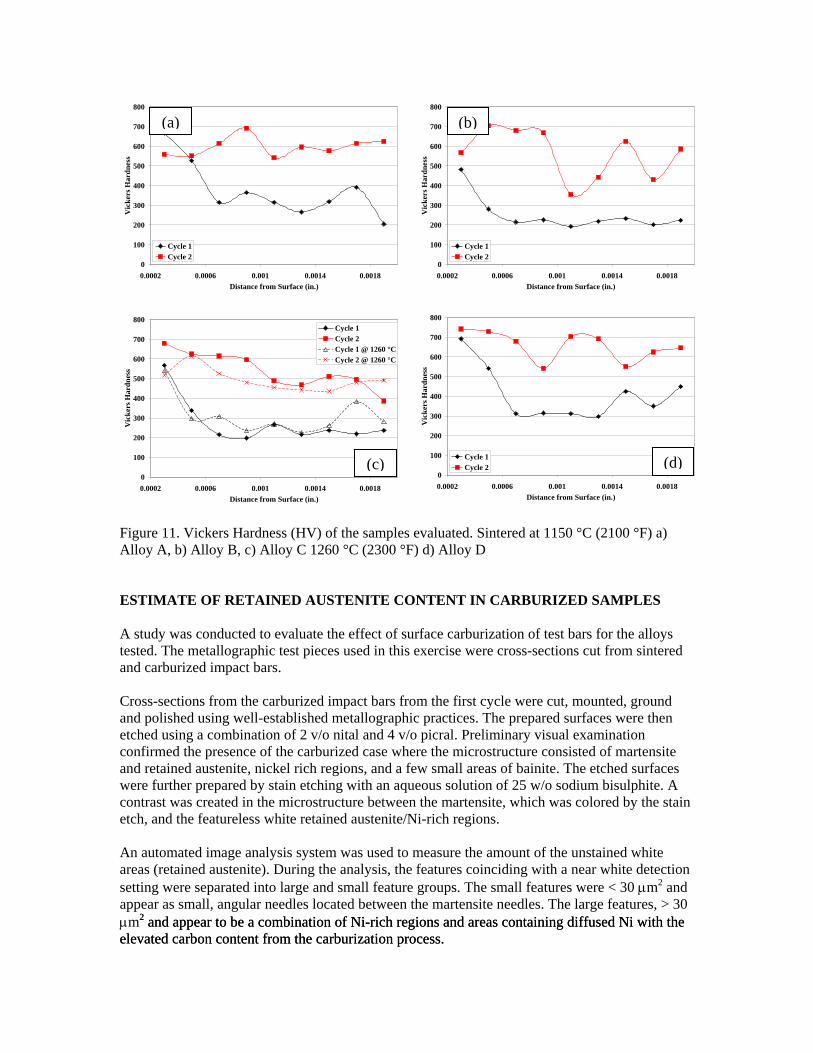
Figure 11 illustrates the Vickers Hardness HV of the alloys tested. Hardness readings were taken from the surface of the case to the core in increments of 0.0002 in. As a result of the through hardening, the samples subjected to the second cycle resulted in a higher hardness (HV) though out the sample. The samples from the first cycle initially were harder at the surface and gradually decreased in hardness as the distance increased from the surface to the core. In terms of the effect of the nickel and graphite. In the as-sintered condition, ultimate tensile strength increased with nickel content. For the alloys that contained 0.15 w/o graphite, as the nickel content increase from 2.0 to 4.0 w/o the UTS increase more than 25 % to 621 MPa (90*103 psi). For the alloys that contained 0.30 w/o graphite, as the nickel content was increased to 4.0 w/o the UTS increased more than 30 % to 738 MPa (107*103 psi). The same trends also resulted for the yield strength. For the alloys at 0.15 w/o graphite, the yield increased more than 15 % to 407 MPa (59*103 psi). At 0.30 w/o graphite, yield strength increased more than 35 % to 524 MPa (76*103 psi). For the samples that were carburized (cycle 1) the increases were minimal. For the alloys that contained 0.15 w/o graphite, as the nickel content increase from 2.0 to 4.0 w/o the UTS increase were about 2 % to 850 MPa (123*103 psi). For the alloys that contained 0.30 w/o graphite, as the nickel content was increased to 4.0 w/o the UTS increased about 5 % to 910 MPa (131*103 psi). The yield strength on the other hand decreased as the nickel content was increased to 4.0 w/o. For the alloys at 0.15 w/o graphite, the yield strength decreased more than 15 % to 607 MPa (88*103 psi). At the 0.30 w/o graphite contents, yield strength decreased more than 25 % to 607 MPa (88*103 psi). For the samples that were through hardened (cycle 2), at the 0.15 w/o graphite, as the nickel content increase to 4.0 w/o the UTS decreased to 987 MPa (143*103 psi), but was negligible. At 0.30 w/o graphite, as the nickel content was increased to 4.0 w/o the UTS resulted in a slight increase to 959 MPa (139*103 psi). The same trends also resulted for the yield strength as in the first cycle. For the alloys at 0.15 w/o graphite, the yield decreased more than 20 % to 718 MPa (104*103 psi). At the 0.30 w/o graphite contents, yield strength decreased 10 % to 676 MPa (98*103 psi). For the high temperature sintering of alloy C for the first carburizing cycle, the UTS increases were about 15% to 966 MPa (140*103 psi), changes in yield were negligible. For the second carburizing cycle, a slight increase in UTS to 1021 MPa (148*103 psi), changes in yield were negligible.
40 µm
(a)
40 µm
(b)
40 µm
(d)
40 µm
(c)
Figure 5. Microstructure of the as sintered samples: (a)Alloy A, (b) Alloy B, (c) Alloy C, (d) Alloy D. Sintered at 1120 °C (2050 °F)
500 µm
(e)
500 µm
(a)
900 µm
(b)
900 µm
(f)
40 µm
(g)
40 µm
(c)
40 µm
(d)
40 µm
(h)
Figure 6. Microstructures of alloy A: (a-c (case) d (core) subjected to carburizing cycle-1) (e-g (case) h (core) subjected to carburizing cycle-2) Sintered at 1150 °C (2100 °F)
500 µm
(a)
900 µm
500 µm
(f)
(e)
900 µm
(b)
40 µm
(c)
40 µm
(g)
40 µm
(d)
40 µm
(h)
Figure 7. Microstructures of alloy B: (a-c (case) d (core) subjected to carburizing cycle-1) (e-g (case) h (core) subjected to carburizing cycle-2) Sintered at 1150 °C (2100 °F)
500 µm
(a)
500 µm
(e)
900 µm
(b)
900 µm
(f)
40 µm
(g)
40 µm
(h)
40 µm
(c)
40 µm
(d)
Figure 8. Microstructures of alloy C: (a-c (case) d (core) subjected to carburizing cycle-1) (e-g (case) h (core) subjected to carburizing cycle-2) Sintered at 1150 °C (2100 °F)
500 µm
(a)
500 µm
(e)
900 µm
(f)
40 µm
(g)
900 µm
(b)
40 µm
(c)
40 µm
(d)
40 µm
(h)
Figure 9. Microstructures of alloy D: (a-c (case) d (core) subjected to carburizing cycle-1) (e-g (case) h (core) subjected to carburizing cycle-2) Sintered at 1150 °C (2100 °F)
500 µm
(a)
500 µm
(e)
900 µm
(b)
900 µm
(f)
40 µm
(g)
40 µm
(h)
40 µm
(c)
40 µm
(d)
Figure 10. Microstructures of alloy C: (a-c (case) d (core) subjected to carburizing cycle-1) (e-g (case) h (core) subjected to carburizing cycle-2) Sintered at 1260 °C (2300 °F)
0
100
200
300
400
500
600
700
800
0.0002 0.0006 0.001 0.0014 0.0018Distance from Surface (in.)
Vic
kers
Har
dnes
s
Cycle 1Cycle 2
(a)
0
100
200
300
400
500
600
700
800
0.0002 0.0006 0.001 0.0014 0.0018Distance from Surface (in.)
Vic
kers
Har
dnes
s
Cycle 1Cycle 2
(b)
0
100
200
300
400
500
600
700
800
0.0002 0.0006 0.001 0.0014 0.0018Distance from Surface (in.)
Vic
kers
Har
dnes
s
Cycle 1Cycle 2 (d)
0
100
200
300
400
500
600
700
800
0.0002 0.0006 0.001 0.0014 0.0018Distance from Surface (in.)
Vic
kers
Har
dnes
s
Cycle 1Cycle 2Cycle 1 @ 1260 °CCycle 2 @ 1260 °C
(c)
Figure 11. Vickers Hardness (HV) of the samples evaluated. Sintered at 1150 °C (2100 °F) a) Alloy A, b) Alloy B, c) Alloy C 1260 °C (2300 °F) d) Alloy D ESTIMATE OF RETAINED AUSTENITE CONTENT IN CARBURIZED SAMPLES A study was conducted to evaluate the effect of surface carburization of test bars for the alloys tested. The metallographic test pieces used in this exercise were cross-sections cut from sintered and carburized impact bars. Cross-sections from the carburized impact bars from the first cycle were cut, mounted, ground and polished using well-established metallographic practices. The prepared surfaces were then etched using a combination of 2 v/o nital and 4 v/o picral. Preliminary visual examination confirmed the presence of the carburized case where the microstructure consisted of martensite and retained austenite, nickel rich regions, and a few small areas of bainite. The etched surfaces were further prepared by stain etching with an aqueous solution of 25 w/o sodium bisulphite. A contrast was created in the microstructure between the martensite, which was colored by the stain etch, and the featureless white retained austenite/Ni-rich regions. An automated image analysis system was used to measure the amount of the unstained white areas (retained austenite). During the analysis, the features coinciding with a near white detection setting were separated into large and small feature groups. The small features were < 30 µm2 and appear as small, angular needles located between the martensite needles. The large features, > 30 µm2 and appear to be a combination of Ni-rich regions and areas containing diffused Ni with the elevated carbon content from the carburization process.
2 and appear to be a combination of Ni-rich regions and areas containing diffused Ni with the elevated carbon content from the carburization process.
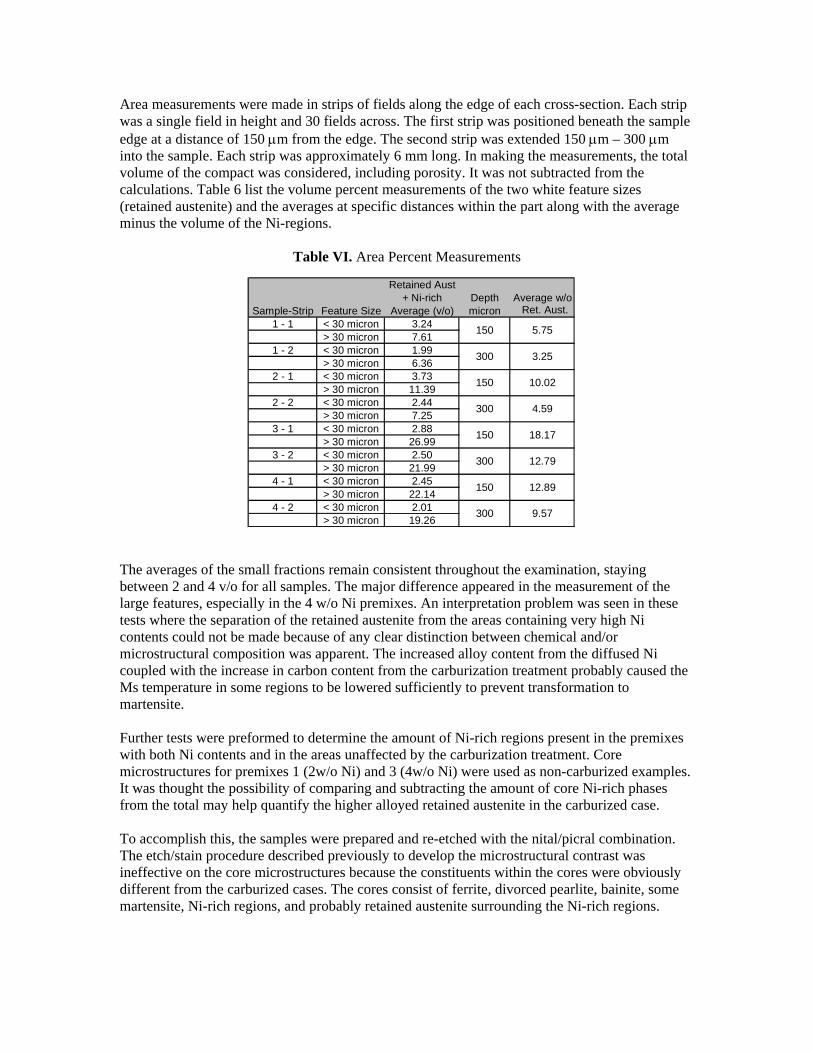
Area measurements were made in strips of fields along the edge of each cross-section. Each strip was a single field in height and 30 fields across. The first strip was positioned beneath the sample edge at a distance of 150 µm from the edge. The second strip was extended 150 µm – 300 µm into the sample. Each strip was approximately 6 mm long. In making the measurements, the total volume of the compact was considered, including porosity. It was not subtracted from the calculations. Table 6 list the volume percent measurements of the two white feature sizes (retained austenite) and the averages at specific distances within the part along with the average minus the volume of the Ni-regions.
Table VI. Area Percent Measurements
Retained Aust+ Ni-rich Depth Average w/o
Sample-Strip Feature Size Average (v/o) micron Ret. Aust.1 - 1 < 30 micron 3.24
> 30 micron 7.611 - 2 < 30 micron 1.99
> 30 micron 6.362 - 1 < 30 micron 3.73
> 30 micron 11.392 - 2 < 30 micron 2.44
> 30 micron 7.253 - 1 < 30 micron 2.88
> 30 micron 26.993 - 2 < 30 micron 2.50
> 30 micron 21.994 - 1 < 30 micron 2.45
> 30 micron 22.144 - 2 < 30 micron 2.01
> 30 micron 19.26 300
300
150
300
150
150
300
150
18.17
12.79
12.89
9.57
5.75
3.25
10.02
4.59
The averages of the small fractions remain consistent throughout the examination, staying between 2 and 4 v/o for all samples. The major difference appeared in the measurement of the large features, especially in the 4 w/o Ni premixes. An interpretation problem was seen in these tests where the separation of the retained austenite from the areas containing very high Ni contents could not be made because of any clear distinction between chemical and/or microstructural composition was apparent. The increased alloy content from the diffused Ni coupled with the increase in carbon content from the carburization treatment probably caused the Ms temperature in some regions to be lowered sufficiently to prevent transformation to martensite. Further tests were preformed to determine the amount of Ni-rich regions present in the premixes with both Ni contents and in the areas unaffected by the carburization treatment. Core microstructures for premixes 1 (2w/o Ni) and 3 (4w/o Ni) were used as non-carburized examples. It was thought the possibility of comparing and subtracting the amount of core Ni-rich phases from the total may help quantify the higher alloyed retained austenite in the carburized case. To accomplish this, the samples were prepared and re-etched with the nital/picral combination. The etch/stain procedure described previously to develop the microstructural contrast was ineffective on the core microstructures because the constituents within the cores were obviously different from the carburized cases. The cores consist of ferrite, divorced pearlite, bainite, some martensite, Ni-rich regions, and probably retained austenite surrounding the Ni-rich regions.
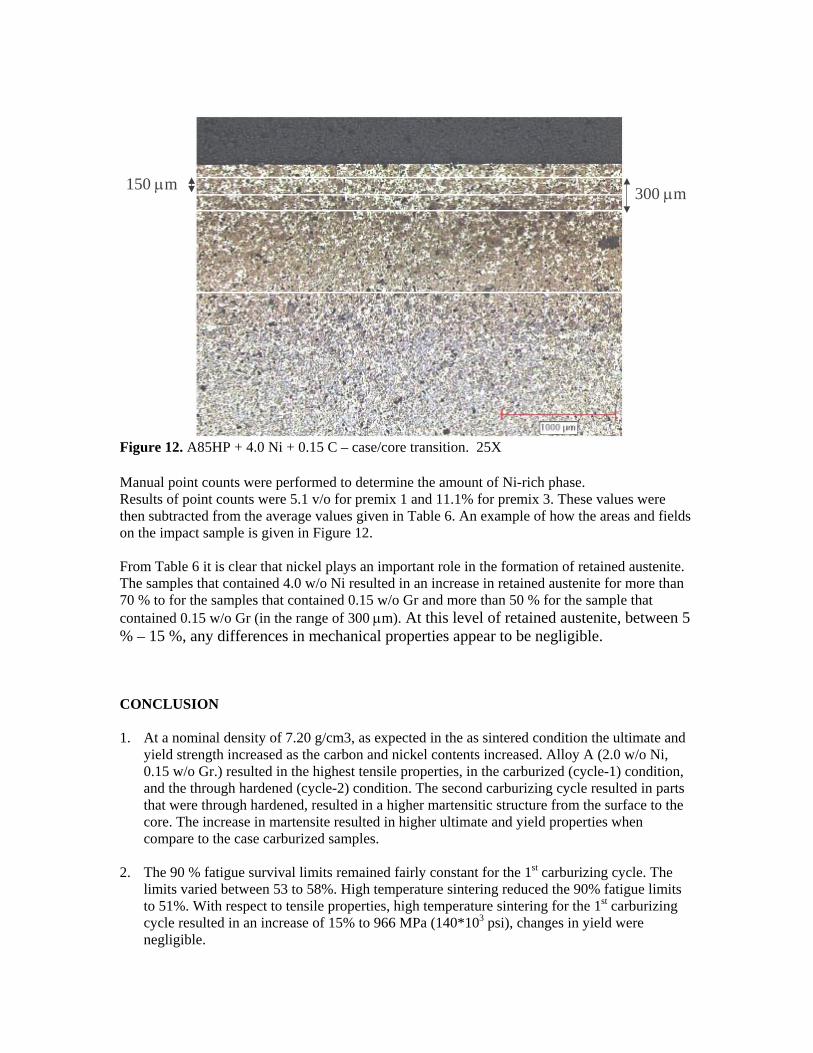
150 µm 300 µm
Figure 12. A85HP + 4.0 Ni + 0.15 C – case/core transition. 25X Manual point counts were performed to determine the amount of Ni-rich phase. Results of point counts were 5.1 v/o for premix 1 and 11.1% for premix 3. These values were then subtracted from the average values given in Table 6. An example of how the areas and fields on the impact sample is given in Figure 12. From Table 6 it is clear that nickel plays an important role in the formation of retained austenite. The samples that contained 4.0 w/o Ni resulted in an increase in retained austenite for more than 70 % to for the samples that contained 0.15 w/o Gr and more than 50 % for the sample that contained 0.15 w/o Gr (in the range of 300 µm). At this level of retained austenite, between 5 % – 15 %, any differences in mechanical properties appear to be negligible. CONCLUSION 1. At a nominal density of 7.20 g/cm3, as expected in the as sintered condition the ultimate and
yield strength increased as the carbon and nickel contents increased. Alloy A (2.0 w/o Ni, 0.15 w/o Gr.) resulted in the highest tensile properties, in the carburized (cycle-1) condition, and the through hardened (cycle-2) condition. The second carburizing cycle resulted in parts that were through hardened, resulted in a higher martensitic structure from the surface to the core. The increase in martensite resulted in higher ultimate and yield properties when compare to the case carburized samples.
2. The 90 % fatigue survival limits remained fairly constant for the 1st carburizing cycle. The
limits varied between 53 to 58%. High temperature sintering reduced the 90% fatigue limits to 51%. With respect to tensile properties, high temperature sintering for the 1st carburizing cycle resulted in an increase of 15% to 966 MPa (140*103 psi), changes in yield were negligible.
3. The 90 % fatigue survival limits decreased for the 2nd carburizing cycle. The limits varied
between 39 to 52%. High temperature sintering reduced the 90% fatigue limits to 46%. With respect to tensile properties, high temperature sintering for the 2nd carburizing cycle resulted in a negligible increase in ultimate and yield strength.
4. For both carburizing cycles, increasing the nickel content from 2.0 w/o to 4.0 w/o
resulted in minimal if any increases in tensile and fatigue properties. 5. The carburized samples resulted in fatigue endurance limits equivalent to or greater than
samples that were machined from AISI 8620 wrought. 6. Nickel plays an important role in the formation of retained austenite. The samples that
contained 4.0 w/o Ni resulted in an increase in retained austenite for more than 70 % to for the samples that contained 0.15 w/o Gr and more than 50 % for the sample that contained 0.15 w/o Gr (in the range of 300 µm). At this level of retained austenite, between 5 – 15 %, any differences in mechanical properties appear to be negligible.
ACKNOWLEGEMENTS The authors wish to acknowledge the contributions of Gerald Golin and Thomas Murphy to this paper and their timely preparation of the metallographic samples is much appreciated.
REFERENCES 1. Krauss, G., Principles of Heat Treatment of Steels, American Society for Metals, Vol. 1, pp.
251 2. “Case Hardening of Steel”, ASM International, Vol. 1, pp. 4, 1987 3. “Manual on Fatigue Testing”, University Microfilms, Inc., Baltimore, MD, 1949. 4. Rice, R.C., “Fatigue Data Analysis,” ASM International, Metals Handbook, Vol. 8, 9th
Edition, pp. 695-720, 1985. 5. W. Jandeska, R. Slattery, H. Fran, A. Rawlings, P. King, “Rolling Contact Fatigue Evaluation
of Powder Forged FLN2-4405”, To be presented 2005 International Conference on Powdered Metallurgy and Particulate Materials, Montreal, Canada.