Embed Size (px)
Citation preview

NBER WORKING PAPER SERIES
EFFECTS OF BICYCLE HELMET LAWS ON CHILDREN'S INJURIES
Pinka ChatterjiSara Markowitz
Working Paper 18773http://www.nber.org/papers/w18773
NATIONAL BUREAU OF ECONOMIC RESEARCH1050 Massachusetts Avenue
Cambridge, MA 02138February 2013
Funding for this project was provided by grant number R03 HD060972-01 from the National Institutesof Health. We would like to acknowledge the help of Tom Schroeder for providing the NEISS data,and to Diane Nesson for coding the laws. The views expressed herein are those of the authors anddo not necessarily reflect the views of the National Bureau of Economic Research.
NBER working papers are circulated for discussion and comment purposes. They have not been peer-reviewed or been subject to the review by the NBER Board of Directors that accompanies officialNBER publications.
© 2013 by Pinka Chatterji and Sara Markowitz. All rights reserved. Short sections of text, not to exceedtwo paragraphs, may be quoted without explicit permission provided that full credit, including © notice,is given to the source.
Effects of Bicycle Helmet Laws on Children's InjuriesPinka Chatterji and Sara MarkowitzNBER Working Paper No. 18773February 2013JEL No. I0,K0
ABSTRACT
Cycling is popular among children, but results in thousands of injuries annually. In recent years, manystates and localities have enacted bicycle helmet laws. We examine direct and indirect effects of theselaws on injuries. Using hospital-level panel data and triple difference models, we find helmet lawsare associated with reductions in bicycle-related head injuries among children. However, laws alsoare associated with decreases in non-head cycling injuries, as well as increases in head injuries fromother wheeled sports. Thus, the observed reduction in bicycle-related head injuries may be due toreductions in bicycle riding induced by the laws.
Pinka ChatterjiState University of New York at AlbanyEconomics Department1400 Washington AvenueAlbany, NY 12222and [email protected]
Sara MarkowitzDepartment of EconomicsEmory University1602 Fishburne Dr.Atlanta, GA 30322and [email protected]
1
INTRODUCTION
Cycling is one of the most popular recreational sports among children and adults. In
2010, there were about 40 million cyclists in the United States, 37 percent of whom were aged 7-
17 years old (NSGA 2012). Cycling, however, is an activity that can lead to potentially serious
injuries and death, particularly among children. In 2009, bicycle accidents resulted in 782 deaths
nationwide, and over 518,000 emergency room visits (CDC 2012a; CDC 2012b). Children aged
19 and under account for 57 percent of all bicycle injuries treated in emergency rooms and 15
percent of deaths. In fact, bicycle accidents are a leading cause of accidental death among
children (CDC 2012b).
Deaths and serious injuries from bicycle accidents frequently result from trauma to the
head, and children are more likely than any other age group to die from a bicycle-related head
injury (Safe Kids USA, 2012). Injured children also are more than twice as likely as injured
adults to suffer from a head or facial injury (Rodgers 2001). Based on 1994-2001 admissions
data from the National Pediatric Trauma Registry (NPTR), the National Safe Kids Campaign
estimates that almost half of children ages 14 and under who were hospitalized for a bicycle-
related accident had a traumatic brain injury. Most (about 75 percent) of these hospitalized
children were males (National Safe Kids Campaign 2002).
Helmet usage reduces the probability of head trauma, but less than half of adults,
teenagers, and pre-teen children report that they use helmets regularly (National Safe Kids
Campaign 2002; Thompson 1989; CPSC 1999; Carpenter and Stehr 2011).1 For this reason,
since 1987, 21 states, the District of Columbia, and over a hundred of localities have
implemented mandatory helmet laws targeted at children of various age groups. Community and
state-level studies offer suggestive evidence that helmet laws are effective in increasing helmet
2
usage.2 However, there exists little information based on national data whether these state and
local helmet regulations actually decrease head injuries from bicycle-related accidents.
To the best of our knowledge, only two studies exist based on national U.S. data that
address the effects of bicycle helmet laws on fatalities from bicycle accidents, and no national
study in the U.S. has examined the effects of helmet laws on injuries. Grant and Rutner (2004)
examine the direct impact of helmet laws on juvenile fatalities that result from motor
vehicle/bicycle accidents. They use data for 1975 to 2000 from the Fatality Analysis Reporting
System (FARS) and estimate models that include fixed effects to account for unobserved, time-
invariant differences across states that might affect helmet legislation and fatalities from bicycle
accidents. The authors find that a state-level helmet law is associated with a 15 percent
reduction in fatalities among juveniles. Carpenter and Stehr (2011) update the fatality analysis
of Grant and Rutner (2004) and analyze FARS fatality data spanning from 1991 to 2005. They
find the laws are associated with a 19 percent reduction in child fatalities. These authors also
explore the mechanism through which the laws reduce fatalities and find evidence that the laws
are associated with increases in helmet usage but also reduced bicycle riding.
While the studies by Grant and Rutner (2004) and Carpenter and Stehr (2011) account for
national and state trends that may confound their estimates, the results still must be interpreted
carefully. First, the fatality results only pertain to deaths resulting from an accident on a public
roadway. Our paper expands upon this by addressing the effect of helmet laws on bicycle-
related injuries that require emergency room treatment, which are far more common than road-
based fatalities. For example in 2009, there were only 85 deaths nationwide reported in FARS
for children under the age of 16, versus over 238,000 non-fatal injuries in emergency rooms for
the same age group (NHTSA 2009; CDC 2012b). Second, the prior studies ignore differences in
3
the ages targeted by laws. As we discuss below, the age groups targeted by helmet laws vary
widely across the country and across time, with states having varied age limits including ages 5,
12, 14, and 17. The prior two studies examine fatalities for children under 16, with the result that
not all children represented in their treatment group are affected by the laws and that some
children in the control group are affected by the laws. We take care to design our study so that
the treatment and control groups are well defined and not overlapping. (Further below, we
describe the difference-in-differences and difference-in-difference-in-differences (DDD) models
used to evaluate the laws.) Like the previous literature, we also take care to account for existing
trends among all riders that may confound our estimates. We test for possible spillover effects
into other age groups not covered by the laws, and we look for direct and spillover effects of
local as well as state helmet laws.
We also further the literature by considering the effects of helmet laws on injuries related
to other sports in which a helmet may be worn. Some of the state helmet laws explicitly include
other wheeled sports such as roller skating and scooter riding. It is also possible that the bicycle
helmet laws create a norm of helmet wearing other sports, such as skiing and ice skating, even
when the laws do not specifically target those sports. To address this possibility, we generate
injury rates by age for certain winter and wheeled sports, and examine the effects of the different
types of helmet laws on injuries related to these sports.
DATA
Injury data
Data on injuries come from the National Electronic Injury Surveillance System (NEISS),
which we obtained for the years 1991 to 2008. The NEISS is a data collection effort sponsored
4
by the Consumer Product Safety Commission (CPSC) and is designed to gather information on
consumer product-related injuries from the emergency departments of hospitals across the
United States. These data are patient-level data on accidents and injuries involving any
consumer product. NEISS hospitals are representative of all U.S. general hospitals with
emergency departments. In 1997, a strata was added to include children’s hospitals. During a
survey redesign in 1997, a resampling method was used that maximized the probability of
retaining hospitals from the previous sample. In our final data set, we observe injury data from
141 hospitals located in 42 states. Hospitals may enter and exit the sample; however, 95
hospitals (67 percent) are in the data for at least 10 years, and 50 (35 percent) are in for all
eighteen years of our sample period. The remaining hospitals are in the sample for an average of
6 years and of these, when a hospital is in a state with a helmet law, half are in long enough to
observe injuries both before and after the passage of the helmet law.
The NEISS provides comprehensive details on each consumer product-related injury.
Included in these data are the victim's age, injury diagnosis, body parts affected, type of
consumer product associated with the injury (e.g. bicycle, skateboard), and a brief narrative
describing the cause of injury. From this information, we generate age-specific bicycle-related
injury counts for each hospital in each year. Previous research indicates that helmet usage has
the potential to prevent injuries to the head, brain, and scalp (Thompson et al. 1996). To best
represent injuries that are potentially preventable by use of a bicycle helmet, we count only the
injuries described by the NEISS as affecting the head, ear, and all parts of the body (at least 25
percent or more.) Injuries to the face are not counted, since helmets are not likely to prevent
these injuries. Injuries are prioritized within the NEISS and they code the body part that is most
seriously hurt.
5
We limit the injury data to only those cases that involve a bicycle, mountain or all terrain
bicycle, or a tricycle. These are codes 1202, 1301, 5033 and 5040 in the NEISS product code
list. However, as the definition of these codes also includes bicycle accessories we took special
care to include only those injuries that occurred while the person was riding on a bicycle
(including young children riding with an adult). For example, head injuries involving a bicycle
accessory such as an air pump were deleted. Injuries that occurred inside a house were also
excluded as these are not expected to be prevented by a helmet. Another example of excluded
injuries is those occurring to pedestrians who were hit by a cyclist. We used the accident
narratives to assist us in determining which cases were relevant to our research question. To do
this, we programmed certain keywords for an automated sorting. Where there were ambiguities,
we read through the individual narratives and made a determination on a case-by-case basis.
After “cleaning” the data, we summed the individual cases to generate counts of bicycle-
related head injuries by age, hospital, state, and year. These counts represent our main
dependent variable or the numerator in the injury rate, as we describe below. To generate a
denominator for the rate, we use the total number of NEISS cases related to all consumer
products in a hospital for each age. This total count has the advantage of being age, hospital, and
year specific, just like the numerator, and at the same time providing a measure of the population
served by the hospital.3
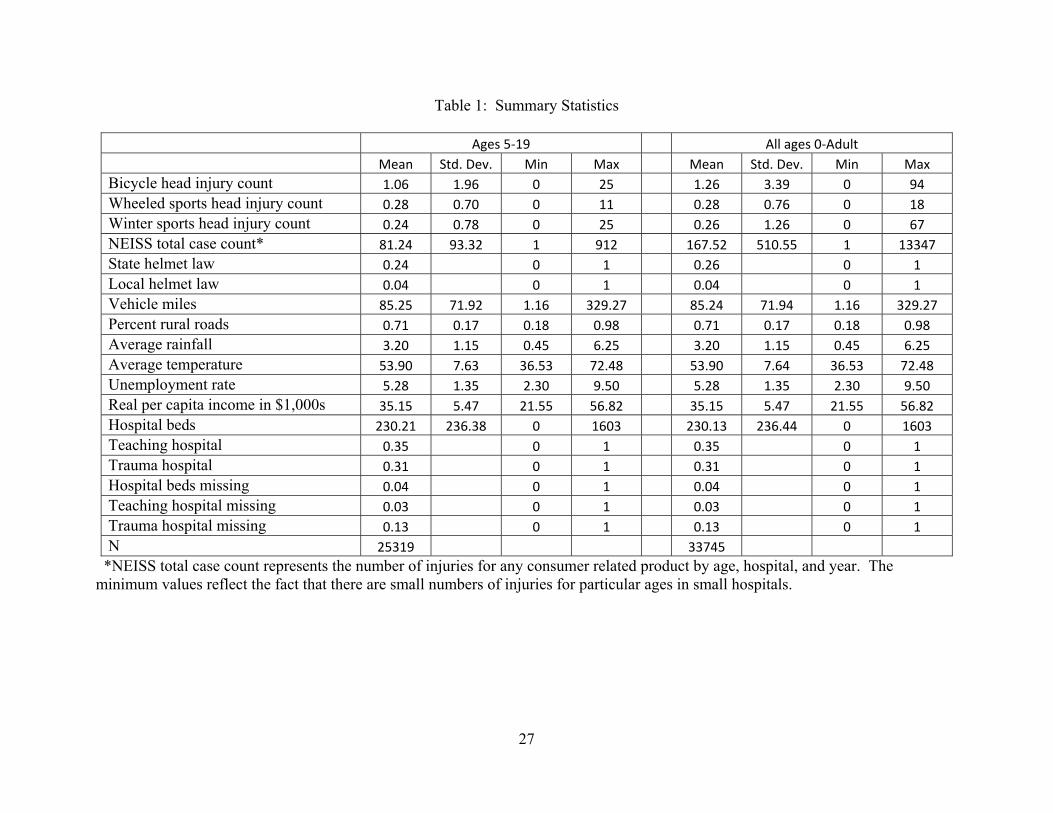
Table 1 shows some summary statistics for these counts and the other variables. We
present mean values along with the minimum and maximum values for those ages 5-19 and
again for ages zero through adult. Note that the averages are based on single year of age,
hospital and year, which results in some very small values for injury counts. The average bicycle
head injury count for ages 5-19 is 1.06. Zeros are quite prevalent in this data, as there are zero
6
injuries reported for 56 percent of the observations in this age group. Note that the average
injury count rises to 2.4 if zeros are excluded. Because of the distribution of the injury data, we
believe that a count model is the best estimation technique. We describe our methodology detail
in the estimation section below.
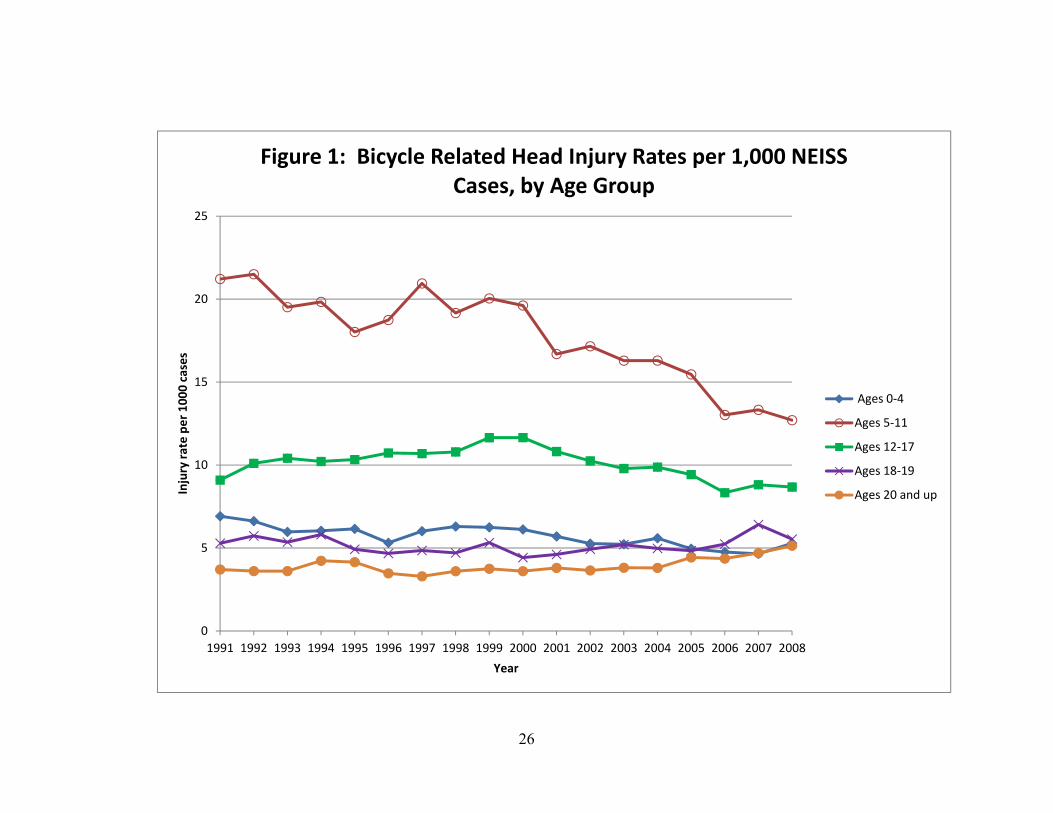
Figure 1 shows trends in the national injury rates over time by age group. Head injury
rates for children ages 5-11 show a dramatic decrease over time, falling from 21.2 injuries per
1000 cases in 1991 to 12.7 injuries per 1000 cases in 2008. The injury rate for children ages 0-4
also exhibits a downward trend, but it is much less pronounced, falling from 6.9 in 1991 to 5.3 in
2008. Teens ages 12-17 experience rates that initially increase slightly, rising from 9.1 in 1991
to 11.6 in 2000, and then falling to 8.7 in 2008. By contrast, the adult injury rate actually
increases over time, rising from 3.7 to 5.1 over the time period presented.
Helmet Laws
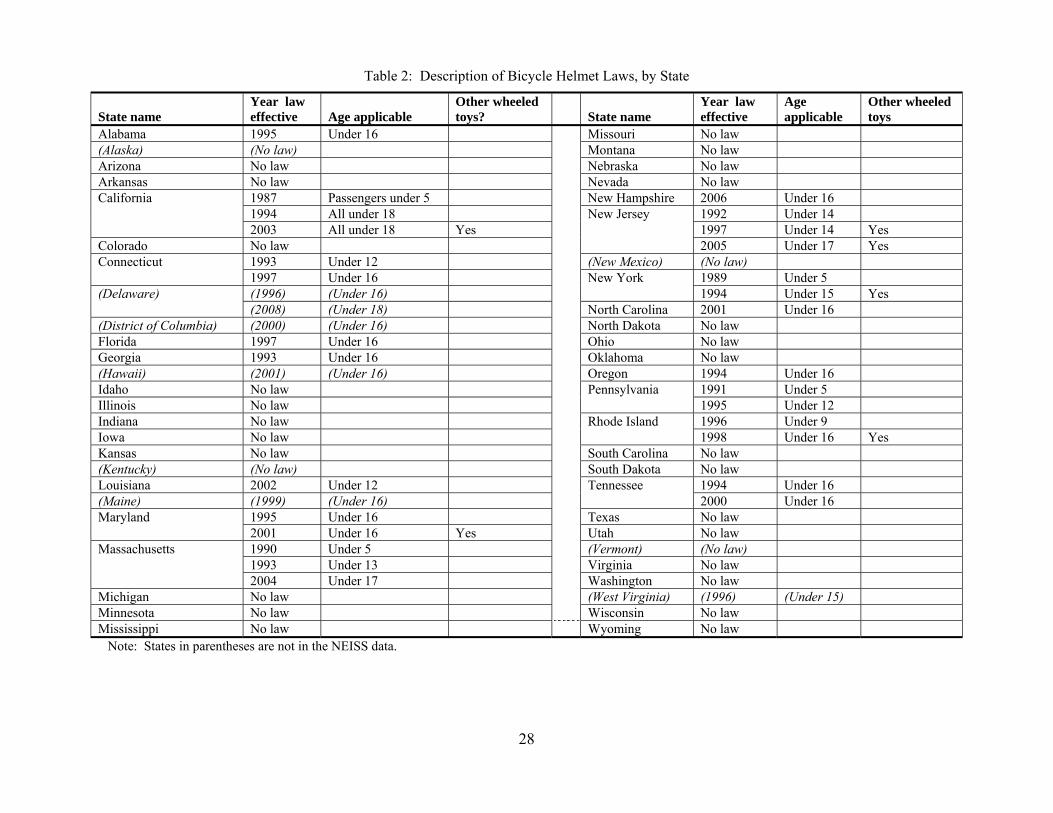
Information on the bicycle helmet laws comes from the Bicycle Helmet Safety Institute.
We confirmed and expanded upon their information by consulting the state statutes. Table 2 lists
each state, the effective date of any helmet law, the ages to which the law applies, and whether
the helmet law pertains to other wheeled sports such as skateboards or roller skates. Many cities
and counties across the country also have local helmet laws. We account for these by gathering
information on helmet laws for the county in which the NEISS hospital is located. County laws
for the NEISS hospital are fairly rare in the time span of our data. We observe local helmet laws
for only 10 hospitals in 9 states, and therefore results for local laws should be treated as
suggestive only. Not only is there limited variation in these laws, but the results are likely to be
biased since hospitals admit patients from wider geographic areas then just counties so many of
7
the patients we observe could be under the jurisdiction of a different law than that of the
hospital’s county.
Care must be taken in interpreting the results of the all of the helmet laws. The degree to
which the laws are enforced may vary widely across localities. Also, the penalties for violating
the law tend to be very minor. In many cases, the penalty for the first offense is a verbal
warning, and if a fine is imposed, it is often waived if a helmet is purchased. Given this, it is not
clear whether an effect of the law reflects the effects of the actual law itself or whether it reflects
any education, public campaigns, or attitudes towards risk that accompany the helmet laws.
Other Variables
Injury rates may vary across geographic areas simply because of factors such as
differences in weather, temperature, or road conditions. We account for the influence of these
factors by including some additional state-level variables in the models described below. First,
we include the yearly average temperature and rainfall in the state in all models. These data
come from the National Climatic Data Center of the U.S. National Oceanic and Atmospheric
Administration. Next, we include the percentage of each state’s highways classified as urban
roadways. Heavy traffic volume on urban roadways may make riding more dangerous and
accidents more likely than in rural areas. Annual vehicle miles per capita are also included to
provide a measure of automobile density. These highway characteristics come from the Federal
Highway Administration of the U.S. Department of Transportation. The state annual
unemployment rate and real per capita income are included to help account for economic
conditions and income available for purchasing bicycles and helmets, and for using alternative
modes of transportation. These variables are available from the U.S. Bureau of Labor Statistics.
8
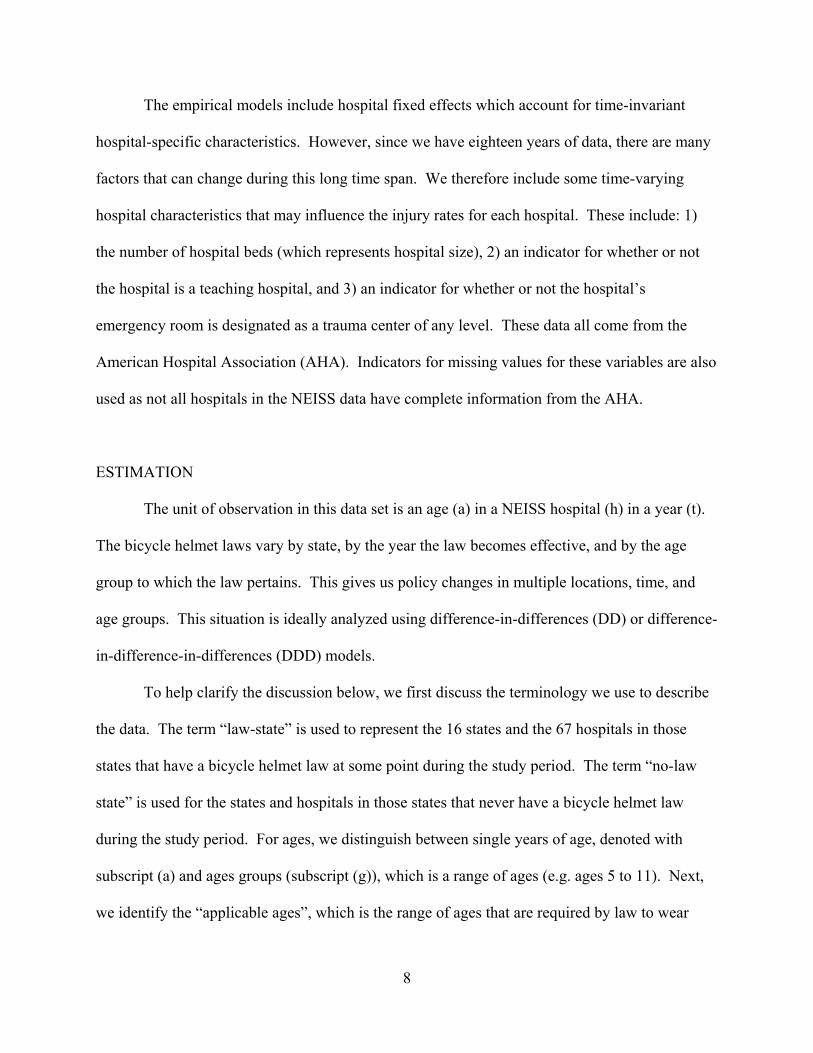
The empirical models include hospital fixed effects which account for time-invariant
hospital-specific characteristics. However, since we have eighteen years of data, there are many
factors that can change during this long time span. We therefore include some time-varying
hospital characteristics that may influence the injury rates for each hospital. These include: 1)
the number of hospital beds (which represents hospital size), 2) an indicator for whether or not
the hospital is a teaching hospital, and 3) an indicator for whether or not the hospital’s
emergency room is designated as a trauma center of any level. These data all come from the
American Hospital Association (AHA). Indicators for missing values for these variables are also
used as not all hospitals in the NEISS data have complete information from the AHA.
ESTIMATION
The unit of observation in this data set is an age (a) in a NEISS hospital (h) in a year (t).
The bicycle helmet laws vary by state, by the year the law becomes effective, and by the age
group to which the law pertains. This gives us policy changes in multiple locations, time, and
age groups. This situation is ideally analyzed using difference-in-differences (DD) or difference-
in-difference-in-differences (DDD) models.
To help clarify the discussion below, we first discuss the terminology we use to describe
the data. The term “law-state” is used to represent the 16 states and the 67 hospitals in those
states that have a bicycle helmet law at some point during the study period. The term “no-law
state” is used for the states and hospitals in those states that never have a bicycle helmet law
during the study period. For ages, we distinguish between single years of age, denoted with
subscript (a) and ages groups (subscript (g)), which is a range of ages (e.g. ages 5 to 11). Next,
we identify the “applicable ages”, which is the range of ages that are required by law to wear
9
helmets when riding (e.g. under 12). This is in contrast to the “non-applicable ages”, which are
the ages that are not covered by the law. Lastly, we use the terms “pre period” and “post period”
to describe the years before and after the laws are in effect. These periods vary by state since
each state enacts their helmet laws at different times.
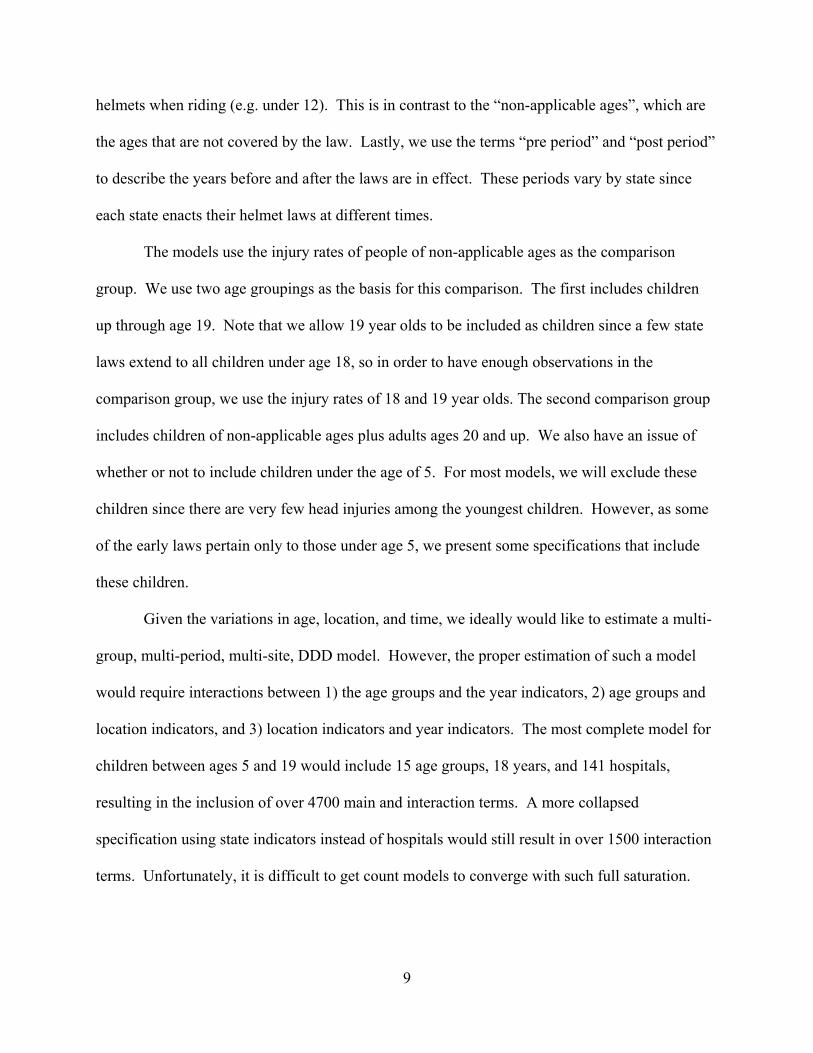
The models use the injury rates of people of non-applicable ages as the comparison
group. We use two age groupings as the basis for this comparison. The first includes children
up through age 19. Note that we allow 19 year olds to be included as children since a few state
laws extend to all children under age 18, so in order to have enough observations in the
comparison group, we use the injury rates of 18 and 19 year olds. The second comparison group
includes children of non-applicable ages plus adults ages 20 and up. We also have an issue of
whether or not to include children under the age of 5. For most models, we will exclude these
children since there are very few head injuries among the youngest children. However, as some
of the early laws pertain only to those under age 5, we present some specifications that include
these children.
Given the variations in age, location, and time, we ideally would like to estimate a multi-
group, multi-period, multi-site, DDD model. However, the proper estimation of such a model
would require interactions between 1) the age groups and the year indicators, 2) age groups and
location indicators, and 3) location indicators and year indicators. The most complete model for
children between ages 5 and 19 would include 15 age groups, 18 years, and 141 hospitals,
resulting in the inclusion of over 4700 main and interaction terms. A more collapsed
specification using state indicators instead of hospitals would still result in over 1500 interaction
terms. Unfortunately, it is difficult to get count models to converge with such full saturation.
10
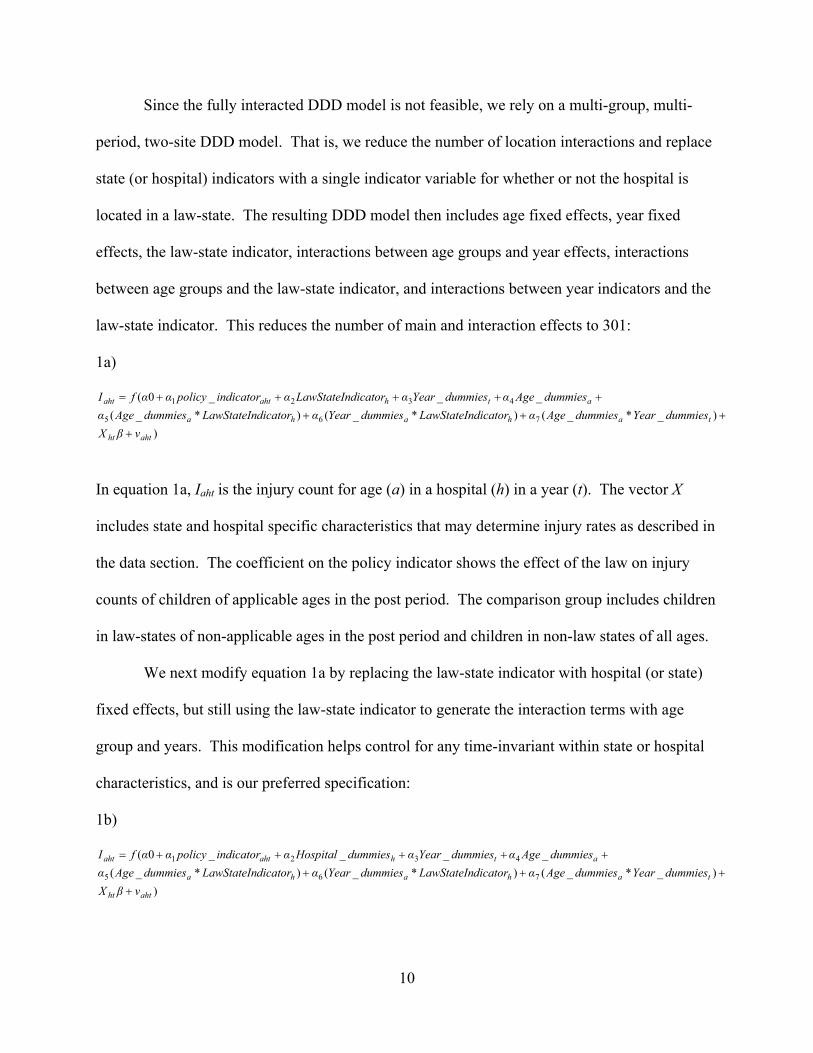
Since the fully interacted DDD model is not feasible, we rely on a multi-group, multi-
period, two-site DDD model. That is, we reduce the number of location interactions and replace
state (or hospital) indicators with a single indicator variable for whether or not the hospital is
located in a law-state. The resulting DDD model then includes age fixed effects, year fixed
effects, the law-state indicator, interactions between age groups and year effects, interactions
between age groups and the law-state indicator, and interactions between year indicators and the
law-state indicator. This reduces the number of main and interaction effects to 301:
1a)
)
)_*_()*_()*_(
___0(
765
4321
ahtht
tahaha
athahtaht
νβX
dummiesYeardummiesAgeαdicatorLawStateIndummiesYearαdicatorLawStateIndummiesAgeα
dummiesAgeαdummiesYearαdicatorLawStateInαindicatorpolicyααfI
In equation 1a, Iaht is the injury count for age (a) in a hospital (h) in a year (t). The vector X
includes state and hospital specific characteristics that may determine injury rates as described in
the data section. The coefficient on the policy indicator shows the effect of the law on injury
counts of children of applicable ages in the post period. The comparison group includes children
in law-states of non-applicable ages in the post period and children in non-law states of all ages.
We next modify equation 1a by replacing the law-state indicator with hospital (or state)
fixed effects, but still using the law-state indicator to generate the interaction terms with age
group and years. This modification helps control for any time-invariant within state or hospital
characteristics, and is our preferred specification:
1b)
)
)_*_()*_()*_(
____0(
765
4321
ahtht
tahaha
athahtaht
νβX
dummiesYeardummiesAgeαdicatorLawStateIndummiesYearαdicatorLawStateIndummiesAgeα
dummiesAgeαdummiesYearαdummiesHospitalαindicatorpolicyααfI
11
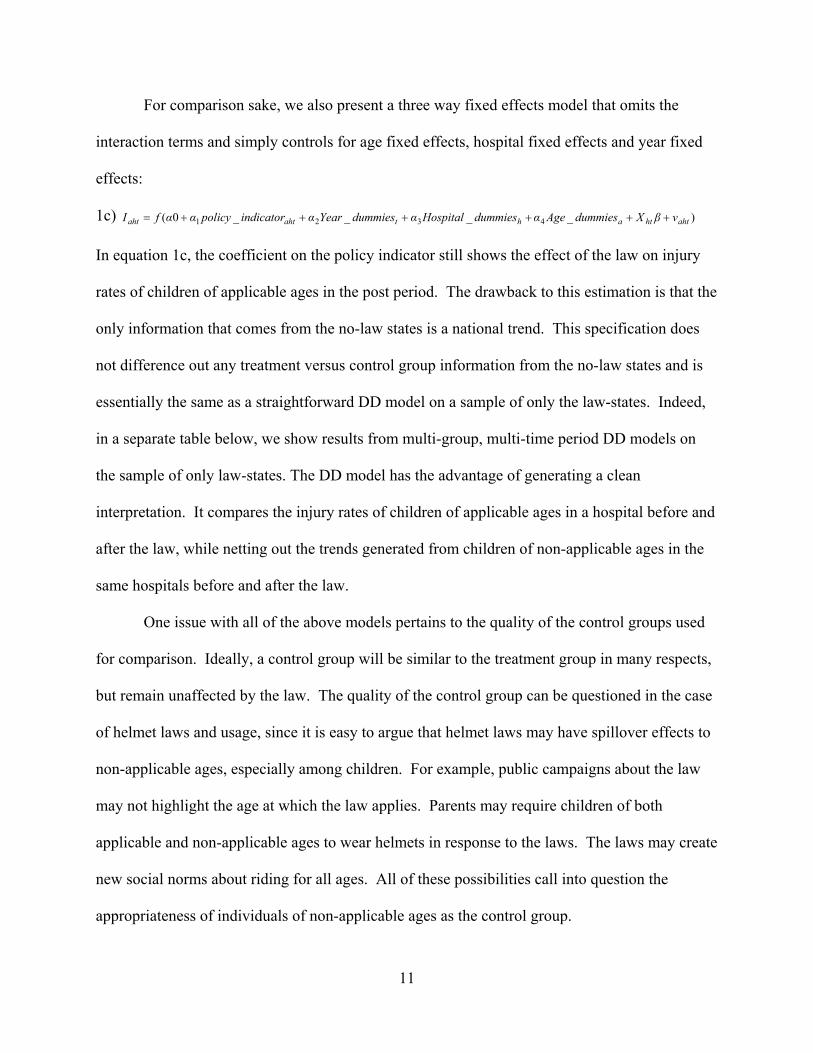
For comparison sake, we also present a three way fixed effects model that omits the
interaction terms and simply controls for age fixed effects, hospital fixed effects and year fixed
effects:
1c) )____0( 4321 ahthtahtahtaht νβXdummiesAgeαdummiesHospitalαdummiesYearαindicatorpolicyααfI
In equation 1c, the coefficient on the policy indicator still shows the effect of the law on injury
rates of children of applicable ages in the post period. The drawback to this estimation is that the
only information that comes from the no-law states is a national trend. This specification does
not difference out any treatment versus control group information from the no-law states and is
essentially the same as a straightforward DD model on a sample of only the law-states. Indeed,
in a separate table below, we show results from multi-group, multi-time period DD models on
the sample of only law-states. The DD model has the advantage of generating a clean
interpretation. It compares the injury rates of children of applicable ages in a hospital before and
after the law, while netting out the trends generated from children of non-applicable ages in the
same hospitals before and after the law.
One issue with all of the above models pertains to the quality of the control groups used
for comparison. Ideally, a control group will be similar to the treatment group in many respects,
but remain unaffected by the law. The quality of the control group can be questioned in the case
of helmet laws and usage, since it is easy to argue that helmet laws may have spillover effects to
non-applicable ages, especially among children. For example, public campaigns about the law
may not highlight the age at which the law applies. Parents may require children of both
applicable and non-applicable ages to wear helmets in response to the laws. The laws may create
new social norms about riding for all ages. All of these possibilities call into question the
appropriateness of individuals of non-applicable ages as the control group.
12
One way to test for spillover effects and validate the control group is through the use of
some simple two group, two time period DD models. We estimate these models by limiting the
sample to the law states and collapsing the age groups so that the grouping within each hospital
becomes applicable ages versus non-applicable ages (the cutoff age will change based on the
state in which the hospital is located). The time dimension is the years before and after the law
passes in each state (which again varies by state). Under this set-up, we can examine a simple
two group, two time period model (equation 2 below) where the coefficient on the interaction
(α3) is the policy effect:
2) )0( 4321 ghthttgtgght νXmmiesHospitalDuα)PostPeriodxreated(AgeGroupTαPostPeriodαeatedAgeGroupTrααfI .
The coefficient α2 in Equation 2 shows the effect on injury rates of being in the non-applicable
age group in the post-period, and is therefore a good estimate of any spillover effects to older age
groups. In other words, the magnitude and statistical significance of α2 can point to whether or
not we have a good control group. As described below, we experiment with different
specifications of this simple DD model using different age ranges as the control group.
Our empirical approach to answering the question of whether bicycle helmet laws are
effective in reducing head injury rates among children relies on the weight of evidence provided
by the different models outlined above. We will compare results from each, along with
comparisons from using different definitions of the control group based on age. All models will
be estimated with Poisson regression analysis, which is an appropriate technique for analyzing
injury counts, particularly when there are a lot of zeros present in the dependent variable. To
permit for overdispersion, standard errors are adjusted for heteroskedasticity of unknown form
that includes a within-state cluster correlation (Cameron and Trivedi 2009; Bertrand et al. 2004).
The advantage of the Poisson estimation is that the estimates are consistent regardless of whether
13
the counts actually have a Poisson distribution (Wooldridge 2002).4 Each model includes the log
of the age-specific population as a right hand side variable to normalize for exposure. The
coefficient on this log population is constrained to equal one.
RESULTS
Main Specifications
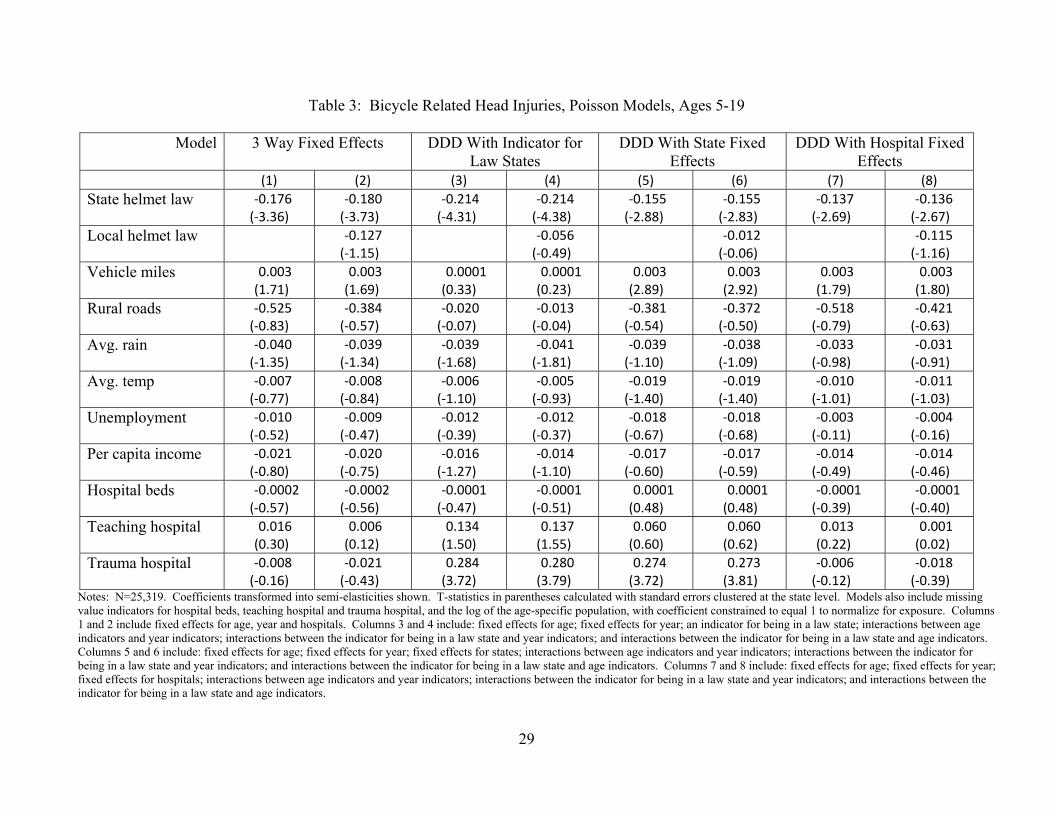
Table 3 shows the results of bicycle helmet laws on injury counts among children ages 5-
19. Four different models are shown, corresponding to equations 1a, 1b, and 1c above. Equation
1b is estimated twice--first with state fixed effects and second with hospital fixed effects. We
switch the order in the table and present the results for the three way fixed effects first (equation
1c). This shows a progression from the least inclusive to the most inclusive specification in
terms of fixed effects and interactions. Models are also shown with and without the indicator for
the presence of a local helmet law.
In all models in Table 3, the coefficient on the state helmet law is negative and
statistically significant. The magnitude varies based on the specification, with the least inclusive
model corresponding to the largest magnitude. The magnitude falls with the inclusion of the
interactions and the state fixed effects. Our preferred specification is shown in column 7 (with
little difference when the local law is added in column 8.). This is the most inclusive DDD
model with hospital fixed effects. Here, the coefficient shows that having a bicycle helmet law is
associated with a reduction in the bicycle-related head injury count of 13.7 percent. In other
words, considering a mean count of 1.06 injuries per age group, hospital and year, we can expect
a decrease in this count of 0.145 injuries, down from 1.06 to 0.914 injuries.
14
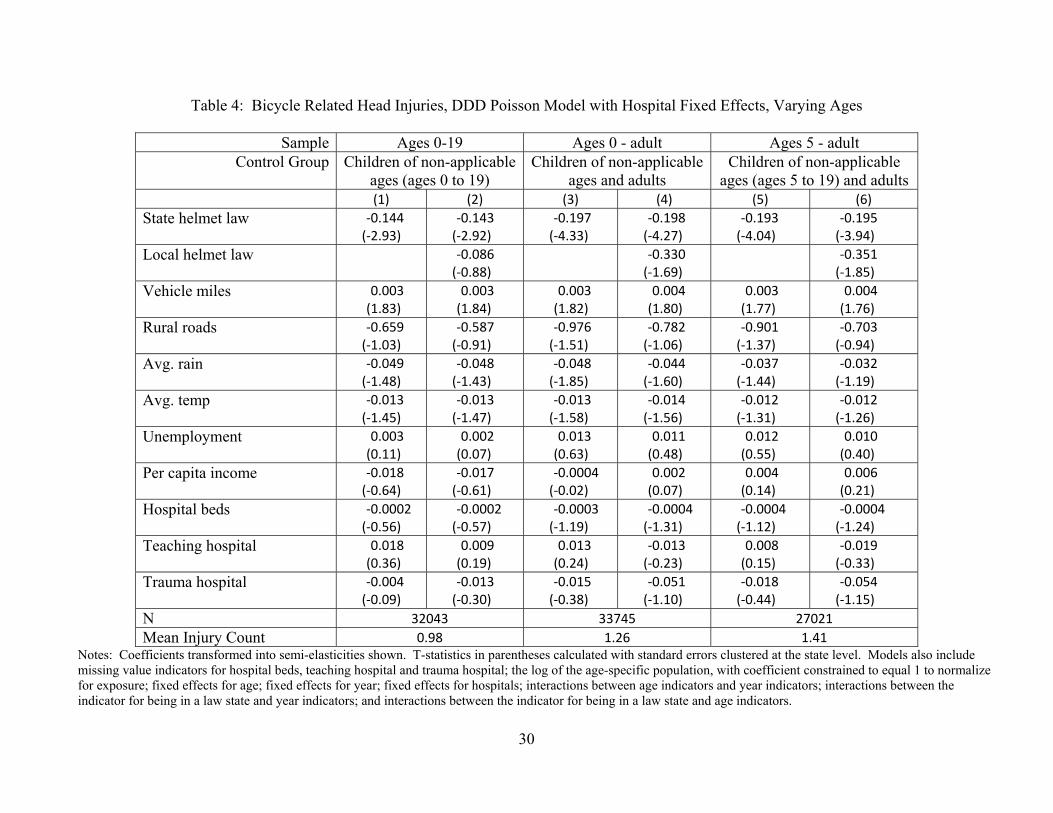
In Table 4, we use the preferred specification (equation 1b) to test whether the results are
sensitive to the inclusion of children under age 5 and to the inclusion of adults. The included
ages are specified in the row labeled “Sample”. The protective effect of helmet laws is still
apparent. The bicycle helmet laws are associated with a reduction in the bicycle-related head
injury counts of a range of 14 to 20 percent. The local laws are also associated with a reduction
in head injuries, but the coefficient is significant only at the 10 percent level in the models that
include adults as part of the control group.
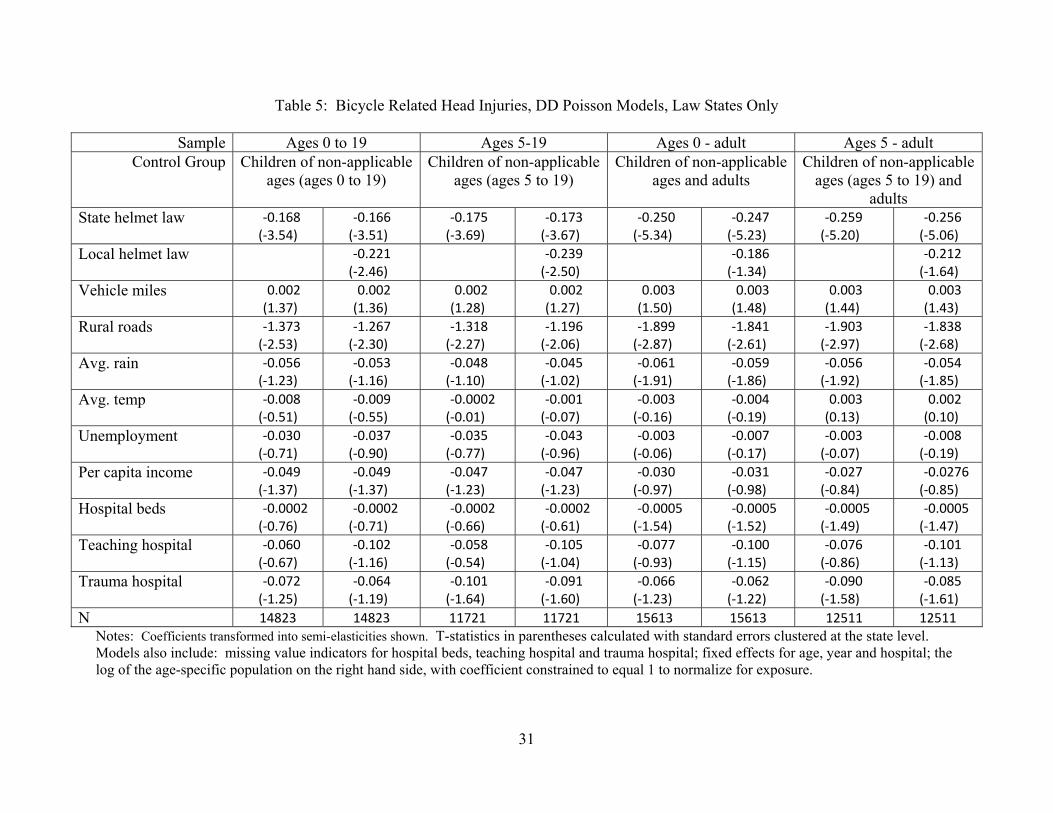
In Table 5, we estimate a series of DD models on the sample of law-states only. The
purpose here is to demonstrate results within a simple in-hospital experiment. These models
compares the injury rates of children of applicable ages in a hospital before and after the law,
while netting out the trends generated from children of non-applicable ages in the same hospitals
before and after the law. In columns 1 through 8, we vary the age groups included, and therefore
vary the age definitions for the treatment and control groups. Once again, the coefficient on the
state helmet laws is negative and statistically significant in all specifications, with magnitudes
similar to those of the previous tables.
Validity of control groups
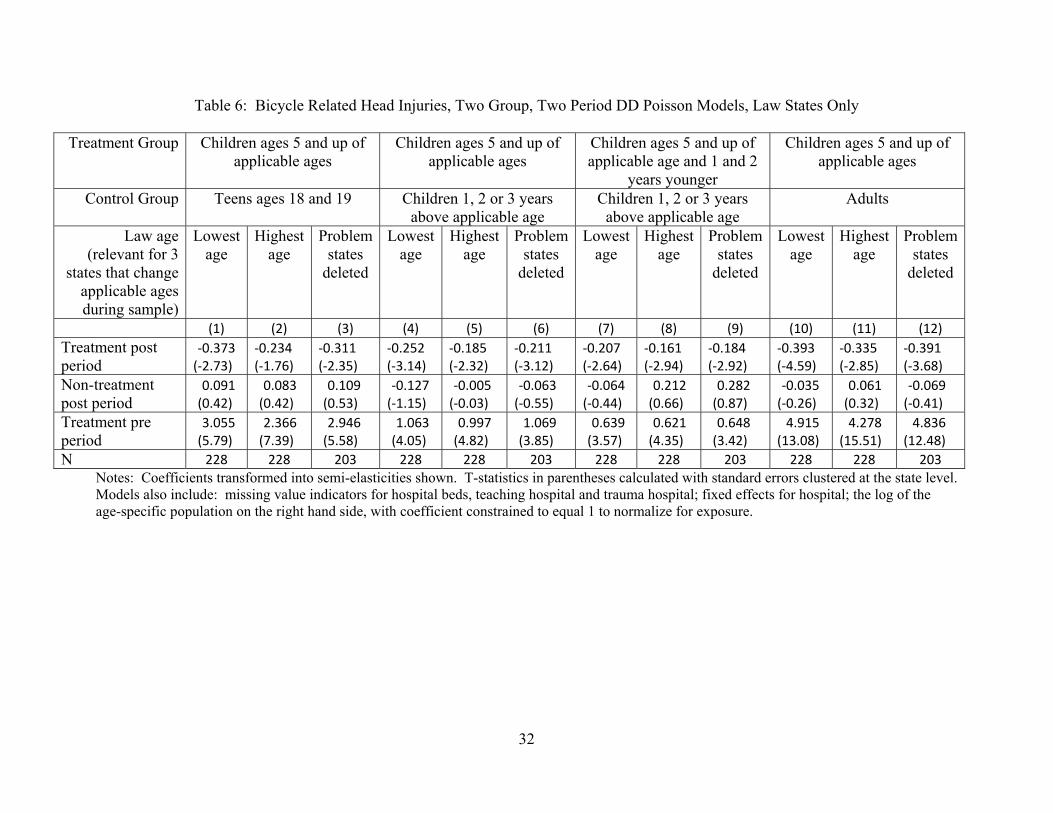
The validity of the control groups are checked in Table 6. Here, we collapse the data for
the law-states by hospital and year into treatment and control groups, before and after the law.
We then run the simple two group, two period DD model. The effect of the law can be seen in
the row labeled “Treatment post period”. Any spillover effects of the law onto the injury rates of
non applicable age groups can be seen in the row labeled “Non-treatment post period”.
15
We limit the data to those of ages 5 and up in order to help eliminate difficulties in
coding the groups that arise from changes in the applicable ages of the law. As can be seen in
Table 2, six states change their applicable age during our sample period. For example,
California’s first helmet law became effective in 1987 and pertained only to children under the
age of 5. They then increased the applicable age to 17 and under in 1994. By eliminating
children under age 5 in this simple DD model, the relevant post-period becomes 1994 and
beyond, and the applicable ages are ages 5 to 17. However, even with the elimination of young
children, we are still left with three states that change the applicable age during the time span of
our data (Connecticut, Massachusetts and New Jersey).5 We therefore run each model three
times. The first uses the lowest age as the applicable age and ignores the subsequent age change.
The second uses the highest age as the applicable age and ignores the lower age limit. Finally,
we delete the three problem states to avoid the issue altogether.
Since the point of this simple DD model is to check on the quality of the control groups
and see if we can observe any spillover effects of the laws, we present results for four different
control groups: First, we use teens ages 18 and 19 since this group serves as controls in all
states; Second, we use children one, two or three years above the applicable age. For example, if
the applicable age is ‘under 12’ in a state, children ages 12, 13, and 14 are designated as the
control group. We expect that any spillover effects would occur among children closest in age to
the applicable ages. The third control group is the same as the second; however, in these models,
we limit the treatment group to children at the applicable age and one and two years younger.
This generates a sample of children within six years of age, who should be similar in many
respects, particularly riding habits. Lastly, we use only adults as the control group since no state
law pertains to adults.
16
In Table 6, the coefficients representing the effect of the helmet law (shown in the row
labeled “treatment post period”) are negative and statistically significant. In addition, the results
also show no evidence of spillover effects for any of the four control groups. All coefficients for
the non-treatment group in the post period are statistically insignificant. For the models in
columns 4-6, where spillover effects would be most likely, the coefficients are indeed negative,
but are not estimated precisely enough to achieve statistical significance at conventional levels.
These results provide evidence that the control groups used in the preferred DDD specification
are useful and are unaffected by the laws.
It is interesting to note also that the coefficients for the treatment groups in the pre period
are all positive and significant, indicating that the children of applicable ages have higher injury
rates to begin with. This could be taken to mean that the laws are appropriately targeted to the
groups with the highest injury propensity. However, this also points to policy endogeneity as a
concern where the laws are passed in response to high rate of injuries. To check for this
problem, we ran our preferred DDD specification including the current year state law and an
indicator for the next year’s law. The size and significance of the coefficient on the current year
law is very similar to that in Table 3, column 7, while the coefficient on the future law is very
small and statistically indistinguishable from zero (results not shown). This provides some
evidence that policy endogeneity is not an issue.
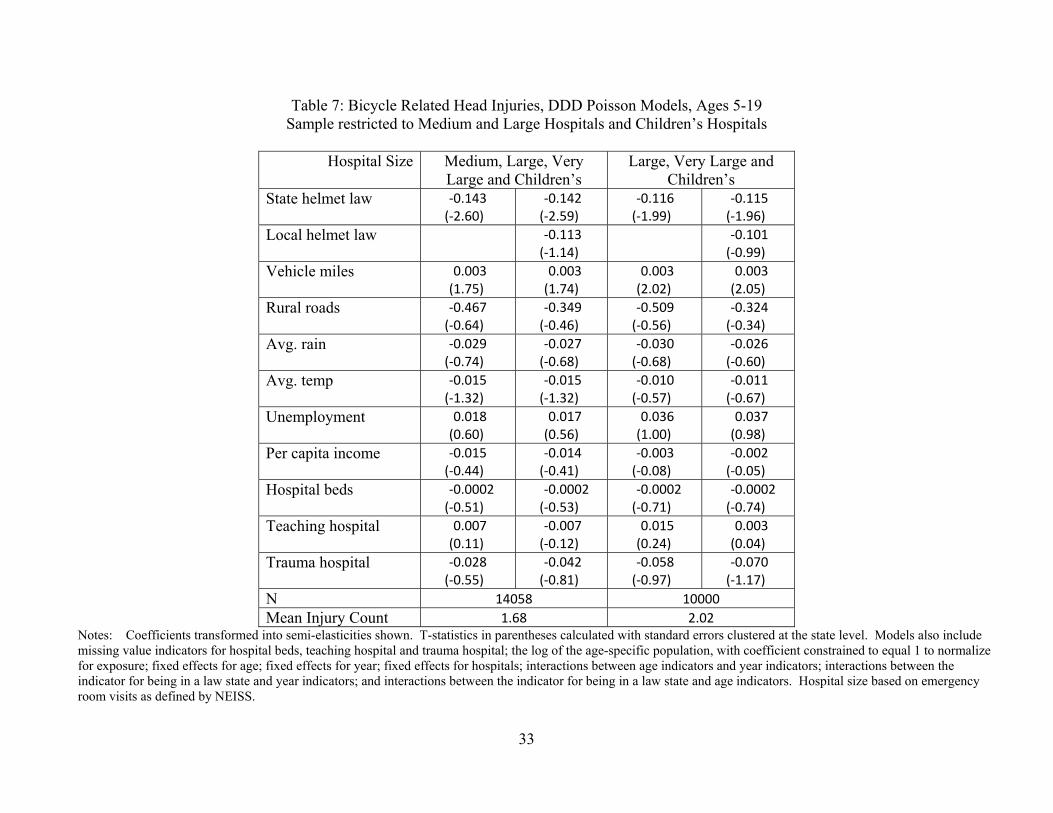
Hospital Size
One concern with the results of the previous tables is that the results may be influenced
by the injury counts in the small hospitals. That is, the rate within a small hospital could be very
high if there are many bike related injuries relative to the number of overall NEISS cases. In
17
Table 7, we limit the sample first by excluding all observations in small hospitals and second, by
excluding of all observations in small and medium size hospitals. Hospital size is defined by
NEISS based on the number of emergency room visits. The results for the preferred DDD
specification is shown in Table 7 with and without local helmet laws. Results remain unchanged
from previous models and indicate a decrease in the bicycle head injury count in the range of
11.5 to 14.3 percent after the enactment of a helmet law.
SAFER RIDING OR CHANGES IN RIDERSHIP?
A major concern with the results presented thus far is that we do not know whether the
reduction in head injuries associated with the law arises from more children wearing helmets
when they ride bicycles, from children riding more safely in general (say by avoiding street
riding), or simply from a reduction in the number of children riding bicycles. Grant and Rutner
(2004) find no evidence of a substation to walking (as measured by pedestrian fatalities) or
driving (as measured by vehicle miles) associated with helmet laws, while Carpenter and Stehr
(2011) finds a reduction in riding among high school students as a result of the laws. We test for
such effects first by examining the effects of the laws on bicycle related injuries to other body
parts and second, by examining the effects of helmet laws on injury rates of other popular sports.
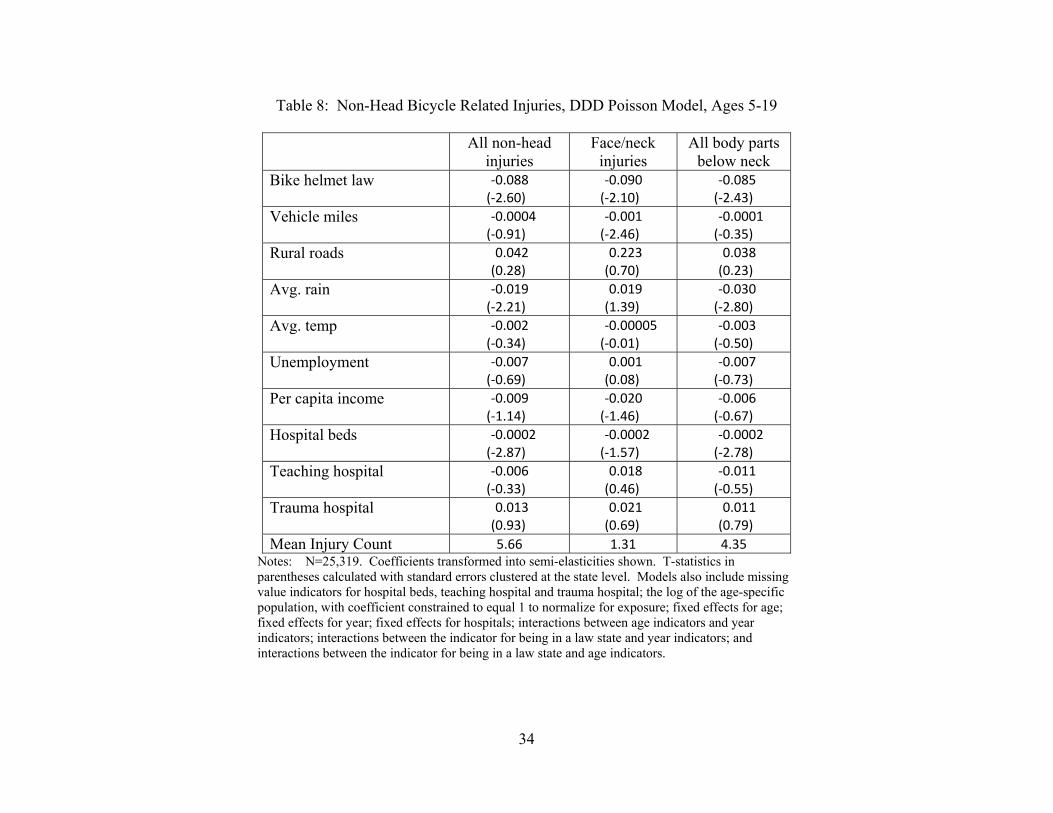
To consider the effects of the laws on non-head injuries, we generate three bicycle related
injury counts for children ages 5-19. The first is a count of all injuries to body parts other than
the head, ear, or total body. The second is a count of injuries to the face, eye, mouth and neck,
which should be most closely related to head injuries, but not preventable by a helmet. The third
is an injury count pertaining to all body parts below the neck. The results for all three injury
types are very similar. Bicycle helmet laws are associated with about a 9 percent reduction in
18
these injuries. Unfortunately, this exercise does not help answer the question since a decrease in
these injuries is consistent with both decrease ridership and safer riding practices.
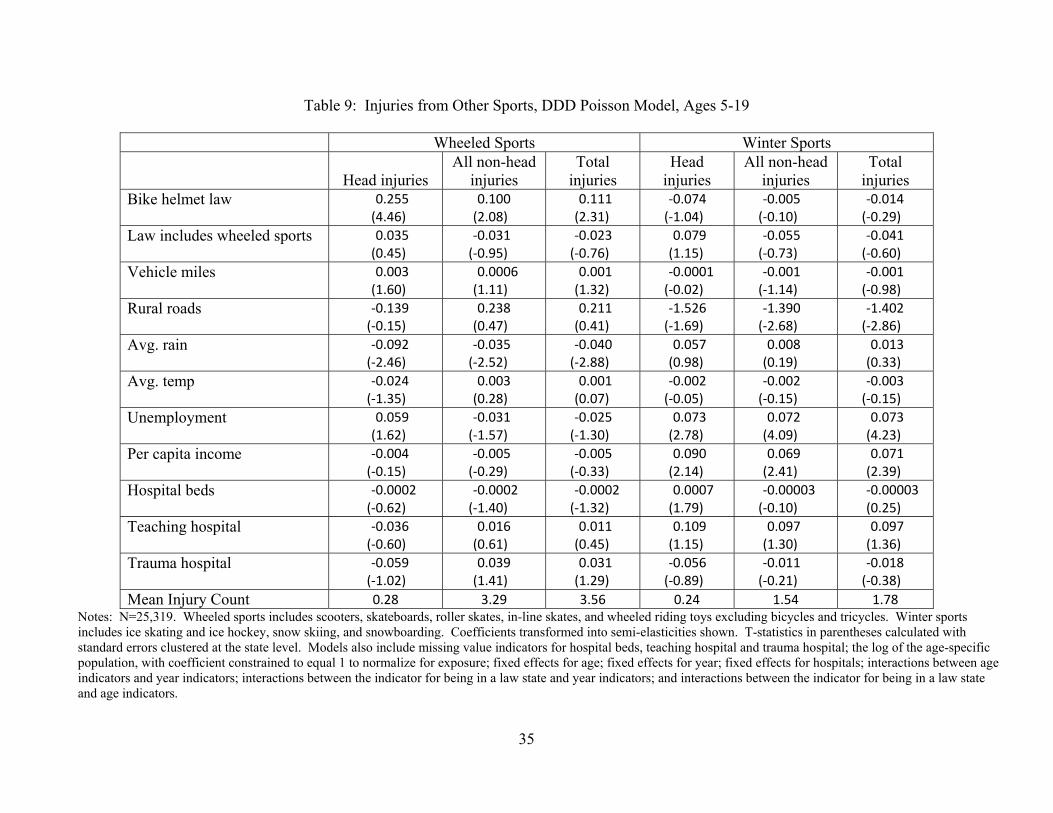
Next we consider the effects of helmet laws on injury rates of other sports. Laws for
helmets in four of the states in our sample explicitly cover other wheeled sports such as roller
skates and scooters.6 Even in the absence of these specific laws, it is possible that the bicycle
helmet laws create a norm of helmet wearing for all sports with a risk of head injury. This can
include winter sports such as skiing and ice skating in addition to the wheeled sports. In this
case, we expect to see a decrease in head injuries for these other sports. However, if the bicycle
helmet laws induce children to substitute away from bike riding toward the other sports, we may
see an increase in injuries related to these sports.
Using the NEISS data and the same process described for bicycle injuries, we generate
injury rates by age for certain wheeled and winter sports. Wheeled sports include scooters,
skateboards, roller skates, in-line skates, and wheeled riding toys excluding bicycles and
tricycles. Winter sports include ice skating and ice hockey, snow skiing, and snowboarding.
Table 1 shows the injury counts for these sports, which are far less common than bicycle injuries.
Trends in these injuries for children (not shown) show a distinct upward path over time.
The models shown in Table 9 use the preferred DDD specification that includes the
hospital fixed effects. The state helmet law indicator is defined in the same way as in the
previous tables. We then add an incremental indicator for whether the state helmet law pertains
to other wheeled sports too. We show results restricting the sample to ages 5-19; however,
results that include adults in the control group are very similar. We also show results for injuries
occurring to the head only and to all other body parts.
19
The results are striking in that the helmet laws are associated with an increase in injuries
from wheeled sports and the laws that pertain specifically to wheeled sports have no effects on
these injuries. These results are notable give that the estimates are net of national trends and net
of trends for children of similar ages in non-law states. The results for the bicycle helmet law
could be interpreted as reflecting a substitution effect away from bicycle riding towards the other
wheeled sports in response to the laws.
The results for winter sports are also shown in Table 9. Here, neither the bicycle helmet
law nor the wheeled sports helmet laws are associated with injuries for skiing and skating. This
is some evidence against a norm being generated by the helmet laws that is broadly applied to
winter sports.
DISCUSSION
In this paper, we examine the question of whether bicycle helmet laws are associated
with reductions in head injury rates among children. We consider the effects of the laws directly
on bicycle related head injuries, bicycle related non-head injuries, and injuries as a result of
participating in other wheeled sports (primarily skateboarding, roller skates and scooters).
For 5-19 year olds, we find the helmet laws are associated with a 13 percent reduction in bicycle
head injuries, but the laws are also associated with a 9 percent reduction in non-head bicycle
related injuries and an 11 percent increase in all types of injuries from the wheeled sports.
These results are checked in a variety of ways. Through variations on DDD and DD
models, we show that the estimated reduction in head injuries resulting from helmet laws is
robust to changes in the definition of the control group, to changes in the type of fixed effects
included (state versus hospital), and to changes in the samples of states and hospitals evaluated.
20
We also provide evidence of a “clean” control group, that is, one where the laws do not have
spillover effects to children of non-applicable ages.
To what do we attribute the observed changes in head and other injuries? Unfortunately,
it is difficult to identify the mechanisms at work with our data, since we cannot distinguish
between a decrease in riding versus a change in safe riding behaviors. Our results fit both
stories. That is, if the laws decrease bicycle riding we would see a decrease in both head injuries
and injuries to other body parts, which we do. If the helmet laws promote safer riding practices
in general and awareness of the risks of riding, we would also see the decrease in both head and
non-head injuries. Our evidence in support of the decrease ridership theory comes from the
observed increase in injuries in other wheeled sports that is associated with the bicycle helmet
laws. We note that Carpenter and Stehr (2011) also find some evidence of the substitution effect
using survey data on bicycle riding among high school students.
The mechanism aside, perhaps what is most important is an estimate of the total effect on
injuries associated with the helmet laws. Considering the different offsetting results, we run our
preferred specification on injury counts for 1) all head injuries and 2) total (all head and body)
injuries arising from cycling and wheeled sports. The net effects of the helmet laws are small
and are not statistically different from zero. However, they do point to a net reduction, be they
imprecisely estimated, with a 6 percent reduction in all head injuries and a 2 percent reduction in
total injuries (results not shown).
The findings from this paper indicate that while bicycle helmet laws are widespread and
thought to be effective, the net effect of these laws on health outcomes is actually not straight-
forward. It is clear that there are offsetting behaviors and unintended consequences of these

21
laws, and these effects need to be considered by policymakers.
22
Endnotes
1 A variety of analyses have shown that helmets are effective in reducing the risk of head and
facial injury, with risk reductions ranging from 47 to 88 percent (Thompson et al. 1989; Li et al.
1995; Thompson et al. 1996; Attewell et al. 2001). There is, however, a recent debate about the
efficacy of soft-shell helmets in protecting against brain injury (Curnow 2005; Hagel and Pless
2006).
2 Puder et al. (1999), for example, examine helmet usage in three counties with helmet laws
targeted at different age groups (all ages, under 14 years old and under 12 years old). Compared
to the county that mandated helmet use for all ages, the prevalence of non-use was 9 percent
higher in the under-14 county and 28 percent higher in the under-12 county. Borglund et al.
(1999) analyze helmet usage among 7 to 12 year old children (N=154) before and after the
passage of a state-level mandatory helmet law. They also find that helmet usage increased from
6 percent to 21 percent of children admitted to a trauma center for any bicycle-related injuries. It
is not clear, however, whether increased helmet usage resulted from the law, since a public
education campaign was introduced in the year before the law was enacted.
3 We considered some different options for the denominator. One is the age-specific population
of the county of the hospital, but this number may not be a fair representation of the hospital’s
population, particularly for urban areas. Another option is to use the total number of emergency
room visits for any cause as provided by the American Hospital Association. However, this data
is not age-specific. Given this, we believe the total count of NEISS cases for all consumer
products is the best available denominator.
23
4 The Poisson model is preferred to the negative binomial since the negative binomial estimates
are not consistent if the variance specification is incorrect (Cameron and Trivedi 2009).
Nevertheless, negative binomial models were tested and give similar results.
5 Rhode Island also changed its applicable age, but we do not observe any hospitals in Rhode
Island after the age change.
6 Rhode Island also has a wheeled sports law, but NEISS hospitals in Rhode Island exit the
sample before the law.
24
References
Attewell RG, Glase K, McFadden M. Bicycle helmet efficacy: a meta-analysis. Accident analysis and prevention 2001; 33: 345-352. Bicycle Helmet Safety Institute. Helmet laws for bicycle riders, http://www.helmets.org/mandator.htm, Accessed 6/10/08. Carpenter, Christopher and Mark Stehr. 2011. Intended and Unintended Consequences of Youth Bicycle Helmet Laws. Journal of Law and Economics. 54(2): 305-324. Centers for Disease Control and Prevention, 2012a. National Center for Health Statistics. Underlying Cause of Death 1999-2009 on CDC WONDER Online Database, released 2012. Centers for Disease Control and Prevention, 2012b. Nonfatal Injury Data on WISQARS. http://www.cdc.gov/injury/wisqars/nonfatal.html Consumer Product Safety Commission, National Bike Helmet Use Survey, April 1999. Consumer Product Safety Commission, Consumer Product Safety Alert: CPSC urges bicyclists to wear helmets. http://www.cpsc.gov/CPSCPUB/PUBS/5002.pdf, Accessed 5/18/12. Curnow, W.J., 2005. The Cochrane Collaboration and bicycle helmets. Accid. Anal. Prev. 37, 569–573. Grant D, Rutner SM. The effect of bicycle helmet legislation on bicycling fatalities. Journal of Policy Analysis and Management, 2004; 595-611. Hagel, B.E., Pless, I.B., 2006. A critical examination of arguments against bicycle helmet use and legislation. Accid. Anal. Prev. 38 (2), 277–278. Ji, Ming , Robert A. Gilchick, Stephen J. Bender. "Trends in helmet use and head injuries in San Diego County: The effect of bicycle helmet legislation." Accident Analysis & Prevention, Volume 38, Issue 1, January 2006, Pages 128-134 Li G, Baker SP, Fowler C, DiScala C. Factors related to the presence of head injury in bicycle-related pediatric trauma patients. The Journal of Trauma: injury, infection and critical care 1995; 38: 871-875. Macpherson AK, To TM, Macarthur C, Chipman ML, Wright JG, Parkin PC. Impact of mandatory helmet legislation on bicycle-related head injuries in children: a population-based study. Pediatrics 2002; 110(5): e50. National Highway Traffic Safety Administration (2009). Traffic Safety Facts 2009 Data Bicyclists and Other Cyclists. DOT HS 811 386.
25
National Safe Kids Campaign. A national study of traumatic brain injury and wheel-related sports. May 2002. NSGA (2012). 2010 Youth Participation in Selected Sports with Comparisons to 2001 http://www.nsga.org/files/public/2010YouthParticipationInSelectedSportsWithComparisons.pdf accessed 5/17/12 Rissel, Chris. “The impact of compulsory cycle helmet legislation on cyclist head injuries in New South Wales, Australia: A rejoinder.” Accident Analysis & Prevention, Volume 45, March 2012, Pages 107-109. Rodgers, GB. The Bicycle Study 2001. Unpublished manuscript, Consumer Product Safety Commission, http://www.cpsc.gov/CPSCPUB/PUBS/344.pdf, Accessed 5/17/12. Robinson, D.L. “Bicycle helmet legislation: Can we reach a consensus?” Accident Analysis & Prevention, Volume 39, Issue 1, January 2007, Pages 86-93. Safe Kids USA. Bicycling and Skating Safety Fact Sheet http://www.safekids.org/our-work/research/fact-sheets/bicycle-safety-fact-sheet.html Accessed 5/17/12. Scuffham, Paul, Jonathan Alsop, Colin Cryer, John D. Langley. "Head injuries to bicyclists and the New Zealand bicycle helmet law." Accident Analysis and Prevention 32 (2000) 565–573 Storo W. The role of bicycle helmets in bicycle-related injury prevention. Clinical Pediatrics 1992; 421-427. Thompson DC, Nunn ME, Thompson RS, Rivera FR. Effectiveness of bicycle safety helmets in preventing serious facial injury. JAMA 1996; 276:1974-5. Thompson RS, Rivara FP, Thompson DC. 1989. A case-control study of the effectiveness of bicycle safety helmets. The New England Journal of Medicine 21;320:1361-67. Walter, Scott R., Jake Olivier, Tim Churches, Raphael Grzebieta. "The impact of compulsory cycle helmet legislation on cyclist head injuries in New South Wales, Australia." Accident Analysis and Prevention 43 (2011) 2064– 2071.
26
0
5
10
15
20
25
1991 1992 1993 1994 1995 1996 1997 1998 1999 2000 2001 2002 2003 2004 2005 2006 2007 2008
Injury ra
te per 100
0 cases
Year
Figure 1: Bicycle Related Head Injury Rates per 1,000 NEISS Cases, by Age Group
Ages 0‐4
Ages 5‐11
Ages 12‐17
Ages 18‐19
Ages 20 and up
27
Table 1: Summary Statistics
Ages 5‐19 All ages 0‐Adult Mean Std. Dev. Min Max Mean Std. Dev. Min MaxBicycle head injury count 1.06 1.96 0 25 1.26 3.39 0 94Wheeled sports head injury count 0.28 0.70 0 11 0.28 0.76 0 18Winter sports head injury count 0.24 0.78 0 25 0.26 1.26 0 67NEISS total case count* 81.24 93.32 1 912 167.52 510.55 1 13347State helmet law 0.24 0 1 0.26 0 1Local helmet law 0.04 0 1 0.04 0 1Vehicle miles 85.25 71.92 1.16 329.27 85.24 71.94 1.16 329.27Percent rural roads 0.71 0.17 0.18 0.98 0.71 0.17 0.18 0.98Average rainfall 3.20 1.15 0.45 6.25 3.20 1.15 0.45 6.25Average temperature 53.90 7.63 36.53 72.48 53.90 7.64 36.53 72.48Unemployment rate 5.28 1.35 2.30 9.50 5.28 1.35 2.30 9.50Real per capita income in $1,000s 35.15 5.47 21.55 56.82 35.15 5.47 21.55 56.82Hospital beds 230.21 236.38 0 1603 230.13 236.44 0 1603Teaching hospital 0.35 0 1 0.35 0 1Trauma hospital 0.31 0 1 0.31 0 1Hospital beds missing 0.04 0 1 0.04 0 1Teaching hospital missing 0.03 0 1 0.03 0 1Trauma hospital missing 0.13 0 1 0.13 0 1N 25319 33745
*NEISS total case count represents the number of injuries for any consumer related product by age, hospital, and year. The minimum values reflect the fact that there are small numbers of injuries for particular ages in small hospitals.
28
Table 2: Description of Bicycle Helmet Laws, by State
State name Year law effective Age applicable
Other wheeled toys?
State name
Year law effective
Age applicable
Other wheeled toys
Alabama 1995 Under 16 Missouri No law (Alaska) (No law) Montana No law Arizona No law Nebraska No law Arkansas No law Nevada No law California 1987 Passengers under 5 New Hampshire 2006 Under 16 1994 All under 18 New Jersey 1992 Under 14 2003 All under 18 Yes 1997 Under 14 Yes Colorado No law 2005 Under 17 Yes Connecticut 1993 Under 12 (New Mexico) (No law) 1997 Under 16 New York 1989 Under 5 (Delaware) (1996) (Under 16) 1994 Under 15 Yes (2008) (Under 18) North Carolina 2001 Under 16 (District of Columbia) (2000) (Under 16) North Dakota No law Florida 1997 Under 16 Ohio No law Georgia 1993 Under 16 Oklahoma No law (Hawaii) (2001) (Under 16) Oregon 1994 Under 16 Idaho No law Pennsylvania 1991 Under 5 Illinois No law 1995 Under 12 Indiana No law Rhode Island 1996 Under 9 Iowa No law 1998 Under 16 Yes Kansas No law South Carolina No law (Kentucky) (No law) South Dakota No law Louisiana 2002 Under 12 Tennessee 1994 Under 16 (Maine) (1999) (Under 16) 2000 Under 16 Maryland 1995 Under 16 Texas No law 2001 Under 16 Yes Utah No law Massachusetts 1990 Under 5 (Vermont) (No law) 1993 Under 13 Virginia No law 2004 Under 17 Washington No law Michigan No law (West Virginia) (1996) (Under 15) Minnesota No law Wisconsin No law Mississippi No law Wyoming No law
Note: States in parentheses are not in the NEISS data.
29
Table 3: Bicycle Related Head Injuries, Poisson Models, Ages 5-19
Model 3 Way Fixed Effects DDD With Indicator for Law States
DDD With State Fixed Effects
DDD With Hospital Fixed Effects
(1) (2) (3) (4) (5) (6) (7) (8)State helmet law ‐0.176
(‐3.36) ‐0.180(‐3.73)
‐0.214(‐4.31)
‐0.214(‐4.38)
‐0.155(‐2.88)
‐0.155(‐2.83)
‐0.137(‐2.69)
‐0.136(‐2.67)
Local helmet law
‐0.127(‐1.15)
‐0.056(‐0.49)
‐0.012(‐0.06)
‐0.115(‐1.16)
Vehicle miles 0.003 (1.71)
0.003(1.69)
0.0001(0.33)
0.0001(0.23)
0.003(2.89)
0.003(2.92)
0.003(1.79)
0.003(1.80)
Rural roads ‐0.525 (‐0.83)
‐0.384(‐0.57)
‐0.020(‐0.07)
‐0.013(‐0.04)
‐0.381(‐0.54)
‐0.372(‐0.50)
‐0.518(‐0.79)
‐0.421(‐0.63)
Avg. rain ‐0.040 (‐1.35)
‐0.039(‐1.34)
‐0.039(‐1.68)
‐0.041(‐1.81)
‐0.039(‐1.10)
‐0.038(‐1.09)
‐0.033(‐0.98)
‐0.031(‐0.91)
Avg. temp ‐0.007 (‐0.77)
‐0.008(‐0.84)
‐0.006(‐1.10)
‐0.005(‐0.93)
‐0.019(‐1.40)
‐0.019(‐1.40)
‐0.010(‐1.01)
‐0.011(‐1.03)
Unemployment ‐0.010 (‐0.52)
‐0.009(‐0.47)
‐0.012(‐0.39)
‐0.012(‐0.37)
‐0.018(‐0.67)
‐0.018(‐0.68)
‐0.003(‐0.11)
‐0.004(‐0.16)
Per capita income ‐0.021 (‐0.80)
‐0.020(‐0.75)
‐0.016(‐1.27)
‐0.014(‐1.10)
‐0.017(‐0.60)
‐0.017(‐0.59)
‐0.014(‐0.49)
‐0.014(‐0.46)
Hospital beds ‐0.0002 (‐0.57)
‐0.0002(‐0.56)
‐0.0001(‐0.47)
‐0.0001(‐0.51)
0.0001(0.48)
0.0001(0.48)
‐0.0001(‐0.39)
‐0.0001(‐0.40)
Teaching hospital 0.016 (0.30)
0.006(0.12)
0.134(1.50)
0.137(1.55)
0.060(0.60)
0.060(0.62)
0.013(0.22)
0.001(0.02)
Trauma hospital ‐0.008 (‐0.16)
‐0.021(‐0.43)
0.284(3.72)
0.280(3.79)
0.274(3.72)
0.273(3.81)
‐0.006(‐0.12)
‐0.018(‐0.39)
Notes: N=25,319. Coefficients transformed into semi-elasticities shown. T-statistics in parentheses calculated with standard errors clustered at the state level. Models also include missing value indicators for hospital beds, teaching hospital and trauma hospital, and the log of the age-specific population, with coefficient constrained to equal 1 to normalize for exposure. Columns 1 and 2 include fixed effects for age, year and hospitals. Columns 3 and 4 include: fixed effects for age; fixed effects for year; an indicator for being in a law state; interactions between age indicators and year indicators; interactions between the indicator for being in a law state and year indicators; and interactions between the indicator for being in a law state and age indicators. Columns 5 and 6 include: fixed effects for age; fixed effects for year; fixed effects for states; interactions between age indicators and year indicators; interactions between the indicator for being in a law state and year indicators; and interactions between the indicator for being in a law state and age indicators. Columns 7 and 8 include: fixed effects for age; fixed effects for year; fixed effects for hospitals; interactions between age indicators and year indicators; interactions between the indicator for being in a law state and year indicators; and interactions between the indicator for being in a law state and age indicators.
30
Table 4: Bicycle Related Head Injuries, DDD Poisson Model with Hospital Fixed Effects, Varying Ages
Sample Ages 0-19 Ages 0 - adult Ages 5 - adult Control Group Children of non-applicable
ages (ages 0 to 19) Children of non-applicable
ages and adults Children of non-applicable
ages (ages 5 to 19) and adults (1) (2) (3) (4) (5) (6)State helmet law ‐0.144
(‐2.93)‐0.143(‐2.92)
‐0.197(‐4.33)
‐0.198(‐4.27)
‐0.193(‐4.04)
‐0.195(‐3.94)
Local helmet law
‐0.086(‐0.88)
‐0.330(‐1.69)
‐0.351(‐1.85)
Vehicle miles 0.003(1.83)
0.003(1.84)
0.003(1.82)
0.004(1.80)
0.003(1.77)
0.004(1.76)
Rural roads ‐0.659(‐1.03)
‐0.587(‐0.91)
‐0.976(‐1.51)
‐0.782(‐1.06)
‐0.901(‐1.37)
‐0.703(‐0.94)
Avg. rain ‐0.049(‐1.48)
‐0.048(‐1.43)
‐0.048(‐1.85)
‐0.044(‐1.60)
‐0.037(‐1.44)
‐0.032(‐1.19)
Avg. temp ‐0.013(‐1.45)
‐0.013(‐1.47)
‐0.013(‐1.58)
‐0.014(‐1.56)
‐0.012(‐1.31)
‐0.012(‐1.26)
Unemployment 0.003(0.11)
0.002(0.07)
0.013(0.63)
0.011(0.48)
0.012(0.55)
0.010(0.40)
Per capita income ‐0.018(‐0.64)
‐0.017(‐0.61)
‐0.0004(‐0.02)
0.002(0.07)
0.004(0.14)
0.006(0.21)
Hospital beds ‐0.0002(‐0.56)
‐0.0002(‐0.57)
‐0.0003(‐1.19)
‐0.0004(‐1.31)
‐0.0004(‐1.12)
‐0.0004(‐1.24)
Teaching hospital 0.018(0.36)
0.009(0.19)
0.013(0.24)
‐0.013(‐0.23)
0.008(0.15)
‐0.019(‐0.33)
Trauma hospital ‐0.004(‐0.09)
‐0.013(‐0.30)
‐0.015(‐0.38)
‐0.051(‐1.10)
‐0.018(‐0.44)
‐0.054(‐1.15)
N 32043 33745 27021Mean Injury Count 0.98 1.26 1.41
Notes: Coefficients transformed into semi-elasticities shown. T-statistics in parentheses calculated with standard errors clustered at the state level. Models also include missing value indicators for hospital beds, teaching hospital and trauma hospital; the log of the age-specific population, with coefficient constrained to equal 1 to normalize for exposure; fixed effects for age; fixed effects for year; fixed effects for hospitals; interactions between age indicators and year indicators; interactions between the indicator for being in a law state and year indicators; and interactions between the indicator for being in a law state and age indicators.
31
Table 5: Bicycle Related Head Injuries, DD Poisson Models, Law States Only
Sample Ages 0 to 19 Ages 5-19 Ages 0 - adult Ages 5 - adult Control Group Children of non-applicable
ages (ages 0 to 19) Children of non-applicable
ages (ages 5 to 19) Children of non-applicable
ages and adults Children of non-applicable
ages (ages 5 to 19) and adults
State helmet law ‐0.168 (‐3.54)
‐0.166(‐3.51)
‐0.175(‐3.69)
‐0.173(‐3.67)
‐0.250(‐5.34)
‐0.247(‐5.23)
‐0.259(‐5.20)
‐0.256(‐5.06)
Local helmet law
‐0.221(‐2.46)
‐0.239(‐2.50)
‐0.186(‐1.34)
‐0.212(‐1.64)
Vehicle miles 0.002 (1.37)
0.002(1.36)
0.002(1.28)
0.002(1.27)
0.003(1.50)
0.003(1.48)
0.003(1.44)
0.003(1.43)
Rural roads ‐1.373 (‐2.53)
‐1.267(‐2.30)
‐1.318(‐2.27)
‐1.196(‐2.06)
‐1.899(‐2.87)
‐1.841(‐2.61)
‐1.903(‐2.97)
‐1.838(‐2.68)
Avg. rain ‐0.056 (‐1.23)
‐0.053(‐1.16)
‐0.048(‐1.10)
‐0.045(‐1.02)
‐0.061(‐1.91)
‐0.059(‐1.86)
‐0.056(‐1.92)
‐0.054(‐1.85)
Avg. temp ‐0.008 (‐0.51)
‐0.009(‐0.55)
‐0.0002(‐0.01)
‐0.001(‐0.07)
‐0.003(‐0.16)
‐0.004(‐0.19)
0.003(0.13)
0.002(0.10)
Unemployment ‐0.030 (‐0.71)
‐0.037(‐0.90)
‐0.035(‐0.77)
‐0.043(‐0.96)
‐0.003(‐0.06)
‐0.007(‐0.17)
‐0.003(‐0.07)
‐0.008(‐0.19)
Per capita income ‐0.049 (‐1.37)
‐0.049(‐1.37)
‐0.047(‐1.23)
‐0.047(‐1.23)
‐0.030(‐0.97)
‐0.031(‐0.98)
‐0.027(‐0.84)
‐0.0276(‐0.85)
Hospital beds ‐0.0002 (‐0.76)
‐0.0002(‐0.71)
‐0.0002(‐0.66)
‐0.0002(‐0.61)
‐0.0005(‐1.54)
‐0.0005(‐1.52)
‐0.0005(‐1.49)
‐0.0005(‐1.47)
Teaching hospital ‐0.060 (‐0.67)
‐0.102(‐1.16)
‐0.058(‐0.54)
‐0.105(‐1.04)
‐0.077(‐0.93)
‐0.100(‐1.15)
‐0.076(‐0.86)
‐0.101(‐1.13)
Trauma hospital ‐0.072 (‐1.25)
‐0.064(‐1.19)
‐0.101(‐1.64)
‐0.091(‐1.60)
‐0.066(‐1.23)
‐0.062(‐1.22)
‐0.090(‐1.58)
‐0.085(‐1.61)
N 14823 14823 11721 11721 15613 15613 12511 12511Notes: Coefficients transformed into semi-elasticities shown. T-statistics in parentheses calculated with standard errors clustered at the state level. Models also include: missing value indicators for hospital beds, teaching hospital and trauma hospital; fixed effects for age, year and hospital; the log of the age-specific population on the right hand side, with coefficient constrained to equal 1 to normalize for exposure.
32
Table 6: Bicycle Related Head Injuries, Two Group, Two Period DD Poisson Models, Law States Only
Treatment Group Children ages 5 and up of applicable ages
Children ages 5 and up of applicable ages
Children ages 5 and up of applicable age and 1 and 2
years younger
Children ages 5 and up of applicable ages
Control Group Teens ages 18 and 19 Children 1, 2 or 3 years above applicable age
Children 1, 2 or 3 years above applicable age
Adults
Law age (relevant for 3
states that change applicable ages during sample)
Lowest age
Highest age
Problem states
deleted
Lowest age
Highest age
Problem states
deleted
Lowest age
Highestage
Problem states
deleted
Lowest age
Highestage
Problem states
deleted
(1) (2) (3) (4) (5) (6) (7) (8) (9) (10) (11) (12)Treatment post period
‐0.373 (‐2.73)
‐0.234 (‐1.76)
‐0.311(‐2.35)
‐0.252(‐3.14)
‐0.185(‐2.32)
‐0.211(‐3.12)
‐0.207 (‐2.64)
‐0.161(‐2.94)
‐0.184(‐2.92)
‐0.393(‐4.59)
‐0.335(‐2.85)
‐0.391(‐3.68)
Non-treatment post period
0.091 (0.42)
0.083 (0.42)
0.109(0.53)
‐0.127(‐1.15)
‐0.005(‐0.03)
‐0.063(‐0.55)
‐0.064 (‐0.44)
0.212(0.66)
0.282(0.87)
‐0.035(‐0.26)
0.061(0.32)
‐0.069(‐0.41)
Treatment pre period
3.055 (5.79)
2.366 (7.39)
2.946(5.58)
1.063(4.05)
0.997(4.82)
1.069(3.85)
0.639 (3.57)
0.621(4.35)
0.648(3.42)
4.915(13.08)
4.278(15.51)
4.836(12.48)
N 228 228 203 228 228 203 228 228 203 228 228 203Notes: Coefficients transformed into semi-elasticities shown. T-statistics in parentheses calculated with standard errors clustered at the state level. Models also include: missing value indicators for hospital beds, teaching hospital and trauma hospital; fixed effects for hospital; the log of the age-specific population on the right hand side, with coefficient constrained to equal 1 to normalize for exposure.
33
Table 7: Bicycle Related Head Injuries, DDD Poisson Models, Ages 5-19 Sample restricted to Medium and Large Hospitals and Children’s Hospitals
Hospital Size Medium, Large, Very
Large and Children’s Large, Very Large and
Children’s State helmet law ‐0.143
(‐2.60)‐0.142(‐2.59)
‐0.116(‐1.99)
‐0.115(‐1.96)
Local helmet law
‐0.113(‐1.14)
‐0.101(‐0.99)
Vehicle miles 0.003(1.75)
0.003(1.74)
0.003(2.02)
0.003(2.05)
Rural roads ‐0.467(‐0.64)
‐0.349(‐0.46)
‐0.509(‐0.56)
‐0.324(‐0.34)
Avg. rain ‐0.029(‐0.74)
‐0.027(‐0.68)
‐0.030(‐0.68)
‐0.026(‐0.60)
Avg. temp ‐0.015(‐1.32)
‐0.015(‐1.32)
‐0.010(‐0.57)
‐0.011(‐0.67)
Unemployment 0.018(0.60)
0.017(0.56)
0.036(1.00)
0.037(0.98)
Per capita income ‐0.015(‐0.44)
‐0.014(‐0.41)
‐0.003(‐0.08)
‐0.002(‐0.05)
Hospital beds ‐0.0002(‐0.51)
‐0.0002(‐0.53)
‐0.0002(‐0.71)
‐0.0002(‐0.74)
Teaching hospital 0.007(0.11)
‐0.007(‐0.12)
0.015(0.24)
0.003(0.04)
Trauma hospital ‐0.028(‐0.55)
‐0.042(‐0.81)
‐0.058(‐0.97)
‐0.070(‐1.17)
N 14058 10000Mean Injury Count 1.68 2.02
Notes: Coefficients transformed into semi-elasticities shown. T-statistics in parentheses calculated with standard errors clustered at the state level. Models also include missing value indicators for hospital beds, teaching hospital and trauma hospital; the log of the age-specific population, with coefficient constrained to equal 1 to normalize for exposure; fixed effects for age; fixed effects for year; fixed effects for hospitals; interactions between age indicators and year indicators; interactions between the indicator for being in a law state and year indicators; and interactions between the indicator for being in a law state and age indicators. Hospital size based on emergency room visits as defined by NEISS.
34
Table 8: Non-Head Bicycle Related Injuries, DDD Poisson Model, Ages 5-19
All non-head injuries
Face/neck injuries
All body parts below neck
Bike helmet law ‐0.088(‐2.60)
‐0.090 (‐2.10)
‐0.085(‐2.43)
Vehicle miles ‐0.0004(‐0.91)
‐0.001 (‐2.46)
‐0.0001(‐0.35)
Rural roads 0.042(0.28)
0.223 (0.70)
0.038(0.23)
Avg. rain ‐0.019(‐2.21)
0.019 (1.39)
‐0.030(‐2.80)
Avg. temp ‐0.002(‐0.34)
‐0.00005(‐0.01)
‐0.003(‐0.50)
Unemployment ‐0.007(‐0.69)
0.001 (0.08)
‐0.007(‐0.73)
Per capita income ‐0.009(‐1.14)
‐0.020 (‐1.46)
‐0.006(‐0.67)
Hospital beds ‐0.0002(‐2.87)
‐0.0002 (‐1.57)
‐0.0002(‐2.78)
Teaching hospital ‐0.006(‐0.33)
0.018 (0.46)
‐0.011(‐0.55)
Trauma hospital 0.013(0.93)
0.021 (0.69)
0.011(0.79)
Mean Injury Count 5.66 1.31 4.35Notes: N=25,319. Coefficients transformed into semi-elasticities shown. T-statistics in parentheses calculated with standard errors clustered at the state level. Models also include missing value indicators for hospital beds, teaching hospital and trauma hospital; the log of the age-specific population, with coefficient constrained to equal 1 to normalize for exposure; fixed effects for age; fixed effects for year; fixed effects for hospitals; interactions between age indicators and year indicators; interactions between the indicator for being in a law state and year indicators; and interactions between the indicator for being in a law state and age indicators.
35
Table 9: Injuries from Other Sports, DDD Poisson Model, Ages 5-19
Wheeled Sports Winter Sports
Head injuries All non-head
injuries Total
injuries Head
injuries All non-head
injuries Total
injuries Bike helmet law 0.255
(4.46)0.100(2.08)
0.111 (2.31)
‐0.074(‐1.04)
‐0.005(‐0.10)
‐0.014(‐0.29)
Law includes wheeled sports 0.035(0.45)
‐0.031(‐0.95)
‐0.023 (‐0.76)
0.079(1.15)
‐0.055(‐0.73)
‐0.041(‐0.60)
Vehicle miles 0.003(1.60)
0.0006(1.11)
0.001 (1.32)
‐0.0001(‐0.02)
‐0.001(‐1.14)
‐0.001(‐0.98)
Rural roads ‐0.139(‐0.15)
0.238(0.47)
0.211 (0.41)
‐1.526(‐1.69)
‐1.390(‐2.68)
‐1.402(‐2.86)
Avg. rain ‐0.092(‐2.46)
‐0.035(‐2.52)
‐0.040 (‐2.88)
0.057(0.98)
0.008(0.19)
0.013(0.33)
Avg. temp ‐0.024(‐1.35)
0.003(0.28)
0.001 (0.07)
‐0.002(‐0.05)
‐0.002(‐0.15)
‐0.003(‐0.15)
Unemployment 0.059(1.62)
‐0.031(‐1.57)
‐0.025 (‐1.30)
0.073(2.78)
0.072(4.09)
0.073(4.23)
Per capita income ‐0.004(‐0.15)
‐0.005(‐0.29)
‐0.005 (‐0.33)
0.090(2.14)
0.069(2.41)
0.071(2.39)
Hospital beds ‐0.0002(‐0.62)
‐0.0002(‐1.40)
‐0.0002 (‐1.32)
0.0007(1.79)
‐0.00003(‐0.10)
‐0.00003(0.25)
Teaching hospital ‐0.036(‐0.60)
0.016(0.61)
0.011 (0.45)
0.109(1.15)
0.097(1.30)
0.097(1.36)
Trauma hospital ‐0.059(‐1.02)
0.039(1.41)
0.031 (1.29)
‐0.056(‐0.89)
‐0.011(‐0.21)
‐0.018(‐0.38)
Mean Injury Count 0.28 3.29 3.56 0.24 1.54 1.78Notes: N=25,319. Wheeled sports includes scooters, skateboards, roller skates, in-line skates, and wheeled riding toys excluding bicycles and tricycles. Winter sports includes ice skating and ice hockey, snow skiing, and snowboarding. Coefficients transformed into semi-elasticities shown. T-statistics in parentheses calculated with standard errors clustered at the state level. Models also include missing value indicators for hospital beds, teaching hospital and trauma hospital; the log of the age-specific population, with coefficient constrained to equal 1 to normalize for exposure; fixed effects for age; fixed effects for year; fixed effects for hospitals; interactions between age indicators and year indicators; interactions between the indicator for being in a law state and year indicators; and interactions between the indicator for being in a law state and age indicators.