Embed Size (px)
Citation preview
TRANSPORTATION RESEARCH RECORD 1114
Effects of Chevrons, Post-Mounted Delineators, and Raised Pavement Markers on Driver Behavior at Roadway Curves
PAUL ZADOR, HOWARD s. STEIN, PAUL WRIGHT, AND JEROME HALL
Previous research has shown that In single-vehicle crashes drivers tend to run off the road In the direction opposite the curve; that Is, they miss the curve. Examined In this study are the short- and long-term effects of commonly used curve delineation treatments on the speed and placement of vehicles traveling on curves on rural two-lane highways Jn Georgia (46 sites) and New Mexico (5 sites). Vehicle speed and placement distributions at sites modified with the addition of chevrons, post-mounted dellneators, and raised pavement markers and unmodified control sites were compared In terms of 10th percentile, 90th percentile, mean values, and standard deviations before and after modification. The modifications tended to shift the nighttime speed distributions upward, with an average speed Increase of I to 3 ft/sec; however, In Georgia, chevrons had little effect on speed. Overall, when chevron signs were used at night, vehicles moved away from the centerline; they moved farther away when raised pavement markers were used. In contrast, when post-mounted delineators were used, vehicles moved toward the centerline. Vehicle speed and placement varlabl.llty were also slightly reduced with the use of chevrons and raised pavement markers. There was little change in the typical driver curve-following behaviors of corner cutting on curve lengthening. Few of the changes varied systemically by curve alignment or grade, and there was little evidence that short-term changes eroded over time. Although drivers did change their behavior in response to the delineation modifications, there was no clear evidence that any one of the devices is superior to the others. The primary benefit of clearly delineating curves may simply be that it helps drivers better recognize that they are approaching a curve.
Research has shown that roadway cuIVes are often a factor in vehicle crashes, especially on rural roads (1-3 ). During 1983, more than 25 percent of fatal highway crashes occurred on cuIVes, and 40 percent of these crashes were also on grades (4). Detailed, analyses of single-vehicle crash sites show that vehicles most commonly leave the roadway on the outside of the curve; that is particularly true for left curves (1-3, 5). CuIVes on roadways have also been shown to be more hazardous for drivers who are unfamiliar with the route (5).
The most common technique used in attempting to reduce crashes on curves is to improve delineation of the roadway with roadway markings of signs. A survey of state highway agencies revealed that chevron signs, raised pavement markers, post-
P. Zador and H. S. Stein, Insurance Institute for Highway Safety, Watergate 600, Suite 300, Washington, D.C. 20037. P. Wright, School of Engineering, Georgia Institute of Technology, Atlanta, Ga. 30332. J. Hall, Bureau of Engineering Research, University of New Mexico, Albuquerque, N.Mex. 87131.
mounted delineators, and curve warning signs are the countermeasures most often used and judged most effective in reducing crashes (although there has been little documentation of their actual effect) (6). Improving roadway delineation is also strongly supported by the U.S. Department of Transportation, which has allocated several hundred million dollars for these activities over the last decade (7).
The choice of specific countermeasures at a given site should to the extent possible be guided by scientific evidence of their expected effects on crashes as well as by engineering considerations of implementation and cost. These effects could vary with road geometry and design. Because crash studies for comparing delineation modifications while controlling for other factors are time consuming and expensive, the effects of delineation modifications are more often studied in relation to the change in driver behavior they produce.
PREVIOUS RESEARCH
Before reviewing studies of driver performance with supplemental delineation systems, it is important to understand how drivers typically negotiate curves. Most drivers do not steer a circular path following the cuIVe's radius. They tend to steer a straighter path flattening the curve until, at some point, they must steer a path that turns more sharply than the actual roadway curve (8-10). This driving behavior is termed curve "lengthening." Because the actual path that drivers follow in negotiating cuIVes is not the center of the lane, they may exceed the speed and side friction limitations for which the roadway cuIVe was designed. If this occurs at the same point along the cuIVe where the curvature of the driver's path is sharper than the roadway curvature, the vehicle will begin to slide laterally on the road The question of whether curve delineation should accommodate curve lengthening or influence drivers to follow a more circular path around curves has not been satisfactorily answered. However, most researchers have interpreted a decrease in the variability in vehicle speed and lateral position to be a major benefit of improved curve delineation (11-13).
Research on the effects of delineation modification on roadway cuIVes has concentrated on studies of factors in driver perception and visibility and driver behavior. Studies of driver visibility requirements and perception of curved roadway sections have typically involved either driver simulations or driver evaluations of static pictures of cuIVes. These studies revealed that as the range of driver visibility decreases, delineation
2
becomes more important (14). Also, several studies revealed that drivers have more troubie perceiving information about left curves compared with right curves (15-18).
Other studies have examined the effect of both novel and conventional roadway delineation treatments on actual driving performance. Some studies of novel treatments have shown that painted markings that create an optical illusion of either increasing speed or roadway narrowing can affect driver performance and reduce crashes (19-21 ). However, painted markings can wear rapidly and their visibility is diminished during rain. Consequently, use of these novel markings is limited.
The Federal Highway Administration (FHWA) conducted a large field evaluation of conventional and modified delineation systems, including painted centerlines and edgelines and supplemental systems such as raised pavement markers and postmounted delineators (12). The first phase of this study evaluated driver performance at 10 curves without supplemental delineation. Vehicle placement, relative to the centerline, was measured at three points: the straightaway before the curve, the beginning of the curve, and the midpoint of the curve. Vehicle placement did not vary at the beginning of the curve compared with the straightaway, but it was significantly different at the midpoint compared with the beginning of the curve. On lefttuming curves, vehicles were closer to the centerline at the curve midpoint; on right-turning curves, they were closer to the edgeline at the midpoint. Both of these behaviors are driver curve-flattening strategies.
In the second phase of the study, the speed and placement of vehicles were measured at several points along four curve sections and several tangent sections. Each section had several variations of delineation treatments. Traffic was observed at each section several days after the modifications. Nighttime midcurv~ speeds of vehicles traveling in both directions were lower with supplemental delineation using raised pavement markers and post-mounted delineators separately and in combination. The speeds were significantly lower (2.1 to 3. 7 ft/sec) for left-turning vehicles for all the delineation modifications. Nighttime vehicle placement changes were almost always toward the edgeline for vehicles traveling in either direction. The changes were significant for raised pavement markers (and raised pavement markers in combination with post-mounted delineators), and they were larger for left-turning vehicles (0.3 to 1.1 ft). The standard deviation of vehicle placement was significantly less for three of the four supplemental delineation modifications for left-turning vehicles (0.29 to 0.16 ft/sec). The study recommended the use of raised pavement markers over post-mounted delineators on high-hazard curves because the raised pavement markers serve as both far and near delineation. It also encouraged the use of one-way raised pavement marker systems and multicolor directional coding of raised pavement markers.
Two other studies of driver performance evaluated the effects of chevron signs, different types of post-mounted delineators, and raised pavement markers; both concluded that driver performance on sharp curves was the most favorable when chevrons were used. In the first study, 36 drivers traveled a closed test track at night that had varying delineation modifications (edgelines, raised pavement markers, post-mounted delineators, and chevron signs) (8). (The study was performed in Australia and drivers were on the left side of the road.) This study revealed that with chevrons drivers followed a better path
TRANSPORTATION RESEARCH RECORD 1114
around the curve (defined in terms of the ratio of the vehicle's instantaneous radius to the actual curve radius). It also revealed that drivers used a comer-cutting strategy and that chevron signs and post-mounted delineators, to some degree, facilitated this strategy. On right curves with chevrons, drivers had an average midcurve placement closest to the centerline. On left curves with chevrons, vehicle placement was not significantly different. However, with post-mounted delineators (both sides of roadway) drivers were closest to the centerline, which is contrary to the comer-cutting strategy. Higher mean vehicle speeds were found with chevrons (with and without edgelines) than with other delineations; for example, the mean speed with chevrons and no edgelines was 66 ft/sec compared with 58 ft/ sec with post-mounted delineators. However, with chevrons mean nighttime speeds were not faster than daytime speeds.
The second study evaluated several types of curve delineation (chevrons, road edge delineators, and special, large striped road edge delineators) placed at five left curves in Virginia (22). Speed and vehicle placement were measured at the beginning and middle of the curve. The data showed drivers were using a comer-cutting strategy, with an average 0.63-ft-difference between vehicle placement at the beginning of undelineated curves compared with the middle of these curves. The data also showed an increase in possible centerline encroachments with all of the delineation types. Although the study recommended the use of chevron signs for sharp curves, closer examination of the data indicates that it is very difficult to identify consistent differences in nighttime driver speed and placement responses to the three types of delineation.
The most important factor in evaluating delineation modifications, regardless of changes in driver behavior, is their effect on crashes. Many studies have revealed reductions in crashes and lower crash rates for roadways and curves with supplemental delineation systems (23-27). However, these studies do not provide conclusive evidence of the claimed benefits because most were cross-sectional analyses and did not properly control for other factors that influence crashes such as differences in roadway design (curvature and grade) and traffic volume.
The objective of the present study was to compare changes in curve-following behavior by drivers caused by the three most common types of curve delineation devices: chevron signs, post-mounted delineators, and raised pavement markers. These devices were independently installed at curves that varied systematically in direction and degree of curvature and in steepness of grade. Prev:ious studies have not evaluated whether the effectiveness of these devices differs by curve geometry and direction. A traffic data recorder collected vehicle speed and position data at two points along each curve section both before and after the installation of these devices. Changes in driver behavior were compared for the sites modified with the three types of delineation devices and a matched set of unmodified sites observed during similar time periods.
METHODS
Rural roadway sites were modified by Georgia and New Mexico Department of Transportation personnel following procedures in the Manual on Uniform Traffic Control Devices regarding the type, size, location, and spacing of the supple-
Zador et al.
mental delineation (28). Specific procedures used for modifying the sites with the three types of delineation are described next. All sites, including the comparison sites, had edge-line markings.
Raised pavement markers. Standard 4 x 4-in. amber Stimsonite markers were installed at the selected sites on both sides of the double yellow centerlines. Reflectorized Type 1 markers, visible to both directions of traffic, were installed with two-part epoxy in a sloped 52-in.-groove (26 in. long in each direction) so that the top of the marker was flush with the original surface. The markers were usually spaced 80 ft apart; along the sharper curves, where at least three markers could not be seen at one time, they were spaced 40 ft apart. The markers were installed throughout the length of the curve. The typical cost to modify a site was approximately $250.
Post-mounted delineators. Standard 3-in.-diameter round, white Stimsonite delineators were installed on metal posts along the outside of the curves. The delineators were installed on both sides of the posts in order to be visible to drivers traveling in both directions. The delineators were placed approximately 4 ft above the near roadway edge and 7 ft away from the edge of the pavement. Where shoulders were less than 7 ft wide, the delineators were placed as close as practicable to the shoulder edge. The delineators were spaced so that drivers would see at least three delineators simultaneously. The typical cost to modify a site was approximately $200.
Chevron signs. Standard 18 x 24-in. chevron alignment signs were placed along the outside of the curves in order to be visible to drivers traveling in both directions. The signs were positioned so that motorists would always have at least three in view. The signs were offset 7 ft away from the pavement or as close as practicable to the shoulder edge when the shoulder was less than 7 ft wide and were mounted at a height of approx -imately 7 ft. The typical cost to modify a site was $300 to $400.
Traffic Data Recorder
A special traffic data recorder (TDR) was constructed by the University of New Mexico Engineering Research Institute to measure the speed and placement of vehicles as they traveled along the road. The TDR consisted of an arrangement of electronic tapeswitches on the roadway and a Rockwell · AIM-65 microprocessor with a printer that interpreted and printed the actuations of the tapeswitches. The first tapeswitch (spanning the road in the direction of travel) alerted the TDR of an approaching vehicle and counted the total traffic in both directions. The next two tapeswitches were placed a fixed distance apart to serve as a "trap" for measuring vehicle speed. Once the speed was known, the placement of the vehicle's right front tire could be computed from a fourth tapeswitch placed at a 45 degree angle to the second and third tapeswitches. Vehicle position, speed, and placement, and the time of the vehicle and traffic counts were printed onto a paper tape after the vehicle cleared all the tapeswitches.
Preliminary testing of the TDR by placing it at several points along a curve indicated that, at about 100 ft before the beginning of the curve, drivers had yet to begin adjusting for the upcoming curve. Over the next 200 ft most of the change in placement occurs and the vehicle path is defined. Several studies have examined the speed and placement of vehicles at the center of the curve; however, because drivers tend to flatten
3
out curves, the major effects of the different delineation treatments might be to influence the initial adjustments drivers make when they begin to negotiate the curve. Therefore, two TDRs were set up for each day/night observation period; one 100 ft before the beginning of the curve and one 100 ft after the beginning of the curve.
Only vehicles that were isolated from all other traffic, either following or oncoming, for at least 2.5 sec were analyzed in t this study. At 70 ft/sec, the approximate average speed encountered in the study, the measurement error for an individual vehicle had a standard deviation of about 1.3 percent or 0.9 ft/ sec. Thus, the standard deviation for an average speed based on 100 individual measurements was about 0.1 ft/sec. The comparable figure for the standard deviation of an average placement was about 0.01 ft.
Experimental Design
There were 46 observation sites in Georgia and 5 in New Mexico. All sites were located on two-lane rural highways. The sites in Georgia represented a nearly complete factorial design with four factors: modification (M), direction of turn (T), vertical alignment (G), and sharpness of curve (C). (Two sites had to be eliminated from the analyses because of modifications that were not part of the experiment.) There were four levels of treatment (control, chevron, post-mounted delineator, and raised pavement marker), two directions of turn (left and right), three types of vertical alignment (grade< -2 percent or down, -2 percent$ grade$ 2 percent or level, and 2 percent< grade or up), and two levels of sharpness of curve (less sharp or more sharp within the grade and turn class). Because only a small number of sites in New Mexico were available for experimentation, only chevrons were tested.
The roadway characteristics of these sites by direction of curve and modification type are given in Table 1. The data indicate that there were some differences in the physical layout of the roadways. For example, the average of the superelevation rates at the unmodified left curves was about one-half of the average rates at the modified sites. The average speed limits
TABLE 1 AVERAGE ROADWAY CHARACTERISTICS OF GEORGIA SITES BY MODIFICATION TYPE AND DIRECTION OF CURVE
Super-Lane Shoulder elevation Speed Width Width at Curve Limit
Modification (ft) (ft) (%) (mph)
(a)Left Curves No modification 11.8 9.1 2.5 52 Chevron signs 12.2 11.4 5.2 51 Post-mounted
delineators 11.9 9.0 6.4 45 Raised pavement
markers 11.8 7.5 4.8 48 (b)Right Curves
No modification 12.2 14.8 4.9 53 Chevron signs 12.0 10.1 5.3 51 Post-mounted
delineators 12.3 6.4 6.9 53 Raised pavement
markers 12.2 11.7 5.3 52
4
varied by about 14 percent for left curves and 4 percent for right curves. In addition, the sites with chevrons and raised pavement markers had the fewest curve warning signs on the approach to the curve, whereas only one unmodified site was without any type of signing (e.g., curve warning, speed limit). These relatively minor differences are unlikely to influence the before-and-after comparisons of the modification effects.
Observations were taken at each modified and control site shortly before and shortly after (several weeks) the modifications were put in place. To determine the long-term effects of the modifications, a third set of observations were taken approximately 6 months after the modifications at about one-third of the Georgia sites and at all New Mexico sites. During each of the three observation periods, data were recorded for about 100 to 150 vehicles during the day and for a similar number of vehicles at night (defined as the time of sunset).
Statistical Analysis
The effects of the modifications on curve-following behavior were investigated using seven variables:
VJ = approach speed, measured 100 ft upstream from the beginning of the curve, ft/sec;
V2 curve speed, measured 100 ft downstream from the beginning of the curve, ft/sec;
DJ = vehicle placement 100 ft upstream from curve, distance from centerline of road to right wheel of vehicle measured in conjunction with VJ, ft;
D2 = same as DJ but measured in conjunction with V2, ft;
DE = estimated deceleration, computed as (V22 -
VJ2)/400, ft/se~:.2;
D = average placement, computed as (D2 + DJ)/2, ft; and
D change in placement between the two traps, computed as (D2 - DJ).
TRANSPORTATION RESEARCH RECORD 1114
The distribution of each of the variables was summarized using four statistics: mean, standard deviation, 10th percentile, and 90th percentile. These statistics were estimated for day and night data separately by site and period of observation.
Changes in these statistics before modification compared with the first period after modification were analyzed using the general linear model (OLM) procedure developed by the SAS Institute (29). The same model was used to analyze changes in all of the variables. In this model, the dependent variable, for example, the average approach speed (MVl), was represented in terms of main effects for modification (M), tum direction (D, vertical alignment (G), sharpness of curve (C), and the interactions of T, G, and C with the modification factor (M):
MV1,,.,8c =A + Bm + C1 + D8 +Ee + F,,., + Gm8 + Hmc
+ Error,,.,8c
where
m = 0 for no modification, = 1 for chevrons,
2 for post-mounted delineators, 3 for raised pavement markers;
I = 1 for left curves, 2 for right curves;
g 1 for downhill grades, = 2 for level grades, = 3 for uphill grades; and
c = 1 for less sharp curves, = 2 for more sharp curves.
The short-term modification effects due to chevrons in New Mexico were tested for statistical significance by using a I-test for comparing the changes between corresponding before-modification and after-modification site averages. This method of paired I-tests was also used to compare short-term and longer effects by modification groups in both Georgia and New Mexico.
TABLE2 AVERAGE NIGIITTIME SPEED AND PLACEMENT VALUES BEFORE MODIFICATION, BY SITE CHARACTERISTICS
Vehicle Speed (ft/sec) Vehicle Placement (ft)
100 ft Before Curve 100 ft Into Curve 100 ft Before Curve 100 ft Into Curve
VI SD V2 SD DI SD D2 SD
(a) By Modification Type
No modification (N=I2) 76.5 4.0 74.I 4.3 7.4 1.1 8.0 1.0 Chevrons, Ga. (N=lO) 70.9 5.2 69.I 5.6 7.8 0.8 7.8 1.3 Chevrons, N. Mex. (N=5) 73.6 5.3 71.9 6.0 7.9 1.3 7.6 2.4 Post-mounted delineator (N=I2) 74.0 4.8 71.5 5.2 7.4 1.0 7.8 1.0 Raised pavement markers (N=I2) 72.2 7.7 69.4 9.2 7.5 0.9 7.6 1.0
(b) By Grade
Uphill (N=I5) 73.0 5.6 69.9 6.8 7.5 0.7 8.0 1.2 Level (N=I9) 73.7 5.9 71.6 5.9 7.6 0.9 8.0 1.3 Downhill (N=I7) 73.7 6.0 71.9 6.8 7.6 1.2 7.4 1.1
(c) By Curvature (Georgia data only)
Left-Moderate (N=I2) 75.5 5.4 73.I 5.8 8.I 0.6 7.4 0.7 Left-Sharp (N=ll) 72.8 6.I 70.6 7.2 8.I 0.6 6.7 1.2 Right-Moderate (N=ll) 76.0 3.8 73.8 4.2 7.0 0.7 8.4 0.7 Right-Sharp (N=I2) 70.I 6.4 67.2 7.3 6.7 0.8 8.2 0.9
Norn: SD = standard deviation.
Zador et al.
RESULTS
Initial Vehicle Speed and Placement
Speed and placement observations for Vl, V2, Dl, and D2 are summarized before modification for the night data given in Table 2. All values in this table are based on the average values of the variables for the sites. Both the average speed and the average vehicle placement varied relatively little among the different modification groups (Table 2a). The range for approach speed was from 70.9 ft/sec to 76.5 ft/sec and for curve speed from 69.1 ft/sec to 74.1 ft/sec. For all modification groups, the curve speeds were a few feet per second below the approach speeds. Average vehicle placements ranged from 7.4 ft to 7.9 ft at the first speed trap and from 7.6 ft to 8.0 ft at the second trap.
The average speed and placement at the first trap varied little by grade (Table 2b). However, at the second trap, 100 ft into the curve, the average speeds were more than 1 ft/sec lower at uphill curves than at level or downhill grades, and vehicles moved away from the centerline by about 0.5 ft between the two traps at uphill and at level curves but drew closer to the centerline by 0.2 ft at downhill curves.
For both left and right curves and at both speed traps, sharper curves had lower average speeds than less sharp curves. The average differences were about 3 ft/sec for left curves and about 6 ft/sec for right curves (Table 2c). The average vehicle placement relative to the centerline was reduced by about 1 ft for left curves and increased by about 1.4 ft for right curves, which indicates a considerable amount of comer cutting or curve flattening among drivers.
Short-Term Effects of Roadway Delineation Modification-Georgia Data
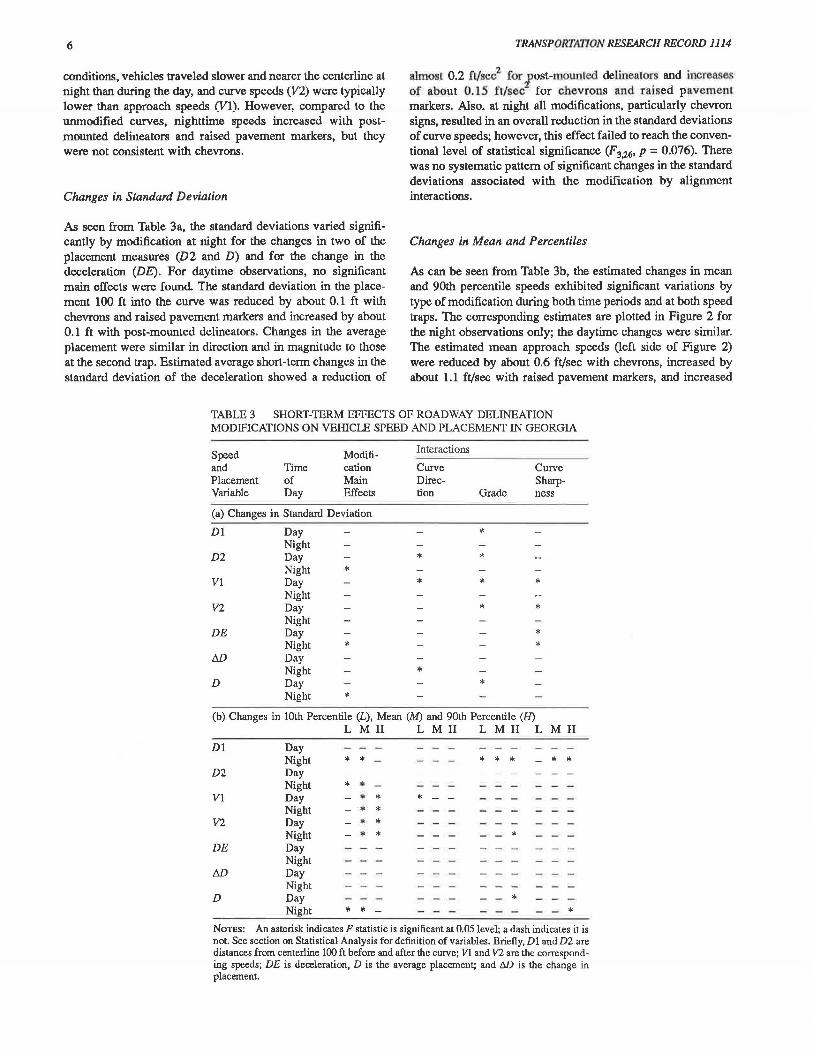
To demonstrate the effects of the modifications for the Georgia data, the statistically significant changes are summarized in Table 3a for standard deviations and in Table 3b for the 10th percentiles (L), means (M), and 90th percentiles (II).
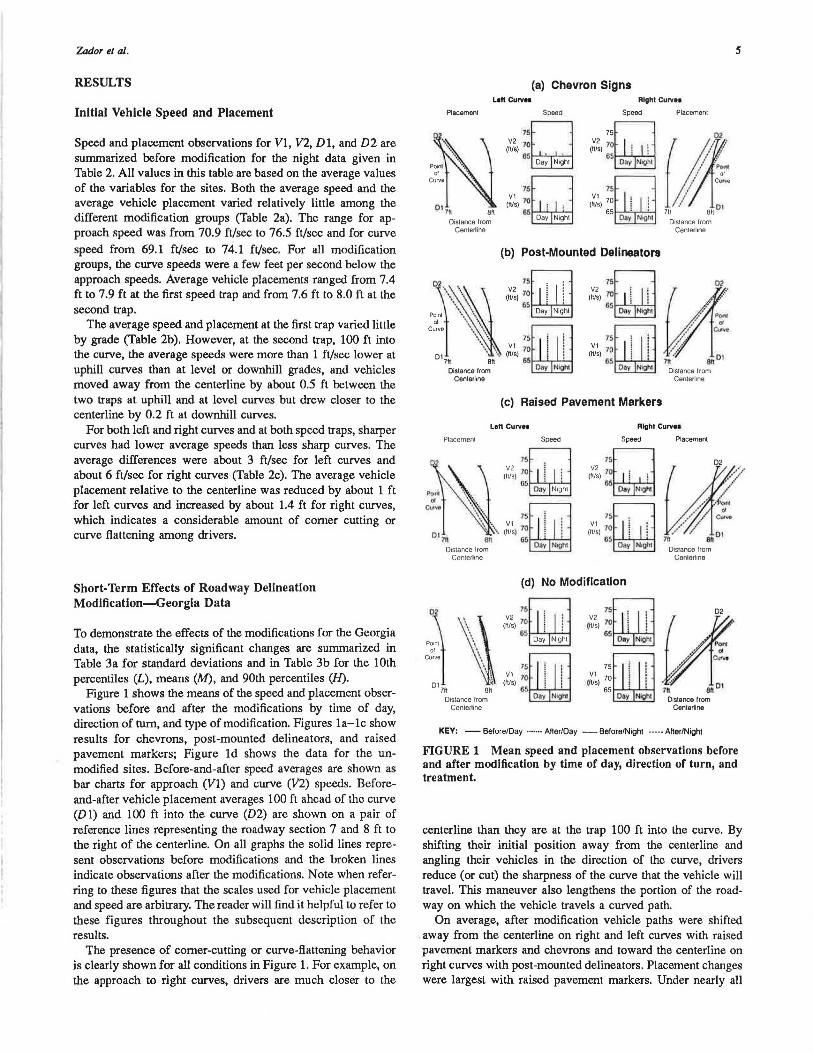
Figure 1 shows the means of the speed and placement observations before and after the modifications by time of day, direction of tum, and type of modification. Figures la- le show results for chevrons, post-mounted delineators, and raised pavement markers; Figure ld shows the data for the unmodified sites. Before-and-after speed averages are shown as bar charts for approach (VI) and curve (V2) speeds. Beforeand-after vehicle placement averages 100 ft ahead of the curve (Dl) and 100 ft into the curve (D2) are shown on a pair of reference lines representing the roadway section 7 and 8 ft to the right of the centerline. On all graphs the solid lines represent observations before modifications and the broken lines indicate observations after the modifications. Note when referring to these figures that the scales used for vehicle placement and speed are arbitrary. The reader will find it helpful to refer to these figures throughout the subsequent description of the results.
The presence of comer-cutting or curve-flattening behavior is clearly shown for all conditions in Figure 1. For example, on the approach to right curves, drivers are much closer to the
(a) Chevron Signs Lett Curvn Righi Curvoo
Placement
N 0 11tt att
Distance lrom Cen\erline
Distance lrom Centerhne
Speed Speed Placement
75~ (0~) 70 85 •
Day Night
75~ V2 (lt/s) 70 ; j
65 Ooy NogN
75~ Vl 70 : I (lt/s) 65 ! !
D•y N>ght
(b) Post-Mounted Delineators
75
(0~) 70 65 .................. ----.
(c) Raised Pavement Markers
{II:.> / .P0111
I or
// c ...
7tt 8tt01
Dis1ance from Cenlerhne
8tt01 01slance I rom
Centerline
Left CurvH Righi Curveo
Placemen!
~~.: \\\\ Curve \\ \
" \ D17tt Shi.
Distance lrom Cenlerline
Speed
15~ V2 10 : : (lt/s) ; '
65 . Day Nrghl
Speed Placemen!
IS~ V2 (lt/s) 70 i I
65 . • Dav Noghl
75~ V1 i • (lt/s) 70 ! !
65 • Day N•(lht
D1s1ance lrom Cenlerhne
(d) No Modification
75~1 V2 i (lt/s) 70 j
65 Oay Nigl'll
75
10~) 70 651-'-""T"''""'"-i ~ 1n. 811D 1
Distance lrom Centerline
KEY: - Before/Day ....... Atter/Day - Before/Night ----· Attar/Night
s
FIGURE 1 Mean speed and placement observations before and after modification by time of day, direction of turn, and treatment.
centerline than they are at the trap 100 ft into the curve. By shifting their initial position away from the centerline and angling their vehicles in the direction of the curve, drivers reduce (or cut) the sharpness of the curve that the vehicle will travel. This maneuver also lengthens the portion of the roadway on which the vehicle travels a curved path.
On average, after modification vehicle paths were shifted . away from the centerline on right and left curves with raised pavement markers and chevrons and toward the centerline on right curves with post-mounted delineators. Placement changes were largest with raised pavement markers. Under nearly all
6
conditions, vehicles traveled slower and nearer the centerline at night than during the day, and curve speeds (V2) were typically lower than approach speeds (Vl). However, compared to the unmodified curves, nighttime speeds increased with postmounted delineators and raised pavement markers, but they were not consistent with chevrons.
Changes in Standard Deviation
As seen from Table 3a, the standard deviations varied significantly by modification at night for the changes in two of the placement measures (D2 and D) and for the change in the deceleration (DE). For daytime observations, no significant main effects were found The standard deviation in the placement 100 ft into the curve was reduced by about 0.1 ft with chevrons and raised pavement markers and increased by about 0.1 ft with post-mounted delineators. Changes in the average placement were similar in direction and in magnitude to those at the second trap. Estimated average short-term changes in the standard deviation of the deceleration showed a reduction of
TRANSPORTATION RESEARCH RECORD 1114
almost 0.2 ft/sec2 for lost-mounted delineators and increases of about 0.15 ft/sec for chevrons and raised pavemenl markers. Also, at night all modifications, particularly chevron signs, resulted in an overall reduction in the standard deviations of curve speeds; however, this effect failed to reach the conventional level of statistical significance (F 3,i6, p = 0.076). There was no systematic pattern of significant changes in the standard deviations associated with the modification by alignment interactions.
Changes in Mean and Percentiles
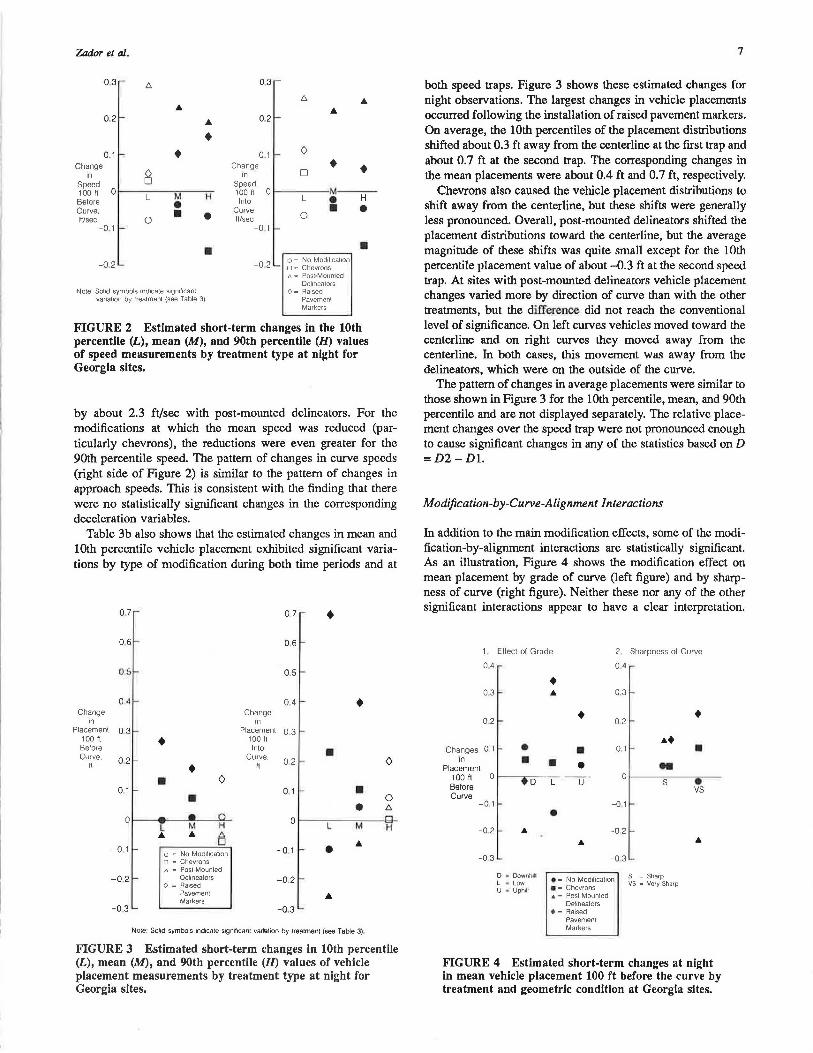
As can be seen from Table 3b, the estimated changes in mean and 90th percentile speeds exhibited significant variations by type of modification during both time periods and at both speed traps. The corresponding estimates are plotted in Figure 2 for the night observations only; the daytime changes were similar. The estimated mean approach speeds (left side of Figure 2) were reduced by about 0.6 ft/sec with chevrons, increased by about 1.1 ft/sec with raised pavement markers, and increased
TABLE 3 SHORT-TERM EFFECTS OF ROADWAY DELINEATION MODIFICATIONS ON VEHICLE SPEED AND PLACEMENT IN GEORGIA
Speed Modifi-and Time cation Placement of Main Variable Day Effects
(a) Changes in Standard Deviation
DI Day
D2
VI
V2
DE
D
Night Day Night Day Night Day Night Day Night Day Night Day Night
*
*
*
Interactions
Curve Direc-ti on Grade
* * *
* *
*
* *
(b) Changes in 10th Percentile (L), Mean (M) and 90th Percentile (H)
Curve Sharp-ness
*
*
* *
LMH LMH LMH LMH
DI Day Night * * - * * * - * *
D2 Duy Night * ... -
VI Day - * * * Night - * *
V2 Day - ... * Night - * * *
DE Day Night
till Day Night
D Day * Night * * *
Norns: An asterisk indicates F statistic is significant at 0.05 level; a dash indicates it is not. See section on Statistical Analysis for definition of variables. Briefly, Dl and D2 are distances from centerline 100 ft before and after the curve; Vl and V2 are the corresponding speeds; DE is deceleration, D is the average placement; and MJ is the change in placement.
Zador et al.
03
0.2
0.1 Change
In Speed 100 tt 0 Before Curve, ft/sec
-0.1
-0 2
• 8 L M
• 0 •
... •
H
• •
Note: Solid symbols 1nd1cate significant varial1on by treatment (see Table 3)
03 -
0.2 -
0.1 - 0 Change • • In D Speed 100 tt 0 M---Into L • H
Curve. • • ft/sec 0 -0.1 -
• -O .2 _ g : ~~e~r~~1!1cahon
<"> = Posl·Mounled Dehnea1ors
o = Raised Pavemenl Markers
FIGURE 2 Estimated short-term changes in the 10th percentile (L), mean (M), and 90th percentile (H) values of speed measurements by treatment type at night for Georgia sites.
by about 2.3 ft/sec with post-mmmted delineators. For the modifications at which the mean speed was reduced (particularly chevrons), the reductions were even greater for the 90th percentile speed. The pattern of changes in curve speeds (right side of Figure 2) is similar to the pattern of changes in approach speeds. This is consistent with the finding that there were no statistically significant changes in the corresponding deceleration variables.
Table 3b also shows that the estimated changes in mean and 10th percentile vehicle placement exhibited significant variations by type of modification during both time periods and at
0.7 0.7 • 06 0.6
0.5 0.5 -
0-4 0.4 • Change Change in 1n
Placement 03 Placement 0.3 100 tt • 100 tt Bel ore Into • Curve, 02 Curve.
02 0 tt • tt
• 0 0 1 0 1 • • 0
• to. 0 0 L M H ...
-0.1 • ... o = No Mod111cat1on -0.1 o = Chevrons a = Posl-Mounted
-0.2 Dehneators O = Raised
-0.2
Pavement ... Markers
-0.3 -0.3
Note: Sohd symbols 1nd1cate s1gnil1cant vartretion by trealmenl (see Table 3)
FIGURE3 Estimated short-term changes in 10th percentile (L), mean (M), and 90th percentile (H) values of vehicle placement measurements by treatment type at night for Georgia sites.
7
both speed traps. Figure 3 shows these estimated changes for night observations. The largest changes in vehicle placements occurred following the installation of raised pavement markers. On average, the 10th percentiles of the placement distributions shifted about 0.3 ft away from the centerline at the first trap and about 0. 7 ft at the second trap. The corresponding changes in the mean placements were about 0.4 ft and 0.7 ft, respectively.
Chevrons also caused the vehicle placement distributions to shift away from the centerline, but these shifts were generally less pronounced. Overall, post-mounted delineators shifted the placement distributions toward the centerline, but the average magnitude of these shifts was quite small except for the 10th percentile placement value of about -0.3 ft at the second speed trap. At sites with post-mounted delineators vehicle placement changes varied more by direction of curve than with the other treatments, but the difference did not reach the conventional level of significance. On left curves vehicles moved toward the centerline and on right curves they moved away from the centerline. In both cases, this movement was away from the delineators, which were on the outside of the curve.
The pattern of changes in average placements were similar to those shown in Figure 3 for the 10th percentile, mean, and 90th percentile and are not displayed separately. The relative placement changes over the speed trap were not pronounced enough to cause significant changes in any of the statistics based on D =D2-Dl.
Modification-by-Curve-Alignment Interactions
In addition to the main modification effects, some of the modification-by-alignment interactions are statistically significant. As an illustration, Figure 4 shows the modification effect on mean placement by grade of curve (left figure) and by sharpness of curve (right figure). Neither these nor any of the other significant interactions appear to have a clear interpretation.
1. Ettect ol Grade 2. Sharpness ol Curve
0.4 0.4
• 03 ... 0.3
• • 02 02
.... Changes 0,1 • • 0.1 •
In • • • Placemen! .. 100 ft 0 0 Before
D L - - u- · s vs
Curve -0.1 -0 1
• -0.2 ... -0 2
... -0 3 -0 3
D • Downh"' • = No Mod1l1cat1on s = Sharp L • Low • = Chevrons
VS .. Very Sharp U • Uphill
.. = Post-Mounted Dellnealors
• = Raised Pavement Markers
FIGURE 4 Estimated short-term changes at night in mean vehicle placement 100 ft before the curve by treatment and geometric condition at Georgia sites.
8
Short· Term Effects of Chevrons-New Mexico Data
The New Mexico data were limited to five sites modified with chevron signs. The short-term effects were to increase both speeds, VI and V2, at night. There was a 3.2 ft/sec increase in approach speed that was statistically significant based on paired t-test comparisons (t = 3.27, p = 0.03), and a 2.6 ft/sec increase in curve speed that was not (t = 2.26, t = 0.09). (It should be recalled that, overall, speeds in Georgia did not increase as a result of the use of chevrons.) At night vehicles moved away from the centerline after the installation of chevron signs; however, these changes were not statistically significant.
Long· Term Effects of Delineation Modification-Georgia and New Mexico Data
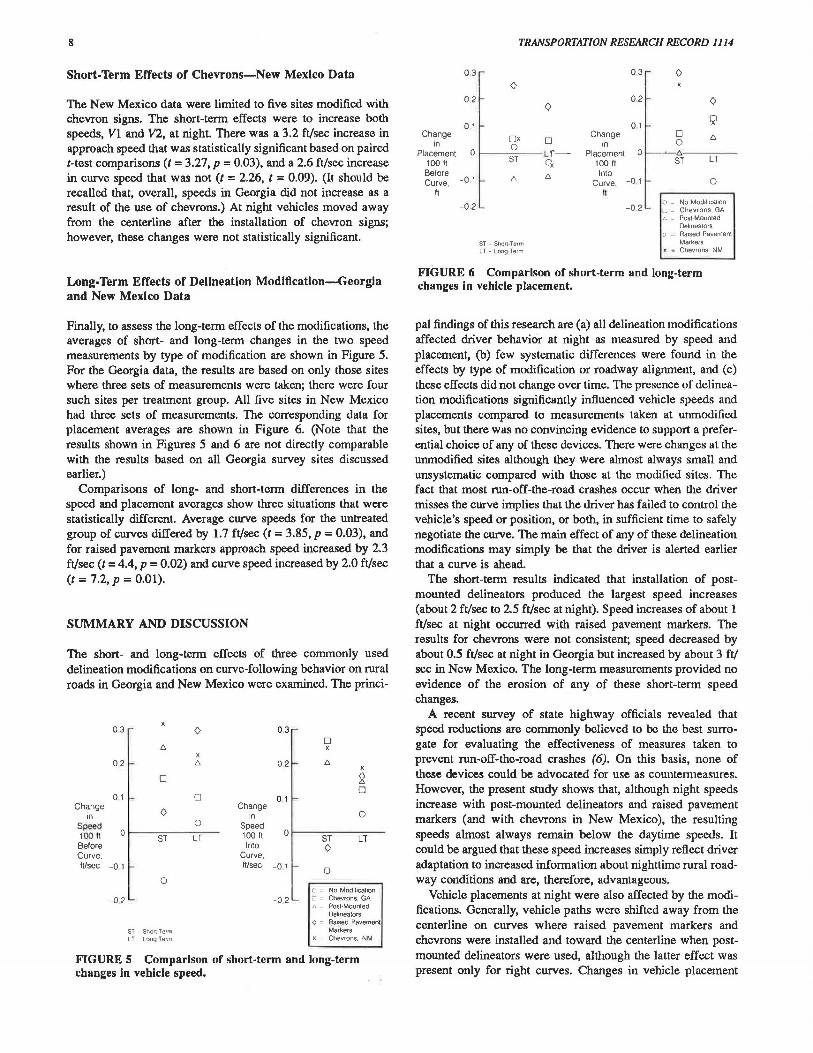
Finally, to assess the long-term effects of the modifications, the averages of short- and long-term changes in the two speed measurements by type of modification are shown in Figure 5. For the Georgia data, the results are based on only those sites where three sets of measurements were taken; there were four such sites per treatment group. All five sites in New Mexico had three sets of measurements. The corresponding data for placement averages are shown in Figure 6. (Note that the results shown in Figures 5 and 6 are not directly comparable with the results based on all Georgia survey sites discussed earlier.)
Comparisons of long- and short-term differences in the speed and placement averages show three situations that were statistically different. Average curve speeds for the untreated group of curves differed by 1.7 ft/sec (t = 3.85, p = 0.03), and for raised pavement markers approach speed increased by 2.3 ft/sec (t = 4.4, p = 0.02) and curve speed increased by 2.0 ft/sec (t = 7.2, p = 0.01).
SUMMARY AND DISCUSSION
The short- and long-term effects of three commonly used delineation modifications on curve-following behavior on rural roads in Georgia and New Mexico were examined. The princi-
03 0 0.3
"' D x
x 02 "' 0.2 "' x
D 2 D
0 1 D 0 1 Change
0 Change
in In 0 Speed 0 Speed 100 fl 0
ST LT 100 11 0 ST LT
Before Into 0 Curve. Curve. 11/sec -0 1 11/sec -0 1 0
0 o = No Mod1l1cal1on
-0 2 -0.2 L = Chevrons. GA t... = Posl-Mounled
Dehnealors O = Raised Pavement
ST Short Term Markers LT long Term x = Chevrons. NM
FIGURES Comparison of short-term and long-term changes in vehicle speed.
03
02
0 1 Change
1n Placement 0
10011 Before Curve, -0 .1
11
-0 2
TRANSPORTATION RESEARCH RECORD 1114
0
ox 0 ST
ST - Short-Term LT - Long Term
0
D Lf-C'x
"'
Change in
Placement 100 11 Into
Curve. II
03- 0
0.2- 0
0 1 ,.. 1x1 D
"' 0 0 .....__.._<).
LT
-0 1 -
-0 2 -
ST
0
o = No Mod1!1cat1on c = Chevrons. GA t... = Post 0 Moun1ed
Dehnealors o = Raised Pavement
Markers .. • Chevrons. NM
FIGURE 6 Comparison of short-term and long-term changes in vehicle placement.
pal findings of this research are (a) all delineation modifications affected driver behavior at night as measured by speed and placement, (b) few systematic differences were found in the effects by type of modification or roadway alignment, and (c) these effects did not change over time. The presence of delineation modifications significantly influenced vehicle speeds and placements compared to measurements taken at unmodified sites, but there was no convincing evidence to support a preferential choice of any of these devices. There were changes at the unmodified sites although they were almost always small and unsystematic compared with those at the modified sites. The fact that most run-off-the-road crashes occur when the driver misses the curve implies that the driver has failed to control the vehicle's speed or position, or both, in sufficient time to safely negotiate the curve. The main effect of any of these delineation modifications may simply be that the driver is alerted earlier that a curve is ahead.
The short-term results indicated that installation of postmounted delineators produced the largest speed increases (about 2 ft/sec to 2.5 ft/sec at night). Speed increases of about 1 ft/sec at night occurred with raised pavement markers. The results for chevrons were not consistent; speed decreased by about 0.5 ft/sec at night in Georgia but increased by about 3 ft/ sec in New Mexico. The long-term measurements provided no evidence of the erosion of any of these short-term speed changes.
A recent survey of state highway officials revealed that speed reductions are commonly believed to be the best surrogate for evaluating the effectiveness of measures taken to prevent run-off-the-road crashes (6). On this basis, none of these devices could be advocated for use as countenneasures. However, the present study shows that, although night speeds increase with post-mounted delineators and raised pavement markers (and with chevrons in New Mexico), the resulting speeds almost always remain below the daytime speeds. It could be argued that these speed increases simply reflect driver adaptation to increased information about nighttime rural roadway conditions and are, therefore, advantageous.
Vehicle placements at night were also affected by the modifications. Generally, vehicle paths were shifted away from the centerline on curves where raised pavement markers and chevrons were installed and toward the centerline when postmounted delineators were used, although the latter effect was present only for right curves. Changes in vehicle placement
7-ador et al.
were largest at sites with raised pavement markers. The magnitudes of the shifts were about the same at both speed traps except where raised pavement markers were used when the shift at the second trap exceeded the shift at the first trap by about 0.2 ft regardless of the direction of the tum. These results can be interpreted in terms of changes in comer-cutting behavior.
For left curves, corner cutting involves first a shift away from the centerline before the curve; for right curves, the first shift is toward the centerline. The direction of these shifts is then reversed as the vehicle travels through the curve (Figure 1). Thus, the modifications had no effect on comer-cutting behavior except when raised pavement markers were used. On right curves, raised pavement markers slightly increased corner cutting during the day and at night. On left curves raised pavement markers reduced corner cutting at night and increased it during the day.
All the present and earlier studies clearly demonstrated drivers' preference for the comer-cutting strategy. Corner cutting can reduce the lateral acceleration through a curve and thereby reduce peak friction demand, but it may also bring vehicles closer to the roadway boundaries and reduce their margin of safety. However, to assess the relative importance of these factors requires the use of crash data, and previous analyses of the relation between crash frequency and implementation of delineation devices have been unable to quantify their effects or examine potential differences among devices.
The size of the changes in vehicle speeds and placements measured in this study compares well with results from other studies, but there are some inconsistencies in the directions. For example, the FIIWA study (12) revealed that midcurve speeds were often significantly lower with raised pavement markers and post-mounted delineators, whereas in the present study speeds increased with the installation of these devices, particularly post-mounted delineators. However, both studies revealed that raised pavement markers had the largest effect on vehicle placement-vehicles moved away from the centerline. The Australian study revealed that speeds were significantly higher with chevron signs (8), but in the present study only the New Mexico sites experienced a significant short-term speed increase.
In conclusion, the results of this study provided strong evidence that supplemental delineation treatments are effective for warning drivers of approaching curves.
ACKNOWLEDGMENTS
The authors gratefully acknowledge the cooperation of representatives of the Georgia Department of Transportation and the New Mexico State Highway Department for their overall contributions to this project. Without that cooperation, the project would not have been possible. The authors particularly appreciate the support of Archie Burnham, Traffic and Safety Engineer, and Dick Graves, Transportation Engineer, Georgia Department of Transportation, and that of Louis Medrano in New Mexico.
Special thanks are due Steven Pickett of the New Mexico Engineering Research Institute who designed and built the TDR equipment and to Chris Swenson who played a key role in the collection of the Georgia data.
9
Finally, appreciation is expressed to Randy Whitfield for his help with the data processing and to Sharon Rasmussen for her editorial assistance.
REFERENCES
1. P. H. Wright and L. S. Robertson. Amelioration of Roadside Obstacle Crashes. Compendium of Technical Papers. Institute of Transportation Engineers, Washington, D.C., 1979.
2. P. H. Wright and P. Zador. Study of Fatal Rollover Crashes in Georgia. In Transportation Research Record 8i9, TRB, National Research Council, Washington, D.C., 1982, pp. 8-17.
3. J. W. Hall and P. Zador. Survey of Single Vehicle Fatal Rollover Crash Sites in New Mexico. In Transportation Research Record 8i9, TRB, National Research Council, Washington, D.C .. 1982, pp. 1-8.
4. Fatal Accident Reporting System, 1983. NIITSA, U.S. Department of Transportation, 1983.
5. H. H. Bissell, G. B. Pilkington, J. M. Mason, and D. C. Woods. Roadway Cross Section and Alignment in Synthesis of Safety Research Related to Traffic Control and Roadway Elements. Report FHWA-TS-82-232. FHWA, U.S. Department of Transportation, 1982.
6. P. H. Wright, J. W. Hall, and P. L. Zador. Low-Cost Countermeasures for Ameliorating Run-Off-the-Road Crashes. In Transportation Research Record 926, TRB, National Research Council, Washington, D.C., 1983.
7. The i985 Annual Report on Highway Safety improvement Programs: Report to Congress. Office of Highway Safety, U.S. Department of Transportation, 1985.
8. I. R. Johnson. The Effects of Roadway Delineation on Curve Negotiation by Both Sober and Drinking Drivers. Australian Road Research Board, No. 128, 1984.
9. C. R. Swenson. A Study of Driver Behavior in Horizontal Curves (unpublished M.S. thesis). School of Civil Engineering, Georgia Institute of Technology, Atlanta, 1985.
10. J. R. McLean. Speeds on Curves: Side Friction Factor Considerations. Australian Road Research Board, APR 126, March 1983.
11. N. D. Nedas and S. Luminello. Field Study of the influence of Post-Delineations on Driver Performance in Various Weather and Light Conditions. Potters Industries, Hasbruck Heights, N.J., 1982.
12. W. A. Stimpson, H. W. McGee, W. K. Kittelson, and R. H. Ruddy. Field Evaluation of Selected Delineation Treatments on Two-Lane Rural Highways. Report FHWA 77-118. U.S. Department of Transportation, 1977.
13. J. I. Taylor, H. W. McGee, E. L. Sequin, and R. S. Hostetter. NCHRP Report 130: Delineation Systems. HRB, National Research Council, Washington, D.C., 1972.
14. R. W. Allen, J. F. O'Hanlon, D. T. McRuer, et al. Driver's Visibility Requirements for Roadway Delineation, Vol. /: Effects of Contrast and Configuration on Driver Performance and Behavior. Report FHWA-RD-77-165. U.S. Department of Transportation, 1977.
15. B. N. Fildes and T. J. Triggs. Effects of Road Curve Geometry and Approach Distance on Judgements of Curve Exit Angle. Proc., Australian Road Research Board, Vol.11, Part 2, Nunawading, 1982.
16. Z. A. Nemeth, T. H. Rockwell, and G. L. Smith. Recommended Delineation Treatments at Selected Situations on Rural State Highways, Part 2. Report FHWA-OH-85-002. U.S. Department of Transportation, 1985.
17. T. J. Triggs, J. W. Meehan, and W. G. Harris. A Laboratory-Based Study of the Effect of Road-Side Post Frequency and Location on Curve Direction Estimation. AIR 355-1. Australian Road Research Board, Nunawading, 1983.
18. G. R. WattsandA. R.Quimby.AspectsofRoadLayoutthatAffect Drivers' Perception and Risk Taking. Transport and Road Research Laboratory Report 920. United Kingdom Department of the Environment, 1980.
19. R. 0. Helliar-Symons. Yellow Bar Experimental Carriageway Markings: Accident Study. Transport and Road Research Labora-
10
tory Report 1010. United Kingdom Department of the Environment, 1981.
20. C. G. Perez. Effect of Advance Information Markings on the Safety n/Curves (unpublished M.S. thesis). School of Civil Engineering, Georgia Institute of Technology, Atlanta, 1979.
21. D. Shinar, T. H. Rockwell, and J. A. Maleck. The Effects of Changes in Driver Perception on Rural Curve Negotiations. Ergonomics, Vol. 23, No. 3, 1980, pp. 263-275.
22. B. E. Jennings. Evaluation of Rural Highway Curve Delineation Signs (unpublished M.S. t11esis). School of Engineering, University of Virginia, Charlottesville, Jan. 1984.
23. S. Bali, R. Potts, J. A. Fee, J. I. Taylor, and J. Glennon. CostEffectiveness and Safety of Alternative Roadway Delineation Treatments for Rural Two-Lane Highways, Vol. II. Report FHWARD-78-51. U.S. Department of Transportation, 1978.
24. C. L. Kugle, 0. J. Pendleton, and M. S. Von Tress. An Evaluation of the Accident Reduction Effectiveness of Raised Pavement Markers. Texas Transportation Institute, College Station, 1984.
TRANSPOKfATION RESEARCH RECORD 1114
25. W. Niessner. Post-Mounted Delineators. Report FHWATS-83-208. FHWA, U.S. Department of Transportation, 1983.
26. W. C. Taylor and T. J. Foudy. Ohio's Curve Delineation Program-An Analysis. Traffic Engineering, Vol. 10, No. 10, 1966, pp. 41-45.
27. P. L. Zador, P. H. Wright, and R. Kllipf. Effect of Pavement Markers on Nighttime Crashes in Georgia. Insurance Institute for Highway Safety, Washington, D.C., 1982.
28. Manual on Uniform Traffic Control Devices. FHWA, U.S. Department of Transportation, 1978.
29. SAS User's Guide: Statistics, I982 Edition, SAS Institute, Cary, N.C., 1982.
Publication of this paper sponsored by Committee on Traffic Control Devices.