Embed Size (px)
Citation preview
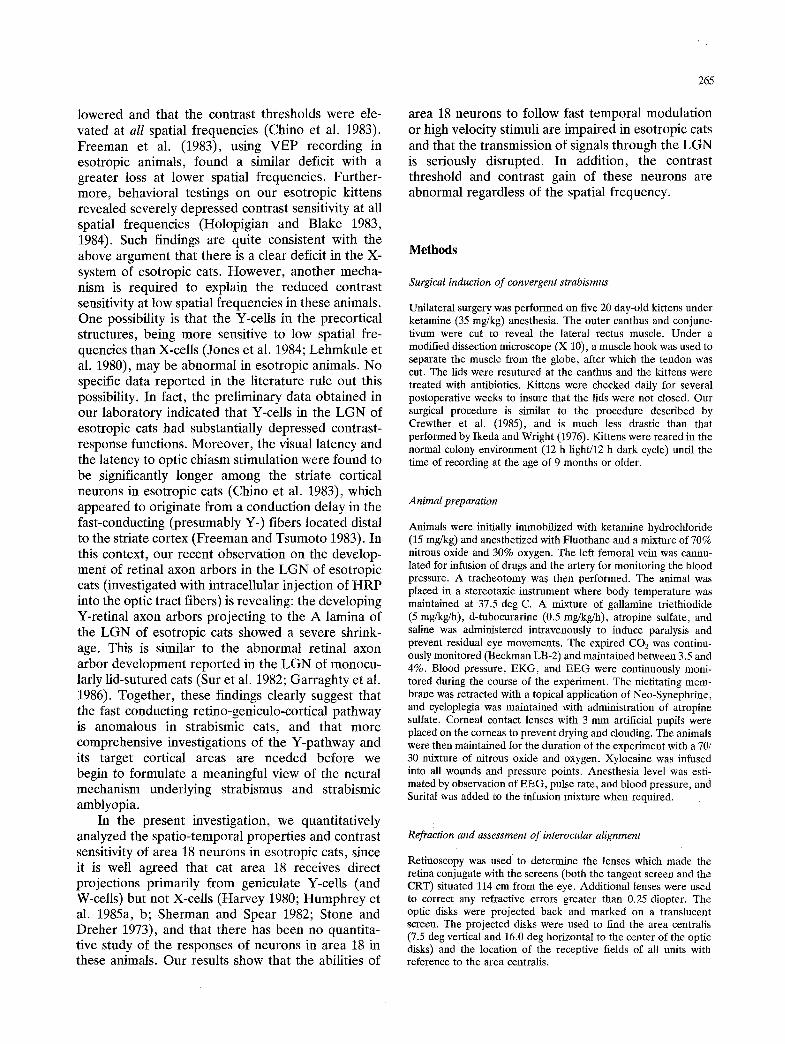
Exp Brain Res (1988) 72:264-278 Exp.erimental Brain Research �9 Springer-Verlag 1988
Effects of convergent strabismus on spatio-temporal response properties of neurons in cat area 18
Y.M. Chino*, W.H. Ridder, III*, and E.P . Czora
Electrophysiology Laboratory, Illinois College of Optometry, 3241 S. Michigan Ave., Chicago, IL 60616, USA
Summary. Single-cell recording experiments were carried out to determine whether rearing kittens with surgically induced convergent strabismus (esotropia) alters the development of receptive field (RF) prop- erties of neurons in area 18. In agreement with previous work on kittens with divergent strabismus (exotropia), there was a marked loss of binocularly driven cells in area 18 of esotropic cats. In contrast to the striate cortex of strabismic cats, the spatial properties of area 18 neurons, including receptive- field size and spatial frequency tuning, did not differ from those in normal controls. On the other hand, we found that contrast thresholds, measured at an opti- mal spatial frequency, were significantly elevated, and that the contrast gain in many cells was reduced in strabismic cats. These deficits were observed in both eyes, though the cells dominated by the deviat- ing eye had a lower response amplitude at all contrasts. Furthermore, temporal frequency tuning curves were abnormal in strabismic cats in that the optimal frequencies and temporal resolutions were shifted to lower values. These effects were also bilateral. Velocity tuning, measured with a high- contrast bar stimulus, revealed that area 18 neurons in strabismic cats were unable to respond to very high velocities compared to normals. This reduced response was more severe when measured with the deviating eye in spite of the bilateral nature of the deficit. Finally, latencies to electrical stimulation of the optic chiasm or the optic radiation were signifi- cantly longer in strabismic cats. The magnitude of these effects was virtually the same for both eyes. From these observations, we conclude that the tem- poral properties of area ]_8 neurons, particularly the cells abilities to follow fast temporal modulations, are
* Present address: College of Optometry, University of Houston, 4800 Calhoun Rd., Houston, TX 77204-6052, USA
Offprint requests to: Y.M. Chino (address see footnote)
affected by raising kittens with surgically induced convergent strabismus.
Key words: Convergent strabismus - Cat - Area 18 - Temporal properties - Contrast sensitivity
Introduction
Rearing kittens with convergent or divergent strabis- mus is known to result in a behaviorally demon- strated loss of acuity and/or reduced contrast sensitiv- ity (Cleland et al. 1982; Crewther et al. 1985; von Grunau and Singer 1980; Holopigian and Blake 1983, 1984; Jacobson and Ikeda 1979; Mitchell et al. 1984). Although the demonstrations of electrophysiological correlates of comparable deficits in strabismic ani- mals are still controversial (Blakemore and Eggers 1978; Chino et al. 1980a, 1983; Cleland et al. 1982; Freeman et al. 1983; Freeman and Tsumoto 1983; Ikeda et al. 1978; Singer et al. 1980), it is widely accepted that X-cells in the lateral geniculate nucleus (LGN) innervated by the area centralis of the deviat- ing eye show a dramatic reduction in spatial resolu- tion and contrast sensitivity (Chino et al. 1986, 1988; Ikeda and Wright 1976; Ikeda et al. 1978; Jones et al. 1984; Mower et al. 1982). Based on such findings, it has been generally concluded that esotropia has deleterious effects primarily on the X-pathway that mediates fine spatial vision and on the contrast sensitivity measured at high spatial frequencies; the implications being that the Y-pathway and the con- trast sensitivity measured at low spatial frequencies are not affected.
Recently, we reported that both the optimal spatial frequency and the spatial resolution of striate cortical neurons in esotropic cats were significantly
265
lowered and that the contrast thresholds were ele- vated at all spatial f requencies (Chino et al. 1983). F reeman et al. (1983), using V E P recording in esotropic animals, found a similar deficit with a greater loss at lower spatial frequencies. Fur ther- more , behavioral testings on our esotropic kittens revealed severely depressed contrast sensitivity at all spatial f requencies (Holopig ian and Blake 1983, 1984). Such findings are quite consistent with the above a rgument that there is a clear deficit in the X- system of esotropic cats. Howeve r , ano ther mecha- nism is required to explain the reduced contrast sensitivity at low spatial f requencies in these animals. One possibility is tha t the Y-cells in the precort ical structures, being more sensitive to low spatial fre- quencies than X-cells (Jones et al. 1984; Lehmku le et al. 1980), may be abnormal in esotropic animals. No specific data repor ted in the l i terature rule out this possibility. In fact, the prel iminary data obta ined in our labora tory indicated that Y-cells in the L G N of esotropic cats had substantially depressed contrast- response functions. Moreover , the visual latency and the latency to optic chiasm st imulat ion were found to be significantly longer among the striate cortical neurons in esotropic cats (Chino et al. 1983), which appeared to originate f rom a conduct ion delay in the fast-conducting (presumably Y-) fibers located distal to the striate cortex (F reeman and T sum ot o 1983). In this context, our recent observat ion on the develop- ment of retinal axon arbors in the L G N of esotropic cats (investigated with intracellular inject ion of H R P into the optic tract fibers) is revealing: the developing Y-retinal axon arbors project ing to the A lamina of the L G N of esotropic cats showed a severe shrink- age. This is similar to the abnormal retinal axon arbor deve lopment repor ted in the L G N of monocu- larly l id-sutured cats (Sur et al. 1982; Gar ragh ty et al. 1986). Together , these findings clearly suggest that the fast conduct ing ret ino-geniculo-cort ical pa thway is anomalous in strabismic cats, and that m o r e comprehensive investigations of the Y-pa thway and its target cortical areas are needed before we begin to formulate a meaningful view of the neural mechanism under lying strabismus and strabismic amblyopia.
In the present investigation, we quanti tat ively analyzed the spat io- temporal proper t ies and contrast sensitivity o f area 18 neurons in esotropic cats, since it is well agreed that cat area 18 receives direct project ions primarily f rom geniculate Y-cells (and W-cells) but not X-cells (Harvey 1980; H u m p h r e y et al. 1985a, b; She rman and Spear 1982; Stone and Drehe r 1973), and that there has been no quanti ta- tive study of the responses of neurons in area 18 in these animals. Our results show that the abilities of
area 18 neurons to follow fast t empora l modula t ion or high velocity stimuli are impaired in esotropic cats and that the transmission of signals th rough the L G N is seriously disrupted. In addit ion, the contrast threshold and contrast gain of these neurons are abnormal regardless of the spatial f requency.
Methods
Surgical induction of convergent strabismus
Unilateral surgery was performed on five 20 day-old kittens under ketamine (35 mg/kg) anesthesia. The outer canthus and conjunc- tivum were cut to reveal the lateral rectus muscle. Under a modified dissection microscope (X 10), a muscle hook was used to separate the muscle from the globe, after which the tendon was cut. The lids were resutured at the canthus and the kittens were treated with antibiotics. Kittens were checked daily for several postoperative weeks to insure that the lids were not closed. Our surgical procedure is similar to the procedure described by Crewther et al. (1985), and is much less drastic than that performed by Ikeda and Wright (1976). Kittens were reared in the normal colony environment (12 h light/12 h dark cycle) until the time of recording at the age of 9 months or older.
Animal preparation
Animals were initially immobilized with ketamine hydrochloride (15 mg/kg) and anesthetized with Fluothane and a mixture of 70% nitrous oxide and 30% oxygen. The left femoral vein was cannu- lated for infusion of drugs and the artery for monitoring the blood pressure. A tracheotomy was then performed. The animal was placed in a stereotaxic instrument where body temperature was maintained at 37.5 deg C, A mixture of gaUamine triethiodide (5 mg/kg/h), d-tubocurarine (0.5 mg/kg/h), atropine sulfate, and saline was administered intravenously to induce paralysis and prevent residual eye movements. The expired CO2 was continu- ously monitored (Beckman LB-2) and maintained between 3.5 and 4%. Blood pressure, EKG, and EEG were continuously moni- tored during the course of the experiment. The nictitating mem- brane was retracted with a topical application of Neo-Synephrine, and cycloplegia was maintained with administration of atropine sulfate. Corneal contact lenses with 3 mm artificial pupils were placed on the corneas to prevent drying and clouding. The animals were then maintained for the duration of the experiment with a 70/ 30 mixture of nitrous oxide and oxygen. Xylocaine was infused into all wounds and pressure points. Anesthesia level was esti- mated by observation of EEG, pulse rate, and blood pressure, and Surital was added to the infusion mixture when required.
Refraction and assessment of interocular alignment
Retinoscopy was used to determine the lenses which made the retina conjugate with the screens (both the tangent screen and the CRT) situated 114 cm from the eye. Additional lenses were used to correct any refractive errors greater than 0.25 diopter. The optic disks were projected back and marked on a translucent screen. The projected disks were used to find the area centralis (7.5 deg vertical and 16.0 deg horizontal to the center of the optic disks) and the location of the receptive fields of all units with reference to the area centralis.
266
Recording and electrical stimulation methods
Three small holes (less than 5 mm in diameter) were drilled in the skull and the dura mater was removed in order to introduce three electrodes (recording microelectrode at H C : A P 3.0mm, L 3.0 mm; stimulating electrode for the optic chiasm at HC : AP 14.5 mm, L 2.0 ram, approximate depth of 24 mm from the surface; and stimulating electrode for the optic radiation at HC : AP 6.0 mm, L 9.0 mm, and approximate depth of 10 mm from the surface). Stimulating electrodes, insulated bipolar stain- less steel electrodes with exposed tips (1 ram), were lowered to the approximated depth and then implanted by listening for the reliable response of fibers in the chiasm or the radiation to visual stimulation. Stimulation pulses were usually 0.1-0.5 mA and 100 ~ts in duration. For recording electrodes, the hole was covered with bone wax through which the microelectrode was driven.
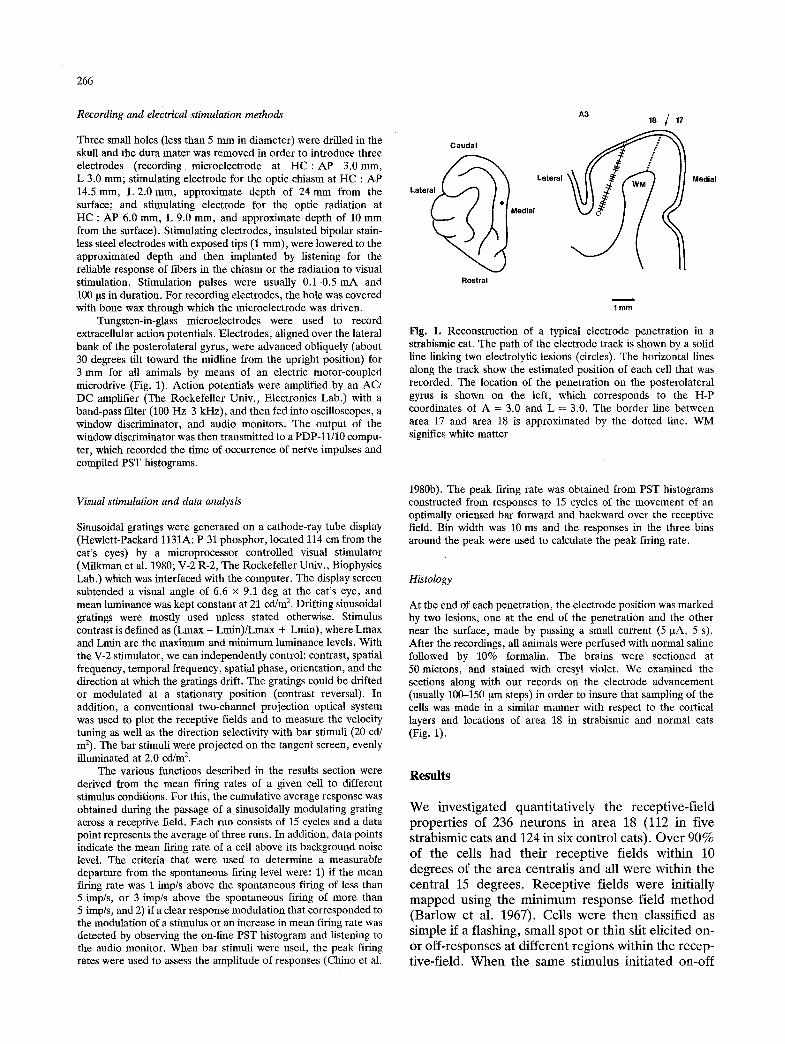
Tungsten-in-glass microelectrodes were used to record extracellnlar action potentials. Electrodes, aligned over the lateral bank of the posterolateral gyrus, were advanced obliquely (about 30 degrees tilt toward the midline from the upright position) for 3 mm for all animals by means of an electric motor-coupled microdrive (Fig. 1). Action potentials were amplified by an AC/ DC amplifier (The Rockefeller Univ., Electronics Lab.) with a band-pass filter (100 Hz-3 kHz), and then fed into oscilloscopes, a window discriminator, and audio monitors. The output of the window discriminator was then transmitted to a PDP-11/10 compu- ter, which recorded the time of occurrence of nerve impulses and compiled PST histograms.
Visual stimulation and data analysis
Sinusoidal gratings were generated on a cathode-ray tube display (Hewlett-Packard l131A: P 31 phosphor, located 114 cm from the cat's eyes) by a microprocessor controlled visual stimulator (Milkman et al. 1980; V-2 R-2, The Rockefeller Univ., Biophysics Lab.) which was interfaced with the computer. The display screen subtended a visual angle of 6.6 • 9.1 deg at the cat's eye, and mean luminance was kept constant at 21 cd/m 2. Drifting sinusoidal gratings were mostly used unless stated otherwise. Stimulus contrast is defined as (Lmax - Lmin)/Lmax + Lmin), where Lmax and Lmin are the maximum and minimum luminance levels. With the V-2 stimulator, we can independently control: contrast, spatial frequency, temporal frequency, spatial phase, orientation, and the direction at which the gratings drift. The gratings could be drifted or modulated at a stationary position (contrast reversal). In addition, a conventional two-channel projection optical system was used to plot the receptive fields and to measure the velocity tuning as well as the direction selectivity with bar stimuli (20 cd/ m2). The bar stimuli were projected on the tangent screen, evenly illuminated at 2.0 cd/m 2.
The various functions described in the results section were derived from the mean firing rates of a given cell to different stimulus conditions. For this, the cumulative average response was obtained during the passage of a sinusoidally modulating grating across a receptive field. Each run consists of 15 cycles and a data point represents the average of three runs. In addition, data points indicate the mean firing rate of a cell above its background noise level. The criteria that were used to determine a measurable departure from the spontaneous firing level were: 1) if the mean firing rate was 1 imp/s above the spontaneous firing of less than 5 imp/s, or 3 imp/s above the spontaneous firing of more than 5 imp/s, and 2) if a clear response modulation that corresponded to the modulation of a stimulus or an increase in mean firing rate was detected by observing the on-line PST histogram and listening to the audio monitor. When bar stimuli were used, the peak firing rates were used to assess the amplitude of responses (Chino et al.
Caudal Later~al Rostral
A3 1 18 ~ 17
Lateral
Medial
Medial
I mm
Fig. 1. Reconstruction of a typical electrode penetration in a strabismic cat. The path of the electrode track is shown by a solid line linking two electrolytic lesions (circles). The horizontal lines along the track show the estimated position of each cell that was recorded. The location of the penetration on the posterolateral gyrus is shown on the left, which corresponds to the H-P coordinates of A = 3.0 and L = 3.0. The border line between area 17 and area 18 is approximated by the dotted line. WM signifies white matter
1980b). The peak firing rate was obtained from PST histograms constructed from responses to 15 cycles of the movement of an optimally oriented bar forward and backward over the receptive field. Bin width was 10 ms and the responses in the three bins around the peak were used to calculate the peak firing rate.
Histology
At the end of each penetration, the electrode position was marked by two lesions, one at the end of the penetration and the other near the surface, made by passing a small current (5 ~tA, 5 s). After the recordings, all animals were perfused with normal saline followed by 10% formalin. The brains were sectioned at 50 microns, and stained with cresyl violet. We examined the sections along with our records on the electrode advancement (usually 100-150 ~tm steps) in order to insure that sampling of the cells was made in a similar manner with respect to the cortical layers and locations of area 18 in strabismic and normal cats (Fig. 1).
R e s u l t s
W e i n v e s t i g a t e d q u a n t i t a t i v e l y t h e r e c e p t i v e - f i e l d
p r o p e r t i e s o f 236 n e u r o n s i n a r e a 18 (112 in f ive
s t r a b i s m i c ca t s a n d 124 in s ix c o n t r o l c a t s ) . O v e r 9 0 %
o f t h e cel ls h a d t h e i r r e c e p t i v e f i e ld s w i t h i n 10
d e g r e e s o f t h e a r e a c e n t r a l i s a n d al l w e r e w i t h i n t h e
c e n t r a l 15 d e g r e e s . R e c e p t i v e f i e ld s w e r e i n i t i a l l y
m a p p e d u s i n g t h e m i n i m u m r e s p o n s e f i e ld m e t h o d
( B a r l o w e t al. 1967) . Ce l l s w e r e t h e n c l a s s i f i ed as s i m p l e if a f l a s h i n g , s m a l l s p o t o r t h i n sl i t e l i c i t e d o n -
o r o f f - r e s p o n s e s a t d i f f e r e n t r e g i o n s w i t h i n t h e r e c e p -
t i ve , f i e l d . W h e n t h e s a m e s t i m u l u s i n i t i a t e d o n - o f f
40
30
20
Strabismic
[-1 simple
[ ] Complex
1 2 3 4 5 6 7
Ocular Dominance Groups
Normal
U 1 2 3 4 5 6 7
Ocular Dominance Groups
267
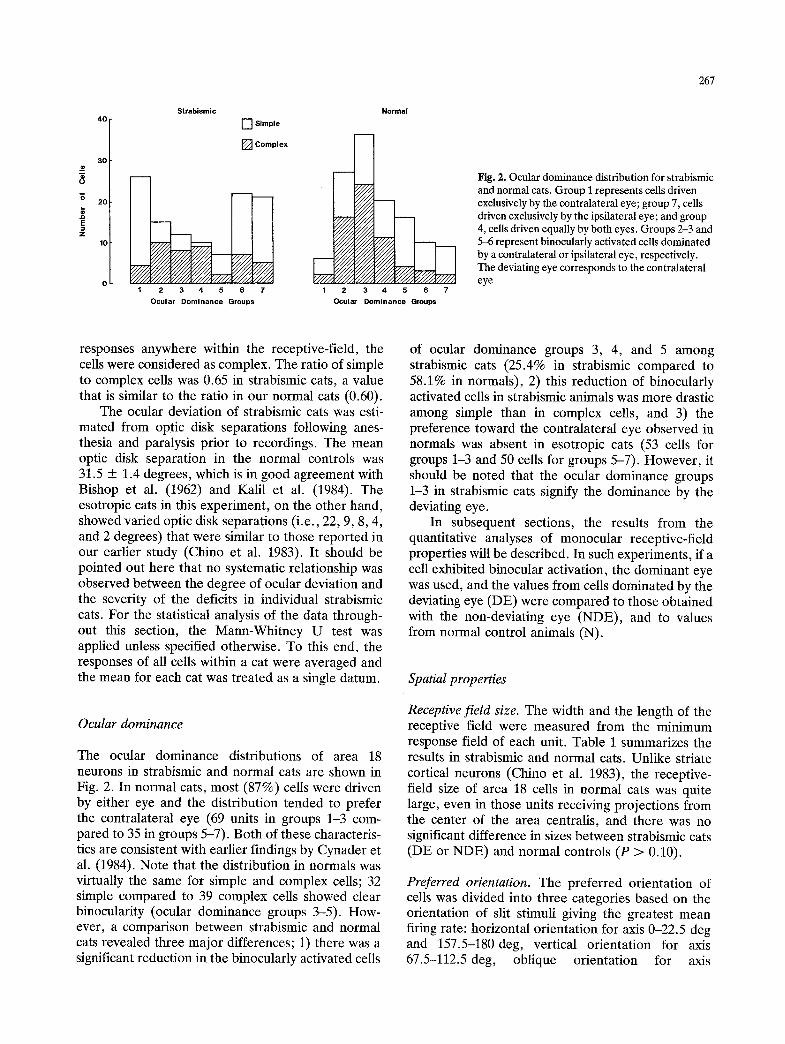
Fig. 2. Ocular dominance distribution for strabismic and normal cats. Group I represents cells driven exclusively by the contralateral eye, group 7, cells driven exclusively by the ipsilateral eye; and group 4, cells driven equally by both eyes. Groups 2-3 and 5-6 represent binocularly activated cells dominated by a contralateral or ipsilateral eye, respectively. The deviating eye corresponds to the contralateral eye
responses anywhere within the receptive-field, the cells were considered as complex. The ratio of simple to complex cells was 0.65 in strabismic cats, a value that is similar to the ratio in our normal cats (0.60).
The ocular deviation of strabismic cats was esti- mated from optic disk separations following anes- thesia and paralysis prior to recordings. The mean optic disk separation in the normal controls was 31.5 + 1.4 degrees, which is in good agreement with Bishop et al. (1962) and Kalil et al. (1984). The esotropic cats in this experiment, on the other hand, showed varied optic disk separations (i.e., 22, 9, 8, 4, and 2 degrees) that were similar to those reported in our earlier study (Chino et al. 1983). It should be pointed out here that no systematic relationship was observed between the degree of ocular deviation and the severity of the deficits in individual strabismic cats. For the statistical analysis of the data through- out this section, the Mann-Whitney U test was applied unless specified otherwise. To this end, the responses of all cells within a cat were averaged and the mean for each cat was treated as a single datum.
Ocular dominance
The ocular dominance distributions of area 18 neurons in strabismic and normal cats are shown in Fig. 2. In normal cats, most (87%) cells were driven by either eye and the distribution tended to prefer the contralateral eye (69 units in groups 1-3 com- pared to 35 in groups 5-7). Both of these characteris- tics are consistent with earlier findings by Cynader et al. (1984). Note that the distribution in normals was virtually the same for simple and complex cells; 32 simple compared to 39 complex cells showed clear binocularity (ocular dominance groups 3-5). How- ever, a comparison between strabismic and normal cats revealed three major differences; 1) there was a significant reduction in the binocularly activated cells
of ocular dominance groups 3, 4, and 5 among strabismic cats (25.4% in strabismic compared to 58.1% in normals), 2) this reduction of binocularly activated cells in strabismic animals was more drastic among simple than in complex cells, and 3) the preference toward the contralateral eye observed in normals was absent in esotropic cats (53 cells for groups 1-3 and 50 cells for groups 5-7). However, it should be noted that the ocular dominance groups 1-3 in strabismic cats signify the dominance by the deviating eye.
In subsequent sections, the results from the quantitative analyses of monocular receptive-field properties will be described. In such experiments, if a cell exhibited binocular activation, the dominant eye was used, and the values from cells dominated by the deviating eye (DE) were compared to those obtained with the non-deviating eye (NDE), and to values from normal control animals (N).
Spatial properties
Receptive field size. The width and the length of the receptive field were measured from the minimum response field of each unit. Table 1 summarizes the results in strabismic and normal cats. Unlike striate cortical neurons (Chino et al. 1983), the receptive- field size of area 18 cells in normal cats was quite large, even in those units receiving projections from the center of the area centralis, and there was no significant difference in sizes between strabismic cats (DE or NDE) and normal controls (P > 0.10).
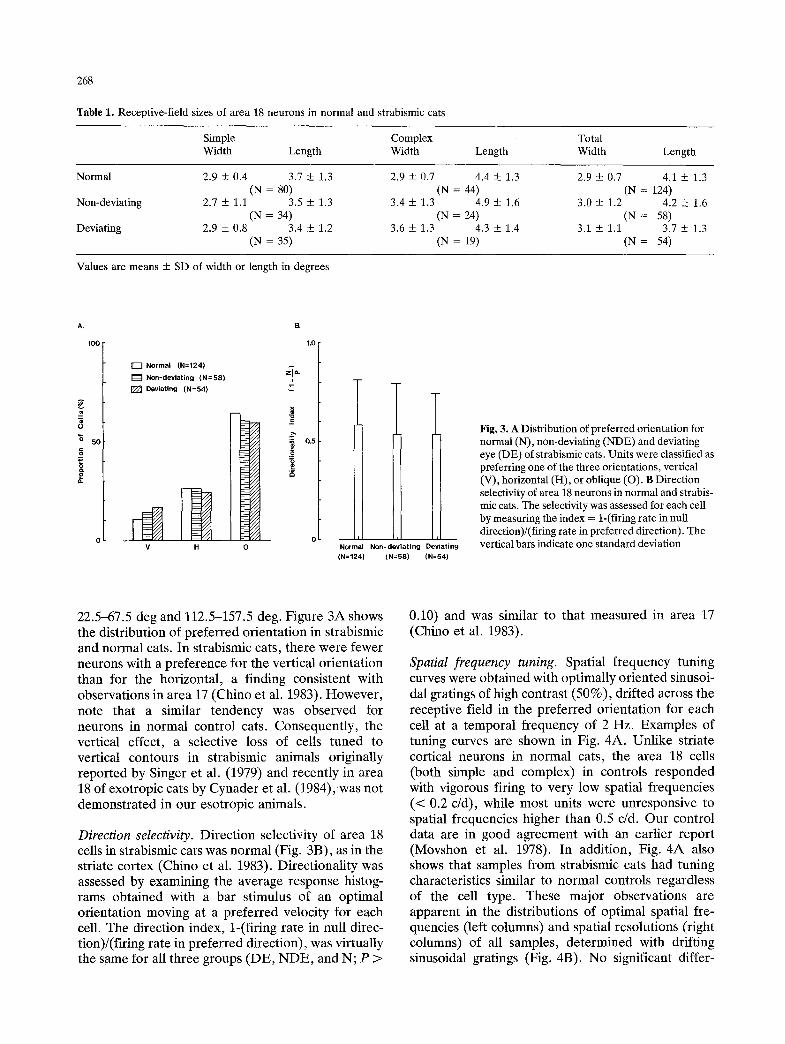
Preferred orientation. The preferred orientation of cells was divided into three categories based on the orientation of slit stimuli giving the greatest mean firing rate: horizontal orientation for axis 0-22.5 deg and 157.5-180 deg, vertical orientation for axis 67.5-112.5 deg, oblique orientation for axis
268
Table 1. Receptive-field sizes of area 18 neurons in normal and strabismic cats
Simple Complex Total Width Length Width Length Width Length
Normal 2.9 + 0.4 3.7 + 1.3 2.9 + 0.7 4.4 _ 1.3 2.9 + 0.7 4.1 + 1.3 (N = 80) (N = 44) (N = 124)
Non-deviating 2.7 + 1.1 3.5 • 1.3 3.4 + 1.3 4.9 • 1.6 3.0 + 1.2 4.2 + 1.6 (N = 34) (N = 24) (N = 58)
Deviating 2.9 + 0.8 3.4 • 1.2 3.6 • 1.3 4.3 + 1.4 3.1 + 1.1 3.7 • 1.3 (N = 35) (N = 19) (N = 54)
Values are means + SD of width or length in degrees
100
_=
0
50 g
[ ~ Normal (N=124)
Non-deviating (N= 58)
Deviating (N=54)
V H
I&
1,0
"- 0.5
Normal Non-deviating Deviating (N=124) (N=58) (N=54)
Fig, 3. A Distribution of preferred orientation for normal (N), non-deviating (NDE) and deviating eye (DE) of strabismic cats. Units were classified as preferring one of the three orientations, vertical (V), horizontal (H), or oblique (O). B Direction selectivity of area 18 neurons in normal and strabis- mic cats. The selectivity was assessed for each cell by measuring the index = 1-(firing rate in null direction)/(firing rate in preferred direction). The vertical bars indicate one standard deviation
22.5-67.5 deg and 112.5-157.5 deg. Figure 3A shows the distribution of preferred orientation in strabismic and normal cats. In strabismic cats, there were fewer neurons with a preference for the vertical orientation than for the horizontal, a finding consistent with observations in area 17 (Chino et al. 1983). However, note that a similar tendency was observed for neurons in normal control cats. Consequently, the vertical effect, a selective loss of cells tuned to vertical contours in strabismic animals originally reported by Singer et al. (1979) and recently in area 18 of exotropic cats by Cynader et al. (1984), was not demonstrated in our esotropic animals.
Direction selectivity. Direction selectivity of area 18 cells in strabismic cats was normal (Fig. 3B), as in the striate cortex (Chino et al. 1983). Directionality was assessed by examining the average response histog- rams obtained with a bar stimulus of an optimal orientation moving at a preferred velocity for each cell. The direction index, 1-(firing rate in null direc- tion)/(firing rate in preferred direction), was virtually the same for all three groups (DE, NDE, and N; P >
0.10) and was similar to that measured in area 17 (Chino et al. 1983).
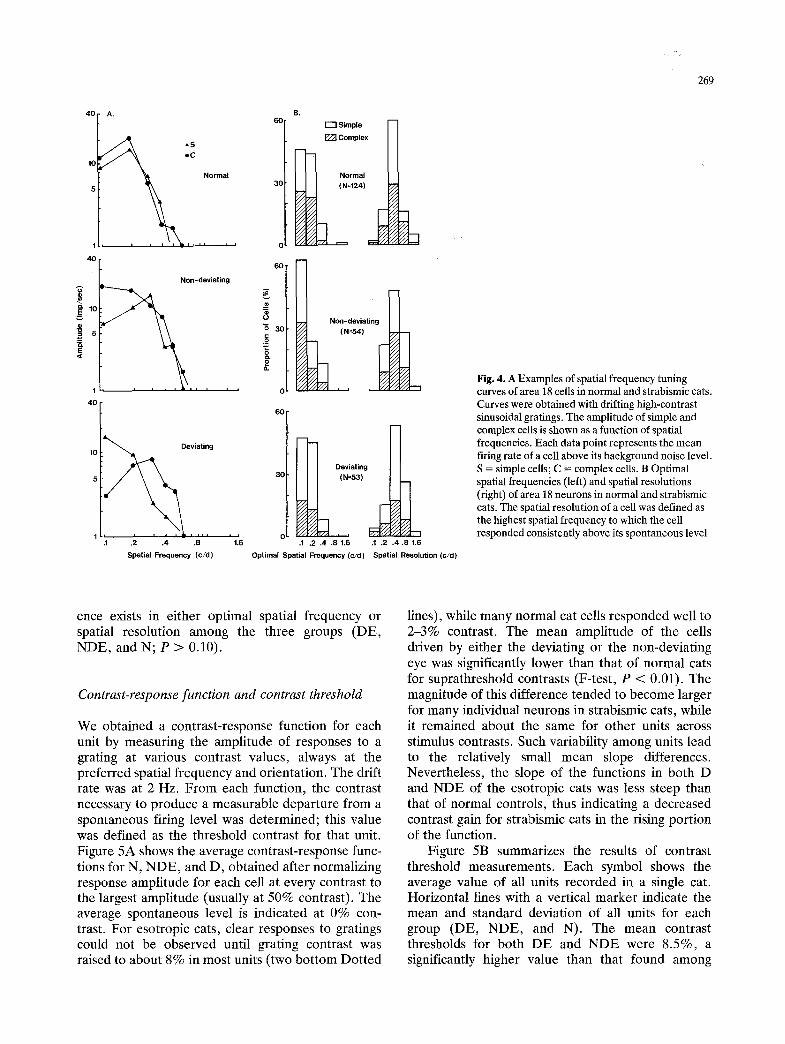
Spatial frequency tuning. Spatial frequency tuning curves were obtained with optimally oriented sinusoi- dal gratings of high contrast (50%), drifted across the receptive field in the preferred orientation for each cell at a temporal frequency of 2 Hz. Examples of tuning curves are shown in Fig. 4A. Unlike striate cortical neurons in normal cats, the area 18 cells (both simple and complex) in controls responded with vigorous firing to very low spatial frequencies (< 0.2 c/d), while most units were unresponsive to spatial frequencies higher than 0.5 c/d. Our control data are in good agreement with an earlier report (Movshon et al. 1978). In addition, Fig. 4A also shows that samples from strabismic cats had tuning characteristics similar to normal controls regardless of the cell type. These major observations are apparent in the distributions of optimal spatial fre- quencies (left columns) and spatial resolutions (right columns) of all samples, determined with drifting sinusoidal gratings (Fig. 4B). No significant differ-
269
_~ lO
45 = E <r
40 f A.
40 f Non-deviating
1 ' ' ' ~ ' ' ' ' ' ' 4O
10
5
.2 .4 .g 1.6 Spatial Frequency (c/d)
g
O
3(~
o . o
B, 60 I-'-I Simple
Complex
N o r m a l
30 (N=124)
o
o~ 1
Non-deviating
60 F-
Deviating 30 (N=53)
0 ' ' .1 .2 .4 .8 1.6 .1 ,2 .4.8 1,6
Optimal Spatial Frequency (c/d) Spatial Resolution (c/d)
Fig. 4. A Examples of spatial frequency tuning curves of area 18 cells in normal and strabismic cats. Curves were obtained with drifting high-contrast sinusoidal gratings. The amplitude of simple and complex cells is shown as a function of spatial frequencies. Each data point represents the mean tiring rate of a cell above its background noise level. S = simple cells; C = complex cells. B Optimal spatial frequencies (left) and spatial resolutions (right) of area 18 neurons in normal and strabismic cats. The spatial resolution of a cell was defined as the highest spatial frequency to which the cell responded consistently above its spontaneous level
ence exists in either optimal spatial frequency or spatial resolution among the three groups (DE, NDE, and N; P > 0.10).
Contrast-response function and contrast threshold
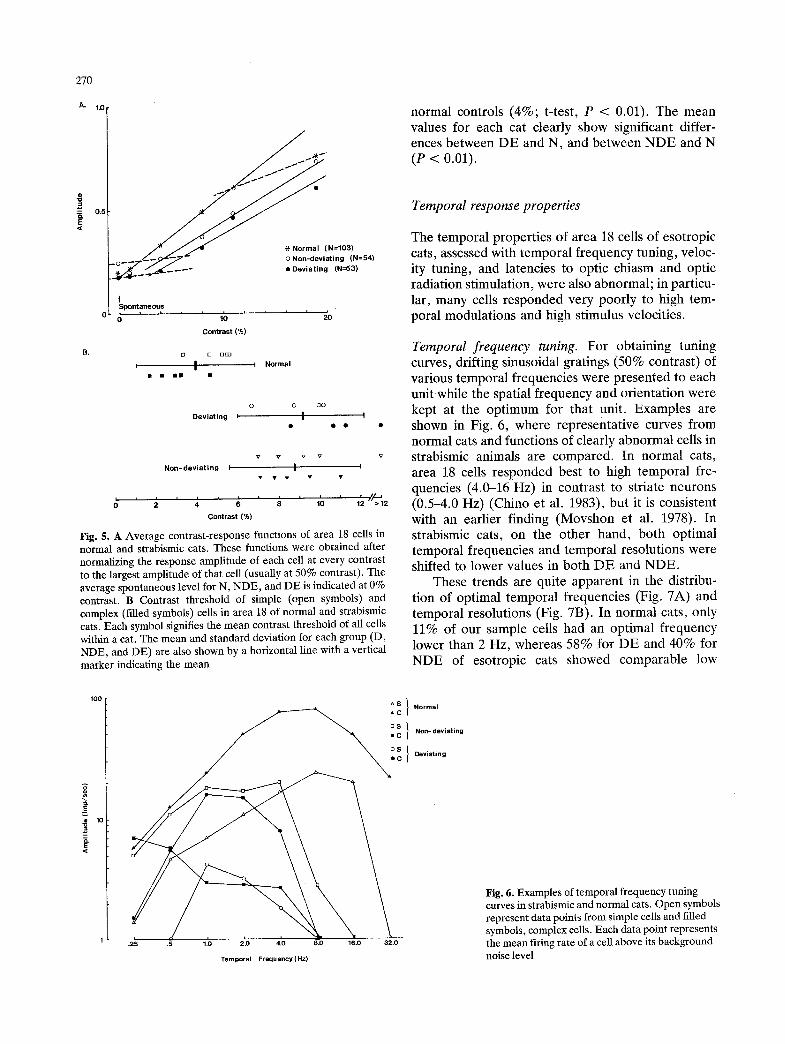
We obtained a contrast-response function for each unit by measuring the amplitude of responses to a grating at various contrast values, always at the preferred spatial frequency and orientation. The drift rate was at 2 Hz. From each function, the contrast necessary to produce a measurable departure from a spontaneous firing level was determined; this value was defined as the threshold contrast for that unit. Figure 5A shows the average contrast-response func- tions for N, NDE, and D, obtained after normalizing response amplitude for each cell at every contrast to the largest amplitude (usually at 50% contrast). The average spontaneous level is indicated at 0% con- trast. For esotropic cats, clear responses to gratings could not be observed until grating contrast was raised to about 8% in most units (two bottom Dotted
lines), while many normal cat cells responded well to 2-3% contrast. The mean amplitude of the cells driven by either the deviating or the non-deviating eye was significantly lower than that of normal cats for suprathreshold contrasts (F-test, P < 0.01). The magnitude of this difference tended to become larger for many individual neurons in strabismic cats, while it remained about the same for other units across stimulus contrasts. Such variability among units lead to the relatively small mean slope differences. Nevertheless, the slope of the functions in both D and NDE of the esotropic cats was less steep than that of normal controls, thus indicating a decreased contrast gain for strabismic cats in the rising portion of the function.
Figure 5B summarizes the results of contrast threshold measurements. Each symbol shows the average value of all units recorded in a single cat. Horizontal lines with a vertical marker indicate the mean and standard deviation of all units for each group (DE, NDE, and N). The mean contrast thresholds for both DE and NDE were 8.5%, a significantly higher value than that found among
270
A. 1.0[
_ ~ 0.5 r E <
o 5 , , (N=53)
Spontaneous i i 0 16
Contrast (%)
C3 [] O~ I
�9 �9 a m �9
I Normal
O O
Deviating I | '1
v v v v v
Non-deviating I I I
~ ' ; ' ~ ' ~ ' t~ ' t ~ / / : , 2 Contrast (%)
Fig. 5. A Average contrast-response functions of area 18 cells in normal and strabismic cats. These functions were obtained after normalizing the response amplitude of each cell at every contrast to the largest amplitude of that cell (usually at 50% contrast). The average spontaneous level for N, NDE, and DE is indicated at 0% contrast. B Contrast threshold of simple (open symbols) and complex (filled symbols) cells in area 18 of normal and strabismic cats. Each symbol signifies the mean contrast threshold of all cells within a cat. The mean and standard deviation for each group (D, NDE, and DE) are also shown by a horizontal line with a vertical marker indicating the mean
normal controls (4%; t-test, P < 0.01). The mean values for each cat clearly show significant differ- ences between DE and N, and between NDE and N (P < 0.01).
Temporal response properties
The temporal properties of area 18 cells of esotropic cats, assessed with temporal frequency tuning, veloc- ity tuning, and latencies to optic chiasm and optic radiation stimulation, were also abnormal; in particu- lar, many cells responded very poorly to high tem- poral modulations and high stimulus velocities.
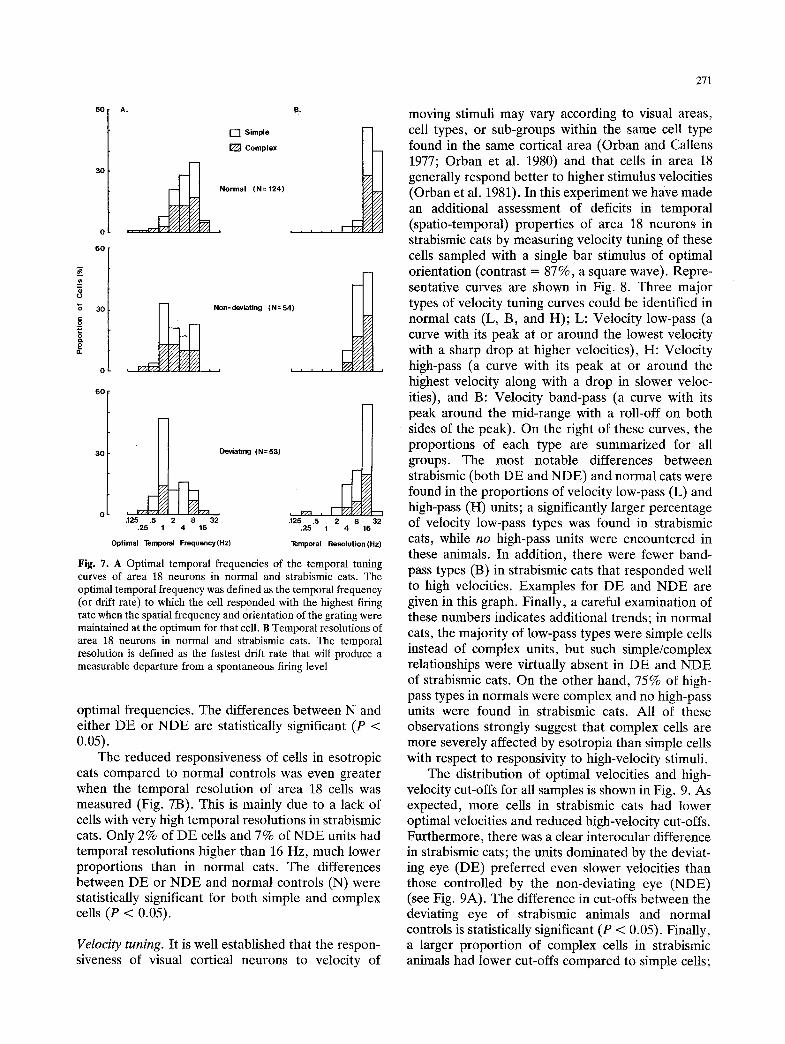
Temporal frequency tuning. For obtaining tuning curves, drifting sinusoidal gratings (50% contrast) of various temporal frequencies were presented to each unitwhile the spatial frequency and orientation were kept at the optimum for that unit. Examples are shown in Fig. 6, where representative curves from normal cats and functions of clearly abnormal cells in strabismic animals are compared. In normal cats, area 18 cells responded best to high temporal fre- quencies (4.0-16 Hz) in contrast to striate neurons (0.5-4.0 Hz) (Chino et al. 1983), but it is consistent with an earlier finding (Movshon et al. 1978). In strabismic cats, on the other hand, both optimal temporal frequencies and temporal resolutions were shifted to lower values in both DE and NDE.
These trends are quite apparent in the distribu- tion of optimal temporal frequencies (Fig. 7A) and temporal resolutions (Fig. 7B). In normal cats, only 11% of our sample cells had an optimal frequency lower than 2 Hz, whereas 58% for DE and 40% for NDE of esotropic cats showed comparable low
00 I AS } N . . . . I �9 C Non- deviating
oS �9 C Deviating
{'~
1 . 2 ; .5 1.O 2'.0 4,0 8.0 16.0 32.0
Temporal Frequency (Hz)
Fig. 6. Examples of temporal frequency tuning curves in strabismic and normal cats. Open symbols represent data points from simple cells and filled symbols, complex ceils. Each data point represents the mean firing rate of a cell above its background noise level
271
60 A.
30
0
60
30
I - 7 Simple
[ ~ Complex
~ Normal (N=124)
. . . . . I E
o n d i t in 4
, v/ , , , . . . .
60
;
3or/ Oe at..53 0 ' , , Ir271 .
.125 .5 8 32 .125 .5 2 8 32 .25 1 4 16 .25 1 4 16
Optimal Temporal Frequency(Hz) Temporal Resolut ion(Hz)
Fig. 7. A Optimal temporal frequencies of the temporal tuning curves of area 18 neurons in normal and strabismic cats. The optimal temporal frequency was defined as the temporal frequency (or drift rate) to which the cell responded with the highest firing rate when the spatial frequency and orientation of the grating were maintained at the optimum for that cell. B Temporal resolutions of area 18 neurons in normal and strabismic cats. The temporal resolution is defined as the fastest drift rate that will produce a measurable departure from a spontaneous firing level
optimal frequencies. The differences between N and either DE or NDE are statistically significant (P < 0.05).
The reduced responsiveness of cells in esotropic cats compared to normal controls was even greater when the temporal resolution of area 18 cells was measured (Fig. 7B). This is mainly due to a lack of cells with very high temporal resolutions in strabismic cats. Only 2% of DE cells and 7% of NDE units had temporal resolutions higher than 16 Hz, much lower proportions than in normal cats. The differences between DE or NDE and normal controls (N) were statistically significant for both simple and complex cells (P < 0.05).
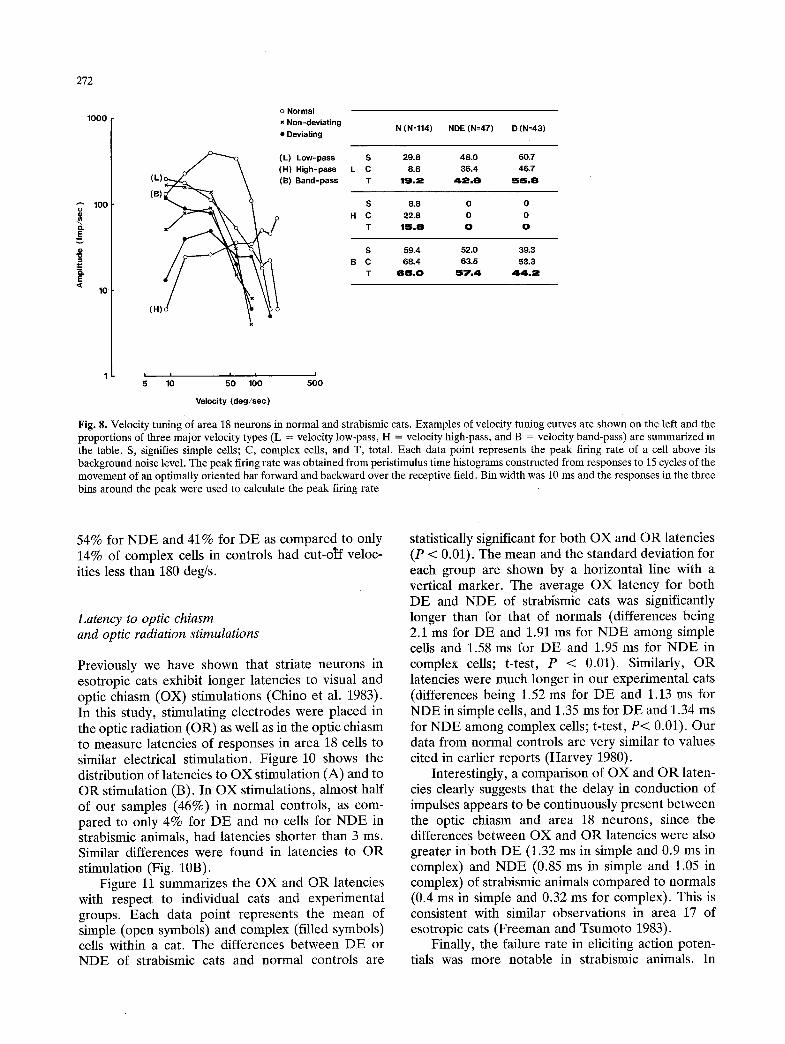
Velocity tuning. It is well established that the respon- siveness of visual cortical neurons to velocity of
moving stimuli may vary according to visual areas, cell types, or sub-groups within the same cell type found in the same cortical area (Orban and Callens 1977; Orban et al. 1980) and that cells in area 18 generally respond better to higher stimulus velocities (Orban et al. 1981). In this experiment we have made an additional assessment of deficits in temporal (spatio-temporal) properties of area 18 neurons in strabismic cats by measuring velocity tuning of these cells sampled with a single bar stimulus of optimal orientation (contrast = 87%, a square wave). Repre- sentative curves are shown in Fig. 8. Three major types of velocity tuning curves could be identified in normal cats (L, B, and H); L: Velocity low-pass (a curve with its peak at or around the lowest velocity with a sharp drop at higher velocities), H: Velocity high-pass (a curve with its peak at or around the highest velocity along with a drop in slower veloc- ities), and B: Velocity band-pass (a curve with its peak around the mid-range with a roll-off on both sides of the peak). ,On the right of these curves, the proportions of each type are summarized for all groups. The most notable differences between strabismic (both DE and NDE) and normal cats were found in the proportions of velocity low-pass (L) and high-pass (H) units; a significantly larger percentage of velocity low-pass types was found in strabismic cats, while no high-pass units were encountered in these animals. In addition, there were fewer band- pass types (B) in strabismic cats that responded well to high velocities. Examples for DE and NDE are given in this graph. Finally, a careful examination of these numbers indicates additional trends; in normal cats, the majority of low-pass types were simple cells instead of complex units, but such simple/complex relationships were virtually absent in DE and NDE of strabismic cats. On the other hand, 75% of high- pass types in normals were complex and no high-pass units were found in strabismic cats. All of these observations strongly suggest that complex cells are more severely affected by esotropia than simple cells with respect to responsivity to high-velocity stimuli.
The distribution of optimal velocities and high- velocity cut-offs for all samples is shown in Fig. 9. As expected, more cells in strabismic cats had lower optimal velocities and reduced high-velocity cut-offs. Furthermore, there was a clear interocular difference in strabismic cats; the units dominated by the deviat- ing eye (DE) preferred even slower velocities than those controlled by the non-deviating eye (NDE) (see Fig. 9A). The difference in Cut-offs between the deviating eye of strabismic animals and normal controls is statistically significant (P < 0.05). Finally, a larger proportion of complex cells in strabismic animals had lower cut-offs compared to simple cells;
272
1000
lOO
E <
lO
o Normal x Non-deviating
N (N=114) NDE (N=47) D (N=43) �9 Deviating
/ / J ~ (L) Low-pass S 29.8 48.0 60.7 (H) High-pass L C 8.8 36.4 46.7
) ~ \ (B) Band-pass T 19 ,2 : 4 2 , 6 ==5,8
o o H C 22.8 O O
x / T 1 5 . 2 0 0
S 59.4 52.0 39.3 B C 68.4 63.5 53.3
T 6 5 . 0 5 7 . 4 4 4 . 2
(H)
x
1 i i i i i 5 10 50 100 500
Velocity (deg/sec)
Fig. 8. Velocity tuning of area 18 neurons in normal and strabismic cats. Examples of velocity tuning curves are shown on the left and the proportions of three major velocity types (L = velocity low-pass, H = velocity high-pass, and B = velocity band-pass) are summarized in the table. S, signifies simple cells; C, complex cells, and T, total. Each data point represents the peak firing rate of a cell above its background noise level. The peak firing rate was obtained from peristimulus time histograms constructed from responses to 15 cycles of the movement of an optimally oriented bar forward and backward over the receptive field. Bin width was 10 ms and the responses in the three bins around the peak were used to calculate the peak firing rate
54% for NDE and 41% for DE as compared to only 14% of complex cells in controls had cut-olaf veloc- ities less than 180 deg/s.
Latency to optic chiasm and optic radiation stimulations
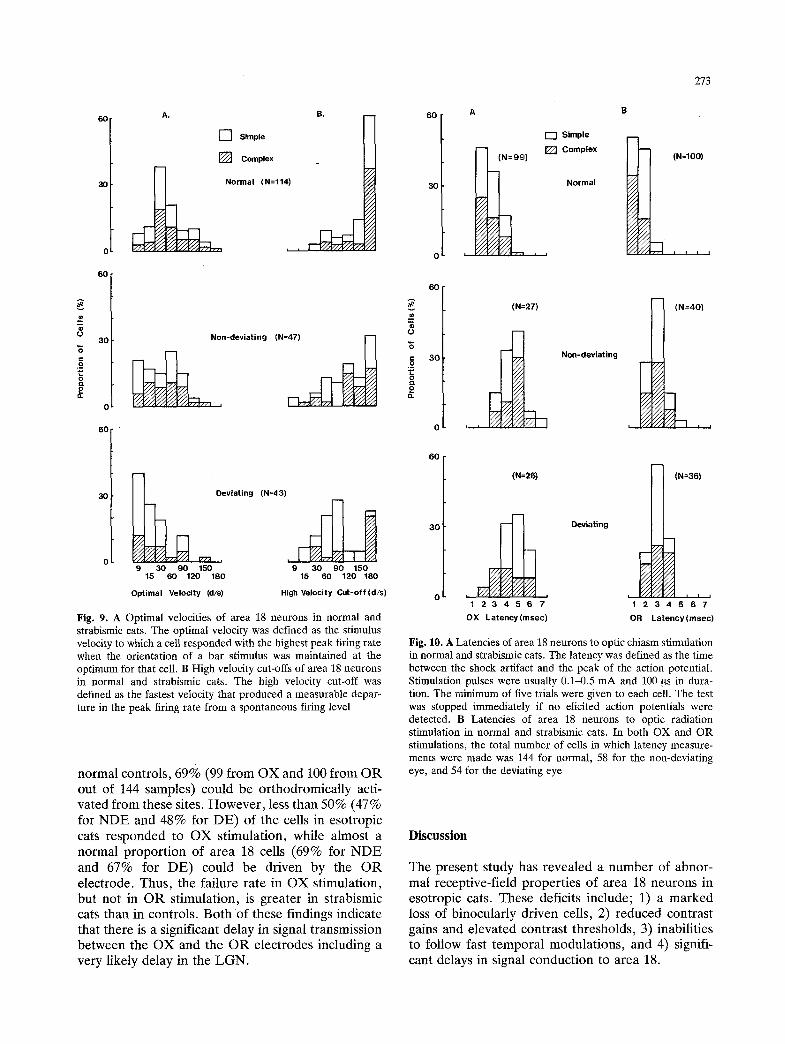
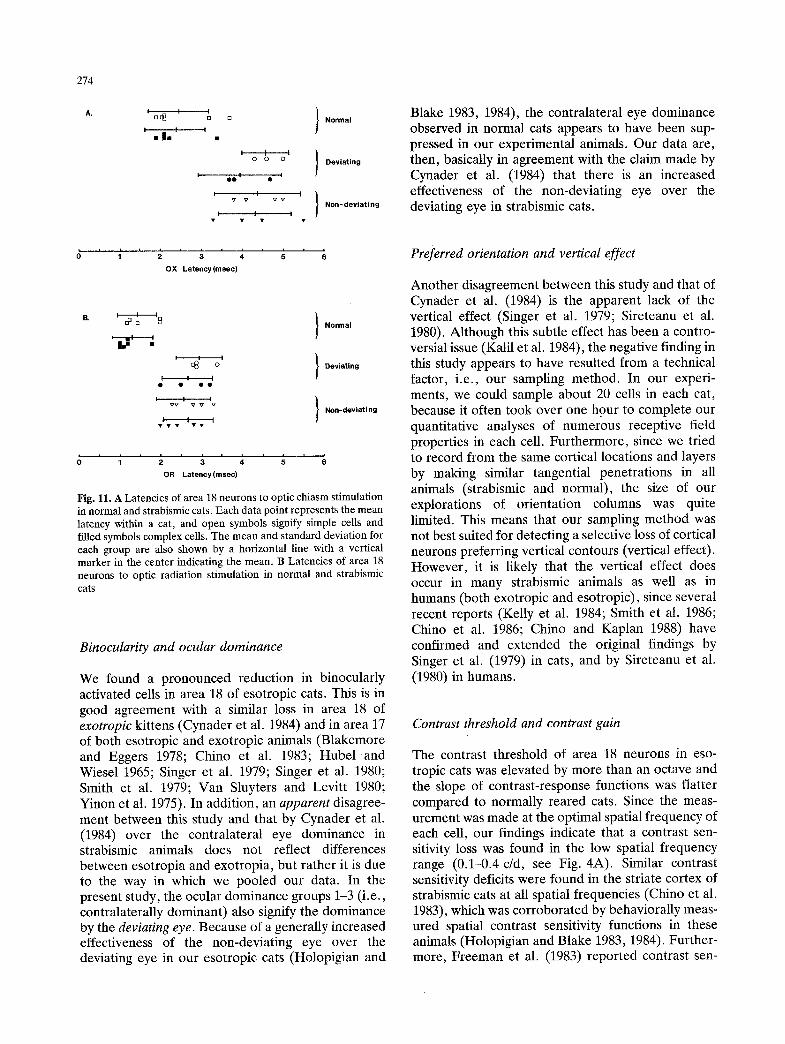
Previously we have shown that striate neurons in esotropic cats exhibit longer latencies to visual and optic chiasm (OX) stimulations (Chino et al. 1983). In this study, stimulating electrodes were placed in the optic radiation (OR) as well as in the optic chiasm to measure latencies of responses in area 18 cells to similar electrical stimulation. Figure 10 shows the distribution of latencies to OX stimulation (A) and to OR stimulation (B). In OX stimulations, almost half of our samples (46%) in normal controls, as com- pared to only 4% for DE and no cells for NDE in strabismic animals, had latencies shorter than 3 ms. Similar differences were found in latencies to OR stimulation (Fig. 10B).
Figure 11 summarizes the OX and OR latencies with respect to individual cats and experimental groups. Each data point represents the mean of simple (open symbols) and complex (filled symbols) cells within a cat. The differences between DE or NDE of strabismic cats and normal controls are
statistically significant for both OX and OR latencies (P < 0.01). The mean and the standard deviation for each group are shown by a horizontal line with a vertical marker. The average OX latency for both DE and NDE of strabismic cats was significantly longer than for that of normals (differences being 2.1 ms for DE and 1.91 ms for NDE among simple cells and 1.58 ms for DE and 1.95 ms for NDE in complex cells; t-test, P < 0.01). Similarly, OR latencies were much longer in our experimental cats (differences being 1.52 ms for DE and 1.13 ms for NDE in simple cells, and 1.35 ms for DE and 1.34 ms for NDE among complex cells; t-test, P< 0.01). Our data from normal controls are very similar to values cited in earlier reports (Harvey 1980).
Interestingly, a comparison of OX and OR laten- cies clearly suggests that the delay in conduction of impulses appears to be continuously present between the optic chiasm and area 18 neurons, since the differences between OX and OR latencies were also greater in both DE (1.32 ms in simple and 0.9 ms in complex) and NDE (0.85 ms in simple and 1.05 in complex) of strabismic animals compared to normals (0.4 ms in simple and 0.32 ms for complex). This is consistent with similar observations in area 17 of esotropic cats (Freeman and Tsumoto 1983).
Finally, the failure rate in eliciting action poten- tials was more notable in strabismic animals. In
60
30
0
60
A. B. - - 60
] Simple
[ ] Complex
30
0
60
Non-deviating (N=47)
30 Deviating (N=43)
9 30 go 150 9 30 90 150 15 60 120 180 15 60 120 180
Optimal Velocity (d/s) High Velocity Cut-off(d/s)
Fig. 9. A Optimal velocities of area 18 neurons in normal and strabismic cats. The optimal velocity was defined as the stimulus velocity to which a cell responded with the highest peak firing rate when the orientation of a bar stimulus was maintained at the optimum for that cell. B High velocity cut-offs of area 18 neurons in normal and strabismic cats. The high velocity cut-off was defined as the fastest veIocity that produced a measurable depar- ture in the peak firing rate from a spontaneous firing level
normal controls, 69% (99 from OX and 100 from OR out of 144 samples) could be orthodromically acti- vated from these sites. However, less than 50% (47% for NDE and 48% for DE) of the cells in esotropic cats responded to OX stimulation, while almost a normal proportion of area 18 cells (69% for NDE and 67% for DE) could be driven by the OR electrode. Thus, the failure rate in OX stimulation, but not in OR stimulation, is greater in strabismic cats than in controls. Both of these findings indicate that there is a significant delay in signal transmission between the OX and the OR electrodes including a very likely delay in the LGN.
0
2 o.
273
30
1"7 Simple
- - [~ ] Complex (N=99)
, ,
Normal
- - ~ (N=IOO)
t! , , , ,
6 0
3 0
(N=27)
Non-deviating
m (N=40)
60
30
(N=26l
2 = 1 2 3 4 5 6 7
OX Latency (msec)
Deviating
m
(N=36)
'1 3 5~6 = i 7
OR Latency (msec)
Fig. 10. A Latencies of area 18 neurons to optic chiasm stimulation in normal and strabismic cats. The latency was defined as the time between the shock artifact and the peak of the action potential. Stimulation pulses were usually 0.1-0.5 mA and 100 ~s in dura- tion. The minimum of five trials were given to each cell. The test was stopped immediately if no elicited action potentials were detected. B Latencies of area 18 neurons to optic radiation stimulation in normal and strabismic cats. In both OX and OR stimulations, the total number of cells in which latency measure- ments were made was 144 for normal, 58 for the non-deviating eye, and 54 for the deviating eye
Discussion
The present study has revealed a number of abnor- mal receptive-field properties of area 18 neurons in esotropic cats. These deficits include; 1) a marked loss of binocularly driven cells, 2) reduced contrast gains and elevated contrast thresholds, 3) inabilities to follow fast temporal modulations, and 4) signifi- cant delays in signal conduction to area 18.
274
A , * G ~ I t 1 n [] Normal i I i
�9 I , �9
' ~ o' / o Deviating !
I t l I t I
I I I v v v v / Non-deviating
[ I I
OX Latency(msec)
I ~ / I~ / N . . . . I
/
' 4 ' ' / o Deviating
! �9 e t
I I I v 1 ~ ' v v Non-deviating ! TI �9 I I �9 � 9
OR Latency (msec)
Fig. ll. A Latencies of area 18 neurons to optic chiasm stimulation in normal and strabismic cats. Each data point represents the mean latency within a cat, and open symbols signify simple cells and filled symbols complex cells. The mean and standard deviation for each group are also shown by a horizontal line with a vertical marker in the center indicating the mean. B Latencies of area 18 neurons to optic radiation stimulation in normal and strabismic cats
Binocularity and ocular dominance
We found a pronounced reduction in binocularly activated cells in area 18 of esotropic cats. This is in good agreement with a similar loss in area 18 of exotropic kittens (Cynader et al. 1984) and in area 17 of both esotropic and exotropic animals (Blakemore and Eggers 1978; Chino et al. 1983; Hubel and Wiesel 1965; Singer et al. 1979; Singer et al. 1980; Smith et al. 1979; Van Sluyters and Levitt 1980; Yinon et al. 1975). In addition, an apparent disagree- ment between this study and that by Cynader et al. (1984) over the contralateral eye dominance in strabismic animals does not reflect differences between esotropia and exotropia, but rather it is due to the way in which we pooled our data. In the present study, the ocular dominance groups 1-3 (i.e., contralaterally dominant) also signify the dominance by the deviating eye. Because of a generally increased effectiveness of the non-deviating eye over the deviating eye in our esotropic cats (Holopigian and
Blake 1983, 1984), the contralateral eye dominance observed in normal cats appears to have been sup- pressed in our experimental animals. Our data are, then, basically in agreement with the claim made by Cynader et al. (1984) that there is an increased effectiveness of the non-deviating eye over the deviating eye in strabismic cats.
Preferred orientation and vertical effect
Another disagreement between this study and that of Cynader et al. (1984) is the apparent lack of the vertical effect (Singer et al. 1979; Sireteanu et al. 1980). Although this subtle effect has been a contro- versial issue (Kalil et al. 1984), the negative finding in this study appears to have resulted from a technical factor, i.e., our sampling method. In our experi- ments, we could sample about 20 cells in each cat, because it often took over one hour to complete our quantitative analyses of numerous receptive field properties in each cell. Fur thermore, since we tried to record from the same cortical locations and layers by making similar tangential penetrations in all animals (strabismic and normal), the size of our explorations of orientation columns was quite limited. This means that our sampling method was not best suited for detecting a selective loss of cortical neurons preferring vertical contours (vertical effect). However, it is likely that the vertical effect does occur in many strabismic animals as well as in humans (both exotropic and esotropic), since several recent reports (Kelly et al. 1984; Smith et al. 1986; Chino et al. 1986; Chino and Kaplan 1988) have confirmed and extended the original findings by Singer et al. (1979) in cats, and by Sireteanu et al. (1980) in humans.
Contrast threshold and contrast gain
The contrast threshold of area 18 neurons in eso- tropic cats was elevated by more than an octave and the slope of contrast-response functions was flatter compared to normally reared cats. Since the meas- urement was made at the optimal spatial frequency of each cell, our findings indicate that a contrast sen- sitivity loss was found in the low spatial frequency range (0.1-0.4 c/d, see Fig. 4A). Similar contrast sensitivity deficits were found in the striate cortex of strabismic cats at all spatial frequencies (Chino et al. 1983), which was corroborated by behaviorally meas- ured spatial contrast sensitivity functions in these animals (Holopigian and Blake 1983, 1984). Further- more, Freeman et al. (1983) reported contrast sen-
275
sitivity deficits in the striate cortex of their strabismic cats with a greater loss at lower spatial frequencies. These contrast sensitivity deficits at low spatial frequencies in the striate cortex and area 18 of strabismic cats suggest that although intracortical changes are likely to be the major factor responsible for the deficits, abnormal Y-LGN inputs to cortical areas may not be ruled out as an additional cause. We are currently investigating the contrast sensitivity of Y-cells in the LGN of esotropic cats, and the preliminary data indicate that their contrast-response functions are indeed suppressed.
Temporal frequency tuning
Experiments on temporal frequency tuning revealed that area 18 neurons in esotropic cats were not as responsive to rapid temporal modulations; i.e., opti- mal temporal frequencies and temporal resolutions were shifted to lower values. This finding is consist- ent with our observations in the striate cortex of strabismic cats (Chino et al. 1983), but the magnitude of the deficit was greater in area 18. Previously, Ikeda and Wright (1976) reported that critical flicker fusion frequency (CFF) of "transient" LGN cells receiving an input from the area centralis of the deviating eye was significantly reduced; thus, implicating the deficits in Y-pathways in precortical neurons of strabismic cats that may be responsible for the present results. It is possible that the difference in severity of temporal deficits between area 17 and 18 may reflect differential inputs of Y-LGN cells to these two cortical areas (Sherman and Spear 1982).
The present findings in esotropic cats are consist- ent with parallel psychophysical observations in human strabismic amblyopes (Alpern et al. 1960; Hamasaki and Flynn 1981; Manny and Levi 1982; Wesson and Loop 1982). For example, Wesson and Loop (1982) reported that the peak sensitivity and the high-frequency resolution of temporal contrast sensitivity functions in strabismic amblyopes were shifted to lower values, and that the contrast sensitiv- ity difference between the amblyopic and the non- amblyopic eye became progressively larger as tem- poral frequency increased. Similar, but smaller, deficits were reported by Manny and Levi (1982) in some of their strabismic amblyopes, but the contrast sensitivity reduction in their study was most dramatic at lower temporal frequencies. Thus, we need to be cautious in comparing animal data with similar find- ings in human studies, since temporal deficits appear to heavily depend on the spatial properties of the stimulus and the nature of the acuity loss (Bradley and Freeman 1985; Manny and Levi 1982).
Velocity tuning
Measurements of velocity tuning in area 18 neurons further confirm our argument that the Y-pathway of these animals may be abnormal. We encountered no velocity high-pass cells in esotropic cats (Fig. 8), and their optimal velocities and high velocity cut-offs were significantly lower compared to those in nor- reals. It should be noted that Y-LGN cells have tuning similar to velocity high-pass cells of area 18 in normal cats, while X-LGN cells have tuning resem- bling velocity band-pass with reduced high-velocity cut-offs or velocity low-pass (Sanderson and Dreher 1973). Since the major geniculate inputs to area 18 are Y-cells, it is not surprising that 16% of area 18 cells in our normal cats were classified as velocity high-pass. This proportion is very close to that reported by Orban et al. (1980). In addition, 65% of normal samples were velocity band-pass types with high velocity cut-offs. On the contrary, in the eso- tropic cat, there was no velocity high-pass unit in area 18 and almost 50% (compared to 19% in controls) were velocity low-pass units.
Latencies to OX and OR stimulation
Latencies to OX and OR stimulation of area 18 neurons are significantly prolonged in esotropic cats and these results provide very convincing evidence for the argument that the Y-pathway in these animals may be anomalous. The observed prolongation of OX latencies in esotropic cats could be attributed to many factors: e.g., a delay in conduction in the optic tract fibers, reduced synaptic transmission in the LGN, slower conduction in the radiation fibers, reduced synaptic transmission in area 18, or a combi- nation of these deficits. The exact nature of the delay is unclear. However, it can be at least argued that since the OX-OR difference in esotropic cats was also prolonged (about 1.6 ms) compared to that in normal controls (about 1.0 ms), signals appeared to be slowed throughout the pathway between the chiasm and area 18 cells. In fact, the magnitude of delay was very similar in the part of the pathway distal to the OR electrode and the part central to the same electrode.
In this context, the failure rate in eliciting action potentials by OX or OR stimulation is quite reveal- ing; i.e., the failure rate was substantially greater in esotropic cats and it is unique to OX stimulation. This finding implies that the transmission of action potentials initiated by the OX electrode through the LGN fails, or that the inputs to these area 18 cells come from somewhere other than the OT-LGN-OR
276
pathway. Projections to area 18 f rom the pulvinar (Gilbert and Kelly 1975; Kennedy and Baledydier 1977; Maciewicz 1975) and the lateral posterior nucleus (Hollander and Vanegas 1977; Niimi and Sprague 1977) are examples of such pathways. How- ever, since the receptive-field propert ies of those area 18 cells that are unresponsive to O X stimula- tions do not differ f rom those responding normally to such stimulation, this possibility is highly unlikely. Instead, signal transmission through the L G N may be depressed in esotropic cats. This view is consistent with our aforement ioned finding that the conduction between OX and O R electrodes in these animals is significantly delayed. Many possibilities (anatomical and/or physiological) exist to explain such conduction delays in the L G N of strabismic cats. One possibility is that the connection between Y-retinal axon arbors and their target Y - L G N cells may not fully develop in these animals as evidenced in monocular ly deprived kittens (Sur et al. 1982; Garra th ty et al. 1986). In fact, our preliminary investigation showed that in esotropic cats, the Y-axon arbors projecting to the lamina A of the L G N severely shrunk or disap- peared. Finally, it is also possible that the synaptic transmission of neural signals may be suppressed in or around the L G N due to rearing with esotropia. The mechanism for such suppression is currently being investigated in our laboratory.
Abnormalities in the non-deviating eye
The physiological deficits in area 18 of esotljopic cats were demonstra ted with the non-deviating eye as with the deviating eye ( though the severity was greater in the deviating eye). This is consistenf with our previous findings in the striate cortex (Clfino et al. 1983). The bilateral nature of the deficits in the receptive field propert ies of both area 17 and 18 is likely to originate f rom abnormal binocular competi- tion in cortical neurons during the critical develop- mental period. On the other hand, based on our findings in stimulation experiments, it is likely that at least in area 18, the factors contributing to the anomalies can be part ly traced to the Y-pathway, as distal as the synaptic connections between the optic tract fibers and L G N neurons (albeit, pr imary altera- tions may still occur intracortically). One possibility is that the gain control of retinogeniculate transmis- sion of signals (Kaplan et al. 1987) may be affected in our esotropic cats, and that the development of such gain control mechanisms may depend upon normal binocular interactions of neural signals within the L G N (Bishop et al. 1953; Guillery 1971; Hayashi 1972; Kato et al. 1971; Pape and Eysel 1986; Sander-
son et al. 1969, 1971; Singer 1970; Suzuki and Takahashi 1970) and/or through the corticofugal pathways (Gilbert and Kelly 1975; Guillery 1967; Jones and PoweU 1975; Tsumoto et al. 1983). More specific investigations on the nature of binocular interactions in the L G N (Schmielau and Singer 1977; Sherman and Koch 1986) of esotropic cats are necessary to explain the entire mechanism underlying the deficits described in this study and its bilateral nature.
Acknowledgements. We thank Drs. E. Kaplan, R. Lin, and E.L. Smith for helpful comments on our manuscript, and L. Agenlian, L. Wytrwal, and A. Pouch for preparing the figures. This work was supported by the National Institutes of Health research grant R01-EY-03588.
References
Alpern M, Flitman DB, Joseph RH (1960) Centrally fixed flicker thresholds in amblyopia. Am J Ophthalmol 49:1194-1202
Barlow HB, Blakemore C, Pettigrew JD (1967) The neural mechanism of binocular depth discrimination. J Physiol (Lond) 193:327-342
Bishop PO, Jeremy D, Mcleod JG (1953) The phenomenon of repetitive firing in the lateral geniculate nucleus. J Neurophy- siol 16:437-447
Bishop PO, Kozak W, Vakkur GJ (1962) Some quantitative aspects of the cat's eye: axis and plane of reference, visual field co-ordinates and optics. J Physiol (Lond) 163:466-502
Blakemore C, Eggers HM (1978) Effects of artificial anisomet- ropia and strabismus on the kitten's visual cortex. Arch Ital Biol 116:385-389
Bradly A, Freeman RD (1985) Temporal sensitivity in amblyopia: an explanation of conflicting reports. Vision Res 25:39-46
Chino YM, Kaplan E (1986) Does esotropia really cause amblyopia in LGN X-cells. Invest Ophthalmol Vis Sci [suppl] 27:242
Chino YM, Kaplan E (1988) Abnormal orientation bias of LGN X-cells in strabismic cats. Invest Ophthalmol Vis Sci (in press)
Chino YM, Shansky MS, Hamasaki DI (1980a) Development of receptive field properties of retinal ganglion cells in kittens raised with a convergent squint. Exp Brain Res 39:313-320
Chino YM, Shansky MS, Pizzi WJ (1980b) Receptive field properties of simple and complex striate neurons in Siamese cats. J Comp Neurol 190:63-86
Chino YM, Shansky MS, Jankowski WL, Banser FA (1983) Effects of rearing kittens with convergent strabismus on development of receptive field properties in striate cortex neurons. J Neurophysiol 50:265-286
Chino YM, Kaplan E, Holopigian K (1986) The vertical effect in X-LGN neurons in kittens reared with unilateral convergent squint. Neuroscience Abstr 12:591
Cleland BC, Crewther DP, Gillard-Crewther S, Mitchell DE (1982) Normality of spatial resolution of retinal ganglion cells in cats with strabismic amblyopia. J Physiol (Lond) 236: 235-249
Crewther SG, Crewther DP, Cleland BG (1985) Convergent strabismic amblyopia in cats. Exp Brain Res 60:1-9
Cynader M, Gardner JC, Mustari M (1984) Effects of neonatally induced strabismus on binocular responses in cat area 18. Exp Brain Res 53:384-399
277
Freeman RD, Tsumoto T (1983) An electrophysiological compari- son of convergent and divergent strabismus in the cat: electrical and visual activation of single cortical cells. J Neuro- physiol 49:238-253
Freeman RD, Sclar G, Ohzawa I (1983) An electrophysiological comparison of convergent and divergent strabismus in the cat: visual evoked potentials. J Neurophysiol 49:227-237
Garraghty PE, Sur M, Sherman SM (1986) Role of competitive interactions in the postnatal development of X- and Y- retinogeniculate axons. J Comp Neurol 251:216-239
Gilbert CD, Kelly JP (1975) The projections of cells in different layers of the cat's visual cortex. J Comp Neurol 163:81-106
Grunau MW von, Singer W (1980) Functional amblyopia in kittens with unilateral exotropia. II. Correspondence between behavioral and eleetrophysiological assessment. Exp Brain Res 40:305-310
Guillery RW (1967) Pattern of fiber degeneration in the dorsal lateral geniculate nucleus of the cat following lesions in the visual cortex. J Comp Neurol 130:197-222
Guillery RW (1971) Patterns of synaptic interconnections in the dorsal lateral geniculate nucleus of cat and monkey: a brief review. Vision Res [Suppl] 3:211-227
Hamasaki DI, Flynn JT (1981) Amblyopic eyes have longer reaction time. Invest Ophthalmol Vis Sci 21:846-853
Harvey AR (1980) The afferent connexions and laminar distribu- tion of ceils in area 18 of the cat. J Physiol (Lond) 302: 483-505
Hayashi Y (1972) Terminal depolarization of intrageniculate optic tract fibers produced by moving visual stimulus. Brain Res 42: 215-219
Holl~inder H, Vanegas H (1977) The projection from the lateral genieulate nucleus onto the visual cortex in the cat. A quantitative study with horseradish-peroxidase. J Comp Neurol 173:51%536
Holopigian K, Blake R (1983) Spatial vision in strabismic cats. J Neurophysiol 50:287-296
Holopigian K, Blake R (1984) Abnormal spatial frequency chan- nels in esotropic cats. Vision Res 24:677-688
Hubel DH, Wiesel TN (1965) Binocular interaction in striate cortex of kittens reared with artificial squint. J Neurophysiol 28:1041-1059
Humphrey AL, Sur M, Uhlrich D J, Sherman SM (1985a) Projec- tion patterns of individual X- and Y-cell axons from the lateral genicnlate nucleus to cortical area 17 in the cat. J Comp Neurol 233:159-189
Humphrey AL, Sur M, Uhlrich D J, Sherman SM (1985b) Termi- nation patterns of individual X- and Y-cell axons in the visual cortex of the cat: projections to area 18. J Comp Neurol 233: 190-212
Ikeda H, Wright MJ (1976) Properties of LGN cells in kittens reared with convergent squint: a neurophysiological demon- stration of amblyopia. Exp Brain Res 25:63-77
Ikeda H, Tremain KE, Einon G (1978) Loss of spatial resolution of lateral geniculate nucleus neurons in kittens reared with convergent squint produced at different stages of develop- ment. Exp Brain Res 31:20%220
Jacobson SG, Ikeda H (1979) Behavioural studies of spatial vision in cats reared with convergent squint: is amblyopia due to arrest of development? Exp Brain Res 34:11-26
Jones EG, Powell TOS (1975) Electron microscopic study of the mode of termination of corticothalamic fibres within the sensory relay nuclei of the cat. Proc R Soc London, Ser B 172: 173-185
Jones KR, Kalil RE, Spear PD (1984) Effects of strabismus on responsivity, spatial resolution, and contrast sensitivity of cat lateral geniculate neurons. J Neurophysiol 52:538-552
Kalil RE, Spear PD, Langsetmo A (1984) Response properties of
striate cortex neurons in cats raised with divergent or conver- gent strabismus. J Neurophysiol 52:514-537
Kaplan E, Purpra K, Shapley RL (1987) Contrast affects the transmission of visual information through the mammalian LGN. J Physiol (Lond) (in press)
Kato H, Yamamoto M, Nakahama H (1971) Intracellular record- ings from the lateral geuiculate neurons of cats. Jpn J Physiol 21:307-323
Kelly SA, Chino YM, Berman MS (1984) The effects of grating orientation on contrast sensitivity in the non-deviating eye of strabismic patients. Invest Ophthalmol Vis Sci [Suppl] 25:219
Kennedy H, Baleydier C (1977) Direct projections from thalamic intralaminar nuclei to extra-striate visual cortex in the cat traced with horseradish peroxidase. Exp Brain Res 28: 133-139
Lehmkule S, Kratz KE, Mangel SC, Sherman SM (1980) Spatial and temporal sensitivity of X- and Y-cells in dorsal lateral geniculate nucleus of the cat. J Neurophysiol 43:420-441
Maciewicz RJ (1975) Thalamic afferents to areas 17, 18 and 19 of cat cortex traced with horseradish peroxidase. Brain Res 84: 308-312
Manny RE, Levi DM (1982) Psychophysical investigations of the temporal modulation sensiti36ty function in amblyopia: uniform field flicker. Invest Ophthalmol Vis Sci 22:515-524
Milkman N, Schick G, Rossetto M, Ratcliff F, Shapley R, Victor J (1980) A two-dimensional computer-controlled visual stimulator. Behav Res Methods Instrum 12:283-292
Mitchell DE, Ruck M, Kaye MG, Kirby S (1984) Immediate and long-term effects on visual acuity of surgically induced strabis- mus in kittens. Exp Brain Res 55:420-430
Movshon JA, Thompson ID, Tolhurst DJ (1978) Spatial and temporal contrast sensitivity of neurons in area 17 and 18 of the cat's visual cortex. J Physiol (Lond) 283:101-120
Mower GD, Burchfield JL, Duffy FH (1982) Animal models of strabismic amblyopia: physiological studies of visual cortex and the lateral geniculate nucleus. Dev Brain Res 5:311-327
Niimi K, Sprague JM (1977) Thalamo-cortical organization of the visual system in the cat. J Comp Neurol 138:21%250
Orban GA, Callens M (1977) Influences of movement parameters on area 18 neurons in the cat. Exp Brain Res 30:10%123
Orban GA, Kennedy H, Maes H (1980) Functional changes across the 1%18 border in the cat. Exp Brain Res 39:177-186
Orban GA, Kennedy H, Maes H (1981) Responses to movement of neurons in area 17 and 18 of the cat: velocity sensitivity. J Neurophysiol 45:105%1073
Pape HC, Eysel UT (1986) Binocular interactions in the lateral geniculate nucleus of the cat: GABAergic inhibition reduced by dominant activity. Exp Brain Res 61:265-271
Sanderson KJ, Darian-Smith I, Bishop PO (1969) Binocular corresponding receptive fields of single units in the cat dorsal lateral genicnlate nucleus. Vision Res 9:1297-1303
Sanderson KJ, Dreher B (1973) Receptive field analysis: responses to moving visual contours by single lateral geniculate neurons in the cat. J Physiol (Lond) 234:95-118
Schmielau F, Singer W (1977) The role of visual cortex for binocular interactions in the cat lateral geniculate nucleus. Brain Res 120:354-361
Sherman SM, Koch C (1986) The control of retinogeniculate transmission in the mammalian lateral geniculate nucleus. Exp Brain Res 63:1-20
Sherman SM, Spear PD (1982) Organization of visual pathways in normal and visually deprived cats. Physiol Rev 62:738-855
Singer W (1970) Inhibitory binocular interaction in the lateral geniculate body of the cat. Brain Res 18:165-170
Singer W, Grunau M von, Rauschecker J (1979) Squint affects striate cortex cells encoding horizontal image movements. Brain Res 170:182-186
278
Singer W, Grunau M von, Rauschecker J (1980) Functional amblyopia in kittens with unilateral exotropia. I. Electrophy- siological assessment. Exp Brain Res 40:294-304
Sireteanu R, Singer W (1980) The "vertical effect" in human squint amblyopia. Exp Brain Res 40:354-357
Smith EL, Bennett MJ, Harwerth RS, Crawford MLJ (1979) Binocularity in kittens reared with optically induced squint. Science 204:875-877
Smith EL, Harwarth RS (1986) Recovery of binocularity in kittens reared with optically induced strabismus. Invest Ophthalmol Vis Sci [Suppl] 27:154
Stone J, Dreher B (1973) Projections of X- and Y-cells of the cat's lateral geniculate nucleus to area 17 and area 18 of visual cortex. J Neurophysiol 36:551-567
Sur M, Sherman SM (1982) Refinogenicuiate terminations in cats: morphological differences between X- and Y-cell axons. Science 218:389-391
Suzuki H, Takahashi M (1970) Organization of lateral geniculate neurons in binocular inhibition. Brain Res 23:261-264
Tsumoto T, Freeman RD (1983) Effects of strabismus on develop- ment of cortico-geniculate projections in the kittens. Exp Brain Res 44:33%339
Van Sluyters RC, Levitt FB (1980) Experimental strabismus in the kitten. J Neurophysiol 43:686-699
Wesson MD, Loop MS (1982) Temporal contrast sensitivity in amblyopia. Invest Ophthalmol Vis Sci 22:98-102
Yinon U, Auerbach E, Blank M, Friesenhausen J (1975) The ocular dominance of cortical neurons in cats developed with divergent and convergent squint. Vision Res 15:1251-1256
Received August 17, 1987 / Accepted April 22, 1988