Embed Size (px)
Citation preview
Effects of professional development on
teachers’ gendered feedback patterns,
students’ misbehaviour and students’ sense
of equity: results from a one-year
quasi-experimental study
Els Consuegraa* and Nadine Engelsa,baDepartment of Educational Sciences, Vrije Universiteit Brussel, Brussels, Belgium;bDepartment of Teacher Education, Vrije Universiteit Brussel, Brussels, Belgium
There have been numerous studies investigating the extent to which teacher–student classroominteractions differ between boys and girls and the results of these studies suggest that teacher nega-
tive feedback is higher for boys, which in turn leads to lower levels of on-task behaviour. The article
describes the results of a quasi-experimental study, involving 30 teachers and a selection of 129 of
their students, aimed at improving teacher feedback patterns, student behavioural responses and
student perception of equity in the classroom environment. Fifteen teachers took part in a five-
session professional development programme in which they investigated their own teaching practice
by means of collaborative appreciative inquiry. The pre-test and post-test data in the control group
illustrate that girls who receive very high levels of positive feedback at the beginning of the year suc-
ceed in maintaining and even strengthening their position as favoured students while at the same
time lowering their level of raising hands and increasing their level of calling out to the teacher. By
contrast, the data in the intervention group show a drop of very high levels of positive feedback and
we see the levels of misbehaviour in boys and girls rise. Students’ sense of equity increases for all
conditions to some extent. The paper considers two alternative explanations for the results: some
students actively resist changes in teacher treatment and various confounding factors might have
been omitted. Implications and suggestions for further research and the design of professional
development programmes on gendered classroom interactions are discussed.
Keywords: classroom interaction; gender; professional development; teacher feedback
1. Problem
Previous research has convincingly shown that teacher–student classroom interac-
tions are gendered (Howe, 1997; Jones & Dindia, 2004; Beaman et al., 2006). One
recurrent finding is that, in general, boys receive more negative feedback from their
teachers than girls. Negative feedback is usually used to refer to disapproval such as
‘stop that’ and ‘be quiet’, teachers’ scornful or disapproving repetition of a pupil’s
*Corresponding author: Department of Educational Sciences, Vrije Universiteit Brussel, Pleinlaan
2, 1050 Brussels, Belgium. Tel.: +32 2 6292288; fax: +32 2 6203636. Email: els.consuegra@
vub.ac.be
© 2016 British Educational Research Association
British Educational Research JournalVol. 42, No. 5, October 2016, pp. 802–825
DOI: 10.1002/berj.3238
response, teacher comments implying negative consequences such as ‘I won’t tell you
again’, and saying ‘no’ in response to incorrect student responses. The meta-analysis
of Kelly (1988) concludes that boys receive more negative feedback and the review of
Beaman et al. in 2006 confirms that the situation still existed. Patterns of gendered
negative feedback might have remained stable throughout the years, interpretations
of the results have not. In the 1980s a teacher gender bias was theorised explaining
that teachers have different expectations of boys and girls and that these are self-
fulfilling by means of gendered treatment (Brophy, 1985). In the 1990s the existence
of teacher gender bias was called into question. It was suggested that boys bring criti-
cism upon themselves as a consequence of their higher levels of disruptive behaviour
(Howe, 1997).
Recent evidence shows that both theories are – at least in part – correct. Consuegra
et al. (2015) found that girls indeed get away with some classroom misbehaviour (e.g.
talking to other students), while other misbehaviours (e.g. calling out) are more
prevalent in boys and are related to teacher criticism in boys and girls alike. Teacher
gender bias is thus subtle, nonetheless, it might be affecting students. Boys argue that
teachers are more lenient toward girls and they report higher levels of discrimination
in class (Younger et al., 1999; Consuegra et al., 2015). Teachers, on the other hand,
are found to be relatively unaware of their gender differential treatment, sticking to
the belief that they treat boys and girls equally (Younger et al., 1999; Garrahy, 2001;
Consuegra et al., 2016).
With regard to positive feedback empirical findings are inconsistent. Some review
studies conclude that boys and girls receive equal amounts (e.g. Jones & Dindia,
2004) while others report that boys occasionally receive more positive feedback than
girls (e.g. Howe & Abedin, 2013). Howe in 1997 concluded that research on positive
interactions is inconclusive and she suggests studying the proportion of positive to
negative interactions rather than the separate frequencies, since it may be more signif-
icant in terms of impact on pupils. Only few studies have, however, investigated cau-
sal relationships between teacher feedback and student behavioural responses by
means of experimental research (Howe, 1997; White, 2010).
This study is aimed at investigating causal relationships between teacher feedback
and student behaviour as well as the effect of a professional development programme
on gendered teacher–student classroom interactions and students’ perception of
equity in the classroom environment.
2. Theoretical framework
Effectiveness of teacher professionalisation
Assessing the effectiveness of teacher professional development is a complex issue
where limited empirical evidence is available. Several authors have recently reviewed
the existing literature and have presented conceptual frameworks to evaluate the
impact of professional development on teacher practice and student learning (e.g.
Hammerness et al., 2007; Timperley et al., 2007; Desimone, 2009; van Veen et al.,
2010). The question of the impact of professional development on teacher practice
and then on pupil outcomes is a layered issue. Change through teacher learning will
Effects of professional development 803
© 2016 British Educational Research Association
not automatically lead to improved pupil learning. The process of effective teacher
professional development is not a simple process of cause and effect; it is not a logical
sequence with change moving through professional learning, teacher knowledge and
skills, teacher practice and instruction, pupil behaviour and pupil learning. The
agency and diversity of learners has to be taken into account. The best we can achieve
through professional learning is an improvement in the conditions for pupil learning.
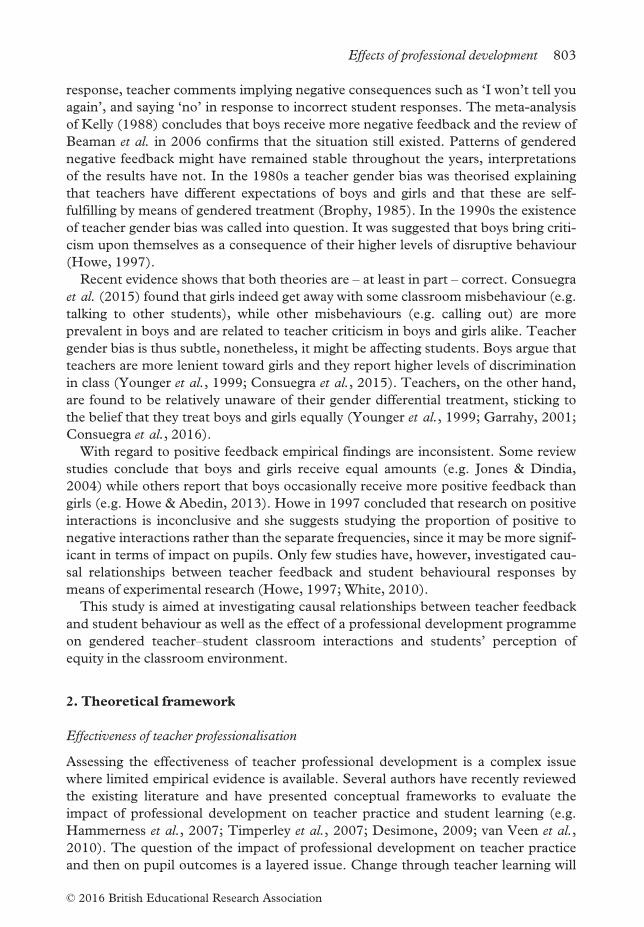
The following list and Figure 1 synthesise the essential characteristics of effective
teacher professional development as suggested by the authors cited above.
1. Content: focus on student learning.
2. Appreciative: strength rather than deficiency based.
3. Duration: extended and intensive programmes, no one-time sessions.
4. School-based: incorporated into the daily work of teachers.
5. Collective: collaboration with internal and external peers.
6. Coherence: integrating theory and practice.
7. Active: inquiry-based creation of knowledge rather than passive consumption.
8. Ownership: responding to self-identified needs and interests.
All eight essential characteristics have been taken into account in this study (see
Section 3). Three elements in particular require further theoretical elaboration within
the scope of this article: teacher collaboration, teacher inquiry and the appreciative
approach.
Collaboration. Teacher collaboration is widely cited as fostering teacher professional
learning, however, it is not self-evident. In Flanders (the Dutch speaking part of Bel-
gium where this study is performed) teachers are still very much isolated and working
on an individual basis (Deneire et al., 2013). Flemish teacher education programmes
do not prepare teachers for collaboration with colleagues (Valcke et al., 2013) and as
a consequence teachers’ self-efficacy with regard to collaboration is very low
(Schraepen et al., 2010). Vescio et al. (2008) conclude that in order for successful
and sustainable teacher collaboration to be effective collaborative learning should
always be student-centred and directed towards improving learning outcomes and
the wellbeing of pupils. Also, teachers should be provided with the time to plan and
structure their own collaboration (Santoli et al., 2008).
Figure 1. Conceptual framework for assessing the effectiveness of teacher professional
development (adapted from Desimone, 2009; van Veen et al., 2010)
804 E. Consuegra and N. Engels
© 2016 British Educational Research Association
Inquiry. Many teachers are unconcerned about theory and their teaching is often dri-
ven by intuition (Hoyle, 1980). Also, most teachers believe that the knowledge base
for teaching is constructed by ‘experts’ and they merely have to apply this knowledge
(Cochran-Smith & Lytle, 1992). To ensure the effectiveness of teacher professional
development, however, a more active role for teachers is needed. Cochran-Smith and
Lytle (1992, 2009) suggest teachers study their own practice teaching and student
learning in a systematic and intentional manner. The result of this inquiry should
bring about an improvement in the teachers’ classroom practice and in student learn-
ing. Teachers are, however, not familiar with investigating their own practice and see
themselves as the producers of knowledge. In order to reduce teachers’ resistance to
inquiry and to foster their knowledge production a safe work-learning environment
needs to be created (Kessels & Keursten, 2002; Cochran-Smith & Lytle, 2009;
Consuegra et al., 2014).
Appreciation. It is often stated that the driving force for reflection is the recognition
of uncertainty involving a problematic situation (Loughran, 2002; Hoban &Hastings,
2006). Consequently, many models for teacher inquiry start from problem state-
ments. Appreciative inquiry (Cooperrider & Srivasta, 1987), however, suggests a
strengths-based alternative, starting from the best of what exists and the desired
future state that could be. This ‘positive principle’ is assumed to increase positive
emotions, which in turn leads to people being more flexible, integrative and open to
information (Bushe, 2011). The appreciative approach can be promising way to stim-
ulate teacher inquiry as described by Cochran-Smith and Lytle (1992), since it is
hypothesised to increase teachers’ motivation to step outside their comfort-zone and
increase their self-efficacy and optimism to engage in collaborative teacher inquiry
(Verleysen et al., 2015).
Changes in teacher professionalism
Optimal instruction, Brophy argued in 1985, implies some degree of individuali-
sation of instruction. It is not always desirable to treat all students equally
(Tomlinson et al., 2003). In order to avoid, however, that differentiated instruc-
tion is negatively influenced by incorrect and stereotyped expectations of teachers,
it is important that teachers’ noticing skills and their interpretations of different
student’s needs are accurate. The ability to notice and to interpret significant fea-
tures in classroom situations is called ‘professional vision’ (Seidel & St€urmer,
2014). A variety of studies have shown that developing teacher professional vision
impacts teachers’ classroom practice (Sherin & van Es, 2009; van Es & Sherin,
2010). In developing teacher professional vision, the use of video has become a
prominent tool (van Es & Sherin, 2008; Seidel & St€urmer, 2014). Video allows
the complexity of real classroom interactions by capturing voices and body lan-
guage to be displayed. Video-stimulated recall interviewing (Tripp & Rich, 2012)
in which teachers watch videos of their own teaching and discuss these with others
enables teachers to gain a perspective on their practice that is otherwise unavail-
able. It provides them an opportunity to become aware of incorrect perceptions of
students and biased interactions.
Effects of professional development 805
© 2016 British Educational Research Association
While some teachers might not be aware of possible gender bias in their interac-
tions with students, other teachers might be(come) overly aware. Harber (2004) has
shown that self-image concerns of being perceived as prejudiced can challenge their
own egalitarian credentials and underlie a positive feedback bias and greater lenience
towards out-groups (both in written and face-to-face interactions). In more recent
work, Harber et al. (2012) showed that such positive feedback bias may undermine
minority students’ academic achievement. Illegitimate praise can erode students’
trust in their teachers and more lenient evaluations can deprive students of academic
challenges that promote learning.
Changes in teacher behaviour and instruction
Ethnographic studies show that equitable classrooms are classrooms in which all
students are entitled, expected and obliged to participate competently (Carlone
et al., 2011) and where excellence is expected and encouraged for all students
(Brown et al., 2011). When students are not expected nor obliged to participate
skilfully, they are found to disengage. The quantity of feedback, questions and turns
students receive from their teachers are important measures of opportunities to par-
ticipate skilfully. As to the quality of feedback, Myhill (2002) suggests that the
higher the ratio of positive to negative interactions the more pupil on-task behaviour
is displayed. White (2010) confirms and recommends a range from 3:1 to 10:1 for
optimal promotion of appropriate student behaviours. Such ratios are, however, sel-
dom reached since levels of praise and reinforcement in general are relatively low
(Merrett & Wheldall, 1992; Drudy & �Ui Chath�ain, 2002; Jones & Dindia, 2004).
Swinson and Harrop (2005) trained teachers to increase the amount of positive
feedback to pupils. They found that the levels of on-task behaviour in students
increased from 77% to 94% when positive feedback was three times more frequent
than negative feedback. Swinson and Harrop (2012) suggest a positive pedagogy
and a high ratio of positive to negative teacher feedback to increase student on-task
behaviour.
Changes in student responses
Despite conventional wisdom echoing that praise leads to positive outcomes in stu-
dents, research literature is far less clear about when and how praise affects children
(Henderlong & Lepper, 2002). Henderlong and Lepper’s (2002, p. 775) review
emphasises that praise is ‘not a simple one-way transmission from the evaluator to the
recipient but rather a complex social communication in which the role of the recipient
is just as critical as the role of the evaluator’. For praise to enhance intrinsic motiva-
tion and student self-perceptions of ability it needs to be perceived as sincere and it
should encourage performance attributions to controllable causes, promote auton-
omy, not rely to heavily on social comparisons and convey attainable standards and
expectations. Also, the consequences of praise can be different in students from dif-
ferent ages, gender or cultures. Finally, several studies have shown that praise can be
ineffective and can even have negative effects on students. An example with regards
to gendered reactions to praise is the fact that some adolescent boys will feel
806 E. Consuegra and N. Engels
© 2016 British Educational Research Association
uncomfortable when being praised because it might undermine their ‘cool’ and anti-
scholastic attitudes in the eyes of their peers (Henderlong & Lepper, 2002; Myhill,
2002).
3. Research focus and the professional development programme
This study investigates the effect of a professional development programme aimed at
improving teachers’ positive to negative feedback ratios towards all students. The
effects of the intervention will be assessed on several levels: teacher observed beha-
viour and instruction, student perceptions of equity and student behavioural
responses. The content of the professional development programme is described in
the following section and references are made to the eight essential elements of effec-
tive teacher professionalisation.
The professional development programme (PDP) took place in the period
November 2012 to April 2013 and six learning activities took place during this per-
iod (duration). In each participating school a professional learning community was
formed that included five teachers and an external facilitator (collective). At the
beginning of the programme each teacher participated in an individual video-
stimulated recall interview with the researcher to increase teacher awareness and
noticing skills. Throughout the school year five sessions took place in the school
itself during, before, in between or after school hours depending on the schedules of
the teachers (school-based). Several cycles of inquiry of formulating goals, collecting
data, analysing data and changing practice were planned, but not realised (active).
Discussions remained at the level of becoming aware and sharing knowledge and
practices. A lot of time was invested in acquiring knowledge about the process of
teacher inquiry: learning how to collaborate, learning how to critically inquire. The
focus of sessions at the beginning of the programme was thus more teacher-centered
than student-centered. The focus on student learning (content) was only reached in
the second half of the programme. During the sessions the participating teachers
were asked to reflect and comment on each other’s good practices and strengths.
This appreciative focus fostered trust between the teachers and a safe environment
to reflect on one’s own practice. Discussions also concerned the linking of one’s
own practice with theories and research findings on gendered interactions (coher-
ence). The focus of discussions soon broadened to include not only gender issues
but issues of teaching diverse students in general as well. Teachers themselves had
asked for such a widening of the scope (ownership). Table 1 provides an overview
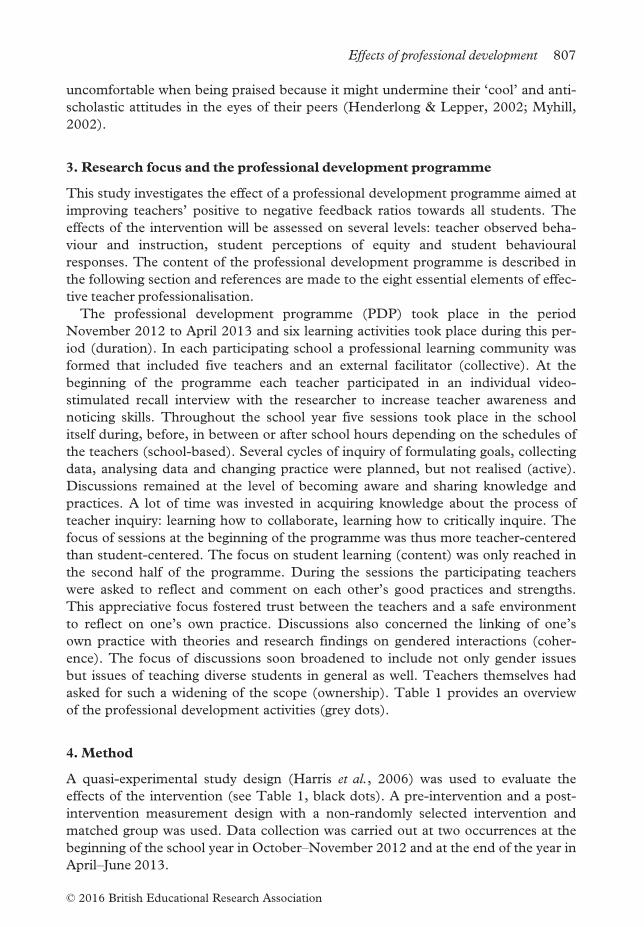
of the professional development activities (grey dots).
4. Method
A quasi-experimental study design (Harris et al., 2006) was used to evaluate the
effects of the intervention (see Table 1, black dots). A pre-intervention and a post-
intervention measurement design with a non-randomly selected intervention and
matched group was used. Data collection was carried out at two occurrences at the
beginning of the school year in October–November 2012 and at the end of the year in
April–June 2013.
Effects of professional development 807
© 2016 British Educational Research Association
Sample
A purposeful heterogeneous sample of six secondary schools was selected for partici-
pation in the quasi-experimental study. Schools were selected from a representative
sample of 59 secondary schools in Flanders (Dutch speaking part of Belgium) that
were enrolled in a larger research programme in which this study is situated. The six
schools varied in a range of conditions: public and private schools; urban and subur-
ban areas; small-, medium- and large-sized schools; and general, vocational and tech-
nical education schools. With support from the principal in each school five teachers
were selected and asked to participate in the intervention study. Teachers had to be
teaching the first year of secondary education in general subjects and those teachers
with most contact hours with the first-year students were invited first for participation
in the study. For each teacher, one of their first-year secondary classes was selected
and one lesson was video-recorded. Classes were selected in such a way that those
classes with most contact hours with the teachers involved in the study were selected.
Teachers were told that any lesson would do for the video-recording unless the entire
hour would be devoted to an examination or test. In the one or two cases where the
observed lessons involved something other than whole-class instruction, we would
revisit the teacher at another time for filming an extra lesson (which resulted in obser-
vations of whole-class teaching for all teachers). In total, 30 teachers and their 500
pupils were video-recorded twice (pre-test and post-test). Half of the 500 pupils were
randomly selected for student-focused coding. Due to practical reasons (out of sight,
quality of recordings) the teacher–student interactions of 180 of these 250 pupils were
coded. In the post-test recordings only 129 of these 180 pupils could be coded (drop-
out rate 28%). The mean age of the observed students at the pre-test and post-test
was 12. The six schools were divided randomly over the control and intervention con-
dition in such a way that a similar diversity of school size and school type (urban/sub-
urban, public/private, tracks in higher grades) was present in both groups. In this
regard it is important to note that the control group was actually a ‘wait group’, mean-
ing that these teachers would participate in the intervention the following year (which
is outside the scope of this paper). The control group and the intervention group each
Table 1. Project outline
2012 2013
Sep Oct Nov Dec Jan Feb Mar Apr May Jun
Student standardised test �Student survey � �Classroom observation � �Teacher video stimulated
recall interview
Professional learning
community session
Note: Black dots indicate pre-test and post-test measurements performed in both the control and the interven-
tion group. Grey dots indicate professional development activities that were only performed in the intervention
group.
808 E. Consuegra and N. Engels
© 2016 British Educational Research Association
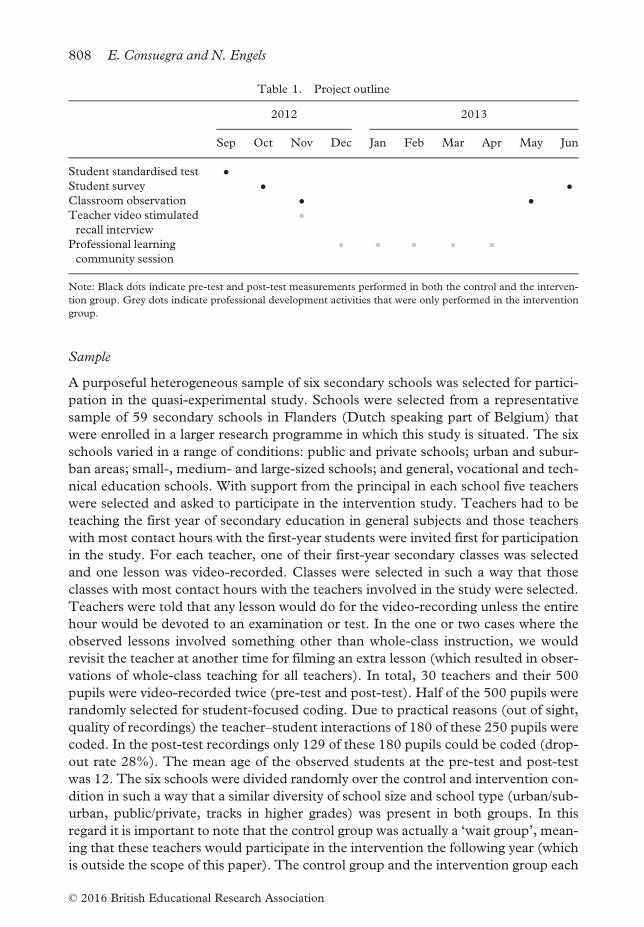
counted 15 teachers and Figure 2 provides an overview of the number of boys and
girls in the control and intervention groups for the pre- and post-test.
Instruments
Survey. Questionnaires were administered by the research team during class. Pupils
were asked about their socio-demographic background and rated the extent to which
students are treated equal by their teachers. To measure this sense of equity the 6-
item equity subscale of the What Is Happening In This Class? (WIHIC) survey was
used (Dorman, 2003). The WIHIC is a recently developed and widely validated
instrument that assesses classroom psychosocial environment in high schools. The
scale is developed in such a way that it does not pre-define the basis for the discrimi-
nation that pupils experience. Sample item: ‘I am treated the same as other students
in class.’ All items are scored 0, 1, 2, 3 or 4, respectively, for the responses of almost
never, seldom, sometimes, often and almost always. A principal component analysis
confirmed the one-component underlying structure of the scale and reliability at the
pre- and post-test was good (respectively a = .894 and a = .935).
Classroom observation schedule. Two educational researchers acted as the observers,
using continuous focal coding for 15-minute video-recorded fragments. The middle
15 minutes of all video-recorded lessons were selected for coding teacher–studentinteractions to ensure that the episode would represent whole-class instruction. The
first and last couple of minutes of a 50-minute lesson are traditionally used to enter
and leave the classroom, fill in the school diary, hand out corrected assignments and
take quizzes. A content analysis of pupils’ classroom interactions was performed using
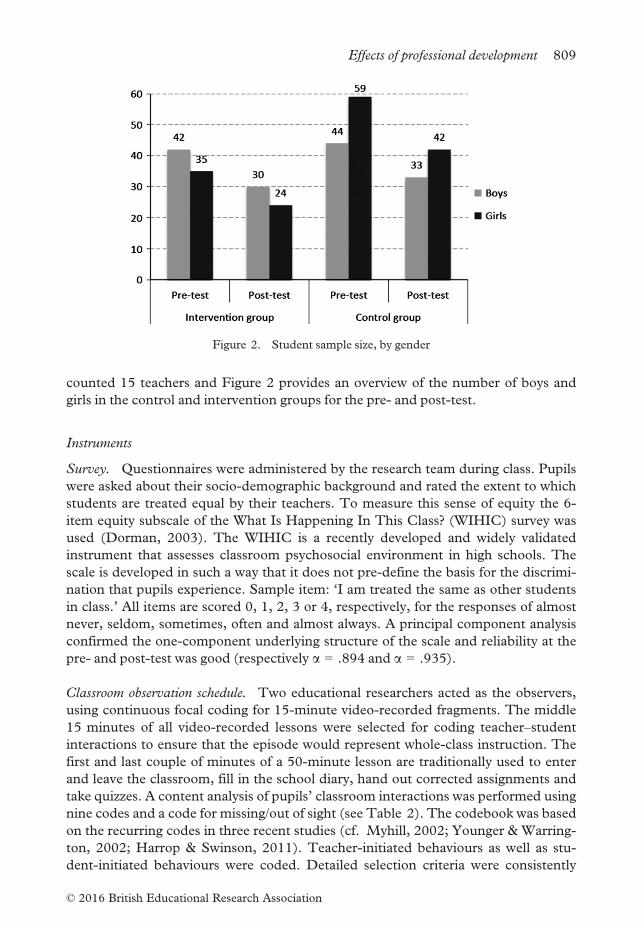
nine codes and a code for missing/out of sight (see Table 2). The codebook was based
on the recurring codes in three recent studies (cf. Myhill, 2002; Younger & Warring-
ton, 2002; Harrop & Swinson, 2011). Teacher-initiated behaviours as well as stu-
dent-initiated behaviours were coded. Detailed selection criteria were consistently
Figure 2. Student sample size, by gender
Effects of professional development 809
© 2016 British Educational Research Association
applied to determine if a behaviour could be assigned to a certain category. Several
iterative cycles of coding, assessment of reliability and codebook modification were
conducted by the two coders until reliability for all codes was high (Hruschka et al.,
2004). To ensure that high levels of observer agreement would not be mere reflec-
tions of high chance agreement, a Krippendorf’s alpha (Krippendorff, 2013) was cal-
culated. As Krippendorff’s alpha is known to be a rather conservative index
(Lombard et al., 2002), a more liberal criterion of .60 was used to determine if the
coding of a variable was considered reliable. Training continued until Kalphas were
above .60 and from that point on the two coders scored the remaining tapes, being
aware that five lessons, taken at random, would be scored by the other observer at the
end. Table 2 gives an overview of the mean Kalpha’s for each code for both reliability
checks combined. We also present a detailed contingency table showing the levels of
agreement and disagreement between the two observers for the different codes
(Harrop & Swinson, 2007). The C, H, T, R, N and P categories were analysed as
events, generating the frequency of each behaviour for each student. The S, O and F
categories were analysed as a state, generating the total duration of each behaviour as
a proportion of time in sight for each student. The positive to negative feedback ratio
(P/N) was calculated by dividing the frequency of positive feedback by the frequency
of negative feedback. All values were first raised with one in order to avoid values of
zero, which could not be used as a divisor. Coding was performed using JWatcher
(Blumstein et al., 2012).
Analysis: Generalised linear mixed models (GLMMs)
A graphical assessment of the observation data (histograms and QQ-plots) clearly
shows that the data are Poisson distributed (except for being on-task and sense of
equity). Advanced statistical techniques remove the need for transforming count data
in order to be able to analyse them (O’Hara & Kotze, 2010). Generalised linear mixed
models (GLMM) are flexible and increasingly popular tools for analysing data with
Table 2. Codebook and Krippendorff’s (2013) alpha (Kalpha)
Code Short definition
Cod1 (0)
Cod2 (0)
Cod1 (0)
Cod2 (1)
Cod1 (1)
Cod2 (0)
Cod1 (1)
Cod2 (1) Kalpha
C Call out to teacher 1089 20 18 73 .78
H Hand up 1078 6 3 113 .96
T Turn from teacher 1147 9 8 36 .80
R Response to question or
comment from teacher
1137 17 11 35 .70
N Negative feedback from teacher 1169 5 9 17 .70
P Positive and neutral
feedback from teacher
1170 1 11 18 .75
S Social behaviour without
permission
971 53 28 148 .75
O On-task behaviour 145 35 78 942 .66
F Off-task behaviour 955 94 34 117 .58
Note: Cod1 (0) = coder 1 recorded non-occurrence. Cod2 (1) = coder 2 recorded occurrence.
810 E. Consuegra and N. Engels
© 2016 British Educational Research Association
various distributions and permit analysis with hierarchical structure, spatial or tempo-
ral dependence by means of the inclusion of random effects in the model (Thiele &
Markussen, 2012). GLMMs remarkable flexibility, however, does not come without
a price: ‘they are surprisingly challenging even for statisticians’ (Bolker et al., 2009).
Also, GLMM computational algorithms regularly fail to converge (Thiele &
Markussen, 2012) since a large number of fixed and especially random effects com-
pared to sample size can burden the analysis. No simulation studies exist to our
knowledge that suggest criteria for sample sizes and model complexity. Still, we opt
for GLMMs following O’Hara and Kotze (2010) plea to not log-transform count data
to be used in parametric tests. In their simulation study they show that GLMMs con-
sistently performed well while log-transformed data performed poorly.
5. Results
Descriptive analyses
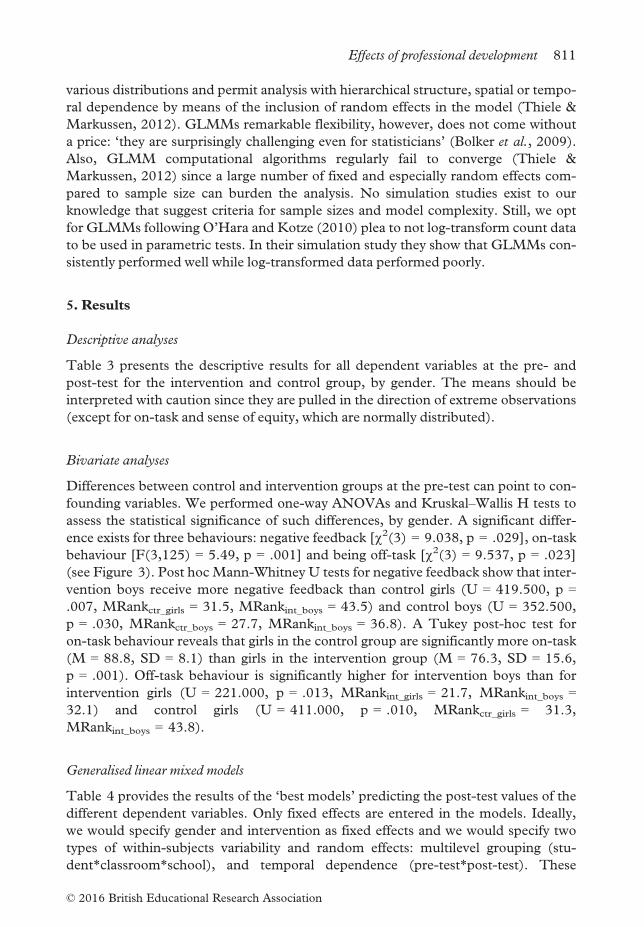
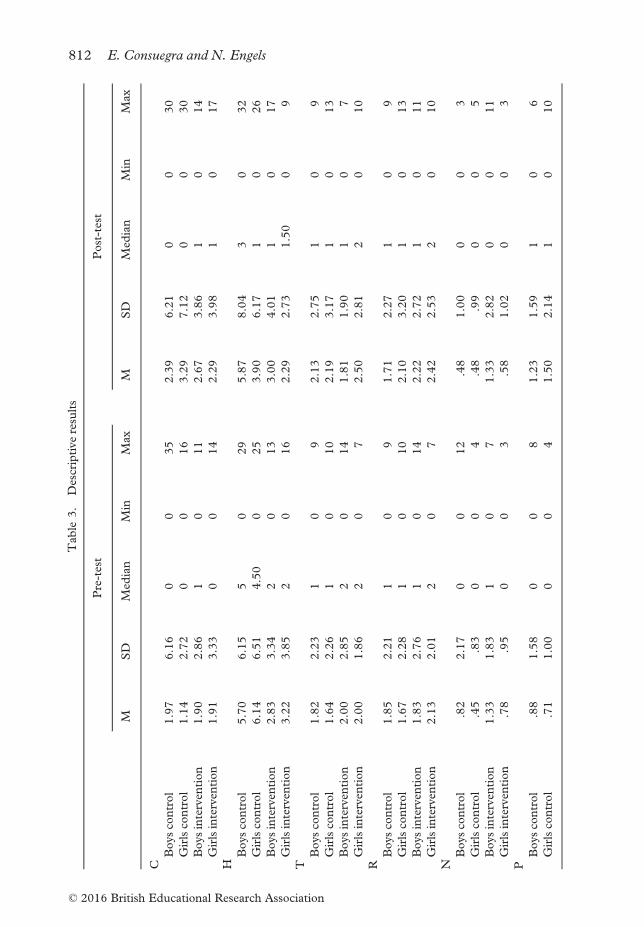
Table 3 presents the descriptive results for all dependent variables at the pre- and
post-test for the intervention and control group, by gender. The means should be
interpreted with caution since they are pulled in the direction of extreme observations
(except for on-task and sense of equity, which are normally distributed).
Bivariate analyses
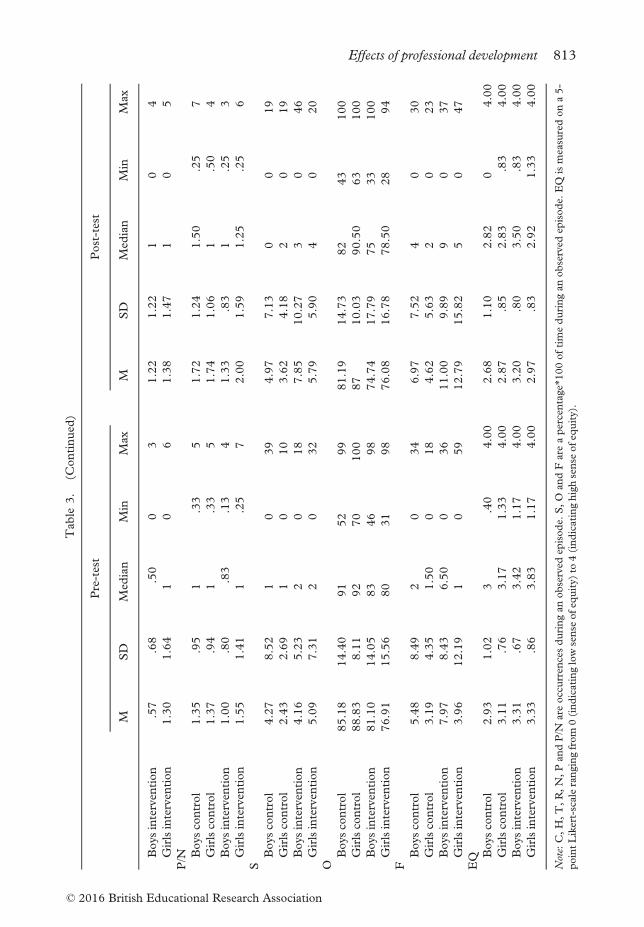
Differences between control and intervention groups at the pre-test can point to con-
founding variables. We performed one-way ANOVAs and Kruskal–Wallis H tests to
assess the statistical significance of such differences, by gender. A significant differ-
ence exists for three behaviours: negative feedback [v2(3) = 9.038, p = .029], on-task
behaviour [F(3,125) = 5.49, p = .001] and being off-task [v2(3) = 9.537, p = .023]
(see Figure 3). Post hocMann-Whitney U tests for negative feedback show that inter-
vention boys receive more negative feedback than control girls (U = 419.500, p =.007, MRankctr_girls = 31.5, MRankint_boys = 43.5) and control boys (U = 352.500,
p = .030, MRankctr_boys = 27.7, MRankint_boys = 36.8). A Tukey post-hoc test for
on-task behaviour reveals that girls in the control group are significantly more on-task
(M = 88.8, SD = 8.1) than girls in the intervention group (M = 76.3, SD = 15.6,
p = .001). Off-task behaviour is significantly higher for intervention boys than for
intervention girls (U = 221.000, p = .013, MRankint_girls = 21.7, MRankint_boys =32.1) and control girls (U = 411.000, p = .010, MRankctr_girls = 31.3,
MRankint_boys = 43.8).
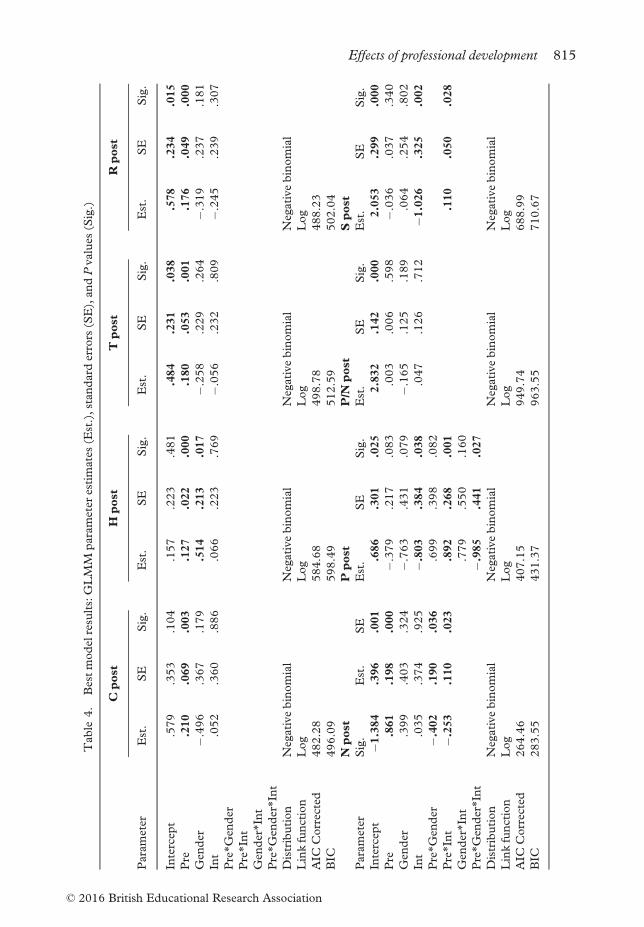
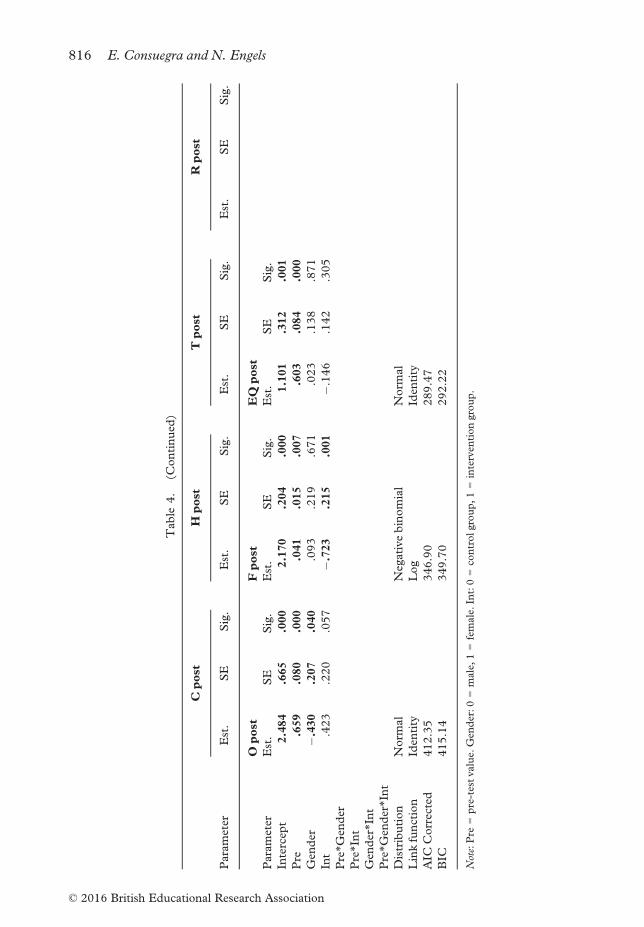
Generalised linear mixed models
Table 4 provides the results of the ‘best models’ predicting the post-test values of the
different dependent variables. Only fixed effects are entered in the models. Ideally,
we would specify gender and intervention as fixed effects and we would specify two
types of within-subjects variability and random effects: multilevel grouping (stu-
dent*classroom*school), and temporal dependence (pre-test*post-test). These
Effects of professional development 811
© 2016 British Educational Research Association
Table
3.
Descriptiveresults
Pre-test
Post-test
MSD
Med
ian
Min
Max
MSD
Med
ian
Min
Max
C
Boysco
ntrol
1.97
6.16
00
35
2.39
6.21
00
30
Girlsco
ntrol
1.14
2.72
00
16
3.29
7.12
00
30
Boysinterven
tion
1.90
2.86
10
11
2.67
3.86
10
14
Girlsinterven
tion
1.91
3.33
00
14
2.29
3.98
10
17
H
Boysco
ntrol
5.70
6.15
50
29
5.87
8.04
30
32
Girlsco
ntrol
6.14
6.51
4.50
025
3.90
6.17
10
26
Boysinterven
tion
2.83
3.34
20
13
3.00
4.01
10
17
Girlsinterven
tion
3.22
3.85
20
16
2.29
2.73
1.50
09
T
Boysco
ntrol
1.82
2.23
10
92.13
2.75
10
9
Girlsco
ntrol
1.64
2.26
10
10
2.19
3.17
10
13
Boysinterven
tion
2.00
2.85
20
14
1.81
1.90
10
7
Girlsinterven
tion
2.00
1.86
20
72.50
2.81
20
10
R
Boysco
ntrol
1.85
2.21
10
91.71
2.27
10
9
Girlsco
ntrol
1.67
2.28
10
10
2.10
3.20
10
13
Boysinterven
tion
1.83
2.76
10
14
2.22
2.72
10
11
Girlsinterven
tion
2.13
2.01
20
72.42
2.53
20
10
N
Boysco
ntrol
.82
2.17
00
12
.48
1.00
00
3
Girlsco
ntrol
.45
.83
00
4.48
.99
00
5
Boysinterven
tion
1.33
1.83
10
71.33
2.82
00
11
Girlsinterven
tion
.78
.95
00
3.58
1.02
00
3
P
Boysco
ntrol
.88
1.58
00
81.23
1.59
10
6
Girlsco
ntrol
.71
1.00
00
41.50
2.14
10
10
812 E. Consuegra and N. Engels
© 2016 British Educational Research Association
Table
3.
(Continued
)
Pre-test
Post-test
MSD
Med
ian
Min
Max
MSD
Med
ian
Min
Max
Boysinterven
tion
.57
.68
.50
03
1.22
1.22
10
4
Girlsinterven
tion
1.30
1.64
10
61.38
1.47
10
5
P/N B
oysco
ntrol
1.35
.95
1.33
51.72
1.24
1.50
.25
7
Girlsco
ntrol
1.37
.94
1.33
51.74
1.06
1.50
4
Boysinterven
tion
1.00
.80
.83
.13
41.33
.83
1.25
3
Girlsinterven
tion
1.55
1.41
1.25
72.00
1.59
1.25
.25
6
S
Boysco
ntrol
4.27
8.52
10
39
4.97
7.13
00
19
Girlsco
ntrol
2.43
2.69
10
10
3.62
4.18
20
19
Boysinterven
tion
4.16
5.23
20
18
7.85
10.27
30
46
Girlsinterven
tion
5.09
7.31
20
32
5.79
5.90
40
20
O
Boysco
ntrol
85.18
14.40
91
52
99
81.19
14.73
82
43
100
Girlsco
ntrol
88.83
8.11
92
70
100
87
10.03
90.50
63
100
Boysinterven
tion
81.10
14.05
83
46
98
74.74
17.79
75
33
100
Girlsinterven
tion
76.91
15.56
80
31
98
76.08
16.78
78.50
28
94
F
Boysco
ntrol
5.48
8.49
20
34
6.97
7.52
40
30
Girlsco
ntrol
3.19
4.35
1.50
018
4.62
5.63
20
23
Boysinterven
tion
7.97
8.43
6.50
036
11.00
9.89
90
37
Girlsinterven
tion
3.96
12.19
10
59
12.79
15.82
50
47
EQ B
oysco
ntrol
2.93
1.02
3.40
4.00
2.68
1.10
2.82
04.00
Girlsco
ntrol
3.11
.76
3.17
1.33
4.00
2.87
.85
2.83
.83
4.00
Boysinterven
tion
3.31
.67
3.42
1.17
4.00
3.20
.80
3.50
.83
4.00
Girlsinterven
tion
3.33
.86
3.83
1.17
4.00
2.97
.83
2.92
1.33
4.00
Note:C,H,T,R,N,PandP/N
are
occurren
cesduringanobserved
episode.
S,O
andFare
apercentage*100oftimeduringanobserved
episode.
EQ
ismeasuredona5-
pointLikert-scalerangingfrom
0(indicatinglowsense
ofeq
uity)to
4(indicatinghighsense
ofeq
uity).
Effects of professional development 813
© 2016 British Educational Research Association
models did not converge, however, even after trying all techniques suggested by
Thiele and Markussen (2012) to solve convergence problems. We hypothesise that
these models are too complex to converge given our small sample size, and we per-
form analyses with simplified models without random effects.
In order to find the ‘best model’ Thiele and Markussen (2012) recommend that
model building for inference is done by backward elimination. We start by fitting a
model with all three main variables (pre-test, gender, intervention) and all of their
two-way and three-way interactions. Then the higher order variables are dropped, so
long as they are not significant at the .05 critical level. We continue by successively
re-fitting reduced models until no more interaction variables can be dropped. None
of the three main variables will be deleted, even if they are not significant. The IBM
SPSS Statistics Version 22 software package was used and the default restricted
maximum likelihood (REML) estimation for GLMM converged easily (at least, for
these simplified models). Since there was evidence of over-dispersion in our count
data (too many zeros), we opted to use a negative binomial distribution (Berk &
MacDonald, 2007). For on-task and sense of equity that were approximately nor-
mally distributed in each of the four groups (skewness ranging from �.3 to �1.4 and
kurtosis ranging from .06 to 1.9) a normal distribution was specified. In the following
sections we discuss intervention effects on teacher behaviours, student behaviours
and students’ sense of equity. For clarity’s sake we only present significant effects.
Figure 3. Significant pre-test differences between intervention and control group, by gender.
Note. Negative feedback: number of occurrences during a 15-minute fragment. On-task and
off-task: percentage of time in sight
814 E. Consuegra and N. Engels
© 2016 British Educational Research Association
Table
4.
Bestmodelresults:GLM
Mparameter
estimates(E
st.),standard
errors(SE),andPvalues
(Sig.)
Parameter
Cpost
Hpost
Tpost
Rpost
Est.
SE
Sig.
Est.
SE
Sig.
Est.
SE
Sig.
Est.
SE
Sig.
Intercep
t.579
.353
.104
.157
.223
.481
.484
.231
.038
.578
.234
.015
Pre
.210
.069
.003
.127
.022
.000
.180
.053
.001
.176
.049
.000
Gen
der
�.496
.367
.179
.514
.213
.017
�.258
.229
.264
�.319
.237
.181
Int
.052
.360
.886
.066
.223
.769
�.056
.232
.809
�.245
.239
.307
Pre*G
ender
Pre*Int
Gen
der*Int
Pre*G
ender*Int
Distribution
Negativebinomial
Negativebinomial
Negativebinomial
Negativebinomial
Linkfunction
Log
Log
Log
Log
AIC
Corrected
482.28
584.68
498.78
488.23
BIC
496.09
598.49
512.59
502.04
Npost
Ppost
P/N
post
Spost
Parameter
Sig.
Est.
SE
Est.
SE
Sig.
Est.
SE
Sig.
Est.
SE
Sig.
Intercep
t�1
.384
.396
.001
.686
.301
.025
2.832
.142
.000
2.053
.299
.000
Pre
.861
.198
.000
�.379
.217
.083
.003
.006
.598
�.036
.037
.340
Gen
der
.399
.403
.324
�.763
.431
.079
�.165
.125
.189
.064
.254
.802
Int
.035
.374
.925
�.803
.384
.038
.047
.126
.712
�1.026
.325
.002
Pre*G
ender
�.402
.190
.036
.699
.398
.082
Pre*Int
�.253
.110
.023
.892
.268
.001
.110
.050
.028
Gen
der*Int
.779
.550
.160
Pre*G
ender*Int
�.985
.441
.027
Distribution
Negativebinomial
Negativebinomial
Negativebinomial
Negativebinomial
Linkfunction
Log
Log
Log
Log
AIC
Corrected
264.46
407.15
949.74
688.99
BIC
283.55
431.37
963.55
710.67
Effects of professional development 815
© 2016 British Educational Research Association
Table
4.
(Continued
)
Parameter
Cpost
Hpost
Tpost
Rpost
Est.
SE
Sig.
Est.
SE
Sig.
Est.
SE
Sig.
Est.
SE
Sig.
Opost
Fpost
EQ
post
Parameter
Est.
SE
Sig.
Est.
SE
Sig.
Est.
SE
Sig.
Intercep
t2.484
.665
.000
2.170
.204
.000
1.101
.312
.001
Pre
.659
.080
.000
.041
.015
.007
.603
.084
.000
Gen
der
�.430
.207
.040
.093
.219
.671
.023
.138
.871
Int
.423
.220
.057
�.723
.215
.001
�.146
.142
.305
Pre*G
ender
Pre*Int
Gen
der*Int
Pre*G
ender*Int
Distribution
Norm
al
Negativebinomial
Norm
al
Linkfunction
Iden
tity
Log
Iden
tity
AIC
Corrected
412.35
346.90
289.47
BIC
415.14
349.70
292.22
Note:Pre
=pre-testvalue.Gen
der:0=male,1=female.Int:0=co
ntrolgroup,1=interven
tiongroup.
816 E. Consuegra and N. Engels
© 2016 British Educational Research Association
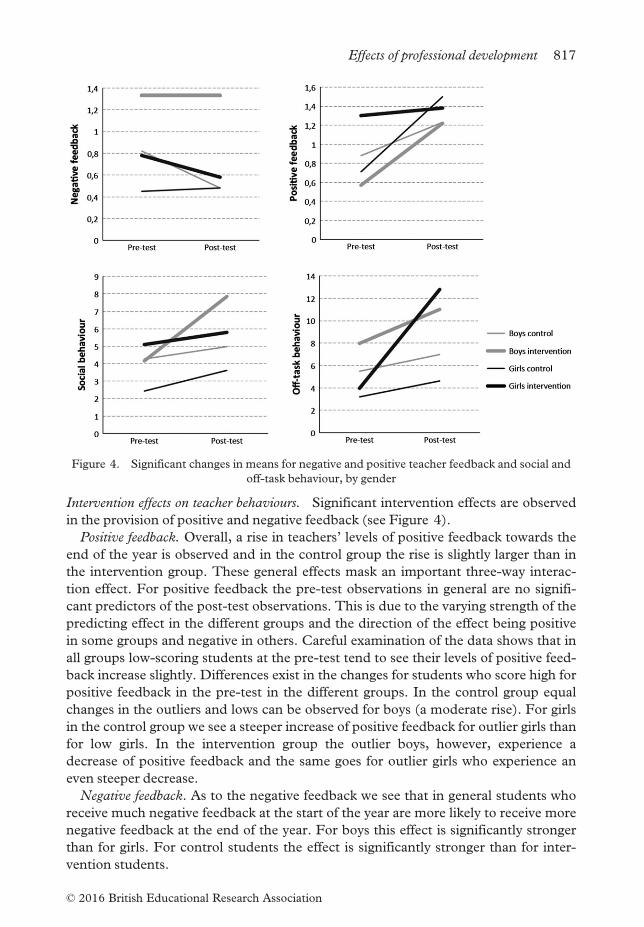
Intervention effects on teacher behaviours. Significant intervention effects are observed
in the provision of positive and negative feedback (see Figure 4).
Positive feedback. Overall, a rise in teachers’ levels of positive feedback towards the
end of the year is observed and in the control group the rise is slightly larger than in
the intervention group. These general effects mask an important three-way interac-
tion effect. For positive feedback the pre-test observations in general are no signifi-
cant predictors of the post-test observations. This is due to the varying strength of the
predicting effect in the different groups and the direction of the effect being positive
in some groups and negative in others. Careful examination of the data shows that in
all groups low-scoring students at the pre-test tend to see their levels of positive feed-
back increase slightly. Differences exist in the changes for students who score high for
positive feedback in the pre-test in the different groups. In the control group equal
changes in the outliers and lows can be observed for boys (a moderate rise). For girls
in the control group we see a steeper increase of positive feedback for outlier girls than
for low girls. In the intervention group the outlier boys, however, experience a
decrease of positive feedback and the same goes for outlier girls who experience an
even steeper decrease.
Negative feedback. As to the negative feedback we see that in general students who
receive much negative feedback at the start of the year are more likely to receive more
negative feedback at the end of the year. For boys this effect is significantly stronger
than for girls. For control students the effect is significantly stronger than for inter-
vention students.
Figure 4. Significant changes in means for negative and positive teacher feedback and social and
off-task behaviour, by gender
Effects of professional development 817
© 2016 British Educational Research Association
Intervention effects on student behaviours. Significant intervention effects are found in
two student behaviours: being off-task and social behaviours with other students (see
Figure 4).
Off-task. In both the intervention and the control group we observe an overall and
significant increase of off-task behaviour. In the intervention group, however, the rise
is steeper. At the post-test no significant difference exists for off-task behaviour
between intervention boys and girls, but intervention boys do score significantly
higher than control girls and control boys.
Social behaviours. Overall, towards the end of the year a rise in students’ social
behaviours is observed in all groups. In the intervention group, the rise is significantly
stronger than in the control group. The post-test observations of social behaviours
are in general not significantly predicted by the pre-test observations. In the control
group, however, we do see significant positive effects of the pre-test level of social
behaviours on the post-test level. In the intervention group we do not see this effect.
In total, the level of social behaviours increases more in the intervention than in the
control group, but it is not the students who are misbehaving in the pre-test who
account for this rise.
Intervention effects on student sense of equity. No significant differences were found for
sense of equity in any of the groups.
6. Discussion and conclusion
In the Section 1 we started from the recurring finding in previous research that boys
receive more negative feedback than girls (Beaman et al., 2006). As to the levels of
positive feedback, research has been inconclusive and Howe (1997) suggested that
research might focus on the ratio of positive to negative feedback instead. In the early
twenty-first century Myhill (2002), Swinson and Harrop (2005) and White (2010)
found a positive correlation between the ratio of positive to negative feedback and stu-
dents’ on-task behaviour. Experimental research confirming this causal relationship
is, however, scarce (Howe, 1997; White, 2010). This quasi-experimental study aimed
at investigating the effects of a professional development programme on teachers’
gendered feedback provided to students and student responses to the changed
instruction. The lack of random assignment and inability to sufficiently control for
important confounding variables in quasi-experimental designs is known to be a
major difficulty in establishing causality. Following the suggestion of Harris et al.
(2006) we present two alternative explanations for the apparent causal associations.
The first concerns a hypothesis of counterproductive effects and the second, an expla-
nation involving confounding factors.
Positive approach with negative effects
Based on the model of van Veen et al. (2010) we assume that professional develop-
ment has an impact on students through its effects on teacher thinking and teacher
behaviour. Indeed, we find effects of the intervention on teacher behaviour and the
most striking effect can be found in the patterns of positive feedback towards
818 E. Consuegra and N. Engels
© 2016 British Educational Research Association
students. The strengths-based approach of the professional development programme
might have made a big impression on the teachers who – energised by the effects of
positive attention on themselves – started experimenting with their patterns of posi-
tive feedback towards students. Previous empirical research on appreciative
approaches to inquiry report that its positive nature supports change by fostering a
sense of excitement in one’s professional practice (Chapman & Giles, 2009). In their
excitement, however, the teachers might have failed to monitor unwanted effects of
their changing feedback practices. Teachers involved in the intervention seem to turn
around their positive feedback patterns abruptly: students who received lots of praise
at the beginning of the year experience a drastic drop in their levels of positive feed-
back toward the end of the year and students who received hardly any at the begin-
ning of the year see a steady growth. This drop of positive attention for the high
outliers is significantly stronger in girls than in boys and it might be an overcompensa-
tion of the intervention teachers who have become aware of the fact that teachers
might be more lenient towards girls ( €Ohrn, 1993). These changes in practice are quite
different from the changes we observe in the control group (and the type of changes
students are more likely to be expecting). In the control group we saw that the highly
praised boys succeed in maintaining their higher positive feedback and highly praised
girls even strengthen their position and the gap with girls who receive less positive
feedback grows. The difference is not significant, but we also see control girls’ calling
out tripling (they overtake boys) and their hand raising drops more strongly than in
other groups. This is not in line with Myhill’s (2002) finding that calling out is more
prevalent in boys. It gives the impression that control girls are trading their hand rais-
ing for calling out and they are getting away with it since their levels of positive feed-
back grow significantly more than in other groups and their levels of negative
feedback drop more than in the intervention group. This does fit Myhill’s (2002)
description of ‘good girls’ reinforcing their position as favoured students and getting
away with more misbehaviour than boys ( €Ohrn, 1993; Younger et al., 1999). The
intervention might have been successful in changing the levels of positive and negative
feedback, but the ratio of positive to negative feedback was not affected by the inter-
vention. The ratio increases for all groups, but the mean ratio is far from near the
minimum three that was suggested by Swinson and Harrop (2005) and White
(2010). No significant differences are found between any of the groups. Changes on
both sides of the equation very much cancelled each other out. We therefore suggest
focussing not only on the ratio but also on the absolute frequencies of positive
and negative feedback. The ratio alone can give a false impression that nothing has
changed.
Now, what are the effects of these changing feedback patterns in student beha-
viour? We observed some unexpected changes. Levels of off-task and unauthorised
social interactions increased significantly in the intervention group. What might
have happened is that students who are used to receiving lots of positive attention,
felt rejected or neglected when teachers’ positive feedback decreases and as a conse-
quence they disengaged and turned to misbehaviour. Our results support this
hypothesis in the sense that the post-test social interactions in the intervention
group are not predicted by the pre-test. It is, thus, not the same students who mis-
behave at the beginning and the end of the year. The qualitative work of some
Effects of professional development 819
© 2016 British Educational Research Association
authors supports this hypothesis of student reaction against teacher treatment they
perceive as being unfair. Taino (2011) shows how students can resist teachers’ use
of gendered address terms such as ‘come on guys’ by teasing or even openly criticis-
ing teachers on their practices. €Ohrn (1993) in her qualitative study also describes
confrontational mechanisms. She describes how girls turn against their teachers to
make them feel uncomfortable when they are unhappy with the treatment they
receive. Resistance to teachers is found to spread quickly through the network of
students. Teachers, in the midst of trying to implement an appreciative approach,
might have failed to notice or respond adequately to the counterproductive
responses of students to the changing feedback patterns. Still, in this scenario we
would expect to see a drop in students’ sense of equity in the ‘rejected’ group. No
such effect could be observed, however. We did not observe any differences in sense
of equity between boys and girls. This is not in line with previous research showing
that boys feel more discriminated against (e.g. Younger et al., 1999). Our data sug-
gest the sense of equity to be a quite stable construct not easily influenced by the
changing interaction patterns in the classroom. Previous research of ours (Consue-
gra et al., 2015) confirms this stability showing that in boys with a lower sense of
equity the measure is uncorrelated to behavioural patterns and teacher feedback.
Boys who experienced more positive feedback or a higher ratio of positive to nega-
tive feedback did not feel any more equally treated. A student sense of equity might
conceptually be closely related to a student sense of futility, measuring a stance of
perceived deprivation and discrimination. Sense of futility has a large correlation
with achievement (Brookover et al., 1978) and sense of futility is proven to be an
important predictor of school misbehaviour (Van Houtte & Stevens, 2008). This
would turn our hypothesised relationship upside down. A sense of equity might not
be the result of teacher equitable treatment but rather it could be students entering
class with a predefined ‘sense of equity’ that, for teachers, is very hard to influence.
Garrahy (2001) identified teachers as being ‘gender-blind’ and unaware of gendered
interactions. Students might be ‘gender-blind’ as well, but unaware of equitable
interactions. Brophy in 1985 had already emphasised the active role of student
beliefs and student expectations in teacher–student interactions. Negative expec-
tancy effects can originate in incorrect teacher expectations, but in incorrect student
expectations as well. This intervention might have addressed students too much as
being the passive recipients of interactions and teacher treatment. We suggest future
professional development programmes include a closer monitoring of the reponses
of students to changing teacher practices. In the cycle of teacher inquiry, the phase
of trying out new teaching strategies and collecting and analysing data on the effects
could have been effective in adjusting and correcting counterproductive effects. In
the intervention programme, however, this phase was never fully reached. At the
start of the programme teachers’ self-efficacy in regard to collaborating in profes-
sional learning communities indeed was very low (Schraepen et al., 2010) resulting
in much time being spent on learning how to collaborate and learning how to
inquire. It is nevertheless crucial to find ways in which teachers can be quickly
engaged in systematic monitoring of student outcomes and student beliefs and
responses. Unsystematic experimentation can clearly generate counterproductive
effects.
820 E. Consuegra and N. Engels
© 2016 British Educational Research Association
Confounding factors and suggestions for future research
An important limitation of this study is the absence of controls for confounding vari-
ables. The fact that we did not check for the multilevel effects of students being
nested within classes and schools is a limitation we already mentioned in the results.
Also, we did not enter covariates such as socio-economic background or migration
background into the models to assess effects of other variables than gender alone
(Beaman et al., 2006) nor did we check effects of gender composition of the class-
rooms that Drudy and �Ui Chath�ain (2002) found to have a significant influence on
gendered interaction patterns. However, the need to control and measure potential
confounding variables becomes less important in studies examining praise in its natu-
ral context. Confounding variables are in this case ‘necessary aspects of conducting
research that is highly ecologically valid’ (Henderlong & Lepper, 2002, p. 790). One
could argue that in order to understand better what was happening a better approach
might be to collect and analyse qualitative interview data from pupils rather than
widen the scope of the study to include more controls for confounding variables.
Video-stimulated recall interviewing with pupils, for example, could be an interesting
approach for future research to investigate student responses to changes in teacher
instruction.
Another limitation of our study is that we did not systematically analyse data
on changes in teacher thinking at the post-test measurement, which would help
interpret the changes in feedback patterns. The overcompensation of teachers
we hypothesise reminds of what Brophy (1985) identified as teachers being
over-reactive and rigidly treating students as stereotypes rather than individuals.
An explicit focus on differentiated instruction towards boys and girls might have
unconsciously affirmed rather than challenged gender stereotypical thinking in
teachers.
For a final limitation we return to van Veen et al.’s (2010) model and the environ-
mental and macro conditions influencing the effects of professional development.
This level has been identified as heavily under-addressed in research. Implementing
interventions in several settings in order to assess which conditions need to be satis-
fied in order to generate effective teacher learning is essential (van Veen et al., 2010).
Increasing the scale of research by implementing not one but several professional
development programmes in various settings is needed. The increase of interventions,
cases and observations would serve the investigation of school-level effects as well as
allowing for a more fine-grained analysis of effects such as the ones described earlier
in this section. More collaboration is needed between research teams to allow for
these larger-scale studies or to improve possibilities for comparison of results in multi-
ple settings.
Acknowledgements
This work was supported by the Flemish Agency for Innovation by Science and
Technology under Grant IWT110020 (Procrustes Project). We would like to
acknowledge the support of Myriam Halimi for her major contribution to the
data collection and data coding and the support of Sebastiano Cincinnato for his
Effects of professional development 821
© 2016 British Educational Research Association
contribution in investigating convergence problems in the generalised linear
mixed models analyses.
We would like to thank the anonymous referees who provided their expert views on
the manuscript and for their critical and constructive input.
References
Beaman, R., Wheldall, K. & Kemp, C. (2006) Differential teacher attention to boys and girls in the
classroom, Educational Review, 58(3), 339–366.Berk, R. & MacDonald, J. (2007) Overdispersion and Poisson regression, Journal of Quantitative
Criminology, 24(3), 45–84.Blumstein, D. T., Daniel, J. C. & Evans, C. S. (2012) Jwatcher 1.0. An Introductory User’s Guide.
Available online at: http://academic.reed.edu/biology/courses/bio342/2010_syllabus/
2010_labs/week1_stuff/JW1manual.pdf (accessed 15 October 2014).
Bolker, B. M., Brooks, M. E., Clark, C. J., Geange, S. W., Poulsen, J. R., Stevens, M. H. H. &
White, J.-S. S. (2009) Generalized linear mixed models: A practical guide for ecology and evo-
lution, Trends in Ecology and Evolution, 24(3), 127–135.Brookover, W. B., Schweitzer, J. H., Schneider, J. M., Beady, C. H., Flood, P. K. & Wisenbaker, J.
M. (1978) Elementary school social climate and school achievement, American Educational
Research Journal, 15(2), 301–318.Brophy, J. E. (1985) Teacher–student interaction, in: J. B. Dusek, V. C. Hall & W. J. Meyer (Eds)
Teacher expectancies (London, Lawrence Erlbaum Associates Publishers), 303–328.Brown, K. M., Benkovitz, J., Muttillo, A. J. & Urban, T. (2011) Leading schools of excellence and
equity: Documenting effective strategies in closing achievement gaps, Teachers College Record,
113(1), 57–96.Bushe, G. R. (2011) Appreciative inquiry: Theory and critique, in: D. Boje, B. Burnes &
J. Hassard (Eds) The Routledge companion to organizational change (Oxford, UK, Routledge),
87–103.Carlone, H. B., Haun-Frank, J. & Webb, A. (2011) Assessing equity beyond knowledge- and skills-
based outcomes: A comparative ethnography of two fourth-grade reform-based science class-
rooms, Journal of Research in Science Teaching, 48(5), 459–485.Chapman, L. & Giles, D. (2009) Using appreciative inquiry to explore the professional practice of a
midwife lecturer, Studies in Continuing Education, 31(3), 297–305.Cochran-Smith, M. & Lytle, S. (1992) Communities for teacher research: Fringe or forefront?,
American Journal of Education, 100(3), 298–325.Cochran-Smith, M. & Lytle, S. (2009) Inquiry as a stance: Practitioner research in the next generation
(New York, Teachers College Press).
Consuegra, E., Engels, N. & Willegems, V. (2016) Using video stimulated recall to investigate tea-
cher awareness of implicit and explicit gendered thoughts on classroom interactions, Teachers
and Teaching: Theory and Practice, 22(6).
Consuegra, E., Halimi, M. & Engels, N. (2015) Gendered classroom interactions, student sense of
equity and student achievement, paper presented at EARLI Conference for Research on Learning
and Instruction, Nicosia, Cyrpus, 25–29 August.
Consuegra, E., Struyven, K. & Engels, N. (2014) Beginning teachers’ experience of the workplace
learning environment in alternative teacher certification programs: A mixed methods approach,
Teaching and Teacher Education, 42(7), 79–88.Cooperrider, D. L. & Srivasta, S. (1987) Appreciative inquiry in organizational life, Research in
Organisational Change and Development, 1, 129–169.Deneire, A., Vanhoof, J., Faddar, J. & Van Petegem, P. (2013) Denken, handelen en professionele
ontwikkeling van Vlaamse leraren en schoolleiders. Eerste resultaten van de Teaching and Learning
International Survey (TALIS) [Thinking, acting and professional development of Flemish
teachers and school leaders. First results of the Teaching and Learning International Survey
(TALIS)] (Brussels, Ministry of Education and Training).
822 E. Consuegra and N. Engels
© 2016 British Educational Research Association
Desimone, L. M. (2009) Improving impact studies of teachers’ professional development: Toward
better conceptualizations and measures, Educational Researcher, 38(3), 181–199.Dorman, J. P. (2003) Cross-national validation of the What Is Happening In This Class? (WIHIC)
questionnaire using confirmatory factor analysis, Learning Environments Research, 6(3), 231–245.
Drudy, S. & �Ui Chath�ain, M. (2002) Gender effects in classroom interaction: Data collection, self-
analysis and reflection, Evaluation and Research Education, 16(1), 34–50.Garrahy, D. A. (2001) Three third-grade teachers’ gender-related beliefs and behaviour, Elementary
School Journal, 102(1), 81–94.Hammerness, K., Darling-Hammond, L., Bransford, J., Berliner, D., Cochran-Smith, M.,
McDonald, M. & Zeichner, K. (2007) How teachers learn and develop, in: L. Darling-
Hammond & J. Bransford (Eds) Preparing teachers for a changing world (San Francisco, Jossey-
Bass), 358–389.Harber, K. D. (2004) The positive feedback bias as a response to out-group unfriendliness, Journal
of Applied Social Psychology, 34(11), 2272–2297.Harber, K. D., Gorman, J. L., Gengaro, F. P., Butisingh, S. & Tsang, W. (2012) Students’ race
and teachers’ social support affect the positive feedback bias in public schools, Journal of Educa-
tional Psychology, 104(4), 1149–1161.Harris, A. D., McGregror, J. C., Perencevich, E. N., Furuno, J. P., Zhu, J., Peterson, D. E. &
Finkelstein, J. (2006) The use and interpretation of quasi-experimental studies in medical
informatics, 13(1), 16–23.Harrop, A. & Swinson, J. (2007) The behavioural approach in schools: A time for caution revisited,
Educational Studies, 33(1), 41–52.Harrop, A. & Swinson, J. (2011) Comparison of teacher talk directed to boys and girls and its rela-
tionship to their behaviour in secondary and primary schools, Educational Studies, 37(1), 115–125.
Henderlong, J. & Lepper, M. R. (2002) The effects of praise on children’s intrinsic motivation: A
review and synthesis, Psychological Bulletin, 128(5), 774–795.Hoban, G. & Hastings, G. (2006) Developing different forms of student feedback to promote tea-
cher reflection: A 10-year collaboration, Teaching and Teacher Education, 22(8), 1006–1019.Howe, C. (1997) Gender and classroom interaction. A research review (Edinburgh, Scottish Council
for Research in Education).
Howe, C. & Abedin, M. (2013) Classroom dialogue: A systematic review across four decades of
research, Cambridge Journal of Education, 43(3), 325–356.Hoyle, E. (1980) Professionalization and deprofessionalization in education, in: M. Atkin, E. Hoyle
& J. Megarry (Eds)World yearbook of education (London, Kogan Page), 42–54.Hruschka, D. J., Schartz, D., Cobb St John, D., Picone-Decaro, E., Jenkins, R. A. & Carey, J. W.
(2004) Reliability in coding open-ended data: Lessons learned from HIV behavioral research,
Field Methods, 16(3), 307–331.Jones, S. M. & Dindia, K. (2004) A meta-analytic perspective on sex equity in the classroom,
Review of Educational Research, 74(4), 443–471.Kelly, A. (1988) Gender differences in teacher–pupil interactions: A meta-analytic review, Research
in Education, 39, 1–23.Kessels, J. W. M. & Keursten, P. (2002) Creating a knowledge productive work environment, Life-
long Learning in Europe, 7(2), 104–112.Krippendorff, K. (2013) Content analysis. An introduction to its methodology (3rd edn) (Thousand
Oaks, CA, Sage).
Lombard, M., Snyder-Duch, J. & Bracken, C. C. (2002) Content analysis in mass communication:
Assessment and reporting of intercoder reliability, Human Communication Research, 28(4),
587–604.Loughran, J. J. (2002) Effective reflective practice: In search of meaning in learning about teaching,
Journal of Teacher Education, 53(1), 33–34.Merrett, F. & Wheldall, K. (1992) Teachers’ use of praise and reprimands to boys and girls, Educa-
tional Researcher, 44(1), 73–79.
Effects of professional development 823
© 2016 British Educational Research Association
Myhill, D. (2002) Bad boys and good girls? Patterns of interaction and response in whole class
teaching, British Educational Research Journal, 28(3), 339–352.O’Hara, R. B. & Kotze, D. J. (2010) Do not log-transform count data,Methods in Ecology and Evolu-
tion, 1(2), 118–122.€Ohrn, E. (1993) Gender, influence and resistance in school, British Journal of Sociology of Education,
14(2), 147–158.Santoli, S. P., Sachs, J. & Romey, E. A. (2008) A successful formula for middle school inclusion:
Collaboration, time and administrative support, Research in Middle Level Education Online,
32(2), 1–13.Schraepen, B., Lebeer, J. & Vanpeperstraete, L. (2010) Draagkracht ten aanzien van diversiteit
en inclusief onderwijs in lagere scholen in de provincie Antwerpen [Capacity to handle diversity
and inclusive education in primary education in the Antwerp Province] (Antwerp, Plantijn
Hogeschool).
Seidel, T. & St€urmer, K. (2014) Modeling and measuring the structure of professional vision in pre-
service teachers, American Educational Research Journal, 51(4), 1–32.Sherin, M. G. & van Es, E. A. (2009) Effects of video club participation on teachers’ professional
vision, Journal of Teacher Education, 60(1), 20–37.Swinson, J. & Harrop, A. (2005) An examination of the effects of a short course aimed at enabling
teachers in infant, junior and secondary schools to alter the verbal feedback given to their
pupils, Educational Studies, 31(2), 115–129.Swinson, J. & Harrop, A. (2012) Positive psychology for teachers (London, Routledge).
Taino, L. (2011) Gendered address terms in reproach sequences in classroom interaction,
Linguistics and Education, 22(4), 330–347.Thiele, J. & Markussen, B. (2012) Potential of GLMM in modelling invasive spread, CAB Reviews,
7(16), 1–10.Timperley, H., Wilson, A., Barrar, H. & Fung, I. (2007) Teacher professional learning and develop-
ment. Best evidence synthesis iteration (University of Auckland, New Zealand Ministry of Educa-
tion).
Tomlinson, C. A., Brighton, C., Hertberg, H., Callahan, C. M., Moon, T. R., Brimijoin, K. &
Reynolds, T. (2003) Differentiating instruction in response to student readiness, interest and
learning profile in academically diverse classrooms: A review of literature, Journal for the Educa-
tion of the Gifted, 27(2/3), 119–145.Tripp, T. R. & Rich, P. J. (2012) The influence of video analysis on the process of teacher change,
Teaching and Teacher Education, 28(5), 728–739.Valcke, M., Rots, I. & Struyven, K. (2012) Als het krijtstof neerdaalt . . . Een bijdrage aan de beleidseval-
uatie van de lerarenopleidingen in Vlaanderen [When the chalk dust settles . . . A contribution to the
policy evaluation of teacher education programmes in Flanders] (Brussels, Flemish Ministry of Edu-
cation and Training).
van Es, E. A. & Sherin, M. G. (2008) Mathematics teachers’ ‘learning to notice’ in the context of a
video club, Teaching and Teacher Education, 24(2), 244–276.van Es, E. A. & Sherin, M. G. (2010) The influence of video clubs on teachers’ thinking and prac-
tice, Journal of Mathematics Teacher Education, 13(2), 155–176.Van Houtte, M. & Stevens, P. A. J. (2008) Sense of futility, The missing link between track position
and self-reported school misconduct, Youth Society, 40(2), 245–264.van Veen, K., Zwart, R., Meirinck, J. & Verloop, N. (2010) Professionele ontwikkeling van leraren
[Professional development of teachers] (ICLON/Expertisecentrum Leren van Docenten).
Verleysen, B., Lambrechts, F. & Van Acker, F. (2015) Building psychological capital with apprecia-
tive inquiry: Investigating the mediating role of basic psychological need satisfaction, Journal of
Applied Behavioral Science, 51(1), 10–35.Vescio, V., Ross, D. & Adams, A. (2008) A review of research on the impact of professional learning
communities on teaching practice and student learning, Teaching and Teacher Education, 24(1),
80–91.White, R. L. (2010) Demonstration of the effects of an increased praise ratio on student on-task behavior.
Ph.D thesis, University of Kansas, Kansas, USA.
824 E. Consuegra and N. Engels
© 2016 British Educational Research Association
Younger, M. & Warrington, M. (2002) Single-sex teaching in a co-educational comprehensive
school in England: An evaluation based upon students’ performance and classroom interac-
tions, British Educational Research Journal, 28(3), 353–374.Younger, M., Warrington, M. & Williams, J. (1999) The gender gap and classroom interactions:
Reality and rhetoric?, British Journal of Sociology of Education, 20(3), 325–341.
© 2016 British Educational Research Association
Effects of professional development 825