Embed Size (px)
Citation preview
EFFECTS OF SEARCH TIMING ON PRODUCT INNOVATION:
THE VALUE OF NOT BEING IN SYNC
RIITTA KATILA Department of Management Science and Engineering
Terman Engineering Center
Stanford University
Stanford, CA 94305-4026 Tel: (650) 725-1632 Fax: (650) 723-1614
e-mail: [email protected]
ERIC L. CHEN Department of Management Science and Engineering
Terman Engineering Center
Stanford University
Stanford, CA 94305-4026 Tel: (650) 725-1632 Fax: (650) 723-1614
e-mail: [email protected]
Working paper. Comments are most welcome. Several people provided valuable suggestions in various stages of this project. Special thanks to Warren Boeker, Kathy Eisenhardt, Jeho Lee, Dan Levinthal, Steve Mezias, Elaine Romanelli, Lori Rosenkopf, Brian Silverman and the anonymous reviewers for many helpful ideas. We also thank Jim Hirabayashi from the U.S. Patent and Trademark Office and several executives and engineers from the robotics industry for their time and valuable assistance. A previous version of the paper appeared in the 2006 Best Paper Proceedings of the Academy of Management (OMT division). This research was supported by the National Science Foundation, Stanford Technology Ventures Program, and the Sloan Foundation.
EFFECTS OF SEARCH TIMING ON PRODUCT INNOVATION:
THE VALUE OF NOT BEING IN SYNC
Abstract
This paper investigates how firms search for new products. While prior research takes a
firm-centric view, we study how the firm’s search depends on that of its competitors. Drawing
on organizational learning theory, we argue and find that search timing relative to competitors
matters. Two seemingly contradictory views are tested: that competitors take away the
exclusivity of search and therefore suppress innovation, or, in contrast, sharpen and validate the
focal firm’s search and thus promote innovation. Our analysis of 15 years of longitudinal data on
124 Japanese, European, and U.S. industrial automation organizations reconciles these views. In
particular, firms introduce more new products if they search later than competitors, and they
introduce innovative new products if they search earlier than competitors. Interestingly, the most
innovative firms combine these two out-of-sync approaches, but avoid searching in sync.
Key words: organizational search, innovation, new products.
1
How do organizations obtain the knowledge necessary for innovation? Organization
theorists highlight several approaches, such as inheriting knowledge from founders (Romanelli,
1985; Eisenhardt and Schoonhoven, 1990), grafting on new members and organizations (Baum
et al., 2000; Rao and Drazin, 2002; Song et al., 2003), and, more recently, growing organically
(Hess and Kazanjian, 2006). Prominent among such organic approaches is search, i.e., a
problem-solving process where organizations recombine, relocate and manipulate existing
knowledge in order to create new knowledge (Nelson and Winter, 1982). Search is particularly
attractive when the needed knowledge was not inherited and cannot be readily grafted on.
A significant stream of research has emerged to study search, and in particular, to study
how firms search to innovate. This research provides several insights. One is that those firms that
search more frequently and further away from their current knowledge-bases (Greve, 2003;
Nerkar, 2003; Taylor and Greve, 2006) are more likely to succeed in search. Another is that
firms typically search in exactly the opposite way – too little and too close (Helfat, 1994; Benner
and Tushman, 2002; Nerkar and Paruchuri, 2005) – and need to find effective strategies to avoid
such local tendencies (e.g., Rosenkopf and Almeida, 2003; Fleming and Sorenson, 2004). A third
insight is that successful search often combines knowledge that is known to the firm with
knowledge that is new to it (March, 1991; Tushman and O’Reilly, 1996; Katila and Ahuja, 2002;
Siggelkow and Rivkin, 2005).
Yet despite this variety in insights, the dominant view on innovation search is
surprisingly firm-centric. The firm’s search activities are measured in terms of its own past
behavior, such as how new the search is relative to the search paths that the firm has tried before.
But such studies, although valuable, do not take into account that the firm’s competitors also
2
search. These competitor searches are likely to create constraints and opportunities for search
that are important but poorly understood.
We propose that the next step in search research, therefore, is to incorporate competition.
Specifically, we ask: How do competitors’ simultaneous or past search activities influence the
outcomes of focal firm’s search? In response, we build on research in organizational learning to
examine how competitors search relative to one another and what the potential effects of
competitor search on innovation are. To assess the effects, we conceptualize search as a learning
contest, map out differences in search timing between the firm and its competitors (head-start, in-
synch, and catch-up), and form predictions of how these timing choices influence performance of
search. We test the predictions over a 15-year period in a prominent subfield of the international
industrial automation industry, namely robotics. The effects of search are examined on two
dependent variables: how frequently new products are introduced and how innovative they are.
There are three main findings. First, our results extend past innovation search studies to
include competition. We find that even after controlling for the traditional predictors of search
success—i.e., search intensity and search distance—search by competitors has a significant
influence. Our results thus provide empirical evidence that fully understanding the value of
search requires understanding the competition.
Second, we find that search timing relative to that of competitors is critical. Firms that
time their search so that they are out-of-sync with their competitors succeed in innovation while
firms that search in-sync often fail. Moreover, out-of-sync search both accentuates and
diminishes product innovation. These findings are not contradictory but reflect tradeoffs between
introducing a larger number but less innovative products (catch-up) and introducing fewer but
more innovative products (head-start).
3
Third, the most innovative firms search along more than one path. When a firm engages
in both types of out-of-sync search simultaneously, it can bridge its own and its rivals’ hitherto
isolated clusters of knowledge, and subsequently introduce more products and more innovative
products than using either approach alone. The aggregate effect of our results is an interesting
evolutionary path through which heterogeneity in the industry converges and diverges over time
and through which industries can potentially overcome local search.
THEORETICAL BACKGROUND
Innovation is a tenuous activity: New products are developed through an inherently
complex and uncertain process. The path to an innovation includes many detours and dead-ends,
and the technical and commercial promise of an innovation is poorly understood in advance. Yet,
innovation is essential in technology-based firms. It represents the commercial potential of the
firm's R&D activities (King and Tucci, 2002) and is thus a source of competitive advantage and
profits (Utterback, 1994; Bayus and Agarwal, 2007). Understanding how firms search for
innovation is thus important.
Innovation Search
Innovation search—the problem-solving process where organizations recombine, relocate
and manipulate existing knowledge in order to create new product innovation—is a particularly
appropriate lens to study innovation for several reasons. First, in-depth fieldwork describes
product development as problem-solving (e.g., Clark et al., 1987; Dougherty and Hardy, 1996).
For example, in the course of new product development, automotive engineers translate
information on technological possibilities into a set of designs, instructions and information
required for producing a product; in other words, they search for solutions to technical problems
(e.g. Clark et al., 1987; Iansiti, 1995). Thus, search theory is particularly likely to give insight
4
into development of new products. Second, search is an appropriate lens to examine innovation
because it explicitly focuses on attempts to solve problems and discover opportunities in a world
that is ambiguous and where problems cannot be solved directly (Simon, 1957; Cyert and March,
1963; Nelson & Winter, 1982). Innovation search is also intriguing to study because a key
element of new product development is competition (Porter, 1985; Brown and Eisenhardt, 1998)
yet prior work on innovation search has neglected to examine its influence.
Innovation search takes place in a knowledge space, also known as a knowledge pool. As
Levinthal and March describe, “search consists of sampling opportunities from the pool of
technological possibilities” (1981: 313). In other words, the firm recombines, relocates and
manipulates knowledge within a technological knowledge space (c.f., Nelson & Winter, 1982),
and researchers typically track this activity using patent citations (Rosenkopf and Nerkar, 2001;
Benner and Tushman, 2002; Almeida et al., 2003; Fleming and Sorenson, 2004; Singh, 2005).
The knowledge space where the firm searches has two distinct sectors: One is knowledge
familiar to the searching firm (its current knowledge-base), and another is knowledge that is new
to it (e.g., Levinthal and March, 1981; Katila and Ahuja, 2002). The firm may introduce new
products because it explores entirely new areas that depart from its current knowledge-base, or
because it productively translates knowledge from its existing knowledge-base into new
products. Consequently, a relatively large stream of innovation search studies (anchored in
organizational learning theory) has examined these two approaches, typically labeling them as
exploration and exploitation.1 Exploring areas that are new to the firm lowers the expected
returns to search, i.e., the mean (because most new ideas are bad ones) and thus reduces
frequency of new products. At the same time, however, exploration increases the variance of
1 Some authors use different labels such as innovation and refinement (Levinthal and March, 1981) or slack search and problemistic search (Cyert and March, 1963).
5
search and subsequently helps the firm introduce more innovative products (March, 1991; see
also Campbell, 1977). In contrast, exploiting the firm’s current knowledge stock leads to a
relatively high mean (because the value of knowledge is already known) and thus increases
frequency of new products. However, exploitation reduces variance of search (because
variability declines with experience) and in the process makes search more reliable but
substantively less innovative (Levitt and March, 1988; March, 1991). In short, the more
exploratory the search the more innovative but unreliable the output; and the more exploitative
the search, the less innovative but more reliable the output (Taylor and Greve, 2006).
Exploration and exploitation have been further characterized through empirical studies.
For instance, Mezias and Glynn (1993) used simulation and Rosenkopf and Nerkar (2001)
archival data to demonstrate that firms that explore are more likely to generate innovative
technologies. Other work has shown that firms that exploit their current knowledge-bases
introduce new technologies more frequently (Greve, 2003; Rouse, 1999). Another empirical
stream provides descriptive insights. The findings indicate that despite the benefits, firms avoid
exploration (Romanelli, 1985; March, 1991), and that this tendency is especially strong and
potentially detrimental in R&D (Helfat, 1994). Further, learning tends to crowd out exploration
(Cyert and March, 1963; Levinthal and March, 1993; Ahuja and Katila, 2004). Thus, as firms
grow large and search more, they will typically exploit more often, thereby making their search
more reliable at the expense of variation.
In sum, prior work on innovation search provides many useful insights. But these insights
are predominantly firm-centric2. The studies typically assess a firm’s search activities relative to
its own behavior and do not consider how competitors search. Overall, how firms search within
2 The few studies that include competition (e.g., Greve and Taylor, 2000) are typically descriptive and use high-level proxies, such as co-location in the same market for competition, and successful outcomes for search.
6
an environment (of other competing organizations) and its implications for search outcomes are
poorly understood. For example, questions such as whether competitors’ experience influences
search in a similar way as the firm’s own experience remain unexplored. And yet, firms do not
search in isolation: in order to understand search in detail, we need to incorporate competition.
This is the task we undertake in this paper.
Effects of Competition on Innovation Search
As noted above, innovation search literature explains innovation but focuses on the firm
and seldom deals with competition. In contrast, both organizational economists and sociologists
have long been interested in the relationship between competition and innovation (e.g.,
Schumpeter, 1934; Scherer, 1980; Porter, 1990). These literatures suggest several logics through
which competition may influence search. We focus on two, learning and racing, that are
particularly significant for innovation search.
Effects of competitor search: learning. Competitors can influence the search of the
focal firm through learning: The firm can learn from its competitors, and the competitors can
learn from the firm. First, the focal firm can learn from its competitors in several ways. One is
learning mimetically, that is, selective copying of other organizations. Some authors argue that,
in competitive industries, large firms in particular often adopt a ‘fast second’ strategy and
commercialize the discoveries of their smaller competitors (e.g., Baldwin and Childs, 1969;
Markides and Geroski, 2005). In another form of learning, firms observe a variety of R&D
attempts by their competitors, and decipher rules that link these experiences (and the searched
knowledge) to consequences (Miner and Mezias, 1996). Such inferential learning—informed
observation and active interpretation of others’ search—may thus lead to more innovation.
Research also notes that by selecting to search in some areas and not in others, competitors “set
7
the agenda” and “influence judgment” in R&D (Greve and Taylor, 2000; Zollo and Winter,
2002). In other words, competitors’ R&D efforts may provide clues to executives that certain
areas are viable and timely in the market, or they may validate (or cast doubt on) the firm’s
current R&D focus. Overall, the implication is that the focal firm learns what works (and what
does not) by observing the results of innovation search of others, with a likely positive effect on
the product frequency of the focal firm.
On the flipside, competitors will also learn from the focal firm. They typically start
searching in the same area, and crowd it. The area quickly becomes ‘picked over’, and
innovative opportunities start to disappear. This is because the best technological opportunities
are typically exploited first, and the remaining opportunities are more difficult to find (Podolny
et al., 1996; Swaminathan, 1996). In contrast, if the focal firm searches alone, it does not have to
invent around competitor search. Knowledge space is less crowded and there are ample
opportunities to draw on knowledge that does not overlap with competitors. Overall, the
implication is that when competitors start learning from the focal firm, there is a likely negative
effect on innovativeness of the focal firm’s new products.
Effects of competitor search: racing. Search by competitors can also induce racing
behavior, where the focal firm searches simply in order to keep up with its competitors. This
behavior is particularly likely when firms engage in simultaneous searches with similar resources
(Paredis, 1997). In the extreme, competitors’ achievements provide a continuously moving target
for the focal firm, establishing a Red Queen effect (i.e., the firm has to run just to stay in place;
Van Valen, 1973; Barnett, 1997). Since racing is likely to focus the firm’s efforts on matching
those of its competitors’, it may make it harder for the firm to introduce new products frequently.
Also, firms that race often start thinking alike about implementation, instead of adopting unique
8
R&D paths (Mowery et al., 1998; Sull, 2001), thus killing the variation in search (e.g., March,
1991; Romanelli, 1999). As a result, innovation may become stifled. The overall implication is
that racing makes innovation more difficult because the firm’s efforts are focused on staying
even rather than on innovating, with a likely negative effect on both the frequency and
innovativeness of the focal firm’s product introductions.
Theoretical Framework
The learning and racing logics can be used to frame our arguments on how competition
affects search. Understood as a positive influence, learning from competitors augments the focal
firm’s search by increasing the amount of experience from which the focal firm can draw.
Competitor searches provide raw material for search as well as examples of what not to do, and
they influence the judgment of where the opportunities are. This logic suggests that it is
advantageous to search when experience from competitors’ searches is already available, that is,
after competitors have already searched. By contrast, understood as a negative influence,
competitors’ learning from the focal firm crowds the search space and restricts the opportunities
for focal firm’s innovation. The very searches by competitors that provided material for learning
also block opportunities for innovation that the focal firm could have reached first. Thus, it
suggests that it is advantageous to search ahead of competitors.
Second, understood as racing, competition derails the focal firm’s search by forcing it to
expend resources to match the rivals rather than to innovate. This logic is particularly acute in
situations where firms engage in simultaneous head-to-head searches, and thus suggests that it is
disadvantageous to search simultaneously with competitors.
Altogether, the answer to the question of how competitors influence search hinges on
which logic is more appropriate. Our purpose in this paper is to show that searching after
9
competitors is a significant determinant of search success when the goal of the search is to
introduce new products more frequently, and that searching ahead of competitors is a significant
determinant when the goal is to introduce more innovative new products. Firms achieve neither
outcome by searching simultaneously with competitors.
--- Insert Table 1 about here ---
In order to analyze the effects of search timing in more detail, we construct a model
where the different competitive situations are categorized by juxtaposing the focal firm’s and its
rivals’ innovation search behavior over time (Table 1).3 Three (illustrative) paths emerge,
differentiated based on when the focal firm starts searching relative to its competitors (see also
Lavie, Lechner and Singh, 2007 regarding alliance timing). Each path starts from a distinct
starting position and then proceeds toward the top right corner of the table. Note that all paths
may not visit all the same steps along the way. For instance, firms may move directly from
firm’s exclusive exploration to rivals’ late exploration if rivals catch up fast.
Consistent with our theoretical focus on organizational learning, the three paths are
labeled as three learning contests (see also Amburgey et al., 2000): The first two are out-of-sync
contests while the third is a synchronous contest. The first, head-start contest, starts when the
focal firm uses a particular knowledge first in the industry, first exploring, and then (possibly but
not necessarily) exploiting exclusively. The rivals may join this contest later. The second, catch-
up contest, starts when rivals use a particular knowledge first in the industry, first exploring, and
then (possibly also) exploiting it exclusively without the focal firm. The focal firm may catch up
and join this contest later. The third, synchronous contest, starts when both the firm and its rivals
3 For brevity, two baseline situations (‘Firm no longer searches’, ‘Rivals no longer search’) are not shown in the table but serve as omitted categories in our empirical tests.
10
use a particular knowledge first (i.e., exploring) simultaneously and possibly keep searching it
together (i.e., exploiting). These three contests form the basis of the hypotheses.
HYPOTHESES
In this section we develop hypotheses to explain how new product innovation depends on
search timing. In trying to unpack the relationship, three distinct sets of hypotheses are
examined: The first set focuses on the situation where the focal firm has a head start. The second
set corresponds to the situation where the rivals search first and the focal firm has to catch up.
The third set focuses on synchronous search where the firms start at the same time and race
together. Italicized terms in this section refer to cells in table 1.
Out-of-Sync: Searching with a Head Start
When the focal firm has a head start, competitors have two possible roles: first they allow
the focal firm to explore but not learn from them (H1) and second, when they join the search,
they provide opportunities for learning but also crowd the space (H2). To separate search that
aims at generating many new products from search that targets more innovative products, we
study the effects on both frequency and innovativeness of new product introductions.
Hypothesis 1 focuses on the focal firm’s search before rivals. Such firm’s exclusive
exploration is proposed to make product introductions less frequent (H1a) but more innovative
(H1b). First, we propose that the potential returns of exclusive exploration are uncertain, making
the search unreliable. Because the firm is searching the knowledge first in the industry, there is
no prior experience to learn from (March, 1991), and it is unclear whether the returns are high
enough to warrant further development into a commercializable product. On average, exclusive
exploration is not likely to generate new products reliably and thus reduces product frequency.
11
In contrast, the variability of outcomes from exclusive exploration is likely to be high,
precisely because there is no prior experience to learn from (March, 1991). Such variability will
extend the range of available technological options from which the firm can select (Madsen et
al., 1997). Since these options are not known to one’s competitors (and so there is no risk of
crowding), they are particularly important when the firm competes for a relative position within
a group of competitors (March and Simon, 1958). This is the case here; the firms try to introduce
a product that offers more value to customers than competing products. We thus propose that
exclusive exploration is likely to yield innovative new products.
When the firm with the head start is able to exploit the knowledge exclusively, i.e.,
continue to search it without any of its rivals joining the race, such firm’s exclusive exploitation
modifies the above-documented negative (on frequency) and positive (on innovativeness) effects
on product innovation. First, the traditional argument is that exploitation will increase the
expected returns from search (March, 1991). At the same time, however, competitors have had
the opportunity to join the search but have not done so, possibly because they do not believe that
the knowledge area provides enough opportunities for them (e.g., scales up easily) or perhaps
because the knowledge may not be as valuable as the focal firm believes (Kirzner, 1973). In
other words, competitors may not be interested because the potential returns from this area are
uncertain. Taken together, these arguments suggest that firm’s exclusive exploitation has a
negative but weaker effect on focal firm’s product frequency than firm’s exclusive exploration.
In contrast, while firm’s exclusive exploitation is likely to result in fewer products, the
products that are generated may be even more innovative than those generated by exclusive
exploration. It often takes multiple attempts to get an innovative product ‘right’. While the first
attempt (through exclusive exploration) may have been relatively rough, the firm that has a
12
chance to continue searching free of competition has complete control of the search process.
There is no need to reconcile findings with those of rivals or to keep track of others’ search
efforts in the same area. Thus, the firm is free to select any knowledge combinations it returns to
search. Further, product development engineers that search a particular knowledge element
repeatedly, for a variety of purposes, often come to understand it better, and learn to combine the
knowledge effectively into new, innovative combinations (Mezias and Glynn, 1993; Galunic and
Rodan, 1998). Thus, exclusive exploitation may result in more innovative products than
exclusive exploration. Based on these arguments, we propose:
H1a. Firm’s exclusive search (exploration and exploitation) has a negative effect on the frequency of its new product introductions. H1b. Firm’s exclusive search (exploration and exploitation) has a positive effect on the innovativeness of its new product introductions.
While hypothesis 1 focused on solitary searches by the focal firm, at some point the
firm’s competitors are likely to join this race (i.e., rivals’ late exploration). Rivals’ search may
provide an opportunity for learning (H2a) but it also increases crowding (H2b). First, by joining
the search, competitors can help confirm that an area is viable and timely for search. In other
words, competitors indicate (indirectly, through their own search) that selecting the knowledge
for further development is worthwhile, i.e., expected returns are high relative to other possible
projects. Thus, there is a lower chance that the development will fail or that the focal firm will
shelve the project. Competitors’ search also provides opportunities for learning because the focal
firm can see what competitors do with the knowledge and may get new product ideas. Taken
together, when competitors join the race they will provide opportunities for learning and so
increase frequency of new product innovation.
13
However, once competitors start searching the knowledge, it is less and less likely to lead
to innovative products that differentiate the focal firm from its rivals. The reason is that rivals
also start learning from the focal firm and soon the knowledge space becomes crowded: the new
knowledge combinations that the focal firm can select are constrained by the combinations that
its rivals are now forming using the same knowledge (March, 1991). So, while rivals’ joining the
search may lower the risk of poor outcomes, it may make it harder to find innovative outcomes
that others would not also find.
H2a. Rivals’ delayed search (late exploration) has a positive effect on the frequency of the firm’s new product introductions. H2b. Rivals’ delayed search (late exploration) has a negative effect on the innovativeness of the firm’s new product introductions.
Out-of-Sync: Searching to Catch Up
The second set of hypotheses focuses on search that is initiated by rivals, with the focal
firm searching to catch up. In this situation, competitors provide opportunities for learning but
make the knowledge space crowded (H3, H4).
Hypothesis 3 focuses on search where the rivals are the first to use a particular
knowledge element. Such rivals’ exclusive exploration makes product introductions more
frequent (H3a) but less innovative (H3b). First, technical breakthroughs and new problem-
solving approaches that rivals discover may leak to the rest of the industry (c.f., Nelson and
Winter, 1973) and so may become available to the focal firm without any direct search by it, i.e.,
through ‘passive search’ (Huber, 1991). Such knowledge leaks may, for instance, remove
bottlenecks in the innovation process that hold back better products (Hughes, 1983), and may
thus make a larger number of new products possible. More broadly, rivals’ exclusive exploration
may provide clues to where the opportunities are that are worth developing. “Borrowing saves
14
the costs of search, the costs of testing and the costs of evaluating feasibility” (March and Simon,
1958). For instance, rivals’ exclusive exploration may provide hints of up-and-coming areas and
thus increase expected returns from search (Romanelli, 1999). The firm may then react, for
example, by introducing shelved products that respond to the new trend (Utterback, 1994). The
focal firm may also scan its competitors’ patent documents to get new insight into its own
development problems or become informed of possible solutions to customers’ problems.
Altogether, rivals’ exploration of new knowledge may suggest which product development
projects should be completed (i.e., which have high expected returns) and thus may allow the
focal firm to introduce new products more often.
In contrast, rivals’ exclusive exploration is likely to hurt innovativeness. Simple imitation
of what rivals already know is unlikely to lead to innovative products that differentiate the firm
from its rivals (Kogut and Zander, 1992), for two reasons. First, rival searches make the
knowledge space crowded. Without its own search effort and the intricate knowledge that it
provides (e.g., causality, failed approaches, promising leads), innovation is difficult. Second,
imitation typically has a low variance – variations that might have developed from the
organization’s idiosyncratic search may never emerge (Romanelli, 1999; Leonard-Barton,
Bowen et al., 1994). The result is that while rivals’ exclusive search may lower the risk of poor
outcomes, it will make it harder to introduce particularly innovative outcomes that would surpass
those of competitors.
When the rivals continue to exploit the knowledge exclusively, i.e., the focal firm does
not join the search, such rivals’ exclusive exploitation intensifies both the above-documented
positive (on frequency) and negative (on innovativeness) effects on product innovation. First,
rivals’ repeated use of knowledge is an implicit sign that the knowledge is valuable, and provides
15
reliable material for learning, from which new products can be created (March, 1991). Observing
rivals’ repeated search also allows the firm’s own engineers to identify possible dead-ends in
product development and to avoid the mistakes of prior searches (i.e., to learn what not to do).
Overall, rivals’ exclusive exploitation may make new product introductions even more frequent
than rivals’ exclusive exploration does.
In contrast, rivals’ exploitation is likely to have a negative effect on innovativeness. The
gap between the firm’s and its rivals’ products widens as rivals return to search the same
knowledge and start to perfect it, but the focal firm has yet to join the search. We propose:
H3a. Rivals’ exclusive search (exploration and exploitation) has a positive effect on the frequency of the firm’s new product introductions. H3b. Rivals’ exclusive search (exploration and exploitation) has a negative effect on the innovativeness of the firm’s new product introductions.
While hypothesis 3 focuses on rivals’ exclusive search and assigns a rather passive role
for the focal firm, hypothesis 4 centers on the moment when the focal firm joins the search
(firm’s late exploration). While knowledge that is available from rivals’ searches can be useful, it
is often incomplete—a collection of fragments of possibly useful knowledge (Winter, 1984:
293)—and typically requires complementary problem-solving efforts by the focal firm.
Hypothesis 4 focuses on these efforts.
Again, we propose both positive (H4a) and negative (H4b) effects on frequency and
innovativeness of new products. First, the firm that joins the race late is likely to introduce more
new products because competitors’ prior searches provide reliable raw material for subsequent
searches. By observing competitor searches first and only then forming their own combinations,
the focal firm’s engineers learn how a particular knowledge element behaves in combination
with other elements, and what approaches to search are the most promising (i.e., have high
16
expected returns). In addition, the rivals’ simultaneous search of the focal knowledge indicates
that the knowledge remains a valuable source for new product introductions. Taken together, we
thus propose a positive effect on frequency of new products.
While firms that explore late are likely to introduce more new products, it is less likely
that they will be innovative. Although the focal firm may identify a knowledge combination that
is new to it, the same combination may have already been used by one of the rivals, thus limiting
the variability of focal firm’s search output. Thus, we propose a negative effect on
innovativeness.
H4a. Firm’s delayed search (late exploration) has a positive effect on the frequency of the firm’s new product introductions. H4b. Firm’s delayed search (late exploration) has a negative effect on the innovativeness of the firm’s new product introductions.
In-Sync: Searching Simultaneously
A third set of hypotheses focuses on synchronous search, i.e., the situation where the
focal firm starts the search simultaneously with its rivals. Unlike the out-of-sync approaches
described above, searching simultaneously with competitors makes it difficult to introduce a
large number of products (H5a) as well as products that are innovative (H5b). First, synchronous
exploration lowers product frequency because it is risky. The firm can neither learn from its
competitors’ nor from its own prior experiences, making the search unreliable. Even more
significantly, both synchronous exploration and synchronous exploitation lead to fewer new
products because racing behavior is likely to develop. Rivals become locked into head-to-head
races where they try to stay competitive with relatively homogeneous resources (Barnett, 1997;
Lieberman and Asaba, 2006). New product ideas are often commercialized prematurely (fearing
17
that the competitors get there first) or not at all (waiting for the competition to move first). As a
result, fewer products are introduced.
Second, synchronous search is likely to make the firm’s products less innovative. With
rivals searching the same knowledge at the same time, neither synchronous exploration nor
synchronous exploitation is likely to lead to unique product ideas. Instead, the rivals are likely to
engage in a race where product innovation is constantly improved in rapid but minor steps in
order to outcompete one another. In these situations, competitors’ achievements provide a
continuously moving target for the focal firm, establishing a Red Queen effect (Van Valen, 1973;
Barnett, 1997). Since the target is constantly moving, it is difficult to keep up, and particularly
difficult to introduce major innovations (Paredis, 1997). Firms may also end up developing
product concepts or technical improvements that respond to their competitors’ moves rather than
the needs of the customer. Both the firm and its rival(s) invest in costly search, but neither ends
up being particularly innovative.
H5a. Synchronous search (exploration and exploitation) has a negative effect on the frequency of the firm’s new product introductions. H5b. Synchronous search (exploration and exploitation) has a negative effect on the innovativeness of the firm’s new product introductions.
METHOD
Sample
We test the hypotheses in the industrial automation industry by studying companies that
developed industrial robots between 1984 and 1998, inclusive. We limited our analysis to three
large geographical areas, namely Japan, Europe, and the U.S., because they accounted for over
95% of the world’s robot supply during this period (World industrial robots, 1996) and because
high-quality data were available for each of them. There were 124 companies in the sample
18
during this 15-year period, although some of these companies participated in the industry for a
shorter time period only. Of the 124 firms, seventy-three were Japanese, nineteen were
European, and twenty-seven were U.S. firms.
We chose to focus on firms that develop robots, for three reasons. First, they make
substantial R&D investments and develop complex products (Klepper, 1988). As a result, it is
difficult to compete in robotics, and so there is a greater need for search behavior that is
effective. We also chose robotics because if firms learn by searching after their competitors, it
should be possible to observe this process in robotics. In our interviews4, robotics engineers and
their managers told us that they regularly scan public sources of information to identify ideas for
new products. One interviewee who had worked both in the automobile and in the robotics
industry pointed out that whereas automobile companies routinely made reciprocal agreements to
exchange information, robotics companies knew surprisingly little about each others’ R&D, and
instead relied on public information such as scanning of competitors’ patents. Third, we chose
robotics because it is a competitive market where users require high product performance
(because robots are a critical part of their manufacturing process). Understanding how firms
create innovative products is thus important.
To identify the sample of industrial robotics companies for this study, a list of candidates
was formed through an extensive search of robotics trade magazines and databases, and then
verified through discussions with industry experts. Only those companies in the population that
developed or had announced that they will develop industrial robots were included. Companies
that developed automation systems or appliances, or robots in other than industrial application
areas were excluded, as were companies that sold or licensed robots, but did not develop them. 4 As part of this study, we conducted informational interviews with engineers and executives of nine U.S., two European and seven Japanese robotics organizations.
19
We also excluded private companies because we did not have complete data on them. Seventy-
one firms in our sample had introduced at least one industrial robot during the study period.
These firms represent a wide range: one company introduced new products 14 years in a row,
whereas 22 of these firms introduced products in only one year. On average, the firms introduced
new products in 4.1 firm-years.
Data Sources
Three primary sources of data were used. For new products, trade publications and
product catalogs were the main source, and the data were assembled using a “literature-based
innovation output indicator” method (Coombs et al., 1996). In this method, editorially-controlled
new product announcement sections of technical and trade journals (such as Assembly
Automation, Industrial Robot, Japan Robot News, Robotics Today, and Robotics World) as well
as product catalogs and databases (such as Robotics new product database and Robotics product
specifications in Japan) were combed through systematically to assemble data on new product
introduction dates and specifications. This data collection was particularly painstaking because
while some of these sources were electronic, many others, especially in early years, were
available only in hard copy format in remote library locations. Altogether, over 30 different
publications over a 15-year period were searched, and multiple sources were used whenever
possible to validate the data.
For patents, we retrieved the data from the U.S. Patent and Trademark Office database,
and used Who owns whom directories to track subsidiaries so that patents could be assigned to
each firm. We then used custom-programmed C code to assemble the data into the independent
variables. These programs were particularly time-consuming to design and run because they
20
combined a large number of citation variables and their recombination patterns, interactions
between various rivals, and long time periods.5
For firm financial and operational indicators, we assembled the data from databases
including Compustat, Worldscope and DIR Analyst’s guide.
The primary, archival data was supplemented with eighteen interviews. We interviewed
industry participants and observers, including robotics executives and engineers, suppliers,
customers, university scientists and industry experts, on three continents (Japan, Europe, U.S.).
These interview data grounded our thinking about the industry. In particular, it strengthened our
understanding of the causal mechanisms underlying successful innovation and helped us choose
more accurate measures. It also helped in interpreting the results.
Dependent Variables
We examined two outcomes of innovation search: (1) number of new product
introductions (product frequency) and (2) innovativeness of these introductions (product
innovativeness). We measured product frequency as the number of new industrial robots
introduced by each sample firm each year. Industrial robot is commonly defined as a product that
is programmed to move a gripper or tool through space to accomplish a useful industrial task
(Hunt, 1983), and all our data sources used this definition. To qualify as new, each product was
required to differ in technical or physical characteristics from the producing firm’s previous
products (Martin and Mitchell, 1998). An existing product introduced in a new geographical
area, for example, did not qualify.
5 This computationally intensive and complex task was accomplished by parallelizing the code and running it on a high-performance Linux cluster computer. There were 244,616 patents and 12,047,365 patent citations in the data. One run of the program took approximately 2 days on the cluster with 346 CPUs; the same task would have required over 100 days on a single-CPU computer. In total, running the different versions of the program and their revisions required over eight years of CPU time.
21
Product innovativeness was measured annually for each firm as the improvement in those
product design characteristics that were important to users. This user design characteristic
method is well-established (Sahal, 1985; Keeney and Lilien, 1987). For example, Dodson (1985)
used it to compare rocket motors (delivered impulse, thrust, and motor weight), and Trajtenberg
(1989) to compare medical imaging equipment (scan time, image quality, and reconstruction
time). In general, several scholars such as Alexander and Mitchell (1985) have concluded that to
qualify, performance measures of products need to be both valuable to users and make sense to
engineers in the field. Design characteristics that users value fulfill both of these criteria.
There are four such characteristics of robots: repeatability, speed, load capacity, and
degrees of freedom6. According to industry sources, customers used these four characteristics to
decide which new robot to buy during the time period of this study (McDermott and Alexander,
1984; Booth, Khouja, and Hu, 1992). A hedonic price analysis, which determines the value that
buyers place on characteristics of products (e.g., Henderson, 1993), also confirmed that these
characteristics were important. Since we did not have price data for all products in the sample,
the hedonic analysis was restricted to a smaller set yet confirmed that we had chosen the right
characteristics (see Appendix).
The four design characteristics that we used are reliably measured and consistently
reported in the product catalogs during the period of the study (Booth et al., 1992). Robotics
associations have guidelines for measuring these characteristics, and both U.S. and international
standards exist to enforce that the measurements are comparable (Dagalakis, 1998). These data
are also highly reliable since multiple data sources were used.
6 Repeatability of each robot is defined as a closeness of agreement of repeated position movements under the same conditions to the same location. Speed is defined as the maximum velocity at which the robot (i.e., its tool tip or end effector) can move, producing a satisfactory result. Load capacity is the maximum weight or mass of a material that the robot can handle without failure. Degrees of freedom (or dexterity) defines the space where the robot is able to move and thus determines how complex its movements can be.
22
In order to construct product innovativeness, we compare the average performance
characteristics of the firm i’s new products in year t (cijt) with the average performance
characteristics of new products introduced in the industry the previous year (cjt-1), where j
identifies one of the four characteristics. For example, the repeatability of the firm’s robots is
compared with the repeatability of all robots introduced last year. Consistent with prior work that
uses a similar composite measure, the innovativeness variable is constructed by identifying the
differences between year t and year t-1 values divided by year t-1 values for each of the four
characteristics, and taking the average of these four ratios.
4
]/) 11
4
1−−
=
−
=∑ jtjtijtj
it
cc[(cnessinnovativeoductPr
We also constructed an alternative measure by comparing year t values with the first robot
introduced in the industry, and, in another unreported regression, used only the most innovative
products of each year. These alternative measures confirmed the original results (available from
the authors).
Independent Variables
Assembling longitudinal data to measure innovation search is a major challenge. We
chose patents as a data source for several reasons. First, patent data provide an accurate
description of such search (i.e., problem-solving), because each patent is required to describe a
technological problem and a solution to that problem (Walker, 1995). Second, patent data are
one of the few sources that gives us a detailed and consistent chronology of search (Griliches,
Pakes, and Hall, 1987; Almeida et al., 2002; Nerkar, 2003). Citation patterns in patents track the
knowledge used over time, and are due to their legal nature, precise (Walker, 1995). Thus, two of
our key features of search, competitor search and its timing, can be measured accurately. Third,
23
patent measures are particularly appropriate for testing hypotheses that include learning. Since
one of the requirements for patenting is novelty, each time a new patent is created and another
patent is cited as its antecedent, the citing patent is used in a different combination of citations
than before. Thus, each repeated use of a citation serves as a distinct source for learning.
Patents are also a particularly good measure of search in our empirical setting, for several
reasons. First, patents are an important appropriability mechanism in robotics (Marklund, 1986),
as well as in the industrial machinery industry in general (Cockburn and Griliches, 1987;
Arundel and Kabla, 1998). Therefore, patents provide a comprehensive source of search data.
Second, patent documents report functional details about robot design that make them a uniquely
rich and useful source both for competitors and for researchers. In fact, prior art patent searches
of the U.S. Patent and Trademark Office database are a common part of robotics R&D in all
geographical areas we interviewed. Third, patents have long been used to describe technology
developments in robotics (e.g. Brossia, 1983; Grupp et al., 1990), and we continue this tradition.
The patents for our independent variables were assembled following Podolny et al.’s
(1996) procedure for comparing technological knowledge-bases of firms (see also Nelson and
Winter, 1982). We first identified all patents that the focal firm (firm i) had applied for each year
(and subsequently received), and made a list of all prior-art patents cited in these patents. These
data (patents and the citations in them) form each firm’s technological knowledge-base yearly.
We then took all prior art citations for the focal firm each year and placed these citations into the
categories shown in table 2, by comparing the firm’s and its rivals’ current and prior years’
knowledge-bases. Table 2 thus shows how search categories in table 1 are operationalized. To
control for the expanding risk set (Podolny and Stuart, 1995), fractions were used when
constructing the variables, as described in more detail below. We divide the citation counts in
24
each category with the firm’s total number of citations that year, or with the rivals’ citations in
the bottom row where the firm has not cited any of the patents.
Capturing the effects of different types of search requires caution because search
variables are fractions of prior art citations and sum to a whole. Thus, we cannot include all
categories simultaneously in the regression models. In order to estimate the models, we focus on
the eight categories shown in table 2, and omit the remaining four categories that are not pictured
(but are shown in the example in figure 1). The categories that are omitted are: patents that the
focal firm searches at the present time (explores or exploits) but rivals no longer search, and
patents that rivals search at the present time (explore or exploit), but the focal firm no longer
searches. We also ran the models by including these categories and omitting others, with no
change in the main results.
If the firm does not apply for patents, making the denominator in our variables zero
(under 4% of observations), the search variables are set to zero.7 Similar results were obtained
when these observations were dropped. To measure present and past, we use this year’s vs. past
five years’ citations. A five-year window is used since organizational memory in high-
technology companies is imperfect: Knowledge depreciates sharply, losing significant value
within approximately five years (Argote, 1999). All 123 other firms that participated in the
industry were included as rivals in our analyses. The measures are described in detail below and
a hypothetical example of the various categories is provided in figure 1.
--- Insert Table 2 and Figure 1 about here --- Head-start variables. We measured Firm’s exclusive exploration (firm uses for the first
time, rivals have never used) as the proportion of those prior art patent citations in the focal
firm’s current year patents that are neither in its own or its rivals’ past five years’ knowledge
7 We appreciate the advice of our anonymous reviewer to include this clarification.

25
bases nor in its rivals’ knowledge bases this year. The denominator in this fraction is thus the
total number of prior art patents that the focal firm is citing in the current year. For example, if
the focal firm cites 10 different prior art patents this year, is using two of them for the first time,
and competitors have never used these two either, firm’s exclusive exploration takes a value of
0.2. [Firm’s exclusive exploration = Citations exclusively explored by the focal firm / Total citations by the focal
firm]
We measured Firm’s exclusive exploitation as the proportion of those prior art patent
citations in the focal firm’s current year patents that are not in its rivals’ but are in its own past
five years’ knowledge bases. [Firm’s exclusive exploitation = Citations exclusively exploited by the focal firm
/ Total citations by the focal firm]
We measured Rivals’ late exploration as the proportion of those prior art patent citations
in the focal firm’s current year patents that are not in its rivals’ but are in the firm’s own past five
years’ knowledge base, and are used this year by both. [Rivals’ late exploration = Late citations by rival
/ Total citations by the focal firm]
Catch-up variables. We measured Rivals’ exclusive exploration (rivals use for the first
time, focal firm has never used) as the proportion of those prior art patent citations in firm’s
rivals’ current year patents that cannot be found in the rivals’ past five years’ technological
knowledge bases nor in the focal firm’s knowledge bases this year or earlier. The denominator in
this fraction is thus the total number of prior art patents that rivals are citing in the current year.
For example, if the rivals cite 100 different prior art patents this year, and are using 50 of them
for the first time and the focal firm has never used these 50, rivals’ exclusive exploration takes a
value of 0.5. [Rivals’ exclusive exploration = Citations exclusively explored by rivals / Total citations by rivals]
We measured Rivals’ exclusive exploitation as the proportion of those prior art patent
citations in the rivals’ current year patents that are in the rivals’ but not in the focal firm’s past
26
five years’ knowledge bases, and are not used by the focal firm this year either. [Rivals’ exclusive
exploitation = Citations exclusively exploited by rivals / Total citations by rivals]
We measured Firm’s late exploration as the proportion of those prior art patent citations
in the focal firm’s current year patents that are in the rivals’ knowledge bases during the past five
years but not in the firm’s knowledge base, and are used this year by both. [Firm’s late exploration =
Late citations by the focal firm / Total citations by the focal firm]
In-sync variables. We measured Synchronous exploration as the proportion of those
prior art patent citations in the focal firm’s current year patents that are not in its own nor in its
rivals’ past five years’ knowledge bases but are used this year by both. [Synchronous exploration =
Citations explored by the focal firm and rivals in sync / Total citations by the focal firm]
We measured Synchronous exploitation as the proportion of those prior art patent
citations in the focal firm’s current year patents that can be found in its own and in its rivals’ past
five years’ knowledge bases, and are used again this year by both. [Synchronous exploitation =
Citations exploited by the focal firm and rivals in sync / Total citations by the focal firm]
All independent variables were lagged so that search was measured before the products
were introduced. As did Beckman and Haunschild (2002), we conducted various analyses with
different lag structures and found approximately the same pattern of results. We report a five-
year lag (moving average of years t-1 through t-5) for the search timing variables. Our interview
data guided this choice because it usually took a few years to introduce a robot after the
knowledge was developed, and the most innovative products had lags up to 4-5 years. Podolny et
al. (1996) used a similar 5-year lag. We also constructed alternative measures by excluding the
focal firm’s self-citations (i.e., citations to one’s own patents) from the variables, thus
eliminating the potential advantages that the firms that have created the patents themselves might
have in searching them. These results exhibited the same pattern as the original results.
27
Control Variables
Prior studies suggest several control variables that are important for our analyses. First,
we controlled for the firm’s search intensity (i.e., search effort) because the amount of search
performed is likely to influence frequency of innovation (e.g., Cyert and March, 1963; Greve,
2003). Consistent with prior work, we measured each firm’s search intensity annually by the
number of patents it applies for (Griliches, 1990; Deng et al., 1999).
We also controlled for the technical similarity of this effort relative to firm’s previous
searches (search distance) because prior work suggests that if the firm searches technological
areas that are new to it, it will be more innovative (e.g., Rosenkopf and Nerkar, 2001). We
measured search distance by the proportion of those technological sub-classes to which the
firm’s current-year patents have been assigned but none of its patents during the past five years
has. We used sub-classes as a measure because they characterize the technological areas where
the firm is searching; similar measures have been corroborated in prior work (e.g., Jaffe, 1989;
Patel and Pavitt, 1997). This measure was constructed annually for each firm in the sample.
We also controlled for firm size and used a commonly accepted measure: number of
corporate employees (in thousands). Same results were obtained with firm size either as a linear
term or in its square root transformation. In addition, given that several innovation scholars
report a relationship between R&D expenditures and innovation, although often in opposite
directions (Mansfield, 1964; Henderson, 1993), we controlled for it. We measured firm R&D for
each firm annually by dividing corporate R&D expenditure by corporate sales. In an unreported
regression we also controlled for firm profitability (ROA) but did not find a significant effect, or
any changes in our main results. The coefficient was negative in equations that predict
28
innovativeness, however, as suggested by Greve (2003). The data for these variables were annual
and obtained from Compustat, Worldscope and DIR Analyst’s Guide.
Because firm diversification can influence innovation in a number of ways, we controlled
for it. Diversified firms may have more opportunities to use their existing technologies and so
economies of scope effects can increase frequency of innovation (Kamien and Schwartz, 1982).
At the same time, top executives in diversified firms may be more detached from R&D activities
and therefore be less committed to pursuing innovative technologies (Hoskisson and Hitt, 1988).
We measured firm diversification by a time-variant variable entropy; i.e., jjj
pp log∑ where pj is
the fraction of the firm’s sales in the jth 4-digit SIC code (Jacquemin and Berry, 1979). We
collected yearly 4-digit SIC sales data for each company from annual reports, company
databases, and directories such as Worldscope and Japan Company Handbook.
Since the sample firms were from different geographical areas, we included a variable to
control for geography. Culture and technological infrastructure can cause geographical
differences in innovation (e.g., Shane, 1992). For example, Mansfield (1989) found that Japanese
robotics companies emphasized product improvements, whereas U.S. companies were more
skilled at developing entirely new products. We used region dummies which were set to one if
the firm originated in a particular area (European, U.S. firm) and zero otherwise. Japanese firms
were the omitted category.
We also controlled for temporal effects because technological factors and the availability
of skills to innovate may vary over time. For instance, the firms may become better at
introducing innovative products over the observation window, and this temporal pattern would
be captured by the outcome variables in the absence of temporal effects. Temporal effects were
incorporated using dummy variables for the calendar years 1984-1996 (1997 is the omitted year).
29
We also ran models in which we substituted the year dummies with cumulative new product
introductions by all firms in the industry annually (as a measure of the skill base; Haleblian, Kim
and Rajagopalan, 2006), with no change in the results.
Statistical Method
The data consist of a panel of observations on firm-years. The first set of data includes
1,304 firm-years and is used to test models with product frequency as the dependent variable.
Since this dependent variable consists of counts of new products and has many zero values, we
use a negative binomial regression. To control for repeated observations for the same firm, we
employ the Generalized Estimating Equations (GEE) regression method. This method accounts
for autocorrelation that may arise because each firm is measured repeatedly across multiple years
(Liang and Zeger, 1986; Haveman and Nonnemaker, 2000). The standard errors that we report
are derived from the Huber/White robust estimator of variance that is insensitive to the choice of
the correlation structure in GEE. To further ensure that unobserved heterogeneity did not affect
the results, we included earlier values of the dependent variable in unreported regressions, i.e.,
presample and lagged dependent variables (Heckman and Borjas, 1980; Blundell et al., 1995).
Our results held independently of the model (results available from authors).
The second set of data includes 285 firm-years and is used to test models with product
innovativeness as the dependent variable. We employed a random-effects GLS regression
because there were multiple observations for each firm.8 This dataset is a subset of the first
because 1,019 of our original observations occurred in firm-years in which the firms did not
introduce any products and the product innovativeness variable could therefore not be calculated.
8 Random-effects is a more appropriate method than fixed-effects because there are many firms in the sample but each has only relatively few observations, potentially causing inconsistent fixed-effects estimates. The fixed-effects model also excludes variables such as geography that do not vary over time within each firm panel (Greene, 2000). Despite the limitations, the fixed-effects estimator confirmed the original results. We also ran a tobit model with similar results. Both results are available from the authors.
30
To be sure that excluding these observations did not bias our results, we ran the analyses using
the Heckman (1979) selection model to estimate the likelihood of product introductions in the
initial sample (124 firms). We then used the parameter estimates (the inverse Mills ratio scores)
from that model in a second stage model to predict the effects of search on innovativeness for
those firms that had at least one product introduction during a year (71 firms). The hazard rate
from the selection model is labeled selection and effectively controls for the likelihood that an
observation is included in the subsample. In unreported regressions, we conducted an alternative
test where we only included those firm-years in which the firm introduced better-performing
robots (relative to its prior introductions).9 The intuition was that once a firm introduces a robot
with certain performance characteristics, it has the ability to innovate at that level. In order to
avoid penalizing firms that chose to introduce a robot with inferior characteristics in some future
years, we dropped these ‘inferior’ firm-years from the analysis. Again, our original findings were
strongly supported (results available from the authors). To facilitate causal inference, the
independent and control variables were lagged, search timing variables by a five-year moving
average as described above and controls by one year. The last dependent variable year was 1998.
RESULTS
Main analyses. Descriptive statistics and correlations for all the key variables are
reported in table 3 for product frequency and in table 5 for innovativeness samples. Overall, the
independent and control variables show considerable variance and most correlations among the
variables range from small to moderate. There are two exceptions in table 3: the correlation
between rivals’ exclusive exploration and rivals’ exclusive exploitation (r=-0.98), and the
correlation between firm’s exclusive exploration and firm’s late exploration (r=-0.73).
Consequently, these variables are entered in the models both separately and simultaneously. In 9 We appreciate the advice of our anonymous reviewer regarding this point.
31
the first case the results are unaffected, but differ in the second (as will be discussed below).
Overall, since potential collinearity between variables may inflate the standard errors, but does
not invalidate the significant parameter estimates that are found (Darlington, 1990),
multicollinearity does not pose a threat to the results that we report.
--- Insert Tables 3 and 5 about here --- Table 4 provides the results of a negative binomial regression with frequency of product
introductions as the dependent variable and table 6 the results of a random-effects GLS
regression with innovativeness of new products as the dependent variable. In both tables, head-
start, catch-up, and in-sync search variables are predictors, and control variables in each model
include search intensity, search distance, and operational controls. Chi-squares and log
likelihoods for each model are reported at the bottom of the table, indicating how each model
improves upon the base model.
--- Insert Tables 4 and 6 about here --- Model 1 in table 4 (frequency) and in table 6 (innovativeness) includes only the control
variables. Year dummies were also included in this and the other models but are not reported to
save space (results available from the authors). As expected, diversified (firm diversification),
Japanese (Japanese firm), search-intensive (search intensity) firms introduce new products more
frequently (table 4). Also as expected, searching technologically further away from prior
searches (search distance) results in more innovative products (table 6) but does not make
product introductions any more frequent (table 4). Further, although the effects of dummies for
European firm and U.S. firm fall short of statistical significance in table 6, the coefficients are in
the direction suggesting that European and U.S. firms introduce more innovative products than
Japanese firms.
32
Model 2 in both tables focuses on head-start search. We argued that searching without
competitors results in fewer but more innovative products (H1). We also proposed that once
competitors enter, the focal firm will introduce more new products but fewer innovative ones
(H2). To avoid risks of multicollinearity, firm’s exclusive exploration variable was added to the
full model separately from firm’s late exploration (models 5 and 6). We interpret the results in
both tables using the full model (model 6, except for H1 that is interpreted using model 5).
To test hypothesis 1a on product frequency, we examined the coefficients for firm’s
exclusive exploration and firm’s exclusive exploitation in table 4. Both coefficients are negative,
and the first is significant (p<0.01) and the second moderately significant (p<0.1) in the full
model (model 5). The results thus confirm that exclusive search makes product introductions less
frequent.10
To test hypothesis 1b on innovativeness, we examined the coefficients for firm’s
exclusive exploration and firm’s exclusive exploitation in table 6. The coefficient for exploration
is non-significant in the full model (model 5), but the coefficient for exploitation is positive and
significant (p<0.001). These results show that firms indeed introduce innovative products when
they are able to search knowledge exclusively and keep the competitors out. Exploration of new
knowledge does not make the firm innovative immediately, but the benefits are realized over
time through repeated search. Thus, we find partial support for hypothesis 1b as well as support
for the idea that the positive effects of firm’s exclusive exploitation are stronger than those of
exclusive exploration. Intriguingly, these findings are consistent with those of Taylor and Greve
10 As expected, we also find that the negative effect attenuates rather than intensifies as the focal firm returns to exploit the same knowledge element. A one standard deviation increase in exploration decreased the rate of product frequency by 33% whereas a standard deviation increase in exploitation decreased frequency only by 21%. Because the negative binomial model is log-linear, we exponentiated coefficients to get these estimated multiplier effects.
33
(2006) and Csikszentmihalyi (1996) who emphasized that inventors’ deep rather than shallow
expertise leads to fundamentally new discoveries. We return to these results in the discussion.
To test hypothesis 2a on frequency we examined the coefficient for rivals’ late
exploration in table 4. The positive and significant (p<0.05) coefficient in the full model (model
6) confirms hypothesis 2a, indicating that firms can indeed learn indirectly from their rivals’
choices. Searching with a head start that used to hurt product frequency turns into a positive
effect as rivals join the search. In separate (unreported) regressions, we also assessed how the
firm’s prior exclusive experience (using a continuous variable of cumulative citations) affected
this relationship by interacting it with rivals’ late exploration. The purpose of this interaction is
to test how much ‘head-start’ the focal firm has relative to rivals.11 The coefficient for this
interaction was positive but it did not reach significance at the p<0.1 level.
Consistent with hypothesis 2b on innovativeness, the coefficient for rivals’ late
exploration variable has a negative sign (albeit not significant) in model 6 in table 6. Thus, there
is some indication that if rivals catch up with firm’s exclusive search, the firm becomes less
innovative.
Model 3 in both tables focuses on catch-up search. We argued that rivals’ exclusive
search leads the focal firm to introduce more new products but makes them less innovative (H3).
We also predicted that when the firm joins the search, it will similarly introduce a larger number
but less innovative products (H4).
To test hypothesis 3a on frequency, we examined coefficients for rivals’ exclusive
exploration and exploitation in table 4. Both coefficients are positive, and exploration is significant
(p<0.05) but exploitation does not reach significance at the p<0.1 level in model 6. These results
11 We appreciate the advice of our anonymous reviewer to include this test.
34
show that rivals’ search makes the focal firm’s search more productive, in particular if the rivals
are exploring the knowledge for the first time.
To test hypothesis 3b on innovativeness, we examined coefficients for rivals’ exclusive
exploration and exploitation in table 6. The coefficients are negative and positive, respectively,
in the full model (model 6) but non-significant. Thus, there is no significant support for either
hypothesis, although the signs on rivals’ exclusive exploration are consistently negative,
suggesting that the influence on innovativeness is negative rather than positive, as we expected.
To test hypothesis 4a on frequency, we examined the firm’s late exploration coefficient in
table 4. The positive and significant (p<0.001) coefficient in model 6 supports hypothesis 4a. In
separate (unreported) regressions, we also assessed how rivals’ prior exclusive experience (using
a continuous variable of cumulative citations) affected this relationship by interacting it with
firm’s late exploration. It leveraged the original positive effect, further supporting H4a.
To test hypothesis 4b on innovativeness, we assessed the coefficient on firm’s late
exploration in table 6. We expected a negative effect on innovativeness, but this prediction was
not borne out as the coefficient is non-significant.
Model 4 focuses on in-sync search. To test hypotheses 5a and 5b, we examined
coefficients for synchronous exploration and synchronous exploitation in tables 4 and 6. The
coefficients have mostly negative (but non-significant) signs in both tables. Although only
synchronous exploration significantly hurts product frequency (model 6, table 4), the overall
conclusion is that successful innovators do not search simultaneously with their rivals, as
expected.
Additional analyses. We conducted several additional tests to corroborate the results.
The first such test explored the boundary conditions for search. Since the firm’s late exploration
35
variable had such a strong positive effect on product frequency (table 4) but the measure was
dichotomous, we measured whether it mattered if the knowledge was used by a niche population
of rivals or by the majority, before the focal firm joined the search. We found that the positive
effect was stronger the fewer rivals had searched the knowledge (i.e., the interaction between
firm’s late exploration and the proportion of rivals who had used the knowledge in the past was
negative and significant at the p<0.01 level). A possible explanation is that it is easier to learn
from a few firms that use the knowledge repeatedly than it is from several isolated uses by a
large number of firms. Note that this result is opposite to what firms tend to do: Organizations
often imitate larger (rather than small) numbers of other organizations (Haunschild and Miner,
1997). Our results thus show that when the goal is to innovate, it is better to build on knowledge
that is known to few rather than to many firms.
We also explored combinations of the different search approaches. In the hypotheses,
search approaches were treated as separate and distinct sources of new products. In additional
tests, in order to explore possible recombinatory effects across the search approaches, we created
interaction terms by pairing each of the broad categories of search (head-start, in-sync and catch-
up) with one another.12 We summarize the findings here, and provide methods details and results
in the appendix. Following March’s (1991) idea that the strongest effects on performance are
borne by balancing opposite extremes of the search spectrum, we expected that head-start and
catch-up search would leverage each other so that bringing these two distinct but beneficial
search paths together would lead to both more products and more innovative products. We also
expected that the interactions of in-sync with either head-start or catch-up search would have a
negative effect. The results (reported in appendix) broadly confirm these expectations. In the
equations predicting product frequency, participating in the two out-of-sync races simultaneously 12 We appreciate the advice of our anonymous reviewer to address this issue.
36
(head-start and catch-up) boosts frequency of product innovation while the interactions with in-
sync searches are not significant. Similarly, in the equations predicting product innovativeness,
the coefficients for the interactions have the expected signs but fail to reach significance. In
additional (unreported) tests, we interacted the original variables instead of the broad categories.
These results confirmed the results that we report above, and also provided support for our
expectation that certain types of out-of-sync approaches (such as firm’s exclusive exploitation
and rivals’ exclusive exploration) reinforce each other to create more innovative new products.
Taken together, these results suggest several reinforcing effects across out-of-sync approaches
(c.f., March, 1991), and provide interesting avenues for future work.
Third, a sensitivity test was conducted to understand the scope of search. Instead of using
all corporate patents to measure search, we included only each sample firm’s patents in robotics
(separated using a comprehensive approach that included both word and technology class
searches; see also Grupp et al., 1990). Using all corporate patents assumes that the searches in
other divisions may be valuable (Henderson and Cockburn, 1996), whereas restricting search to
robotics patents means that knowledge is “sticky” and transfers relatively poorly across divisions
(Szulanski, 1996). The latter approach also assumes that it is possible to accurately isolate the
search efforts that contribute to new robotics products. In any case, the robotics patent results
(available from the authors) exhibit the same pattern as the original results, and thus show that
the results are robust regarding the scope of search.
DISCUSSION
In this paper we extended the traditional firm-centric search theory to incorporate an
overlooked but critical dimension, competition. In particular, we examined how the firm’s search
is influenced by that of its competitors. An analysis of 124 global robotics organizations supports
37
our theoretical predictions. Firms do not search in isolation; instead, they are strongly influenced
by competitors. Searching behind competitors helps firms introduce a larger number of new
products whereas staying one step ahead helps firms introduce more innovative new products.
Most frequent innovators participate in these two out-of-sync searches, but avoid searching in
sync. Our results have interesting implications for theories of search, competition, and
innovation.
Innovation Search
We started this paper by proposing that the next step for search research is to incorporate
competition. In particular, we identified the focal firm’s search timing relative to that of
competitors as a significant open issue. Juxtaposing the firm’s own search with its rivals’ search
over time, we then operationalized and tested the relationship between innovation and search
timing relative to competitors.
Several key findings support the theoretical predictions. The first set of findings is
consistent with the theoretical arguments that competition stimulates learning by the focal firm.
Indeed, firms that delay search can be frequent innovators: By observing competitors, firms learn
what not to do and where future opportunities might be, and can thus introduce new products
more frequently.
The second set of findings highlights the tension that is caused by the competitors’
learning from the focal firm and therefore supports the theoretical predictions that searching
ahead of competitors avoids the negative effects on innovativeness. Firms are particularly likely
to introduce innovative products when they search early, without their competitors, and
especially when their competitors are then slow to catch up.
38
The third set of findings shows that the best innovators combine the two out-of-sync
approaches. They search simultaneously with head-start and catch-up logics. By participating in
both contests simultaneously, the same firm can introduce both a larger number and more
innovative products. Firms that search in-sync with competitors attain neither. These results also
make an interesting connection to evolutionary theory: In competitive interactions it is not
necessarily most advantageous to perform as well as possible in absolute terms; rather it pays to
differentiate from the opponent.
Overall, the findings extend the innovation search theory to include competition. They
suggest that it matters not only whether firms are searching locally or distally with respect to
their own past, but also whether and when they are searching with respect to their rivals. We thus
add to previous empirical search studies that have started to incorporate external elements, and in
particular to that of Greve and Taylor (2000), who found that changes in competitors’ markets
triggered changes in the focal firm. However, these authors used successful search outcomes
such as market entry to approximate search, and suggested that further work was needed to
identify the actual search processes and resource allocations. We addressed this issue, and also
extended the theory to different types of search timing and their effects on search performance
that have not been studied. The results thus provide empirical evidence that understanding search
requires understanding the dynamics of competition. It matters not only where you search, but
with whom.
While many of our hypotheses are supported, a few results are surprising and offer
unexpected insights. Creativity research argues that deep expertise is a source of truly novel
innovations (Csikszentmihalyi, 1996; Taylor and Greve, 2006). However, this observation has
not been easy to reconcile with the exploration/exploitation perspective that connects old and
39
familiar knowledge with lack of innovation. This paper brings together these two observations in
a unique way: We show that searchers with deep expertise (firm’s exclusive exploitation) rather
than those exploring entirely new knowledge (firms’ exclusive exploration) introduce the most
innovative products. Further, innovation is a race: the firm is innovative as long as it has
exclusive access to the knowledge, but loses its edge once rivals move in (rivals’ late
exploration). These results thus prompt us to reconsider some of our traditional assumptions
about exploration and exploitation. While exploration is traditionally believed to lead to
innovation, our results show that such novelty may be overrated. Exploration does not lead to
innovative products immediately; the benefits are realized over time through repeated,
competitor-free exploitation. Examining this phenomenon in detail is an intriguing avenue for
future work.
Beyond Search
Evidence of how competitor searches influence the focal firm’s search will also provide
one answer to the enduring question in organizational economics; whether competition spurs or
stifles innovation. Prior work in economics suggests that there is a tension, some arguing for
positive effects (Porter, 1990) and others suggesting negative ones (Blundell et al., 1999). While
economics studies often use broad time-independent measures of competition, this paper
demonstrates that it is important to go beyond proxy measures of monopolists or industry
concentration to examine how competition evolves over time and to pinpoint the specific search
approaches that firms use. With such a dynamic search perspective, the results show that it is not
competition per se, but timing of the search relative to competitors, that gives rise to differences
in innovation.
40
Our findings also contribute to research on innovation more generally. First, as Drazin
and Schoonhoven (1996: 1067) note, “researchers have usually portrayed innovation as a
universally useful and productive end in and of itself; they have typically not distinguished
between types of innovations”. In contrast, we examine both frequency and innovativeness of
new products and thus expand to examine more diverse types of innovation. Second, by
incorporating competition, this research also contributes to understanding the external factors
that influence innovation. Drazin and Schoonhoven further note, “certain to influence a given
organization in its decision to innovate or not would be actions taken by its competitors” (1996:
1077), yet according to these authors such external factors have received less attention than the
internal ones and should be brought back to the center stage. Our approach also responds to calls
for more “integrated, multilevel models of innovation” (Brown and Eisenhardt, 1995; Drazin and
Schoonhoven, 1996; Lepak, Smith and Taylor, 2007) that integrate innovation activities at the
organizational level with macro processes that operate at the environmental level (i.e.,
competitor searches). Third, we also contribute to innovation research by examining spillovers
(a.k.a. passive search). As did Jaffe (1989), we find that when competitors are active innovators,
the firm is also more likely to innovate. Extending these prior results, we show specifically when
spillovers are useful, i.e., that they need to be captured fast before they depreciate. Because our
study focuses on the effects of spillovers on new products rather than inventions, it also provides
more direct evidence of the commercial benefits of spillovers than prior studies. These benefits
of spillovers naturally raise the question of why firms would invest in costly search when they
could borrow from their competitors, that is, “exploit the successful exploration of others”
(Levinthal and March, 1993). Our results show that focal firm’s own exclusive search is the only
way to create innovative products, and that such search is protected from imitators who cannot
41
create them from spillovers. Combined, these three contributions lead to a more integrated and
complete view of factors leading to innovation.
There are also several methodological contributions. First, our analysis is based on a
unique dataset that tracks product development and product introduction behaviors of robotics
companies over time and across three continents. This dataset combines numerous hardcopy and
electronic sources as well as several informative interviews with industry participants to provide
a comprehensive history of the robotics firms’ search efforts. Consequently, it provides a rare
opportunity to test hypotheses about search timing. We hope that this study will encourage
further research on compiling such longitudinal data on other industries.
Second, our method was novel and extensive: Measures of technological knowledge
(patents) were combined with measures of commercialization (products), thus uniquely tracking
the innovation process from invention to its commercial introduction. Usually longitudinal
studies focus on one end or the other, but do not link the two. We were also able to develop more
comprehensive and detailed measures of search than prior studies, instead of deciphering the
process from its outcomes. In particular, patent measures made it possible to accurately express
central features of search vis-à-vis competitors.
Third, we set necessary boundary conditions for the methodology and for the paper that
suggest avenues for future work. The periods of discontinuous change as defined for example by
Anderson and Tushman (1990)—that potentially introduce a whole new set of product attributes
and have been relatively well-studied in organizational literature—are beyond the scope of this
study. While such discontinuities are intriguing, most innovation activities in organizations take
place in-between discontinuities. Improvements along the existing product attributes (such as
those studied in this paper) often play an equally important role in technical advance.
42
CONCLUSION
To understand how competitors influence innovation search, we theorized about and
modeled product innovation as a combination of opportunities and constraints created by
competitors. A longitudinal study on the worldwide robotics industry provided intriguing results.
We found that searching later than competitors boosts product frequency whereas searching
ahead of them helps the firm introduce innovative products. Overall, the findings show how an
approach that incorporates both organizational and inter-organizational factors, not as contrasting
but as complementary explanations, can provide a richer understanding of search and innovation.
43
REFERENCES
Ahuja, G., and R. Katila 2004. “Where do resources come from? The role of idiosyncratic
situations.” Strategic Management Journal, 25(8-9): 887-907.
Alexander, A., and B. Mitchell 1985 “Measuring technological change of heterogeneous
products.” Technological forecasting and social change, 27: 161-195.
Almeida, P., G. Dokko, and L. Rosenkopf 2003 “Start-up size and the mechanisms of external
learning: Increasing opportunity and decreasing ability?” Research Policy, 32: 301–315.
Almeida P., J. Song, and R. Grant 2002 “Are firms superior to alliances and markets? An
empirical test of crossborder knowledge building.” Organization Science, 13: 147–161.
Amburgey, T., T. Dacin, and J. Singh 2000 “Learning races and dynamic capabilities” Working
paper. University of Toronto.
Anderson, P., and M. L. Tushman 1990 “Technological discontinuities and dominant designs: A
cyclical model of technological change.” Administrative Science Quarterly, 35(4): 604-633.
Argote, L. 1999 Organizational Learning: Creating, Retaining and Transferring Knowledge.
Boston: Kluwer Academic Publishers.
Arundel, A., and I. Kabla 1998 “What percentage of innovations are patented? Empirical
estimates for European firms.” Research Policy, 27: 127-141.
Baldwin. W., and G. Childs 1969 “The fast second and rivalry in research and development.”
Southern Economic Journal, 36: 18-24.
Barnett, W. P. 1997 "The dynamics of competitive intensity." Administrative Science Quarterly,
42: 128-160.
Baum, J., S. Li, and J. Usher 2000 “Making the next move: How experiential and vicarious learning
shape the locations of chains' acquisition.” Administrative Science Quarterly, 45: 766-801.
Bayus, B., and R. Agarwal 2007 “The role of pre-entry experience, entry timing and product
technology strategies in explaining firm survival.” Management Science, 53: 1887-1902.
Beckman, C., and P. Haunschild 2002 “Network learning: The effects of partners' heterogeneity
of experience on corporate acquisitions.” Administrative Science Quarterly, 47: 92-124.
44
Benner, M. and M. Tushman 2002 "Process management and technological innovation: A
longitudinal study of the photography and paint industries," Administrative Science Quarterly,
47: 676-706.
Blundell, R., R. Griffith and J. Van Reenen 1995 “Dynamic count data models of technological
innovation.” Economic Journal, 105: 333-344.
Blundell, R., R. Griffith, and J. Van Reenen 1999 “Market share, market value and innovation in
a panel of British manufacturing firms.” Review of Economic Studies, 66: 529-554.
Booth, D., M. Khouja, and M. Hu 1992 ”A robust multivariate statistical procedure for
evaluation and selection of industrial robots.” International Journal of Operations & Production
Management, 12(2): 15-24.
Brossia, C. 1983 Technology Forecasting based on Patent Trend Analysis using Robotics
Technology as a Case Study. Unpublished M. Sc. Thesis, Colorado School of Mines.
Brown, S., and K. Eisenhardt 1995 "Product development: Past research, present findings, and
future directions." Academy of Management Review, 20: 343-378.
Brown, S., and K. Eisenhardt 1998 Competing on the Edge: Strategy as Structured Chaos.
Boston, MA: Harvard Business School Press.
Campbell, D. T. 1977 Comment on "The natural selection model of conceptual evolution."
Philosophy of Science, 44:502-507.
Clark, K., B. Chew, and T. Fujimoto 1987 “Product development in the world auto industry.”
Brookings Papers on Economic Activity, (3): 729-781.
Cockburn, I., and Z. Griliches 1987 “Industry effects and appropriability measures in the stock
market’s valuation of R&D and patents.” NBER working paper no 2465.
Coombs, R., P. Narandren, and A. Richards 1996 “A literature-based innovation output
indicator.” Research Policy, 25: 403-413.
Cronbach, L. 1987 “Statistical tests for moderator variables.” Psychological Bulletin, 102: 414-17.
Csikszentmihalyi, M. 1996 Creativity. New York: HarperCollins.
Cyert, R., and J. March 1963 A Behavioral Theory of the Firm. Englewood Cliffs, NJ: Prentice-
Hall.
45
Dagalakis, N. 1998 “Industrial robotics standards.” In Nof, S. (ed.), Handbook of Industrial
Robotics: Chapter 27. New York: Wiley.
Darlington, R. 1990 Regression and Linear Models. New York: McGraw-Hill.
Deng, A, B. Lev, and F. Narin 1999 “Science and technology as predictors of stock
performance.” Financial Analysts Journal, May/June: 20-32.
Dodson, E. 1985 “Measurement of state of the art and technological advance.” Technological
Forecasting and Social Change, 27: 129-146.
Dougherty, D., and C. Hardy 1996 “Sustained product innovation in large, mature organizations:
Overcoming innovation-to-organization problems.” Academy of Management Journal, 39: 1120-53.
Drazin, R. and C. Schoonhoven 1996 "Community, population, and organization effects on
innovation: A multi-level perspective." Academy of Management Journal, 39: 1065-1083.
Eisenhardt, K., and C. B. Schoonhoven 1990 "Organizational growth: Linking founding team,
strategy, environment, and growth among U.S. semiconductor ventures, 1978-1988."
Administrative Science Quarterly, 35: 504-529.
Fleming, L. 2001 "Recombinant uncertainty in technological search." Management Science, 47: 117-132.
Fleming L., and O. Sorenson 2004 “Science as a map in technological search.” Strategic
Management Journal, Special Issue 25(8-9): 909-928.
Galunic, C., and S. Rodan 1998 “Resource recombinations in the firm: knowledge structures and
the potential for Schumpeterian innovation.” Strategic Management Journal, 19: 1193-1201.
Greene, W. 2000 Econometric Analysis. Upper Saddle River, NJ: Prentice Hall.
Greve, H. 2003 “A behavioral theory of R&D expenditures and innovations: evidence from
shipbuilding.” Academy of Management Journal, 46: 685–702.
Greve, H., and A. Taylor 2000 “Innovations as catalysts for organizational change: Shifts in
organizational cognition and search.” Administrative Science Quarterly, 45: 54-80.
Griliches, Z. 1990 “Patent statistics as economic indicators: A survey.” Journal of Economic
Literature, 28: 1661-1707.
Griliches, Z., A. Pakes, and B. Hall 1987 “The value of patents as indicators of inventive
activity.” in Dasgupta and Stoneman (eds.) Economic Policy and Technological
46
Performance. Cambridge: Cambridge University Press.
Grupp, H., B. Schwitalla, U. Schmoch, and A. Granberg 1990 “Developing industrial robot
technology in Sweden, West Germany, Japan, and the USA.” In J. Sigurdson (ed.), Measuring
the Dynamics of Technological Change: 106-129. London: Pinter Publishers.
Gulati, R., and M. Gargiulo 1999 "Where do interorganizational networks come from?"
American Journal of Sociology, 104: 1439-1493.
Haleblian, J., J. Kim and N. Rajagopalan 2006 “The influence of acquisition experience and
performance on acquisition behavior.” Academy of Management Journal, 49: 357-370.
Haunschild, P. R., and A. S. Miner 1997 "Models of interorganizational imitation: The effects of
outcome salience and uncertainty." Administrative Science Quarterly, 42: 472-500.
Haveman, H. A., and L. Nonnemaker 2000 "Competition in multiple geographic markets: The
impact on growth and market entry." Administrative Science Quarterly, 45: 232-267.
Heckman, J. 1979 “Sample selection bias as a specification error.” Econometrica, 47: 153-161.
Heckman, J. J., and G. J. Borjas 1980 "Does unemployment cause future unemployment:
Definitions, questions, and answers from a continuous time model of heterogeneity and state
dependence." Econometrica, 47: 247-283.
Helfat, C. 1994 “Evolutionary trajectories in petroleum firm R&D.” Management Science, 40: 1720-47.
Henderson, R. 1993 “Underinvestment and incompetence as responses to radical innovation.”
Rand Journal of Economics, 24(2): 248-270.
Henderson, R., and K. B. Clark 1990 “Architectural innovation: The reconfiguration of existing product
technologies and the failure of established firms.” Administrative Science Quarterly, 35: 9-30.
Henderson, R., and I. Cockburn 1996 “Scale, scope, and spillovers: The determinants of research
productivity in drug discovery.” Rand Journal of Economics, 27(1): 32-59.
Hess, E., and R. Kazanjian 2006 The Search for Organic Growth. New York, N.Y.: Cambridge
University Press.
Hoskisson, R., and M. Hitt 1988 “Strategic control systems and relative R&D investment in large
multiproduct firms.” Strategic Management Journal, 9(6): 605-621.
47
Huber, G. 1991. Organizational learning: The contributing processes and a review of the
literatures, Organization Science, 2(1): 8-117.
Hughes, T. 1983 “Reverse salients and critical problems.” In T. Hughes (ed.), Networks of
Power. Baltimore: John Hopkins University Press.
Hunt, D. 1983 Industrial Robotics Handbook. New York, N.Y.: Industrial Press.
Iansiti, M. 1995. “Technology development and integration: An empirical study of the
interaction between applied science and product development.” IEEE Transactions on
Engineering Management, 42: 259-269.
Jaccard, J., R. Turrisi, and C. Wan 1990 Interaction Effects in Multiple Regression. London: Sage.
Jacquemin, A., and C. Berry 1979 “Entropy measure of diversification and corporate growth.”
Journal of Industrial Economics, 27: 359-369.
Jaffe, A. 1989 “Characterizing the “technological position” of firms, with application to
quantifying technological opportunity and research spillovers.” Research Policy, 18: 87-97.
Kamien, M. and N. Schwartz 1982 Market Structure and Innovation. New York: Cambridge.
Katila, R., and G. Ahuja 2002. “Something old, something new: A longitudinal study of search
behavior and new product introductions.” Academy of Management Journal, 45(6): 1183-94.
Keeney, R., and G. Lilien 1987 “New industrial product design and evaluation using
multiattribute value analysis.” Journal of Product Innovation Management, 4: 185-198.
King, A., and C. Tucci 2002 "Incumbent entry into new market niches: The role of experience and
managerial choice in the creation of dynamic capabilities." Management Science, 48: 171-186.
Kirzner, I. M. 1973 Competition and Entrepreneurship. Chicago: University of Chicago Press.
Klepper, S. 1988 “Collaborations in robotics.” In Mowery, D. (Ed.) International Collaborative
Ventures in U.S. Manufacturing: 223-265. Cambridge, MA: Ballinger.
Kogut, B., and U. Zander 1992 "Knowledge of the firm, combinative capabilities, and the
replication of technology." Organization Science, 3: 383-397.
Lant, T., and S. Mezias 1992 “An organizational learning model of convergence and
reorientation.” Organization Science, 3: 47-71.
48
Lavie, D., Lechner, C., and H. Singh 2007 “The performance implications of timing of entry and
involvement in multipartner alliances.” Academy of Management Journal, 50:578-604.
Leonard-Barton, D., K. Bowen, K. Clark, C. Holloway, and S. Wheelwright 1994 “Prototypes:
Tools for learning and integration.” Harvard Business Review, 72: 124-125.
Lepak, D., K. Smith and S. Taylor 2007 “Value creation and value capture: A multilevel
perspective.” Academy of Management Review, 32: 180-194.
Levinthal, D. A., and J. G. March 1981 "A model of adaptive organizational search." Journal of
Economic Behavior and Organization, 2: 307-333.
Levinthal, D. A., and J. G. March 1993 "The myopia of learning." Strategic Management
Journal, 14: 95-112.
Levitt, B., & March, J. 1988. “Organizational learning.” Annual Review of Sociology, 14: 319-340.
Liang, K.-Y., and S.L. Zeger 1986 “Longitudinal data analysis using Generalized Linear
Models.” Biometrika, 73: 13-22.
Lieberman, A., and S. Asaba 2006 “Why do firms imitate each other?” Academy of Management
Review, 31: 366-385.
Madsen, T., E. Mosakowski, and S. Zaheer 1997 “Intrafirm evolutionary processes and
competitive advantage.” A paper presented at the Academy of Management, Boston, MA.
Mansfield, E. 1964 “Industrial research and development expenditures. Determinants, prospects,
and relation of size of firm and inventive output.” Journal of Political Economy, 72(4): 334-37.
Mansfield, E. 1989 “Innovation, R and D, and firm growth in robotics.” In A. Andersson et al.
(eds.), Knowledge and Industrial Organization: 143-155. Berlin: Springer-Verlag.
March, J. 1991 “Exploration and exploitation in organizational learning.” Organization Science, 2: 71-87.
March, J., and H. Simon 1958 Organizations. New York: Wiley.
Markides, C., and P. Geroski 2005 Fast Second: How Smart Companies Bypass Radical
Innovation to Enter and Dominate New Markets. San Francisco, CA: John Wiley & Sons.
Marklund, P-O. 1986 “Patents – a competitive factor.” The Industrial Robot, October: 15-17.
Martin, X., and W. Mitchell 1998 “The influence of local search and performance heuristics on
new design introduction in a new product market.” Research Policy, 26: 753-771.
49
McDermott, K., and M. Alexander 1984 “Industrial robots/Form and function.” Industrial
Engineering Conference Proceedings, Fall: 66-72.
Mezias, S., and M. Glynn 1993 “The three faces of corporate renewal: Institution, revolution,
and evolution.” Strategic Management Journal, 14(2): 77-101.
Miner, A., and S. Mezias 1996 “Ugly duckling no more: Pasts and futures of organizational
learning research.” Organization Science, 7: 88-99.
Mowery, D., J. Oxley, and B. Silverman 1998 “Technological overlap and interfirm cooperation:
implications for the resource-based view of the firm.” Research Policy, 26: 507-523.
Nelson R., and S. Winter 1973 “Toward an evolutionary theory of economic capabilities.”
American Economic Review, 63: 440-449.
Nelson, R., and S. Winter 1982 An Evolutionary Theory of Economic Change. Cambridge, MA:
Harvard University Press.
Nerkar, A. 2003 “Old is gold? The value of temporal exploration in the creation of new
knowledge.” Management Science, 49: 211-229.
Nerkar, A., and S. Paruchuri 2005 “Evolution of R&D capabilities: The role of knowledge
networks within a firm.” Management Science, 49: 211-229.
Paredis, J. 1997 “Coevolving cellular automata: be aware of the red queen” In Baeck, T. (ed.),
Proceedings of ICGA VII: 393–400.
Patel, P., and K. Pavitt 1997 “The technological competencies of the world’s largest firms:
complex and path-dependent, but not much variety”. Research Policy, 26: 141-156.
Podolny, J., and T. Stuart 1995 "A role-based ecology of technological change." American
Journal of Sociology, 5: 1224-1260.
Podolny, J., T. Stuart, and M. Hannan 1996 “Networks, knowledge, and niches: Competition in the
worldwide semiconductor industry, 1984-1991.” American Journal of Sociology, 102: 659-689.
Porter, M.E. 1985 Competitive Advantage. Ch. 5. New York: Free Press.
Porter, M.E. 1990 The Competitive Advantage of Nations. New York: Free Press.
Rao, H., and R. Drazin 2002 “Overcoming resource constraints on product innovation by
recruiting talent from rivals.” Academy of Management Journal, 45:491-507.
50
Romanelli, E. 1985 Performance and Persistence of New Firm Strategies in Organizational
Evolution: The Case of Minicomputers. Unpublished Ph.D. dissertation, Columbia University.
Romanelli E. 1999 “Blind (but not unconditioned) variation. Problems of copying in
sociocultural evolution”. In J. Baum and B. McKelvey (Eds). Variations in Organization
Science. Newbury Park, CA: Sage: 79-91.
Rosenkopf, L., and P. Almeida 2003 "Overcoming local search through alliances and mobility."
Management Science, 49: 751-766.
Rosenkopf, L., and A. Nerkar 2001 "Beyond local search: Boundary-spanning, exploration, and
impact in the optical disc industry." Strategic Management Journal, 22: 287-306.
Rouse, W. 1999 “Connectivity, creativity, and chaos.” Information Knowledge Systems
Management, 1: 117-131.
Sahal, D. 1985 “Technological guideposts and innovation avenues.” Research Policy, 14(2): 61-82.
Scherer, F. M. 1980 Industrial Market Structure and Economic Performance. New York: Houghton-Mifflin.
Schumpeter, J. 1934 Theory of Economic Development. Cambridge, MA: Harvard University Press.
Schumpeter, J. 1942 Capitalism, Socialism, and Democracy. New York: Harper and Row.
Shane, S. 1992 “Why do some societies invent more than others?” Journal of Business
Venturing, 7(1): 29-46.
Siggelkow, N., and J. Rivkin 2005 “Speed and search: Designing organizations for turbulence
and complexity.” Organization Science, 16:101-122.
Simon, H. 1957. Administrative Behavior. A Study of Decision-Making Processes in
Administrative Organization. New York: Macmillan.
Singh, J. 2005 “Collaborative networks as determinants of knowledge diffusion patterns.”
Management Science, 51: 756–770.
Song, J., P. Almeida, and G. Wu 2003 “Learning-by-hiring: When is mobility more likely to
facilitate interfirm knowledge transfer?” Management Science, 49(4): 351-365.
Sull, D. 2001 “From community of innovation to community of inertia: The rise and fall of the
U.S. tire industry.” Academy of Management Proceedings: L1-6.
51
Swaminathan, A. 1996 "Environmental conditions at founding and organizational mortality: A
trial-by-fire model." Academy of Management Journal, 39: 1350-1377.
Szulanski, G. 1996 "Exploring internal stickiness: Impediments to the transfer of best practice
within the firm." Strategic Management Journal, 17: 27-43.
Taylor, A., and H. Greve 2006 “Superman or The Fantastic Four? Knowledge combination and
experience in innovative teams” Academy of Management Journal, 49(4): 723-740.
Trajtenberg, M. 1989 “The welfare analysis of product innovations, with an application to
computed tomography scanners.” Journal of Political Economy, 97(2): 444-479.
Tushman, M., and O’Reilly, C. 1996 “Ambidextrous organizations: Managing evolutionary and
revolutionary change.” California Management Review, 38(4): 8-30.
Utterback, J. 1994 Mastering the Dynamics of Innovation. Cambridge: Harvard University Press.
Van Valen, L. 1973 "A new evolutionary law." Evolutionary Theory, 1: 1-30.
Walker, R. 1995 Patents as Scientific and Technical Literature. The Scarecrow Press: Metuchen, N.J.
Winter, S. 1984 “Schumpeterian competition in alternative technological regimes.” Journal of
Economic Behavior and Organization, 5: 287-320.
World industrial robots. 1996 U.N. and Intl. Federation of Robotics. Geneva, Switzerland.
Zollo, M., and S. G. Winter 2002 “Deliberate learning and the evolution of dynamic
capabilities.” Organization Science, 13: 339–353.
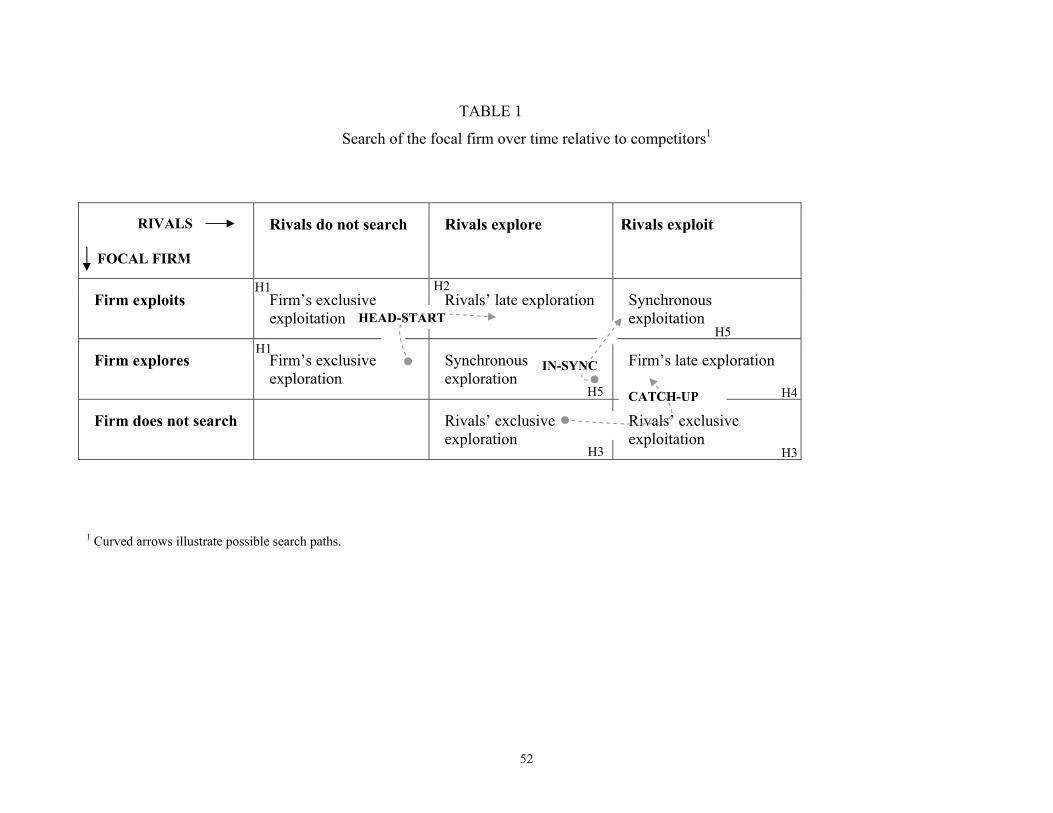
52
TABLE 1
Search of the focal firm over time relative to competitors1
RIVALS FOCAL FIRM
Rivals do not search Rivals explore Rivals exploit
Firm exploits Firm’s exclusive exploitation
Rivals’ late exploration Synchronous exploitation
Firm explores Firm’s exclusive exploration
Synchronous exploration
Firm’s late exploration
Firm does not search Rivals’ exclusive exploration
Rivals’ exclusive exploitation
1 Curved arrows illustrate possible search paths.
CATCH-UP
HEAD-START
IN-SYNC
H3 H3
H4
H1 H2
H5
H5H1
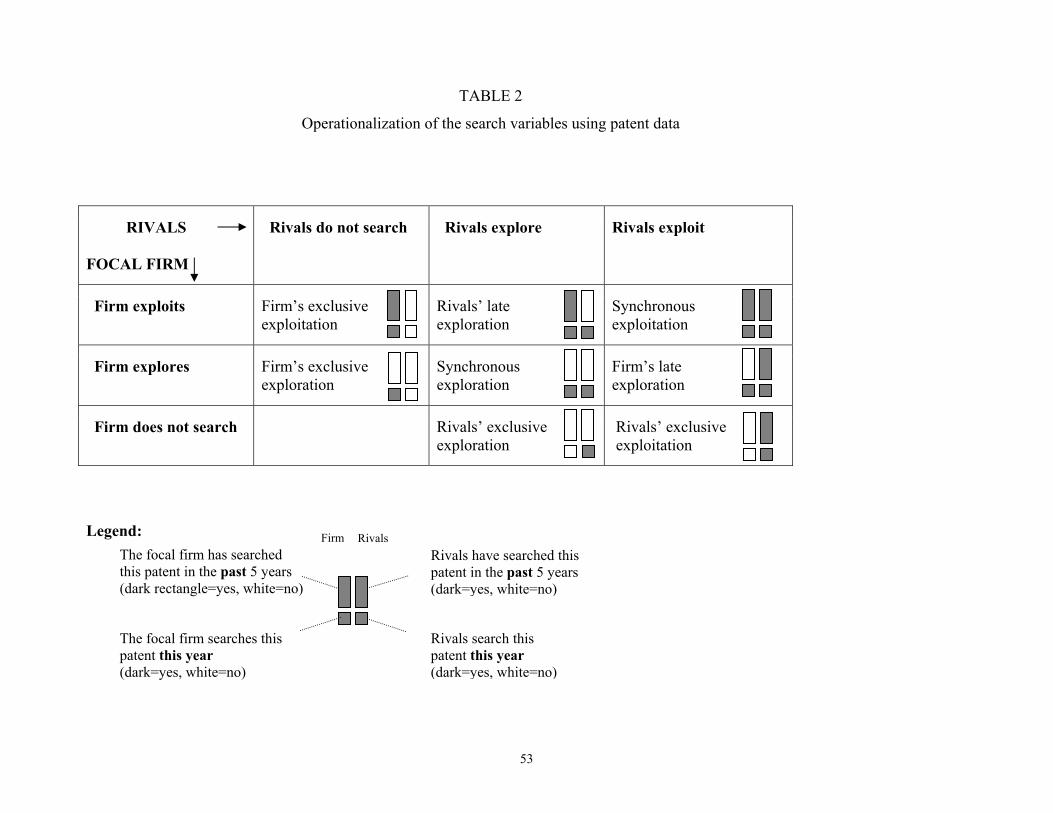
53
TABLE 2
Operationalization of the search variables using patent data
RIVALS FOCAL FIRM
Rivals do not search Rivals explore Rivals exploit
Firm exploits Firm’s exclusive exploitation
Rivals’ late exploration
Synchronous exploitation
Firm explores Firm’s exclusive exploration
Synchronous exploration
Firm’s late exploration
Firm does not search Rivals’ exclusive exploration
Rivals’ exclusive exploitation
Legend:
The focal firm has searched this patent in the past 5 years (dark rectangle=yes, white=no)
Rivals have searched this patent in the past 5 years (dark=yes, white=no)
Rivals search this patent this year (dark=yes, white=no)
The focal firm searches this patent this year (dark=yes, white=no)
Firm Rivals
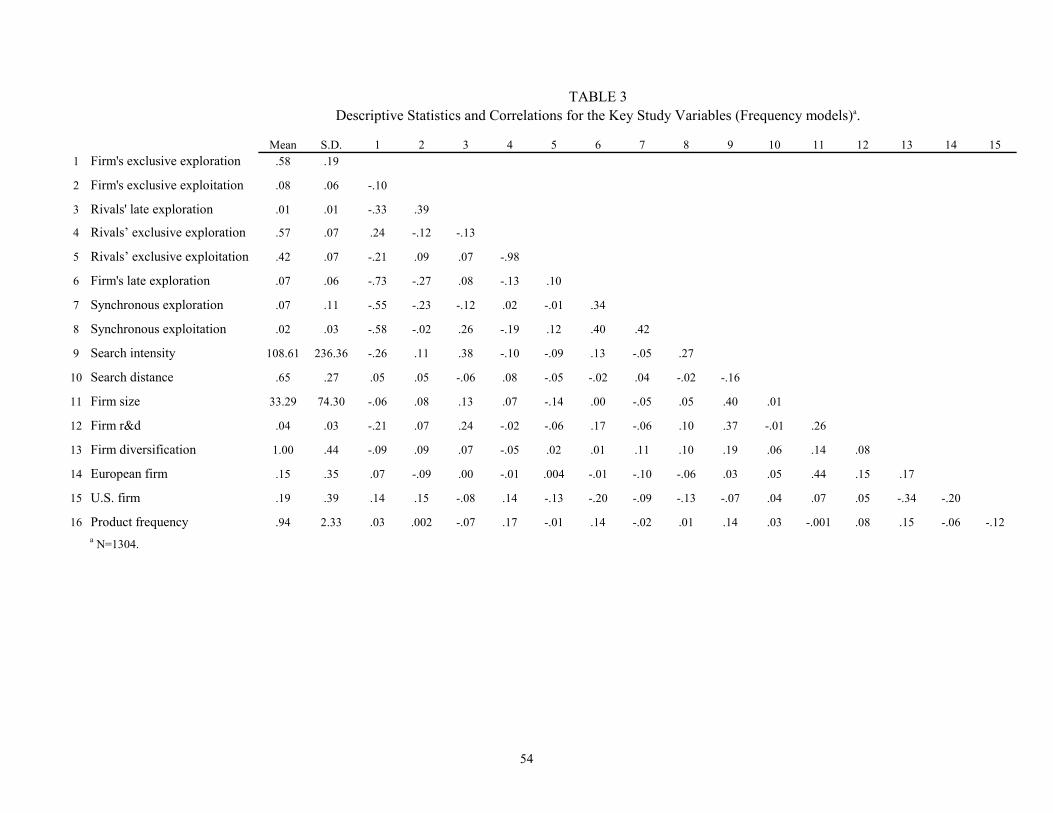
54
TABLE 3Descriptive Statistics and Correlations for the Key Study Variables (Frequency models)a.
Mean S.D. 1 2 3 4 5 6 7 8 9 10 11 12 13 14 151 Firm's exclusive exploration .58 .19
2 Firm's exclusive exploitation .08 .06 -.10
3 Rivals' late exploration .01 .01 -.33 .39
4 Rivals’ exclusive exploration .57 .07 .24 -.12 -.13
5 Rivals’ exclusive exploitation .42 .07 -.21 .09 .07 -.98
6 Firm's late exploration .07 .06 -.73 -.27 .08 -.13 .10
7 Synchronous exploration .07 .11 -.55 -.23 -.12 .02 -.01 .34
8 Synchronous exploitation .02 .03 -.58 -.02 .26 -.19 .12 .40 .42
9 Search intensity 108.61 236.36 -.26 .11 .38 -.10 -.09 .13 -.05 .27
10 Search distance .65 .27 .05 .05 -.06 .08 -.05 -.02 .04 -.02 -.16
11 Firm size 33.29 74.30 -.06 .08 .13 .07 -.14 .00 -.05 .05 .40 .01
12 Firm r&d .04 .03 -.21 .07 .24 -.02 -.06 .17 -.06 .10 .37 -.01 .26
13 Firm diversification 1.00 .44 -.09 .09 .07 -.05 .02 .01 .11 .10 .19 .06 .14 .08
14 European firm .15 .35 .07 -.09 .00 -.01 .004 -.01 -.10 -.06 .03 .05 .44 .15 .17
15 U.S. firm .19 .39 .14 .15 -.08 .14 -.13 -.20 -.09 -.13 -.07 .04 .07 .05 -.34 -.20
16 Product frequency .94 2.33 .03 .002 -.07 .17 -.01 .14 -.02 .01 .14 .03 -.001 .08 .15 -.06 -.12a N=1304.
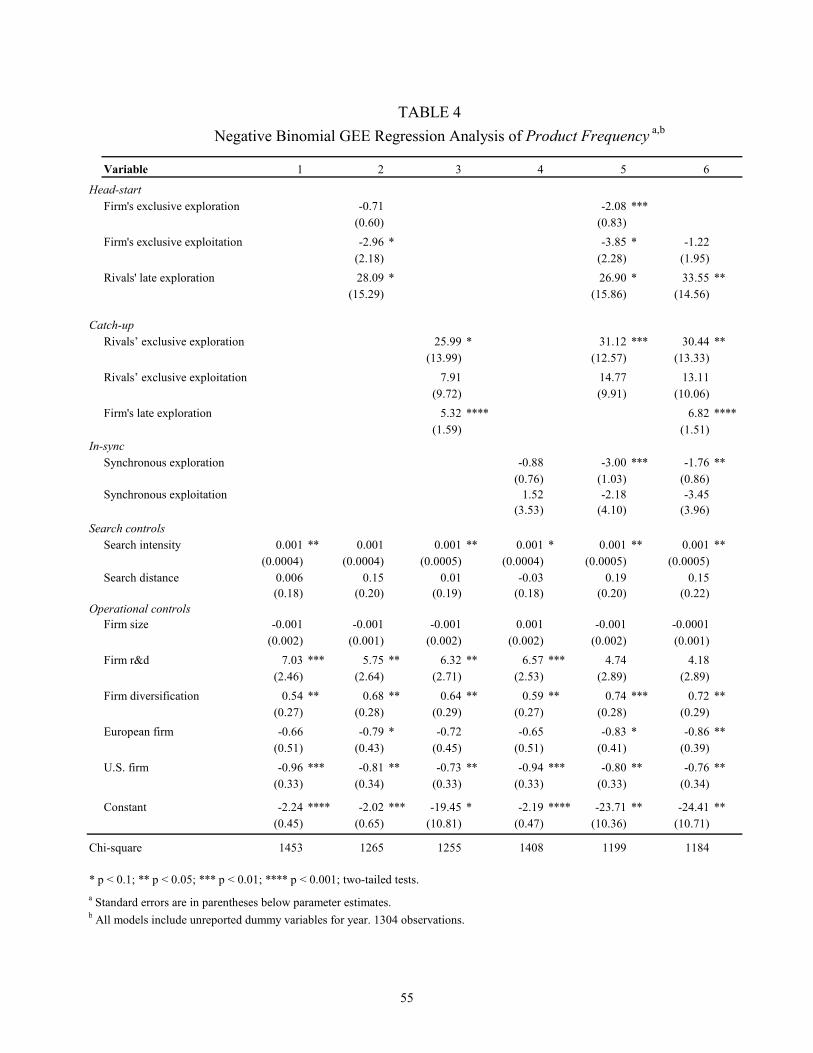
55
TABLE 4
Negative Binomial GEE Regression Analysis of Product Frequency a,b
Variable 1 2 3 4 5 6
Head-start Firm's exclusive exploration -0.71 -2.08 ***
(0.60) (0.83)Firm's exclusive exploitation -2.96 * -3.85 * -1.22
(2.18) (2.28) (1.95)Rivals' late exploration 28.09 * 26.90 * 33.55 **
(15.29) (15.86) (14.56)
Catch-upRivals’ exclusive exploration 25.99 * 31.12 *** 30.44 **
(13.99) (12.57) (13.33)Rivals’ exclusive exploitation 7.91 14.77 13.11
(9.72) (9.91) (10.06)Firm's late exploration 5.32 **** 6.82 ****
(1.59) (1.51)In-sync
Synchronous exploration -0.88 -3.00 *** -1.76 **(0.76) (1.03) (0.86)
Synchronous exploitation 1.52 -2.18 -3.45(3.53) (4.10) (3.96)
Search controlsSearch intensity 0.001 ** 0.001 0.001 ** 0.001 * 0.001 ** 0.001 **
(0.0004) (0.0004) (0.0005) (0.0004) (0.0005) (0.0005)Search distance 0.006 0.15 0.01 -0.03 0.19 0.15
(0.18) (0.20) (0.19) (0.18) (0.20) (0.22)Operational controls
Firm size -0.001 -0.001 -0.001 0.001 -0.001 -0.0001 (0.002) (0.001) (0.002) (0.002) (0.002) (0.001)
Firm r&d 7.03 *** 5.75 ** 6.32 ** 6.57 *** 4.74 4.18(2.46) (2.64) (2.71) (2.53) (2.89) (2.89)
Firm diversification 0.54 ** 0.68 ** 0.64 ** 0.59 ** 0.74 *** 0.72 **(0.27) (0.28) (0.29) (0.27) (0.28) (0.29)
European firm -0.66 -0.79 * -0.72 -0.65 -0.83 * -0.86 **(0.51) (0.43) (0.45) (0.51) (0.41) (0.39)
U.S. firm -0.96 *** -0.81 ** -0.73 ** -0.94 *** -0.80 ** -0.76 **(0.33) (0.34) (0.33) (0.33) (0.33) (0.34)
Constant -2.24 **** -2.02 *** -19.45 * -2.19 **** -23.71 ** -24.41 **(0.45) (0.65) (10.81) (0.47) (10.36) (10.71)
Chi-square 1453 1265 1255 1408 1199 1184
* p < 0.1; ** p < 0.05; *** p < 0.01; **** p < 0.001; two-tailed tests.a Standard errors are in parentheses below parameter estimates.b All models include unreported dummy variables for year. 1304 observations.
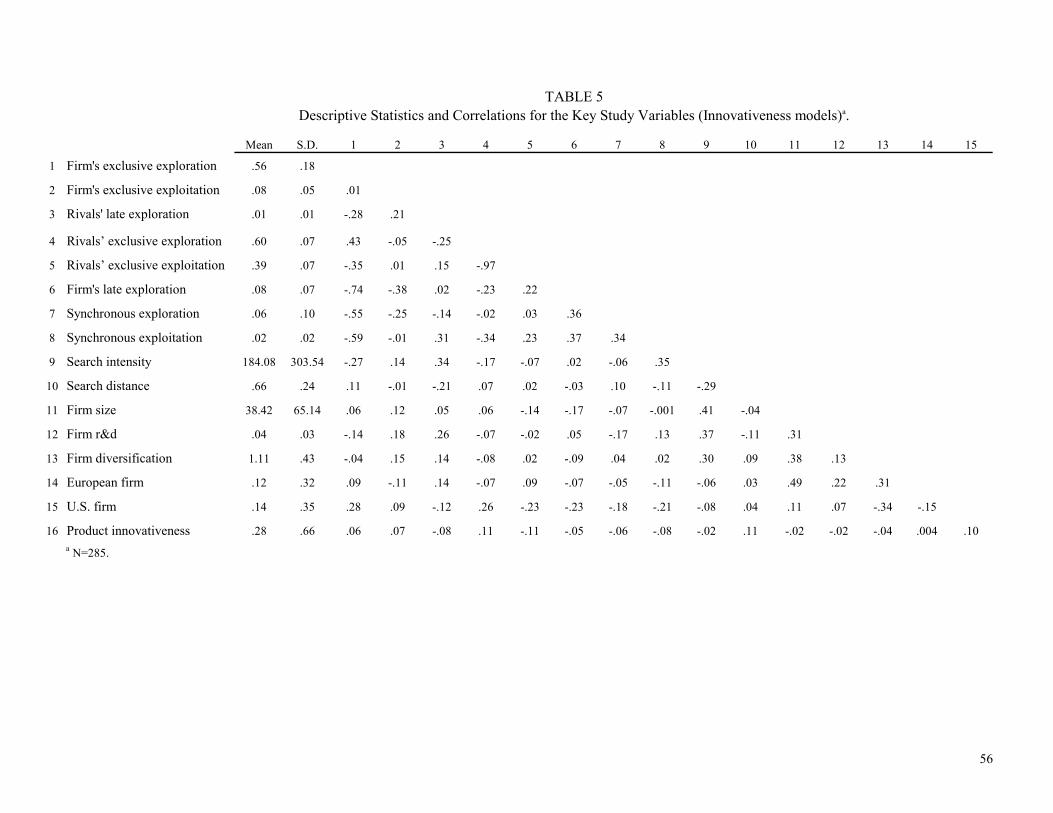
56
TABLE 5Descriptive Statistics and Correlations for the Key Study Variables (Innovativeness models)a.
Mean S.D. 1 2 3 4 5 6 7 8 9 10 11 12 13 14 15
1 Firm's exclusive exploration .56 .18
2 Firm's exclusive exploitation .08 .05 .01
3 Rivals' late exploration .01 .01 -.28 .21
4 Rivals’ exclusive exploration .60 .07 .43 -.05 -.25
5 Rivals’ exclusive exploitation .39 .07 -.35 .01 .15 -.97
6 Firm's late exploration .08 .07 -.74 -.38 .02 -.23 .22
7 Synchronous exploration .06 .10 -.55 -.25 -.14 -.02 .03 .36
8 Synchronous exploitation .02 .02 -.59 -.01 .31 -.34 .23 .37 .34
9 Search intensity 184.08 303.54 -.27 .14 .34 -.17 -.07 .02 -.06 .35
10 Search distance .66 .24 .11 -.01 -.21 .07 .02 -.03 .10 -.11 -.29
11 Firm size 38.42 65.14 .06 .12 .05 .06 -.14 -.17 -.07 -.001 .41 -.04
12 Firm r&d .04 .03 -.14 .18 .26 -.07 -.02 .05 -.17 .13 .37 -.11 .31
13 Firm diversification 1.11 .43 -.04 .15 .14 -.08 .02 -.09 .04 .02 .30 .09 .38 .13
14 European firm .12 .32 .09 -.11 .14 -.07 .09 -.07 -.05 -.11 -.06 .03 .49 .22 .31
15 U.S. firm .14 .35 .28 .09 -.12 .26 -.23 -.23 -.18 -.21 -.08 .04 .11 .07 -.34 -.15
16 Product innovativeness .28 .66 .06 .07 -.08 .11 -.11 -.05 -.06 -.08 -.02 .11 -.02 -.02 -.04 .004 .10a N=285.
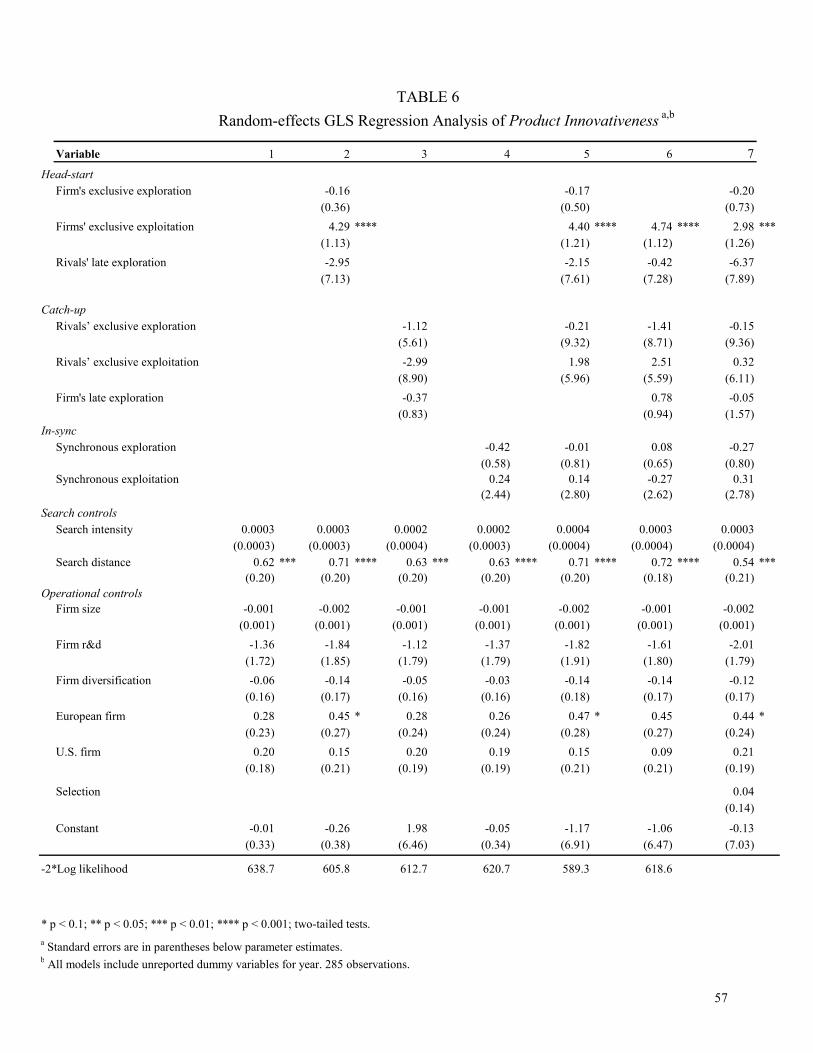
57
TABLE 6Random-effects GLS Regression Analysis of Product Innovativeness a,b
Variable 1 2 3 4 5 6 7Head-start
Firm's exclusive exploration -0.16 -0.17 -0.20(0.36) (0.50) (0.73)
Firms' exclusive exploitation 4.29 **** 4.40 **** 4.74 **** 2.98 ***(1.13) (1.21) (1.12) (1.26)
Rivals' late exploration -2.95 -2.15 -0.42 -6.37(7.13) (7.61) (7.28) (7.89)
Catch-upRivals’ exclusive exploration -1.12 -0.21 -1.41 -0.15
(5.61) (9.32) (8.71) (9.36)Rivals’ exclusive exploitation -2.99 1.98 2.51 0.32
(8.90) (5.96) (5.59) (6.11)Firm's late exploration -0.37 0.78 -0.05
(0.83) (0.94) (1.57)In-sync
Synchronous exploration -0.42 -0.01 0.08 -0.27(0.58) (0.81) (0.65) (0.80)
Synchronous exploitation 0.24 0.14 -0.27 0.31(2.44) (2.80) (2.62) (2.78)
Search controlsSearch intensity 0.0003 0.0003 0.0002 0.0002 0.0004 0.0003 0.0003
(0.0003) (0.0003) (0.0004) (0.0003) (0.0004) (0.0004) (0.0004)Search distance 0.62 *** 0.71 **** 0.63 *** 0.63 **** 0.71 **** 0.72 **** 0.54 ***
(0.20) (0.20) (0.20) (0.20) (0.20) (0.18) (0.21)Operational controls
Firm size -0.001 -0.002 -0.001 -0.001 -0.002 -0.001 -0.002 (0.001) (0.001) (0.001) (0.001) (0.001) (0.001) (0.001)
Firm r&d -1.36 -1.84 -1.12 -1.37 -1.82 -1.61 -2.01(1.72) (1.85) (1.79) (1.79) (1.91) (1.80) (1.79)
Firm diversification -0.06 -0.14 -0.05 -0.03 -0.14 -0.14 -0.12(0.16) (0.17) (0.16) (0.16) (0.18) (0.17) (0.17)
European firm 0.28 0.45 * 0.28 0.26 0.47 * 0.45 0.44 *(0.23) (0.27) (0.24) (0.24) (0.28) (0.27) (0.24)
U.S. firm 0.20 0.15 0.20 0.19 0.15 0.09 0.21(0.18) (0.21) (0.19) (0.19) (0.21) (0.21) (0.19)
Selection 0.04(0.14)
Constant -0.01 -0.26 1.98 -0.05 -1.17 -1.06 -0.13(0.33) (0.38) (6.46) (0.34) (6.91) (6.47) (7.03)
-2*Log likelihood 638.7 605.8 612.7 620.7 589.3 618.6
* p < 0.1; ** p < 0.05; *** p < 0.01; **** p < 0.001; two-tailed tests.a Standard errors are in parentheses below parameter estimates.b All models include unreported dummy variables for year. 285 observations.
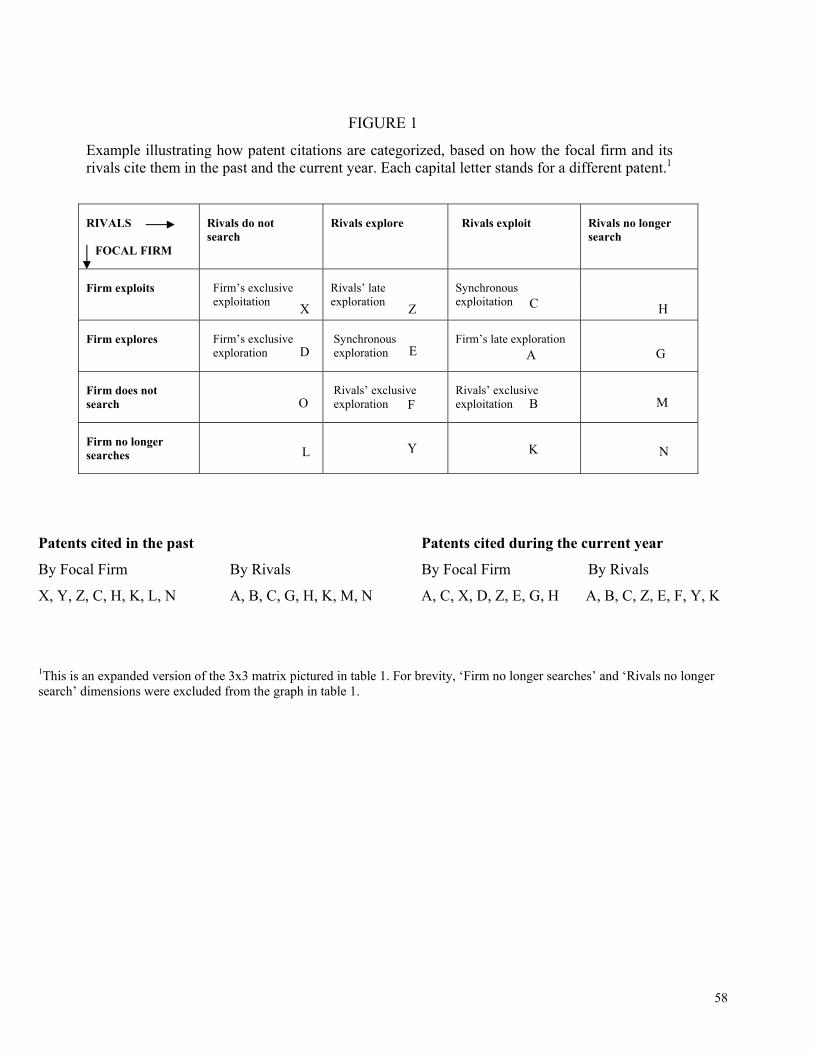
58
FIGURE 1
Example illustrating how patent citations are categorized, based on how the focal firm and its rivals cite them in the past and the current year. Each capital letter stands for a different patent.1
RIVALS FOCAL FIRM
Rivals do not search
Rivals explore Rivals exploit Rivals no longer search
Firm exploits Firm’s exclusive exploitation
Rivals’ late exploration
Synchronous exploitation
Firm explores Firm’s exclusive exploration
Synchronous exploration
Firm’s late exploration
Firm does not search
Rivals’ exclusive exploration
Rivals’ exclusive exploitation
Firm no longer searches
Patents cited in the past Patents cited during the current year
By Focal Firm By Rivals By Focal Firm By Rivals
X, Y, Z, C, H, K, L, N A, B, C, G, H, K, M, N A, C, X, D, Z, E, G, H A, B, C, Z, E, F, Y, K
1This is an expanded version of the 3x3 matrix pictured in table 1. For brevity, ‘Firm no longer searches’ and ‘Rivals no longer search’ dimensions were excluded from the graph in table 1.
D
X
G
H
A
Z
E
C
F
Y
B
K
O
L
M
N
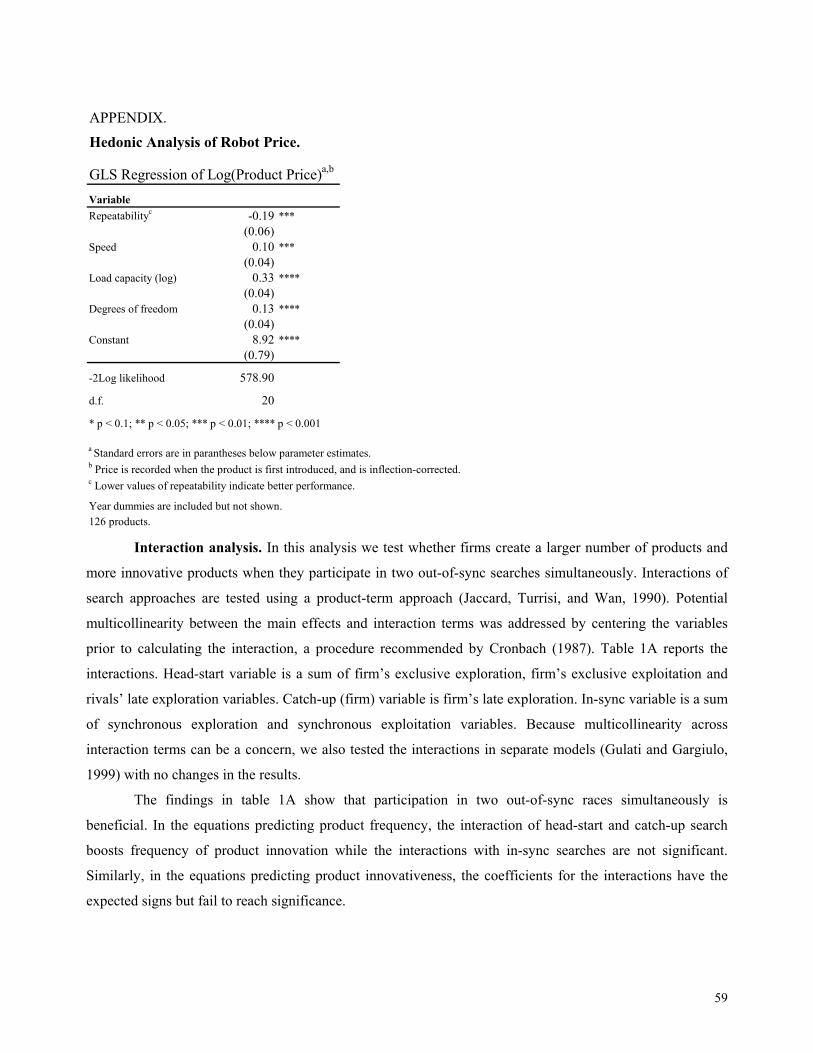
59
APPENDIX. Hedonic Analysis of Robot Price.
GLS Regression of Log(Product Price)a,b
VariableRepeatabilityc -0.19 ***
(0.06)Speed 0.10 ***
(0.04)Load capacity (log) 0.33 ****
(0.04)Degrees of freedom 0.13 ****
(0.04)Constant 8.92 ****
(0.79)
-2Log likelihood 578.90
d.f. 20
* p < 0.1; ** p < 0.05; *** p < 0.01; **** p < 0.001
a Standard errors are in parantheses below parameter estimates.b Price is recorded when the product is first introduced, and is inflection-corrected. c Lower values of repeatability indicate better performance.
Year dummies are included but not shown. 126 products.
Interaction analysis. In this analysis we test whether firms create a larger number of products and
more innovative products when they participate in two out-of-sync searches simultaneously. Interactions of
search approaches are tested using a product-term approach (Jaccard, Turrisi, and Wan, 1990). Potential
multicollinearity between the main effects and interaction terms was addressed by centering the variables
prior to calculating the interaction, a procedure recommended by Cronbach (1987). Table 1A reports the
interactions. Head-start variable is a sum of firm’s exclusive exploration, firm’s exclusive exploitation and
rivals’ late exploration variables. Catch-up (firm) variable is firm’s late exploration. In-sync variable is a sum
of synchronous exploration and synchronous exploitation variables. Because multicollinearity across
interaction terms can be a concern, we also tested the interactions in separate models (Gulati and Gargiulo,
1999) with no changes in the results.
The findings in table 1A show that participation in two out-of-sync races simultaneously is
beneficial. In the equations predicting product frequency, the interaction of head-start and catch-up search
boosts frequency of product innovation while the interactions with in-sync searches are not significant.
Similarly, in the equations predicting product innovativeness, the coefficients for the interactions have the
expected signs but fail to reach significance.
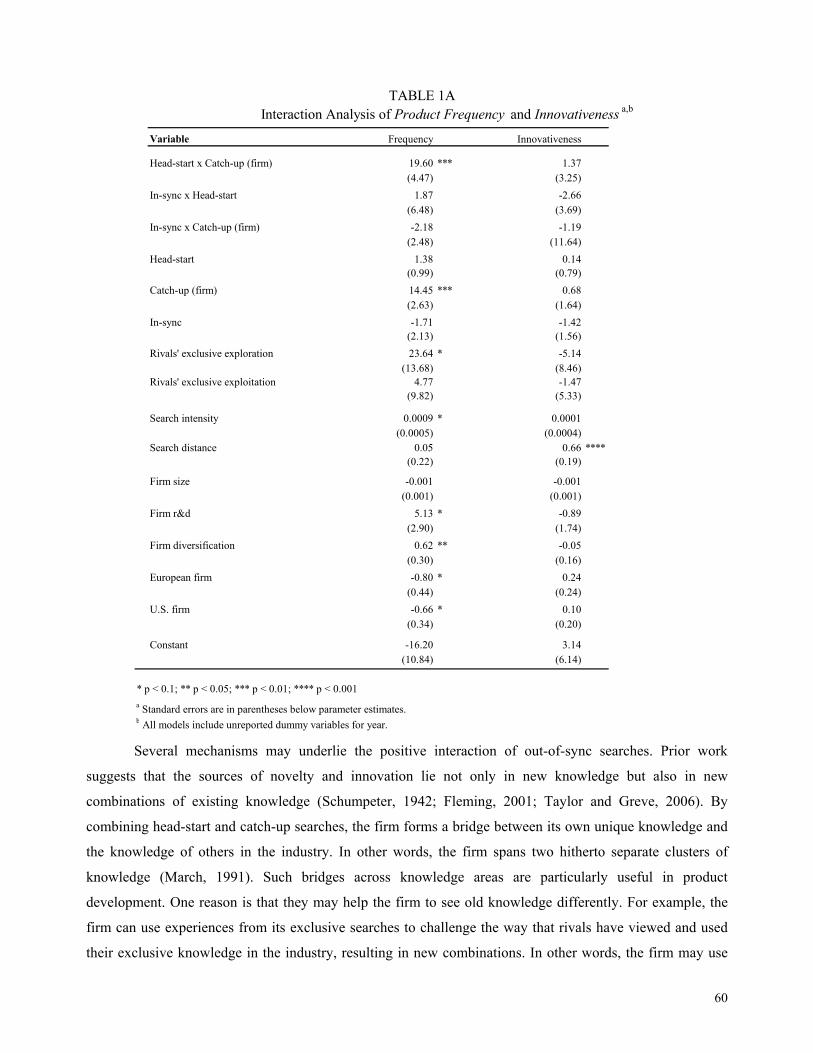
60
TABLE 1AInteraction Analysis of Product Frequency and Innovativeness a,b
Variable Frequency Innovativeness
Head-start x Catch-up (firm) 19.60 *** 1.37(4.47) (3.25)
In-sync x Head-start 1.87 -2.66(6.48) (3.69)
In-sync x Catch-up (firm) -2.18 -1.19(2.48) (11.64)
Head-start 1.38 0.14(0.99) (0.79)
Catch-up (firm) 14.45 *** 0.68(2.63) (1.64)
In-sync -1.71 -1.42(2.13) (1.56)
Rivals' exclusive exploration 23.64 * -5.14(13.68) (8.46)
Rivals' exclusive exploitation 4.77 -1.47(9.82) (5.33)
Search intensity 0.0009 * 0.0001(0.0005) (0.0004)
Search distance 0.05 0.66 ****(0.22) (0.19)
Firm size -0.001 -0.001 (0.001) (0.001)
Firm r&d 5.13 * -0.89(2.90) (1.74)
Firm diversification 0.62 ** -0.05(0.30) (0.16)
European firm -0.80 * 0.24(0.44) (0.24)
U.S. firm -0.66 * 0.10(0.34) (0.20)
Constant -16.20 3.14(10.84) (6.14)
* p < 0.1; ** p < 0.05; *** p < 0.01; **** p < 0.001a Standard errors are in parentheses below parameter estimates.b All models include unreported dummy variables for year. Several mechanisms may underlie the positive interaction of out-of-sync searches. Prior work
suggests that the sources of novelty and innovation lie not only in new knowledge but also in new
combinations of existing knowledge (Schumpeter, 1942; Fleming, 2001; Taylor and Greve, 2006). By
combining head-start and catch-up searches, the firm forms a bridge between its own unique knowledge and
the knowledge of others in the industry. In other words, the firm spans two hitherto separate clusters of
knowledge (March, 1991). Such bridges across knowledge areas are particularly useful in product
development. One reason is that they may help the firm to see old knowledge differently. For example, the
firm can use experiences from its exclusive searches to challenge the way that rivals have viewed and used
their exclusive knowledge in the industry, resulting in new combinations. In other words, the firm may use
61
knowledge from one part of the knowledge domain to challenge “accepted believes” in another (Lant and
Mezias, 1992). While repeated use of a particular knowledge element often locks the firm in a network of
routines (Henderson and Clark, 1990) and thus in a pattern of recombinations, first time users often introduce
new ways of using the knowledge and new combinations of them (March, 1991; Galunic and Rodan, 1998),
by using unique knowledge from their own searches. In fact, one of the oft-cited robotics designs in the
interviews conducted in this study was a robot that was developed by a relatively novice team by simply
turning a common design on its side (from vertical to horizontal). These arguments explain why searches
ahead and after competitors (head-start, catch-up) are mutually reinforcing.
Altogether, interaction results show that not all search approaches create tradeoffs between introducing
more products and introducing more innovative products. An especially intriguing result, in addition to the
main results reported in Table 1A, is the (unreported) positive and significant interaction between rivals’ late
exploration and firm’s late exploration variables which makes new products both more frequent and more
innovative (results available from the authors). Curiously, by forming a two-way bridge between its own and
its rivals’ search efforts, the focal firm is able to locate in a sweet spot that boosts both qualities.