Embed Size (px)
Citation preview
European Journal of Business and Innovation Research
Vol.2, No.1, pp. 93-119, March 2014
Published by European Centre for Research Training and Development UK (www.ea-journals.org)
93
EFFECTS OF STRATEGIC MANAGEMENT DRIVERS ON THE PERFORMANCE OF
HOTEL INDUSTRY IN KENYAN COAST
Uzel Jean Mzera Mutindi 1
PhD Candidate at JKUAT, MSA CBD, Kenya.
P. O. Box 666-80109, Mtwapa, Mombasa-Kenya
Prof. G.S. Namusonge, PhD 2
Full Professor, EPD JKUAT, Kenya.
Dr. J. Obwogi, PhD 3
Technical University of Mombasa, Kenya.
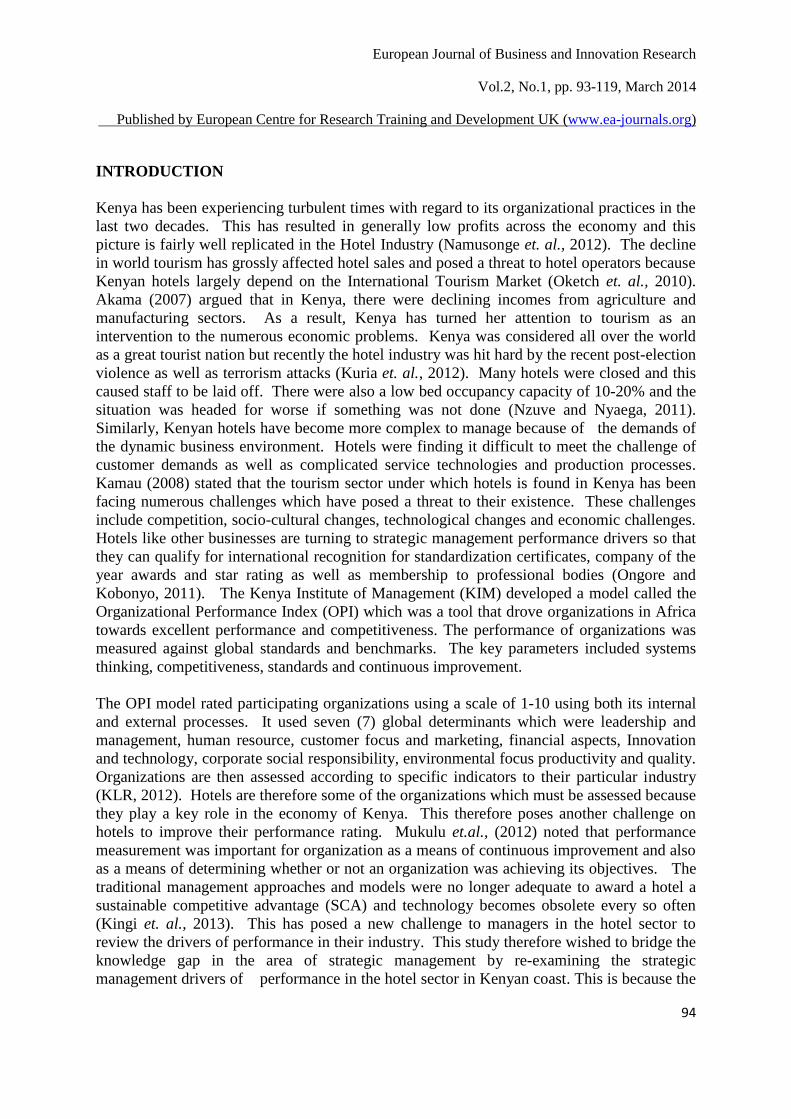
ABSTRACT: The purpose of this research was to examine the effect of strategic management
drivers on the performance of hotels in Kenyan coast. The general objective of the study was to
examine the role of strategic management drivers on the performance of hotels in Kenyan Coast.
The strategic management drivers selected for this study and which formed the specific objectives of
the study were: to find out the effect of customer relationship management (CRM) strategy, strategic
planning (SP), competitive positioning(CP), information communication technology(ICT) and
organizational learning(OL) on the performance of the hotel industry in Kenyan Coast. The study
adopted a mixed research approach which was both quantitative and qualitative using descriptive
survey. The population of the study was 180 managers of classified hotels in Kenya’s Coast. The
sampling technique that was used was stratified random sampling. Data collection methods involved
secondary and primary data. The instrument of study was a self administered questionnaire which
was used to collect data after it had been piloted for validity and reliability. The questionnaires were
administered through drop and pick method. An observation checklist was also used to account for
qualitative data Performance in the hotel industry was measured using both financial and non-
financial measures. In this study 123 hotels were extensively surveyed to ascertain their level of use
of strategic management drivers of hotels performance. The correlations between the five strategic
drivers were evaluated by using various statics tools and instruments. The findings revealed that
strategic management drivers had a positive influence on hotel performance. The overall results
indicated that there was a highly significant linear relationship between CRM strategy and hotel
performance and a moderately significant linear relationship between strategic planning (SP),
strategic competitive positioning (SCP) and hotel performance and a moderately low significant
relationship between Information communication technology (ICT), Organizational learning (OL)
and hotel performance. The study recognized strategic management drivers as some of the tools that
propel performance in the hotel industry. It recommended to hotels that they ought to embrace the
adoption of strategic management drivers. Hotels were also challenged to align their goals and
objectives to the stated strategic management drivers of performance in order to gain sustainable
competitive advantage (SCA). This research will go a long way in assisting hotels in identifying and
adopting strategic management drivers in order to enhance their performance. Enhanced
performance through the adoption of strategic management drivers will help hotels to create jobs,
improve the economy as well as making Kenyan hotels more competitive in the global hotel industry.
KEYWORDS: Hotel performance, Tourist Hotels, Strategic Management Drivers.
European Journal of Business and Innovation Research
Vol.2, No.1, pp. 93-119, March 2014
Published by European Centre for Research Training and Development UK (www.ea-journals.org)
94
INTRODUCTION
Kenya has been experiencing turbulent times with regard to its organizational practices in the
last two decades. This has resulted in generally low profits across the economy and this
picture is fairly well replicated in the Hotel Industry (Namusonge et. al., 2012). The decline
in world tourism has grossly affected hotel sales and posed a threat to hotel operators because
Kenyan hotels largely depend on the International Tourism Market (Oketch et. al., 2010).
Akama (2007) argued that in Kenya, there were declining incomes from agriculture and
manufacturing sectors. As a result, Kenya has turned her attention to tourism as an
intervention to the numerous economic problems. Kenya was considered all over the world
as a great tourist nation but recently the hotel industry was hit hard by the recent post-election
violence as well as terrorism attacks (Kuria et. al., 2012). Many hotels were closed and this
caused staff to be laid off. There were also a low bed occupancy capacity of 10-20% and the
situation was headed for worse if something was not done (Nzuve and Nyaega, 2011).
Similarly, Kenyan hotels have become more complex to manage because of the demands of
the dynamic business environment. Hotels were finding it difficult to meet the challenge of
customer demands as well as complicated service technologies and production processes.
Kamau (2008) stated that the tourism sector under which hotels is found in Kenya has been
facing numerous challenges which have posed a threat to their existence. These challenges
include competition, socio-cultural changes, technological changes and economic challenges.
Hotels like other businesses are turning to strategic management performance drivers so that
they can qualify for international recognition for standardization certificates, company of the
year awards and star rating as well as membership to professional bodies (Ongore and
Kobonyo, 2011). The Kenya Institute of Management (KIM) developed a model called the
Organizational Performance Index (OPI) which was a tool that drove organizations in Africa
towards excellent performance and competitiveness. The performance of organizations was
measured against global standards and benchmarks. The key parameters included systems
thinking, competitiveness, standards and continuous improvement.
The OPI model rated participating organizations using a scale of 1-10 using both its internal
and external processes. It used seven (7) global determinants which were leadership and
management, human resource, customer focus and marketing, financial aspects, Innovation
and technology, corporate social responsibility, environmental focus productivity and quality.
Organizations are then assessed according to specific indicators to their particular industry
(KLR, 2012). Hotels are therefore some of the organizations which must be assessed because
they play a key role in the economy of Kenya. This therefore poses another challenge on
hotels to improve their performance rating. Mukulu et.al., (2012) noted that performance
measurement was important for organization as a means of continuous improvement and also
as a means of determining whether or not an organization was achieving its objectives. The
traditional management approaches and models were no longer adequate to award a hotel a
sustainable competitive advantage (SCA) and technology becomes obsolete every so often
(Kingi et. al., 2013). This has posed a new challenge to managers in the hotel sector to
review the drivers of performance in their industry. This study therefore wished to bridge the
knowledge gap in the area of strategic management by re-examining the strategic
management drivers of performance in the hotel sector in Kenyan coast. This is because the
European Journal of Business and Innovation Research
Vol.2, No.1, pp. 93-119, March 2014
Published by European Centre for Research Training and Development UK (www.ea-journals.org)
95
research hypothesized that strategic management performance drivers could be the answer to
the current hotel dilemma.
LITERATURE REVIEW
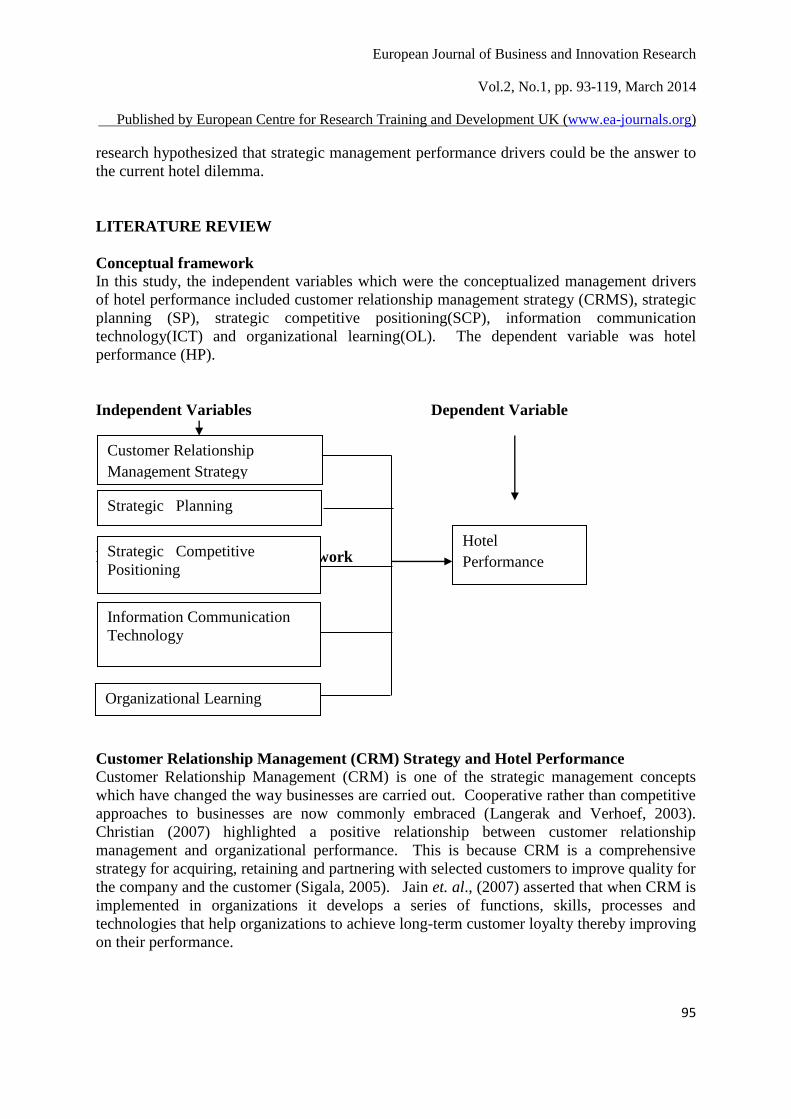
Conceptual framework
In this study, the independent variables which were the conceptualized management drivers
of hotel performance included customer relationship management strategy (CRMS), strategic
planning (SP), strategic competitive positioning(SCP), information communication
technology(ICT) and organizational learning(OL). The dependent variable was hotel
performance (HP).
Independent Variables Dependent Variable
Figure: 2.2. Conceptual Framework
Customer Relationship Management (CRM) Strategy and Hotel Performance
Customer Relationship Management (CRM) is one of the strategic management concepts
which have changed the way businesses are carried out. Cooperative rather than competitive
approaches to businesses are now commonly embraced (Langerak and Verhoef, 2003).
Christian (2007) highlighted a positive relationship between customer relationship
management and organizational performance. This is because CRM is a comprehensive
strategy for acquiring, retaining and partnering with selected customers to improve quality for
the company and the customer (Sigala, 2005). Jain et. al., (2007) asserted that when CRM is
implemented in organizations it develops a series of functions, skills, processes and
technologies that help organizations to achieve long-term customer loyalty thereby improving
on their performance.
Customer Relationship
Management Strategy
Practices
Strategic Planning
Strategic Competitive
Positioning
Hotel
Performance
-
Organizational Learning
Information Communication
Technology
T
European Journal of Business and Innovation Research
Vol.2, No.1, pp. 93-119, March 2014
Published by European Centre for Research Training and Development UK (www.ea-journals.org)
96
Coltman (2007) contented that CRM is a core process in enhancing competitiveness and
performance. They further assert that CRM policies in the hotel sector must concentrate on
customer satisfaction, customer retention and customer quality. Teng et. al., (2007) also
suggested that CRM improves performance through its various processes because it enables
companies to evaluate their efficiency in serving customers. Hotels therefore have a duty to
identify customer needs in order to plan how to satisfy them (Zander and Zander, 2005).
Customer relationships are one of the most expensive assets a hotel can have because
satisfied customers are more likely to return to the hotels and also to recommend others
(Jones et. al., 2007). Uzel (2012) stated there was intense competition in today’s hotels
which requires managers to adopt strategic drivers of performance in order to improve hotel
services. Chen and Popovich (2003) stated that hotels that maintain long run performance are
the ones that are able to build customer loyalty and retention. Zablah et.al., (2004)
established that CRM brings benefits in terms of improved performance. This results from
acquiring new customers as well as sustaining customers for competitive advantage. CRM
also improves performance through reduction of the costs incurred in acquiring customers
and also the profitability that results from customer loyalty (Piccoli et.al., 2003). CRM
strategy is a customer centered rather than product centered interaction with customers which
adds value to the services offered in hotels to enhance the desired results. Minal and Kasim
(2009) stated that CRM improves hotels performance through engaging customers in long
term relationships in order to improve profits in the hotel industry. Customer Relationship
Management Strategy if applied will attract new customers in the hotel industry which was
facing a lot of competition and required that they differentiate their customers (Piccoli et.al.,
2003). Hotels like other organizations needed to assess users satisfaction levels towards
their service so that they could use the feedback to make positive adjustments to their
products and services. Iravo et. al., (2013) stated that dissatisfied customers were disloyal to
the organization and talked about their bad experience to other customers. In this study CRM
was viewed as a customer strategy for retaining customer loyalty and improving hotels
performance.
Strategic planning and hotel performance The history of strategic planning dated back to long-range planning (Cappelli, 2005).
Strategic planning was therefore a proactive alternative to long-range planning which was
found to be obsolete because it was not increasing firm’s true value. Strategic Planning is a
core task of senior management which involves fourteen (14) processes (Armstrong, 2010).
These processes are designing objectives, planning strategy, establishing goals, developing
company philosophy, policies, procedures, organization structures, establishing personnel and
facilities, capital, establishing standards, programs and operational plans and
institutionalization, evaluation and control. Pearce and Robinson (2008) viewed Strategic
Planning as an organizational process that is vision driven and that aims at developing the
future value of an organization. Dan (2009) stated that Strategic Planning process involves
the implementation of strategy in an organization which should be managed through a
sequence of steps. These steps include setting of objectives, analysis of environmental trends
& capabilities, evaluation of the available options and planning, implementation,
operationalization and institutionalization of strategy.
European Journal of Business and Innovation Research
Vol.2, No.1, pp. 93-119, March 2014
Published by European Centre for Research Training and Development UK (www.ea-journals.org)
97
Barney and Hesterly (2006) were of the view that the process of strategic planning was
designed well such that it met the specific needs of the organization. The strategic
management planning process involved the mission and vision of the organization,
environmental analysis, selection of objectives and analyzing strategic choices (Porter, 2004).
There were no any best way of conducting the process of strategic planning in an
organization and therefore strategies should be formulated explicitly and implicitly (Johnson
and Scholes, 2003). Hotels have acknowledged the importance of strategic planning just like
other organizations. This is because strategic planning helps organizations to clearly identify
and prioritize their objectives, and targets. Strategic planning however has to be done under
a conducive strategic planning environment which has the appropriate structures for proper
coordination and cooperation (Dobini, 2003). Manager’s perception was also very important
to the strategic planning process because they are the initiators as well as the implementers of
the plans (Balogun, 2003). The concept of strategic planning has been widely adopted by
hotels but its dimensions, roles and impact to the performance of the overall hotel
management was still disputable. Creating a winning strategy is not a one-time event
because a good strategy today might not be successful tomorrow. Changes in the business
environment are leading to new and greater demands on strategic planning systems. Jehad
and Adel (2013) asserted that there were several planning systems used by hotels in order to
manage change and these systems have evolved in order to cope with the continuously
changing environment. Strategic plans can help hotels communicate their goals, strategies
and operational tasks to internal and external stakeholders (Galbreath, 2010). Higher
planning formality is beneficial for firms that operate in highly competitive environments like
hotels and this may assist them to meet competitive threats more systematically (Law and
Jogaratnam, 2005). A hotel could adopt strategies in both the internal and external
environment. The internal environment included the physical and social factors within the
boundaries of the hotels or specific decision units that are taken directly into consideration in
the decision-making behaviour of individuals in those systems (Richard et. al., 2009).
Internal environment also can refer to the amount of attention devoted to a hotel’s recent
history and current situation, its past performance and an analysis of its strengths and
weaknesses. On the other hand, external orientation involves the ability to obtain reliable
research information in order to learn about external environmental opportunities and threats
(Dincer et.al., 2006). These opportunities and threats refer to those relevant factors outside
the boundaries of the hotel or specific decision units that are taken directly into consideration
(Pinea and Phillips, 2005). Johnson and Scholes (2003) stated that for a formal planning
process to assist in strategy development, it must include mechanisms to embrace proper
customer services, efficiency of operating processes, alternating and retaining high quality
employees, and analysis of financial strengths and weaknesses. The external orientation will
create analysis of investment opportunities, analysis of competition and reforming market
research.
Wheelen and Hunger (2008) concluded that strategic planning attempts to look ahead to
where a firm wants to be in future together with the budget to get there. In the recent times,
the hotel industry has identified the importance of strategic planning by defining the mission
of their businesses so that they are better able to give themselves a direction to focus their
activities. Strategic planning helps managers to identify a clear-cut concept of their hotels
and as a result of this make it possible to formulate plans and activities that will bring them
European Journal of Business and Innovation Research
Vol.2, No.1, pp. 93-119, March 2014
Published by European Centre for Research Training and Development UK (www.ea-journals.org)
98
close to their goals (Pearce and Robinson, 2008). Kenyan hotel managers operate in a world
that is ever changing and nothing is static whether in technology, politics or society. They
therefore have no choice but to come up with strategic planning as a tool for the future
prospects of their hotels.
Strategic Competitive Positioning and hotel performance
Competitive advantage (CA) has been defined differently by different authors but all of them
agree that it related to strategy formulation and implementation in organizations (Porter,
2009). Hotels that desire to perform must select strategies that gave them a competitive
advantage over their competitors based on their core competencies (Porter, 2004).
Organizations can do strategic analysis to achieve competitive advantage using tools such as
Strengths Weaknesses Opportunities Threats (SWOT) Analysis, Porter’s five forces Model
and the RBT of the firm (Harrison, 2003). Strengths, Weaknesses, Opportunities, and
Threats analysis aims at matching an organizations internal strengths and weaknesses with its
external opportunities and threats. Porters Five Forces Model determines the firms’ abilities
to position and compete in the industry. Mibei (2007) also proposed three generic strategies
which could help organizations to cope with competitive forces and these include focus, cost
leadership and differentiations. Previous RBT research has provided evidence that the
analysis of a firm’s internal resources helps firms to realize their competencies and
capabilities which are inimitable by their competitors (Wang and Ahmed, 2007).
Lo (2012) stated that firm’s resources include assets, capabilities, organizational processes
and knowledge that help firms to implement strategies that improve performance. Other
researchers refer to these resources as core competencies and capabilities that could generate
competitive advantage (Barney and Peteref, 2003). A few hospitality researchers have stated
core competencies of hospitality organizations to be processes, skills and assets that influence
organizations to achieve competitive advantage (Barney, 2001b). Sources that have also been
mentioned to contribute to core competencies are location, brand, facilities, employee,
customer loyalties, market coverage, market share, service quality, technology, leadership,
systems and procedures and organizational culture (Peteraf and Bergen, 2003). Hotels are
dynamic organizations which are affected by diverse variables hence the application of
Competitive advantage will help them to sustain exemplary performance. Richard and
Marilyn (2006) argued that the essence of business strategy formulation is coping with
competition. Moullin (2007) also suggested that business strategy was all about
competitiveness because the main purpose of strategy adoption was to enable a hotel gain a
sustainable edge over its competitors. Tavitiyaman et. al., (2011) stated that hotel’s
strategies consists of competitive moves and business approaches that managers employ to
attract and please customers, compete successfully, grow the business, conduct operations
and achieve targeted objectives. A hotel achieves sustainable competitive advantage when an
attractive number of customers prefer its services over the offerings of competitors and when
the basis of this preference is durable (Sabah et. al., 2012). Businesses will only result in
superior performance when the appropriate strategic management drivers of performance are
adopted. The management of these key success factors results in superior value. Hotels can
take advantage of their overall products and services to come up with services which are
superior to their competitors. Lo (2012) observed that porters’ generic strategy can create
competitive advantage for a firm through the adoption of differentiation and cost-leadership.
European Journal of Business and Innovation Research
Vol.2, No.1, pp. 93-119, March 2014
Published by European Centre for Research Training and Development UK (www.ea-journals.org)
99
These strategies give a firm a better chance of outperforming other firms in a homogeneous
industry. Porter (2004) described porter’s five forces as the threat of new entrants, threat of
substitutes, bargaining power of suppliers and buyers and the intensity of rivalry. Firms in a
particular industry need to adopt these five drivers in order to improve their performance.
Porter (2009) stated that for a firm to achieve high performance it has to achieve one of the
basic competitive advantages which are lower cost and differentiation. He further suggests
that a firm which does not adopt any one of these strategies is geared towards failure.
Differentiation can take different forms such as various marketing strategies, better product
image, better market awareness, low prices, higher product quality and better customer
service or availability of goods (Lo, 2012). Strategic management scholars have been asking
key questions regarding why firms perform better than others (Peng, 2002). These scholars
claimed that a firm superior’s performance was influenced by many factors (Davidson, 2005).
Differentiation helped firms to build customer loyalty through offering unique products or
services (Allen and Helms, 2006).
Firms that adopted differentiation could charge higher prices based on their costs, channels of
distribution and quality (Akan et. al., 2006). Differentiation strategies could be classified
into market and product strategies. In product-innovation, firms outperformed their
competitors by increased creativity, quality, efficiency and innovations among others. Lo
(2012) states that there are few examples of differentiation in hotel industry such as designer
hotels and Boutique hotels. Marketing differentiation involves the use of marketing
practices for hotels to differentiate themselves which include market segmentation, branding,
promotions, pricing and advertising (Akan et. al., 2006). A hotel could gain competitive
advantage by adopting a low cost strategy such as mass production, technology adoption,
achieving economies of scale and access to raw materials (Campbell-Hunt, 2000). A cost-
leadership strategy can improve the performance of hotels by giving them distinctive
competencies in the management of materials and also in the production process.
Information Communication Technology (ICT) and hotel performance
Sirawit et. al., (2011) observed that the use of ICT is an integral part of hotels because it
increases hotel performance in various ways. Firstly, the use of ICT improves managerial
activities and leads to better organizational performance. ICT has therefore been recognized
as one of the drivers of hotel performance because hotels globally have to use ICT for all
their processes (Ham et. al., 2005). ICT has been widely used in hospitality industry to
eliminate the gap between purchase and service experience (Law and Jogaratnam, 2005).
This is because hospitality is a service which may not be experienced in advance because
decisions are made away from guest experiences. Innovation entails addition of new
technical knowledge to production of goods and services.
Technological innovation includes the development of new business methods to achieve
desired objectives. ICT led to high organizational performance which was characterized by
high financial income, continuous sustainable innovations, satisfied customers and a
motivated human resource (Epstein, 2004). Sabri et. al., (2004) in his study established a
positive relationship between ICT and the performance of firms. ICT positively influences
employee performance because it is the human capital that spearheads innovations. All types
of ICT were totally dependent on the human resource of the organization that designed, run
European Journal of Business and Innovation Research
Vol.2, No.1, pp. 93-119, March 2014
Published by European Centre for Research Training and Development UK (www.ea-journals.org)
100
and reviewed the programs (Zaheer et. al., 2011). Wong et. al., (2007) confirmed a positive
relationship between innovation and organizational performance and therefore when an
organization achieves competence in making a certain product; it can add value to the product
by investing in the latest and modern technology. The Resource Based Theory of the firm
explains the role of ICT and performance by assuming that distinctive competencies are
relatively stable overtime and are heterogeneously shared across firms (Denson, 2008). ICT
has been cited as one of the valuable resources and sources of competitive advantage which
influence organizational performance. Information Communication Technology involves the
introduction of modern ideas within an organization which is one of the driving forces of
performance in hotels (GoK, 2007). Cagna (2007) proposed ICT as one of the ways for the
survival of organizations today. Shimpton et. al., (2006) stated that ICT can be sustained by
involving human resources to manage, create, transfer and implement knowledge.
The adoption of ICT has been widely supported by literature in the hotel industry which
identifies it as a strategic driver to organizational performance (Sharma and Upneja, 2005).
Law and Jogaratnam (2005) supported the use of IT for operational purposes by stating that
firm and location related factors are among the key issues that influence adoption of ICT in
hotels. Lau et. al., (2005) highlighted that the use of ICT in hotels was becoming a
complicated affair because little attention had been given to the integration of ICT to key
strategic management drivers (Segnupta et. al., 2006). Barkhi and Daghfous (2009) stated
that competition among hotels is a major catalyst for the need for innovation in technology
because of the dynamic nature of today’s organizations. Hotels just like other organizations
have been forced to look for new sources of competitive advantage one of which was ICT
(Raisinghani, 2005). Barkhi and Daghfous (2004) highlighted the readiness of hotels to
adopt ICT and best practices and stated that current ICT infrastructure in hotels was enough
to support adoption of best practices and improve the hotels performance.
Organizational learning and hotel performance
Njuguna (2009) stated that organizational learning is a fundamental source of competitive
advantage in organizations. He further stated that it helps firms to obtain sustainable
competitive advantage through the development of its unique learning knowledge resources
and capabilities. Hotels like many other businesses are facing a lot of competitive challenges
arising from the dynamism and complexity of the business environment (DeNisi et. al.,
2003). This state of affairs has propelled academicians and hotel practitioners to study
distinctive firm competencies that add value to the final consumer. Hotels just like other
organizations have to encourage their employees to continually learn new skills and to be
innovative in order to achieve their strategic alternatives (GoK, 2003). Winter (2003)
proposed four stages of organizational learning which were knowledge acquisition,
distribution, application and translation into organizational resources such as procedures,
systems and databases which can be used for leveraging the firm. DeNisi (2003) highlighted
that when a firm obtains individual level resources such as knowledge or human capital it has
to leverage these resources to organizational capital so that the whole organization can
benefit. Intellectual capital is therefore a key determinant of value creation for
organizations. Intellectual capital can be divided into organizational capital, social capital
and human capital. Armstrong (2010) highlighted that through organizational learning a firm
can develop unique intellectual capital that other firms cannot imitate.Organizational learning
European Journal of Business and Innovation Research
Vol.2, No.1, pp. 93-119, March 2014
Published by European Centre for Research Training and Development UK (www.ea-journals.org)
101
helps people in the organization to question themselves about organizational systems and
challenges and endeavor to seek for solutions (Murray and Donegan, 2003).
Hotel Performance.
Performance is a complex and dynamic concept which has been conceptualized in two ways
namely the drivers of performance and the results of performance (Neely 2005).
Organizational performance is concerned with the overall productivity in an organization in
terms of stock turnover, customers, profitability and market share. Competition in the global
economy has intensified the importance of identifying the drivers of sustainable performance.
The search for such drivers is no longer restricted to tangible factors but has expanded to
include intangibles. Performance may be measured by both quantitative and qualitative
methods. Ittner and Larcker (2003) stated that non-financial measures are better performance
indicators in the service industry than financial measures. This is because non-financial
measures are better measures of value and motivation which complement short-run financial
figures as indicators of long-term goals.
Performance is regarded as an output which is aligned to objectives or simply profitability
and is explained in terms of expected behavioural output and also results. Odhuon et. al.,
(2010) asserted that the only worthy performance measure is financial performance because
of its value to shareholders, executives and the market. This measure is an indicator of
organizational success and sustainability because it is the reason for the existence of firms.
The financial success of an organization is a measure of a firm’s performance because it
depicts the ability of an organization to operate above all its costs. Ittner and Larcker (2003)
claimed that a firm’s performance should not be measured by financial performance but also
operational and market indicators. Financial Performance for this research was measured
using profitability and growth in sales while non-financial indicators will be service quality
and customer satisfaction. Non-financial measures have been deemed to be more effective in
motivating managerial performance because they are more reflective of the overall corporate
strategy (Banker et. al. 2005). The hotel industry is a service sector with inseparable
products which demand for different methods of measurement (Bowie and Buttle, 2004).
This means that a hotel is obliged to not only deliver services and products but also to
increase customer satisfaction by providing quality and hence improvement of profits
(Ramsaran-Powdar, 2007). Previous studies on hotel industry have indicated that customer
satisfaction influences hotels competitive advantage and performance (Barsky and Nash,
2003).
RESEARCH METHODOLOGY
Research Design
The study adopted a mixed research design which included qualitative and quantitative
research to establish the associations among the key study variables, to verify results and
enable greater accuracy in measurement. Qualitative data was collected by use of direct
observation and face to face interviews to get the opinions, perceptions and experiences of
the managers in the hospitality industry. The advantage of using both designs is that they
complemented each other and there is also a possibility of getting more valid results through
European Journal of Business and Innovation Research
Vol.2, No.1, pp. 93-119, March 2014
Published by European Centre for Research Training and Development UK (www.ea-journals.org)
102
an address of the inefficiencies of either design (Ramchander, 2004). A cross-sectional
survey design was the specific design that was used. This design has been used by several
authors in their research on the hospitality industry in Kenya (Fwaya et. al., 2012; Wadongo
et. al., 2010; Odhuno et. al., 2010; Kingi, 2013). The advantage of this design over others
was that data was collected less expensively and within a short time. The characteristics of
variables did not change much in the short period of data collection. The purpose of the
cross-sectional design was to establish relationships between drivers and the results of
performance for hotels in Kenyan Coast.
Sampling technique and sample size
Stratified sampling was used to select the hotels for each category for the study, that is, 1 to 5
star hotels. The hotels were obtained from the classification list. The classified hotels were
selected for the study because they have clear and consistent organizational structures which
implied that the results could be generalized without a lot of errors. Kothari (2012) noted
that stratified sampling was used when a population from which a sample was drawn did not
constitute a homogeneous group. This was the case with the categorization of hotels into
different stars. The method also involved dividing the population into a series of relevant
strata which implied that the sample was likely to be more representative (Saunders et. al.,
2009).
Sample Size
To compile the hotel sample size, 123 hotels were selected out of a total population of 180
using Saunders formula for sample size determination. The hotels in each stratum which were
selected for the sample of study were obtained using Neymans (1934) formula.
Data analysis and presentation
Cooper and Schindler (2003) highlighted data analysis as inspection, cleaning, transforming
and modelling data in order to highlight useful information to draw conclusions and to
support decision making. The questionnaires were edited for completeness and consistency
to ensure that respondents completed them as required. The collected data was tested for
normality using Kolmogorrov-Smirrov (KJ) one sample test and Kurtosis. Kurtosis
measured the flatness or peakness of data with a peaked distribution being positive and a flat
one being negative. A normal distribution should have a kurtosis of 0. The collected data
was coded and entered into SPSS to create a data sheet that was used for analysis. The
variables that were measured were defined and labelled. The responses were coded with
numbers including the open ended questions. After data was collected it was screened and
cleaned to find out whether there were errors that could be corrected. Data was analyzed
using quantitative and qualitative techniques. Descriptive statistics were used to describe the
characteristics of collected data. Pearson’s Correlation, Analysis of variance (ANOVA)
and Multiple Regression Analysis using Logit model were used to establish the relationships
among the study variables. The entire hypothesis was tested at 95% confidence level.
Responses were assigned numerical values which were consistent with numerical codes.
Quantitative Analysis
The data analysis processes for quantitative items was done using the statistical package for
social sciences (SPSS) version 20. Qualitative data was measured through correlation
European Journal of Business and Innovation Research
Vol.2, No.1, pp. 93-119, March 2014
Published by European Centre for Research Training and Development UK (www.ea-journals.org)
103
coefficient to establish initial relationships between variables. Karl Pearson’s Zero Order
coefficient of correlation test was used to compare observed data with the data the
researcher had hypothesized (Kothari, 2012). The model used for this analysis was multiple
regression analysis which was as follows:
Y= βo+ β1X1 + β2 X2+ β3 X3 a+β4 X4 + β5 X5 + ε
Where:-
Y = Dependent variable (Hotel performance)
X1 = Independent variable #1(Customer relationship management
strategy)
X2 = Independent variable #2(Strategic planning)
X3 = Independent variable #3(Strategic competitive positioning)
X4 = Independent variable #4(ICT)
X5 = Independent variable #5(Organizational Learning)
β1 –β5 = Regression coefficient for each Independent variable
ε = Random or Stochastic Term.
Hypothesis was tested at 95% confidence level (α = 0.05). A two tailed test was carried out.
DATA ANALYSIS AND DISCUSSION
Test of the hypotheses
The study was based on the premise that strategic management drivers (independent variable)
influence hotel performance (dependent variable). As a result of this, five null hypotheses
were constructed to guide the study as highlighted in the conceptual framework. In order to
establish the statistical significance of the respective hypothesis, simple regression analysis
was used to statistically test the hypotheses as presented in the discussions below. The
hypothesis was tested at 95 percent confidence level (α ═ 0.05).
Effect of Customer relationship management on Organizational performance
In order to assess the influence of Customer relationship management on Organizational
performance, the study had set the following null hypothesis; H01There is no relationship
between Customer relationship management strategy and the performance of hotels in
Kenyan Coast. The aggregate mean score of CRM measures (Independent variable) were
regressed on the aggregate mean score of the organizational performance measures
(dependent variable) and the relevant results presented in table 4.
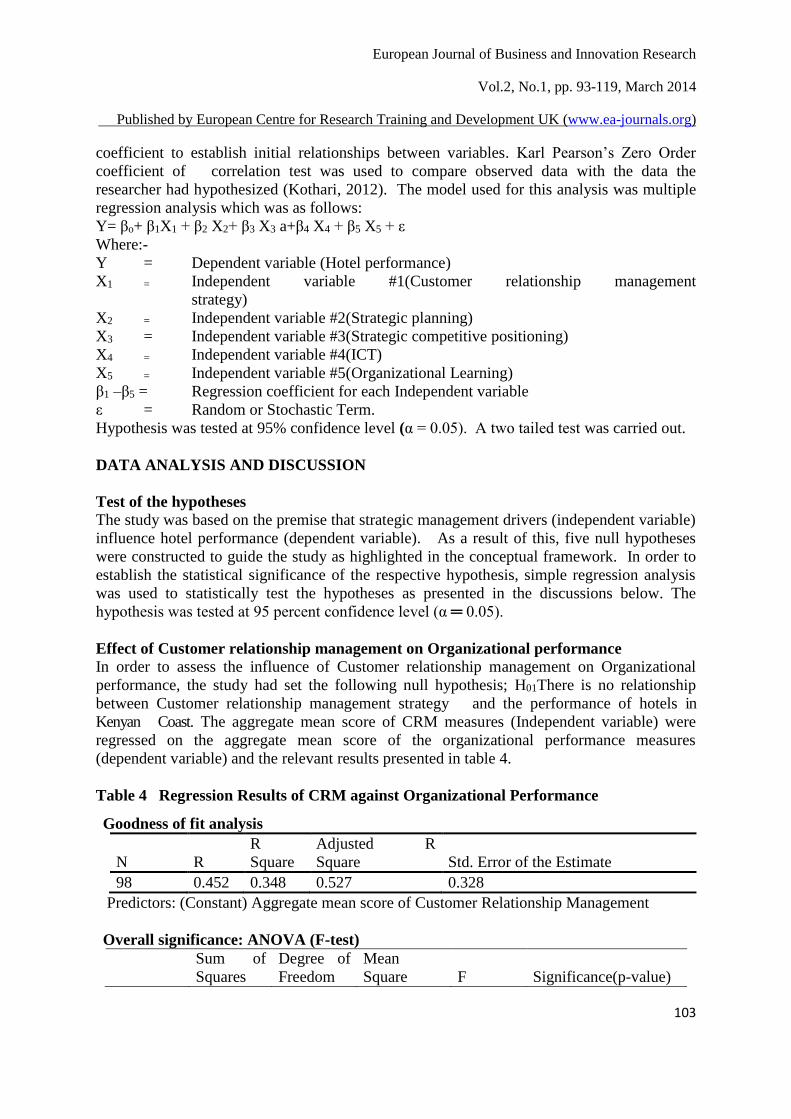
Table 4 Regression Results of CRM against Organizational Performance
Goodness of fit analysis
N R
R
Square
Adjusted R
Square Std. Error of the Estimate
98 0.452 0.348 0.527 0.328
Predictors: (Constant) Aggregate mean score of Customer Relationship Management
Overall significance: ANOVA (F-test)
Sum of
Squares
Degree of
Freedom
Mean
Square F Significance(p-value)
European Journal of Business and Innovation Research
Vol.2, No.1, pp. 93-119, March 2014
Published by European Centre for Research Training and Development UK (www.ea-journals.org)
104
Source: Research Data
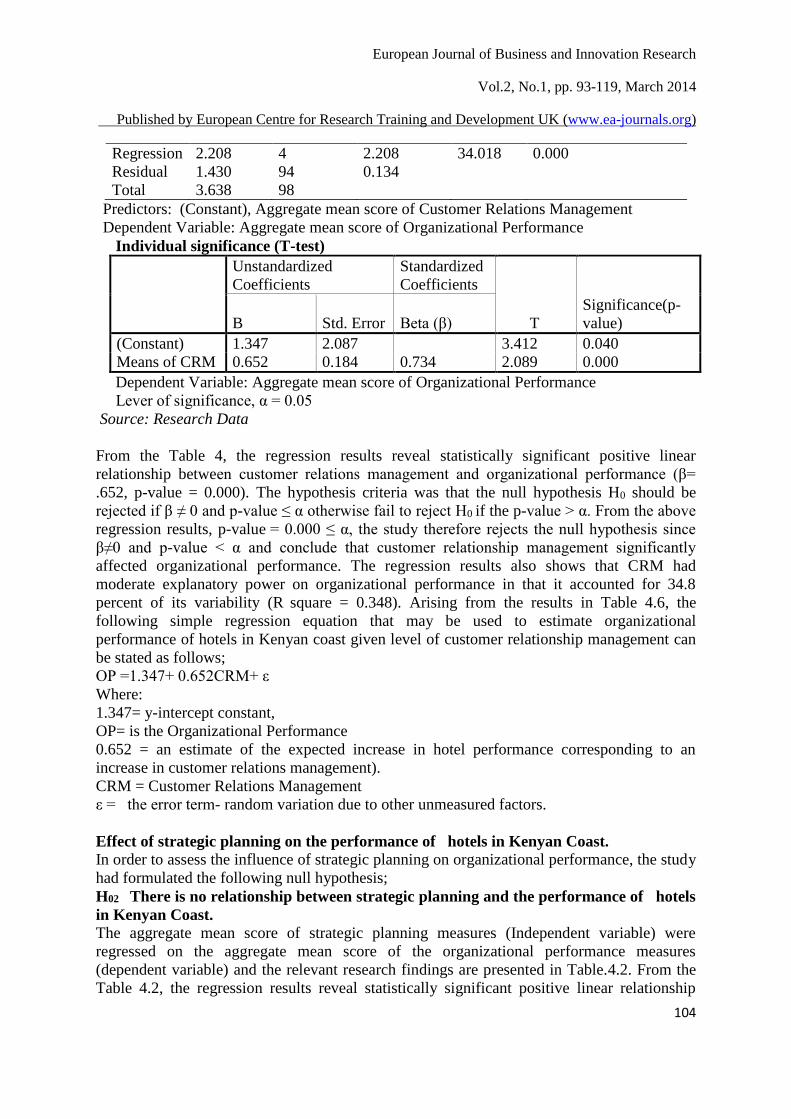
From the Table 4, the regression results reveal statistically significant positive linear
relationship between customer relations management and organizational performance (β=
.652, p-value = 0.000). The hypothesis criteria was that the null hypothesis H0 should be
rejected if β ≠ 0 and p-value ≤ α otherwise fail to reject H0 if the p-value > α. From the above
regression results, p-value = 0.000 ≤ α, the study therefore rejects the null hypothesis since
β≠0 and p-value < α and conclude that customer relationship management significantly
affected organizational performance. The regression results also shows that CRM had
moderate explanatory power on organizational performance in that it accounted for 34.8
percent of its variability (R square = 0.348). Arising from the results in Table 4.6, the
following simple regression equation that may be used to estimate organizational
performance of hotels in Kenyan coast given level of customer relationship management can
be stated as follows;
OP =1.347+ 0.652CRM+ ε
Where:
1.347= y-intercept constant,
OP= is the Organizational Performance
0.652 = an estimate of the expected increase in hotel performance corresponding to an
increase in customer relations management).
CRM = Customer Relations Management
ε = the error term- random variation due to other unmeasured factors.
Effect of strategic planning on the performance of hotels in Kenyan Coast. In order to assess the influence of strategic planning on organizational performance, the study
had formulated the following null hypothesis;
H02 There is no relationship between strategic planning and the performance of hotels
in Kenyan Coast.
The aggregate mean score of strategic planning measures (Independent variable) were
regressed on the aggregate mean score of the organizational performance measures
(dependent variable) and the relevant research findings are presented in Table.4.2. From the
Table 4.2, the regression results reveal statistically significant positive linear relationship
Regression 2.208 4 2.208 34.018 0.000
Residual 1.430 94 0.134
Total 3.638 98
Predictors: (Constant), Aggregate mean score of Customer Relations Management
Dependent Variable: Aggregate mean score of Organizational Performance
Individual significance (T-test)
Unstandardized
Coefficients
Standardized
Coefficients
T
Significance(p-
value)
B Std. Error Beta (β)
(Constant) 1.347 2.087 3.412 0.040
Means of CRM 0.652 0.184 0.734 2.089 0.000
Dependent Variable: Aggregate mean score of Organizational Performance
Lever of significance, α = 0.05
European Journal of Business and Innovation Research
Vol.2, No.1, pp. 93-119, March 2014
Published by European Centre for Research Training and Development UK (www.ea-journals.org)
105
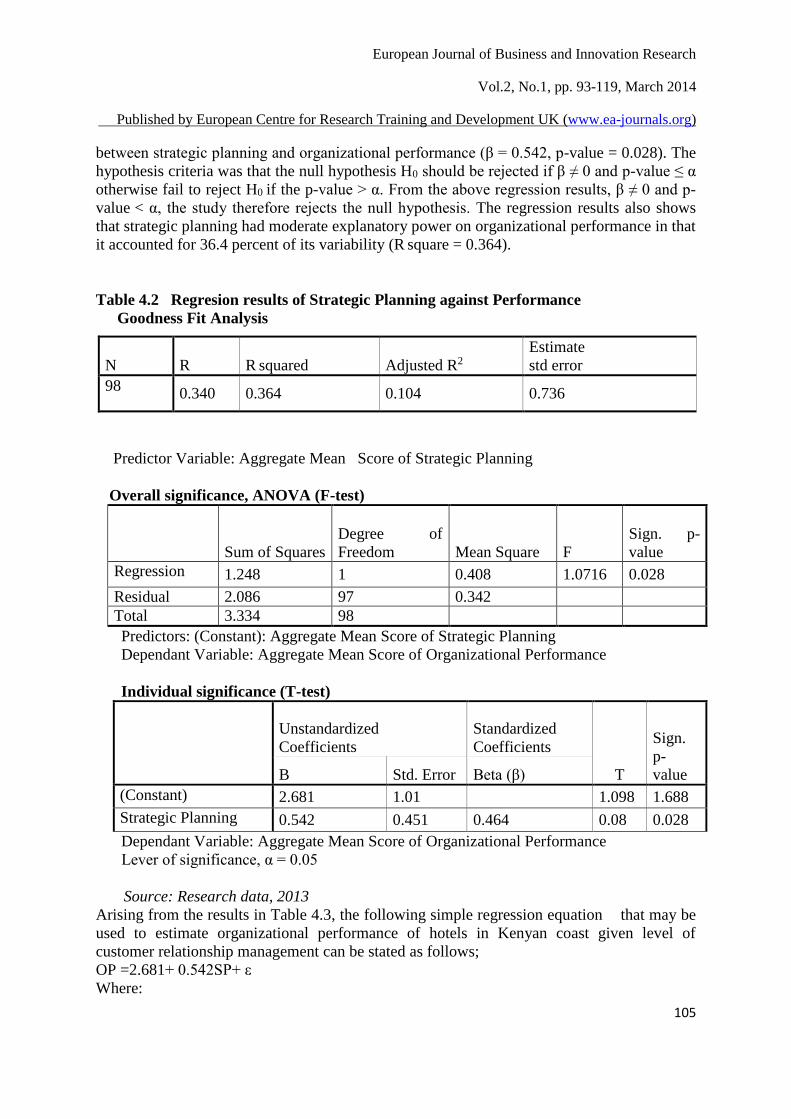
between strategic planning and organizational performance (β = 0.542, p-value = 0.028). The
hypothesis criteria was that the null hypothesis H0 should be rejected if β ≠ 0 and p-value ≤ α
otherwise fail to reject H0 if the p-value > α. From the above regression results, β ≠ 0 and p-
value < α, the study therefore rejects the null hypothesis. The regression results also shows
that strategic planning had moderate explanatory power on organizational performance in that
it accounted for 36.4 percent of its variability (R square = 0.364).
Table 4.2 Regresion results of Strategic Planning against Performance
Goodness Fit Analysis
Predictor Variable: Aggregate Mean Score of Strategic Planning
Overall significance, ANOVA (F-test)
Sum of Squares
Degree of
Freedom Mean Square F
Sign. p-
value
Regression 1.248 1 0.408 1.0716 0.028
Residual 2.086 97 0.342
Total 3.334 98
Predictors: (Constant): Aggregate Mean Score of Strategic Planning
Dependant Variable: Aggregate Mean Score of Organizational Performance
Individual significance (T-test)
Unstandardized
Coefficients
Standardized
Coefficients
T
Sign.
p-
value B Std. Error Beta (β)
(Constant) 2.681 1.01 1.098 1.688
Strategic Planning 0.542 0.451 0.464 0.08 0.028
Dependant Variable: Aggregate Mean Score of Organizational Performance
Lever of significance, α = 0.05
N R R squared Adjusted R2
Estimate
std error
98 0.340 0.364 0.104 0.736
Source: Research data, 2013
Arising from the results in Table 4.3, the following simple regression equation that may be
used to estimate organizational performance of hotels in Kenyan coast given level of
customer relationship management can be stated as follows;
OP =2.681+ 0.542SP+ ε
Where:
European Journal of Business and Innovation Research
Vol.2, No.1, pp. 93-119, March 2014
Published by European Centre for Research Training and Development UK (www.ea-journals.org)
106
2.681 is the y-intercept; constant,
OP is the Organizational performance
0.542= an estimate of the expected increase in organizational performance corresponding to
an increase in use of strategic planning).
SP is strategic planning
ε is the error term- random variation due to other unmeasured factors.
Effect of Strategic Competitive Positioning on Organizational Performance
To assess the effect of strategic competitive positioning on organizational performance of
hotels in Kenyan Coast, the study had set the following null hypothesis:
H03 There is no relationship between strategic competitive positioning and the
performance of hotels in Kenyan Coast.
The aggregate mean score of strategic competitive positioning measures (Independent
variable) were regressed on the aggregate mean score of the organizational performance
measures (dependent variable) and the relevant research findings are presented in Table.4.3.
From the Table 4.3, the regression results reveal statistically significant positive linear
relationship between strategic competitive positioning and organizational performance (β =
0.492, p-value = 0.008). The hypothesis criteria was that the null hypothesis H0 should be
rejected if β ≠ 0 and p-value ≤ α otherwise fail to reject H0 if the p-value > α. From the above
regression results, β ≠ 0 and p-value < α, the study therefore rejects the null hypothesis. The
regression results also shows that strategic competitive positioning had explanatory power on
organizational performance in that it accounted for 49.2 percent of its variability (R square =
0.492).
Table 4.3 Results of Regression of strategic competitive positioning against
organizational Performance
Source: Research data
The regression results in table 4.3 shows that on overall significance, there is a slightly
statistical positive linear relationship between strategic competitive positioning and hotel
performance (β=0.267) and the relationship is statistically significant because the p-value is
less than the set value of α (p – value = 0.008). The hypothesis test criterion was that the null
hypothesis which is H0 should be rejected if β ≠ 0 and p-value < α otherwise fail to reject if β
= 0 and p-value > α. From the regression results, β = 0.267 and p – value = 0.008, the study
therefore rejects the null hypothesis and concludes that there is significant effect of strategic
competitive positioning on organizational performance. The regression results also show that
18.8 percent of hotel performance can be explained by strategic competitive positioning (R
square = 0.188). Arising from the research results in Table 4.8, a simple regression equation
that may be used to estimate hotel performance in Kenyan coast given their existing strategic
competitive positioning can be stated as follows;.
OP = 1.830+ 0.267SCP + ε
Where:
OP is the Organizational Performance
1.830 is the constant intercept of the term (α = 1.830), or the slope coefficient,
0.492 is the beta or the slope coefficient, (estimates of the expected increase in organizational
performance corresponding to an increase in use of strategic competitive positioning).
SCP is Strategic Competitive Positioning
European Journal of Business and Innovation Research
Vol.2, No.1, pp. 93-119, March 2014
Published by European Centre for Research Training and Development UK (www.ea-journals.org)
107
ε is the error term- random variation due to other unmeasured factors.
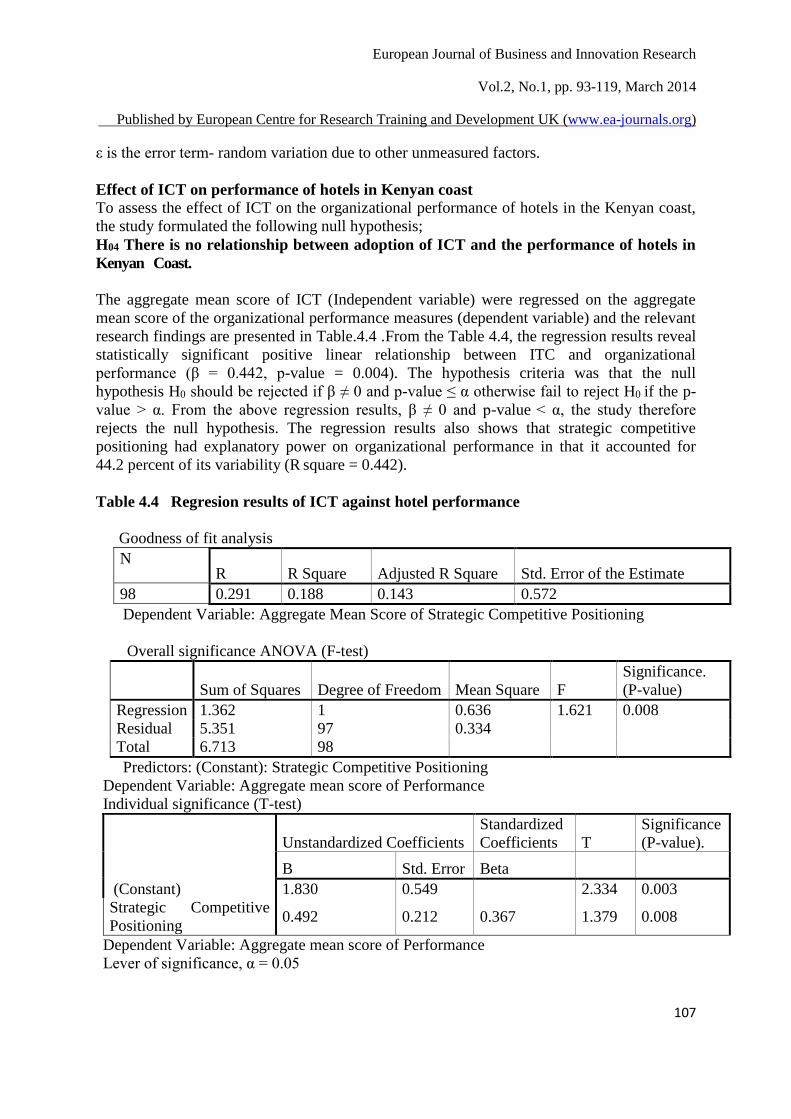
Effect of ICT on performance of hotels in Kenyan coast
To assess the effect of ICT on the organizational performance of hotels in the Kenyan coast,
the study formulated the following null hypothesis;
H04 There is no relationship between adoption of ICT and the performance of hotels in
Kenyan Coast.
The aggregate mean score of ICT (Independent variable) were regressed on the aggregate
mean score of the organizational performance measures (dependent variable) and the relevant
research findings are presented in Table.4.4 .From the Table 4.4, the regression results reveal
statistically significant positive linear relationship between ITC and organizational
performance (β = 0.442, p-value = 0.004). The hypothesis criteria was that the null
hypothesis H0 should be rejected if β ≠ 0 and p-value ≤ α otherwise fail to reject H0 if the p-
value > α. From the above regression results, β ≠ 0 and p-value < α, the study therefore
rejects the null hypothesis. The regression results also shows that strategic competitive
positioning had explanatory power on organizational performance in that it accounted for
44.2 percent of its variability (R square = 0.442).
Table 4.4 Regresion results of ICT against hotel performance
Goodness of fit analysis
N R R Square Adjusted R Square Std. Error of the Estimate
98 0.291 0.188 0.143 0.572
Dependent Variable: Aggregate Mean Score of Strategic Competitive Positioning
Overall significance ANOVA (F-test)
Sum of Squares Degree of Freedom Mean Square F
Significance.
(P-value)
Regression 1.362 1 0.636 1.621 0.008
Residual 5.351 97 0.334
Total 6.713 98
Predictors: (Constant): Strategic Competitive Positioning
Dependent Variable: Aggregate mean score of Performance
Individual significance (T-test)
(Constant)
Unstandardized Coefficients
Standardized
Coefficients T
Significance
(P-value).
B Std. Error Beta
1.830 0.549 2.334 0.003
Strategic Competitive
Positioning 0.492 0.212 0.367 1.379 0.008
Dependent Variable: Aggregate mean score of Performance
Lever of significance, α = 0.05
European Journal of Business and Innovation Research
Vol.2, No.1, pp. 93-119, March 2014
Published by European Centre for Research Training and Development UK (www.ea-journals.org)
108
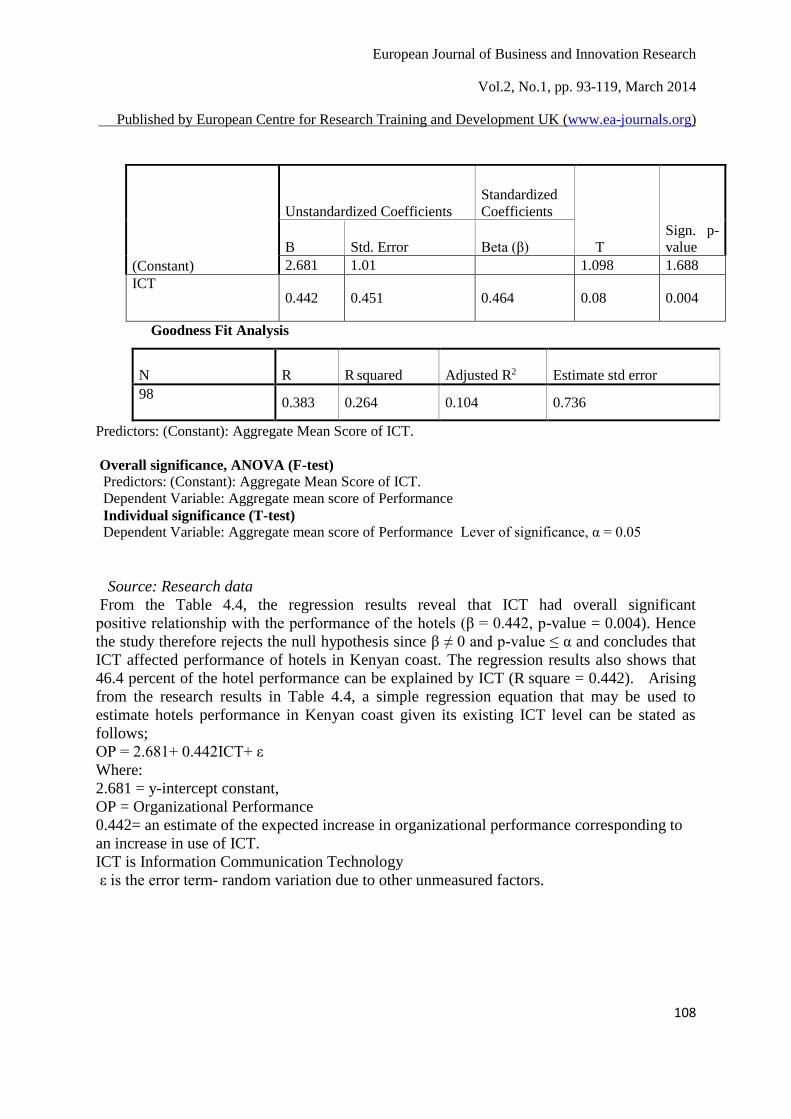
Source: Research data
From the Table 4.4, the regression results reveal that ICT had overall significant
positive relationship with the performance of the hotels (β = 0.442, p-value = 0.004). Hence
the study therefore rejects the null hypothesis since β ≠ 0 and p-value ≤ α and concludes that
ICT affected performance of hotels in Kenyan coast. The regression results also shows that
46.4 percent of the hotel performance can be explained by ICT (R square = 0.442). Arising
from the research results in Table 4.4, a simple regression equation that may be used to
estimate hotels performance in Kenyan coast given its existing ICT level can be stated as
follows;
OP = 2.681+ 0.442ICT+ ε
Where:
2.681 = y-intercept constant,
OP = Organizational Performance
0.442= an estimate of the expected increase in organizational performance corresponding to
an increase in use of ICT.
ICT is Information Communication Technology
ε is the error term- random variation due to other unmeasured factors.
(Constant)
Unstandardized Coefficients
Standardized
Coefficients
T
Sign. p-
value
B Std. Error Beta (β)
2.681 1.01 1.098 1.688
ICT 0.442 0.451 0.464 0.08 0.004
Goodness Fit Analysis
N R R squared Adjusted R2 Estimate std error
98 0.383 0.264 0.104 0.736
Predictors: (Constant): Aggregate Mean Score of ICT.
Overall significance, ANOVA (F-test)
Predictors: (Constant): Aggregate Mean Score of ICT.
Dependent Variable: Aggregate mean score of Performance
Individual significance (T-test)
Dependent Variable: Aggregate mean score of Performance Lever of significance, α = 0.05
European Journal of Business and Innovation Research
Vol.2, No.1, pp. 93-119, March 2014
Published by European Centre for Research Training and Development UK (www.ea-journals.org)
109
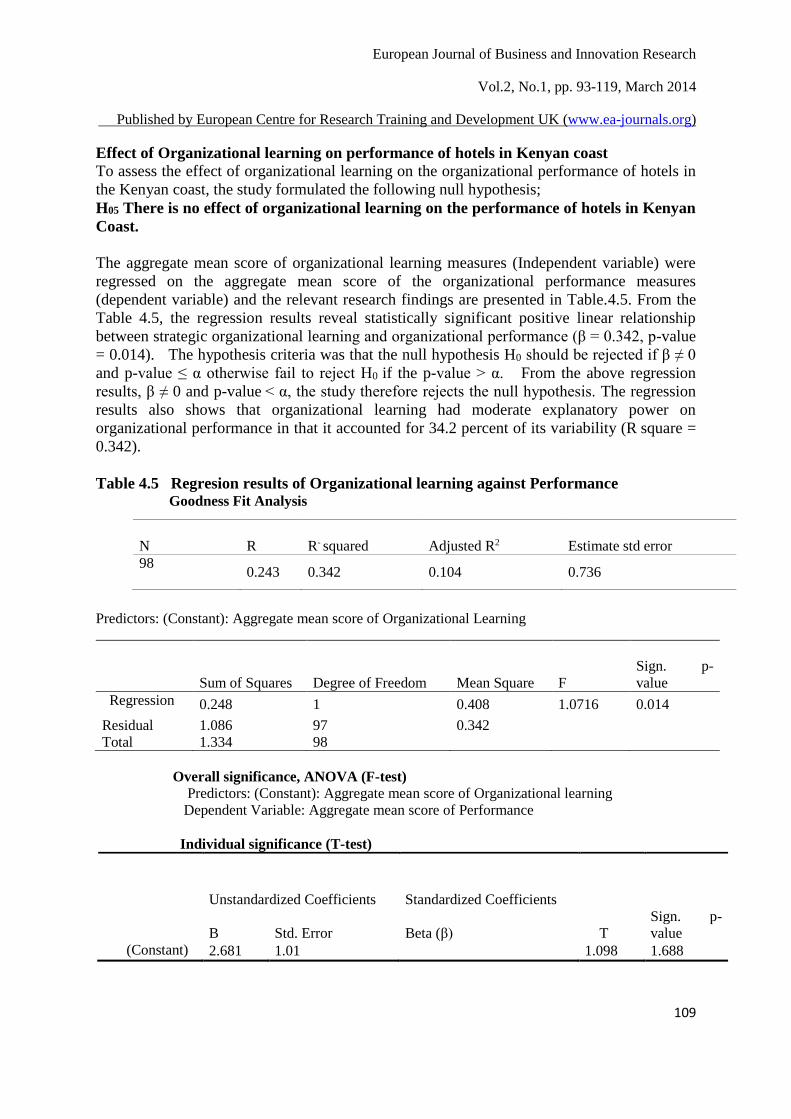
Effect of Organizational learning on performance of hotels in Kenyan coast To assess the effect of organizational learning on the organizational performance of hotels in
the Kenyan coast, the study formulated the following null hypothesis;
H05 There is no effect of organizational learning on the performance of hotels in Kenyan
Coast.
The aggregate mean score of organizational learning measures (Independent variable) were
regressed on the aggregate mean score of the organizational performance measures
(dependent variable) and the relevant research findings are presented in Table.4.5. From the
Table 4.5, the regression results reveal statistically significant positive linear relationship
between strategic organizational learning and organizational performance (β = 0.342, p-value
= 0.014). The hypothesis criteria was that the null hypothesis H0 should be rejected if β ≠ 0
and p-value ≤ α otherwise fail to reject H0 if the p-value > α. From the above regression
results, β ≠ 0 and p-value < α, the study therefore rejects the null hypothesis. The regression
results also shows that organizational learning had moderate explanatory power on
organizational performance in that it accounted for 34.2 percent of its variability (R square =
0.342).
Table 4.5 Regresion results of Organizational learning against Performance Goodness Fit Analysis
Predictors: (Constant): Aggregate mean score of Organizational Learning
Overall significance, ANOVA (F-test)
Predictors: (Constant): Aggregate mean score of Organizational learning
Dependent Variable: Aggregate mean score of Performance
Individual significance (T-test)
Unstandardized Coefficients Standardized Coefficients
T
Sign. p-
value
B Std. Error Beta (β)
(Constant) 2.681 1.01 1.098 1.688
N R R- squared Adjusted R2 Estimate std error
98 0.243 0.342 0.104 0.736
Sum of Squares Degree of Freedom Mean Square F
Sign. p-
value
Regression 0.248 1 0.408 1.0716 0.014
Residual 1.086 97 0.342
Total 1.334 98
European Journal of Business and Innovation Research
Vol.2, No.1, pp. 93-119, March 2014
Published by European Centre for Research Training and Development UK (www.ea-journals.org)
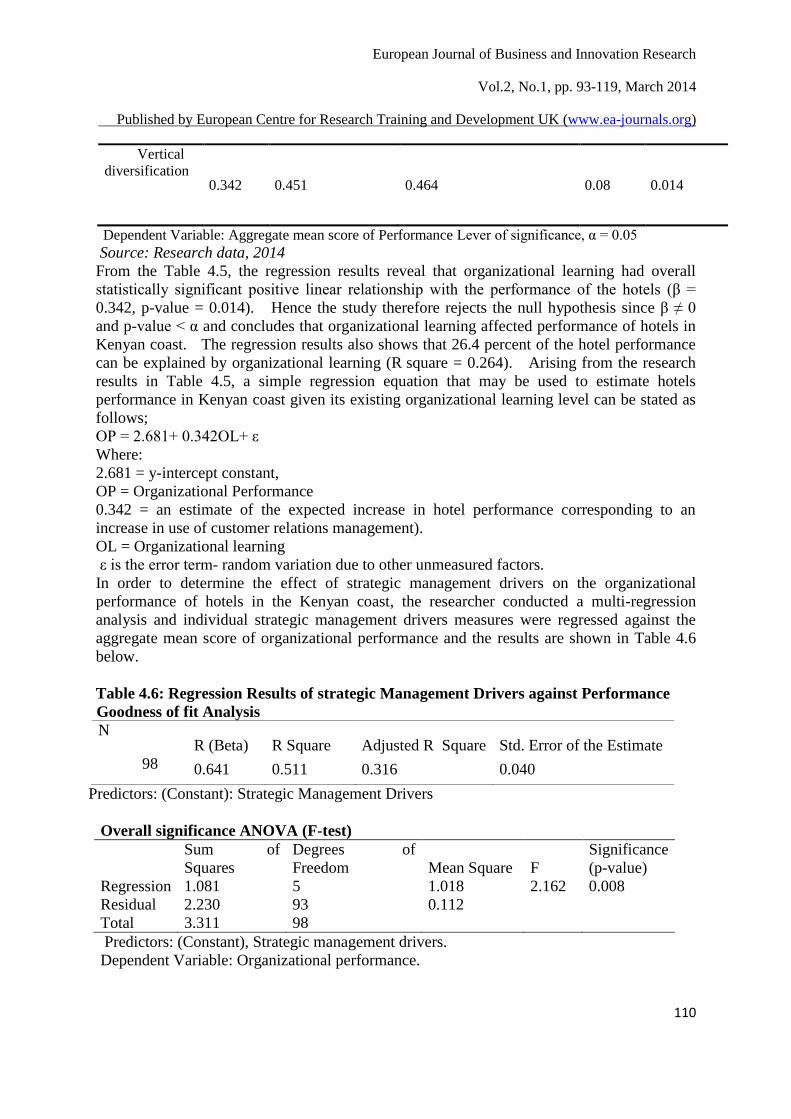
110
Vertical
diversification 0.342 0.451 0.464 0.08 0.014
Dependent Variable: Aggregate mean score of Performance Lever of significance, α = 0.05
Source: Research data, 2014
From the Table 4.5, the regression results reveal that organizational learning had overall
statistically significant positive linear relationship with the performance of the hotels (β =
0.342, p-value = 0.014). Hence the study therefore rejects the null hypothesis since β ≠ 0
and p-value < α and concludes that organizational learning affected performance of hotels in
Kenyan coast. The regression results also shows that 26.4 percent of the hotel performance
can be explained by organizational learning (R square = 0.264). Arising from the research
results in Table 4.5, a simple regression equation that may be used to estimate hotels
performance in Kenyan coast given its existing organizational learning level can be stated as
follows;
OP = 2.681+ 0.342OL+ ε
Where:
2.681 = y-intercept constant,
OP = Organizational Performance
0.342 = an estimate of the expected increase in hotel performance corresponding to an
increase in use of customer relations management).
OL = Organizational learning
ε is the error term- random variation due to other unmeasured factors.
In order to determine the effect of strategic management drivers on the organizational
performance of hotels in the Kenyan coast, the researcher conducted a multi-regression
analysis and individual strategic management drivers measures were regressed against the
aggregate mean score of organizational performance and the results are shown in Table 4.6
below.
Table 4.6: Regression Results of strategic Management Drivers against Performance
Goodness of fit Analysis
N R (Beta) R Square Adjusted R Square Std. Error of the Estimate
98 0.641 0.511 0.316 0.040
Predictors: (Constant): Strategic Management Drivers
Overall significance ANOVA (F-test)
Sum of
Squares
Degrees of
Freedom Mean Square F
Significance
(p-value)
Regression 1.081 5 1.018 2.162 0.008
Residual 2.230 93 0.112
Total 3.311 98
Predictors: (Constant), Strategic management drivers.
Dependent Variable: Organizational performance.
European Journal of Business and Innovation Research
Vol.2, No.1, pp. 93-119, March 2014
Published by European Centre for Research Training and Development UK (www.ea-journals.org)
111
Individual significance (T-test)
Unstandardized
Coefficients
Standardized
Coefficients
T
Significance
(p-value) Beta Std. Error (r)
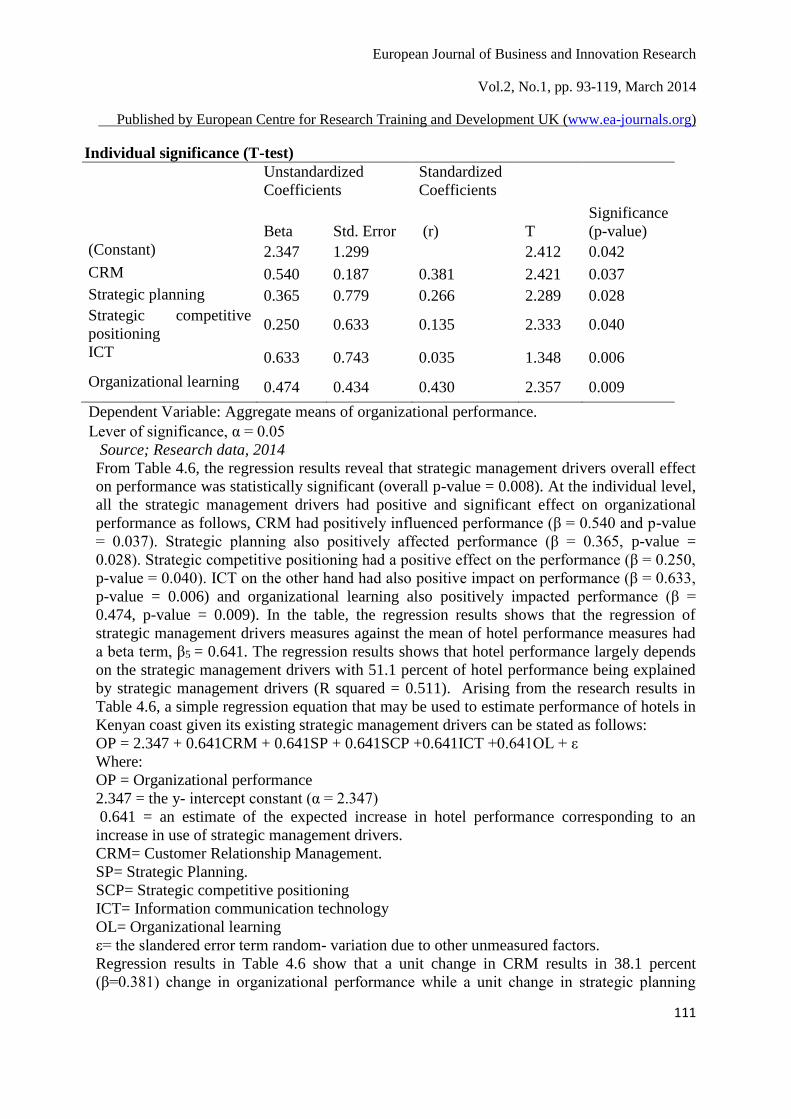
(Constant) 2.347 1.299 2.412 0.042
CRM 0.540 0.187 0.381 2.421 0.037
Strategic planning 0.365 0.779 0.266 2.289 0.028
Strategic competitive
positioning 0.250 0.633 0.135 2.333 0.040
ICT 0.633 0.743 0.035 1.348 0.006
Organizational learning 0.474 0.434 0.430 2.357 0.009
Dependent Variable: Aggregate means of organizational performance.
Lever of significance, α = 0.05
Source; Research data, 2014
From Table 4.6, the regression results reveal that strategic management drivers overall effect
on performance was statistically significant (overall p-value = 0.008). At the individual level,
all the strategic management drivers had positive and significant effect on organizational
performance as follows, CRM had positively influenced performance (β = 0.540 and p-value
= 0.037). Strategic planning also positively affected performance (β = 0.365, p-value =
0.028). Strategic competitive positioning had a positive effect on the performance (β = 0.250,
p-value = 0.040). ICT on the other hand had also positive impact on performance (β = 0.633,
p-value = 0.006) and organizational learning also positively impacted performance (β =
0.474, p-value = 0.009). In the table, the regression results shows that the regression of
strategic management drivers measures against the mean of hotel performance measures had
a beta term, β5 = 0.641. The regression results shows that hotel performance largely depends
on the strategic management drivers with 51.1 percent of hotel performance being explained
by strategic management drivers (R squared = 0.511). Arising from the research results in
Table 4.6, a simple regression equation that may be used to estimate performance of hotels in
Kenyan coast given its existing strategic management drivers can be stated as follows:
OP = 2.347 + 0.641CRM + 0.641SP + 0.641SCP +0.641ICT +0.641OL + ε
Where:
OP = Organizational performance
2.347 = the y- intercept constant (α = 2.347)
0.641 = an estimate of the expected increase in hotel performance corresponding to an
increase in use of strategic management drivers.
CRM= Customer Relationship Management.
SP= Strategic Planning.
SCP= Strategic competitive positioning
ICT= Information communication technology
OL= Organizational learning
ε= the slandered error term random- variation due to other unmeasured factors.
Regression results in Table 4.6 show that a unit change in CRM results in 38.1 percent
(β=0.381) change in organizational performance while a unit change in strategic planning
European Journal of Business and Innovation Research
Vol.2, No.1, pp. 93-119, March 2014
Published by European Centre for Research Training and Development UK (www.ea-journals.org)
112
results in 26.6 percent (β=0.266) change in organizational performance .On the other hand, a
unit change in strategic competitive positioning results in 13.5 percent (β=0.135) change in
hotel performance and ICT if implemented well will affect hotel performance by 51.1
percent. The study results presented in this chapter have utilized a variety of descriptive and
inferential statistics.
SUMMARY, CONCLUSION AND RECOMMENDATIONS
Summary and Key Findings
This study on the effect of strategic management drivers on organizational performance in
Kenyan coast had five specific objectives which were later developed into null hypotheses
and statistically tested using the Karl Pearson’s zero order. The discussions in the following
sections highlight the key findings of the study based on the hypotheses.
The first objective was to establish the effect of customer relationship management on
organizational performance. The study found out that CRM significantly and positively
affected organizational performance with 34.8 percent of the organizational performance (R
squared = 0.348) being explained by CRM.
The second objective was to determine the effect of strategic planning on performance of
hotels in Kenyan coast. The study found out that strategic planning significantly and
positively affected firm organizational performance with 36.4 percent of the hotel
performance (R squared = 0.364) being explained by strategic planning.
The third objective was to establish the effect of strategic competitive positioning (SCP) on
organizational performance in Kenya coast. The study found out that strategic competitive
positioning had significant and positive effect on organizational performance with 18.8
percent of the hotel performance (R squared = 0.188) being explained by strategic
competitive positioning.
The fourth objective was to establish the effect of ICT on organizational performance in
Kenyan coast. The study found out that ICT had significant and positive effect on
organizational performance with 26.4 percent of the hotel performance (R squared = 0.264)
being explained by ICT.
The fifth and final objective was to establish the effect of organizational learning(OL) on
organizational performance in Kenyan coast. The study found out that organizational learning
had a significant and positive effect on organizational performance with 34.2 percent of the
hotel performance (R squared = 0.342) being explained by ICT.
Managerial and theoretical implications
The results of this research paper should be of interest to managers of hotels that implement
strategic management drivers and to management consultants. The first implication of the
study is that managers should strive to enhance their strategic management drivers as this not
only improves their hotels’ ability to create superior customer value but also generally
enhances hotel performance. The study shows that strategic management drivers significantly
enhance both the qualitative and quantitative aspects of hotel performance which were
assessed through customer behavioural outcomes, market and financial outcomes
respectively. Finally, this study makes a useful contribution to the advancement of academic
knowledge on strategic management drivers from the context of sub-Saharan African setting
and particularly on hotels in Kenya. The extant literature decries the lack of scholarly
European Journal of Business and Innovation Research
Vol.2, No.1, pp. 93-119, March 2014
Published by European Centre for Research Training and Development UK (www.ea-journals.org)
113
contribution on strategic management drivers from Sub-Saharan Africa and on the hotel
sector. The study should encourage more scholarly output on strategic management drivers
and business strategy from Sub-Saharan Africa.
Conclusion
The study was based on the premise that strategic management drivers influence
organizational performance. The study results supported this premise in that strategic
management drivers (CRM, strategic planning, ICT, strategic competitive positioning and
organizational learning) were found to significantly and positively affect organizational
performance.
Recommendations
Based on the findings and conclusions of the study, the recommendations made were
That there is need for the hotels in Kenyan coast to employ strategic management drivers in
their operations as this improves their level of performance. Strategic management drivers
have been found by this study to have a great effect on improving organizational
performance.
Limitations of the study and Suggestions for Further Research
Although the study found out those strategic management drivers improves hotel
performance, the study did not come up with any optimum point at which the hotel should
employ them. The study also did not come up with a way of combining the various forms of
strategic management drivers’ mix. It is on the above bases that this study recommends
further studies to establish an optimum point or the strategic management drivers’ index for
the hotels.
Finally, the study relied on self reported data mainly from only one industry perspective
alone and used a single industry setting. Further research could seek to address this
limitation by use of multiple industries setting to conduct their studies and this would
enhance the validity and generalization of the research findings. Although this study has
mentioned some limitations, the findings are useful for managerial and theoretical
considerations. The study will assist intellectuals and be a reference for future studies and
practitioner undertakings on strategic management drivers and organizational performance
REFEREENCES
Allen, R.S., & Helms, M. M. (2006). Linking Strategic Practices and
Organizational Performance to Porter’s generic Strategies. Business
Process Management, 12(4), 433-454.
Akama, J.S. (2007). Tourism development in Kenya: Problems and policy
alternatives. Progress in Tourism and Hospitality Research 3(2), 95-
105.
Akan, O., Allen, S., Helms, M. & Spralls III, A. (2006). Critical tactics for
implementing Porter’s generic Strategies. The Journal of Business
Strategy, 27(1), 43-53.
Armstrong, M. (2010). A handbook of personnel management practice.
London: Kogan Page
European Journal of Business and Innovation Research
Vol.2, No.1, pp. 93-119, March 2014
Published by European Centre for Research Training and Development UK (www.ea-journals.org)
114
Balogun, J. (2003). From blaming the middle to harnessing its potential:
creating change intermediaries. British Journal of Management. 14(1),
69-83
Banker, D., Potter, G. & Srinivasan, D. (2005). Association of non financial
performance measures with the financial performance of lodging
chain. Cornell Hotel and Restaurant Administrative quarterly, 46(4),
394-412.
Barkhi, R. & Daghfous, A, (2009). The Strategic Management of Information
Technology in UAE hotels: An exploratory study of TQM, SCM, and
CRM implementations. Technovation, ICD, 588-595.
Barney, J.B. & Hesterly, W.S. (2006) Strategic Management and Competitive
advantage: concepts and Cases. Upper Saddle River;
Pearson/Prentice Hall.
Barsky, J., & Nash, L. (2003). Customer Satisfaction: applying concepts to
Quarterly, 44(5), 24-32.
Bowie, D., & Buttle, F. (2004). Hospitality Marketing: An introduction
Oxford: Elsevier Buterworth – Heinemann.
Cagna, J.D, (2007). The six core values of innovation.
www.principledinnovation.com
Cappelli, P. (2005). Fragmenting work: blurring organizational boundaries
and disordering hierarchies. Administrative Science quarterly, 50(2),
299-301.
Chen, J. & Popowich, K. (2003). Understanding customer relationship
management (CRM): People, Process and Technology. Business
Process Management Journal. 9(5), 672-688
Coltman, T. (2007). Why build a customer relationship management capability?
The Journal of strategic Information Systems, 16(3), 301-320.
Dan, K. (2009). The scalability of H. Igor Ansoff’s Strategic Management
Principles for Small and Medium sized firms. Journal of Management
Research. 1(1), 1-26.
DeNisi, A.S., Itih, M.A. & Jackson, S.E. (2003). The knowledge Based
Approach to Sustainable Competitive Advantage. New York: Oxford
University Press.
Denson, D. (2008) Organisational Culture and Innovation. Understand the
Link. Research notes, 2(2) .www.denisonculture .com.
Dincer, O., Tatoglu, E. & Glaister, K. (2006). The Strategic Planning Process
in the Management of Tourism. Tourism Management. 11(3), 206-
213.
Dobini, B. (2003). Creating a Strategy Implementation Environment. Business
Horizons, 46(2), 43-46.
Epstein, M.J. (2004). The Drivers and Measures of Success in High
Performance Organizations In Epstein, M.J. and J.F. Manzoni,
(eds.). Performance Measurement and Management Control:
Superior Organizational Performance. Studies in Managerial and
Financial Accounting. 14, Elservier. Amsterdam.
European Journal of Business and Innovation Research
Vol.2, No.1, pp. 93-119, March 2014
Published by European Centre for Research Training and Development UK (www.ea-journals.org)
115
Fwaya, O.,Odhuno, E., Kambona, O. & Odhuon, O. (2012).
Relationships between drivers and results of performance in the
Kenyan Hotel Industry. Journal of Hospitality Management and
Tourism, 3(3), 46-54.
Galbreath, J. (2010). Drivers of Corporate Social Responsibility: the role of
formal strategic planning and firm culture. British Journal of
Management, 2(1) -511-525.
Government of Kenya (2007), Kenya vision 2030: A Globally Competitive and
Prospective Kenya, Nairobi: Government Printers.
Government of Kenya (2003), Hotel Classification Systems. Kenya, Nairobi:
Government Printer.
Ham, S., Kim, W. & Jeong, S. (2005). Effect of Information Technology on
Performance In upscale hotels, International. Journal of Hospitality
Management. 24(2), 281-294.
Harrison J.S. (2003). Strategic Analysis for the Hospitality Industry. Cornell
Hotel and Restaurant Administration Quarterly, 44 (2), 139-152.
Iravo, M., Ongori, J. & Munene, C. (2013). Factors affecting the performance of
hotels and restaurants in Kenya. A case of Kisii County. Interdisciplinary
Journal of Contemporary Research in Business, 4(12), 897-928.
Ittner, C. & Larcker, G. (2003) Coming up short on non-financial performance
measurement. Harvard Business Review, 1(12), 88-95.
Jain, R. Jain, S. & Dhar, U. (2007). CUREL: A scale for Measuring
Customer Relationship Management Effectiveness in Service Sector,
Journal of Services Research, 7(1), 37-57.
Jehad, A. & Adel, K. (2013). Strategic Planning and Organizational
Effectiveness in Jordanian Hotels. International Journal of Business
and Management. 8(1), 11-25.
Johnson, G. & Scholes, K. (2003). Exploring corporate strategy. 6th Edition.
Prentice-Hall, New Delhi.
Jones, D., Mark, B. & Sim, J. (2007). A new look at the Antecedents and
consequences of relationships Quality in the Hotel Service
Environment. Service Marketing Quarterly, 28(3), 15-31.
Kamau, F. (2008). Strategic Planning Practices Adopted by Tour and Travel
firms in Kenya. Unpublished MBA Thesis. University of Nairobi.
Kenya Law Report. (2012) Kenya Institute of Management. www.kenyalaw.org>NCLR.
Home>Professional Affiliations
Kingi, W. (2013). Effect of Human Resource Development on the
Performance of Tourist Class Hotels in Malindi District, Kenya. firms I Kenya.
Unpublished Phd. Thesis. Jomo Kenyatta Univeresity
of Agriculture and Technology.
Kothari, C. (2012). Research Methodology Methods and Techniques. New
Age International Publishers: New Delhi.
Kuria K., Wanderi M. & Ondigi, A. (2012). Factors Influencing labour
Turnover in three and Five Star- related hotels in Nairobi, Kenya.
European Journal of Business and Innovation Research
Vol.2, No.1, pp. 93-119, March 2014
Published by European Centre for Research Training and Development UK (www.ea-journals.org)
116
International Journal of Humanities and Social Sciences,1(20),195-
201
Langerak, F. & Verhoef, P. (2003). Strategically embedding CRM, Business
Strategy Review, 14(4), 73-80.
Lau, K., Lee, K. & Ho, Y. (2005). Text Mining for hotel industry. Cornell
Hotel and Restaurant Administration Quarterly 46(3), 344-362.
Law, R. & Jogaratnam, G. (2005). A study of hotel information technology
applications. International Journal of Contemporary Hospitality
Management. 17(2), 170-180.
Lo, Y. (2012). Back to Hotel Strategic Management 101: An examination of
hotels, implementation of Porter’s generic strategy in China. The
Journal of International Management Studies 7(1), 56-69.
Mibei, W.K. (2007). Competitive Strategies Adopted by Travel agencies in
Kenya, Unpublished MBA Thesis, University of Nairobi.
Minal, B. & Kasim. A. (2009). Linking CRM Strategy, Customer performance
measures and performance in the Hotel industry. International Journal
of Economics and Management, 3(2), 297-316.
Moullin, M. (2007). Linking Performance Measurement and Organizational
excellence. International Journal of Health Care Quality assurance.
20(3), 181-183.
Mukulu, E., Nteete, K., & Namusonge, G. (2012). Pedagogical Approaches
Determining the Performance of Entrepreneurship Education in Kenya
Public Universities. International Jornal of Humanities and Social
Science, 2(13)
Murray, P. & Donegan, K. (2003). Empirical Linkages between firm
competencies and Organizational Learning as a determining factor in
Business Performance. The Learning Organization, 12(3), 227-245.
Namusonge, G.S., Kabare, K. & Mutua, S. (2012). Role of Human Resource
Management Practices on performance of financial cooperatives based
in Nairobi County, Kenya International Journal of Humanities and
Social Science. 2(22), 289-297.
Neymans, J. (1934). On the two different aspects of the representative method.
The method of stratified sampling and the method of purposive selection.
Journal of the Royal Statistical Society. (97),558-606.
Neely, A. (2005). The evolution of performance Measurement Research
development in the Last Decade and a Research agenda for the Next.
Journal of Operations & Production Management.
25(12), 1264-1277.
Njuguna, J. (2009). Strategic Positioning for Sustainable Competitive
Advantage: An Organisational Learning Approach. KCA Journal of
Business Management.
Nzuve, M. & Nyaega, G. (2011). Application of the Balanced Scorecard in
performance measurement at Essar Telecom Kenya Limited.
Unpublished MBA Project, University of Nairobi.
European Journal of Business and Innovation Research
Vol.2, No.1, pp. 93-119, March 2014
Published by European Centre for Research Training and Development UK (www.ea-journals.org)
117
Odhuno, L., Kambona, O., Othuno, E. & Wadongo, B. (2010). Key performance
indicators in the Kenyan hospitality industry. A Managerial
perspective. Benchmarking. An International Journal, 17 (6), 858-875.
Ongore, V. & Kobonyo, P. (2011). Effects of selected corporate Governance
characteristics on Firm Performance: Empirical Evidence from Kenya.
International Journal of Economics and Financial
Issues, 1(3), 99-122.
Oketch R., Wadawi K., Brester, N. & Needetea, A. (2010). The role of hotels
in Consumption of Cultural Tourism in Kenya. Journal of Tourism
(8), 34-39.
Pearce, J.A. & Robinson, R.B. (2008). Strategic Management: Formulation,
Implementation, and Control. (10th ed.). New York. McGraw-Hill,
Irwin.
Peteraf, A. & Barney, B. (2003). Unraveling the resource-based tangle.
Management and Decision Economics, 24(1), 309-323.
Peteraf, A. & Bergen, M. (2003). Scanning dynamic competitive landscapes: A
market-based and resource-based framework: Strategic Management
Journal, 24(1), 1027-1041.
Pinea,R. & Phillips,P.(2005). Performance Comparisons of Hotels in China.
Hospitality Management. 24(1), 57-73.
Piccoli, G., O’connor, P., Capaccioli, C. & Alvarez, R. (2008). CRM: A driver
for change in the structure of the U.S.Lodging Industry, Cornell Hotel
and Restaurant. Administration Quarterly, 42(6), 10-21.
Porter, M.E. (2004). Building the Microeconomic Foundations of Prosperity:
Findings from the business competitiveness index. In Sala-i-Martin,
X. (ed.). The Global Competitiveness Report 2003 – 2004. Oxford
University Press. New York.
Porter, M.E. (2009). Global Business. South-Western Cengage Learning.
Raisinghani, M.S., Tan, E., Untama, J.A. & Weiershaus, H. (2005). CRM
Systems in German Hospitals. Illustrations of Issues & Trends.
Journal of Cases on Information Technology. 7(4), 1-26.
Ramchander, P. (2004). Towards the Responsible Management of the Socio-
Cultural impact of Township Tourism. Retrieved on 5th September,
2013,.http://upetd.up.ac.za/thesis/available/etd
08130507/unrestricted/05chapter5.pdf
Ramsaran – Fowdar, R. (2007). Developing a Service quality questionnaires
for the hotel industry in Mauritius. Journal of vacation marketing.
13(1), 19-27.
Richard, P., Devinney, T., Yip, G. & Johnson, G. (2009). Measuring
Organizational Performance: Towards Methodological best practice.
Journal of Management. 35(3), 718-804.
Richard, S. & Marilyn, M. (2006). Linking Strategic Practices and
Organizational Performance to Porters Generric Strategies. Business
Process Management Journal. 12(4), 433-454.
European Journal of Business and Innovation Research
Vol.2, No.1, pp. 93-119, March 2014
Published by European Centre for Research Training and Development UK (www.ea-journals.org)
118
Sabah, A., Laith, A. & Manar, J. (2012). Effect of Core Competence on
Competitive Advantage and Organizational Performance. 7(1), 192-
204.
Saunders, M., Lewis, P. & Thornhill, A. (2009). Research Methods for
Business Students 5th Edn.). New Jersey: Prentice Hall.
Sengupta, K., Haser, D.R. & Cook, L.S. (2006). Manufacturing and Service
Supply Chain performance: a comparative Analysis. Journal of Supply
chain Management 42(4), 4-15.
Sharma, A. & Upneja, A. (2005). Factors influencing financial performance of
small hotels in Tanzania. International Journal of Contemporary
Hospitality Management, 17(6), 504-515.
Shimpton, H., West, M.A., Dawson, J., Birdi, K.B. &Patterson, M. (2006).
HRM as a predictor of Innovation. Human resource Management
Journal, 16(1), 3-27.
Sirawit, S., Nazrui, I. & Do Ba, K. (2011). Does ICT adoption enhance hotel
performance. Journal of Hospitality and Tourism Technology. 2(1),
34-39.
Tavitiyaman, P., Qu, H. & Zhang, H. (2011). The Impact of Industry force
factors on resource competitive strategies and hotel performance.
International Journal of Hospitality Management. 3(1), 1-10.
Uzel, J. (2012). The effect of strategic value-based management on the
performance of organizations in Coast Province, Kenya. International
Journal of Business & social Science, 3(16), 262-270.
Wadongo, B., Odhuno, E. & Kambona, O. (2010). Managerial roles and choice
of performance measures in the Kenyan Five- Star hotels using a
cross-sectional correlation design. Managing Leisure. 15(11), 17-31.
Wang, C.L. & Ahmed, P.K. (2007). Dynamic Capabilities: A Review and
Research agenda. The International Journal of Management
Reviews. 9(1), 31-51.
Waudo, J. & Kamau, W. (2012). Hospitality Industry employers expectations of
employees competencies In Nairobi Hotels. Journal of Hospitality
Management and Tourism 3(4), 55-63.
Wheelen, T.L. & Hunger, J.D. (2008). Strategic Management & Business Policy.
Massachusetts. Addison-Wesley Publishing Company
Winter, S. (2003). The satisfying principle in capability Learning. Strategic
Management Journal, 2(1), 981-996.
Wong, H., Page D., Abello, R. & Pang, P. (2007). Explorations of Innovation
and Business Performance using linked firm-level data. Research
paper Cat.no.1351.0.55.020. Australian Bureau of Statistics:
Canberra.
Zablah, A.R., Bellenger, D.N. & Johnsoton, N.J. (2004). An evaluation of
divergent perspectives on customer relationship. Towards a common
understanding of an emerging phenomenon, Industrial Marketing
Management, 33(1), 475-548.

European Journal of Business and Innovation Research
Vol.2, No.1, pp. 93-119, March 2014
Published by European Centre for Research Training and Development UK (www.ea-journals.org)
119
Zaheer, A., Sabir, M. & Suhail, A. (2011). Link between product Innovation and
Non-technological Organization Performance. Asian Journal of
Business Management 3(4), 287-293.
Zander, I. & Zander, V. (2005). The Inside Track: On the important (But
Neglected) Role of Customers in the Resource-Based View of
Strategy and Firm Growth. Journal of Management Studies, 42(8), pp
1519-1548.
Zikmund, W., Babin, J., Carr, C. & Griffin, M. (2009). Business Research
Melbods (8th edn.) USA: South Western College Publishing.