Embed Size (px)
Citation preview

DOT HS 812 176 June 2015
Effects of Tire Rolling Resistance On Class 8 Tractor-Trailer Stopping Distance
Disclaimer
This publication is distributed by the U.S. Department of Transportation, National Highway Traffic Safety Administration, in the interest of information exchange. The opinions, findings, and conclusions expressed in this publication are those of the author and not necessarily those of the Department of Transportation or the National Highway Traffic Safety Administration. The United States Government assumes no liability for its content or use thereof. If trade or manufacturer’s names or products are mentioned, it is because they are considered essential to the object of the publication and should not be construed as an endorsement. The United States Government does not endorse products or manufacturers.
Suggested APA Format Citation: Lascurain, M. B. (2015, June). Effects of tire rolling resistance on Class 8 tractor-trailer stopping distance. (Report No. DOT HS 812 176). Washington, DC: National Highway Traffic Safety Administration.
i
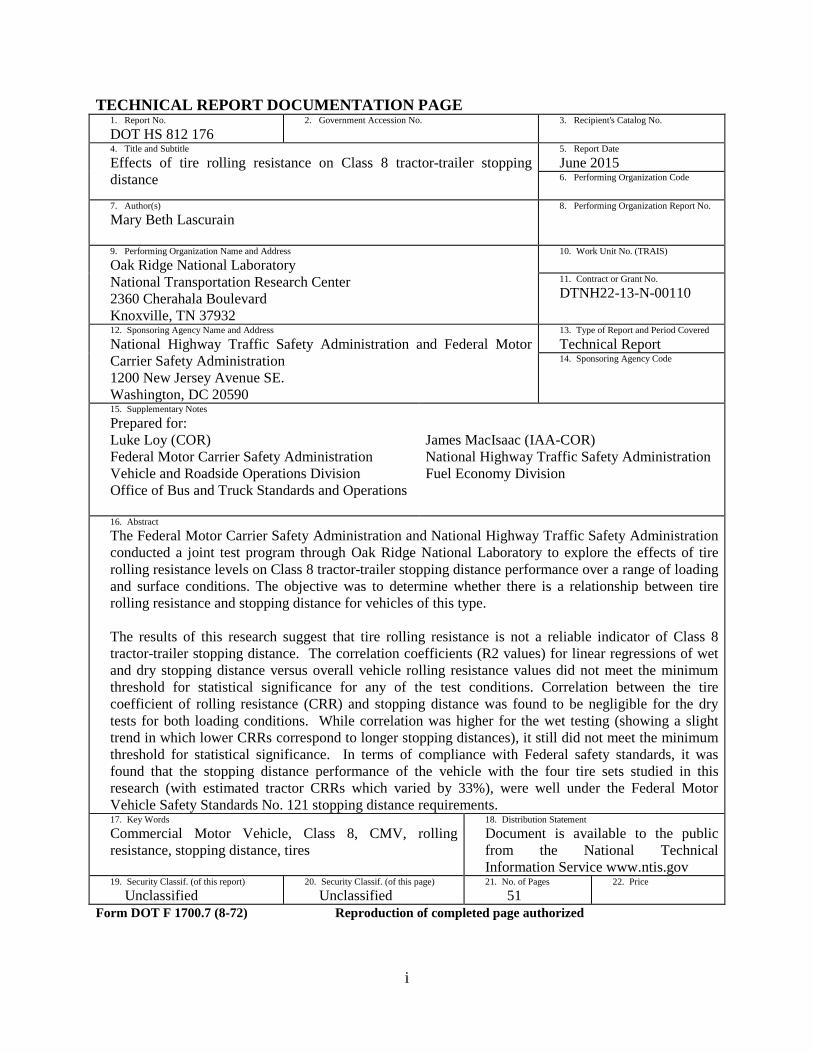
TECHNICAL REPORT DOCUMENTATION PAGE 1. Report No.
DOT HS 812 176 2. Government Accession No. 3. Recipient's Catalog No.
4. Title and Subtitle
Effects of tire rolling resistance on Class 8 tractor-trailer stopping distance
5. Report Date
June 2015 6. Performing Organization Code
7. Author(s)
Mary Beth Lascurain
8. Performing Organization Report No.
9. Performing Organization Name and Address
Oak Ridge National Laboratory National Transportation Research Center 2360 Cherahala Boulevard Knoxville, TN 37932
10. Work Unit No. (TRAIS)
11. Contract or Grant No.
DTNH22-13-N-00110
12. Sponsoring Agency Name and Address
National Highway Traffic Safety Administration and Federal Motor Carrier Safety Administration 1200 New Jersey Avenue SE. Washington, DC 20590
13. Type of Report and Period Covered
Technical Report 14. Sponsoring Agency Code
15. Supplementary Notes
Prepared for: Luke Loy (COR) Federal Motor Carrier Safety Administration Vehicle and Roadside Operations Division Office of Bus and Truck Standards and Operations
James MacIsaac (IAA-COR) National Highway Traffic Safety Administration Fuel Economy Division
16. Abstract
The Federal Motor Carrier Safety Administration and National Highway Traffic Safety Administration conducted a joint test program through Oak Ridge National Laboratory to explore the effects of tire rolling resistance levels on Class 8 tractor-trailer stopping distance performance over a range of loading and surface conditions. The objective was to determine whether there is a relationship between tire rolling resistance and stopping distance for vehicles of this type. The results of this research suggest that tire rolling resistance is not a reliable indicator of Class 8 tractor-trailer stopping distance. The correlation coefficients (R2 values) for linear regressions of wet and dry stopping distance versus overall vehicle rolling resistance values did not meet the minimum threshold for statistical significance for any of the test conditions. Correlation between the tire coefficient of rolling resistance (CRR) and stopping distance was found to be negligible for the dry tests for both loading conditions. While correlation was higher for the wet testing (showing a slight trend in which lower CRRs correspond to longer stopping distances), it still did not meet the minimum threshold for statistical significance. In terms of compliance with Federal safety standards, it was found that the stopping distance performance of the vehicle with the four tire sets studied in this research (with estimated tractor CRRs which varied by 33%), were well under the Federal Motor Vehicle Safety Standards No. 121 stopping distance requirements. 17. Key Words
Commercial Motor Vehicle, Class 8, CMV, rolling resistance, stopping distance, tires
18. Distribution Statement
Document is available to the public from the National Technical Information Service www.ntis.gov
19. Security Classif. (of this report)
Unclassified 20. Security Classif. (of this page)
Unclassified 21. No. of Pages
51 22. Price
Form DOT F 1700.7 (8-72) Reproduction of completed page authorized
1
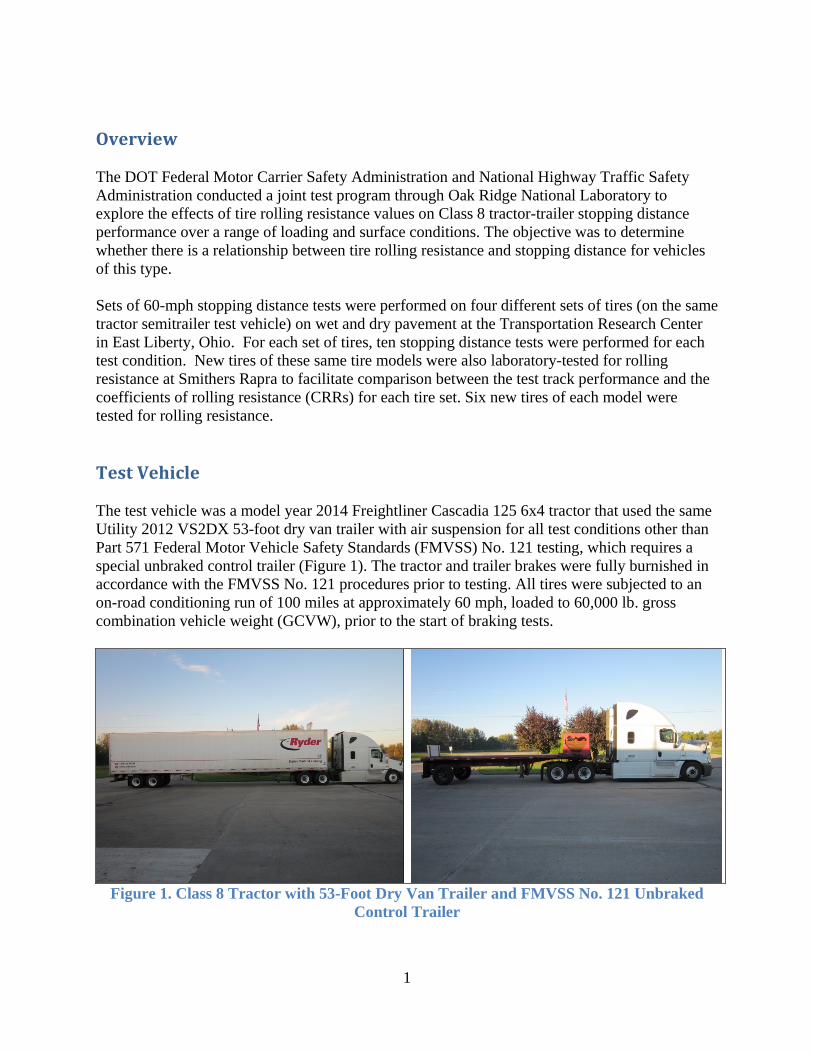
Overview The DOT Federal Motor Carrier Safety Administration and National Highway Traffic Safety Administration conducted a joint test program through Oak Ridge National Laboratory to explore the effects of tire rolling resistance values on Class 8 tractor-trailer stopping distance performance over a range of loading and surface conditions. The objective was to determine whether there is a relationship between tire rolling resistance and stopping distance for vehicles of this type. Sets of 60-mph stopping distance tests were performed on four different sets of tires (on the same tractor semitrailer test vehicle) on wet and dry pavement at the Transportation Research Center in East Liberty, Ohio. For each set of tires, ten stopping distance tests were performed for each test condition. New tires of these same tire models were also laboratory-tested for rolling resistance at Smithers Rapra to facilitate comparison between the test track performance and the coefficients of rolling resistance (CRRs) for each tire set. Six new tires of each model were tested for rolling resistance. Test Vehicle The test vehicle was a model year 2014 Freightliner Cascadia 125 6x4 tractor that used the same Utility 2012 VS2DX 53-foot dry van trailer with air suspension for all test conditions other than Part 571 Federal Motor Vehicle Safety Standards (FMVSS) No. 121 testing, which requires a special unbraked control trailer (Figure 1). The tractor and trailer brakes were fully burnished in accordance with the FMVSS No. 121 procedures prior to testing. All tires were subjected to an on-road conditioning run of 100 miles at approximately 60 mph, loaded to 60,000 lb. gross combination vehicle weight (GCVW), prior to the start of braking tests.
Figure 1. Class 8 Tractor with 53-Foot Dry Van Trailer and FMVSS No. 121 Unbraked
Control Trailer
2
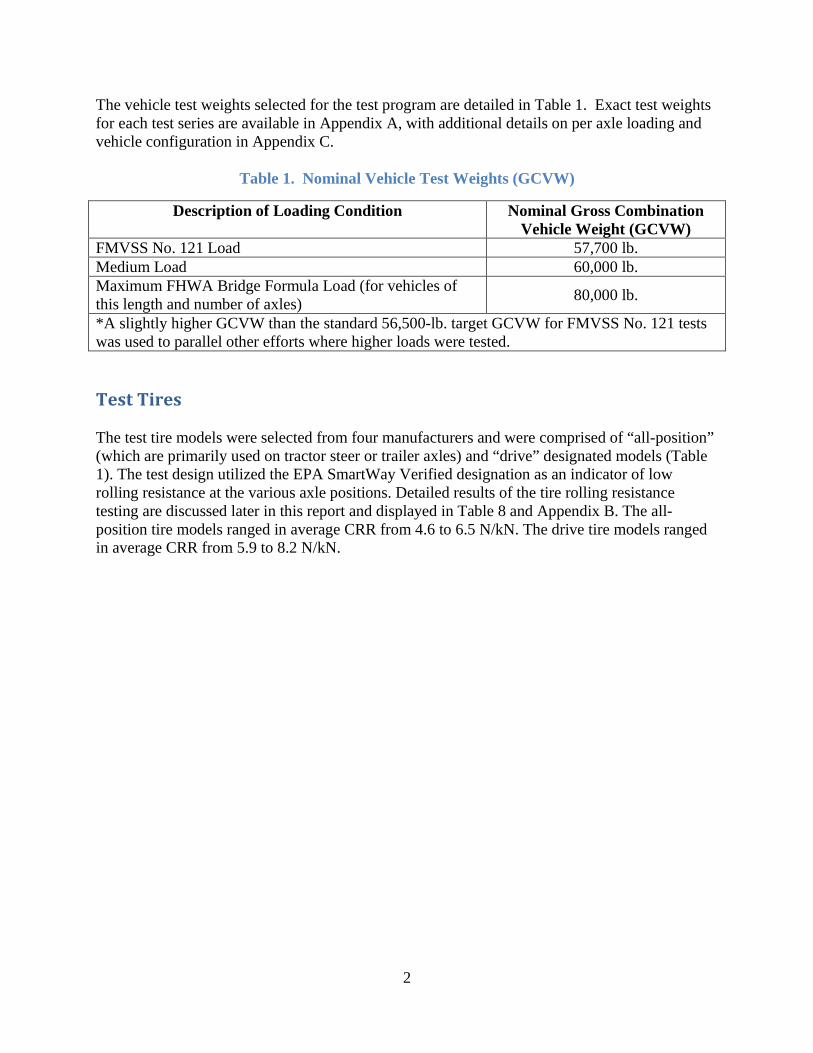
The vehicle test weights selected for the test program are detailed in Table 1. Exact test weights for each test series are available in Appendix A, with additional details on per axle loading and vehicle configuration in Appendix C.
Table 1. Nominal Vehicle Test Weights (GCVW)
Description of Loading Condition Nominal Gross Combination Vehicle Weight (GCVW)
FMVSS No. 121 Load 57,700 lb. Medium Load 60,000 lb. Maximum FHWA Bridge Formula Load (for vehicles of this length and number of axles) 80,000 lb.
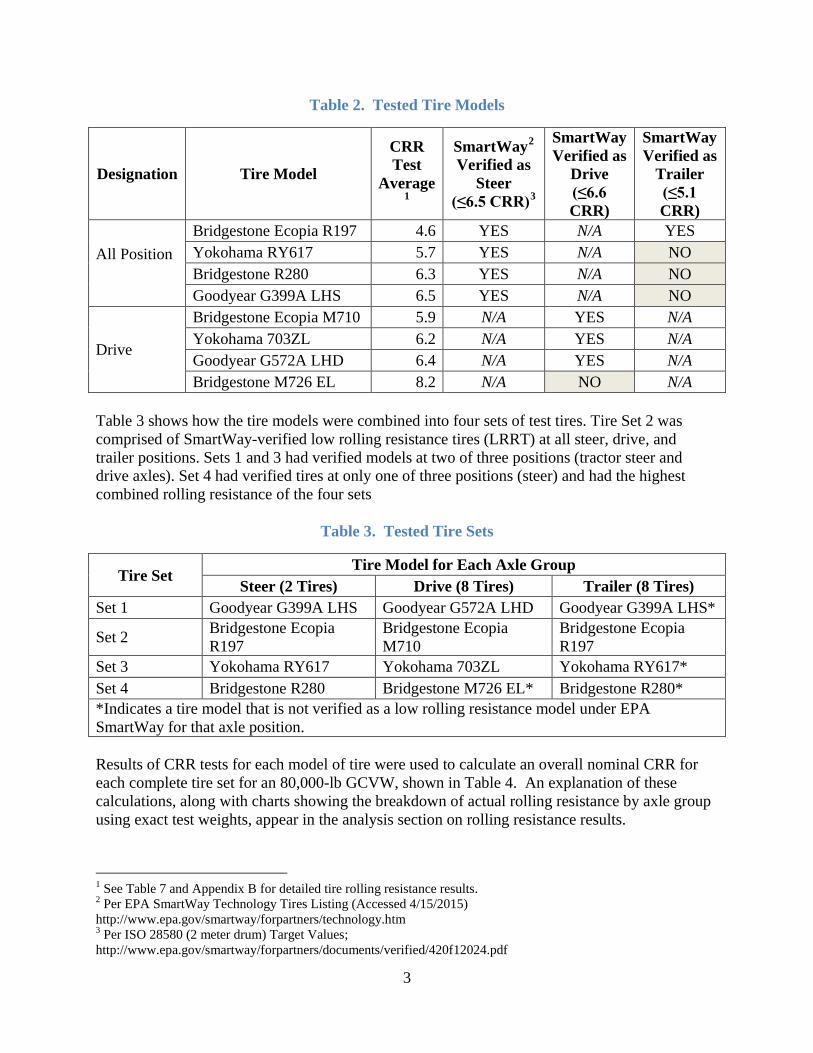
*A slightly higher GCVW than the standard 56,500-lb. target GCVW for FMVSS No. 121 tests was used to parallel other efforts where higher loads were tested. Test Tires The test tire models were selected from four manufacturers and were comprised of “all-position” (which are primarily used on tractor steer or trailer axles) and “drive” designated models (Table 1). The test design utilized the EPA SmartWay Verified designation as an indicator of low rolling resistance at the various axle positions. Detailed results of the tire rolling resistance testing are discussed later in this report and displayed in Table 8 and Appendix B. The all-position tire models ranged in average CRR from 4.6 to 6.5 N/kN. The drive tire models ranged in average CRR from 5.9 to 8.2 N/kN.
3
Table 2. Tested Tire Models
Designation Tire Model
CRR Test
Average1
SmartWay2 Verified as
Steer (≤6.5 CRR)3
SmartWay Verified as
Drive (≤6.6 CRR)
SmartWay Verified as
Trailer (≤5.1 CRR)
All Position
Bridgestone Ecopia R197 4.6 YES N/A YES Yokohama RY617 5.7 YES N/A NO Bridgestone R280 6.3 YES N/A NO Goodyear G399A LHS 6.5 YES N/A NO
Drive
Bridgestone Ecopia M710 5.9 N/A YES N/A Yokohama 703ZL 6.2 N/A YES N/A Goodyear G572A LHD 6.4 N/A YES N/A Bridgestone M726 EL 8.2 N/A NO N/A
Table 3 shows how the tire models were combined into four sets of test tires. Tire Set 2 was comprised of SmartWay-verified low rolling resistance tires (LRRT) at all steer, drive, and trailer positions. Sets 1 and 3 had verified models at two of three positions (tractor steer and drive axles). Set 4 had verified tires at only one of three positions (steer) and had the highest combined rolling resistance of the four sets
Table 3. Tested Tire Sets
Tire Set Tire Model for Each Axle Group
Steer (2 Tires) Drive (8 Tires) Trailer (8 Tires) Set 1 Goodyear G399A LHS Goodyear G572A LHD Goodyear G399A LHS*
Set 2 Bridgestone Ecopia R197
Bridgestone Ecopia M710
Bridgestone Ecopia R197
Set 3 Yokohama RY617 Yokohama 703ZL Yokohama RY617* Set 4 Bridgestone R280 Bridgestone M726 EL* Bridgestone R280* *Indicates a tire model that is not verified as a low rolling resistance model under EPA SmartWay for that axle position. Results of CRR tests for each model of tire were used to calculate an overall nominal CRR for each complete tire set for an 80,000-lb GCVW, shown in Table 4. An explanation of these calculations, along with charts showing the breakdown of actual rolling resistance by axle group using exact test weights, appear in the analysis section on rolling resistance results.
1 See Table 7 and Appendix B for detailed tire rolling resistance results. 2 Per EPA SmartWay Technology Tires Listing (Accessed 4/15/2015) http://www.epa.gov/smartway/forpartners/technology.htm 3 Per ISO 28580 (2 meter drum) Target Values; http://www.epa.gov/smartway/forpartners/documents/verified/420f12024.pdf
4
Table 4. Overall CRR Estimates Each Tire Set Loaded to 80,000-lb GCVW
Tires Estimated Overall GCV CRR (N/kN)
Set 1 6.48 Set 2 5.15 Set 3 5.95 Set 4 7.10
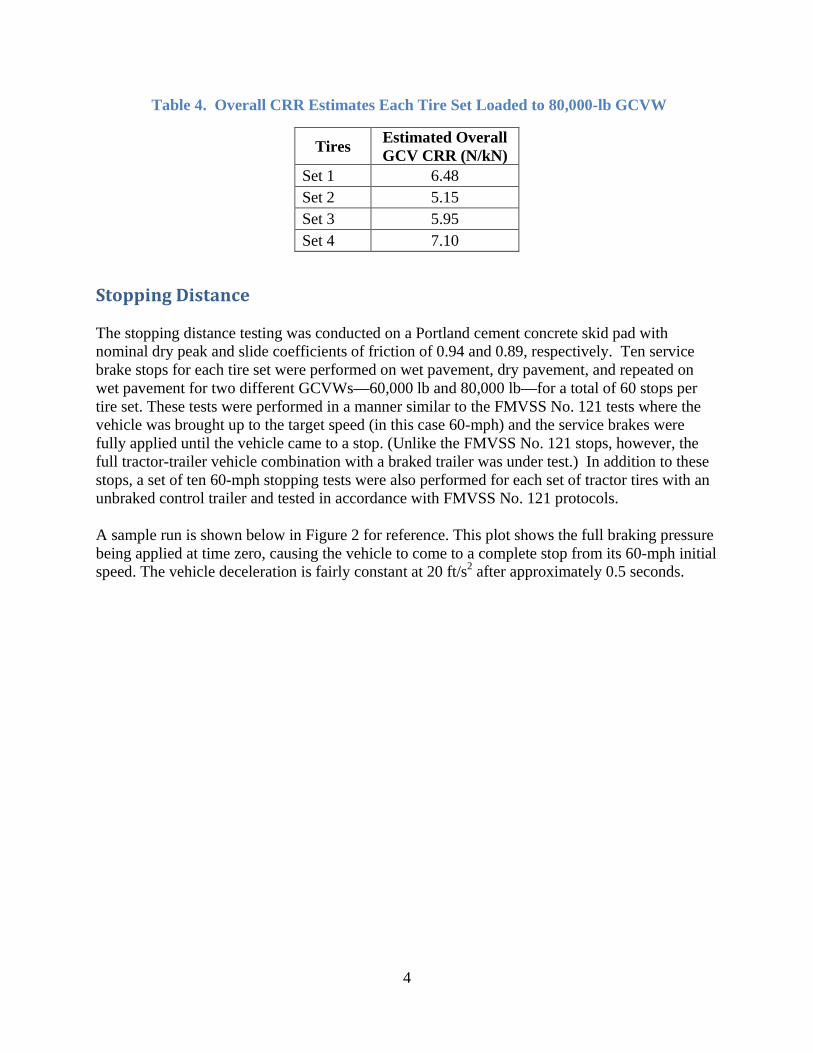
Stopping Distance The stopping distance testing was conducted on a Portland cement concrete skid pad with nominal dry peak and slide coefficients of friction of 0.94 and 0.89, respectively. Ten service brake stops for each tire set were performed on wet pavement, dry pavement, and repeated on wet pavement for two different GCVWs—60,000 lb and 80,000 lb—for a total of 60 stops per tire set. These tests were performed in a manner similar to the FMVSS No. 121 tests where the vehicle was brought up to the target speed (in this case 60-mph) and the service brakes were fully applied until the vehicle came to a stop. (Unlike the FMVSS No. 121 stops, however, the full tractor-trailer vehicle combination with a braked trailer was under test.) In addition to these stops, a set of ten 60-mph stopping tests were also performed for each set of tractor tires with an unbraked control trailer and tested in accordance with FMVSS No. 121 protocols. A sample run is shown below in Figure 2 for reference. This plot shows the full braking pressure being applied at time zero, causing the vehicle to come to a complete stop from its 60-mph initial speed. The vehicle deceleration is fairly constant at 20 ft/s2 after approximately 0.5 seconds.
5
Figure 2. Streaming Data from Sample Stopping Test
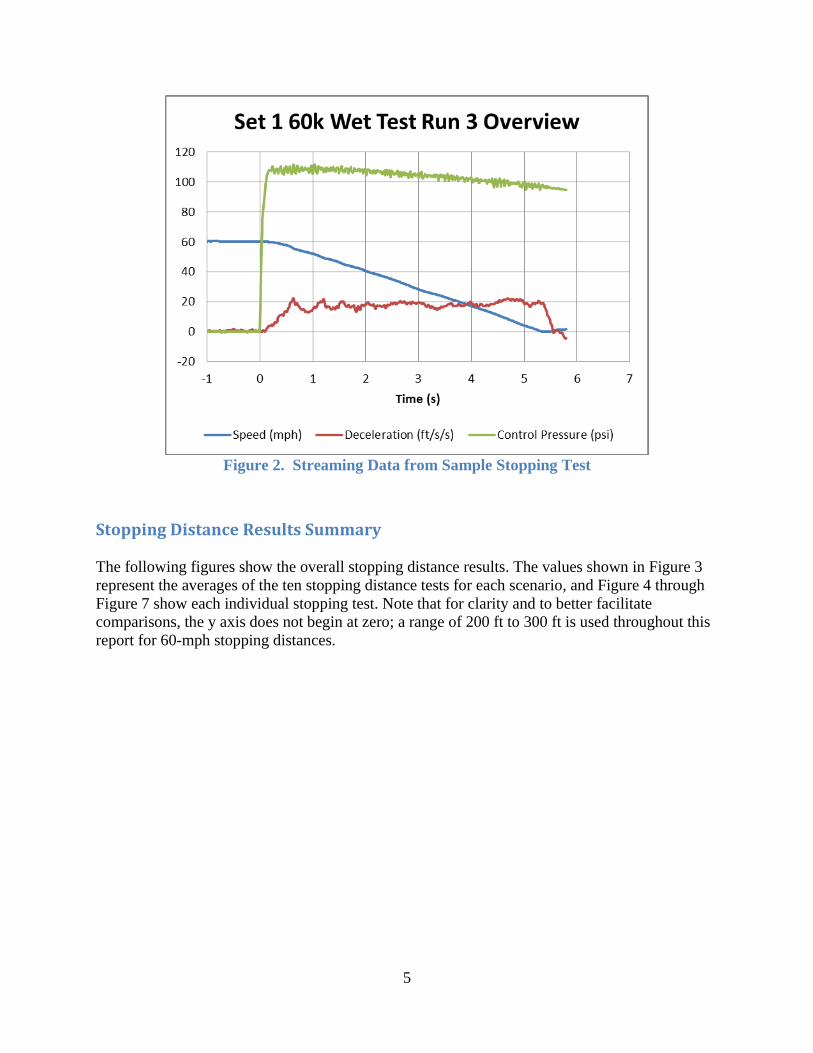
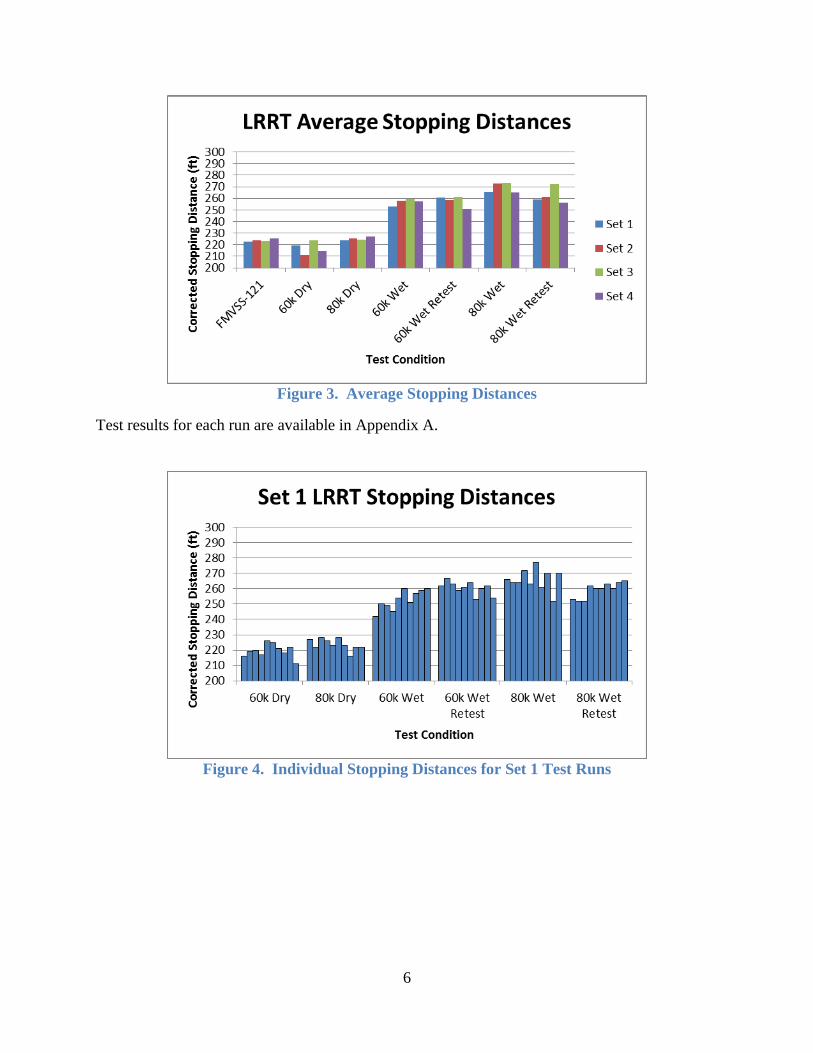
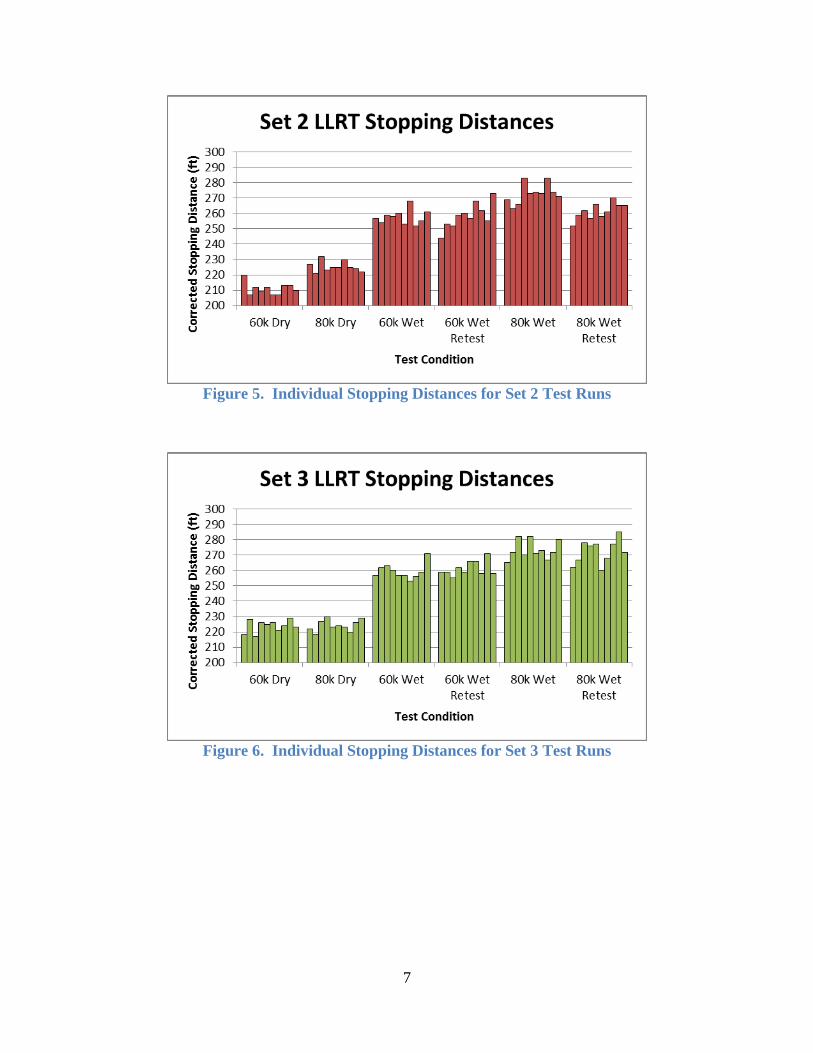
Stopping Distance Results Summary The following figures show the overall stopping distance results. The values shown in Figure 3 represent the averages of the ten stopping distance tests for each scenario, and Figure 4 through Figure 7 show each individual stopping test. Note that for clarity and to better facilitate comparisons, the y axis does not begin at zero; a range of 200 ft to 300 ft is used throughout this report for 60-mph stopping distances.
6
Figure 3. Average Stopping Distances
Test results for each run are available in Appendix A.
Figure 4. Individual Stopping Distances for Set 1 Test Runs
7
Figure 5. Individual Stopping Distances for Set 2 Test Runs
Figure 6. Individual Stopping Distances for Set 3 Test Runs
8
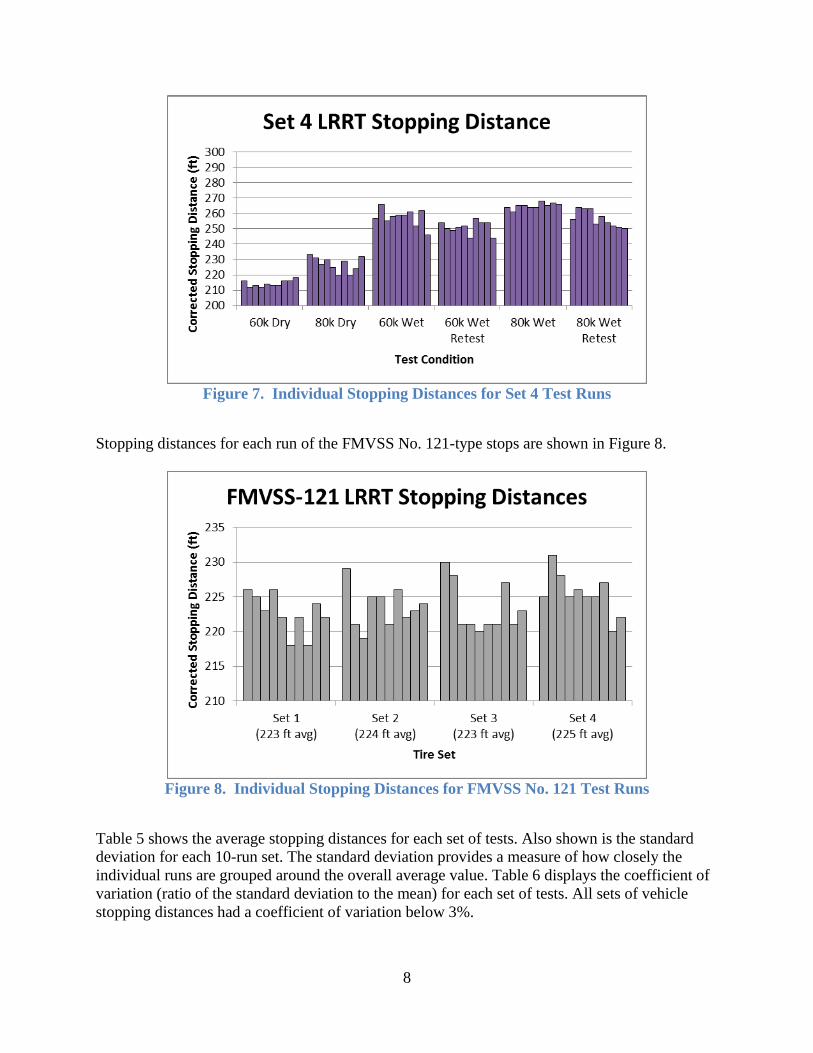
Figure 7. Individual Stopping Distances for Set 4 Test Runs
Stopping distances for each run of the FMVSS No. 121-type stops are shown in Figure 8.
Figure 8. Individual Stopping Distances for FMVSS No. 121 Test Runs
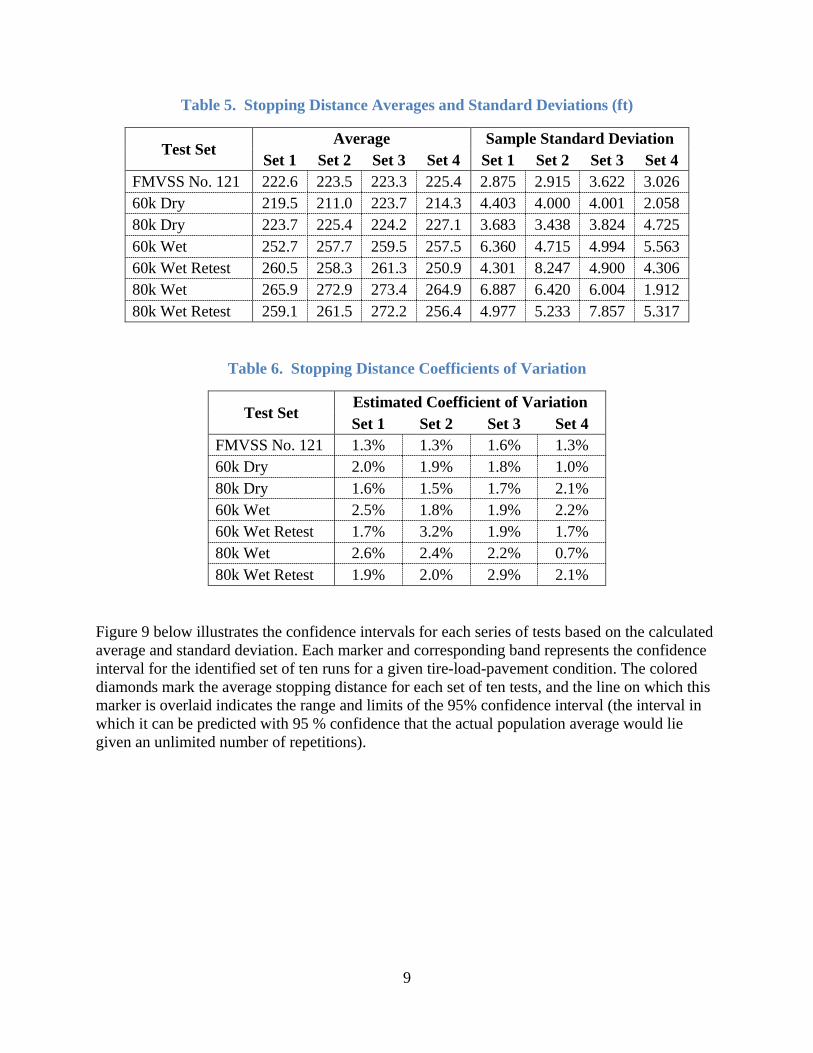
Table 5 shows the average stopping distances for each set of tests. Also shown is the standard deviation for each 10-run set. The standard deviation provides a measure of how closely the individual runs are grouped around the overall average value. Table 6 displays the coefficient of variation (ratio of the standard deviation to the mean) for each set of tests. All sets of vehicle stopping distances had a coefficient of variation below 3%.
9
Table 5. Stopping Distance Averages and Standard Deviations (ft)
Test Set Average Sample Standard Deviation
Set 1 Set 2 Set 3 Set 4 Set 1 Set 2 Set 3 Set 4 FMVSS No. 121 222.6 223.5 223.3 225.4 2.875 2.915 3.622 3.026 60k Dry 219.5 211.0 223.7 214.3 4.403 4.000 4.001 2.058 80k Dry 223.7 225.4 224.2 227.1 3.683 3.438 3.824 4.725 60k Wet 252.7 257.7 259.5 257.5 6.360 4.715 4.994 5.563 60k Wet Retest 260.5 258.3 261.3 250.9 4.301 8.247 4.900 4.306 80k Wet 265.9 272.9 273.4 264.9 6.887 6.420 6.004 1.912 80k Wet Retest 259.1 261.5 272.2 256.4 4.977 5.233 7.857 5.317
Table 6. Stopping Distance Coefficients of Variation
Test Set Estimated Coefficient of Variation Set 1 Set 2 Set 3 Set 4
FMVSS No. 121 1.3% 1.3% 1.6% 1.3% 60k Dry 2.0% 1.9% 1.8% 1.0% 80k Dry 1.6% 1.5% 1.7% 2.1% 60k Wet 2.5% 1.8% 1.9% 2.2% 60k Wet Retest 1.7% 3.2% 1.9% 1.7% 80k Wet 2.6% 2.4% 2.2% 0.7% 80k Wet Retest 1.9% 2.0% 2.9% 2.1%
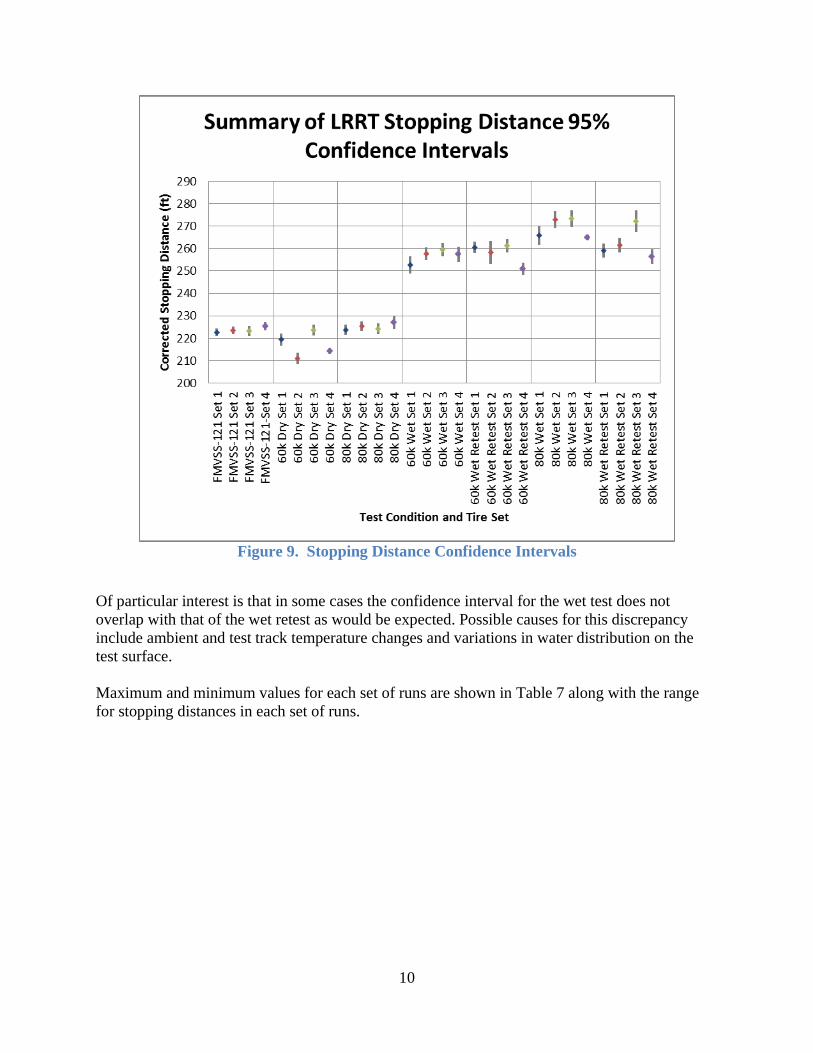
Figure 9 below illustrates the confidence intervals for each series of tests based on the calculated average and standard deviation. Each marker and corresponding band represents the confidence interval for the identified set of ten runs for a given tire-load-pavement condition. The colored diamonds mark the average stopping distance for each set of ten tests, and the line on which this marker is overlaid indicates the range and limits of the 95% confidence interval (the interval in which it can be predicted with 95 % confidence that the actual population average would lie given an unlimited number of repetitions).
10
Figure 9. Stopping Distance Confidence Intervals
Of particular interest is that in some cases the confidence interval for the wet test does not overlap with that of the wet retest as would be expected. Possible causes for this discrepancy include ambient and test track temperature changes and variations in water distribution on the test surface. Maximum and minimum values for each set of runs are shown in Table 7 along with the range for stopping distances in each set of runs.
11
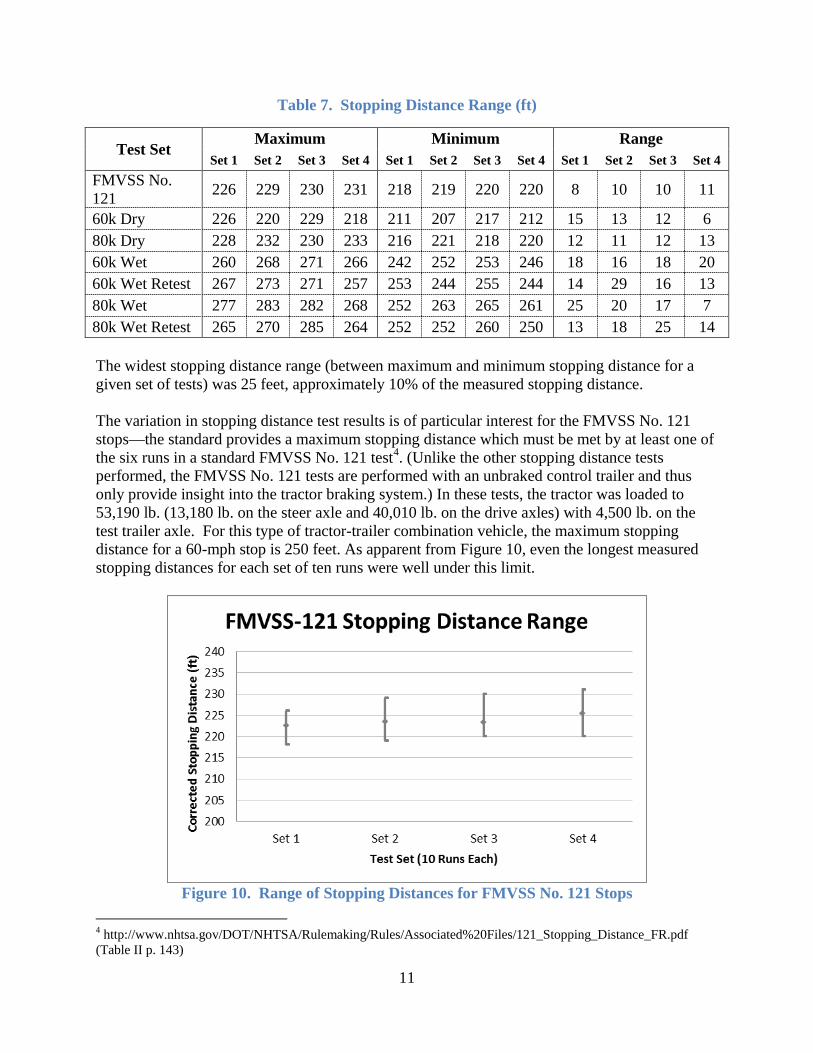
Table 7. Stopping Distance Range (ft)
Test Set Maximum Minimum Range
Set 1 Set 2 Set 3 Set 4 Set 1 Set 2 Set 3 Set 4 Set 1 Set 2 Set 3 Set 4 FMVSS No. 121 226 229 230 231 218 219 220 220 8 10 10 11
60k Dry 226 220 229 218 211 207 217 212 15 13 12 6 80k Dry 228 232 230 233 216 221 218 220 12 11 12 13 60k Wet 260 268 271 266 242 252 253 246 18 16 18 20 60k Wet Retest 267 273 271 257 253 244 255 244 14 29 16 13 80k Wet 277 283 282 268 252 263 265 261 25 20 17 7 80k Wet Retest 265 270 285 264 252 252 260 250 13 18 25 14 The widest stopping distance range (between maximum and minimum stopping distance for a given set of tests) was 25 feet, approximately 10% of the measured stopping distance. The variation in stopping distance test results is of particular interest for the FMVSS No. 121 stops—the standard provides a maximum stopping distance which must be met by at least one of the six runs in a standard FMVSS No. 121 test4. (Unlike the other stopping distance tests performed, the FMVSS No. 121 tests are performed with an unbraked control trailer and thus only provide insight into the tractor braking system.) In these tests, the tractor was loaded to 53,190 lb. (13,180 lb. on the steer axle and 40,010 lb. on the drive axles) with 4,500 lb. on the test trailer axle. For this type of tractor-trailer combination vehicle, the maximum stopping distance for a 60-mph stop is 250 feet. As apparent from Figure 10, even the longest measured stopping distances for each set of ten runs were well under this limit.
Figure 10. Range of Stopping Distances for FMVSS No. 121 Stops
4 http://www.nhtsa.gov/DOT/NHTSA/Rulemaking/Rules/Associated%20Files/121_Stopping_Distance_FR.pdf (Table II p. 143)
12
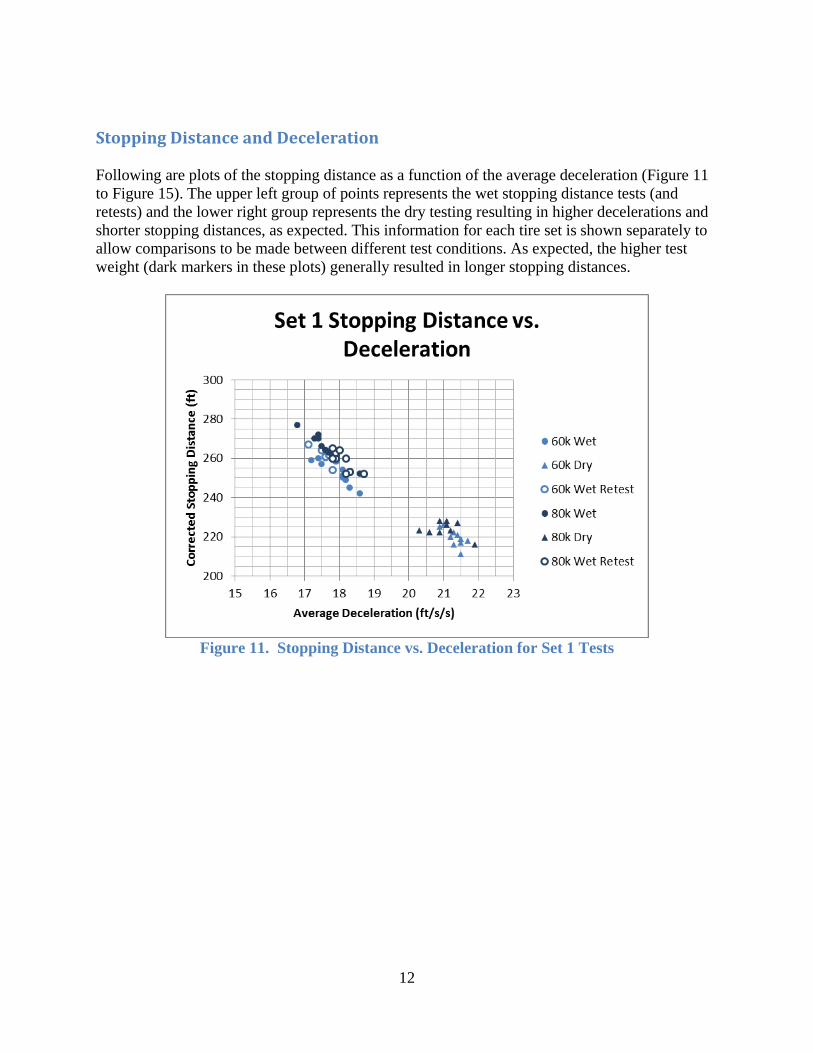
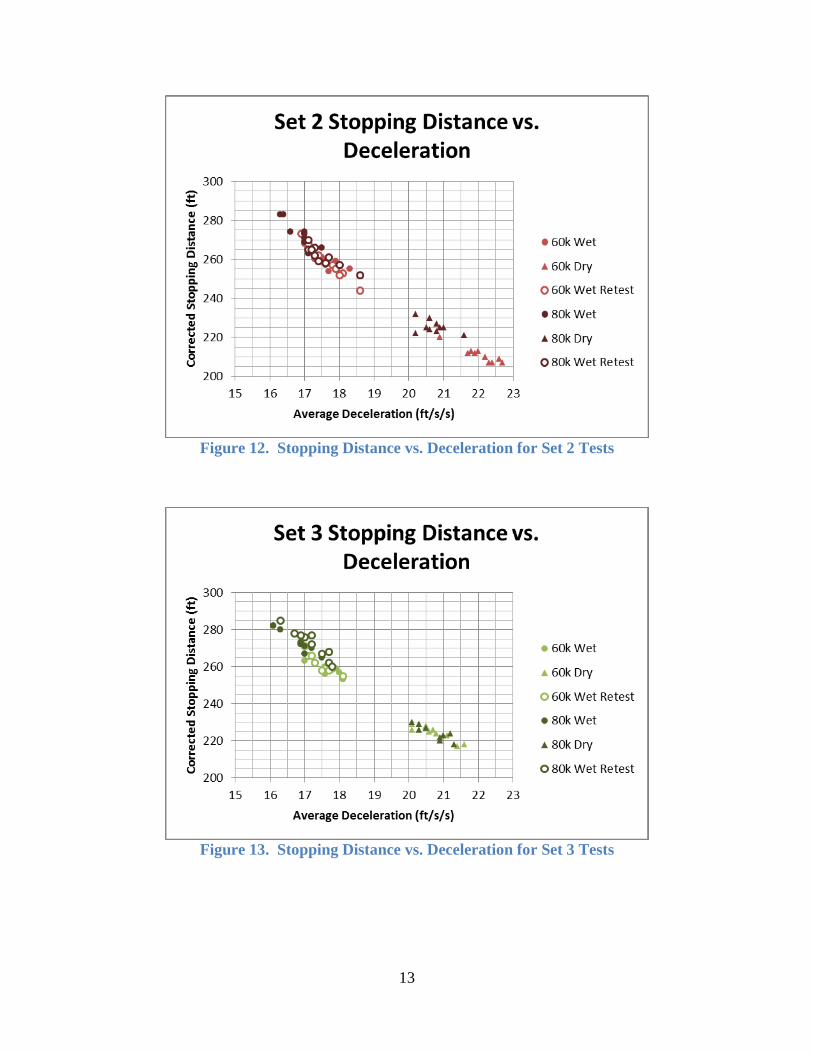
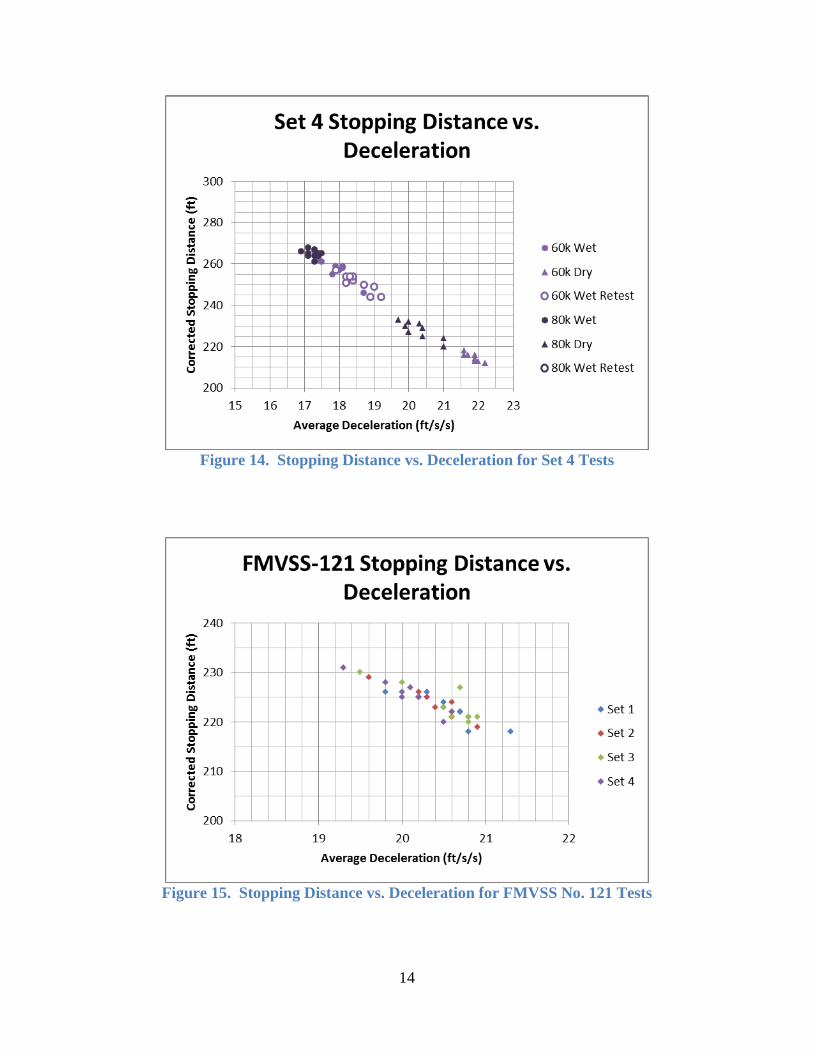
Stopping Distance and Deceleration Following are plots of the stopping distance as a function of the average deceleration (Figure 11 to Figure 15). The upper left group of points represents the wet stopping distance tests (and retests) and the lower right group represents the dry testing resulting in higher decelerations and shorter stopping distances, as expected. This information for each tire set is shown separately to allow comparisons to be made between different test conditions. As expected, the higher test weight (dark markers in these plots) generally resulted in longer stopping distances.
Figure 11. Stopping Distance vs. Deceleration for Set 1 Tests
13
Figure 12. Stopping Distance vs. Deceleration for Set 2 Tests
Figure 13. Stopping Distance vs. Deceleration for Set 3 Tests
14
Figure 14. Stopping Distance vs. Deceleration for Set 4 Tests
Figure 15. Stopping Distance vs. Deceleration for FMVSS No. 121 Tests
15
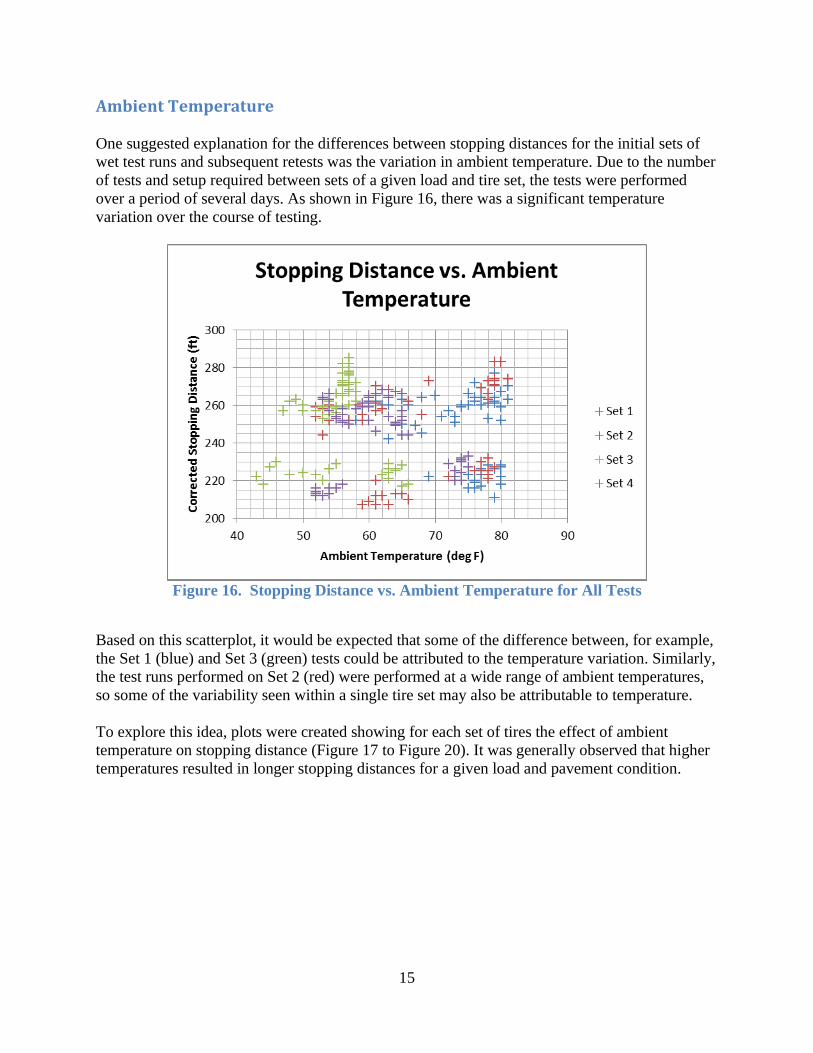
Ambient Temperature One suggested explanation for the differences between stopping distances for the initial sets of wet test runs and subsequent retests was the variation in ambient temperature. Due to the number of tests and setup required between sets of a given load and tire set, the tests were performed over a period of several days. As shown in Figure 16, there was a significant temperature variation over the course of testing.
Figure 16. Stopping Distance vs. Ambient Temperature for All Tests
Based on this scatterplot, it would be expected that some of the difference between, for example, the Set 1 (blue) and Set 3 (green) tests could be attributed to the temperature variation. Similarly, the test runs performed on Set 2 (red) were performed at a wide range of ambient temperatures, so some of the variability seen within a single tire set may also be attributable to temperature. To explore this idea, plots were created showing for each set of tires the effect of ambient temperature on stopping distance (Figure 17 to Figure 20). It was generally observed that higher temperatures resulted in longer stopping distances for a given load and pavement condition.
16
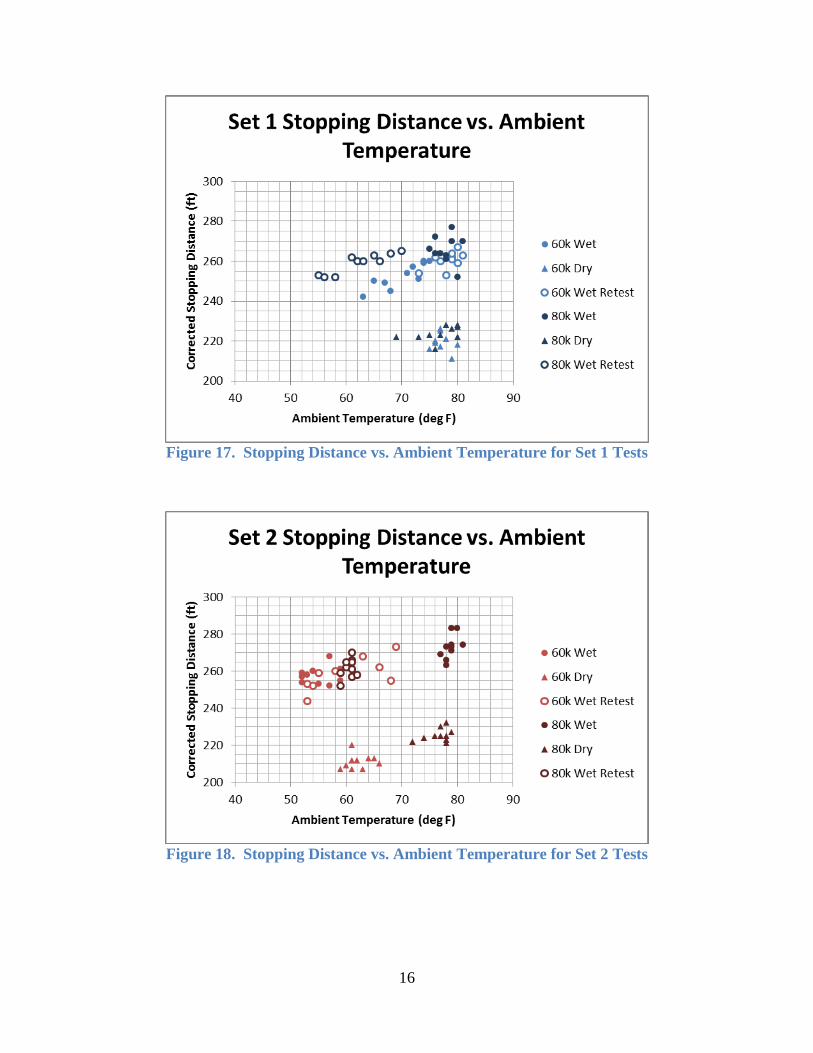
Figure 17. Stopping Distance vs. Ambient Temperature for Set 1 Tests
Figure 18. Stopping Distance vs. Ambient Temperature for Set 2 Tests
17
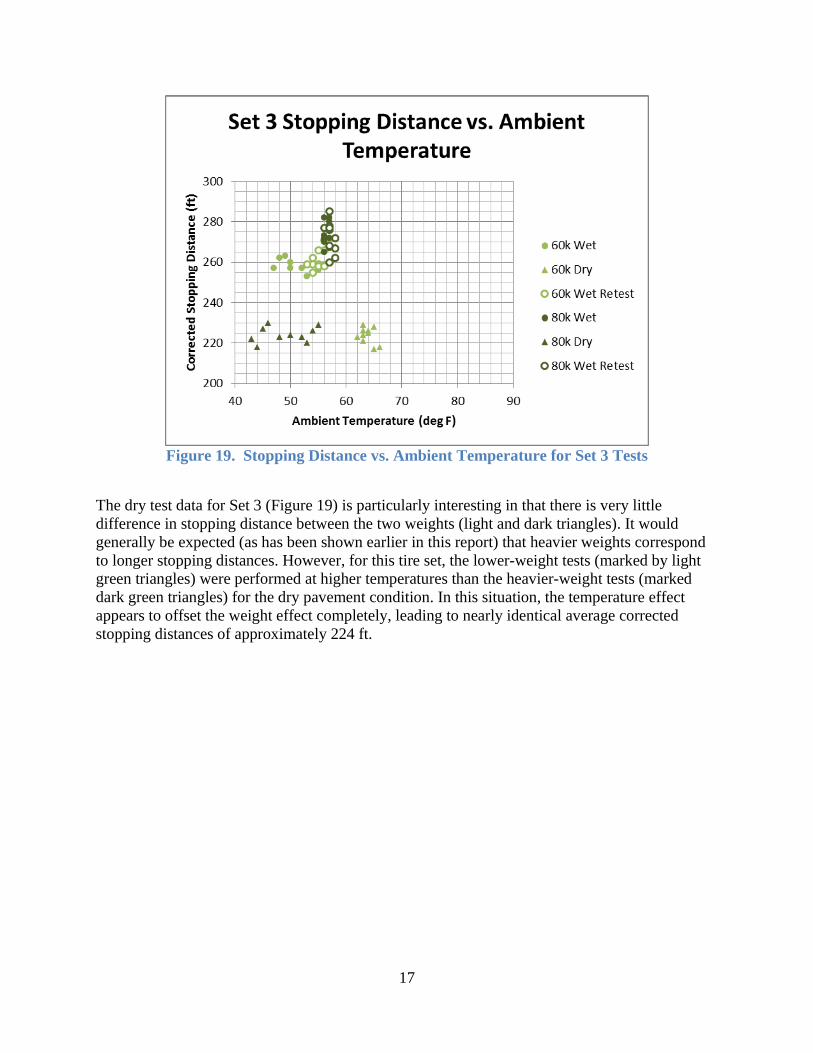
Figure 19. Stopping Distance vs. Ambient Temperature for Set 3 Tests
The dry test data for Set 3 (Figure 19) is particularly interesting in that there is very little difference in stopping distance between the two weights (light and dark triangles). It would generally be expected (as has been shown earlier in this report) that heavier weights correspond to longer stopping distances. However, for this tire set, the lower-weight tests (marked by light green triangles) were performed at higher temperatures than the heavier-weight tests (marked dark green triangles) for the dry pavement condition. In this situation, the temperature effect appears to offset the weight effect completely, leading to nearly identical average corrected stopping distances of approximately 224 ft.
18
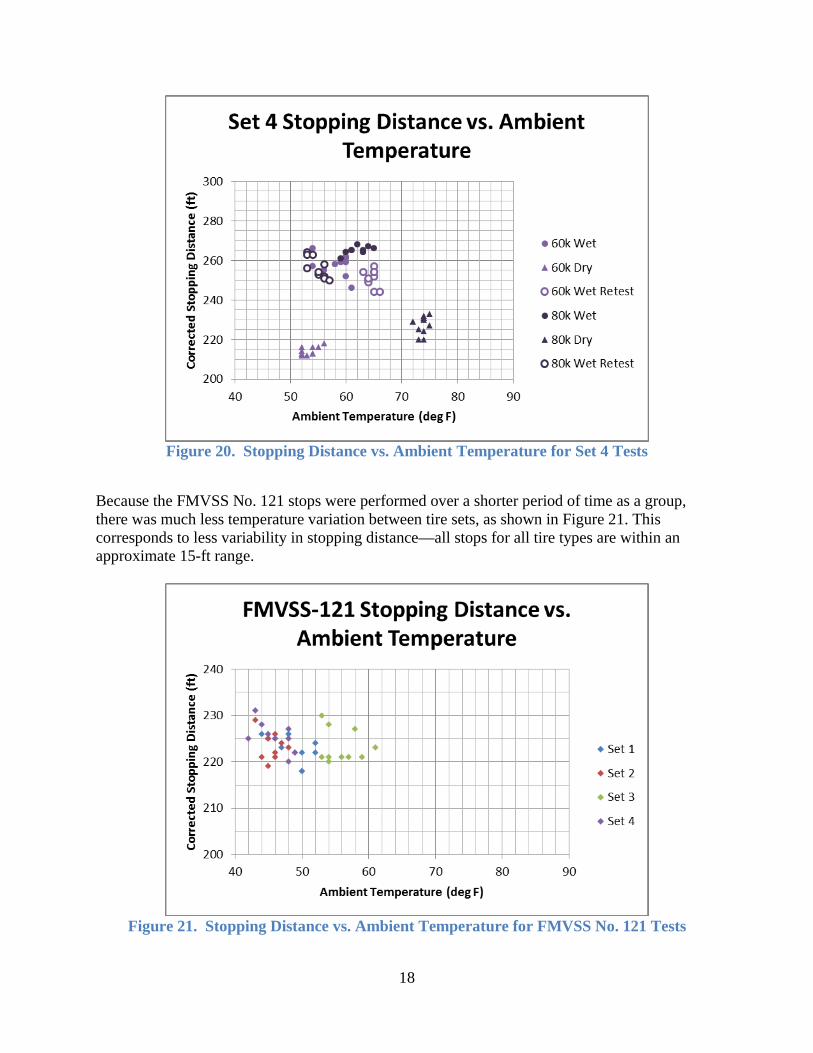
Figure 20. Stopping Distance vs. Ambient Temperature for Set 4 Tests
Because the FMVSS No. 121 stops were performed over a shorter period of time as a group, there was much less temperature variation between tire sets, as shown in Figure 21. This corresponds to less variability in stopping distance—all stops for all tire types are within an approximate 15-ft range.
Figure 21. Stopping Distance vs. Ambient Temperature for FMVSS No. 121 Tests
19
Rolling Resistance
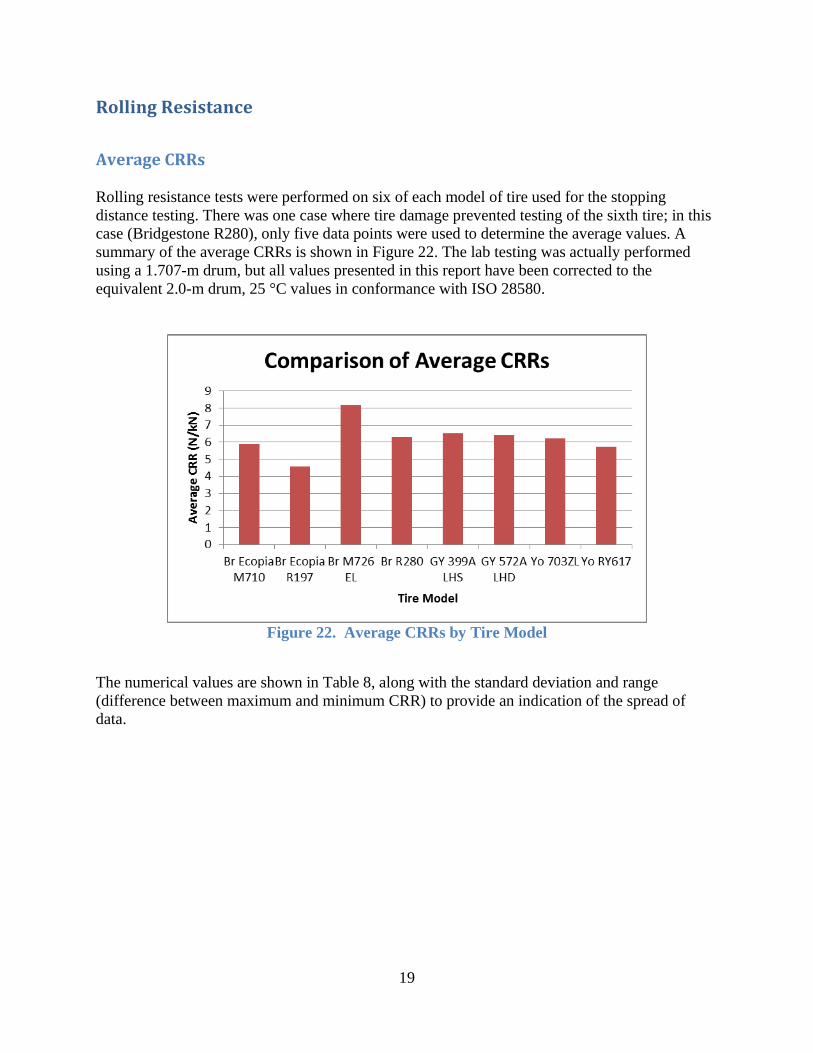
Average CRRs Rolling resistance tests were performed on six of each model of tire used for the stopping distance testing. There was one case where tire damage prevented testing of the sixth tire; in this case (Bridgestone R280), only five data points were used to determine the average values. A summary of the average CRRs is shown in Figure 22. The lab testing was actually performed using a 1.707-m drum, but all values presented in this report have been corrected to the equivalent 2.0-m drum, 25 °C values in conformance with ISO 28580.
Figure 22. Average CRRs by Tire Model
The numerical values are shown in Table 8, along with the standard deviation and range (difference between maximum and minimum CRR) to provide an indication of the spread of data.
20
Table 8. Summary of CRR Statistical Values (N/kN)
Designation Tire Model Average Standard Deviation Range
All Position
Bridgestone Ecopia R197 4.5884 0.1078 0.2857 Yokohama RY617 5.7485 0.1325 0.3077 Bridgestone R280 6.3111 0.1452 0.3259 Goodyear G399A LHS 6.5340 0.3676 0.9985
Drive
Bridgestone Ecopia M710 5.9000 0.0975 0.2547 Yokohama 703ZL 6.2245 0.0980 0.2779 Goodyear G572A LHD 6.4128 0.0962 0.2309 Bridgestone M726 EL 8.1637 0.2597 0.5466
The variation between tests of a same tire model was generally with in the expected range of 0.5 N/kN. However, one test within the Goodyear 399A LHS yielded CRR values approximately 1 N/kN lower than the other test runs; this is reflected in the high standard deviation for the test sample (0.3676). This tire was retested to confirm that the unexpectedly low value was valid.
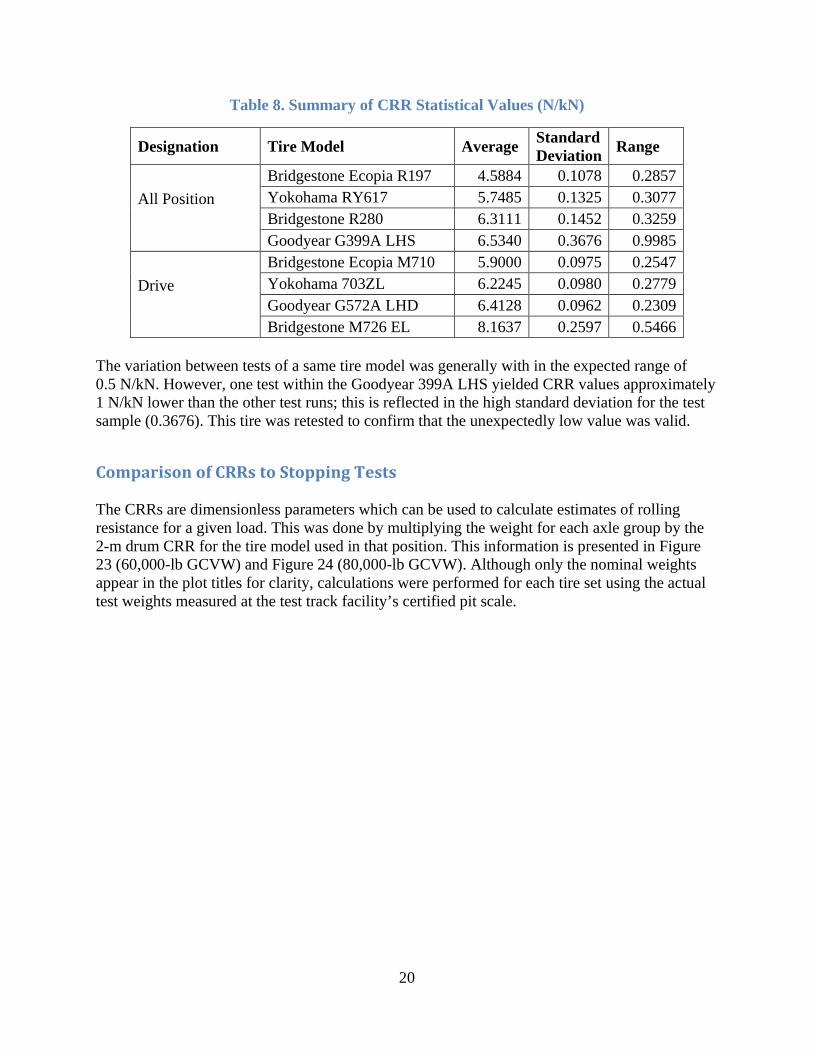
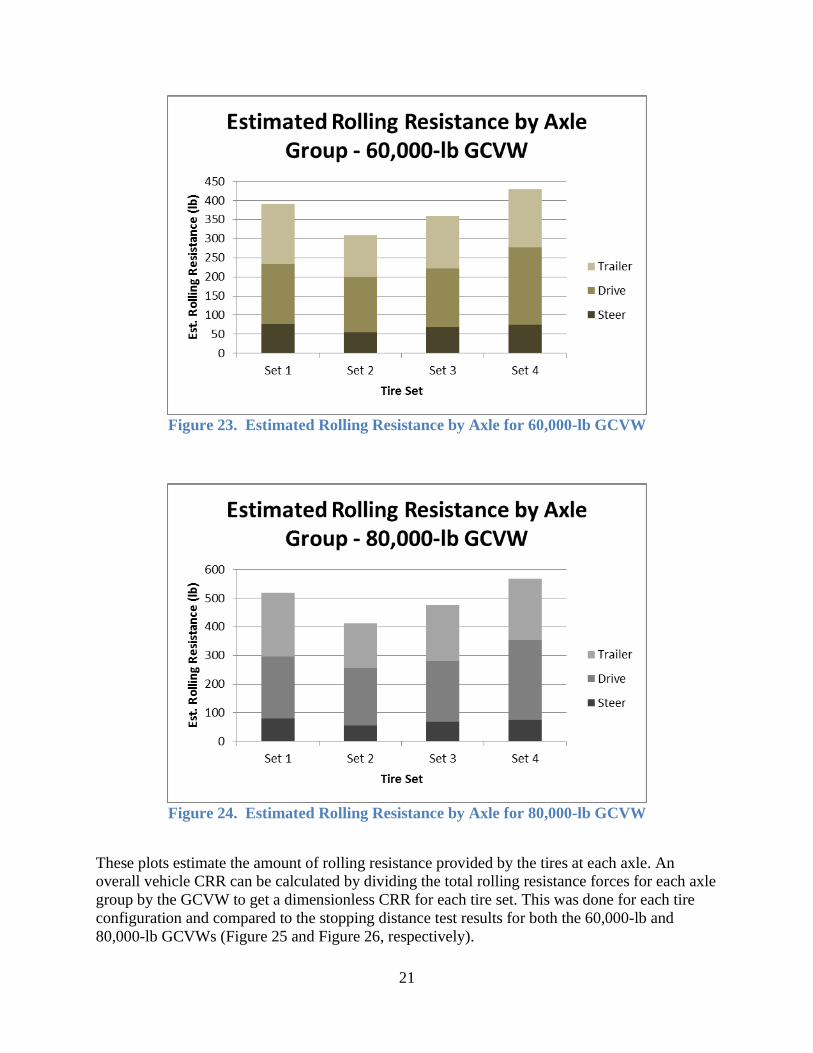
Comparison of CRRs to Stopping Tests The CRRs are dimensionless parameters which can be used to calculate estimates of rolling resistance for a given load. This was done by multiplying the weight for each axle group by the 2-m drum CRR for the tire model used in that position. This information is presented in Figure 23 (60,000-lb GCVW) and Figure 24 (80,000-lb GCVW). Although only the nominal weights appear in the plot titles for clarity, calculations were performed for each tire set using the actual test weights measured at the test track facility’s certified pit scale.
21
Figure 23. Estimated Rolling Resistance by Axle for 60,000-lb GCVW
Figure 24. Estimated Rolling Resistance by Axle for 80,000-lb GCVW
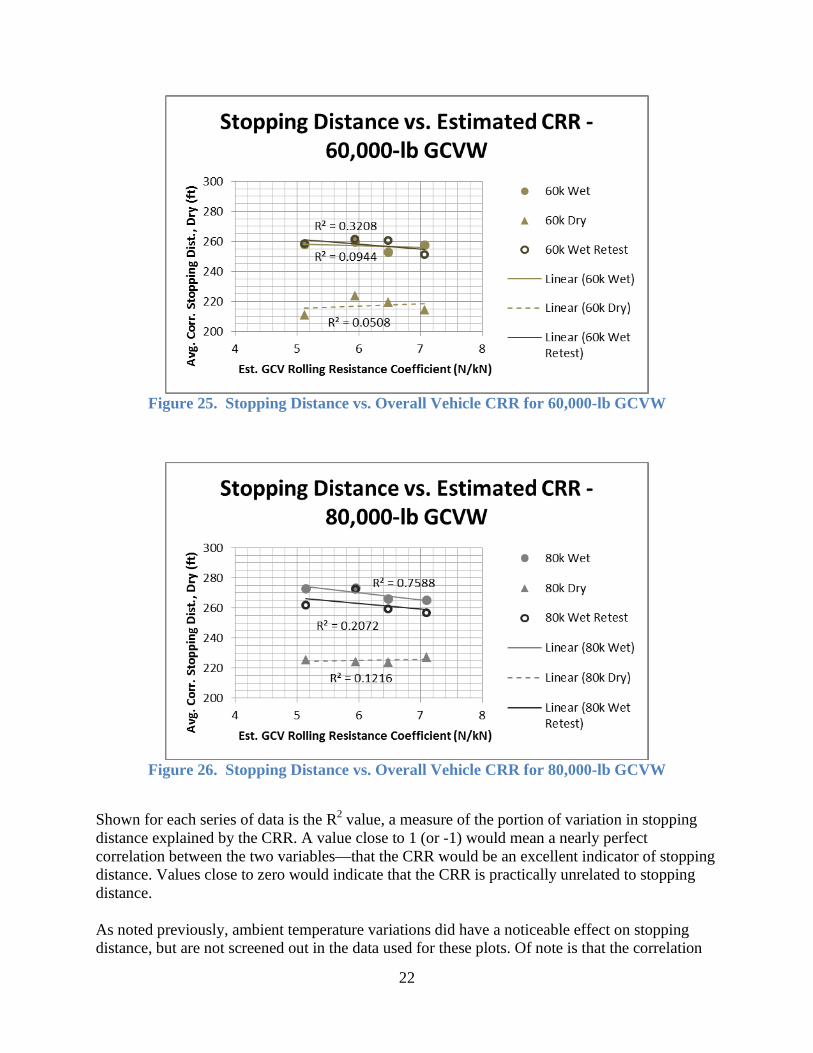
These plots estimate the amount of rolling resistance provided by the tires at each axle. An overall vehicle CRR can be calculated by dividing the total rolling resistance forces for each axle group by the GCVW to get a dimensionless CRR for each tire set. This was done for each tire configuration and compared to the stopping distance test results for both the 60,000-lb and 80,000-lb GCVWs (Figure 25 and Figure 26, respectively).
22
Figure 25. Stopping Distance vs. Overall Vehicle CRR for 60,000-lb GCVW
Figure 26. Stopping Distance vs. Overall Vehicle CRR for 80,000-lb GCVW
Shown for each series of data is the R2 value, a measure of the portion of variation in stopping distance explained by the CRR. A value close to 1 (or -1) would mean a nearly perfect correlation between the two variables—that the CRR would be an excellent indicator of stopping distance. Values close to zero would indicate that the CRR is practically unrelated to stopping distance. As noted previously, ambient temperature variations did have a noticeable effect on stopping distance, but are not screened out in the data used for these plots. Of note is that the correlation
23
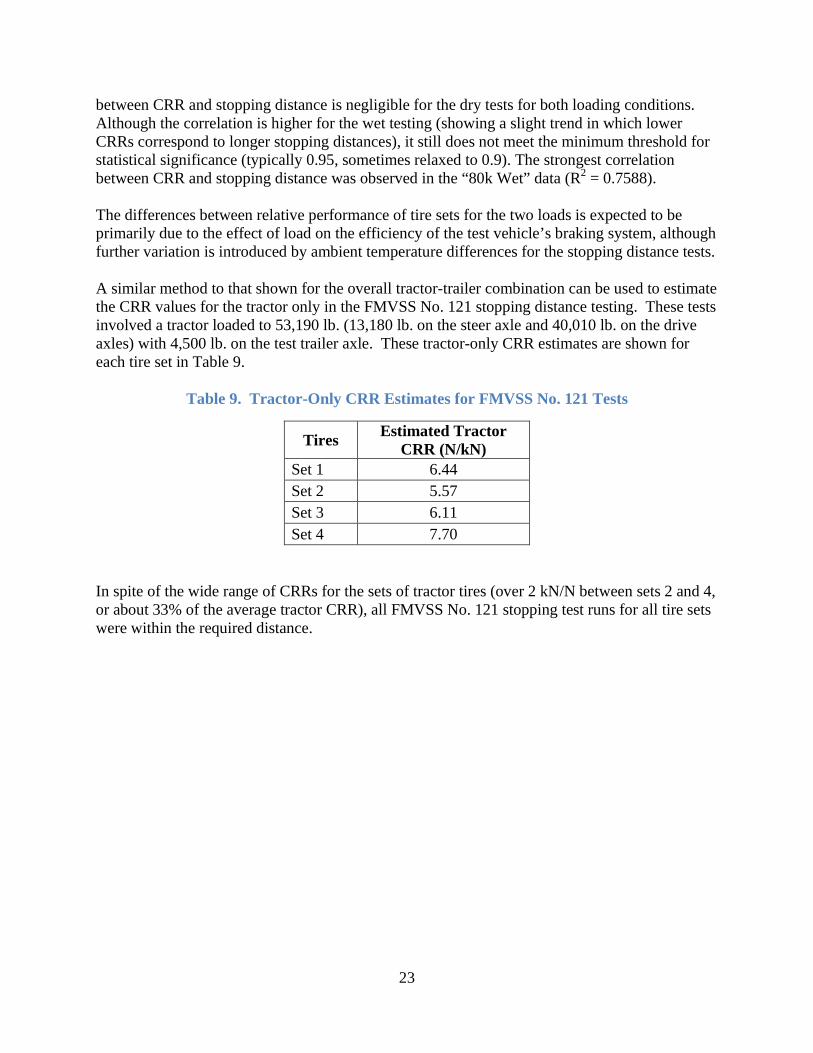
between CRR and stopping distance is negligible for the dry tests for both loading conditions. Although the correlation is higher for the wet testing (showing a slight trend in which lower CRRs correspond to longer stopping distances), it still does not meet the minimum threshold for statistical significance (typically 0.95, sometimes relaxed to 0.9). The strongest correlation between CRR and stopping distance was observed in the “80k Wet” data (R2 = 0.7588). The differences between relative performance of tire sets for the two loads is expected to be primarily due to the effect of load on the efficiency of the test vehicle’s braking system, although further variation is introduced by ambient temperature differences for the stopping distance tests. A similar method to that shown for the overall tractor-trailer combination can be used to estimate the CRR values for the tractor only in the FMVSS No. 121 stopping distance testing. These tests involved a tractor loaded to 53,190 lb. (13,180 lb. on the steer axle and 40,010 lb. on the drive axles) with 4,500 lb. on the test trailer axle. These tractor-only CRR estimates are shown for each tire set in Table 9.
Table 9. Tractor-Only CRR Estimates for FMVSS No. 121 Tests
Tires Estimated Tractor CRR (N/kN)
Set 1 6.44 Set 2 5.57 Set 3 6.11 Set 4 7.70
In spite of the wide range of CRRs for the sets of tractor tires (over 2 kN/N between sets 2 and 4, or about 33% of the average tractor CRR), all FMVSS No. 121 stopping test runs for all tire sets were within the required distance.
24
Conclusions While all vehicle stopping distance test sets had a coefficient of variation below 3%, ambient test temperature was observed to induce variability in the results. It was generally observed that higher ambient temperatures resulted in longer stopping distances for a given load and pavement condition. The overall results of this research suggest that tire rolling resistance is not a reliable indicator of Class 8 tractor-trailer stopping distance. The correlation coefficients (R2 values) for linear regressions of wet and dry stopping distance versus overall vehicle rolling resistance values did not meet the minimum threshold for statistical significance for any of the test conditions. Correlation between CRR and stopping distance was found to be negligible for the dry tests for both loading conditions. While correlation was higher for the wet testing (showing a slight trend in which lower CRRs correspond to longer stopping distances), it still did not meet the minimum threshold for statistical significance. In terms of compliance with Federal safety standards, it was found that the stopping distance performance of the vehicle with the four tire sets studied in this research (with estimated tractor CRRs which varied by 33%), were well under the FMVSS No. 121 stopping distance requirements.
25
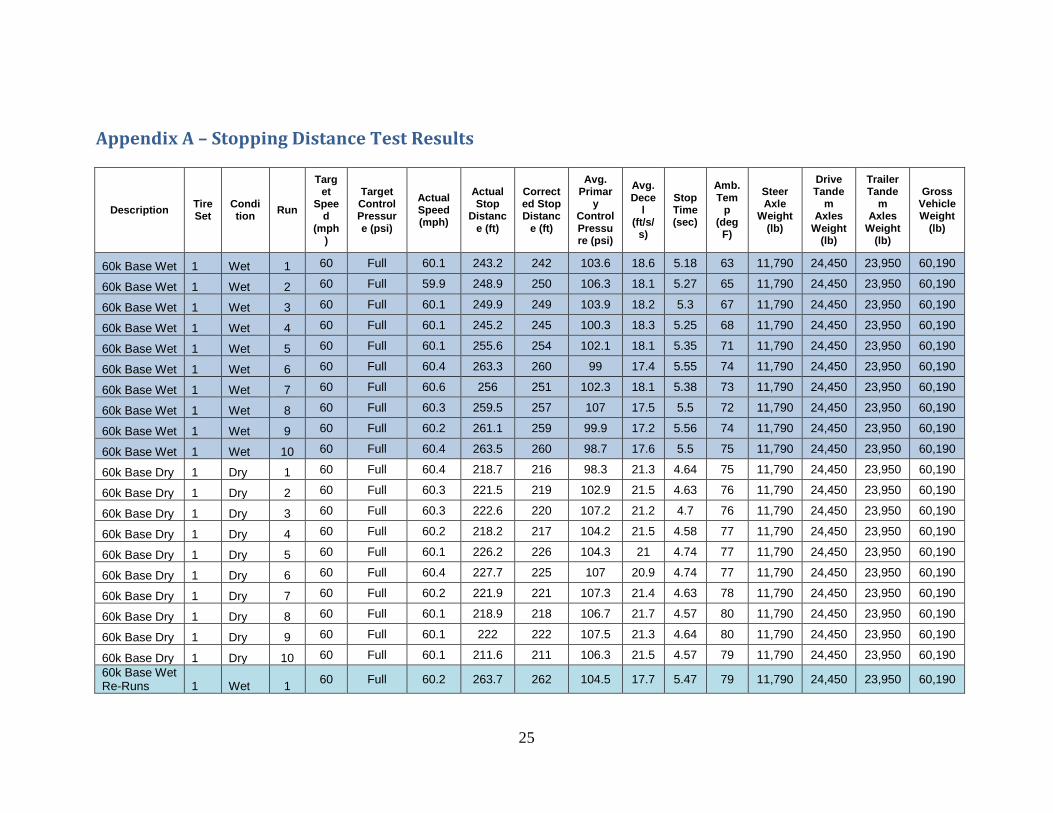
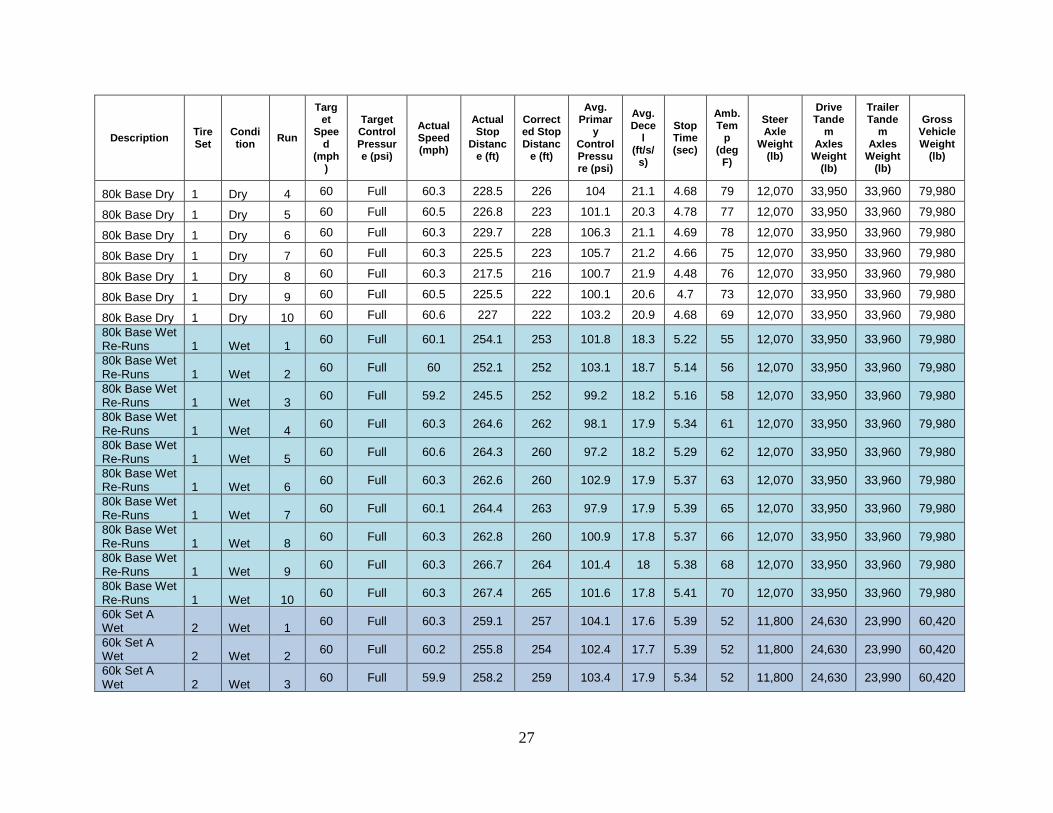
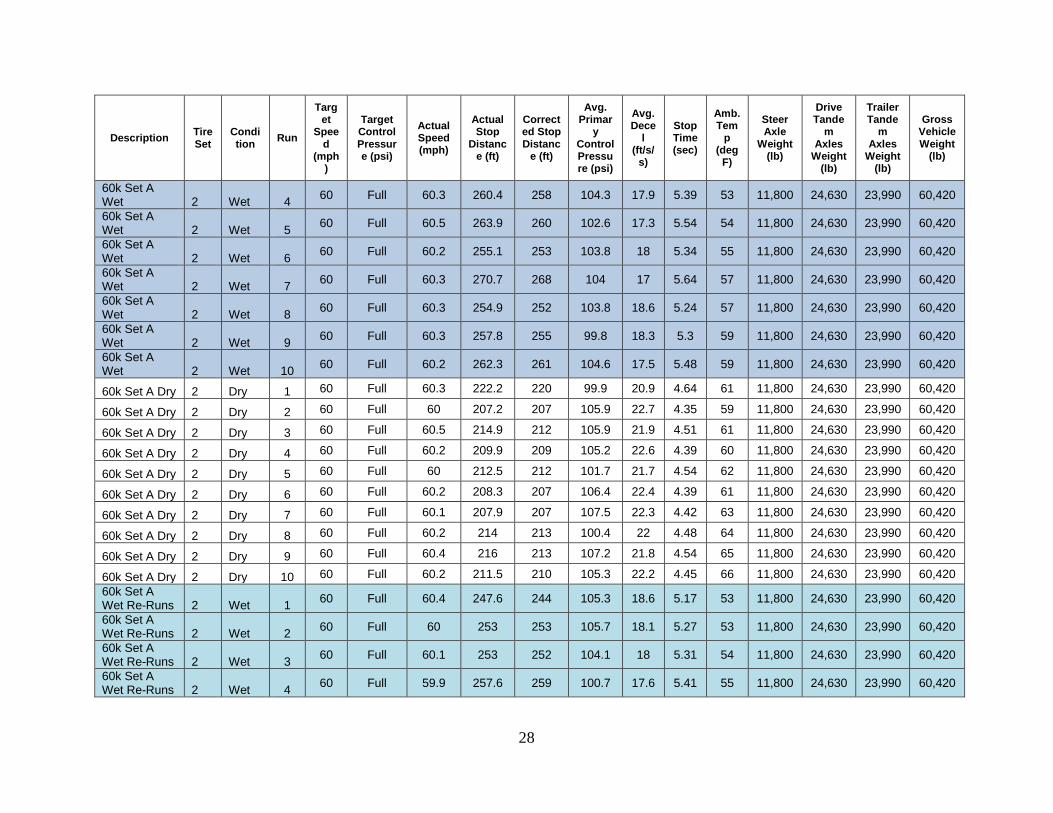
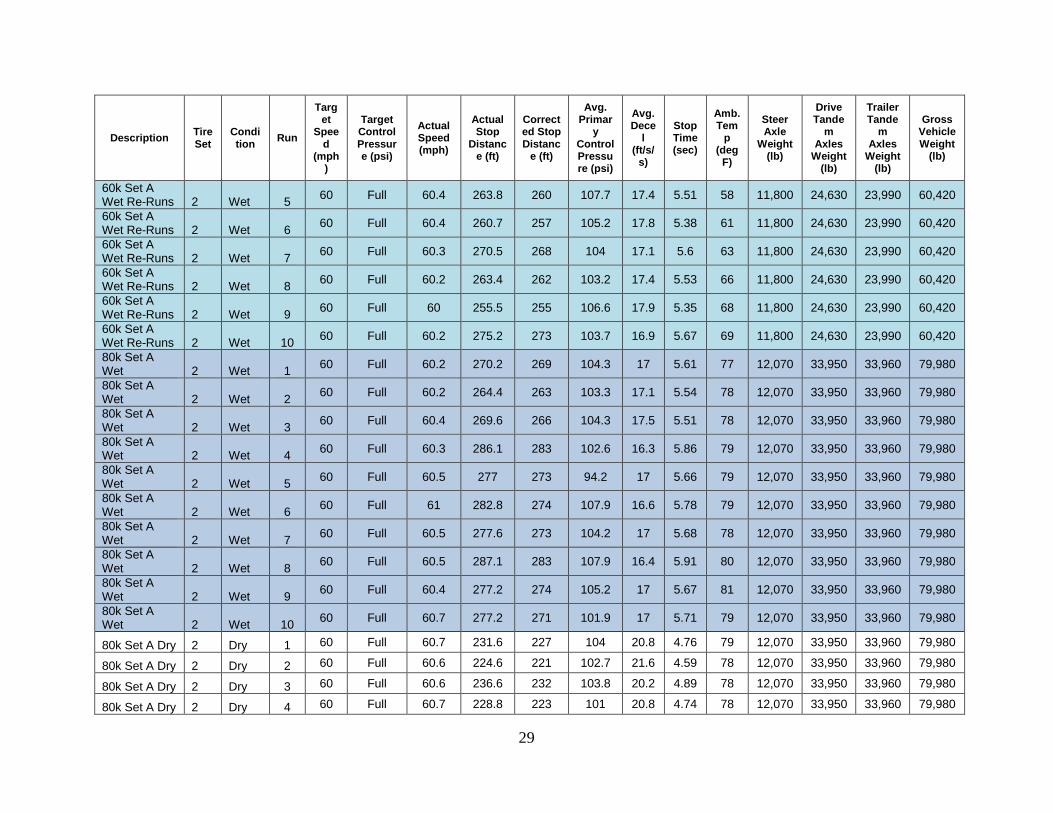
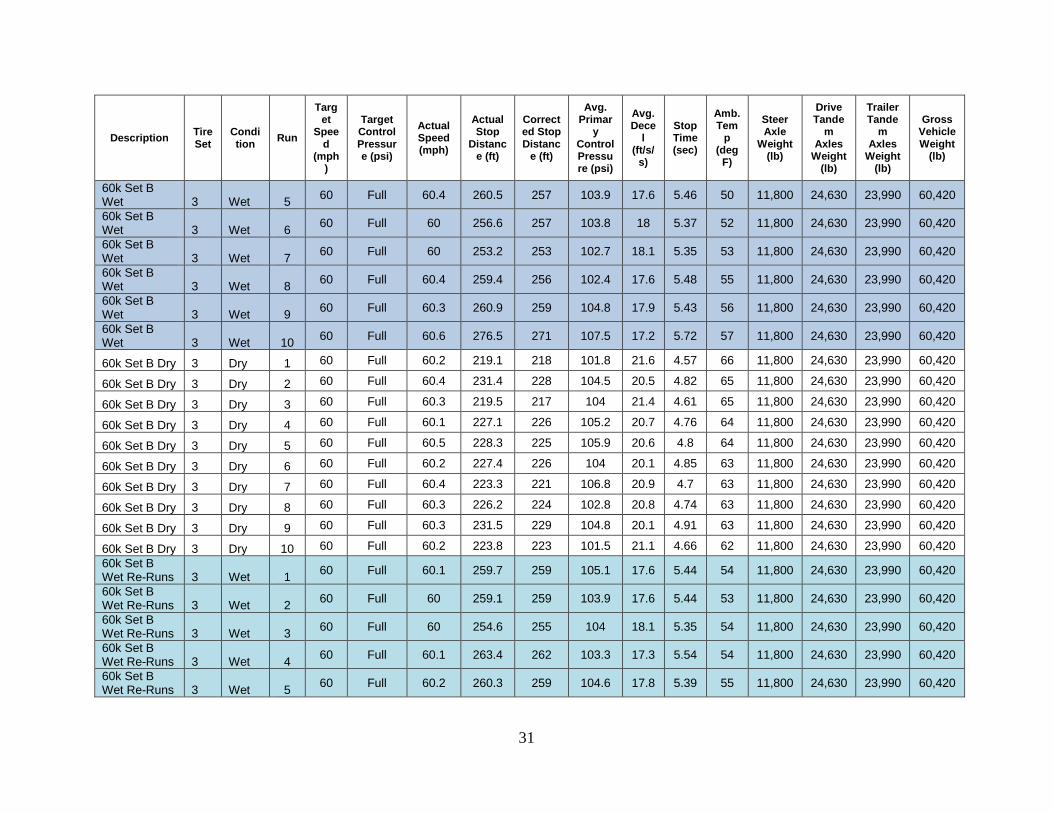
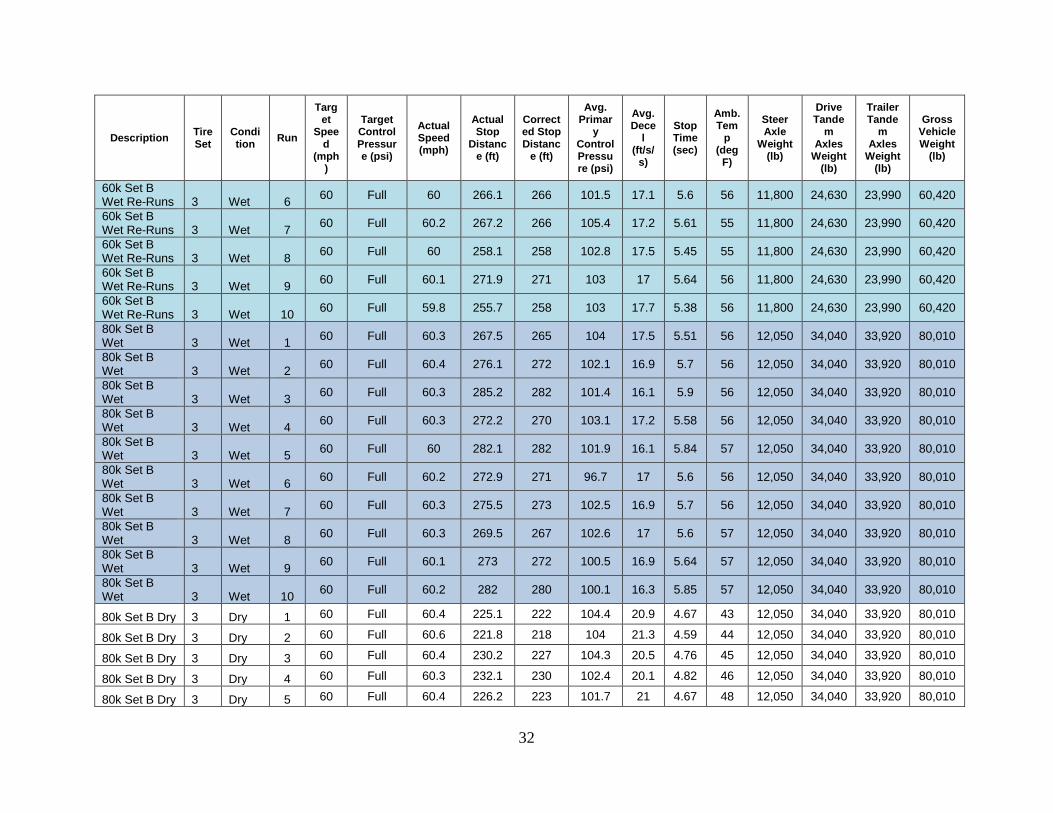
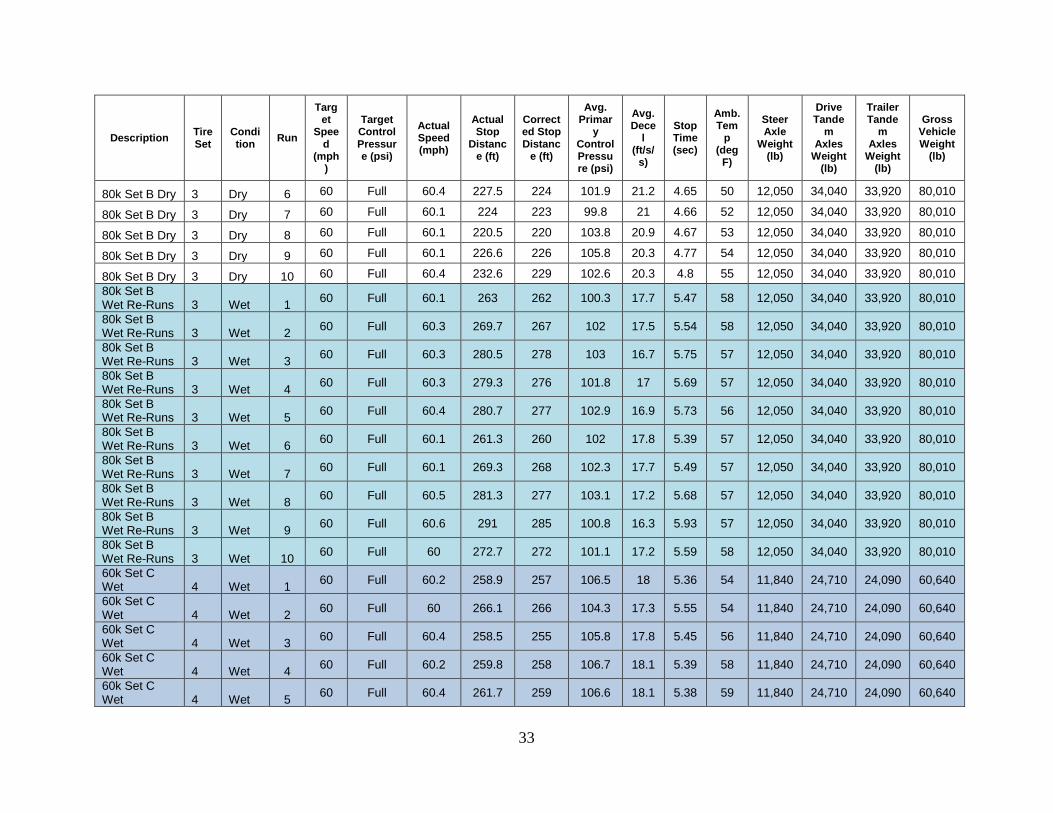
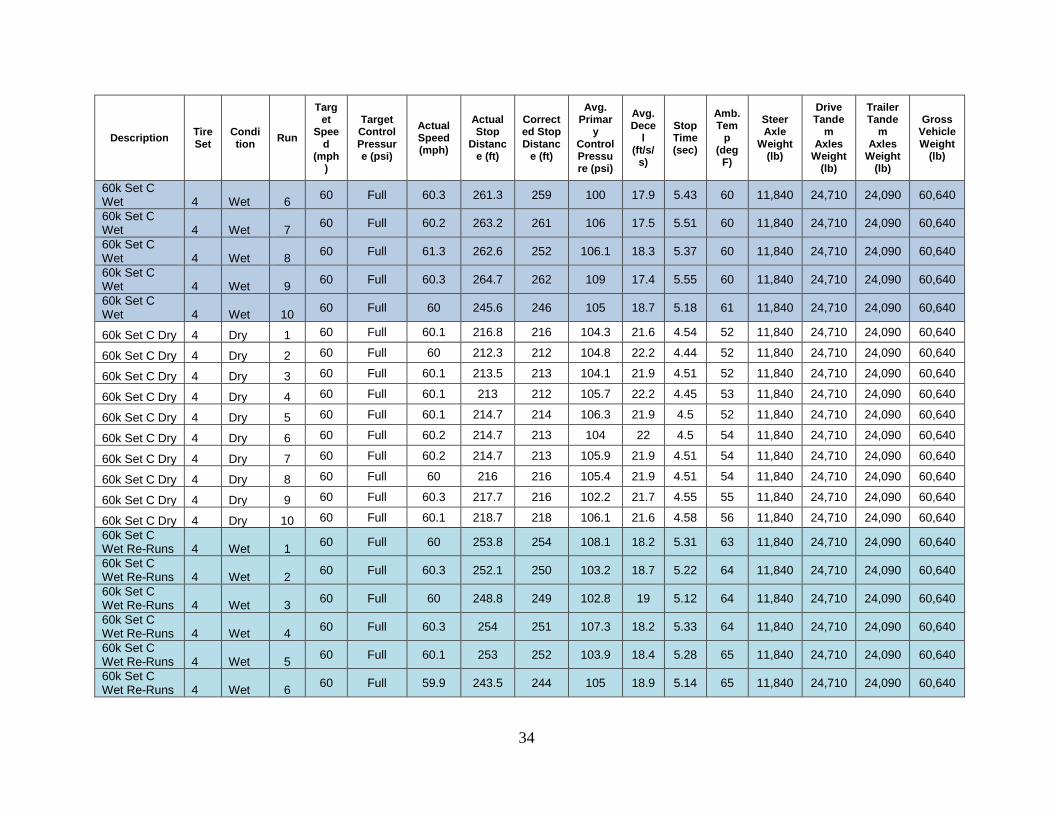
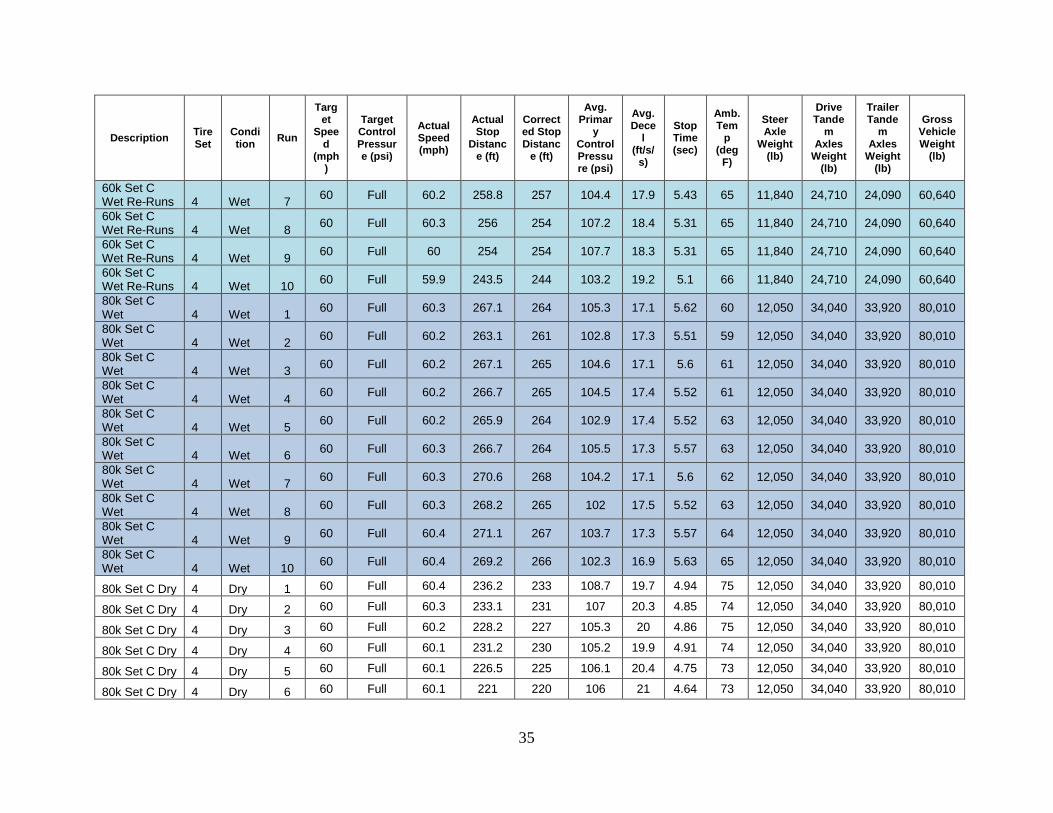
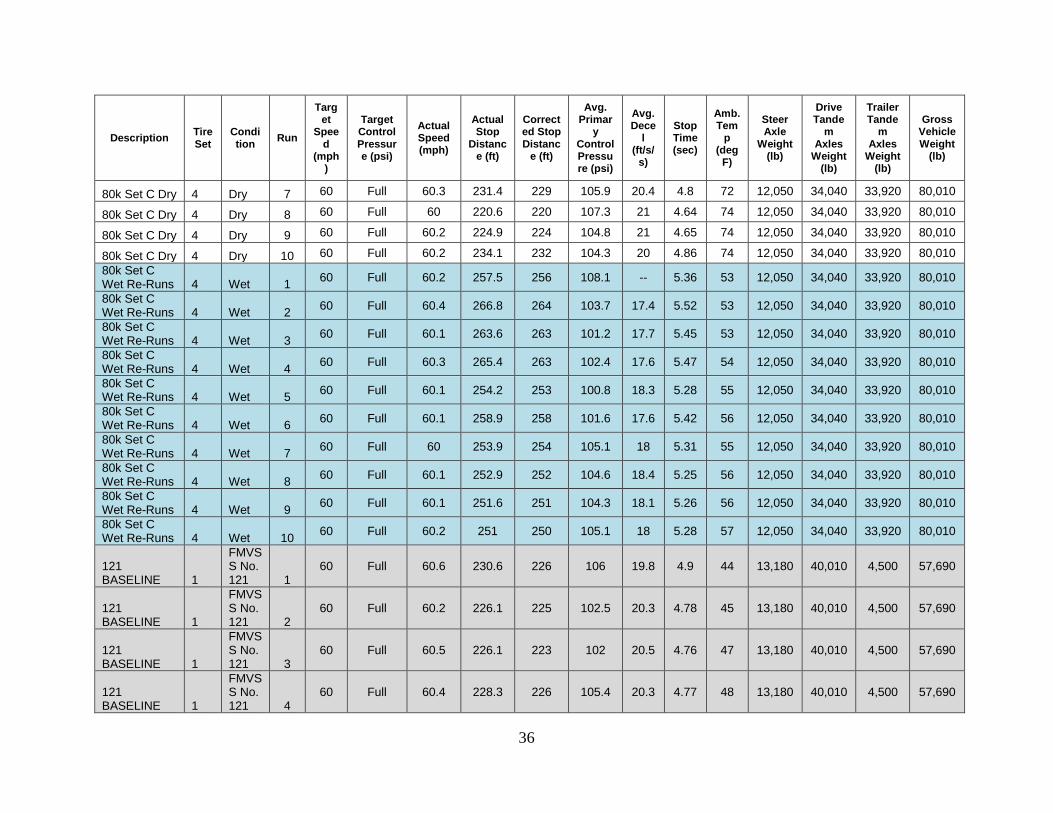
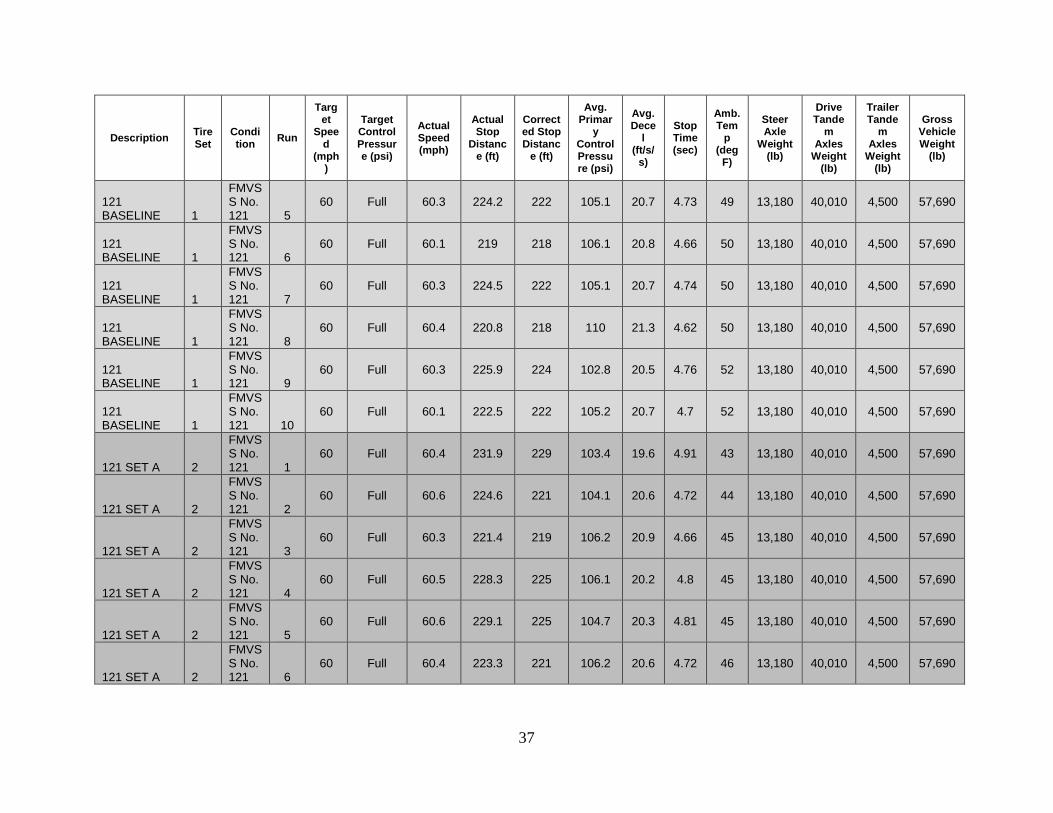
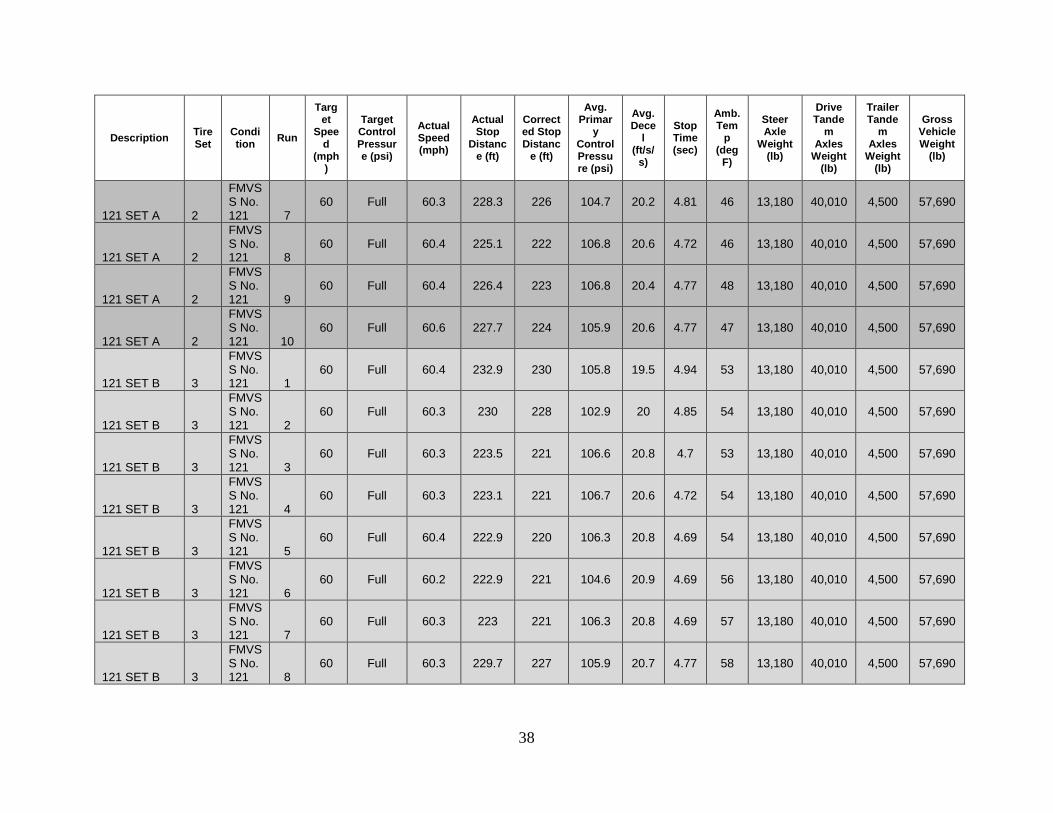
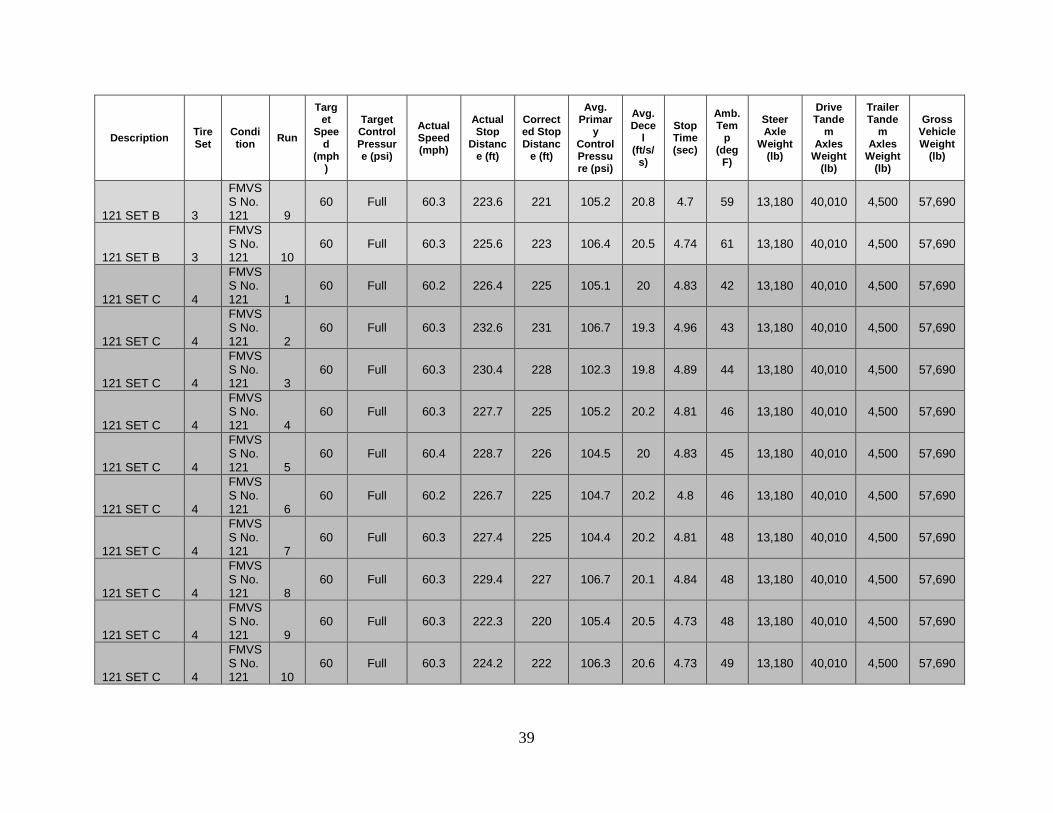
Appendix A – Stopping Distance Test Results
Description Tire Set
Condition Run
Target
Speed
(mph)
Target Control Pressure (psi)
Actual Speed (mph)
Actual Stop
Distance (ft)
Corrected Stop Distanc
e (ft)
Avg. Primar
y Control Pressure (psi)
Avg. Dece
l (ft/s/
s)
Stop Time (sec)
Amb. Tem
p (deg
F)
Steer Axle
Weight (lb)
Drive Tande
m Axles
Weight (lb)
Trailer Tande
m Axles
Weight (lb)
Gross Vehicle Weight
(lb)
60k Base Wet 1 Wet 1 60 Full 60.1 243.2 242 103.6 18.6 5.18 63 11,790 24,450 23,950 60,190
60k Base Wet 1 Wet 2 60 Full 59.9 248.9 250 106.3 18.1 5.27 65 11,790 24,450 23,950 60,190
60k Base Wet 1 Wet 3 60 Full 60.1 249.9 249 103.9 18.2 5.3 67 11,790 24,450 23,950 60,190
60k Base Wet 1 Wet 4 60 Full 60.1 245.2 245 100.3 18.3 5.25 68 11,790 24,450 23,950 60,190
60k Base Wet 1 Wet 5 60 Full 60.1 255.6 254 102.1 18.1 5.35 71 11,790 24,450 23,950 60,190
60k Base Wet 1 Wet 6 60 Full 60.4 263.3 260 99 17.4 5.55 74 11,790 24,450 23,950 60,190
60k Base Wet 1 Wet 7 60 Full 60.6 256 251 102.3 18.1 5.38 73 11,790 24,450 23,950 60,190
60k Base Wet 1 Wet 8 60 Full 60.3 259.5 257 107 17.5 5.5 72 11,790 24,450 23,950 60,190
60k Base Wet 1 Wet 9 60 Full 60.2 261.1 259 99.9 17.2 5.56 74 11,790 24,450 23,950 60,190
60k Base Wet 1 Wet 10 60 Full 60.4 263.5 260 98.7 17.6 5.5 75 11,790 24,450 23,950 60,190
60k Base Dry 1 Dry 1 60 Full 60.4 218.7 216 98.3 21.3 4.64 75 11,790 24,450 23,950 60,190
60k Base Dry 1 Dry 2 60 Full 60.3 221.5 219 102.9 21.5 4.63 76 11,790 24,450 23,950 60,190
60k Base Dry 1 Dry 3 60 Full 60.3 222.6 220 107.2 21.2 4.7 76 11,790 24,450 23,950 60,190
60k Base Dry 1 Dry 4 60 Full 60.2 218.2 217 104.2 21.5 4.58 77 11,790 24,450 23,950 60,190
60k Base Dry 1 Dry 5 60 Full 60.1 226.2 226 104.3 21 4.74 77 11,790 24,450 23,950 60,190
60k Base Dry 1 Dry 6 60 Full 60.4 227.7 225 107 20.9 4.74 77 11,790 24,450 23,950 60,190
60k Base Dry 1 Dry 7 60 Full 60.2 221.9 221 107.3 21.4 4.63 78 11,790 24,450 23,950 60,190
60k Base Dry 1 Dry 8 60 Full 60.1 218.9 218 106.7 21.7 4.57 80 11,790 24,450 23,950 60,190
60k Base Dry 1 Dry 9 60 Full 60.1 222 222 107.5 21.3 4.64 80 11,790 24,450 23,950 60,190
60k Base Dry 1 Dry 10 60 Full 60.1 211.6 211 106.3 21.5 4.57 79 11,790 24,450 23,950 60,190 60k Base Wet Re-Runs 1 Wet 1 60 Full 60.2 263.7 262 104.5 17.7 5.47 79 11,790 24,450 23,950 60,190
26
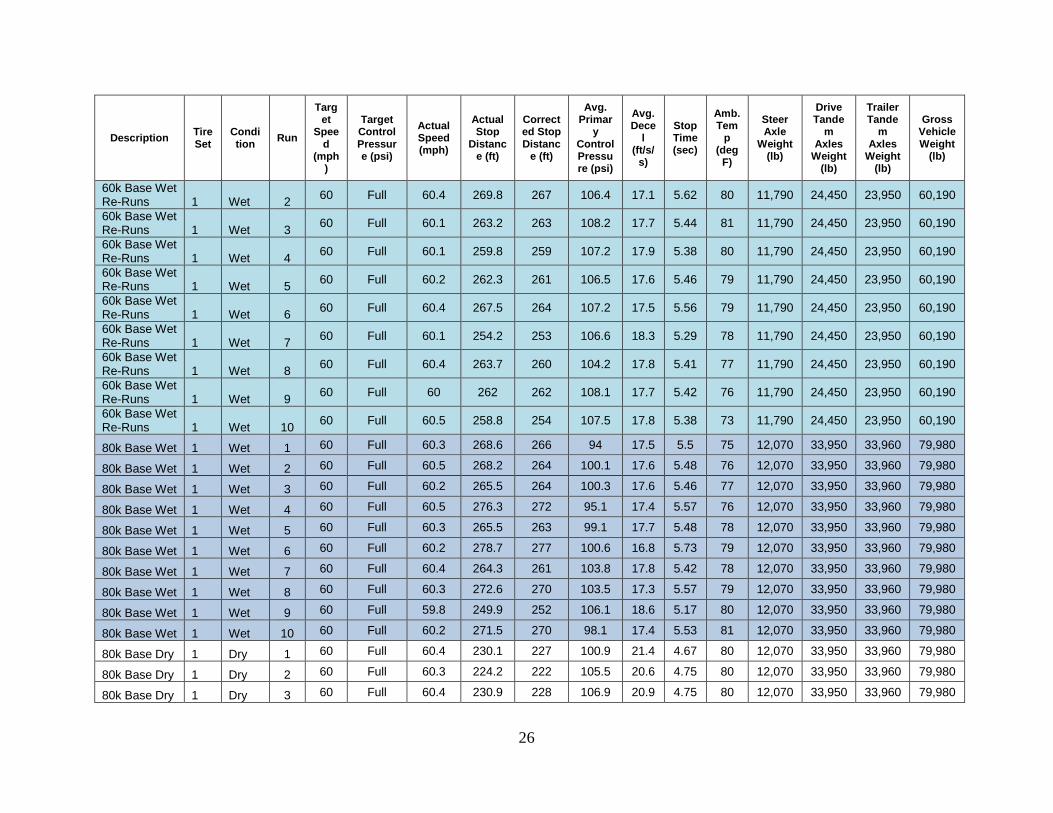
Description Tire Set
Condition Run
Target
Speed
(mph)
Target Control Pressure (psi)
Actual Speed (mph)
Actual Stop
Distance (ft)
Corrected Stop Distanc
e (ft)
Avg. Primar
y Control Pressure (psi)
Avg. Dece
l (ft/s/
s)
Stop Time (sec)
Amb. Tem
p (deg
F)
Steer Axle
Weight (lb)
Drive Tande
m Axles
Weight (lb)
Trailer Tande
m Axles
Weight (lb)
Gross Vehicle Weight
(lb)
60k Base Wet Re-Runs 1 Wet 2 60 Full 60.4 269.8 267 106.4 17.1 5.62 80 11,790 24,450 23,950 60,190
60k Base Wet Re-Runs 1 Wet 3 60 Full 60.1 263.2 263 108.2 17.7 5.44 81 11,790 24,450 23,950 60,190
60k Base Wet Re-Runs 1 Wet 4 60 Full 60.1 259.8 259 107.2 17.9 5.38 80 11,790 24,450 23,950 60,190
60k Base Wet Re-Runs 1 Wet 5 60 Full 60.2 262.3 261 106.5 17.6 5.46 79 11,790 24,450 23,950 60,190
60k Base Wet Re-Runs 1 Wet 6 60 Full 60.4 267.5 264 107.2 17.5 5.56 79 11,790 24,450 23,950 60,190
60k Base Wet Re-Runs 1 Wet 7 60 Full 60.1 254.2 253 106.6 18.3 5.29 78 11,790 24,450 23,950 60,190
60k Base Wet Re-Runs 1 Wet 8 60 Full 60.4 263.7 260 104.2 17.8 5.41 77 11,790 24,450 23,950 60,190
60k Base Wet Re-Runs 1 Wet 9 60 Full 60 262 262 108.1 17.7 5.42 76 11,790 24,450 23,950 60,190
60k Base Wet Re-Runs 1 Wet 10 60 Full 60.5 258.8 254 107.5 17.8 5.38 73 11,790 24,450 23,950 60,190
80k Base Wet 1 Wet 1 60 Full 60.3 268.6 266 94 17.5 5.5 75 12,070 33,950 33,960 79,980
80k Base Wet 1 Wet 2 60 Full 60.5 268.2 264 100.1 17.6 5.48 76 12,070 33,950 33,960 79,980
80k Base Wet 1 Wet 3 60 Full 60.2 265.5 264 100.3 17.6 5.46 77 12,070 33,950 33,960 79,980
80k Base Wet 1 Wet 4 60 Full 60.5 276.3 272 95.1 17.4 5.57 76 12,070 33,950 33,960 79,980
80k Base Wet 1 Wet 5 60 Full 60.3 265.5 263 99.1 17.7 5.48 78 12,070 33,950 33,960 79,980
80k Base Wet 1 Wet 6 60 Full 60.2 278.7 277 100.6 16.8 5.73 79 12,070 33,950 33,960 79,980
80k Base Wet 1 Wet 7 60 Full 60.4 264.3 261 103.8 17.8 5.42 78 12,070 33,950 33,960 79,980
80k Base Wet 1 Wet 8 60 Full 60.3 272.6 270 103.5 17.3 5.57 79 12,070 33,950 33,960 79,980
80k Base Wet 1 Wet 9 60 Full 59.8 249.9 252 106.1 18.6 5.17 80 12,070 33,950 33,960 79,980
80k Base Wet 1 Wet 10 60 Full 60.2 271.5 270 98.1 17.4 5.53 81 12,070 33,950 33,960 79,980
80k Base Dry 1 Dry 1 60 Full 60.4 230.1 227 100.9 21.4 4.67 80 12,070 33,950 33,960 79,980
80k Base Dry 1 Dry 2 60 Full 60.3 224.2 222 105.5 20.6 4.75 80 12,070 33,950 33,960 79,980
80k Base Dry 1 Dry 3 60 Full 60.4 230.9 228 106.9 20.9 4.75 80 12,070 33,950 33,960 79,980
27
Description Tire Set
Condition Run
Target
Speed
(mph)
Target Control Pressure (psi)
Actual Speed (mph)
Actual Stop
Distance (ft)
Corrected Stop Distanc
e (ft)
Avg. Primar
y Control Pressure (psi)
Avg. Dece
l (ft/s/
s)
Stop Time (sec)
Amb. Tem
p (deg
F)
Steer Axle
Weight (lb)
Drive Tande
m Axles
Weight (lb)
Trailer Tande
m Axles
Weight (lb)
Gross Vehicle Weight
(lb)
80k Base Dry 1 Dry 4 60 Full 60.3 228.5 226 104 21.1 4.68 79 12,070 33,950 33,960 79,980
80k Base Dry 1 Dry 5 60 Full 60.5 226.8 223 101.1 20.3 4.78 77 12,070 33,950 33,960 79,980
80k Base Dry 1 Dry 6 60 Full 60.3 229.7 228 106.3 21.1 4.69 78 12,070 33,950 33,960 79,980
80k Base Dry 1 Dry 7 60 Full 60.3 225.5 223 105.7 21.2 4.66 75 12,070 33,950 33,960 79,980
80k Base Dry 1 Dry 8 60 Full 60.3 217.5 216 100.7 21.9 4.48 76 12,070 33,950 33,960 79,980
80k Base Dry 1 Dry 9 60 Full 60.5 225.5 222 100.1 20.6 4.7 73 12,070 33,950 33,960 79,980
80k Base Dry 1 Dry 10 60 Full 60.6 227 222 103.2 20.9 4.68 69 12,070 33,950 33,960 79,980 80k Base Wet Re-Runs 1 Wet 1 60 Full 60.1 254.1 253 101.8 18.3 5.22 55 12,070 33,950 33,960 79,980
80k Base Wet Re-Runs 1 Wet 2 60 Full 60 252.1 252 103.1 18.7 5.14 56 12,070 33,950 33,960 79,980
80k Base Wet Re-Runs 1 Wet 3 60 Full 59.2 245.5 252 99.2 18.2 5.16 58 12,070 33,950 33,960 79,980
80k Base Wet Re-Runs 1 Wet 4 60 Full 60.3 264.6 262 98.1 17.9 5.34 61 12,070 33,950 33,960 79,980
80k Base Wet Re-Runs 1 Wet 5 60 Full 60.6 264.3 260 97.2 18.2 5.29 62 12,070 33,950 33,960 79,980
80k Base Wet Re-Runs 1 Wet 6 60 Full 60.3 262.6 260 102.9 17.9 5.37 63 12,070 33,950 33,960 79,980
80k Base Wet Re-Runs 1 Wet 7 60 Full 60.1 264.4 263 97.9 17.9 5.39 65 12,070 33,950 33,960 79,980
80k Base Wet Re-Runs 1 Wet 8 60 Full 60.3 262.8 260 100.9 17.8 5.37 66 12,070 33,950 33,960 79,980
80k Base Wet Re-Runs 1 Wet 9 60 Full 60.3 266.7 264 101.4 18 5.38 68 12,070 33,950 33,960 79,980
80k Base Wet Re-Runs 1 Wet 10 60 Full 60.3 267.4 265 101.6 17.8 5.41 70 12,070 33,950 33,960 79,980
60k Set A Wet 2 Wet 1 60 Full 60.3 259.1 257 104.1 17.6 5.39 52 11,800 24,630 23,990 60,420
60k Set A Wet 2 Wet 2 60 Full 60.2 255.8 254 102.4 17.7 5.39 52 11,800 24,630 23,990 60,420
60k Set A Wet 2 Wet 3 60 Full 59.9 258.2 259 103.4 17.9 5.34 52 11,800 24,630 23,990 60,420
28
Description Tire Set
Condition Run
Target
Speed
(mph)
Target Control Pressure (psi)
Actual Speed (mph)
Actual Stop
Distance (ft)
Corrected Stop Distanc
e (ft)
Avg. Primar
y Control Pressure (psi)
Avg. Dece
l (ft/s/
s)
Stop Time (sec)
Amb. Tem
p (deg
F)
Steer Axle
Weight (lb)
Drive Tande
m Axles
Weight (lb)
Trailer Tande
m Axles
Weight (lb)
Gross Vehicle Weight
(lb)
60k Set A Wet 2 Wet 4 60 Full 60.3 260.4 258 104.3 17.9 5.39 53 11,800 24,630 23,990 60,420
60k Set A Wet 2 Wet 5 60 Full 60.5 263.9 260 102.6 17.3 5.54 54 11,800 24,630 23,990 60,420
60k Set A Wet 2 Wet 6 60 Full 60.2 255.1 253 103.8 18 5.34 55 11,800 24,630 23,990 60,420
60k Set A Wet 2 Wet 7 60 Full 60.3 270.7 268 104 17 5.64 57 11,800 24,630 23,990 60,420
60k Set A Wet 2 Wet 8 60 Full 60.3 254.9 252 103.8 18.6 5.24 57 11,800 24,630 23,990 60,420
60k Set A Wet 2 Wet 9 60 Full 60.3 257.8 255 99.8 18.3 5.3 59 11,800 24,630 23,990 60,420
60k Set A Wet 2 Wet 10 60 Full 60.2 262.3 261 104.6 17.5 5.48 59 11,800 24,630 23,990 60,420
60k Set A Dry 2 Dry 1 60 Full 60.3 222.2 220 99.9 20.9 4.64 61 11,800 24,630 23,990 60,420
60k Set A Dry 2 Dry 2 60 Full 60 207.2 207 105.9 22.7 4.35 59 11,800 24,630 23,990 60,420
60k Set A Dry 2 Dry 3 60 Full 60.5 214.9 212 105.9 21.9 4.51 61 11,800 24,630 23,990 60,420
60k Set A Dry 2 Dry 4 60 Full 60.2 209.9 209 105.2 22.6 4.39 60 11,800 24,630 23,990 60,420
60k Set A Dry 2 Dry 5 60 Full 60 212.5 212 101.7 21.7 4.54 62 11,800 24,630 23,990 60,420
60k Set A Dry 2 Dry 6 60 Full 60.2 208.3 207 106.4 22.4 4.39 61 11,800 24,630 23,990 60,420
60k Set A Dry 2 Dry 7 60 Full 60.1 207.9 207 107.5 22.3 4.42 63 11,800 24,630 23,990 60,420
60k Set A Dry 2 Dry 8 60 Full 60.2 214 213 100.4 22 4.48 64 11,800 24,630 23,990 60,420
60k Set A Dry 2 Dry 9 60 Full 60.4 216 213 107.2 21.8 4.54 65 11,800 24,630 23,990 60,420
60k Set A Dry 2 Dry 10 60 Full 60.2 211.5 210 105.3 22.2 4.45 66 11,800 24,630 23,990 60,420 60k Set A Wet Re-Runs 2 Wet 1 60 Full 60.4 247.6 244 105.3 18.6 5.17 53 11,800 24,630 23,990 60,420
60k Set A Wet Re-Runs 2 Wet 2 60 Full 60 253 253 105.7 18.1 5.27 53 11,800 24,630 23,990 60,420
60k Set A Wet Re-Runs 2 Wet 3 60 Full 60.1 253 252 104.1 18 5.31 54 11,800 24,630 23,990 60,420
60k Set A Wet Re-Runs 2 Wet 4 60 Full 59.9 257.6 259 100.7 17.6 5.41 55 11,800 24,630 23,990 60,420
29
Description Tire Set
Condition Run
Target
Speed
(mph)
Target Control Pressure (psi)
Actual Speed (mph)
Actual Stop
Distance (ft)
Corrected Stop Distanc
e (ft)
Avg. Primar
y Control Pressure (psi)
Avg. Dece
l (ft/s/
s)
Stop Time (sec)
Amb. Tem
p (deg
F)
Steer Axle
Weight (lb)
Drive Tande
m Axles
Weight (lb)
Trailer Tande
m Axles
Weight (lb)
Gross Vehicle Weight
(lb)
60k Set A Wet Re-Runs 2 Wet 5 60 Full 60.4 263.8 260 107.7 17.4 5.51 58 11,800 24,630 23,990 60,420
60k Set A Wet Re-Runs 2 Wet 6 60 Full 60.4 260.7 257 105.2 17.8 5.38 61 11,800 24,630 23,990 60,420
60k Set A Wet Re-Runs 2 Wet 7 60 Full 60.3 270.5 268 104 17.1 5.6 63 11,800 24,630 23,990 60,420
60k Set A Wet Re-Runs 2 Wet 8 60 Full 60.2 263.4 262 103.2 17.4 5.53 66 11,800 24,630 23,990 60,420
60k Set A Wet Re-Runs 2 Wet 9 60 Full 60 255.5 255 106.6 17.9 5.35 68 11,800 24,630 23,990 60,420
60k Set A Wet Re-Runs 2 Wet 10 60 Full 60.2 275.2 273 103.7 16.9 5.67 69 11,800 24,630 23,990 60,420
80k Set A Wet 2 Wet 1 60 Full 60.2 270.2 269 104.3 17 5.61 77 12,070 33,950 33,960 79,980
80k Set A Wet 2 Wet 2 60 Full 60.2 264.4 263 103.3 17.1 5.54 78 12,070 33,950 33,960 79,980
80k Set A Wet 2 Wet 3 60 Full 60.4 269.6 266 104.3 17.5 5.51 78 12,070 33,950 33,960 79,980
80k Set A Wet 2 Wet 4 60 Full 60.3 286.1 283 102.6 16.3 5.86 79 12,070 33,950 33,960 79,980
80k Set A Wet 2 Wet 5 60 Full 60.5 277 273 94.2 17 5.66 79 12,070 33,950 33,960 79,980
80k Set A Wet 2 Wet 6 60 Full 61 282.8 274 107.9 16.6 5.78 79 12,070 33,950 33,960 79,980
80k Set A Wet 2 Wet 7 60 Full 60.5 277.6 273 104.2 17 5.68 78 12,070 33,950 33,960 79,980
80k Set A Wet 2 Wet 8 60 Full 60.5 287.1 283 107.9 16.4 5.91 80 12,070 33,950 33,960 79,980
80k Set A Wet 2 Wet 9 60 Full 60.4 277.2 274 105.2 17 5.67 81 12,070 33,950 33,960 79,980
80k Set A Wet 2 Wet 10 60 Full 60.7 277.2 271 101.9 17 5.71 79 12,070 33,950 33,960 79,980
80k Set A Dry 2 Dry 1 60 Full 60.7 231.6 227 104 20.8 4.76 79 12,070 33,950 33,960 79,980
80k Set A Dry 2 Dry 2 60 Full 60.6 224.6 221 102.7 21.6 4.59 78 12,070 33,950 33,960 79,980
80k Set A Dry 2 Dry 3 60 Full 60.6 236.6 232 103.8 20.2 4.89 78 12,070 33,950 33,960 79,980
80k Set A Dry 2 Dry 4 60 Full 60.7 228.8 223 101 20.8 4.74 78 12,070 33,950 33,960 79,980

30
Description Tire Set
Condition Run
Target
Speed
(mph)
Target Control Pressure (psi)
Actual Speed (mph)
Actual Stop
Distance (ft)
Corrected Stop Distanc
e (ft)
Avg. Primar
y Control Pressure (psi)
Avg. Dece
l (ft/s/
s)
Stop Time (sec)
Amb. Tem
p (deg
F)
Steer Axle
Weight (lb)
Drive Tande
m Axles
Weight (lb)
Trailer Tande
m Axles
Weight (lb)
Gross Vehicle Weight
(lb)
80k Set A Dry 2 Dry 5 60 Full 60.5 228.2 225 102.8 20.5 4.77 78 12,070 33,950 33,960 79,980
80k Set A Dry 2 Dry 6 60 Full 60.5 228.9 225 102.9 21 4.69 77 12,070 33,950 33,960 79,980
80k Set A Dry 2 Dry 7 60 Full 60.4 233.7 230 102.6 20.6 4.76 77 12,070 33,950 33,960 79,980
80k Set A Dry 2 Dry 8 60 Full 60.1 225.7 225 102.9 20.9 4.67 76 12,070 33,950 33,960 79,980
80k Set A Dry 2 Dry 9 60 Full 60.3 226.4 224 104.5 20.6 4.69 74 12,070 33,950 33,960 79,980
80k Set A Dry 2 Dry 10 60 Full 60.4 224.7 222 103.9 20.2 4.79 72 12,070 33,950 33,960 79,980 80k Set A Wet Re-Runs 2 Wet 1 60 Full 60.1 252.8 252 104.1 18.6 5.17 59 12,070 33,950 33,960 79,980
80k Set A Wet Re-Runs 2 Wet 2 60 Full 60.2 260.9 259 102.5 17.4 5.47 59 12,070 33,950 33,960 79,980
80k Set A Wet Re-Runs 2 Wet 3 60 Full 60.1 263.5 262 102.3 17.3 5.46 60 12,070 33,950 33,960 79,980
80k Set A Wet Re-Runs 2 Wet 4 60 Full 60.4 259.8 257 104.8 18 5.33 61 12,070 33,950 33,960 79,980
80k Set A Wet Re-Runs 2 Wet 5 60 Full 60.4 269 266 101.8 17.3 5.53 61 12,070 33,950 33,960 79,980
80k Set A Wet Re-Runs 2 Wet 6 60 Full 60.5 262.5 258 100.9 17.6 5.45 62 12,070 33,950 33,960 79,980
80k Set A Wet Re-Runs 2 Wet 7 60 Full 60.2 262.5 261 103.8 17.7 5.38 61 12,070 33,950 33,960 79,980
80k Set A Wet Re-Runs 2 Wet 8 60 Full 60.1 271.5 270 102.3 17.1 5.61 61 12,070 33,950 33,960 79,980
80k Set A Wet Re-Runs 2 Wet 9 60 Full 59.8 262.8 265 103.2 17.1 5.52 61 12,070 33,950 33,960 79,980
80k Set A Wet Re-Runs 2 Wet 10 60 Full 60.1 265.8 265 103.9 17.2 5.54 60 12,070 33,950 33,960 79,980
60k Set B Wet 3 Wet 1 60 Full 60.1 258.5 257 103 17.6 5.44 47 11,800 24,630 23,990 60,420
60k Set B Wet 3 Wet 2 60 Full 60.1 262.7 262 101.5 17.3 5.52 48 11,800 24,630 23,990 60,420
60k Set B Wet 3 Wet 3 60 Full 60.3 265.3 263 104.2 17 5.65 49 11,800 24,630 23,990 60,420
60k Set B Wet 3 Wet 4 60 Full 60.3 263 260 100.6 17.6 5.52 50 11,800 24,630 23,990 60,420
31
Description Tire Set
Condition Run
Target
Speed
(mph)
Target Control Pressure (psi)
Actual Speed (mph)
Actual Stop
Distance (ft)
Corrected Stop Distanc
e (ft)
Avg. Primar
y Control Pressure (psi)
Avg. Dece
l (ft/s/
s)
Stop Time (sec)
Amb. Tem
p (deg
F)
Steer Axle
Weight (lb)
Drive Tande
m Axles
Weight (lb)
Trailer Tande
m Axles
Weight (lb)
Gross Vehicle Weight
(lb)
60k Set B Wet 3 Wet 5 60 Full 60.4 260.5 257 103.9 17.6 5.46 50 11,800 24,630 23,990 60,420
60k Set B Wet 3 Wet 6 60 Full 60 256.6 257 103.8 18 5.37 52 11,800 24,630 23,990 60,420
60k Set B Wet 3 Wet 7 60 Full 60 253.2 253 102.7 18.1 5.35 53 11,800 24,630 23,990 60,420
60k Set B Wet 3 Wet 8 60 Full 60.4 259.4 256 102.4 17.6 5.48 55 11,800 24,630 23,990 60,420
60k Set B Wet 3 Wet 9 60 Full 60.3 260.9 259 104.8 17.9 5.43 56 11,800 24,630 23,990 60,420
60k Set B Wet 3 Wet 10 60 Full 60.6 276.5 271 107.5 17.2 5.72 57 11,800 24,630 23,990 60,420
60k Set B Dry 3 Dry 1 60 Full 60.2 219.1 218 101.8 21.6 4.57 66 11,800 24,630 23,990 60,420
60k Set B Dry 3 Dry 2 60 Full 60.4 231.4 228 104.5 20.5 4.82 65 11,800 24,630 23,990 60,420
60k Set B Dry 3 Dry 3 60 Full 60.3 219.5 217 104 21.4 4.61 65 11,800 24,630 23,990 60,420
60k Set B Dry 3 Dry 4 60 Full 60.1 227.1 226 105.2 20.7 4.76 64 11,800 24,630 23,990 60,420
60k Set B Dry 3 Dry 5 60 Full 60.5 228.3 225 105.9 20.6 4.8 64 11,800 24,630 23,990 60,420
60k Set B Dry 3 Dry 6 60 Full 60.2 227.4 226 104 20.1 4.85 63 11,800 24,630 23,990 60,420
60k Set B Dry 3 Dry 7 60 Full 60.4 223.3 221 106.8 20.9 4.7 63 11,800 24,630 23,990 60,420
60k Set B Dry 3 Dry 8 60 Full 60.3 226.2 224 102.8 20.8 4.74 63 11,800 24,630 23,990 60,420
60k Set B Dry 3 Dry 9 60 Full 60.3 231.5 229 104.8 20.1 4.91 63 11,800 24,630 23,990 60,420
60k Set B Dry 3 Dry 10 60 Full 60.2 223.8 223 101.5 21.1 4.66 62 11,800 24,630 23,990 60,420 60k Set B Wet Re-Runs 3 Wet 1 60 Full 60.1 259.7 259 105.1 17.6 5.44 54 11,800 24,630 23,990 60,420
60k Set B Wet Re-Runs 3 Wet 2 60 Full 60 259.1 259 103.9 17.6 5.44 53 11,800 24,630 23,990 60,420
60k Set B Wet Re-Runs 3 Wet 3 60 Full 60 254.6 255 104 18.1 5.35 54 11,800 24,630 23,990 60,420
60k Set B Wet Re-Runs 3 Wet 4 60 Full 60.1 263.4 262 103.3 17.3 5.54 54 11,800 24,630 23,990 60,420
60k Set B Wet Re-Runs 3 Wet 5 60 Full 60.2 260.3 259 104.6 17.8 5.39 55 11,800 24,630 23,990 60,420
32
Description Tire Set
Condition Run
Target
Speed
(mph)
Target Control Pressure (psi)
Actual Speed (mph)
Actual Stop
Distance (ft)
Corrected Stop Distanc
e (ft)
Avg. Primar
y Control Pressure (psi)
Avg. Dece
l (ft/s/
s)
Stop Time (sec)
Amb. Tem
p (deg
F)
Steer Axle
Weight (lb)
Drive Tande
m Axles
Weight (lb)
Trailer Tande
m Axles
Weight (lb)
Gross Vehicle Weight
(lb)
60k Set B Wet Re-Runs 3 Wet 6 60 Full 60 266.1 266 101.5 17.1 5.6 56 11,800 24,630 23,990 60,420
60k Set B Wet Re-Runs 3 Wet 7 60 Full 60.2 267.2 266 105.4 17.2 5.61 55 11,800 24,630 23,990 60,420
60k Set B Wet Re-Runs 3 Wet 8 60 Full 60 258.1 258 102.8 17.5 5.45 55 11,800 24,630 23,990 60,420
60k Set B Wet Re-Runs 3 Wet 9 60 Full 60.1 271.9 271 103 17 5.64 56 11,800 24,630 23,990 60,420
60k Set B Wet Re-Runs 3 Wet 10 60 Full 59.8 255.7 258 103 17.7 5.38 56 11,800 24,630 23,990 60,420
80k Set B Wet 3 Wet 1 60 Full 60.3 267.5 265 104 17.5 5.51 56 12,050 34,040 33,920 80,010
80k Set B Wet 3 Wet 2 60 Full 60.4 276.1 272 102.1 16.9 5.7 56 12,050 34,040 33,920 80,010
80k Set B Wet 3 Wet 3 60 Full 60.3 285.2 282 101.4 16.1 5.9 56 12,050 34,040 33,920 80,010
80k Set B Wet 3 Wet 4 60 Full 60.3 272.2 270 103.1 17.2 5.58 56 12,050 34,040 33,920 80,010
80k Set B Wet 3 Wet 5 60 Full 60 282.1 282 101.9 16.1 5.84 57 12,050 34,040 33,920 80,010
80k Set B Wet 3 Wet 6 60 Full 60.2 272.9 271 96.7 17 5.6 56 12,050 34,040 33,920 80,010
80k Set B Wet 3 Wet 7 60 Full 60.3 275.5 273 102.5 16.9 5.7 56 12,050 34,040 33,920 80,010
80k Set B Wet 3 Wet 8 60 Full 60.3 269.5 267 102.6 17 5.6 57 12,050 34,040 33,920 80,010
80k Set B Wet 3 Wet 9 60 Full 60.1 273 272 100.5 16.9 5.64 57 12,050 34,040 33,920 80,010
80k Set B Wet 3 Wet 10 60 Full 60.2 282 280 100.1 16.3 5.85 57 12,050 34,040 33,920 80,010
80k Set B Dry 3 Dry 1 60 Full 60.4 225.1 222 104.4 20.9 4.67 43 12,050 34,040 33,920 80,010
80k Set B Dry 3 Dry 2 60 Full 60.6 221.8 218 104 21.3 4.59 44 12,050 34,040 33,920 80,010
80k Set B Dry 3 Dry 3 60 Full 60.4 230.2 227 104.3 20.5 4.76 45 12,050 34,040 33,920 80,010
80k Set B Dry 3 Dry 4 60 Full 60.3 232.1 230 102.4 20.1 4.82 46 12,050 34,040 33,920 80,010
80k Set B Dry 3 Dry 5 60 Full 60.4 226.2 223 101.7 21 4.67 48 12,050 34,040 33,920 80,010
33
Description Tire Set
Condition Run
Target
Speed
(mph)
Target Control Pressure (psi)
Actual Speed (mph)
Actual Stop
Distance (ft)
Corrected Stop Distanc
e (ft)
Avg. Primar
y Control Pressure (psi)
Avg. Dece
l (ft/s/
s)
Stop Time (sec)
Amb. Tem
p (deg
F)
Steer Axle
Weight (lb)
Drive Tande
m Axles
Weight (lb)
Trailer Tande
m Axles
Weight (lb)
Gross Vehicle Weight
(lb)
80k Set B Dry 3 Dry 6 60 Full 60.4 227.5 224 101.9 21.2 4.65 50 12,050 34,040 33,920 80,010
80k Set B Dry 3 Dry 7 60 Full 60.1 224 223 99.8 21 4.66 52 12,050 34,040 33,920 80,010
80k Set B Dry 3 Dry 8 60 Full 60.1 220.5 220 103.8 20.9 4.67 53 12,050 34,040 33,920 80,010
80k Set B Dry 3 Dry 9 60 Full 60.1 226.6 226 105.8 20.3 4.77 54 12,050 34,040 33,920 80,010
80k Set B Dry 3 Dry 10 60 Full 60.4 232.6 229 102.6 20.3 4.8 55 12,050 34,040 33,920 80,010 80k Set B Wet Re-Runs 3 Wet 1 60 Full 60.1 263 262 100.3 17.7 5.47 58 12,050 34,040 33,920 80,010
80k Set B Wet Re-Runs 3 Wet 2 60 Full 60.3 269.7 267 102 17.5 5.54 58 12,050 34,040 33,920 80,010
80k Set B Wet Re-Runs 3 Wet 3 60 Full 60.3 280.5 278 103 16.7 5.75 57 12,050 34,040 33,920 80,010
80k Set B Wet Re-Runs 3 Wet 4 60 Full 60.3 279.3 276 101.8 17 5.69 57 12,050 34,040 33,920 80,010
80k Set B Wet Re-Runs 3 Wet 5 60 Full 60.4 280.7 277 102.9 16.9 5.73 56 12,050 34,040 33,920 80,010
80k Set B Wet Re-Runs 3 Wet 6 60 Full 60.1 261.3 260 102 17.8 5.39 57 12,050 34,040 33,920 80,010
80k Set B Wet Re-Runs 3 Wet 7 60 Full 60.1 269.3 268 102.3 17.7 5.49 57 12,050 34,040 33,920 80,010
80k Set B Wet Re-Runs 3 Wet 8 60 Full 60.5 281.3 277 103.1 17.2 5.68 57 12,050 34,040 33,920 80,010
80k Set B Wet Re-Runs 3 Wet 9 60 Full 60.6 291 285 100.8 16.3 5.93 57 12,050 34,040 33,920 80,010
80k Set B Wet Re-Runs 3 Wet 10 60 Full 60 272.7 272 101.1 17.2 5.59 58 12,050 34,040 33,920 80,010
60k Set C Wet 4 Wet 1 60 Full 60.2 258.9 257 106.5 18 5.36 54 11,840 24,710 24,090 60,640
60k Set C Wet 4 Wet 2 60 Full 60 266.1 266 104.3 17.3 5.55 54 11,840 24,710 24,090 60,640
60k Set C Wet 4 Wet 3 60 Full 60.4 258.5 255 105.8 17.8 5.45 56 11,840 24,710 24,090 60,640
60k Set C Wet 4 Wet 4 60 Full 60.2 259.8 258 106.7 18.1 5.39 58 11,840 24,710 24,090 60,640
60k Set C Wet 4 Wet 5 60 Full 60.4 261.7 259 106.6 18.1 5.38 59 11,840 24,710 24,090 60,640
34
Description Tire Set
Condition Run
Target
Speed
(mph)
Target Control Pressure (psi)
Actual Speed (mph)
Actual Stop
Distance (ft)
Corrected Stop Distanc
e (ft)
Avg. Primar
y Control Pressure (psi)
Avg. Dece
l (ft/s/
s)
Stop Time (sec)
Amb. Tem
p (deg
F)
Steer Axle
Weight (lb)
Drive Tande
m Axles
Weight (lb)
Trailer Tande
m Axles
Weight (lb)
Gross Vehicle Weight
(lb)
60k Set C Wet 4 Wet 6 60 Full 60.3 261.3 259 100 17.9 5.43 60 11,840 24,710 24,090 60,640
60k Set C Wet 4 Wet 7 60 Full 60.2 263.2 261 106 17.5 5.51 60 11,840 24,710 24,090 60,640
60k Set C Wet 4 Wet 8 60 Full 61.3 262.6 252 106.1 18.3 5.37 60 11,840 24,710 24,090 60,640
60k Set C Wet 4 Wet 9 60 Full 60.3 264.7 262 109 17.4 5.55 60 11,840 24,710 24,090 60,640
60k Set C Wet 4 Wet 10 60 Full 60 245.6 246 105 18.7 5.18 61 11,840 24,710 24,090 60,640
60k Set C Dry 4 Dry 1 60 Full 60.1 216.8 216 104.3 21.6 4.54 52 11,840 24,710 24,090 60,640
60k Set C Dry 4 Dry 2 60 Full 60 212.3 212 104.8 22.2 4.44 52 11,840 24,710 24,090 60,640
60k Set C Dry 4 Dry 3 60 Full 60.1 213.5 213 104.1 21.9 4.51 52 11,840 24,710 24,090 60,640
60k Set C Dry 4 Dry 4 60 Full 60.1 213 212 105.7 22.2 4.45 53 11,840 24,710 24,090 60,640
60k Set C Dry 4 Dry 5 60 Full 60.1 214.7 214 106.3 21.9 4.5 52 11,840 24,710 24,090 60,640
60k Set C Dry 4 Dry 6 60 Full 60.2 214.7 213 104 22 4.5 54 11,840 24,710 24,090 60,640
60k Set C Dry 4 Dry 7 60 Full 60.2 214.7 213 105.9 21.9 4.51 54 11,840 24,710 24,090 60,640
60k Set C Dry 4 Dry 8 60 Full 60 216 216 105.4 21.9 4.51 54 11,840 24,710 24,090 60,640
60k Set C Dry 4 Dry 9 60 Full 60.3 217.7 216 102.2 21.7 4.55 55 11,840 24,710 24,090 60,640
60k Set C Dry 4 Dry 10 60 Full 60.1 218.7 218 106.1 21.6 4.58 56 11,840 24,710 24,090 60,640 60k Set C Wet Re-Runs 4 Wet 1 60 Full 60 253.8 254 108.1 18.2 5.31 63 11,840 24,710 24,090 60,640
60k Set C Wet Re-Runs 4 Wet 2 60 Full 60.3 252.1 250 103.2 18.7 5.22 64 11,840 24,710 24,090 60,640
60k Set C Wet Re-Runs 4 Wet 3 60 Full 60 248.8 249 102.8 19 5.12 64 11,840 24,710 24,090 60,640
60k Set C Wet Re-Runs 4 Wet 4 60 Full 60.3 254 251 107.3 18.2 5.33 64 11,840 24,710 24,090 60,640
60k Set C Wet Re-Runs 4 Wet 5 60 Full 60.1 253 252 103.9 18.4 5.28 65 11,840 24,710 24,090 60,640
60k Set C Wet Re-Runs 4 Wet 6 60 Full 59.9 243.5 244 105 18.9 5.14 65 11,840 24,710 24,090 60,640
35
Description Tire Set
Condition Run
Target
Speed
(mph)
Target Control Pressure (psi)
Actual Speed (mph)
Actual Stop
Distance (ft)
Corrected Stop Distanc
e (ft)
Avg. Primar
y Control Pressure (psi)
Avg. Dece
l (ft/s/
s)
Stop Time (sec)
Amb. Tem
p (deg
F)
Steer Axle
Weight (lb)
Drive Tande
m Axles
Weight (lb)
Trailer Tande
m Axles
Weight (lb)
Gross Vehicle Weight
(lb)
60k Set C Wet Re-Runs 4 Wet 7 60 Full 60.2 258.8 257 104.4 17.9 5.43 65 11,840 24,710 24,090 60,640
60k Set C Wet Re-Runs 4 Wet 8 60 Full 60.3 256 254 107.2 18.4 5.31 65 11,840 24,710 24,090 60,640
60k Set C Wet Re-Runs 4 Wet 9 60 Full 60 254 254 107.7 18.3 5.31 65 11,840 24,710 24,090 60,640
60k Set C Wet Re-Runs 4 Wet 10 60 Full 59.9 243.5 244 103.2 19.2 5.1 66 11,840 24,710 24,090 60,640
80k Set C Wet 4 Wet 1 60 Full 60.3 267.1 264 105.3 17.1 5.62 60 12,050 34,040 33,920 80,010
80k Set C Wet 4 Wet 2 60 Full 60.2 263.1 261 102.8 17.3 5.51 59 12,050 34,040 33,920 80,010
80k Set C Wet 4 Wet 3 60 Full 60.2 267.1 265 104.6 17.1 5.6 61 12,050 34,040 33,920 80,010
80k Set C Wet 4 Wet 4 60 Full 60.2 266.7 265 104.5 17.4 5.52 61 12,050 34,040 33,920 80,010
80k Set C Wet 4 Wet 5 60 Full 60.2 265.9 264 102.9 17.4 5.52 63 12,050 34,040 33,920 80,010
80k Set C Wet 4 Wet 6 60 Full 60.3 266.7 264 105.5 17.3 5.57 63 12,050 34,040 33,920 80,010
80k Set C Wet 4 Wet 7 60 Full 60.3 270.6 268 104.2 17.1 5.6 62 12,050 34,040 33,920 80,010
80k Set C Wet 4 Wet 8 60 Full 60.3 268.2 265 102 17.5 5.52 63 12,050 34,040 33,920 80,010
80k Set C Wet 4 Wet 9 60 Full 60.4 271.1 267 103.7 17.3 5.57 64 12,050 34,040 33,920 80,010
80k Set C Wet 4 Wet 10 60 Full 60.4 269.2 266 102.3 16.9 5.63 65 12,050 34,040 33,920 80,010
80k Set C Dry 4 Dry 1 60 Full 60.4 236.2 233 108.7 19.7 4.94 75 12,050 34,040 33,920 80,010
80k Set C Dry 4 Dry 2 60 Full 60.3 233.1 231 107 20.3 4.85 74 12,050 34,040 33,920 80,010
80k Set C Dry 4 Dry 3 60 Full 60.2 228.2 227 105.3 20 4.86 75 12,050 34,040 33,920 80,010
80k Set C Dry 4 Dry 4 60 Full 60.1 231.2 230 105.2 19.9 4.91 74 12,050 34,040 33,920 80,010
80k Set C Dry 4 Dry 5 60 Full 60.1 226.5 225 106.1 20.4 4.75 73 12,050 34,040 33,920 80,010
80k Set C Dry 4 Dry 6 60 Full 60.1 221 220 106 21 4.64 73 12,050 34,040 33,920 80,010
36
Description Tire Set
Condition Run
Target
Speed
(mph)
Target Control Pressure (psi)
Actual Speed (mph)
Actual Stop
Distance (ft)
Corrected Stop Distanc
e (ft)
Avg. Primar
y Control Pressure (psi)
Avg. Dece
l (ft/s/
s)
Stop Time (sec)
Amb. Tem
p (deg
F)
Steer Axle
Weight (lb)
Drive Tande
m Axles
Weight (lb)
Trailer Tande
m Axles
Weight (lb)
Gross Vehicle Weight
(lb)
80k Set C Dry 4 Dry 7 60 Full 60.3 231.4 229 105.9 20.4 4.8 72 12,050 34,040 33,920 80,010
80k Set C Dry 4 Dry 8 60 Full 60 220.6 220 107.3 21 4.64 74 12,050 34,040 33,920 80,010
80k Set C Dry 4 Dry 9 60 Full 60.2 224.9 224 104.8 21 4.65 74 12,050 34,040 33,920 80,010
80k Set C Dry 4 Dry 10 60 Full 60.2 234.1 232 104.3 20 4.86 74 12,050 34,040 33,920 80,010 80k Set C Wet Re-Runs 4 Wet 1 60 Full 60.2 257.5 256 108.1 -- 5.36 53 12,050 34,040 33,920 80,010
80k Set C Wet Re-Runs 4 Wet 2 60 Full 60.4 266.8 264 103.7 17.4 5.52 53 12,050 34,040 33,920 80,010
80k Set C Wet Re-Runs 4 Wet 3 60 Full 60.1 263.6 263 101.2 17.7 5.45 53 12,050 34,040 33,920 80,010
80k Set C Wet Re-Runs 4 Wet 4 60 Full 60.3 265.4 263 102.4 17.6 5.47 54 12,050 34,040 33,920 80,010
80k Set C Wet Re-Runs 4 Wet 5 60 Full 60.1 254.2 253 100.8 18.3 5.28 55 12,050 34,040 33,920 80,010
80k Set C Wet Re-Runs 4 Wet 6 60 Full 60.1 258.9 258 101.6 17.6 5.42 56 12,050 34,040 33,920 80,010
80k Set C Wet Re-Runs 4 Wet 7 60 Full 60 253.9 254 105.1 18 5.31 55 12,050 34,040 33,920 80,010
80k Set C Wet Re-Runs 4 Wet 8 60 Full 60.1 252.9 252 104.6 18.4 5.25 56 12,050 34,040 33,920 80,010
80k Set C Wet Re-Runs 4 Wet 9 60 Full 60.1 251.6 251 104.3 18.1 5.26 56 12,050 34,040 33,920 80,010
80k Set C Wet Re-Runs 4 Wet 10 60 Full 60.2 251 250 105.1 18 5.28 57 12,050 34,040 33,920 80,010
121 BASELINE 1
FMVSS No. 121 1
60 Full 60.6 230.6 226 106 19.8 4.9 44 13,180 40,010 4,500 57,690
121 BASELINE 1
FMVSS No. 121 2
60 Full 60.2 226.1 225 102.5 20.3 4.78 45 13,180 40,010 4,500 57,690
121 BASELINE 1
FMVSS No. 121 3
60 Full 60.5 226.1 223 102 20.5 4.76 47 13,180 40,010 4,500 57,690
121 BASELINE 1
FMVSS No. 121 4
60 Full 60.4 228.3 226 105.4 20.3 4.77 48 13,180 40,010 4,500 57,690
37
Description Tire Set
Condition Run
Target
Speed
(mph)
Target Control Pressure (psi)
Actual Speed (mph)
Actual Stop
Distance (ft)
Corrected Stop Distanc
e (ft)
Avg. Primar
y Control Pressure (psi)
Avg. Dece
l (ft/s/
s)
Stop Time (sec)
Amb. Tem
p (deg
F)
Steer Axle
Weight (lb)
Drive Tande
m Axles
Weight (lb)
Trailer Tande
m Axles
Weight (lb)
Gross Vehicle Weight
(lb)
121 BASELINE 1
FMVSS No. 121 5
60 Full 60.3 224.2 222 105.1 20.7 4.73 49 13,180 40,010 4,500 57,690
121 BASELINE 1
FMVSS No. 121 6
60 Full 60.1 219 218 106.1 20.8 4.66 50 13,180 40,010 4,500 57,690
121 BASELINE 1
FMVSS No. 121 7
60 Full 60.3 224.5 222 105.1 20.7 4.74 50 13,180 40,010 4,500 57,690
121 BASELINE 1
FMVSS No. 121 8
60 Full 60.4 220.8 218 110 21.3 4.62 50 13,180 40,010 4,500 57,690
121 BASELINE 1
FMVSS No. 121 9
60 Full 60.3 225.9 224 102.8 20.5 4.76 52 13,180 40,010 4,500 57,690
121 BASELINE 1
FMVSS No. 121 10
60 Full 60.1 222.5 222 105.2 20.7 4.7 52 13,180 40,010 4,500 57,690
121 SET A 2
FMVSS No. 121 1
60 Full 60.4 231.9 229 103.4 19.6 4.91 43 13,180 40,010 4,500 57,690
121 SET A 2
FMVSS No. 121 2
60 Full 60.6 224.6 221 104.1 20.6 4.72 44 13,180 40,010 4,500 57,690
121 SET A 2
FMVSS No. 121 3
60 Full 60.3 221.4 219 106.2 20.9 4.66 45 13,180 40,010 4,500 57,690
121 SET A 2
FMVSS No. 121 4
60 Full 60.5 228.3 225 106.1 20.2 4.8 45 13,180 40,010 4,500 57,690
121 SET A 2
FMVSS No. 121 5
60 Full 60.6 229.1 225 104.7 20.3 4.81 45 13,180 40,010 4,500 57,690
121 SET A 2
FMVSS No. 121 6
60 Full 60.4 223.3 221 106.2 20.6 4.72 46 13,180 40,010 4,500 57,690
38
Description Tire Set
Condition Run
Target
Speed
(mph)
Target Control Pressure (psi)
Actual Speed (mph)
Actual Stop
Distance (ft)
Corrected Stop Distanc
e (ft)
Avg. Primar
y Control Pressure (psi)
Avg. Dece
l (ft/s/
s)
Stop Time (sec)
Amb. Tem
p (deg
F)
Steer Axle
Weight (lb)
Drive Tande
m Axles
Weight (lb)
Trailer Tande
m Axles
Weight (lb)
Gross Vehicle Weight
(lb)
121 SET A 2
FMVSS No. 121 7
60 Full 60.3 228.3 226 104.7 20.2 4.81 46 13,180 40,010 4,500 57,690
121 SET A 2
FMVSS No. 121 8
60 Full 60.4 225.1 222 106.8 20.6 4.72 46 13,180 40,010 4,500 57,690
121 SET A 2
FMVSS No. 121 9
60 Full 60.4 226.4 223 106.8 20.4 4.77 48 13,180 40,010 4,500 57,690
121 SET A 2
FMVSS No. 121 10
60 Full 60.6 227.7 224 105.9 20.6 4.77 47 13,180 40,010 4,500 57,690
121 SET B 3
FMVSS No. 121 1
60 Full 60.4 232.9 230 105.8 19.5 4.94 53 13,180 40,010 4,500 57,690
121 SET B 3
FMVSS No. 121 2
60 Full 60.3 230 228 102.9 20 4.85 54 13,180 40,010 4,500 57,690
121 SET B 3
FMVSS No. 121 3
60 Full 60.3 223.5 221 106.6 20.8 4.7 53 13,180 40,010 4,500 57,690
121 SET B 3
FMVSS No. 121 4
60 Full 60.3 223.1 221 106.7 20.6 4.72 54 13,180 40,010 4,500 57,690
121 SET B 3
FMVSS No. 121 5
60 Full 60.4 222.9 220 106.3 20.8 4.69 54 13,180 40,010 4,500 57,690
121 SET B 3
FMVSS No. 121 6
60 Full 60.2 222.9 221 104.6 20.9 4.69 56 13,180 40,010 4,500 57,690
121 SET B 3
FMVSS No. 121 7
60 Full 60.3 223 221 106.3 20.8 4.69 57 13,180 40,010 4,500 57,690
121 SET B 3
FMVSS No. 121 8
60 Full 60.3 229.7 227 105.9 20.7 4.77 58 13,180 40,010 4,500 57,690
39
Description Tire Set
Condition Run
Target
Speed
(mph)
Target Control Pressure (psi)
Actual Speed (mph)
Actual Stop
Distance (ft)
Corrected Stop Distanc
e (ft)
Avg. Primar
y Control Pressure (psi)
Avg. Dece
l (ft/s/
s)
Stop Time (sec)
Amb. Tem
p (deg
F)
Steer Axle
Weight (lb)
Drive Tande
m Axles
Weight (lb)
Trailer Tande
m Axles
Weight (lb)
Gross Vehicle Weight
(lb)
121 SET B 3
FMVSS No. 121 9
60 Full 60.3 223.6 221 105.2 20.8 4.7 59 13,180 40,010 4,500 57,690
121 SET B 3
FMVSS No. 121 10
60 Full 60.3 225.6 223 106.4 20.5 4.74 61 13,180 40,010 4,500 57,690
121 SET C 4
FMVSS No. 121 1
60 Full 60.2 226.4 225 105.1 20 4.83 42 13,180 40,010 4,500 57,690
121 SET C 4
FMVSS No. 121 2
60 Full 60.3 232.6 231 106.7 19.3 4.96 43 13,180 40,010 4,500 57,690
121 SET C 4
FMVSS No. 121 3
60 Full 60.3 230.4 228 102.3 19.8 4.89 44 13,180 40,010 4,500 57,690
121 SET C 4
FMVSS No. 121 4
60 Full 60.3 227.7 225 105.2 20.2 4.81 46 13,180 40,010 4,500 57,690
121 SET C 4
FMVSS No. 121 5
60 Full 60.4 228.7 226 104.5 20 4.83 45 13,180 40,010 4,500 57,690
121 SET C 4
FMVSS No. 121 6
60 Full 60.2 226.7 225 104.7 20.2 4.8 46 13,180 40,010 4,500 57,690
121 SET C 4
FMVSS No. 121 7
60 Full 60.3 227.4 225 104.4 20.2 4.81 48 13,180 40,010 4,500 57,690
121 SET C 4
FMVSS No. 121 8
60 Full 60.3 229.4 227 106.7 20.1 4.84 48 13,180 40,010 4,500 57,690
121 SET C 4
FMVSS No. 121 9
60 Full 60.3 222.3 220 105.4 20.5 4.73 48 13,180 40,010 4,500 57,690
121 SET C 4
FMVSS No. 121 10
60 Full 60.3 224.2 222 106.3 20.6 4.73 49 13,180 40,010 4,500 57,690
40
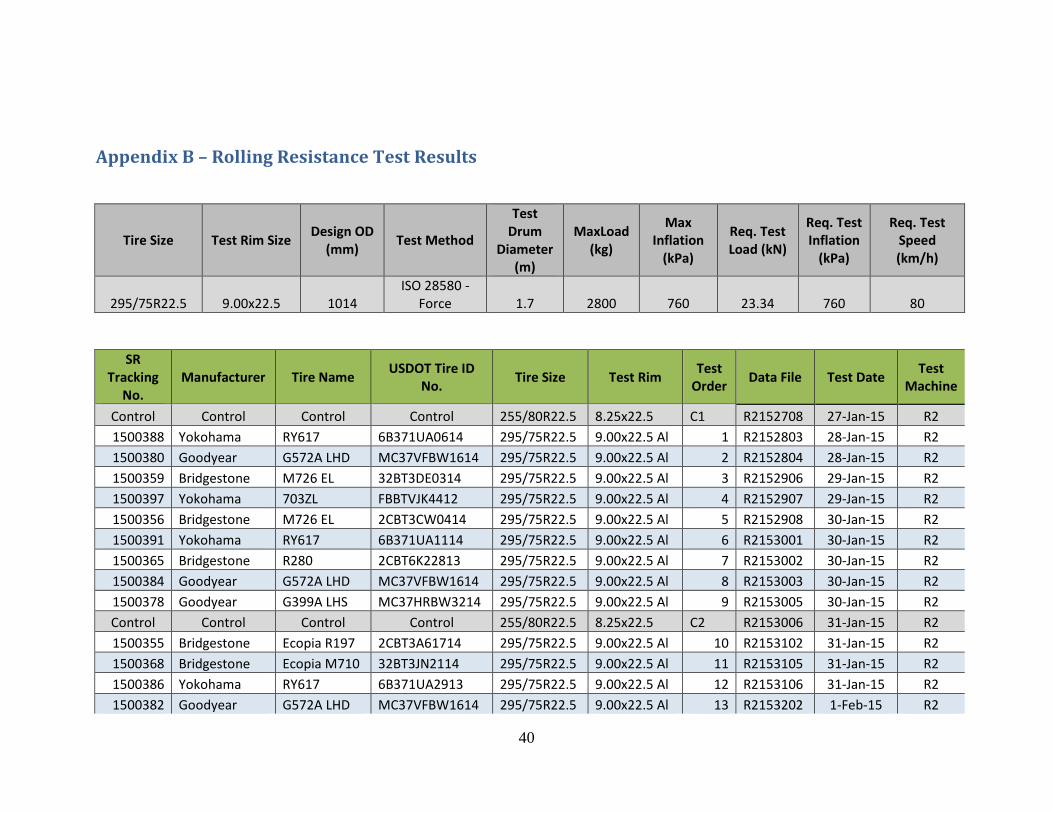
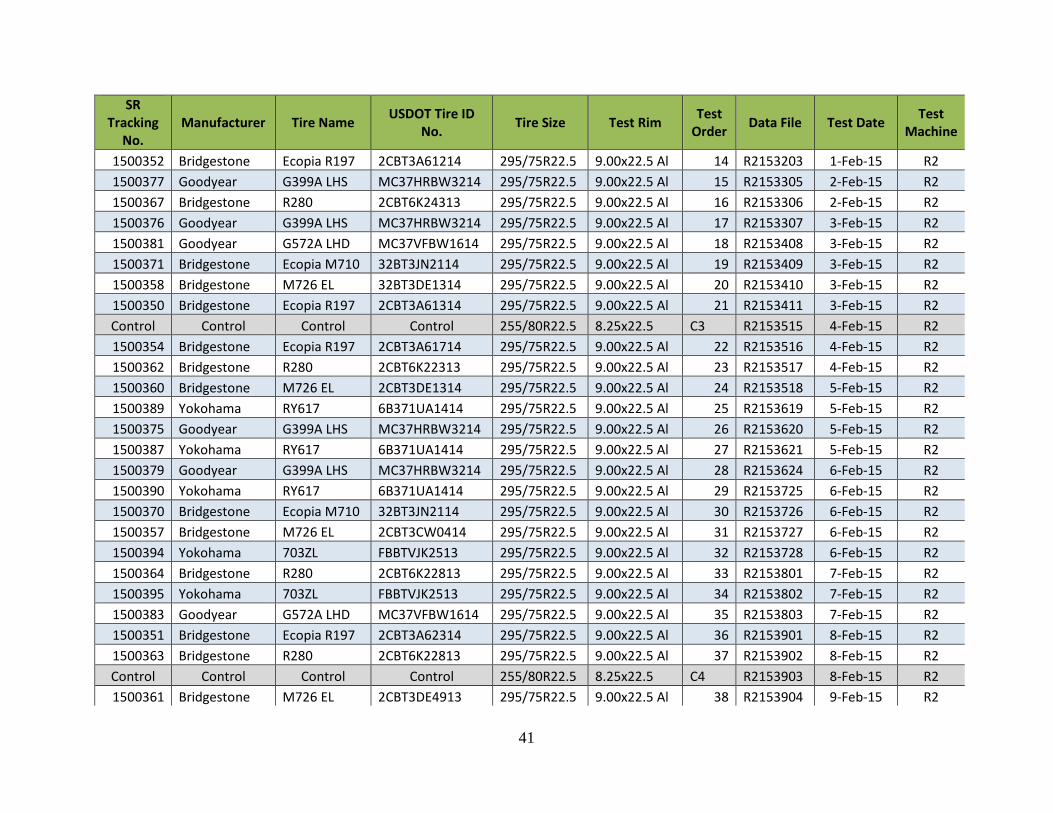
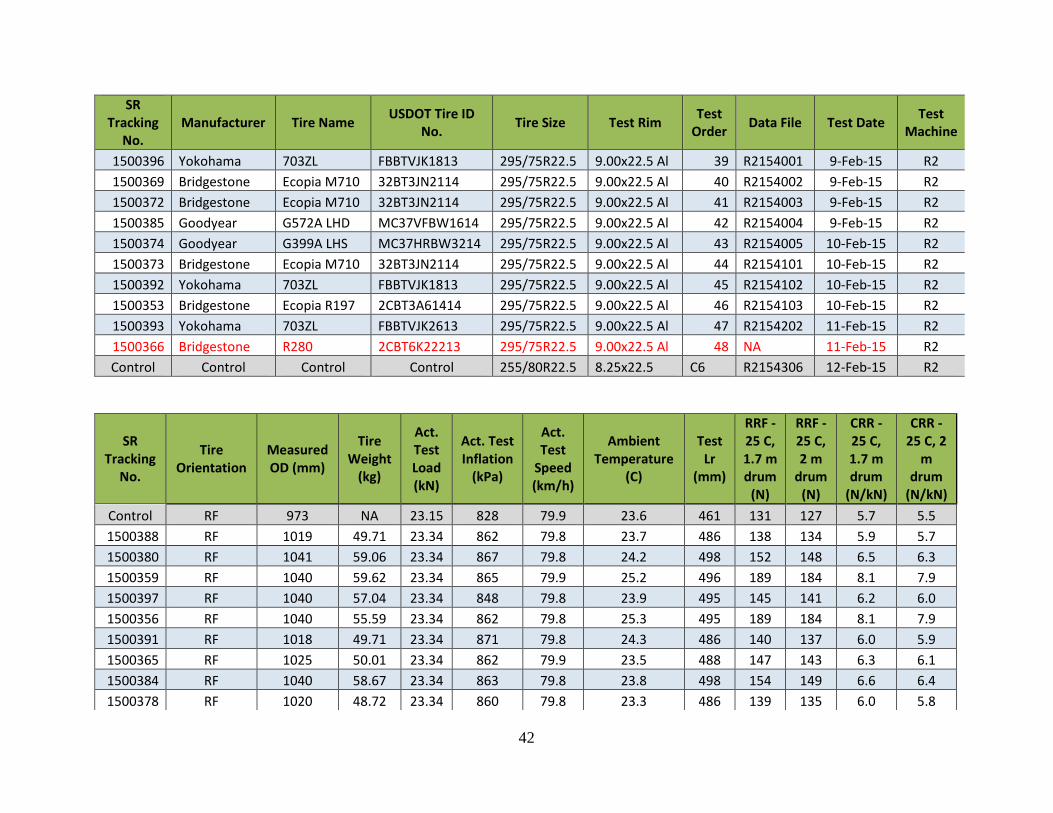
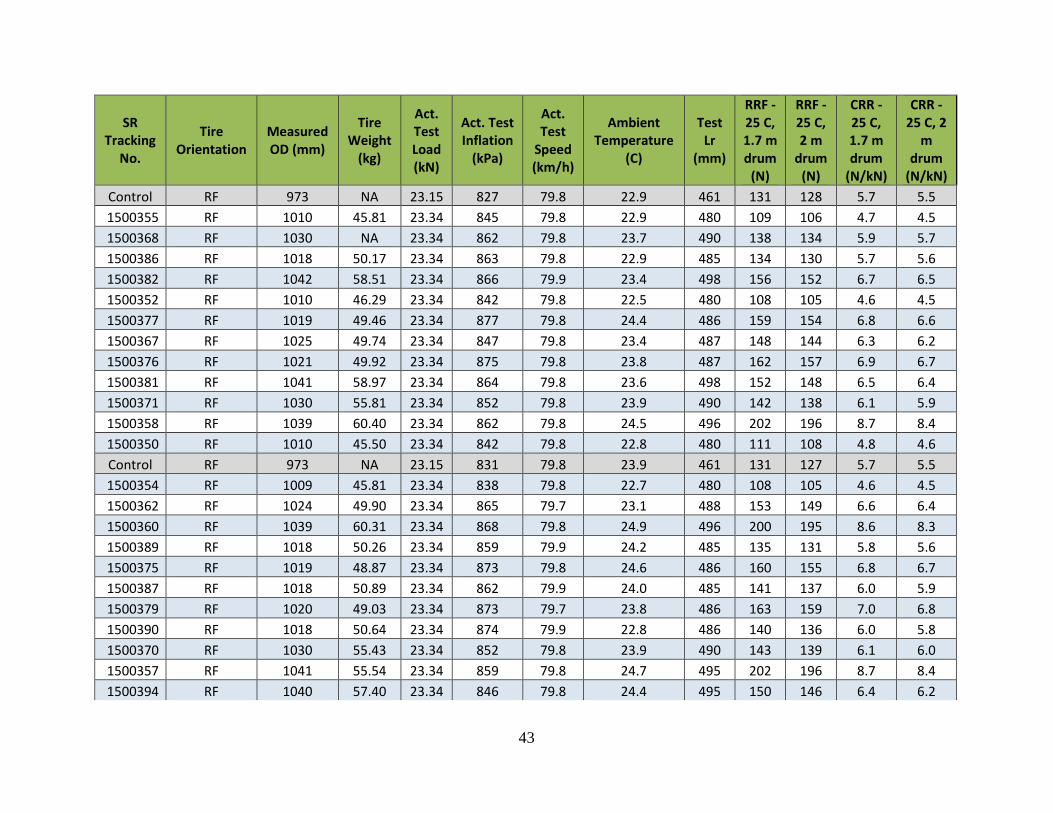
Appendix B – Rolling Resistance Test Results
Tire Size Test Rim Size Design OD (mm) Test Method
Test Drum
Diameter (m)
MaxLoad (kg)
Max Inflation
(kPa)
Req. Test Load (kN)
Req. Test Inflation
(kPa)
Req. Test Speed (km/h)
295/75R22.5 9.00x22.5 1014 ISO 28580 -
Force 1.7 2800 760 23.34 760 80
SR Tracking
No. Manufacturer Tire Name USDOT Tire ID
No. Tire Size Test Rim Test Order Data File Test Date Test
Machine
Control Control Control Control 255/80R22.5 8.25x22.5 C1 R2152708 27-Jan-15 R2 1500388 Yokohama RY617 6B371UA0614 295/75R22.5 9.00x22.5 Al 1 R2152803 28-Jan-15 R2 1500380 Goodyear G572A LHD MC37VFBW1614 295/75R22.5 9.00x22.5 Al 2 R2152804 28-Jan-15 R2 1500359 Bridgestone M726 EL 32BT3DE0314 295/75R22.5 9.00x22.5 Al 3 R2152906 29-Jan-15 R2 1500397 Yokohama 703ZL FBBTVJK4412 295/75R22.5 9.00x22.5 Al 4 R2152907 29-Jan-15 R2 1500356 Bridgestone M726 EL 2CBT3CW0414 295/75R22.5 9.00x22.5 Al 5 R2152908 30-Jan-15 R2 1500391 Yokohama RY617 6B371UA1114 295/75R22.5 9.00x22.5 Al 6 R2153001 30-Jan-15 R2 1500365 Bridgestone R280 2CBT6K22813 295/75R22.5 9.00x22.5 Al 7 R2153002 30-Jan-15 R2 1500384 Goodyear G572A LHD MC37VFBW1614 295/75R22.5 9.00x22.5 Al 8 R2153003 30-Jan-15 R2 1500378 Goodyear G399A LHS MC37HRBW3214 295/75R22.5 9.00x22.5 Al 9 R2153005 30-Jan-15 R2 Control Control Control Control 255/80R22.5 8.25x22.5 C2 R2153006 31-Jan-15 R2 1500355 Bridgestone Ecopia R197 2CBT3A61714 295/75R22.5 9.00x22.5 Al 10 R2153102 31-Jan-15 R2 1500368 Bridgestone Ecopia M710 32BT3JN2114 295/75R22.5 9.00x22.5 Al 11 R2153105 31-Jan-15 R2 1500386 Yokohama RY617 6B371UA2913 295/75R22.5 9.00x22.5 Al 12 R2153106 31-Jan-15 R2 1500382 Goodyear G572A LHD MC37VFBW1614 295/75R22.5 9.00x22.5 Al 13 R2153202 1-Feb-15 R2
41
SR Tracking
No. Manufacturer Tire Name USDOT Tire ID
No. Tire Size Test Rim Test Order Data File Test Date Test
Machine
1500352 Bridgestone Ecopia R197 2CBT3A61214 295/75R22.5 9.00x22.5 Al 14 R2153203 1-Feb-15 R2 1500377 Goodyear G399A LHS MC37HRBW3214 295/75R22.5 9.00x22.5 Al 15 R2153305 2-Feb-15 R2 1500367 Bridgestone R280 2CBT6K24313 295/75R22.5 9.00x22.5 Al 16 R2153306 2-Feb-15 R2 1500376 Goodyear G399A LHS MC37HRBW3214 295/75R22.5 9.00x22.5 Al 17 R2153307 3-Feb-15 R2 1500381 Goodyear G572A LHD MC37VFBW1614 295/75R22.5 9.00x22.5 Al 18 R2153408 3-Feb-15 R2 1500371 Bridgestone Ecopia M710 32BT3JN2114 295/75R22.5 9.00x22.5 Al 19 R2153409 3-Feb-15 R2 1500358 Bridgestone M726 EL 32BT3DE1314 295/75R22.5 9.00x22.5 Al 20 R2153410 3-Feb-15 R2 1500350 Bridgestone Ecopia R197 2CBT3A61314 295/75R22.5 9.00x22.5 Al 21 R2153411 3-Feb-15 R2 Control Control Control Control 255/80R22.5 8.25x22.5 C3 R2153515 4-Feb-15 R2 1500354 Bridgestone Ecopia R197 2CBT3A61714 295/75R22.5 9.00x22.5 Al 22 R2153516 4-Feb-15 R2 1500362 Bridgestone R280 2CBT6K22313 295/75R22.5 9.00x22.5 Al 23 R2153517 4-Feb-15 R2 1500360 Bridgestone M726 EL 2CBT3DE1314 295/75R22.5 9.00x22.5 Al 24 R2153518 5-Feb-15 R2 1500389 Yokohama RY617 6B371UA1414 295/75R22.5 9.00x22.5 Al 25 R2153619 5-Feb-15 R2 1500375 Goodyear G399A LHS MC37HRBW3214 295/75R22.5 9.00x22.5 Al 26 R2153620 5-Feb-15 R2 1500387 Yokohama RY617 6B371UA1414 295/75R22.5 9.00x22.5 Al 27 R2153621 5-Feb-15 R2 1500379 Goodyear G399A LHS MC37HRBW3214 295/75R22.5 9.00x22.5 Al 28 R2153624 6-Feb-15 R2 1500390 Yokohama RY617 6B371UA1414 295/75R22.5 9.00x22.5 Al 29 R2153725 6-Feb-15 R2 1500370 Bridgestone Ecopia M710 32BT3JN2114 295/75R22.5 9.00x22.5 Al 30 R2153726 6-Feb-15 R2 1500357 Bridgestone M726 EL 2CBT3CW0414 295/75R22.5 9.00x22.5 Al 31 R2153727 6-Feb-15 R2 1500394 Yokohama 703ZL FBBTVJK2513 295/75R22.5 9.00x22.5 Al 32 R2153728 6-Feb-15 R2 1500364 Bridgestone R280 2CBT6K22813 295/75R22.5 9.00x22.5 Al 33 R2153801 7-Feb-15 R2 1500395 Yokohama 703ZL FBBTVJK2513 295/75R22.5 9.00x22.5 Al 34 R2153802 7-Feb-15 R2 1500383 Goodyear G572A LHD MC37VFBW1614 295/75R22.5 9.00x22.5 Al 35 R2153803 7-Feb-15 R2 1500351 Bridgestone Ecopia R197 2CBT3A62314 295/75R22.5 9.00x22.5 Al 36 R2153901 8-Feb-15 R2 1500363 Bridgestone R280 2CBT6K22813 295/75R22.5 9.00x22.5 Al 37 R2153902 8-Feb-15 R2 Control Control Control Control 255/80R22.5 8.25x22.5 C4 R2153903 8-Feb-15 R2 1500361 Bridgestone M726 EL 2CBT3DE4913 295/75R22.5 9.00x22.5 Al 38 R2153904 9-Feb-15 R2
42
SR Tracking
No. Manufacturer Tire Name USDOT Tire ID
No. Tire Size Test Rim Test Order Data File Test Date Test
Machine
1500396 Yokohama 703ZL FBBTVJK1813 295/75R22.5 9.00x22.5 Al 39 R2154001 9-Feb-15 R2 1500369 Bridgestone Ecopia M710 32BT3JN2114 295/75R22.5 9.00x22.5 Al 40 R2154002 9-Feb-15 R2 1500372 Bridgestone Ecopia M710 32BT3JN2114 295/75R22.5 9.00x22.5 Al 41 R2154003 9-Feb-15 R2 1500385 Goodyear G572A LHD MC37VFBW1614 295/75R22.5 9.00x22.5 Al 42 R2154004 9-Feb-15 R2 1500374 Goodyear G399A LHS MC37HRBW3214 295/75R22.5 9.00x22.5 Al 43 R2154005 10-Feb-15 R2 1500373 Bridgestone Ecopia M710 32BT3JN2114 295/75R22.5 9.00x22.5 Al 44 R2154101 10-Feb-15 R2 1500392 Yokohama 703ZL FBBTVJK1813 295/75R22.5 9.00x22.5 Al 45 R2154102 10-Feb-15 R2 1500353 Bridgestone Ecopia R197 2CBT3A61414 295/75R22.5 9.00x22.5 Al 46 R2154103 10-Feb-15 R2 1500393 Yokohama 703ZL FBBTVJK2613 295/75R22.5 9.00x22.5 Al 47 R2154202 11-Feb-15 R2 1500366 Bridgestone R280 2CBT6K22213 295/75R22.5 9.00x22.5 Al 48 NA 11-Feb-15 R2 Control Control Control Control 255/80R22.5 8.25x22.5 C6 R2154306 12-Feb-15 R2
SR Tracking
No.
Tire Orientation
Measured OD (mm)
Tire Weight
(kg)
Act. Test Load (kN)
Act. Test Inflation
(kPa)
Act. Test
Speed (km/h)
Ambient Temperature
(C)
Test Lr
(mm)
RRF - 25 C, 1.7 m drum
(N)
RRF - 25 C, 2 m
drum (N)
CRR - 25 C, 1.7 m drum
(N/kN)
CRR - 25 C, 2
m drum
(N/kN) Control RF 973 NA 23.15 828 79.9 23.6 461 131 127 5.7 5.5 1500388 RF 1019 49.71 23.34 862 79.8 23.7 486 138 134 5.9 5.7 1500380 RF 1041 59.06 23.34 867 79.8 24.2 498 152 148 6.5 6.3 1500359 RF 1040 59.62 23.34 865 79.9 25.2 496 189 184 8.1 7.9 1500397 RF 1040 57.04 23.34 848 79.8 23.9 495 145 141 6.2 6.0 1500356 RF 1040 55.59 23.34 862 79.8 25.3 495 189 184 8.1 7.9 1500391 RF 1018 49.71 23.34 871 79.8 24.3 486 140 137 6.0 5.9 1500365 RF 1025 50.01 23.34 862 79.9 23.5 488 147 143 6.3 6.1 1500384 RF 1040 58.67 23.34 863 79.8 23.8 498 154 149 6.6 6.4 1500378 RF 1020 48.72 23.34 860 79.8 23.3 486 139 135 6.0 5.8
43
SR Tracking
No.
Tire Orientation
Measured OD (mm)
Tire Weight
(kg)
Act. Test Load (kN)
Act. Test Inflation
(kPa)
Act. Test
Speed (km/h)
Ambient Temperature
(C)
Test Lr
(mm)
RRF - 25 C, 1.7 m drum
(N)
RRF - 25 C, 2 m
drum (N)
CRR - 25 C, 1.7 m drum
(N/kN)
CRR - 25 C, 2
m drum
(N/kN) Control RF 973 NA 23.15 827 79.8 22.9 461 131 128 5.7 5.5 1500355 RF 1010 45.81 23.34 845 79.8 22.9 480 109 106 4.7 4.5 1500368 RF 1030 NA 23.34 862 79.8 23.7 490 138 134 5.9 5.7 1500386 RF 1018 50.17 23.34 863 79.8 22.9 485 134 130 5.7 5.6 1500382 RF 1042 58.51 23.34 866 79.9 23.4 498 156 152 6.7 6.5 1500352 RF 1010 46.29 23.34 842 79.8 22.5 480 108 105 4.6 4.5 1500377 RF 1019 49.46 23.34 877 79.8 24.4 486 159 154 6.8 6.6 1500367 RF 1025 49.74 23.34 847 79.8 23.4 487 148 144 6.3 6.2 1500376 RF 1021 49.92 23.34 875 79.8 23.8 487 162 157 6.9 6.7 1500381 RF 1041 58.97 23.34 864 79.8 23.6 498 152 148 6.5 6.4 1500371 RF 1030 55.81 23.34 852 79.8 23.9 490 142 138 6.1 5.9 1500358 RF 1039 60.40 23.34 862 79.8 24.5 496 202 196 8.7 8.4 1500350 RF 1010 45.50 23.34 842 79.8 22.8 480 111 108 4.8 4.6 Control RF 973 NA 23.15 831 79.8 23.9 461 131 127 5.7 5.5 1500354 RF 1009 45.81 23.34 838 79.8 22.7 480 108 105 4.6 4.5 1500362 RF 1024 49.90 23.34 865 79.7 23.1 488 153 149 6.6 6.4 1500360 RF 1039 60.31 23.34 868 79.8 24.9 496 200 195 8.6 8.3 1500389 RF 1018 50.26 23.34 859 79.9 24.2 485 135 131 5.8 5.6 1500375 RF 1019 48.87 23.34 873 79.8 24.6 486 160 155 6.8 6.7 1500387 RF 1018 50.89 23.34 862 79.9 24.0 485 141 137 6.0 5.9 1500379 RF 1020 49.03 23.34 873 79.7 23.8 486 163 159 7.0 6.8 1500390 RF 1018 50.64 23.34 874 79.9 22.8 486 140 136 6.0 5.8 1500370 RF 1030 55.43 23.34 852 79.8 23.9 490 143 139 6.1 6.0 1500357 RF 1041 55.54 23.34 859 79.8 24.7 495 202 196 8.7 8.4 1500394 RF 1040 57.40 23.34 846 79.8 24.4 495 150 146 6.4 6.2
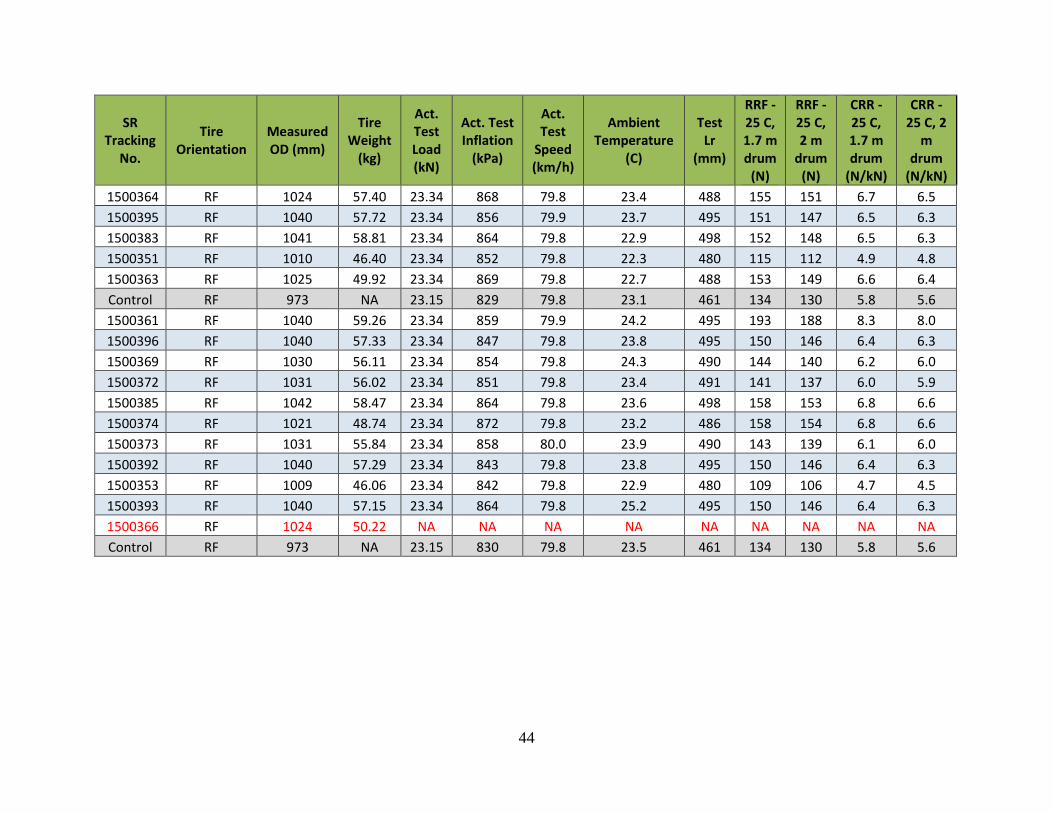
44
SR Tracking
No.
Tire Orientation
Measured OD (mm)
Tire Weight
(kg)
Act. Test Load (kN)
Act. Test Inflation
(kPa)
Act. Test
Speed (km/h)
Ambient Temperature
(C)
Test Lr
(mm)
RRF - 25 C, 1.7 m drum
(N)
RRF - 25 C, 2 m
drum (N)
CRR - 25 C, 1.7 m drum
(N/kN)
CRR - 25 C, 2
m drum
(N/kN) 1500364 RF 1024 57.40 23.34 868 79.8 23.4 488 155 151 6.7 6.5 1500395 RF 1040 57.72 23.34 856 79.9 23.7 495 151 147 6.5 6.3 1500383 RF 1041 58.81 23.34 864 79.8 22.9 498 152 148 6.5 6.3 1500351 RF 1010 46.40 23.34 852 79.8 22.3 480 115 112 4.9 4.8 1500363 RF 1025 49.92 23.34 869 79.8 22.7 488 153 149 6.6 6.4 Control RF 973 NA 23.15 829 79.8 23.1 461 134 130 5.8 5.6 1500361 RF 1040 59.26 23.34 859 79.9 24.2 495 193 188 8.3 8.0 1500396 RF 1040 57.33 23.34 847 79.8 23.8 495 150 146 6.4 6.3 1500369 RF 1030 56.11 23.34 854 79.8 24.3 490 144 140 6.2 6.0 1500372 RF 1031 56.02 23.34 851 79.8 23.4 491 141 137 6.0 5.9 1500385 RF 1042 58.47 23.34 864 79.8 23.6 498 158 153 6.8 6.6 1500374 RF 1021 48.74 23.34 872 79.8 23.2 486 158 154 6.8 6.6 1500373 RF 1031 55.84 23.34 858 80.0 23.9 490 143 139 6.1 6.0 1500392 RF 1040 57.29 23.34 843 79.8 23.8 495 150 146 6.4 6.3 1500353 RF 1009 46.06 23.34 842 79.8 22.9 480 109 106 4.7 4.5 1500393 RF 1040 57.15 23.34 864 79.8 25.2 495 150 146 6.4 6.3 1500366 RF 1024 50.22 NA NA NA NA NA NA NA NA NA Control RF 973 NA 23.15 830 79.8 23.5 461 134 130 5.8 5.6
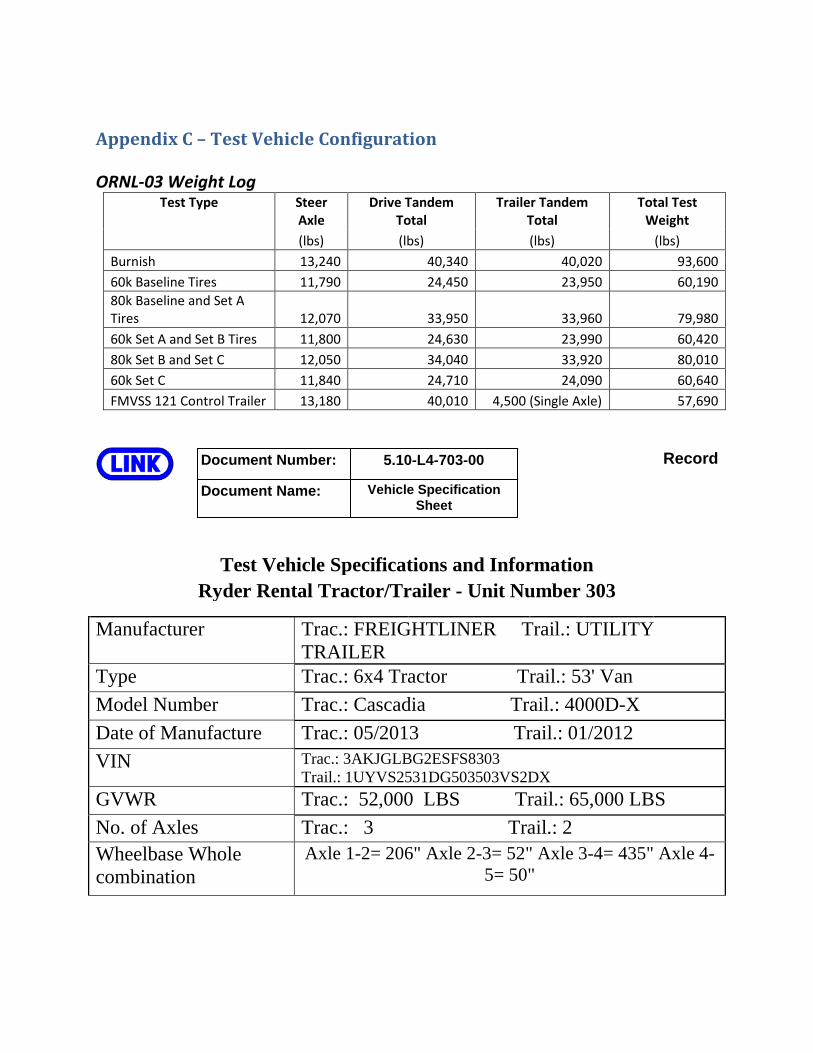
Appendix C – Test Vehicle Configuration ORNL-03 Weight Log
Test Type Steer Axle
Drive Tandem Total
Trailer Tandem Total
Total Test Weight
(lbs) (lbs) (lbs) (lbs)
Burnish 13,240 40,340 40,020 93,600
60k Baseline Tires 11,790 24,450 23,950 60,190
80k Baseline and Set A Tires 12,070 33,950 33,960 79,980
60k Set A and Set B Tires 11,800 24,630 23,990 60,420
80k Set B and Set C 12,050 34,040 33,920 80,010
60k Set C 11,840 24,710 24,090 60,640
FMVSS 121 Control Trailer 13,180 40,010 4,500 (Single Axle) 57,690
Record
Test Vehicle Specifications and Information
Ryder Rental Tractor/Trailer - Unit Number 303
Manufacturer Trac.: FREIGHTLINER Trail.: UTILITY TRAILER
Type Trac.: 6x4 Tractor Trail.: 53' Van Model Number Trac.: Cascadia Trail.: 4000D-X Date of Manufacture Trac.: 05/2013 Trail.: 01/2012 VIN Trac.: 3AKJGLBG2ESFS8303
Trail.: 1UYVS2531DG503503VS2DX GVWR Trac.: 52,000 LBS Trail.: 65,000 LBS No. of Axles Trac.: 3 Trail.: 2 Wheelbase Whole combination
Axle 1-2= 206" Axle 2-3= 52" Axle 3-4= 435" Axle 4-5= 50"
Document Number:
Document Name:
5.10-L4-703-00
Vehicle Specification Sheet
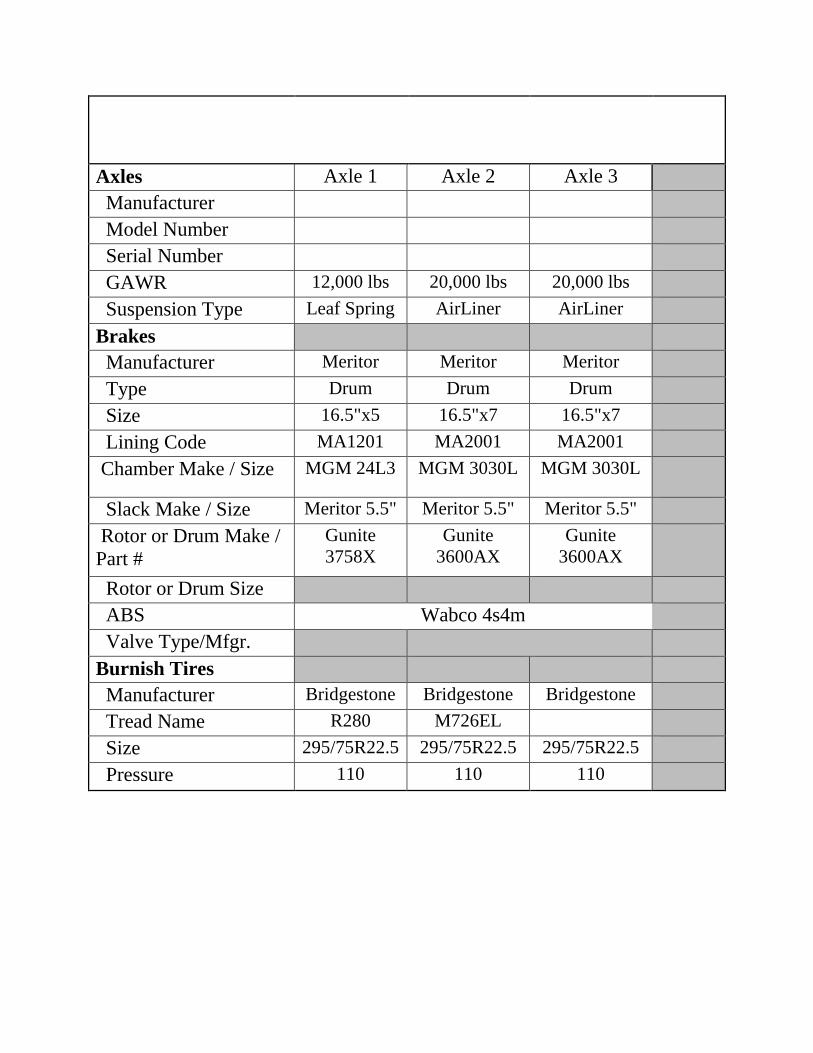
Axles Axle 1 Axle 2 Axle 3 Manufacturer
Model Number
Serial Number
GAWR 12,000 lbs 20,000 lbs 20,000 lbs Suspension Type Leaf Spring AirLiner AirLiner Brakes Manufacturer Meritor Meritor Meritor Type Drum Drum Drum Size 16.5"x5 16.5"x7 16.5"x7 Lining Code MA1201 MA2001 MA2001 Chamber Make / Size MGM 24L3 MGM 3030L MGM 3030L
Slack Make / Size Meritor 5.5" Meritor 5.5" Meritor 5.5" Rotor or Drum Make / Part #
Gunite 3758X
Gunite 3600AX
Gunite 3600AX
Rotor or Drum Size ABS Wabco 4s4m Valve Type/Mfgr.
Burnish Tires
Manufacturer Bridgestone Bridgestone Bridgestone Tread Name R280 M726EL Size 295/75R22.5 295/75R22.5 295/75R22.5 Pressure 110 110 110
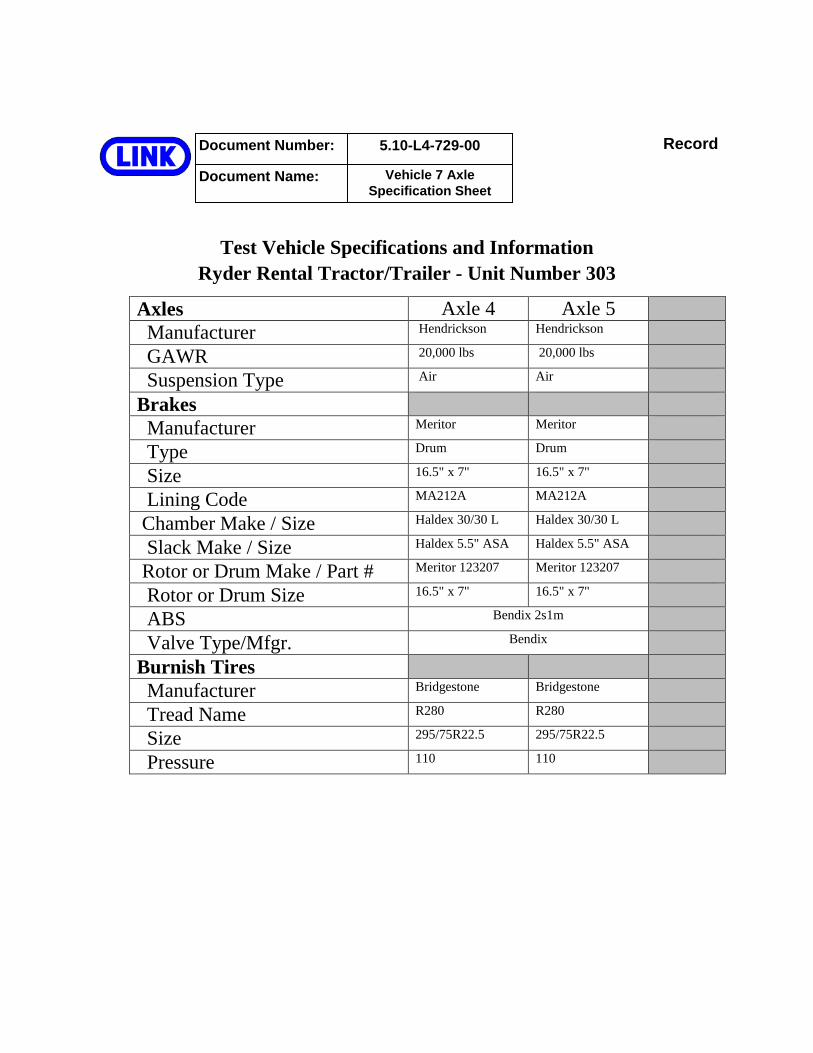
Record
Test Vehicle Specifications and Information Ryder Rental Tractor/Trailer - Unit Number 303
Axles Axle 4 Axle 5
Manufacturer Hendrickson Hendrickson
GAWR 20,000 lbs 20,000 lbs
Suspension Type Air Air
Brakes
Manufacturer Meritor Meritor
Type Drum Drum
Size 16.5" x 7" 16.5" x 7"
Lining Code MA212A MA212A
Chamber Make / Size Haldex 30/30 L Haldex 30/30 L
Slack Make / Size Haldex 5.5" ASA Haldex 5.5" ASA
Rotor or Drum Make / Part # Meritor 123207 Meritor 123207
Rotor or Drum Size 16.5" x 7" 16.5" x 7"
ABS Bendix 2s1m
Valve Type/Mfgr. Bendix
Burnish Tires
Manufacturer Bridgestone Bridgestone
Tread Name R280 R280
Size 295/75R22.5 295/75R22.5
Pressure 110 110
Document Number:
Document Name:
5.10-L4-729-00
Vehicle 7 Axle Specification Sheet
DOT HS 812 176June 2015
11659-061715-v3