Embed Size (px)
Citation preview
E�ects of varying dietary protein and energy supplyon growth, body composition and protein utilizationin gilthead seabream (Sparus aurata L.)
I. LUPATSCH1, G. WM. KISSIL1, D. SKLAN2 & E. PFEFFER3
1 National Center for Mariculture, Israel Oceanographic & Limnological Research, P.O.B. 1212, Eilat 88112, Israel; 2 Faculty of
Agriculture, Hebrew University of Jerusalem, P.O.B. 12, Rehovot 76100, Israel; 3 Institut fuÈr TierernaÈhrung der Rheinischen
Friedrich-Wilhelms-UniversitaÈt Bonn, 53115 Bonn, Endenicher Allee 15, Germany
Abstract
Diets formulated with increasing digestible energy (10±22 DE
MJ kg)1) contents and decreasing digestible crude protein
(DCP)/DE ratios (34±15 g MJ)1) were fed to triplicate
groups of Sparus aurata in three consecutive trials. Fish
were hand-fed to apparent satiation and voluntary feed
intake was found to be dependent upon dietary DE content.
Daily growth was regulated both by energy and protein
intake and reached its maximum at high energy levels.
Growth composition showed narrow limits regarding protein
gain (157±190 g kg)1) and a wider range regarding lipid (55±
210 g kg)1) deposition re¯ecting the dietary energy to protein
supply. Energy utilization for growth was constant at a value
of 0.50 regardless of energy intake. E�ciency of protein
utilization for growth varied between 0.33 and 0.60 depend-
ing on the DCP/DE ratio in the diet. The optimal protein
utilization for protein deposition was found to be at 0.47.
These values allow daily energy and protein requirements for
growing S. aurata to be quanti®ed. This demonstrates that
the optimal dietary DCP/DE supply changes with ®sh size,
growth potential and daily feed intake.
KEY WORDSKEY WORDS: body composition, DCP/DE ratio, factorial
approach, feed intake, protein utilization, Sparus aurata
Received 8 September 1999, accepted 30 March 2000
Correspondence: I. Lupatsch, National Center for Mariculture, P.O.B.
1212, 88112 Eilat, Israel. E-mail: [email protected]
Introduction
Considerable research has dealt with the e�ect of dietary
protein and energy supply on performance in ®sh and the
concept of protein sparing in various ®sh species has been
proposed. Several authors have described optimal dietary
protein to energy ratios in rainbow trout Oncorhynchus
mykiss (Kim & Kaushik 1992; Lanari et al. 1995), African
cat®sh Clarias gariepinus (Henken et al. 1986), yellowtail
Seriola quinqueradiata (Takeda et al. 1975; Shimeno et al.
1985), tilapia Oreochromis sp. (Winfree & Stickney 1981;
Shiau & Huang 1990), Atlantic salmon Salmo salar (Hilles-
tad & Johnsen 1994), carp Cyprinus carpio (Watanabe et al.
1987), European seabass Dicentrarchus labrax (Tibaldi et al.
1991) and gilthead seabream Sparus aurata (Kissil et al. 1982;
Vergara et al. 1996b). However, despite this body of infor-
mation, results concerning the optimal protein requirement
even for the same species are often not in agreement.
One of the factors a�ecting the dietary protein to energy
ratios might be the use of ®sh of di�erent weights, as protein
requirements decrease with increasing ®sh size (Page &
Andrews 1973; Kaushik & Luquet 1984; Masser et al. 1991).
Another source of variation is the di�erence in digestibility
coe�cients of dietary energy and protein, which have not
been determined precisely in many feeds. Furthermore, the
methods of calculating the digestible energy (DE) content
may vary among authors, making it di�cult to draw
conclusions with regard to the optimal digestible crude
protein (DCP)/DE ratios. A further di�erence between the
studies is the choice of feeding rate which could vary from a
given proportion of biomass to ad libitum feeding. For
instance, applying a daily feeding rate of 80 g kg)1 biomass
could have masked the e�ect of reduced feed intake in red
drum fed high lipid diets (Williams & Robinson 1988). Some
71
Aquaculture Nutrition 20017;71^80. . . . . . . . . . . . . . . . . . . . . . . . . . . . . . . . . . . . . . . . . . . . . . . . . . . . . . . . . . . . . . . . . . . . . . . . . . . . . . . . . . . . . . . . . . . . . .
. . . . . . . . . . . . . . . . . . . . . . . . . . . . . . . . . . . . . . . . . . . . . . . . . . . . . . . . . . . . . . . . . . . . . . . . . . . . . . . . . . . . . . . . . . . . . .
Ó 2001Blackwell Science Ltd

of the experiments were performed with puri®ed diets, where
feed intake was below the normal range, probably owing to
palatability problems, and rapid growth was not found
(Sabaut & Luquet 1973). As the growth rate is the criterion
for which the protein and energy requirements are being
established, it is reasonable that high growth rates should be
achieved with high feed intake.
In a previous study with S. aurata, energy and protein
requirements were determined using the factorial approach
(Lupatsch et al. 1998), de®ning the daily requirements per
unit of metabolic body weight rather than as a percentage of
the diet. As protein may function as an energy source apart
from its essential role for growth, the optimal balance
between the supply of dietary energy and protein should be
examined.
Thus the objectives of the present trials were to determine:
(a) The regulation of daily feed intake of S. aurata depending
on dietary energy and protein levels.
(b) The in¯uence of DE and DCP intake on growth and
body composition.
(c) The protein and energy requirement for optimal growth
and protein utilization.
Materials and methods
Gilthead seabream reared at the National Center for
Mariculture (NCM), Eilat, Israel, were used to carry out a
series of trials with increasing dietary energy densities as well
as varying protein to energy ratios.
The local brood stock was established about 1983 using
wild-caught juvenile S. aurata from the Bardawil lagoon on
the Sinai coast of the Mediterranean sea. Prior to all the
experiments, the ®sh were fed a local commercial diet
(Matmor Inc., M.P. Evtach, Israel) according to feeding
tables developed at NCM.
The trials were performed as described in Table 1.
Digestibility
In all the diets D1±D15 the digestibility of the dietary
ingredients was measured as described by Lupatsch et al.
(1997) using S. aurata weighing 300±400 g. Chromic oxide
(8 g kg)1) was added to the feed as a marker and faeces were
collected by stripping.
Diet preparation
Diets D1±D15 were formulated to provide a range of dietary
DE contents from 10 to 22 DE MJ kg)1 feed and DCP/DE
(g MJ)1) ratios from 34 to 15. The diets were based mainly
on ®sh meal and ®sh oil, exchanging the oil with starch or
cellulose where necessary to reach broad DCP to DE ranges
(Table 2). An oil absorbing agent was used to allow
incorporation of high lipid levels in the diet without
compromising stability of the pellets. Cellulose was assumed
to be indigestible. Fish meal was considered a protein source
with a balanced amino acid pro®le. The diets were mixed for
30 min in a 25-L batch mixer and steam pelleted to 2.4 and
3.8 mm diameter using a laboratory pellet mill.
Fish and food
Fish were fed to apparent satiation twice a day and feeding
was carried out by the same person throughout the experi-
ments. The point of satiation was determined when the ®sh
showed no more interest in the food. Feed intake was
recorded daily.
Ten ®sh from each trial 1 to 3 were taken at the beginning,
and at the end of the experiments ®shes were sampled from
each tank and immediately frozen. Before analysis the ten
®shes of each group were combined, cut up with a knife and
while still frozen, ground twice in a meat grinder using a
3-mm die. A subsample for estimation of dry matter was
taken before the remaining homogenate was freeze-dried.
The freeze-dried sample was again mixed in a blender and
used for all remaining analyses.
The feed samples were ®nely ground in a hammer mill
using a 1-mm screen.
Analytical procedures
Dry matter was calculated by weight loss after 24 h at
105 °C. Crude protein was measured using the Kjeldahl
technique and multiplying n by 6.25. Crude lipid was
measured after chloroform±methanol extraction (Folch et al.
1957). Samples were homogenized with a high speed homo-
Table 1 Experimental design
Trial1 Trial 2 Trial 3
Fish 18 per tank 20 per tank 19 per tankInitial weight (g) 17.3 25.2 32.0Treatment 6 diets (D1^D6) 4 diets (D7^D10) 5 diets (D11^D15)Feeding 2 ´ daily per 2 ´ daily per 2 ´ daily per
demand demand demandReplicates 3 3 3Duration 140 days 94 days 92 daysWater 21^23 °C 22^24 °C 22^24 °Ctemperature ambient ambient ambient
Salinity 41 g L)1 41 g L)1 41 g L)1
Tanks 200 l outdoors 200 l outdoors 200 l outdoorsWeighing ~ every14 days ~ every14 days ~ every14 days
I. Lupatsch et al.
. . . . . . . . . . . . . . . . . . . . . . . . . . . . . . . . . . . . . . . . . . . . . . . . . . . . . . . . . . . . . . . . . . . . . . . . . . . . . . . . . . . . . . . . . . . . . .
Ó 2001Blackwell Science Ltd Aquaculture Nutrition 7;71^80
72

genizer for 5 min and lipid was determined gravimetrically
after solvent separation and vacuum drying. Ash was
calculated from the weight loss after incineration of samples
for 24 h at 550° in a mu�e furnace. Gross energy content
was measured by combustion in a Parr bomb calorimeter
using benzoic acid as the standard. All analyses were carried
out in duplicate.
Calculation and statistical procedures
Body weight (BW) was calculated from the initial and ®nal
body weight of ®sh as the geometric mean
BW � �Wini �Wfin�0:5:Feed intake regarding whole diets and weight gain were
expressed in g BW (kg))0.70 day)1 to correct for the in¯uence
of ®sh size on feed consumption in gilthead seabream
(Lupatsch & Kissel 1998).
Energy intake and gain were calculated per metabolic
weight units of kJ BW (kg))0.83 day)1 and protein intake and
gain per metabolic weight units of g BW (kg))0.70 day)1 as
determined for gilthead seabream (Lupatsch et al. 1998).
All equations were obtained by regression analysis and
optimal parameter estimates obtained with the iterative
nonlinear least squares algorithm of Levenberg±Marquardt
(SPSS 5.0.1 for Windows). Each point in the calculation
represented the combined group of ®sh per single tank
(triplicate tanks per treatment). The P-value for statistical
signi®cance was 0.05. Descriptive statistics are mean � SE
unless otherwise noted.
For enhanced clarity the points of interest in the graphs are
depicted, where appropriate, as average values per treatment
(mean � SD).
Results
As the amount of feed consumed is one of the most
important factors for high weight gains, one of the ®rst
objectives was to test whether voluntary feed intake was
controlled by energy or protein levels in the diet.
Table 2 Composition and proximate analysis (g kg)1 as fed) of diets in Trials 1, 2 and 3
Trial1 Trial 2 Trial 3
D1 D2 D3 D4 D5 D6 D7 D8 D9 D10 D11 D12 D13 D14 D15
Composition (g kg)1)Fish meal A1 600 735 885 600Fish meal B2 870 805 750 700 650Fish meal C3 620 620 620 780 780 780Fish oil 4 ^ 40 85 ^ 25 65 95 95 95 163 100 150 200 250 300Cornstarch5 ^ ^ ^ ^ ^ ^ 285 150 ^ 150 ^ ^ ^ ^Cellulose 360 320 275 200 175 135 ^ ^ ^ 67 ^ ^ ^ ^ ^Vitamin mix6 10 10 10 10 10 10 10 10 10 10 10 10 10 10 10Sipernat7 10 10 10 10 10 10 10 10 10 10 20 35 40 40 40
Analysis (g kg)1)Dry matter 931 930 934 935 940 931 928 931 923 926 932 938 940 945 948Crude protein 417 418 411 502 506 498 427 520 624 429 522 480 442 420 385Crude lipid 66 101 131 85 115 140 161 178 184 220 176 225 256 314 352Ash 112 108 104 114 115 115 99 123 131 97 129 134 139 149 149Gross energy (MJ) 18.37 19.35 19.95 19.37 19.51 20.45 20.23 20.79 21.58 21.69 21.10 21.81 22.53 22.66 23.59Digestible crudeprotein8 (DCP)
344 345 339 414 418 411 376 457 549 377 459 422 389 370 339
Digestible energy9 (DE)(MJ kg)1)
10.02 11.59 13.03 12.58 13.37 14.89 17.13 18.15 19.45 18.18 18.86 19.62 20.39 20.62 21.57
DCP/DE (g MJ)1) 34.3 29.8 26.0 32.9 31.3 27.6 21.9 25.2 28.2 20.7 24.3 21.5 19.1 17.9 15.7
1Fish meal A: GE = 20.18 MJ kg)1, ADC = 89%; CP = 710 g kg)1, ADC = 88%.2 Fish meal B: GE = 19.87 MJ kg)1, ADC = 88%; CP = 589 g kg)1, ADC = 88%.3 Fish meal C: GE = 20.51 MJ kg)1, ADC = 79%; CP = 650 g kg)1, ADC = 82.5%.4 Fish oil: GE = 38.50 MJ kg)1, ADC = 95%.5 Cornstarch: GE = 16.2 MJ kg)1, ADC = 65%; (measured at 20% inclusion level).6 V|tamin mix provided the following per kg of diet:V|tamin A16000 IU, vitamin D3 1900 IU, vitamin E150 mg, thiamine 30 mg, ribo£avin 45 mg, niacin15 mg, Ca-pantothenate 30 mg, pyridoxine 5 mg, folic acid 11 mg, vitamin B12 0,12 mg, vitamin K 11 mg, biotin 0.25 mg, inositol 150 mg, ascorbic acid500 mg, choline chloride 3 g.7 Pelleting help, DEGUSSA AG, Hanau, Germany.8, 9 Calculated using digestible protein and energy values of the single ingredients (Lupatsch et al.1997).
Protein and energy supply in Sparus aurata
. . . . . . . . . . . . . . . . . . . . . . . . . . . . . . . . . . . . . . . . . . . . . . . . . . . . . . . . . . . . . . . . . . . . . . . . . . . . . . . . . . . . . . . . . . . . . .
Ó 2001Blackwell Science Ltd Aquaculture Nutrition 7;71^80
73
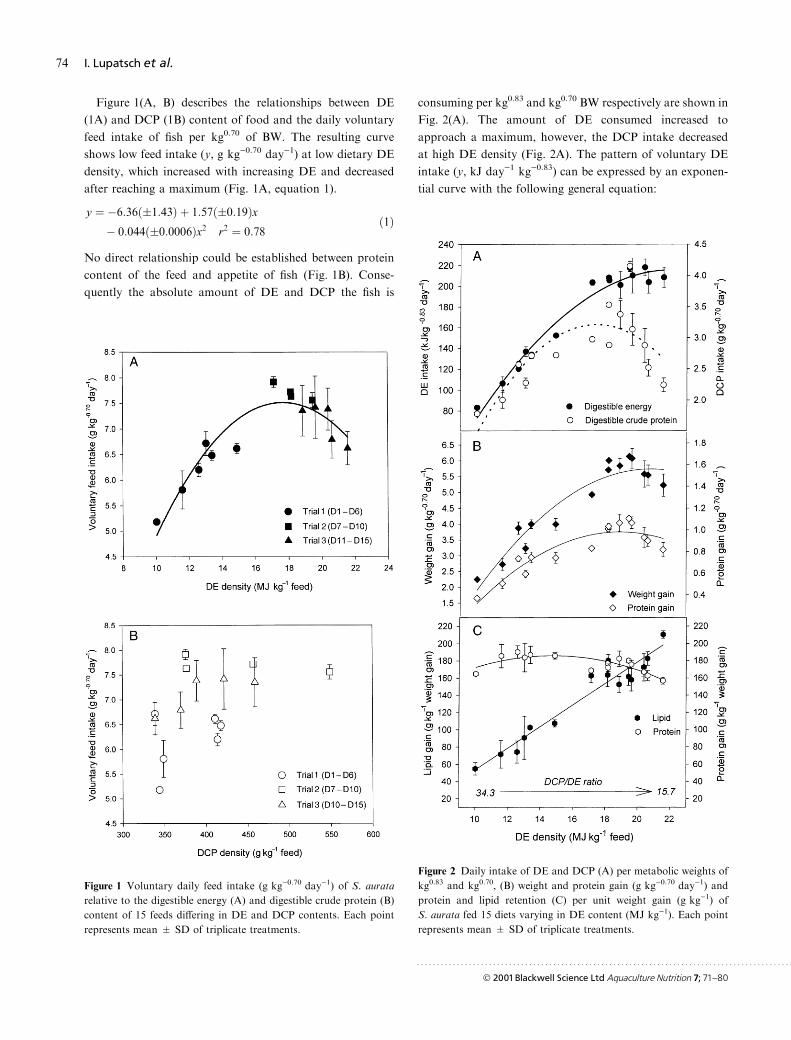
Figure 1(A, B) describes the relationships between DE
(1A) and DCP (1B) content of food and the daily voluntary
feed intake of ®sh per kg0.70 of BW. The resulting curve
shows low feed intake (y, g kg)0.70 day)1) at low dietary DE
density, which increased with increasing DE and decreased
after reaching a maximum (Fig. 1A, equation 1).
y � ÿ6:36��1:43� � 1:57��0:19�xÿ 0:044��0:0006�x2 r2 � 0:78
�1�
No direct relationship could be established between protein
content of the feed and appetite of ®sh (Fig. 1B). Conse-
quently the absolute amount of DE and DCP the ®sh is
consuming per kg0.83 and kg0.70 BW respectively are shown in
Fig. 2(A). The amount of DE consumed increased to
approach a maximum, however, the DCP intake decreased
at high DE density (Fig. 2A). The pattern of voluntary DE
intake (y, kJ day)1 kg)0.83) can be expressed by an exponen-
tial curve with the following general equation:
Figure 1 Voluntary daily feed intake (g kg)0.70 day)1) of S. aurata
relative to the digestible energy (A) and digestible crude protein (B)
content of 15 feeds di�ering in DE and DCP contents. Each point
represents mean � SD of triplicate treatments.
Figure 2 Daily intake of DE and DCP (A) per metabolic weights of
kg0.83 and kg0.70, (B) weight and protein gain (g kg)0.70 day)1) and
protein and lipid retention (C) per unit weight gain (g kg)1) of
S. aurata fed 15 diets varying in DE content (MJ kg)1). Each point
represents mean � SD of triplicate treatments.
I. Lupatsch et al.
. . . . . . . . . . . . . . . . . . . . . . . . . . . . . . . . . . . . . . . . . . . . . . . . . . . . . . . . . . . . . . . . . . . . . . . . . . . . . . . . . . . . . . . . . . . . . .
Ó 2001Blackwell Science Ltd Aquaculture Nutrition 7;71^80
74
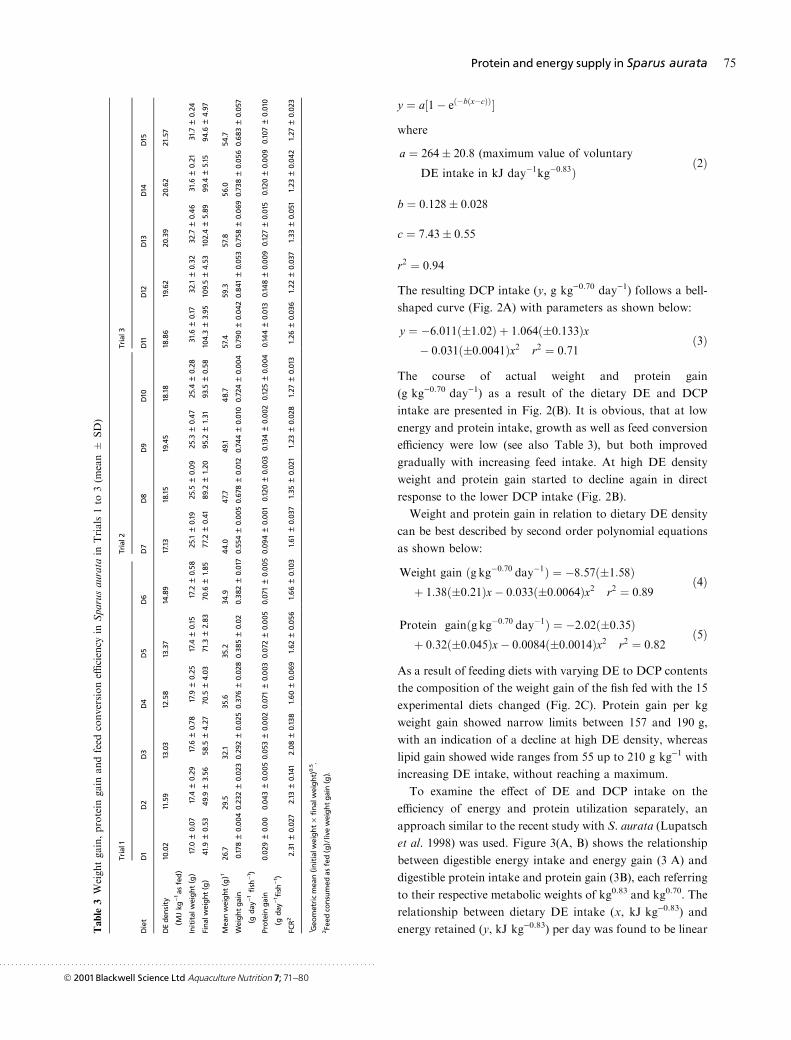
y � a�1ÿ e�ÿb�xÿc���where
a � 264� 20:8 (maximum value of voluntary
DE intake in kJ dayÿ1kgÿ0:83� �2�
b � 0:128� 0:028
c � 7:43� 0:55
r2 � 0:94
The resulting DCP intake (y, g kg)0.70 day)1) follows a bell-
shaped curve (Fig. 2A) with parameters as shown below:
y � ÿ6:011��1:02� � 1:064��0:133�xÿ 0:031��0:0041�x2 r2 � 0:71
�3�
The course of actual weight and protein gain
(g kg)0.70 day)1) as a result of the dietary DE and DCP
intake are presented in Fig. 2(B). It is obvious, that at low
energy and protein intake, growth as well as feed conversion
e�ciency were low (see also Table 3), but both improved
gradually with increasing feed intake. At high DE density
weight and protein gain started to decline again in direct
response to the lower DCP intake (Fig. 2B).
Weight and protein gain in relation to dietary DE density
can be best described by second order polynomial equations
as shown below:
Weight gain �g kgÿ0:70 dayÿ1� � ÿ8:57��1:58�� 1:38��0:21�xÿ 0:033��0:0064�x2 r2 � 0:89
�4�
Protein gain�g kgÿ0:70 dayÿ1� � ÿ2:02��0:35�� 0:32��0:045�xÿ 0:0084��0:0014�x2 r2 � 0:82
�5�
As a result of feeding diets with varying DE to DCP contents
the composition of the weight gain of the ®sh fed with the 15
experimental diets changed (Fig. 2C). Protein gain per kg
weight gain showed narrow limits between 157 and 190 g,
with an indication of a decline at high DE density, whereas
lipid gain showed wide ranges from 55 up to 210 g kg)1 with
increasing DE intake, without reaching a maximum.
To examine the e�ect of DE and DCP intake on the
e�ciency of energy and protein utilization separately, an
approach similar to the recent study with S. aurata (Lupatsch
et al. 1998) was used. Figure 3(A, B) shows the relationship
between digestible energy intake and energy gain (3 A) and
digestible protein intake and protein gain (3B), each referring
to their respective metabolic weights of kg0.83 and kg0.70. The
relationship between dietary DE intake (x, kJ kg)0.83) and
energy retained (y, kJ kg)0.83) per day was found to be linearTable
3Weightgain,protein
gain
andfeed
conversione�
ciency
inSparusaurata
inTrials1to
3(m
ean�
SD)
Trial1
Trial2
Trial3
Diet
D1
D2
D3
D4
D5
D6
D7
D8
D9
D10
D11
D12
D13
D14
D15
DEden
sity
(MJkg
^1as
fed)
10.02
11.59
13.03
12.58
13.37
14.89
17.13
18.15
19.45
18.18
18.86
19.62
20.39
20.62
21.57
Inititalweight(g)
17.0
þ0.07
17.4
þ0.29
17.6
þ0.78
17.9
þ0.25
17.4
þ0.15
17.2
þ0.58
25.1þ0.19
25.5
þ0.09
25.3
þ0.47
25.4
þ0.28
31.6
þ0.17
32.1þ0.32
32.7
þ0.46
31.6
þ0.21
31.7
þ0.24
Finalweight(g)
41.9
þ0.53
49.9
þ3.56
58.5
þ4.27
70.5
þ4.03
71.3
þ2.83
70.6
þ1.85
77.2
þ0.41
89.2
þ1.20
95.2
þ1.31
93.5
þ0.58
104.3þ3.95
109.5þ4.53
102.4þ5.89
99.4
þ5.15
94.6
þ4.97
Mea
nweight(g)1
26.7
29.5
32.1
35.6
35.2
34.9
44.0
47.7
49.1
48.7
57.4
59.3
57.8
56.0
54.7
Weightgain
(gday
^1¢sh
^1 )
0.178þ0.004
0.23
2þ0.02
30.29
2þ0.02
50.376þ0.02
80.385
þ0.02
0.382
þ0.017
0.55
4þ0.005
0.67
8þ0.012
0.74
4þ0.010
0.72
4þ0.004
0.79
0þ0.04
20.841
þ0.05
30.75
8þ0.069
0.73
8þ0.05
60.683
þ0.05
7
Protein
gain
(gday
^1¢sh
^1 )
0.02
9þ0.00
0.04
3þ0.005
0.05
3þ0.002
0.071þ0.003
0.072þ0.005
0.071þ0.005
0.09
4þ0.001
0.120þ0.003
0.134þ0.002
0.125þ0.004
0.14
4þ0.013
0.14
8þ0.009
0.127þ0.015
0.120þ0.009
0.107þ0.010
FCR2
2.31
þ0.027
2.13
þ0.141
2.08þ0.138
1.60þ0.069
1.62
þ0.05
61.66þ0.103
1.61
þ0.03
71.35
þ0.021
1.23
þ0.02
81.27
þ0.013
1.26
þ0.03
61.22
þ0.037
1.33
þ0.051
1.23
þ0.04
21.27
þ0.02
3
1 Geo
metricmea
n(initialw
eight
´¢nalweight)0.5.
2Feed
consumed
asfed(g)/liveweightgain(g).
Protein and energy supply in Sparus aurata
. . . . . . . . . . . . . . . . . . . . . . . . . . . . . . . . . . . . . . . . . . . . . . . . . . . . . . . . . . . . . . . . . . . . . . . . . . . . . . . . . . . . . . . . . . . . . .
Ó 2001Blackwell Science Ltd Aquaculture Nutrition 7;71^80
75
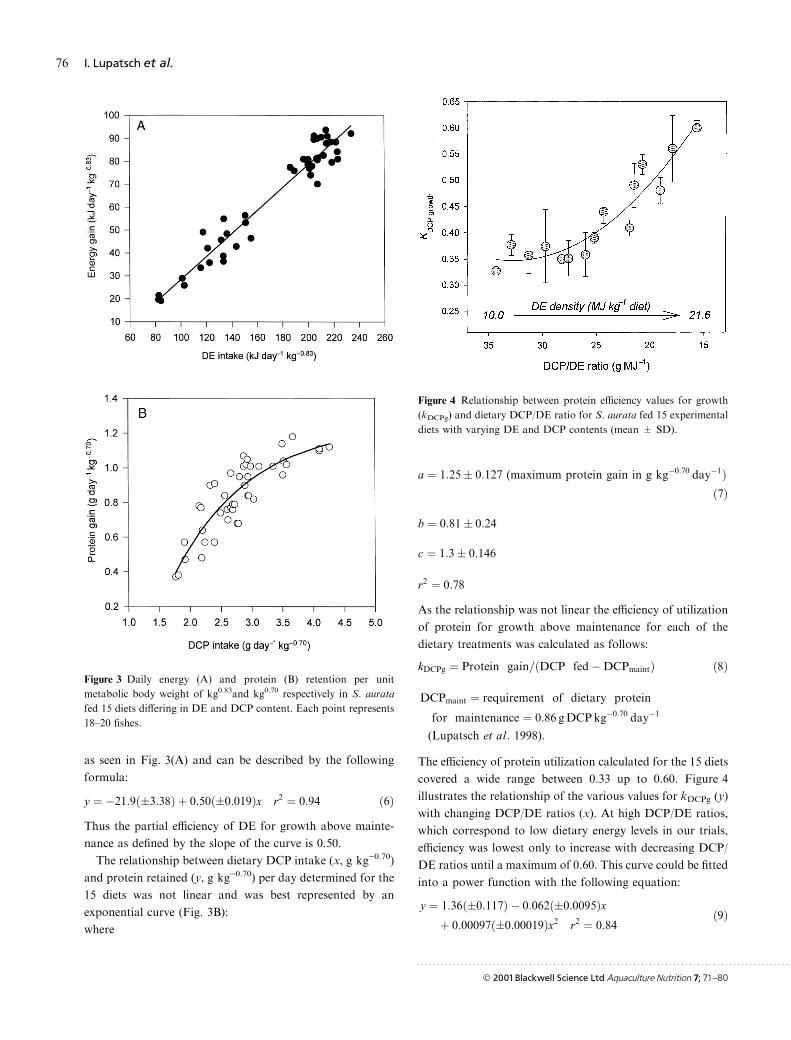
as seen in Fig. 3(A) and can be described by the following
formula:
y � ÿ21:9��3:38� � 0:50��0:019�x r2 � 0:94 �6�Thus the partial e�ciency of DE for growth above mainte-
nance as de®ned by the slope of the curve is 0.50.
The relationship between dietary DCP intake (x, g kg)0.70)
and protein retained (y, g kg)0.70) per day determined for the
15 diets was not linear and was best represented by an
exponential curve (Fig. 3B):
where
a � 1:25� 0:127 (maximum protein gain in g kgÿ0:70 dayÿ1��7�
b � 0:81� 0:24
c � 1:3� 0:146
r2 � 0:78
As the relationship was not linear the e�ciency of utilization
of protein for growth above maintenance for each of the
dietary treatments was calculated as follows:
kDCPg � Protein gain=�DCP fedÿDCPmaint� �8�
DCPmaint � requirement of dietary protein
for maintenance � 0:86 gDCPkgÿ0:70 dayÿ1
(Lupatsch et al: 1998):
The e�ciency of protein utilization calculated for the 15 diets
covered a wide range between 0.33 up to 0.60. Figure 4
illustrates the relationship of the various values for kDCPg (y)
with changing DCP/DE ratios (x). At high DCP/DE ratios,
which correspond to low dietary energy levels in our trials,
e�ciency was lowest only to increase with decreasing DCP/
DE ratios until a maximum of 0.60. This curve could be ®tted
into a power function with the following equation:
y � 1:36��0:117� ÿ 0:062��0:0095�x� 0:00097��0:00019�x2 r2 � 0:84
�9�
Figure 3 Daily energy (A) and protein (B) retention per unit
metabolic body weight of kg0.83and kg0.70 respectively in S. aurata
fed 15 diets di�ering in DE and DCP content. Each point represents
18±20 ®shes.
Figure 4 Relationship between protein e�ciency values for growth
(kDCPg) and dietary DCP/DE ratio for S. aurata fed 15 experimental
diets with varying DE and DCP contents (mean � SD).
I. Lupatsch et al.
. . . . . . . . . . . . . . . . . . . . . . . . . . . . . . . . . . . . . . . . . . . . . . . . . . . . . . . . . . . . . . . . . . . . . . . . . . . . . . . . . . . . . . . . . . . . . .
Ó 2001Blackwell Science Ltd Aquaculture Nutrition 7;71^80
76
Discussion
Feed intake
Digestible energy content is thought to be one of the major
criteria controlling feed intake in ®sh (Lee & Putnam 1972;
Jobling & Wandsvik 1983; Kentouri et al. 1995; Paspatis &
Boujard 1996) along with other factors including ®sh size,
temperature or palatability. In the present study S. aurata
regulated voluntary feed intake according to DE rather than
to dietary DCP which is apparent from Fig. 1(A, B). Feed
intake (Fig. 1A) followed a bell shaped curve, where feed
intake per g BW (kg))0.70 decreased with high dietary DE
content (equation 1). Thus the total amount of DE consumed
reached a plateau of maximum intake of about
264 kJ kg)0.83 day)1 (Fig. 2A, equation 2). On the other
hand, feed intake in gilthead seabream was reduced at low
dietary DE densities as well. However, as low DE diets (D1±
D6) were formulated with up to 36% cellulose, the possibility
of palatability problems cannot be excluded.
According to Bromley & Adkins (1984), trout could
regulate their feed intake to make up for low energy density
until 30% cellulose inclusion was reached when intake
dropped drastically. This fact, together with an increase in
stomach weight in trout fed with a 40±50% cellulose diet, was
interpreted by the authors, that the ®sh could not compen-
sate feed intake any more because of limiting stomach
capacity. Feeding was also reduced in channel cat®sh, when
given a diet with higher ®bre levels, indicating that the extra
bulk depressed the feed intake (Page & Andrews 1973).
In this study gilthead seabream was able, within limits, to
compensate for a low energy feed by enhancing intake as
long as the physical capacity of the digestive tract permitted.
However, the feed intake indirectly controlled the protein
consumption as seen in Fig. 2(A). Reduced intake of high
energy diets on one hand, and at the other extreme, very low
energy diets, decreased protein intake and thus caused
growth depression (Fig. 2B).
A similar process was observed in trout, where caloric
intake was regulated by feed, but protein intake was not
compensated by feed intake (Boujard & Me dale 1994). Ellis
& Reigh (1991) also suggested in their study with red drum,
that low protein intake in combination with high dietary
gross energy (GE):crude protein (CP) ratios was growth-
limiting.
Growth composition
Knowledge of the energy and protein content of the weight
gain of ®sh allows an estimate of the necessary dietary
supply. As stated previously with S. aurata (Lupatsch et al.
1998), the protein level stayed at a constant 179 g kg)1
whereas the lipid level increased with increasing ®sh size. The
same pattern could be observed in the present trials, with
body composition displaying narrow limits for protein,
between 157 and 190 g kg)1 but wide ranges for lipid
deposition from 55 to 210 g kg)1 weight gain (Fig. 2C). This
pattern occurred regardless of ®sh size suggesting additional
dietary in¯uences. Linear regression between ®sh size and fat
deposition could account for 75% of the variation and
regression between dietary DE and lipid retention could
explain 93% of the variance (after Fig. 2C).
There seems to be a common pattern where ®sh tend to
increase their lipid deposition with increasing fat levels in
diets in conjunction with decreasing protein intake. Feeding
trout ad libitum with a non-protein energy source and
restricted protein led to increasing levels of fat in the carcass
(Kaushik & Luquet 1984). Under protein restriction, carp
accumulated proportionally more dry matter, fat and energy
(Schwarz et al. 1985). The dressing out percentage of
Atlantic salmon dropped, and the fat in the ®llet was higher,
as the protein content of the diets decreased to 35%, which
corresponded to a DCP/DE ratio of 14.8 (Hillestad &
Johnsen 1994).
Energy and protein utilization
In the present study with S. aurata the relationship between
daily DE intake and energy retained per BW (kg)0.83 was
found to be linear (Fig. 3A), and thus e�ciency of utilization
of DE was constant as demonstrated previously (Lupatsch
et al. 1998). The slope that describes the partial e�ciency of
DE for growth (kDEg � 0.50, equation 6) is close to the value
of 0.46 found in the previous paper. On the other hand the
relationship between DCP intake and protein retained using
diets with varying protein content was better described by an
exponential curve (Fig. 3B, equation 7). At low DCP intake,
the slope of the curve is the steepest, thus the protein gain is
at its most e�cient ± as limiting ± but plateauz at a maximum
daily protein gain, which was 1.25 g protein BW (kg))0.70 in
this trial (equation 7). The di�erences in the protein response
result from its utilization both as a protein and as an energy
source. As protein gain reaches a maximum and voluntary
feed intake is regulated by DE requirements it is likely that
surplus protein is used as an energy source. Also, if the diet is
de®cient in nonprotein energy, protein will be used for
energetic purposes rather than for protein synthesis, causing
reduced growth even with high dietary protein content, and
hence resulting in lower e�ciency.
Protein and energy supply in Sparus aurata
. . . . . . . . . . . . . . . . . . . . . . . . . . . . . . . . . . . . . . . . . . . . . . . . . . . . . . . . . . . . . . . . . . . . . . . . . . . . . . . . . . . . . . . . . . . . . .
Ó 2001Blackwell Science Ltd Aquaculture Nutrition 7;71^80
77
This is illustrated in Fig. 4, where the values of kDCPg
(after equation 8) are shown in relation to DCP/DE ratios.
At high dietary DCP/DE ratios we ®nd the e�ciency of
protein utilization to level around 0.35. A further increase of
the DE content by raising the non-protein energy fraction
improved the protein e�ciency which reached kDCPg � 0.60
at low DCP intake.
However, the highest protein e�ciency did not concur with
maximum growth, and it indicates limiting protein supply, as
the following example illustrates. Maximum weight gain in
S. aurata (Fig. 2B, equation 4) could be achieved with an
intake of 217 MJ DE kg)0.83 and 2.68 g DCP kg)0.70 day)1
(Fig. 2A), providing a DCP/DE ratio of 18.2 for a 50-g ®sh.
On the other hand, to reach maximum protein gain (Fig. 2B,
equation 5) 204 MJ DE kg)0.83 and a minimum of 3.01 g
DCP kg)0.70 day)1 had to be supplied. This corresponds to a
DCP/DE ratio of 21.8. At DCP/DE ratios of 18.2 and 21.8
we ®nd kDCPg values of 0.55 and 0.47, respectively (Fig. 4,
equation 9). The di�erence in this response is owing to the
change in the relative composition of the weight gain
(Fig. 2C) as mentioned before. The value of kDCPg � 0.47
therefore characterizes protein e�ciency for maximum pro-
tein gain, higher protein e�ciencies can only be reached at
reduced overall gain.
These ®ndings, where maximum growth and highest
protein e�ciency are not identical agrees with reports in
other ®sh species such as tilapia (Kaushik et al. 1995) and
trout (Kim & Kaushik 1992). In other studies with S. aurata,
Vergara et al. (1996a) described decreasing protein e�ciency
ratio (PER) values with increasing dietary protein levels from
420 to 580 g kg)1, but weight gain was improved with the
higher protein diets for gilthead seabream sized 5±30 g. The
same pattern was observed by Santinha et al. (1996), where a
55% protein diet gave the best growth in gilthead seabream,
between 9 and 63 g, but a 40% protein diet showed the
highest protein e�ciency.
From the point of view of ®sh culture, growth can be
maximized either in terms of protein or fat. The optimum
DCP and DE supply will vary depending upon the criterion
used for evaluating optimization: using highest protein or
energy e�ciency or maximum weight and protein deposition.
Daily protein requirements
Fish require the supply of digestible essential amino acids
plus certain quantities of non-essential amino-N for the
synthesis of protein. Digestible crude protein may not be
su�ciently precise for indicating requirements of ®sh or
quality of dietary protein. In the present work however, ®sh
meal was the only source of protein in each of the 15 diets
fed. The DCP as used in this paper therefore represents the
amino acid patterns similar to those found in ®sh meal.
In a previous paper (Lupatsch et al. 1998) energy require-
ments were calculated for gilthead seabream using the
factorial approach. Similarly, the daily protein requirements
can be quanti®ed using the value of kDCPg � 0.47, which
Body weight (g fish)1) 10 100 250Metabolic BW (kg0.70) 0.0398 0.199 0.379DCPm1 (g ¢sh)1 day)1) 0.034 0.172 0.326Body protein (g kg)1) 179 179 179Weight gain2 (g ¢sh)1 day)1) 0.25 1.00 1.82RCP (g fish)1 day)1) 0.045 0.179 0.326DCPg3 (g ¢sh)1 day)1) 0.096 0.398 0.694DCPm+g (g ¢sh)1 day)1) 0.130 0.570 1.019DE4 (kJ ¢sh)1 day)1) 4.55 25.61 52.85DE density of feed 16 20 16 20 16 20Feed intake (g fish)1 day)1) 0.284 0.228 1.60 1.28 3.30 2.69DCP content (g kg)1) 455 569 345 432 309 387FCR 1.14 0.91 1.60 1.28 1.80 1.44DCP/DE 28.5 28.5 21.6 21.6 19.3 19.3
1Digestible crude protein required for maintenance = 0.86 g BW kg)0.70 day)1. Values determined forS. aurata (Lupatsch et al.1998).2 Predicted growth for S. aurata (Lupatsch & Kissil 1998).Weight gain (g day)1 ¢sh)1) = 0.0167 ´ weight(g) 0.621 ´ e0.055 T for T = 23 °C.3 Digestible crude protein required for growth using partial e¤ciency of 0.47 (present study).4 Digestible energy required for maintenance = 55.8 kJ kg)0.83 day)1, digestible energy required forgrowth using partial e¤ciency of DE for growth = 0.50 (present study), retained energy based onenergy content of ¢sh = 11.35 ´ BW (kg) 0.115 MJ kg)1.Values determined for S. aurata (Lupatsch et al.1998).
Table 4 Recommendations of dietary
energy and protein supply for growing
Sparus aurata
I. Lupatsch et al.
. . . . . . . . . . . . . . . . . . . . . . . . . . . . . . . . . . . . . . . . . . . . . . . . . . . . . . . . . . . . . . . . . . . . . . . . . . . . . . . . . . . . . . . . . . . . . .
Ó 2001Blackwell Science Ltd Aquaculture Nutrition 7;71^80
78
corresponds to the optimal utilization of protein for growth
as described above. Some recommendations for formulating
practical diets using these values for growing seabream are
given in Table 4.
As ®sh are eating to satisfy their energy requirements, total
feed intake would depend initially upon the chosen dietary
DE content. The absolute protein requirement per day per
®sh is dependent on ®sh size and weight gain, regardless of
dietary DE density. Therefore, the protein level expressed as
a percentage of the feed will change according to the
preferred DE level (Table 4). The DCP/DE ratio will
decrease with increasing ®sh size and decreasing growth
potential, as demonstrated in Table 4, owing to the changing
ratio of energy to protein of the gain and the increasing
proportion of energy used for maintenance with increasing
®sh size.
This is shown in the study of GarcõÂa-Alca zar et al. (1994)
for gilthead seabream, where smaller ®sh up to 100 g grow
better on a 49% protein and 12% lipid diet while bigger ®sh
up to 330 g performed better on a 45% protein and 19% lipid
diet. The optimal DCP/DE ratio also decreased in Atlantic
salmon with increasing ®sh weight (Einen & Roem 1997).
Current assessments of protein requirements for trout are
22±24 gDCP/MJDE(Cho&Kaushik1990;Cho1992) and for
carp 20±22 g CP/DE (Schwarz et al. 1983; Zeitler et al. 1984).
These values of course would depend on ®sh size, growth rate
and composition of the gain as calculated in Table 4.
Fish, that are able to consume high amounts of feed owing
to increased stomach capacity, could be fed lower energy
diets with low protein levels, as, based on the calculation
from Table 4, the same amount of protein per day would be
consumed. It has been reported that the optimum dietary
protein content changes in carp and rainbow trout with
increasing feeding intensity (Ogino 1980): in carp the optimal
crude protein content decreased from 50% to 35% with an
increasing feed intake from 2.5 to 3.5%. Beamish & Medland
(1986) found, that growth rate in large trout had signi®cantly
improved on a high protein diet, but the e�ects were only
apparent at restricted feeding.
This study has shown that optimal protein requirements
for growth in ®sh change both with feed intake and with
dietary energy density. These ®ndings may explain di�erences
between previous reports de®ning optimal dietary protein
levels for ®sh.
References
Beamish, F.W.H. & Medland, T.E. (1986) Protein sparing e�ects in
large rainbow trout, Salmo gairdneri. Aquaculture, 55, 35±42.
Boujard, T. & Me dale, F. (1994) Regulation of voluntary feed intake
in juvenile rainbow trout fed by hand or by self-feeders with diets
containing two di�erent protein/energy ratios. Aquat. Living
Resour., 7, 211±215.
Bromley, P.J. & Adkins, T.C. (1984) The in¯uence of cellulose ®ller
on feeding, growth and utilization of protein and energy in
rainbow trout, Salmo gairdnerii Richardson. J. Fish. Biol., 24,
235±244.
Cho, C.Y. (1992) Feeding systems for rainbow trout and other
salmonids with reference to current estimates of energy and
protein requirements. Aquaculture, 100, 107±123.
Cho, C.Y. & Kaushik, S.J. (1990) Nutritional energetics in ®sh:
energy and protein utilization in rainbow trout. World Rev. Nutr.
Diet., 61, 132±172.
Einen, O. & Roem, A.J. (1997) Dietary protein/energy ratios for
Atlantic salmon in relation to ®sh size: growth, feed utilization and
slaughter quality. Aquacult. Nutr., 3, 115±126.
Ellis, S.C. & Reigh, R.C. (1991) E�ects of dietary lipid and
carbohydrate levels on growth and body composition of juvenile
red drum, Sciaenops ocellatus. Aquaculture, 97, 383±394.
Folch, J., Lees, M. & Sloane, G.H. (1957) Simple method for
isolation and puri®cation of total lipids from animal tissues. J. Biol.
Chem., 226, 497±507.
GarcõÂa-Alca zar, A., Abella n, E., Dehesa, M.R.L., Arizcun, M.,
Delgado, J. & Ortega, A. (1994) Pre-growout and growout results
for sea bream (Sparus aurata L.) and sea bass (Dicentrarchus
labrax L.) with di�erent fat/protein ratios. Bol. Inst. Esp. Ocea-
nogr., 10, 191±201.
Henken, A.M., Machiels, M.A.M., Dekker, W. & Hogendoorn, H.
(1986) The e�ect of dietary protein and energy content on growth
rate and feed utilization of the African cat®sh Clarias gariepinus
(Burchell 1822). Aquaculture, 58, 55±74.
Hillestad, M. & Johnsen, F. (1994) High-energy/low-protein diets for
Atlantic salmon: e�ects on growth, nutrient retention and slaugh-
ter quality. Aquaculture, 124, 109±116.
Jobling, M. & Wandsvik, A. (1983) An investigation of factors
controlling food intake in Arctic charr, Salvelinus alpinus L. J. Fish
Biol., 23, 397±404.
Kaushik, S.J., Doudet, T., Me dale, F., Aguirre, P. & Blanc, D.
(1995) Protein and energy needs for maintenance and growth of
Nile tilapia (Oreochromis niloticus). J. Appl. Ichthyol., 11, 290±296.
Kaushik, S.J. & Luquet, P. (1984) Relationship between protein
intake and voluntary energy intake as a�ected by body weight with
an estimation of maintenance needs in rainbow trout. Z. Tier-
physiol. TierernaÈhr. U. Futtermittelkd., 51, 57±69.
Kentouri, M., Divanach, P., Geurden, I. & Anthouard, M. (1995)
Evidence of adaptive behaviour in gilthead seabream (Sparus
aurata L.) in relation to diet composition, in a self-feeding
condition. Ictyophysiol. Acta, 18, 125±143.
Kim, J.D. & Kaushik, S.J. (1992) Contribution of digestible energy
from carbohydrates and estimation of protein/energy requirements
for growth of rainbow trout (Oncorhynchus mykiss). Aquaculture,
106, 161±169.
Kissil, G.Wm., Meyers, S.P., Stickney, R.R. & Gropp, J. (1982)
Protein ± energy ratios in the feed of the gilthead bream (Sparus
aurata). Proceedings of the Warmwater Fish Culture Workshop.
World Mariculture Society. Special Publication, 3, 145±152.
Lanari, D., D'Agaro, E. & Ballestrazzi, R. (1995) E�ect of dietary
DP/DE ratio on apparent digestibility, growth and nitrogen and
phosphorus retention in rainbow trout, Oncorhynchus mykiss
(Walbaum). Aquacult. Nutr., 1, 105±110.
Lee, D.J. & Putnam, G.B. (1972) The response of rainbow trout to
varying protein/energy ratios in a test diet. J. Nutr., 103, 916±922.
Protein and energy supply in Sparus aurata
. . . . . . . . . . . . . . . . . . . . . . . . . . . . . . . . . . . . . . . . . . . . . . . . . . . . . . . . . . . . . . . . . . . . . . . . . . . . . . . . . . . . . . . . . . . . . .
Ó 2001Blackwell Science Ltd Aquaculture Nutrition 7;71^80
79

Lupatsch, I. & Kissil, G.Wm. (1998) Predicting aquaculture waste
from gilthead seabream (Sparus aurata) culture using a nutritional
approach. Aquat. Living Resour., 11, 265±268.
Lupatsch, I., Kissil, G.Wm., Sklan, D. & Pfe�er, E. (1997) Apparent
digestibility coe�cients of feed ingredients and their predictability
in compound diets for gilthead seabream, Sparus aurata L.
Aquacult. Nutr., 3, 81±89.
Lupatsch, I., Kissil, G.Wm., Sklan, D. & Pfe�er, E. (1998) Energy
and protein requirements for maintenance and growth in gilthead
seabream (Sparus aurata L.). Aquacult. Nutr., 4, 165±173.
Masser, M.P., Grant, W.E., Neill, W.H. & Robinson, E.H. (1991) A
simulation model representing e�ects of dietary energy/protein
ratio and water temperature on growth of channel cat®sh
(Ictalurus punctatus). Ecol. Modelling, 53, 17±35.
Ogino, C. (1980) Protein requirements of carp and rainbow trout.
Bull. Jap. Soc. Sci. Fish., 46, 385±388.
Page, J.W. & Andrews, J.W. (1973) Interactions of dietary levels of
protein and energy on channel cat®sh (Ictalurus punctatus).
J. Nutr., 103, 1339±1346.
Paspatis, M. & Boujard, T. (1996) A comparative study of
automatic feeding and self-feeding in juvenile Atlantic salmon
(Salmo salar) fed diets of di�erent energy levels. Aquaculture,
145, 245±257.
Sabaut, J.J. & Luquet, P. (1973) Nutritional requirements of the
gilthead bream Chrysophrys aurata. Quantitative protein require-
ments. Mar. Biol., 18, 50±54.
Santinha, P.J.M., Gomes, E.F.S. & Coimbra, J.O. (1996) E�ects of
protein level of the diet on digestibility and growth of gilthead
seabream, Sparus aurata L. Aquacult. Nutr., 2, 81±87.
Schwarz, F.J., Plank, J. & Kirchgessner, M. (1985) E�ects of protein
or energy restriction with subsequent realimentation on perform-
ance parameters of carp (Cyprinus carpio L.). Aquaculture, 48,
23±33.
Schwarz, F.J., Zeitler, M.H. & Kirchgessner, M. (1983) Wachstum
und NaÈ hrsto�aufwand bei Karpfen (Cyprinus carpio L.) mit
unterschiedlicher Protein- und Energieversorgung. 2. Mittlere
Gewichtsentwicklung, Futterverwertung, Protein- und Ener-
gieaufwand. Z. Tierphysiol., TierernaÈhr. U. Futtermittelkd., 49,
88±98.
Shiau, S.Y. & Huang, S.L. (1990) In¯uence of varying energy levels
with two protein concentrations in diets for hybrid tilapia
(Oreochromis niloticus ´ O. aureus) reared in seawater. Aquacul-
ture, 91, 143±152.
Shimeno, S., Hosokawa, H., Takeda, M., Kajiyama, H. & Kaisho, T.
(1985) E�ect of dietary lipid and carbohydrate on growth, feed
conversion and body composition in young yellowtail. Bull. Jap.
Soc. Sci. Fish., 51, 1893±1898.
Takeda, M., Shimeno, S., Hosokawa, H., Kajiyama, H. & Kaisyo, T.
(1975) The e�ect of dietary calorie-to-protein ratio on the growth,
feed conversion and body composition of young yellowtail. Bull.
Jap. Soc. Sci. Fish., 41, 443±447.
Tibaldi, E., Tulli, F., Ballestrazzi, R. & Lanari, D. (1991) E�ect of
dietary protein/metabolizable energy ratio and body size on the
performance of juvenile sea bass. Zoot. Nutr. Anim., 17, 313±320.
Vergara, J.M., Ferna ndez-Palacios, H., Robaina , L., Jauncey, K., de
la Higuera, M. & Izquierdo, M. (1996a) The e�ects of varying
dietary protein level on the growth, feed e�ciency, protein
utilization and body composition of gilthead seabream fry. Fish
Sci., 62, 620±623.
Vergara, J.M., Robaina , L., Izquierdo, M. & de la Higuera, M.
(1996b) Protein sparing e�ect of lipids in diets for ®ngerlings of
gilthead seabream. Fish Sci., 62, 624±628.
Watanabe, T., Takeuchi, T., Satoh, S., Ida, T. & Yaguchi, M. (1987)
Development of low protein-high energy diets for practical carp
culture with special reference to reduction of total nitrogen
excretion. Nippon Suisan Gakkaishi, 53, 1413±1423.
Williams, C.D. & Robinson, E.H. (1988) Response of red drum to
various dietary levels of menhaden oil. Aquaculture, 70, 107±120.
Winfree, R.A. & Stickney, R.R. (1981) E�ects of dietary protein and
energy on growth, feed conversion e�ciency and body composi-
tion of Tilapia aurea. J. Nutr., 111, 1001±1012.
Zeitler, M.H., Kirchgessner, M. & Schwarz, F.J. (1984) E�ects of
di�erent protein and energy supplies on carcass composition of
carp (Cyprinus carpio L.). Aquaculture, 36, 37±48.
I. Lupatsch et al.
. . . . . . . . . . . . . . . . . . . . . . . . . . . . . . . . . . . . . . . . . . . . . . . . . . . . . . . . . . . . . . . . . . . . . . . . . . . . . . . . . . . . . . . . . . . . . .
Ó 2001Blackwell Science Ltd Aquaculture Nutrition 7;71^80
80