Embed Size (px)
Citation preview
2016
Egypt: A potential hub for commercial activities in Africa and the Middle East
Nov.
EGYPT AS A HUB FOR TRADE AND INVESTMENT IN AFRICA is a research carried out by ALEXBANK and SRM
Research Directors: Dante CAMPIONI (ALEXBANK), Massimo DEANDREIS (SRM)
Head of Research Team: Emil ESKANDER (ALEXBANK), Alessandro PANARO (SRM), Ramy TAHA (ALEXBANK).
Team of Research: Hemat EL MASRY (ALEXBANK), Olimpia FERRARA (SRM), Luca FORTE (SRM), Samer HALIM (ALEXBANK), Omar ISMAIL (ALEXBANK), Dario RUGGIERO (SRM).
Cover design: Marina RIPOLI (SRM).
Graphic design and data visualization: Raffaela QUAGLIETTA (SRM).
Special thanks to Mrs. Mai EL-GENDI from the General Authority for Investment and Free Zones (GAFI), Mr. Atter HANNOURA (Head of PPP unit at the Ministry of Finance and Board Member of ALEXBANK) and ALEXBANK’s Corporate Division for the additional data they provided us with.
Chiara CIMINI, Erica D’ACUNZO and Maria Rosaria NICODEMO contributed at the preparation of the study. Chiara CIMINI contributed at the elaboration of the maps of Egypt’s trade agreements in section 2.
The report has been elaborated with data available in January 2016.
EGYPT: A POTENTIAL HUB FOR COMMERCIAL ACTIVITIES IN
AFRICA AND THE MIDDLE EASTA Research Paper
by ALEXBANK Research in Co-operation with SRM
Outline
FACTS & FIGURES 5
INTRODUCTION 7
SECTION 1. EGYPT’S ECONOMY AT A GLANCE 10
Trade Policy Developments 12
Egypt’s Trade Statistics 13
SECTION 2. EGYPT’S TRADE AGREEMENTS 16
Egypt-Eu Association Agreement 19
PAFTA (Pan Arab Free Trade Area) 21
Agadir Agreement 23
QIZ (Qualifying Industrial Zones) 25
Egypt-Mercosur (Common Market of the South America ) 27
Egypt-Turkey Agreement 29
COMESA (Common Market for Eastern and Southern Africa) 31
Other Trade Agreements 33
European Trade Policy 34
SECTION 3. AFRICA….THE NEW PATHWAY OF GROWTH (Case study of African Tripartite Free Trade Agreement) 35
TFTA Background and timeline 35
Potentials of TFTA 36
Egypt’s experience with COMESA 38
Conclusion 40
SECTION 4. THE NEW SUEZ CANAL: A BOOST FOR INTERNATIONAL TRADE 41
The New Suez Canal 41
Suez Canal Corridor Development 42
SECTION 5. FDI… POTENTIAL KEY DRIVER FOR GROWTH 46
Egypt as an Attractive Investment Destination 47
Investment Climate Reforms 48
Investment Opportunities 49
PPP Projects …Co-Operation to Development 49
Italian Egyptian Economic Relations 50
CONCLUSION 61
Appendix 1. The Investment Climate 62
Appendix 2. Mega Projects Offered Through EEDC 77
Appendix 3. PPP Projects 80
Appendix 4. A List of Newly Restricted Imports 83
Appendix 5. CBE’s New Definition for SMEs 84
LIST OF SOURCES 85
FACTS & FIGURES
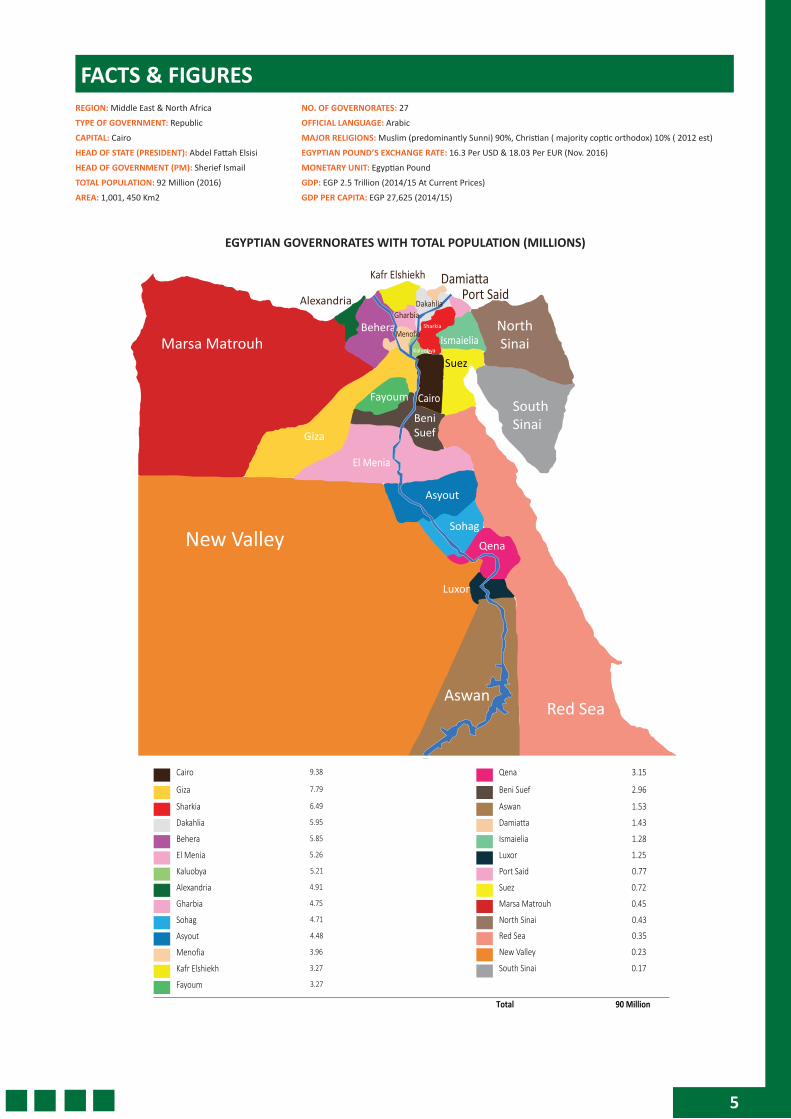
EGYPTIAN GOVERNORATES WITH TOTAL POPULATION (MILLIONS)
Marsa Matrouh
New Valley
AswanRed Sea
Luxor
Qena
Sohag
Asyout
El Menia
Beni Suef
FayoumSouth Sinai
North Sinai
Suez
Ismaielia
Kafr Elshiekh
Alexandria
Behera
Giza
Cairo
Kaluobya
Sharkia
Gharbia
Menofia
Dakahlia
DamiattaPort Said
Sharkia
Dakahlia
Behera
El Menia
Kaluobya
Alexandria
Gharbia
Sohag
Asyout
Menofia
Kafr Elshiekh
Fayoum
Total
6.49
5.95
5.85
5.26
5.21
4.91
4.75
4.71
4.48
3.96
3.27
3.27
Aswan
Damiatta
Ismaielia
Luxor
Port Said
Suez
Marsa Matrouh
North Sinai
1.53
1.43
Giza 7.79 Beni Suef 2.96
Cairo 9.38 Qena 3.15
1.28
1.25
0.77
0.72
0.45
0.43
Red Sea
New Valley
South Sinai
0.35
0.23
0.17
90 Million
5
REGION: Middle East & North Africa
TYPE OF GOVERNMENT: Republic
CAPITAL: Cairo
HEAD OF STATE (PRESIDENT): Abdel Fattah Elsisi
HEAD OF GOVERNMENT (PM): Sherief Ismail
TOTAL POPULATION: 92 Million (2016)
AREA: 1,001, 450 Km2
NO. OF GOVERNORATES: 27
OFFICIAL LANGUAGE: Arabic
MAJOR RELIGIONS: Muslim (predominantly Sunni) 90%, Christian ( majority coptic orthodox) 10% ( 2012 est)
EGYPTIAN POUND’S EXCHANGE RATE: 16.3 Per USD & 18.03 Per EUR (Nov. 2016)
MONETARY UNIT: Egyptian Pound
GDP: EGP 2.5 Trillion (2014/15 At Current Prices)
GDP PER CAPITA: EGP 27,625 (2014/15)
6
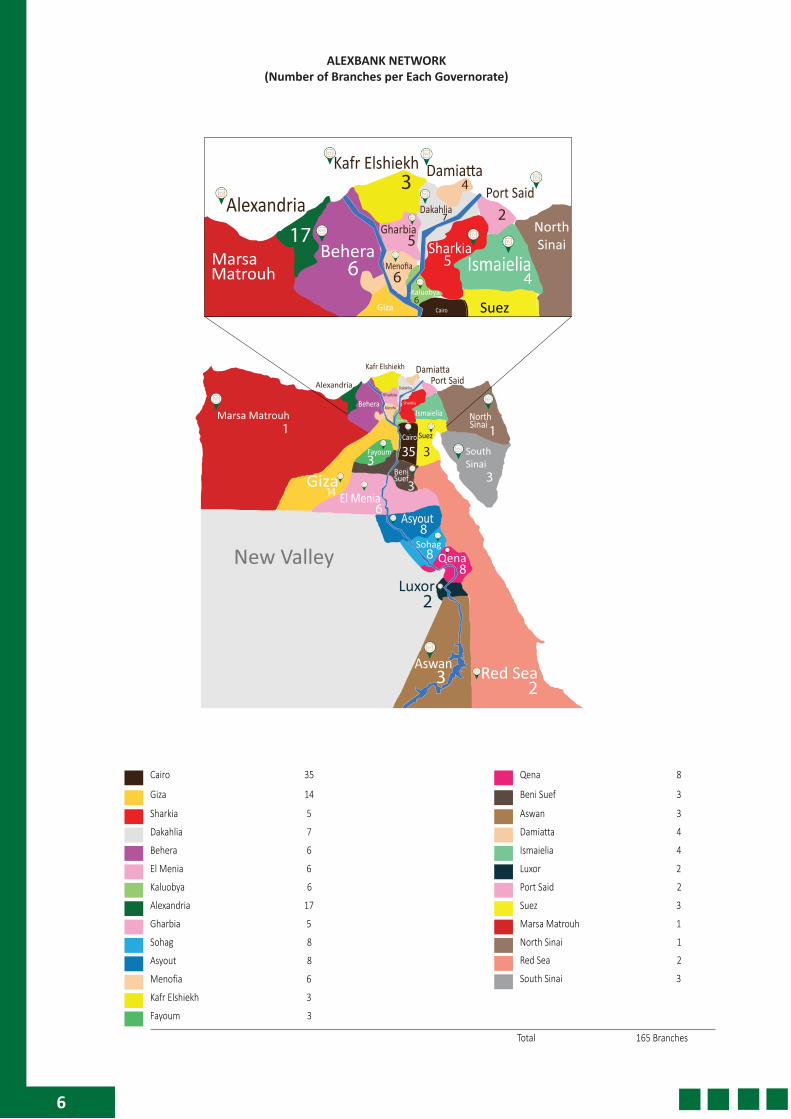
ALEXBANK NETWORK (Number of Branches per Each Governorate)
7
Sharkia
Dakahlia
Behera
El Menia
Kaluobya
Alexandria
Gharbia
Sohag
Asyout
Menofia
Kafr Elshiekh
Fayoum
Total
5
7
6
6
6
17
5
8
8
6
3
3
Aswan
Damiatta
Ismaielia
Luxor
Port Said
Suez
Marsa Matrouh
North Sinai
3
4
Giza 14 Beni Suef 3
Cairo 35 Qena 8
4
2
2
3
1
1
Red Sea
South Sinai
2
3
165 Branches
INTRODUCTION
Egypt has been historically a center of trade and business in the Middle East due to its strategic location in the crossroads between the East and the West which offers the international companies a platform for their commercial activities into the Middle East and Africa. Aiming to exploit the unique advantages it enjoys, Egypt has conducted an economic reform program with trade policy at the forefront since the early 1990s. Trade liberalization policy was a part of a broader economic program called Structural Adjustment Program (ERSAP) that was implemented under the IMF’s supervision during (1991–1996) to integrate Egyptian economy in the global markets.
Accordingly, Egypt has progressively eliminated most quantitative restrictions and lowered tariff rates on imported goods and services. Some of trade reforms have been unilateral and others have been linked to Egypt’s commitments as a member of the General Agreement on Tariffs and Trade (GATT)1 since 1970 and the World Trade Organization (WTO) since 1995 that obligated Egypt to remove 98% of its tariffs through scheduled reductions during the period 1995–2005.
Egypt has always recorded a trade imbalance with the deficit reaching USD 37.6 billion in FY 2015/16 compared to only USD 12 billion in FY 2005/06. This is mainly attributed to the notable increase in imports whose volume grew by 85.2% during the period between FY 2005/06 and FY 2015/16.
Globally, the WTO’s regulations in this respect have been paralleled with an accelerated trend toward integration into regional blocs. Egypt wasn’t in isolation from these developments; it has headed for integration in regional and international trade agreements, aiming to face the fierce competition among different trading blocs, diversify markets and risk, benefit from economies of scale, attract capital investment and enhance export-led growth. Toward this end, Egypt has signed a wide array of trade agreements and expanded its network of relationships with its trade partners on the global arena. In the same context, Egypt is an active signatory of investment framework agreements with the Arab and African countries with the aim of strengthening inter-regional integration and fully benefit from trade agreements it signed as foreign investment is essential for the growth of the Egyptian economy.
This study offers an in-depth analysis for key trade agreements Egypt signed with its main partners including Europe, Africa, Asia and North & South America. It mainly covers the agreements’ key features, objectives and benefits for signing parties, where Egypt engages in several forms of international relations including Free Trade Agreement, Free Trade Zones, Common markets and collaborations with international organizations. In a specific section, there is a focus on the most recent trade agreement Egypt is involved in, which integrates the largest three African existing trade communities into one trade bloc creating the “Tripartite Free Trade Area (TFTA)”. The economic and trade co-operation with African countries returns to the mid of 1990s, when Egypt has participated in the Common Market for Eastern and Southern Africa (COMESA) and implemented successful steps in the integration process by removing a 100% of tariffs on imports from COMESA member states over the last ten years. In 2015, Egypt, along with 25 African countries, signed the agreement of launching the largest Free Trade Area in the world TFTA, hoping to be the new pathway of growth for Egypt in the future on the major three pillars TFTA focuses on: trade, investment and industrialization.
It must be highlighted that lately Egyptian authorities took different measures to boost the local economic activities and protect the market from the flood of cheap and low quality goods. These measures included:
• Strategic measures represented in:
■
■
■
Launching mega projects such as the inauguration of the new Suez Canal on the 6th of August 2015, as a first stage of a two phased mega project which consists of digging a new canal parallel to the original one with a total length of 72 km for the whole project. On the other hand, Egypt has commenced the Suez Canal Axis Development project, aiming at transforming the waterway into an integrated global business hub. This mega project is divided into industrial, residential and commercial zones, and aims to create a community in an area of 461 million km2, roughly twice the area of Singapore port and 10 times the area of Jebel Ali in the UAE. It includes developing 6 ports and 3 industrial zones to create new residential, agricultural and industrial communities. The project is expected to create 1.5 million jobs and attract billions of new investments.
Taking a number of measures, aiming to boost investment, Including the postponement of applying the capital gains tax in addition to introducing wide-ranging tax exemptions for producers of strategic goods and exempting investments in some areas from taxes a certain period.
Adopting a free-float exchange rate regime to deepen foreign currency liquidity in banks, improve Egypt’s competiveness and attract new foreign investments.
1 General Agreement on Tariffs and Trade (GATT) was a multilateral agreement regulating international trade, aiming at reaching a "substantial reduction of tariffs and other trade barriers and the elimination of preferences, on a reciprocal and mutually advantageous basis.", paving the way for establishing the World Trade Organization (WTO) on the 1st of January 1995.
7
■ Launching an initiative by the Central Bank of Egypt (CBE) that aims at encouraging banks to extend finance to Small and Medium Enterprizes (SMEs) to be extended at paticularly favorable conditions (only 5% interest rate) to Very Small and Small Enterprizes in addition to funding Medium Enterprizes at 7% interest rate.
■ Cutting energy subsidies partially to tackle Egypt’s long-lasting fiscal imbalances.
■ Issuing a new investment law that facilitates investments procedures.
• Tactical measures included issuing a series of decrees starting January 2016, aimed at rebalancing the trade deficit and promote the development of local value-added activities, including:
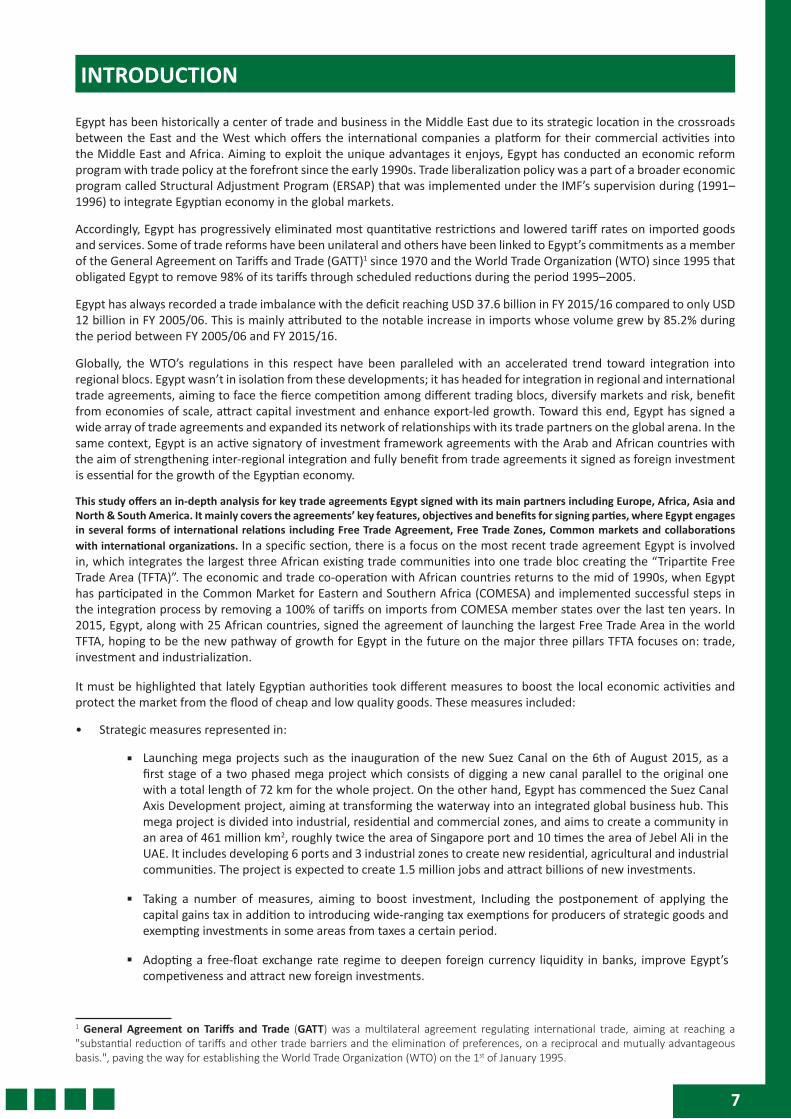
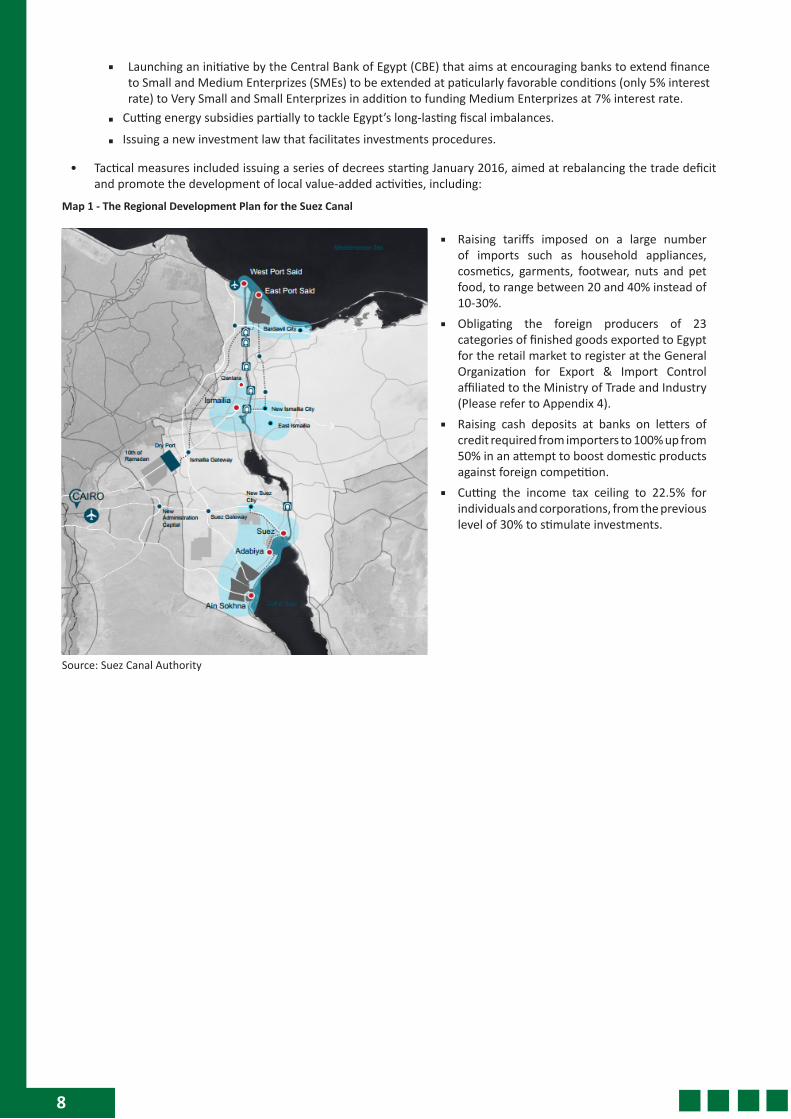
Map 1 - The Regional Development Plan for the Suez Canal
Source: Suez Canal Authority
■ Raising tariffs imposed on a large number of imports such as household appliances, cosmetics, garments, footwear, nuts and pet food, to range between 20 and 40% instead of 10-30%.
■ Obligating the foreign producers of 23 categories of finished goods exported to Egypt for the retail market to register at the General Organization for Export & Import Control affiliated to the Ministry of Trade and Industry (Please refer to Appendix 4).
■ Raising cash deposits at banks on letters of credit required from importers to 100% up from 50% in an attempt to boost domestic products against foreign competition.
■ Cutting the income tax ceiling to 22.5% for individuals and corporations, from the previous level of 30% to stimulate investments.
8
9
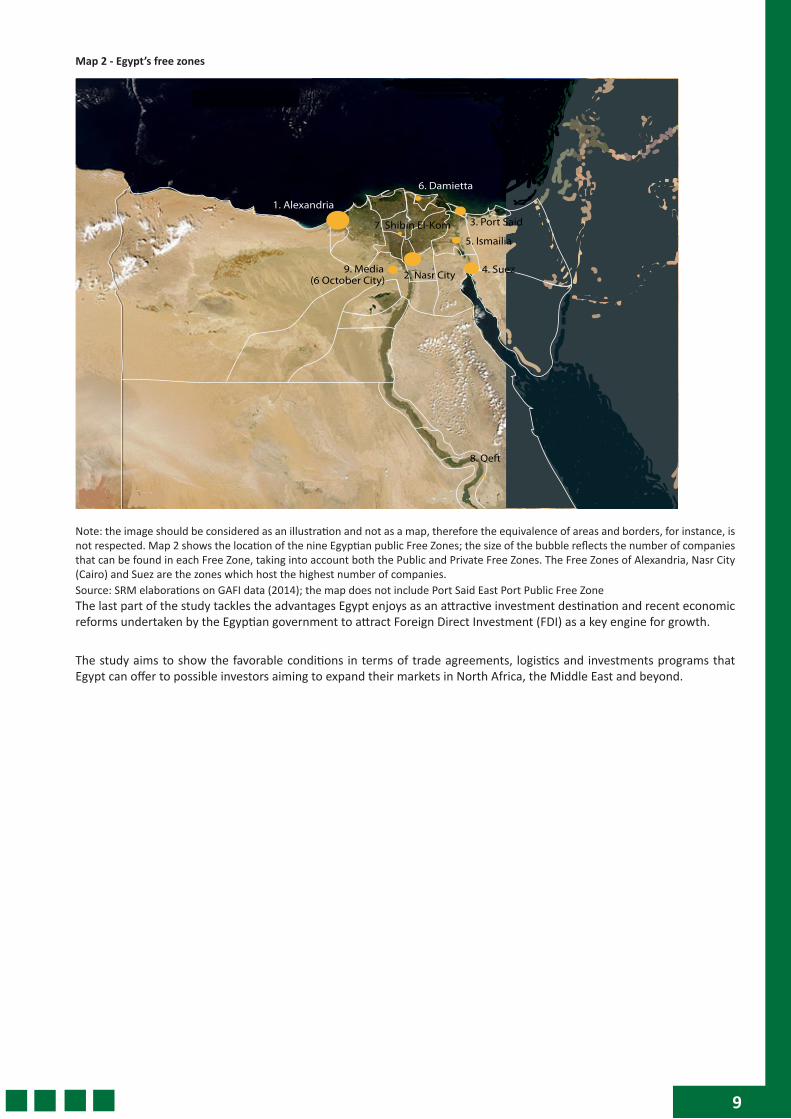
Map 2 - Egypt’s free zones
8. Qeft
2. Nasr City
1. Alexandria 3. Port Said
4. Suez
5. Ismailia
6. Damietta
7. Shibin El-Kom
9. Media
(6 October City)
Note: the image should be considered as an illustration and not as a map, therefore the equivalence of areas and borders, for instance, is not respected. Map 2 shows the location of the nine Egyptian public Free Zones; the size of the bubble reflects the number of companies that can be found in each Free Zone, taking into account both the Public and Private Free Zones. The Free Zones of Alexandria, Nasr City (Cairo) and Suez are the zones which host the highest number of companies.Source: SRM elaborations on GAFI data (2014); the map does not include Port Said East Port Public Free ZoneThe last part of the study tackles the advantages Egypt enjoys as an attractive investment destination and recent economic reforms undertaken by the Egyptian government to attract Foreign Direct Investment (FDI) as a key engine for growth.
The study aims to show the favorable conditions in terms of trade agreements, logistics and investments programs that Egypt can offer to possible investors aiming to expand their markets in North Africa, the Middle East and beyond.
10
1 - EGYPT’S ECONOMY AT A GLANCE
The Egyptian economy has been performing well since 2014 as the government undertook a number of steps aiming at regaining pre-revolution growth rates, restoring foreign investors' confidence, curbing budget deficit and tackling the escalating debt levels. The government has also made initiatives to bring back investors and undertake a number of mega projects through more than one event of which the Egypt Economic Development Conference (EEDC) in 2015 that witnessed the participation of 80 countries and more than 2500 investors, and resulted in signing investment deals worth around USD 60 billion mainly in the construction, real estate and infrastructure sectors.
GDP accelerated during FY 2014/15 reaching about 4.2%, compared to 2.2% during the last fiscal year, supported by the Y-O-Y improvement in the performance of key sectors like construction, wholesale and retail trade, agricultural, non-oil manufacturing and tourism sectors. This improvement was maintained in FY 2015/16 with a 4.3% growth rate, despite the negative impacts of the Russian airplane crash over Sinai on tourism revenues and the retreat of Suez Canal revenues resulted from the slowdown of the global economy. This improvement was supported by achieving more stability after electing a new Parliament and the establishment of different mega projects especially in the infrastructure sector. Moreover, the Italian oil firm Eni made a supergiant gas discovery in the deep waters of Egypt in August 2015. The discovery can hold a potential of 30 trillion cubic feet of lean gas in place to be the largest gas discovery ever made in Egypt and in the Mediterranean Sea and it will secure Egypt’s needs of natural gas for several years.
The Central Agency for Public Mobilization and Statistics (CAPMAS) announced that Egypt’s annual headline inflation (urban areas) dropped in September 2016 to 14.1%, down from 15.5% recorded in August 2016 due to the base year effect. Inflation rate is expected to hike in the coming months due to the depreciation of the Egyptian Pound, applying the Value Added Tax (VAT) and raising fuel prices.
For the Egyptian Pound’s exchange rate against the US Dollar, the CBE decided to adopt a free-float exchange rate regime, with the US Dollar to be traded at EGP13 as a starting point and a +/-10% band placed on banks FX pricing. This band was discarded after the CBE’s FX auction held on the 3rd of November.
The decision was also accompanied with the following steps:
• Raising core interest rates by 3% to 14.75%,15.75% and 15.25% for overnight deposit and lending rates and discount rates respectively, to contain the expected inflationary pressures. Accordingly, State-owned banks “National Bank of Egypt”, “Banque Misr” and “Banque Du Caire” offered 18-months and 3-year investment certificates at 20% and 16% interest rate respectively.
• Selling USD100 million to local banks in an exceptional foreign exchange auction at a cut-off price of EGP13, promising to hold multiple price auctions when deemed necessary.
• Applying no limits or conditions on exchanging foreign currency from banks.
This decision is expected to eliminate the foreign currency parallel market, deepen FC liquidity in banks, support Egypt’s competitiveness and boost different sectors including tourism and real estate. It’s also expected to help Egypt attract new Foreign Direct Investments (FDIs).
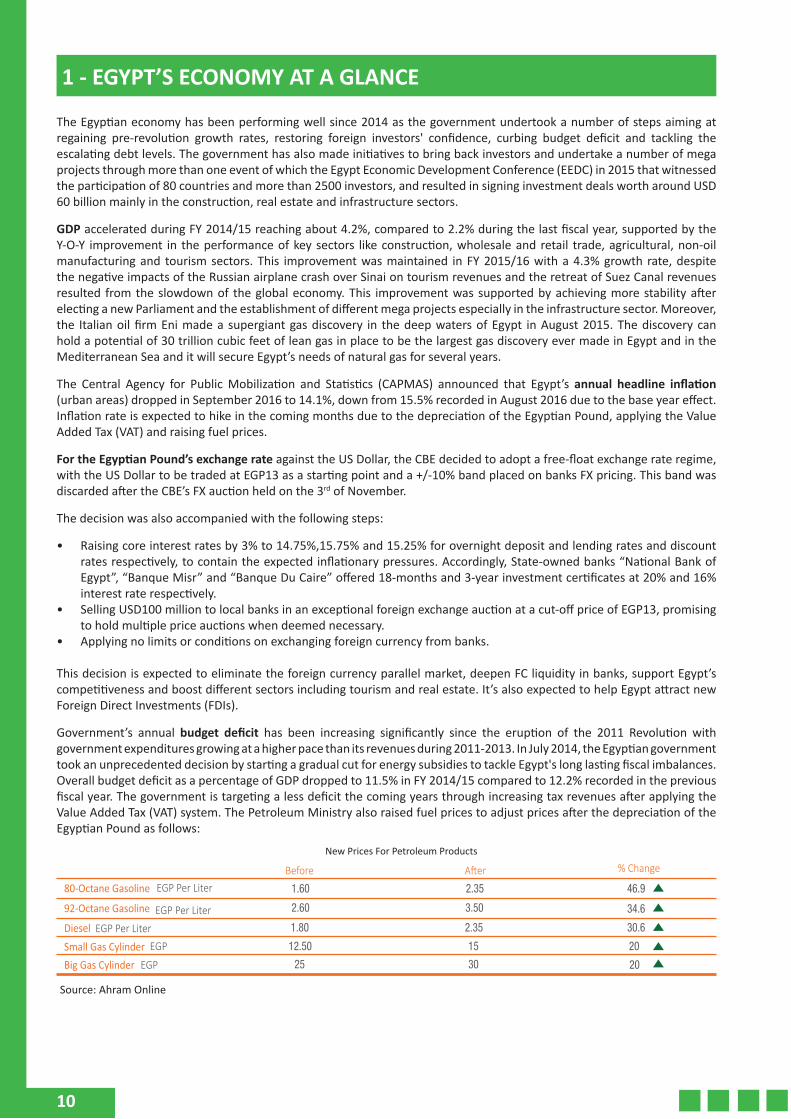
Government’s annual budget deficit has been increasing significantly since the eruption of the 2011 Revolution with government expenditures growing at a higher pace than its revenues during 2011-2013. In July 2014, the Egyptian government took an unprecedented decision by starting a gradual cut for energy subsidies to tackle Egypt's long lasting fiscal imbalances. Overall budget deficit as a percentage of GDP dropped to 11.5% in FY 2014/15 compared to 12.2% recorded in the previous fiscal year. The government is targeting a less deficit the coming years through increasing tax revenues after applying the Value Added Tax (VAT) system. The Petroleum Ministry also raised fuel prices to adjust prices after the depreciation of the Egyptian Pound as follows:
Source: Ahram Online
New Prices For Petroleum Products
% ChangeBefore After80-Octane Gasoline EGP Per Liter 1.60 2.35 46.9
92-Octane Gasoline 2.60 3.50 34.6EGP Per LiterDiesel 1.80 2.35 30.6EGP Per Liter
Small Gas Cylinder 12.50 15 20EGP
Big Gas Cylinder 25 30EGP 20
11
Balance Of Payments (BOP) recorded a deficit of USD 2.8 billion in FY 2015/16 compared to a surplus of USD 3.7 billion one year earlier due to the major increase in the current account deficit by 53.7%. In the meanwhile, the capital and financial account achieved a surplus, registering a 10.7% increase in the net inflow to record USD 19.9 billion compared to USD 17.9 billion in the previous year.
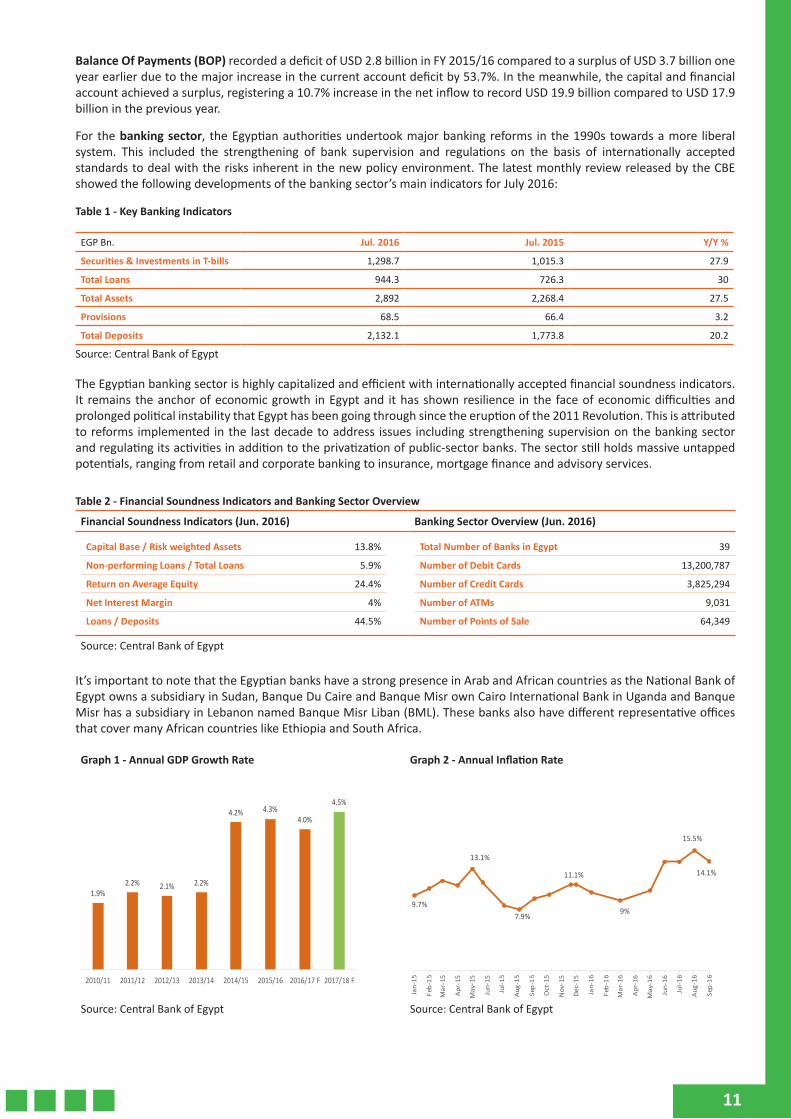
For the banking sector, the Egyptian authorities undertook major banking reforms in the 1990s towards a more liberal system. This included the strengthening of bank supervision and regulations on the basis of internationally accepted standards to deal with the risks inherent in the new policy environment. The latest monthly review released by the CBE showed the following developments of the banking sector’s main indicators for July 2016:
Table 1 - Key Banking Indicators
EGP Bn. Jul. 2016 Jul. 2015 Y/Y %
Securities & Investments in T-bills 1,298.7 1,015.3 27.9
Total Loans 944.3 726.3 30
Total Assets 2,892 2,268.4 27.5
Provisions 68.5 66.4 3.2
Total Deposits 2,132.1 1,773.8 20.2
Source: Central Bank of Egypt
The Egyptian banking sector is highly capitalized and efficient with internationally accepted financial soundness indicators. It remains the anchor of economic growth in Egypt and it has shown resilience in the face of economic difficulties and prolonged political instability that Egypt has been going through since the eruption of the 2011 Revolution. This is attributed to reforms implemented in the last decade to address issues including strengthening supervision on the banking sector and regulating its activities in addition to the privatization of public-sector banks. The sector still holds massive untapped potentials, ranging from retail and corporate banking to insurance, mortgage finance and advisory services.
Table 2 - Financial Soundness Indicators and Banking Sector Overview
Financial Soundness Indicators (Jun. 2016) Banking Sector Overview (Jun. 2016)
Capital Base / Risk weighted Assets 13.8%
Non-performing Loans / Total Loans 5.9%
Return on Average Equity 24.4%
Net Interest Margin 4%
Loans / Deposits 44.5%
Total Number of Banks in Egypt 39
Number of Debit Cards 13,200,787
Number of Credit Cards 3,825,294
Number of ATMs 9,031
Number of Points of Sale 64,349
Source: Central Bank of Egypt
It’s important to note that the Egyptian banks have a strong presence in Arab and African countries as the National Bank of Egypt owns a subsidiary in Sudan, Banque Du Caire and Banque Misr own Cairo International Bank in Uganda and Banque Misr has a subsidiary in Lebanon named Banque Misr Liban (BML). These banks also have different representative offices that cover many African countries like Ethiopia and South Africa.
Graph 1 - Annual GDP Growth Rate Graph 2 - Annual Inflation Rate
Source: Central Bank of Egypt Source: Central Bank of Egypt
1.9%2.2% 2.1% 2.2%
4.2% 4.3%4.0%
4.5%
2010/11 2011/12 2012/13 2013/14 2014/15 2015/16 2016/17 F 2017/18 F
9.7%
13.1%
7.9%
11.1%
9%
15.5%
14.1%
Jan-
15
Feb-
15
Mar
-15
Apr-
15
May
-15
Jun-
15
Jul-1
5
Aug-
15
Sep-
15
Oct
-15
Nov
-15
Dec-
15
Jan-
16
Feb-
16
Mar
-16
Apr-
16
May
-16
Jun-
16
Jul-1
6
Aug-
16
Sep-
16
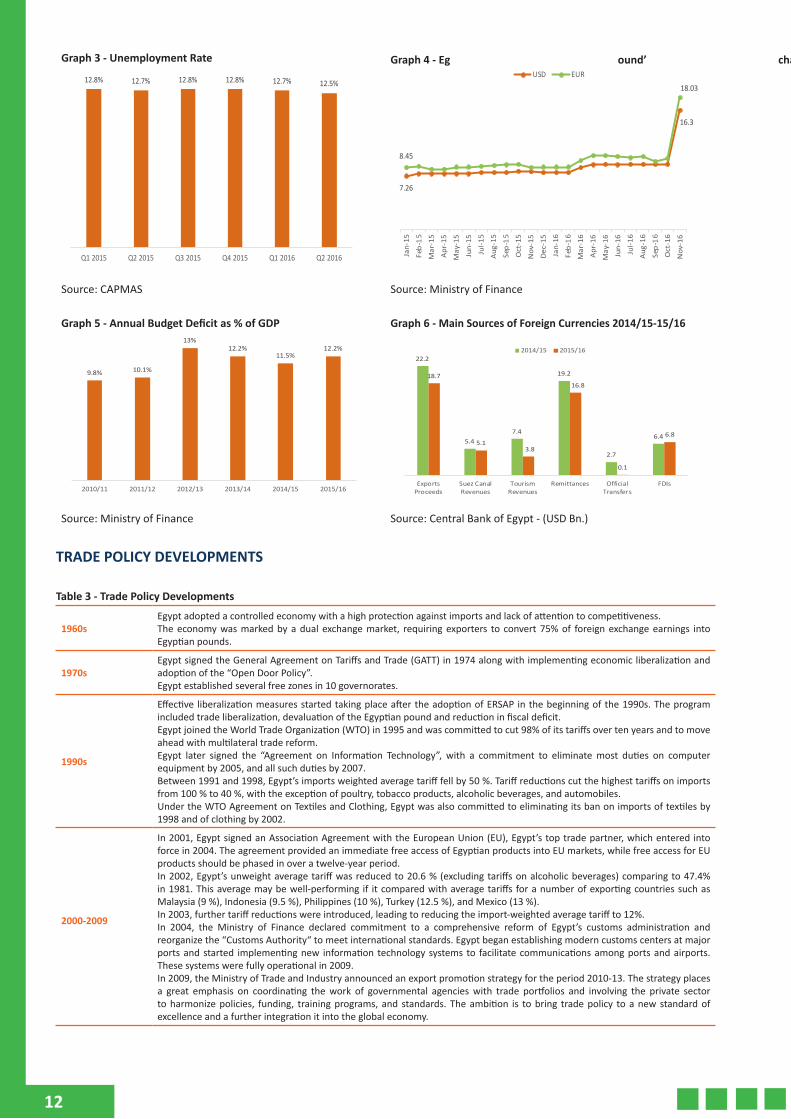
Graph 3 - Unemployment Rate
12.8% 12.7% 12.8% 12.8% 12.7% 12.5%
Q1 2015 Q2 2015 Q3 2015 Q4 2015 Q1 2016 Q2 2016
Graph 4 - Egyptian Pound’s Exchange Rate
7.26
16.3
8.45
18.03
Jan-
15
Feb-
15
Mar
-15
Apr-
15
May
-15
Jun-
15
Jul-1
5
Aug-
15
Sep-
15
Oct
-15
Nov
-15
Dec-
15
Jan-
16
Feb-
16
Mar
-16
Apr-
16
May
-16
Jun-
16
Jul-1
6
Aug-
16
Sep-
16
Oct
-16
Nov
-16
USD EUR
Source: CAPMAS Source: Ministry of Finance
Graph 5 - Annual Budget Deficit as % of GDP
9.8% 10.1%
13%12.2%
11.5%12.2%
2010/11 2011/12 2012/13 2013/14 2014/15 2015/16
Graph 6 - Main Sources of Foreign Currencies 2014/15-15/16
Source: Ministry of Finance Source: Central Bank of Egypt - (USD Bn.)
TRADE POLICY DEVELOPMENTS
Table 3 - Trade Policy Developments
1960sEgypt adopted a controlled economy with a high protection against imports and lack of attention to competitiveness.The economy was marked by a dual exchange market, requiring exporters to convert 75% of foreign exchange earnings into Egyptian pounds.
1970sEgypt signed the General Agreement on Tariffs and Trade (GATT) in 1974 along with implementing economic liberalization and adoption of the “Open Door Policy”. Egypt established several free zones in 10 governorates.
1990s
Effective liberalization measures started taking place after the adoption of ERSAP in the beginning of the 1990s. The program included trade liberalization, devaluation of the Egyptian pound and reduction in fiscal deficit.Egypt joined the World Trade Organization (WTO) in 1995 and was committed to cut 98% of its tariffs over ten years and to move ahead with multilateral trade reform.Egypt later signed the “Agreement on Information Technology”, with a commitment to eliminate most duties on computer equipment by 2005, and all such duties by 2007.Between 1991 and 1998, Egypt’s imports weighted average tariff fell by 50 %. Tariff reductions cut the highest tariffs on imports from 100 % to 40 %, with the exception of poultry, tobacco products, alcoholic beverages, and automobiles.Under the WTO Agreement on Textiles and Clothing, Egypt was also committed to eliminating its ban on imports of textiles by 1998 and of clothing by 2002.
2000-2009
In 2001, Egypt signed an Association Agreement with the European Union (EU), Egypt’s top trade partner, which entered into force in 2004. The agreement provided an immediate free access of Egyptian products into EU markets, while free access for EU products should be phased in over a twelve-year period.In 2002, Egypt’s unweight average tariff was reduced to 20.6 % (excluding tariffs on alcoholic beverages) comparing to 47.4% in 1981. This average may be well-performing if it compared with average tariffs for a number of exporting countries such as Malaysia (9 %), Indonesia (9.5 %), Philippines (10 %), Turkey (12.5 %), and Mexico (13 %).In 2003, further tariff reductions were introduced, leading to reducing the import-weighted average tariff to 12%. In 2004, the Ministry of Finance declared commitment to a comprehensive reform of Egypt’s customs administration and reorganize the “Customs Authority“ to meet international standards. Egypt began establishing modern customs centers at major ports and started implementing new information technology systems to facilitate communications among ports and airports. These systems were fully operational in 2009.In 2009, the Ministry of Trade and Industry announced an export promotion strategy for the period 2010-13. The strategy places a great emphasis on coordinating the work of governmental agencies with trade portfolios and involving the private sector to harmonize policies, funding, training programs, and standards. The ambition is to bring trade policy to a new standard of excellence and a further integration it into the global economy.
22.2
5.47.4
19.2
2.7
6.4
18.7
5.13.8
16.8
0.1
6.8
ExportsProceeds
Suez CanalRevenues
TourismRevenues
Remittances OfficialTransfers
FDIs
2014/15 2015/16
12
2010 - Present
• In 2010, Egypt and the EU completed an agricultural annex to their Free Trade Area (FTA), liberalizing trade in over 90% of agricultural goods.
• Article 6 of Decree 184/2013 allows the reduction of customs tariffs on intermediate goods if the final product has a certain percentage of input from local manufacturers, beginning at 30% local content. As the percentage of local content rises, so does the tariff reduction, reaching up to 90% if the amount of local input is 60% or above.
• In the last ten years, the Egyptian government has significantly reduced import tariffs that reached to below 15% for a vast majority of goods entering Egypt. One exception is clothing, which carries a tariff of 30%. Vehicles, alcohol, and tobacco are the only items on which tariffs are still 40% or greater. Passenger vehicles with engines under 1,600 are subject to an import tariff of 40%. Vehicles with engines over 1,600 cc are subject to an import tariff of 135%. Additionally, vehicles with engines over 2,000 cc are subject to an escalating sales tax of up to 45%.
• Egypt does not apply any export taxes, charges or levies. However, according to Article 8 of the Import and Export Regulations, a duty of up to 100% of the value of the good may be imposed at any time by the Minister responsible for trade, according to the authorities.
• In January 2016, the Egyptian authorities decided to take some measures to decrease importing and protect the market from the flood of cheap low quality goods. The Ministry of Trade & Industry announced that 23 finished goods that are exported to Egypt for the retail market have to be registered at the General Organization for Export & Import Control.
• The Central Bank of Egypt (CBE) raised cash deposits at banks on letters of credit required from importers to 100% up from 50% in an attempt to boost domestic products against foreign competition. Imports of medicines, input materials for pharmaceuticals and babies' milk are excluded from the decision.
On the other hand, the CBE has eased the monthly limit imposed on US Dollar deposits to USD 250,000 or its equivalent of foreign currencies instead of USD 50,000, with no limits on daily deposits. The decision includes only companies importing four groups of goods, which includes:• Basic commodities and ration goods.• Machinery, equipment & spare parts.• Raw materials & intermediate goods.• Pharmaceuticals.
The decision aims at organizing the import process, by facilitating staples imports while curbing unnecessary imports.
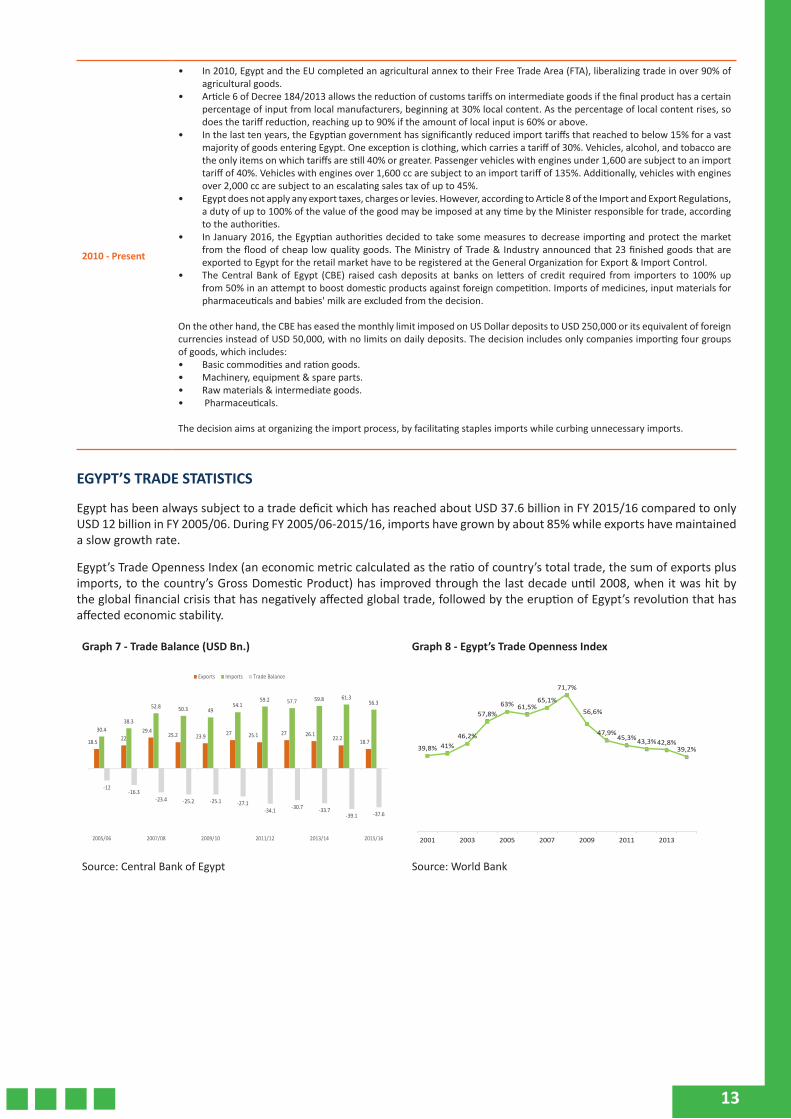
EGYPT’S TRADE STATISTICS
Egypt has been always subject to a trade deficit which has reached about USD 37.6 billion in FY 2015/16 compared to only USD 12 billion in FY 2005/06. During FY 2005/06-2015/16, imports have grown by about 85% while exports have maintained a slow growth rate.
Egypt’s Trade Openness Index (an economic metric calculated as the ratio of country’s total trade, the sum of exports plus imports, to the country’s Gross Domestic Product) has improved through the last decade until 2008, when it was hit by the global financial crisis that has negatively affected global trade, followed by the eruption of Egypt’s revolution that has affected economic stability.
Graph 7 - Trade Balance (USD Bn.) Graph 8 - Egypt’s Trade Openness Index
39,8% 41% 46,2%
57,8% 63% 61,5%
65,1%
71,7%
56,6%
47,9% 45,3% 43,3% 42,8%
39,2%
2001 2003 2005 2007 2009 2011 2013
Source: Central Bank of Egypt Source: World Bank
13
18.5 2229.4
25.2 23.9 27 25.1 27 26.122.2 18.7
30.438.3
52.8 50.3 4954.1
59.2 57.7 59.8 61.356.3
-12-16.3
-23.4 -25.2 -25.1 -27.1-34.1 -30.7 -33.7
-39.1 -37.6
2005/06 2007/08 2009/10 2011/12 2013/14 2015/16
Exports Imports Trade Balance
14
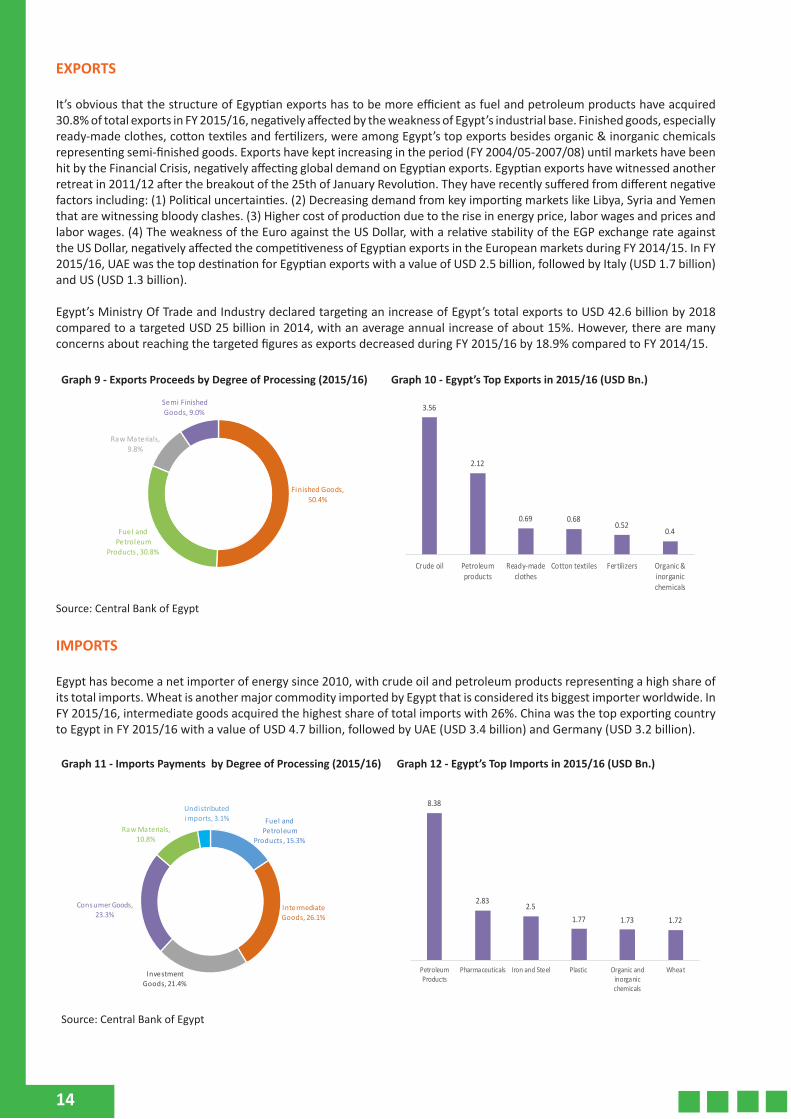
EXPORTS
It’s obvious that the structure of Egyptian exports has to be more efficient as fuel and petroleum products have acquired 30.8% of total exports in FY 2015/16, negatively affected by the weakness of Egypt’s industrial base. Finished goods, especially ready-made clothes, cotton textiles and fertilizers, were among Egypt’s top exports besides organic & inorganic chemicals representing semi-finished goods. Exports have kept increasing in the period (FY 2004/05-2007/08) until markets have been hit by the Financial Crisis, negatively affecting global demand on Egyptian exports. Egyptian exports have witnessed another retreat in 2011/12 after the breakout of the 25th of January Revolution. They have recently suffered from different negative factors including: (1) Political uncertainties. (2) Decreasing demand from key importing markets like Libya, Syria and Yemen that are witnessing bloody clashes. (3) Higher cost of production due to the rise in energy price, labor wages and prices and labor wages. (4) The weakness of the Euro against the US Dollar, with a relative stability of the EGP exchange rate against the US Dollar, negatively affected the competitiveness of Egyptian exports in the European markets during FY 2014/15. In FY 2015/16, UAE was the top destination for Egyptian exports with a value of USD 2.5 billion, followed by Italy (USD 1.7 billion) and US (USD 1.3 billion).
Egypt’s Ministry Of Trade and Industry declared targeting an increase of Egypt’s total exports to USD 42.6 billion by 2018 compared to a targeted USD 25 billion in 2014, with an average annual increase of about 15%. However, there are many concerns about reaching the targeted figures as exports decreased during FY 2015/16 by 18.9% compared to FY 2014/15.
Graph 9 - Exports Proceeds by Degree of Processing (2015/16) Graph 10 - Egypt’s Top Exports in 2015/16 (USD Bn.)
Source: Central Bank of Egypt
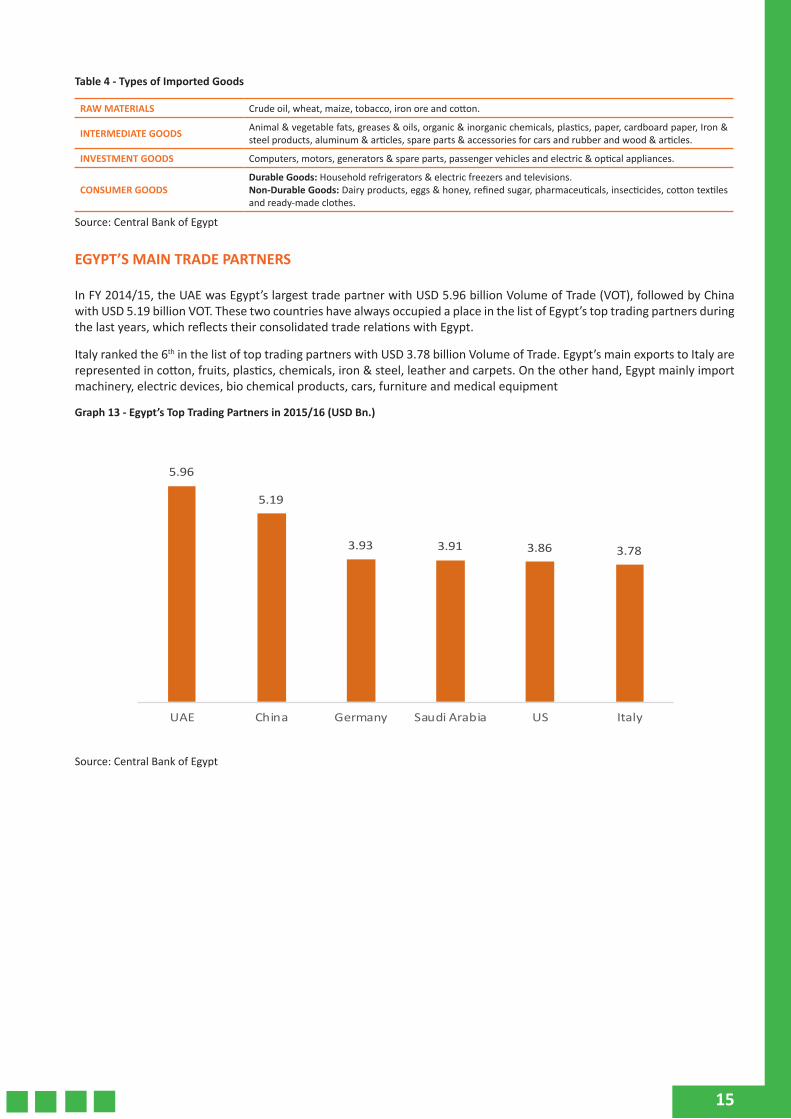
IMPORTS
Egypt has become a net importer of energy since 2010, with crude oil and petroleum products representing a high share of its total imports. Wheat is another major commodity imported by Egypt that is considered its biggest importer worldwide. In FY 2015/16, intermediate goods acquired the highest share of total imports with 26%. China was the top exporting country to Egypt in FY 2015/16 with a value of USD 4.7 billion, followed by UAE (USD 3.4 billion) and Germany (USD 3.2 billion).
Graph 11 - Imports Payments by Degree of Processing (2015/16)
Fuel and Petroleum
Products , 15.3%
Intermediate Goods, 26.1%
Investment Goods, 21.4%
Consumer Goods, 23.3%
Raw Materials, 10.8%
Undistributed imports, 3.1%
Source: Central Bank of Egypt
Graph 12 - Egypt’s Top Imports in 2015/16 (USD Bn.)
Finished Goods, 50.4%
Fuel and Petroleum
Products , 30.8%
Raw Materials, 9.8%
Semi Finished Goods, 9.0% 3.56
2.12
0.69 0.680.52
0.4
Crude oil Petroleumproducts
Ready-madeclothes
Cotton textiles Fertilizers Organic &inorganicchemicals
8.38
2.832.5
1.77 1.73 1.72
PetroleumProducts
Pharmaceuticals Iron and Steel Plastic Organic andinorganicchemicals
Wheat
15
Table 4 - Types of Imported Goods
RAW MATERIALS Crude oil, wheat, maize, tobacco, iron ore and cotton.
INTERMEDIATE GOODS Animal & vegetable fats, greases & oils, organic & inorganic chemicals, plastics, paper, cardboard paper, Iron & steel products, aluminum & articles, spare parts & accessories for cars and rubber and wood & articles.
INVESTMENT GOODS Computers, motors, generators & spare parts, passenger vehicles and electric & optical appliances.
CONSUMER GOODSDurable Goods: Household refrigerators & electric freezers and televisions. Non-Durable Goods: Dairy products, eggs & honey, refined sugar, pharmaceuticals, insecticides, cotton textiles and ready-made clothes.
Source: Central Bank of Egypt
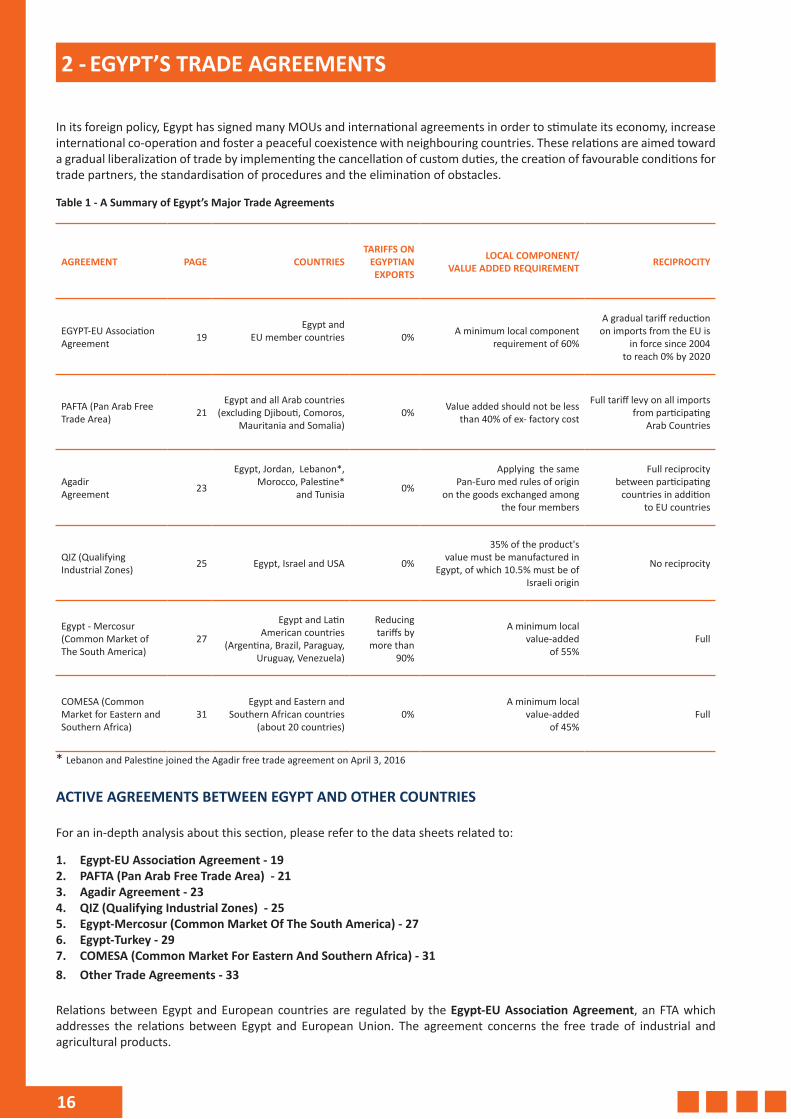
EGYPT’S MAIN TRADE PARTNERS
In FY 2014/15, the UAE was Egypt’s largest trade partner with USD 5.96 billion Volume of Trade (VOT), followed by China with USD 5.19 billion VOT. These two countries have always occupied a place in the list of Egypt’s top trading partners during the last years, which reflects their consolidated trade relations with Egypt.
Italy ranked the 6th in the list of top trading partners with USD 3.78 billion Volume of Trade. Egypt’s main exports to Italy are represented in cotton, fruits, plastics, chemicals, iron & steel, leather and carpets. On the other hand, Egypt mainly import machinery, electric devices, bio chemical products, cars, furniture and medical equipment
Graph 13 - Egypt’s Top Trading Partners in 2015/16 (USD Bn.)
5.96
5.19
3.93 3.91 3.86 3.78
UAE China Germany Saudi Arabia US Italy
Source: Central Bank of Egypt
16
2 - EGYPT’S TRADE AGREEMENTS
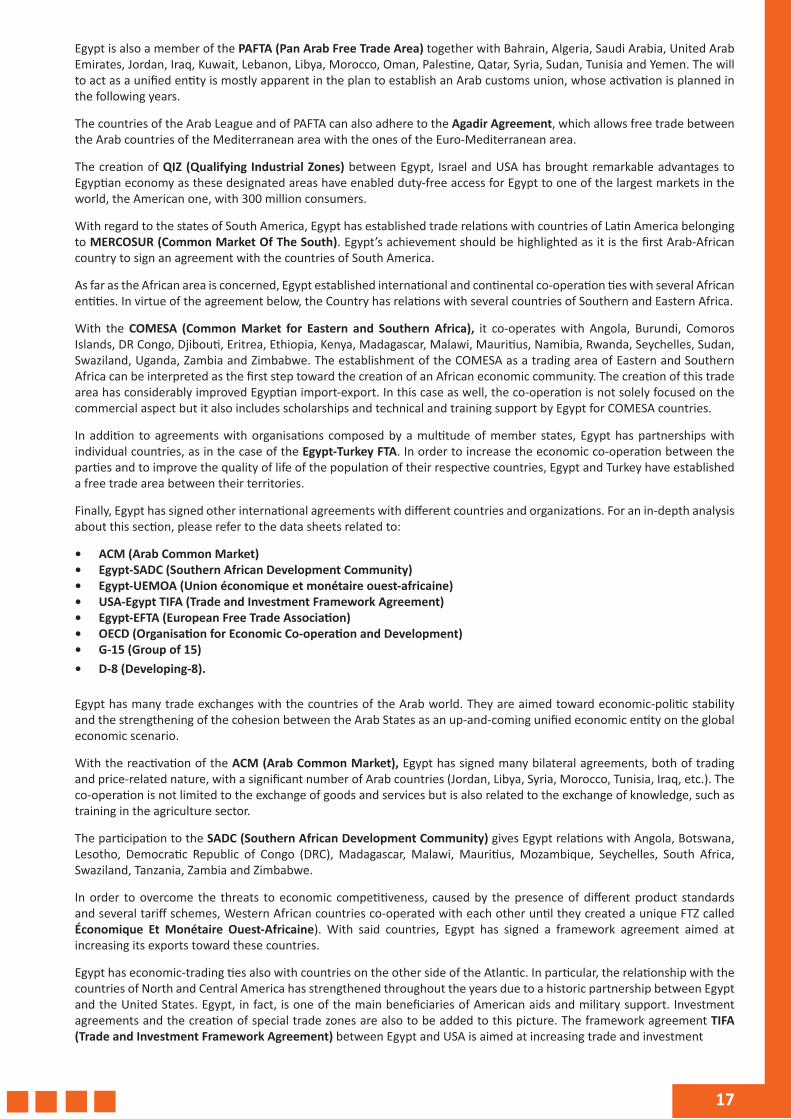
In its foreign policy, Egypt has signed many MOUs and international agreements in order to stimulate its economy, increase international co-operation and foster a peaceful coexistence with neighbouring countries. These relations are aimed toward a gradual liberalization of trade by implementing the cancellation of custom duties, the creation of favourable conditions for trade partners, the standardisation of procedures and the elimination of obstacles.
Table 1 - A Summary of Egypt’s Major Trade Agreements
AGREEMENT PAGE COUNTRIESTARIFFS ON
EGYPTIAN EXPORTS
LOCAL COMPONENT/VALUE ADDED REQUIREMENT RECIPROCITY
EGYPT-EU Association Agreement 19
Egypt and EU member countries 0% A minimum local component
requirement of 60%
A gradual tariff reduction on imports from the EU is
in force since 2004 to reach 0% by 2020
PAFTA (Pan Arab Free Trade Area) 21
Egypt and all Arab countries (excluding Djibouti, Comoros,
Mauritania and Somalia) 0% Value added should not be less
than 40% of ex- factory cost
Full tariff levy on all imports from participating
Arab Countries
Agadir Agreement 23
Egypt, Jordan, Lebanon*,Morocco, Palestine*
and Tunisia 0%
Applying the same Pan-Euro med rules of origin
on the goods exchanged among the four members
Full reciprocity between participating
countries in addition to EU countries
QIZ (Qualifying Industrial Zones) 25 Egypt, Israel and USA 0%
35% of the product's value must be manufactured in
Egypt, of which 10.5% must be of Israeli origin
No reciprocity
Egypt - Mercosur (Common Market of The South America)
27
Egypt and Latin American countries
(Argentina, Brazil, Paraguay, Uruguay, Venezuela)
Reducing tariffs by
more than 90%
A minimum local value-added
of 55%Full
COMESA (Common Market for Eastern and Southern Africa)
31Egypt and Eastern and
Southern African countries (about 20 countries)
0% A minimum local
value-added of 45%
Full
* Lebanon and Palestine joined the Agadir free trade agreement on April 3, 2016
ACTIVE AGREEMENTS BETWEEN EGYPT AND OTHER COUNTRIES
For an in-depth analysis about this section, please refer to the data sheets related to:
1. Egypt-EU Association Agreement - 192. PAFTA (Pan Arab Free Trade Area) - 213. Agadir Agreement - 234. QIZ (Qualifying Industrial Zones) - 255. Egypt-Mercosur (Common Market Of The South America) - 276. Egypt-Turkey - 297. COMESA (Common Market For Eastern And Southern Africa) - 318. Other Trade Agreements - 33
Relations between Egypt and European countries are regulated by the Egypt-EU Association Agreement, an FTA which addresses the relations between Egypt and European Union. The agreement concerns the free trade of industrial and agricultural products.
17
Egypt is also a member of the PAFTA (Pan Arab Free Trade Area) together with Bahrain, Algeria, Saudi Arabia, United Arab Emirates, Jordan, Iraq, Kuwait, Lebanon, Libya, Morocco, Oman, Palestine, Qatar, Syria, Sudan, Tunisia and Yemen. The will to act as a unified entity is mostly apparent in the plan to establish an Arab customs union, whose activation is planned in the following years.
The countries of the Arab League and of PAFTA can also adhere to the Agadir Agreement, which allows free trade between the Arab countries of the Mediterranean area with the ones of the Euro-Mediterranean area.
The creation of QIZ (Qualifying Industrial Zones) between Egypt, Israel and USA has brought remarkable advantages to Egyptian economy as these designated areas have enabled duty-free access for Egypt to one of the largest markets in the world, the American one, with 300 million consumers.
With regard to the states of South America, Egypt has established trade relations with countries of Latin America belonging to MERCOSUR (Common Market Of The South). Egypt’s achievement should be highlighted as it is the first Arab-African country to sign an agreement with the countries of South America.
As far as the African area is concerned, Egypt established international and continental co-operation ties with several African entities. In virtue of the agreement below, the Country has relations with several countries of Southern and Eastern Africa.
With the COMESA (Common Market for Eastern and Southern Africa), it co-operates with Angola, Burundi, Comoros Islands, DR Congo, Djibouti, Eritrea, Ethiopia, Kenya, Madagascar, Malawi, Mauritius, Namibia, Rwanda, Seychelles, Sudan, Swaziland, Uganda, Zambia and Zimbabwe. The establishment of the COMESA as a trading area of Eastern and Southern Africa can be interpreted as the first step toward the creation of an African economic community. The creation of this trade area has considerably improved Egyptian import-export. In this case as well, the co-operation is not solely focused on the commercial aspect but it also includes scholarships and technical and training support by Egypt for COMESA countries.
In addition to agreements with organisations composed by a multitude of member states, Egypt has partnerships with individual countries, as in the case of the Egypt-Turkey FTA. In order to increase the economic co-operation between the parties and to improve the quality of life of the population of their respective countries, Egypt and Turkey have established a free trade area between their territories.
Finally, Egypt has signed other international agreements with different countries and organizations. For an in-depth analysis about this section, please refer to the data sheets related to:
• ACM (Arab Common Market)• Egypt-SADC (Southern African Development Community)• Egypt-UEMOA (Union économique et monétaire ouest-africaine)• USA-Egypt TIFA (Trade and Investment Framework Agreement)• Egypt-EFTA (European Free Trade Association)• OECD (Organisation for Economic Co-operation and Development)• G-15 (Group of 15)• D-8 (Developing-8).
Egypt has many trade exchanges with the countries of the Arab world. They are aimed toward economic-politic stability and the strengthening of the cohesion between the Arab States as an up-and-coming unified economic entity on the global economic scenario.
With the reactivation of the ACM (Arab Common Market), Egypt has signed many bilateral agreements, both of trading and price-related nature, with a significant number of Arab countries (Jordan, Libya, Syria, Morocco, Tunisia, Iraq, etc.). The co-operation is not limited to the exchange of goods and services but is also related to the exchange of knowledge, such as training in the agriculture sector.
The participation to the SADC (Southern African Development Community) gives Egypt relations with Angola, Botswana, Lesotho, Democratic Republic of Congo (DRC), Madagascar, Malawi, Mauritius, Mozambique, Seychelles, South Africa, Swaziland, Tanzania, Zambia and Zimbabwe.
In order to overcome the threats to economic competitiveness, caused by the presence of different product standards and several tariff schemes, Western African countries co-operated with each other until they created a unique FTZ called Économique Et Monétaire Ouest-Africaine). With said countries, Egypt has signed a framework agreement aimed at increasing its exports toward these countries.
Egypt has economic-trading ties also with countries on the other side of the Atlantic. In particular, the relationship with the countries of North and Central America has strengthened throughout the years due to a historic partnership between Egypt and the United States. Egypt, in fact, is one of the main beneficiaries of American aids and military support. Investment agreements and the creation of special trade zones are also to be added to this picture. The framework agreement TIFA (Trade and Investment Framework Agreement) between Egypt and USA is aimed at increasing trade and investment
18
flows to the country. The benefits deriving from the agreements are quantifiable in terms of new workplaces, technology development, investment attraction and GDP growth.
The EFTA (European Free Trade Association) includes countries located in the Central-North European area, such as Switzerland, Norway, Liechtenstein and Iceland. Thanks to the agreement, Egypt was able to establish an FTA with these countries, obtaining the exemption to all custom duties and export taxes on the products at the core of Egyptian industry and agriculture.
Egypt has a presence in the overall global scenario, thanks to co-operation agreements with important international organisations. Among them, the collaboration with the OECD (Organisation for Economic Co-operation and Development) is of central importance. By adhering to the Statement on international investment and multinational companies of the OECD, Egypt has committed to provide national treatment to foreign investors.
Likewise, Egypt is a member of another organisation vowed to the creation of a suitable environment for domestic and foreign investments, the Group of 15 (G-15). It is a forum established to foster international co-operation and contribution, consisting of countries belonging to Latin America, Africa and Asia. The worth of this collaboration can be assessed when analysing the excellent global competitiveness performances of some of the member countries such as Malaysia, Chile and India. Therefore, one could easily infer how trade exchanges with these entities can be translated into an enormous economic growth potential for Egypt.
Outside of European borders we have the inclusion of Egypt into an organisation called Developing-8 (D-8), for the co-operation and development between Bangladesh, Egypt, Indonesia, Iran, Malaysia, Nigeria, Pakistan and Turkey. The Organisation for Economic Co-operation D-8 aims at improving the position of the member states in the global economy through the diversification of trade opportunities and with co-operation taking the place of exploitation.
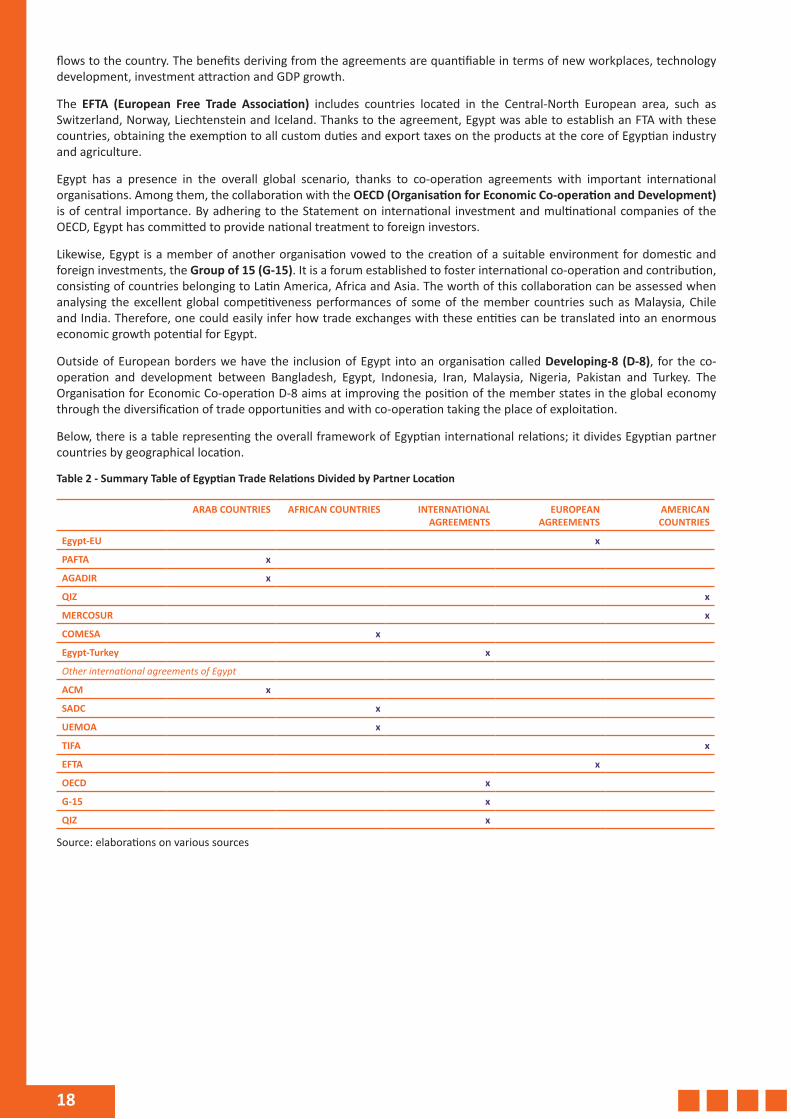
Below, there is a table representing the overall framework of Egyptian international relations; it divides Egyptian partner countries by geographical location.
Table 2 - Summary Table of Egyptian Trade Relations Divided by Partner Location
ARAB COUNTRIES AFRICAN COUNTRIES INTERNATIONAL AGREEMENTS
EUROPEAN AGREEMENTS
AMERICAN COUNTRIES
Egypt-EU x
PAFTA x
AGADIR x
QIZ x
MERCOSUR x
COMESA x
Egypt-Turkey x
Other international agreements of Egypt
ACM x
SADC x
UEMOA x
TIFA x
EFTA x
OECD x
G-15 x
QIZ x
Source: elaborations on various sources
19
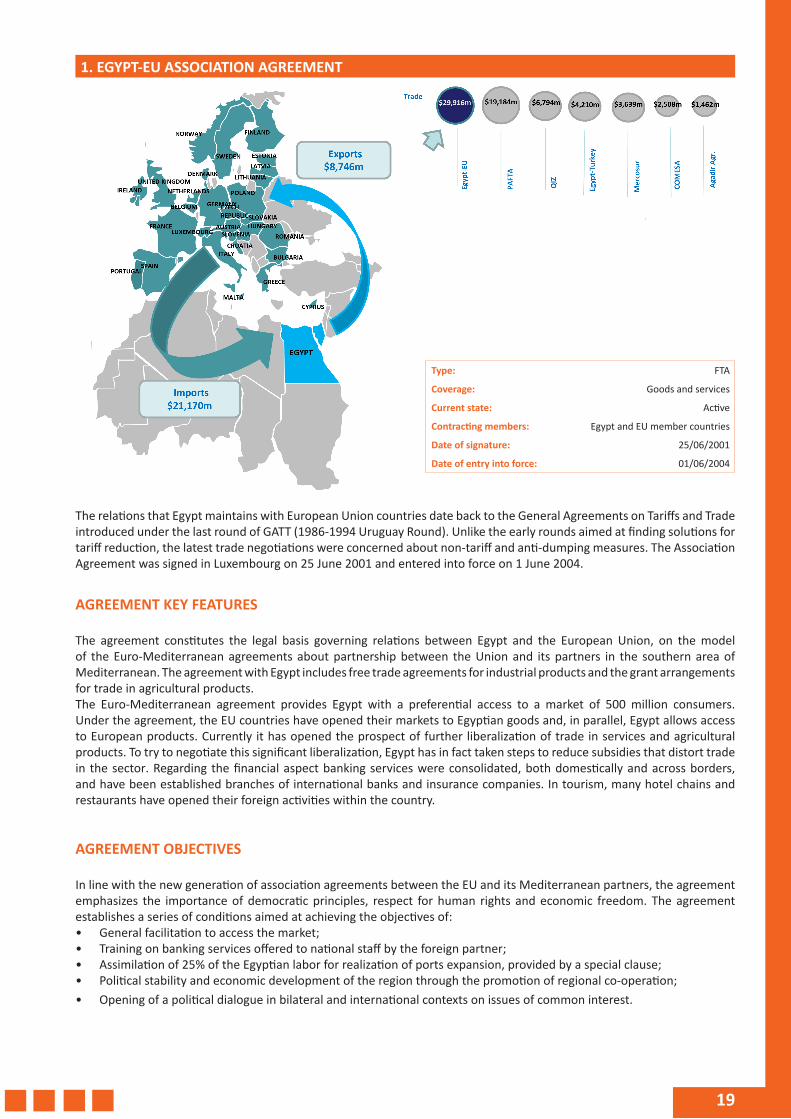
1. EGYPT-EU ASSOCIATION AGREEMENT
The relations that Egypt maintains with European Union countries date back to the General Agreements on Tariffs and Trade introduced under the last round of GATT (1986-1994 Uruguay Round). Unlike the early rounds aimed at finding solutions for tariff reduction, the latest trade negotiations were concerned about non-tariff and anti-dumping measures. The Association Agreement was signed in Luxembourg on 25 June 2001 and entered into force on 1 June 2004.
AGREEMENT KEY FEATURES
The agreement constitutes the legal basis governing relations between Egypt and the European Union, on the model of the Euro-Mediterranean agreements about partnership between the Union and its partners in the southern area of Mediterranean. The agreement with Egypt includes free trade agreements for industrial products and the grant arrangements for trade in agricultural products. The Euro-Mediterranean agreement provides Egypt with a preferential access to a market of 500 million consumers. Under the agreement, the EU countries have opened their markets to Egyptian goods and, in parallel, Egypt allows access to European products. Currently it has opened the prospect of further liberalization of trade in services and agricultural products. To try to negotiate this significant liberalization, Egypt has in fact taken steps to reduce subsidies that distort trade in the sector. Regarding the financial aspect banking services were consolidated, both domestically and across borders, and have been established branches of international banks and insurance companies. In tourism, many hotel chains and restaurants have opened their foreign activities within the country.
AGREEMENT OBJECTIVES
In line with the new generation of association agreements between the EU and its Mediterranean partners, the agreement emphasizes the importance of democratic principles, respect for human rights and economic freedom. The agreement establishes a series of conditions aimed at achieving the objectives of:• General facilitation to access the market;• Training on banking services offered to national staff by the foreign partner;• Assimilation of 25% of the Egyptian labor for realization of ports expansion, provided by a special clause;• Political stability and economic development of the region through the promotion of regional co-operation;• Opening of a political dialogue in bilateral and international contexts on issues of common interest.
Type: FTA
Coverage: Goods and services
Current state: Active
Contracting members: Egypt and EU member countries
Date of signature: 25/06/2001
Date of entry into force: 01/06/2004
20
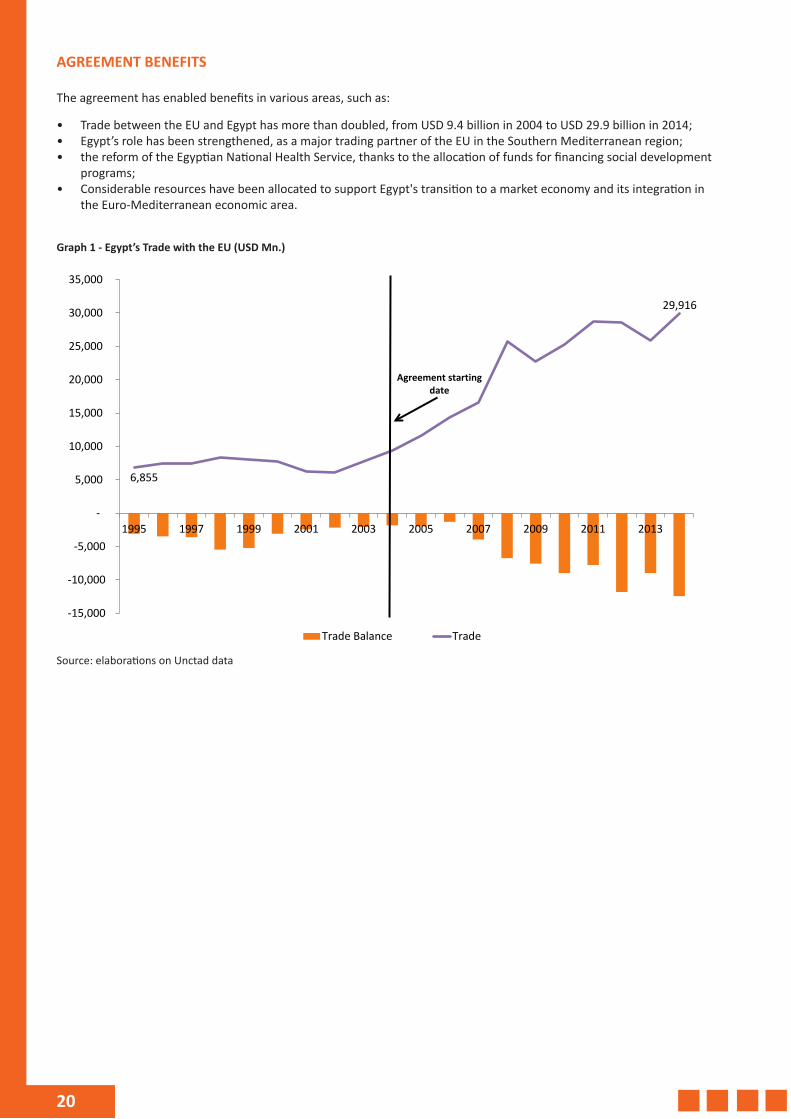
AGREEMENT BENEFITS
The agreement has enabled benefits in various areas, such as:
• Trade between the EU and Egypt has more than doubled, from USD 9.4 billion in 2004 to USD 29.9 billion in 2014;• Egypt’s role has been strengthened, as a major trading partner of the EU in the Southern Mediterranean region;• the reform of the Egyptian National Health Service, thanks to the allocation of funds for financing social development
programs;• Considerable resources have been allocated to support Egypt's transition to a market economy and its integration in
the Euro-Mediterranean economic area.
Graph 1 - Egypt’s Trade with the EU (USD Mn.)
6,855
29,916
-10,000
-15,000
-5,000
-
5,000
10,000
15,000
20,000
25,000
30,000
35,000
1995 1997 1999 2001 2003 2005 2007 2009 2011 2013
Trade Balance Trade
Agreement starting date
Source: elaborations on Unctad data
21
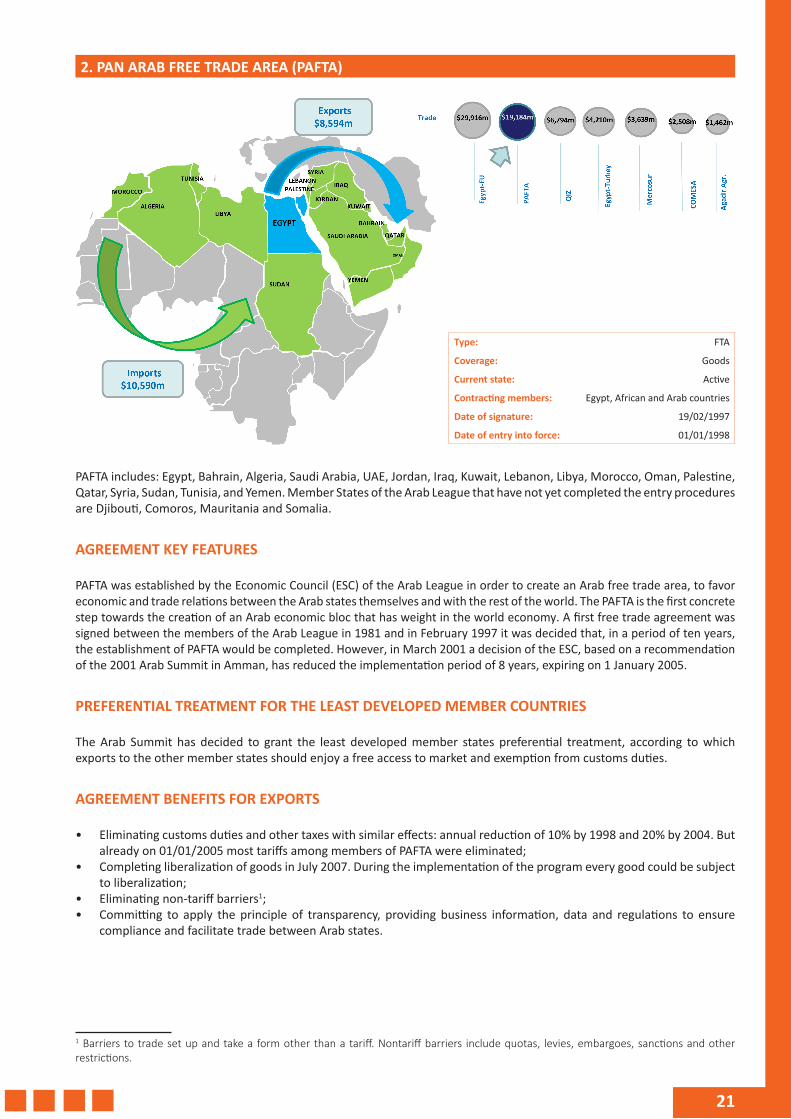
2. PAN ARAB FREE TRADE AREA (PAFTA)
PAFTA includes: Egypt, Bahrain, Algeria, Saudi Arabia, UAE, Jordan, Iraq, Kuwait, Lebanon, Libya, Morocco, Oman, Palestine, Qatar, Syria, Sudan, Tunisia, and Yemen. Member States of the Arab League that have not yet completed the entry procedures are Djibouti, Comoros, Mauritania and Somalia.
AGREEMENT KEY FEATURES
PAFTA was established by the Economic Council (ESC) of the Arab League in order to create an Arab free trade area, to favor economic and trade relations between the Arab states themselves and with the rest of the world. The PAFTA is the first concrete step towards the creation of an Arab economic bloc that has weight in the world economy. A first free trade agreement was signed between the members of the Arab League in 1981 and in February 1997 it was decided that, in a period of ten years, the establishment of PAFTA would be completed. However, in March 2001 a decision of the ESC, based on a recommendation of the 2001 Arab Summit in Amman, has reduced the implementation period of 8 years, expiring on 1 January 2005.
PREFERENTIAL TREATMENT FOR THE LEAST DEVELOPED MEMBER COUNTRIES
The Arab Summit has decided to grant the least developed member states preferential treatment, according to which exports to the other member states should enjoy a free access to market and exemption from customs duties.
AGREEMENT BENEFITS FOR EXPORTS
• Eliminating customs duties and other taxes with similar effects: annual reduction of 10% by 1998 and 20% by 2004. But already on 01/01/2005 most tariffs among members of PAFTA were eliminated;
• Completing liberalization of goods in July 2007. During the implementation of the program every good could be subject to liberalization;
• Eliminating non-tariff barriers1;• Committing to apply the principle of transparency, providing business information, data and regulations to ensure
compliance and facilitate trade between Arab states.
1 Barriers to trade set up and take a form other than a tariff. Nontariff barriers include quotas, levies, embargoes, sanctions and other restrictions.
Type: FTA
Coverage: Goods
Current state: Active
Contracting members: Egypt, African and Arab countries
Date of signature: 19/02/1997
Date of entry into force: 01/01/1998
22
AGREEMENT BENEFITS FOR INVESTMENTS
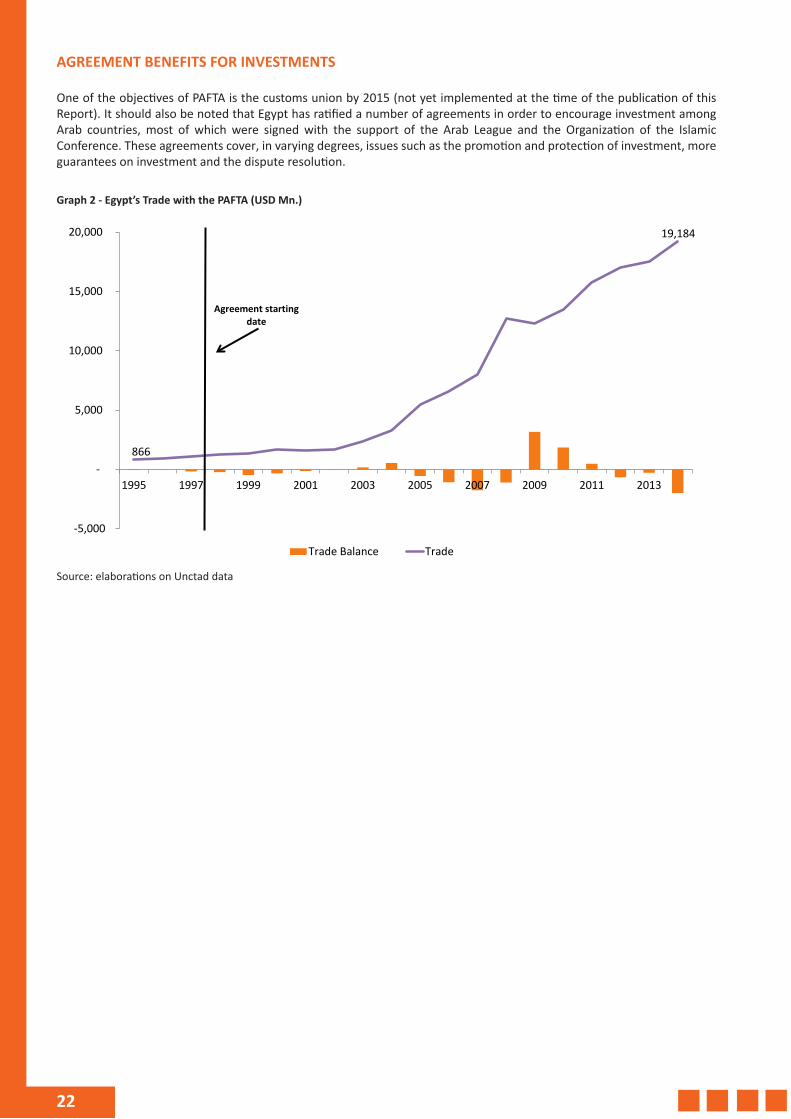
One of the objectives of PAFTA is the customs union by 2015 (not yet implemented at the time of the publication of this Report). It should also be noted that Egypt has ratified a number of agreements in order to encourage investment among Arab countries, most of which were signed with the support of the Arab League and the Organization of the Islamic Conference. These agreements cover, in varying degrees, issues such as the promotion and protection of investment, more guarantees on investment and the dispute resolution.
Graph 2 - Egypt’s Trade with the PAFTA (USD Mn.)
866
19,184
-5,000
-
5,000
10,000
15,000
20,000
1995 1997 1999 2001 2003 2005 2007 2009 2011 2013
Trade Balance Trade
Agreement starting date
Source: elaborations on Unctad data
23
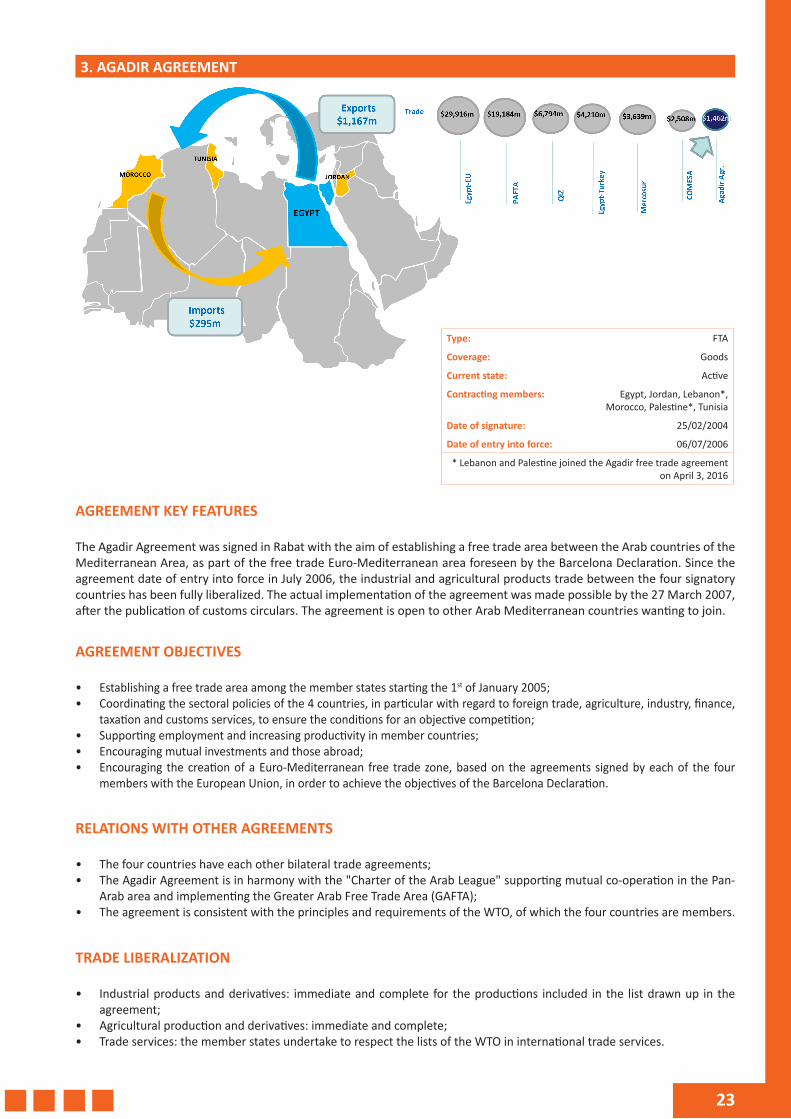
3. AGADIR AGREEMENT
AGREEMENT KEY FEATURES
The Agadir Agreement was signed in Rabat with the aim of establishing a free trade area between the Arab countries of the Mediterranean Area, as part of the free trade Euro-Mediterranean area foreseen by the Barcelona Declaration. Since the agreement date of entry into force in July 2006, the industrial and agricultural products trade between the four signatory countries has been fully liberalized. The actual implementation of the agreement was made possible by the 27 March 2007, after the publication of customs circulars. The agreement is open to other Arab Mediterranean countries wanting to join.
AGREEMENT OBJECTIVES
• Establishing a free trade area among the member states starting the 1st of January 2005;• Coordinating the sectoral policies of the 4 countries, in particular with regard to foreign trade, agriculture, industry, finance,
taxation and customs services, to ensure the conditions for an objective competition;• Supporting employment and increasing productivity in member countries;• Encouraging mutual investments and those abroad;• Encouraging the creation of a Euro-Mediterranean free trade zone, based on the agreements signed by each of the four
members with the European Union, in order to achieve the objectives of the Barcelona Declaration.
RELATIONS WITH OTHER AGREEMENTS
• The four countries have each other bilateral trade agreements;• The Agadir Agreement is in harmony with the "Charter of the Arab League" supporting mutual co-operation in the Pan-
Arab area and implementing the Greater Arab Free Trade Area (GAFTA);• The agreement is consistent with the principles and requirements of the WTO, of which the four countries are members.
TRADE LIBERALIZATION
• Industrial products and derivatives: immediate and complete for the productions included in the list drawn up in the agreement;
• Agricultural production and derivatives: immediate and complete;• Trade services: the member states undertake to respect the lists of the WTO in international trade services.
Type: FTA
Coverage: Goods
Current state: Active
Contracting members: Egypt, Jordan, Lebanon*, Morocco, Palestine*, Tunisia
Date of signature: 25/02/2004
Date of entry into force: 06/07/2006
* Lebanon and Palestine joined the Agadir free trade agreement on April 3, 2016
24
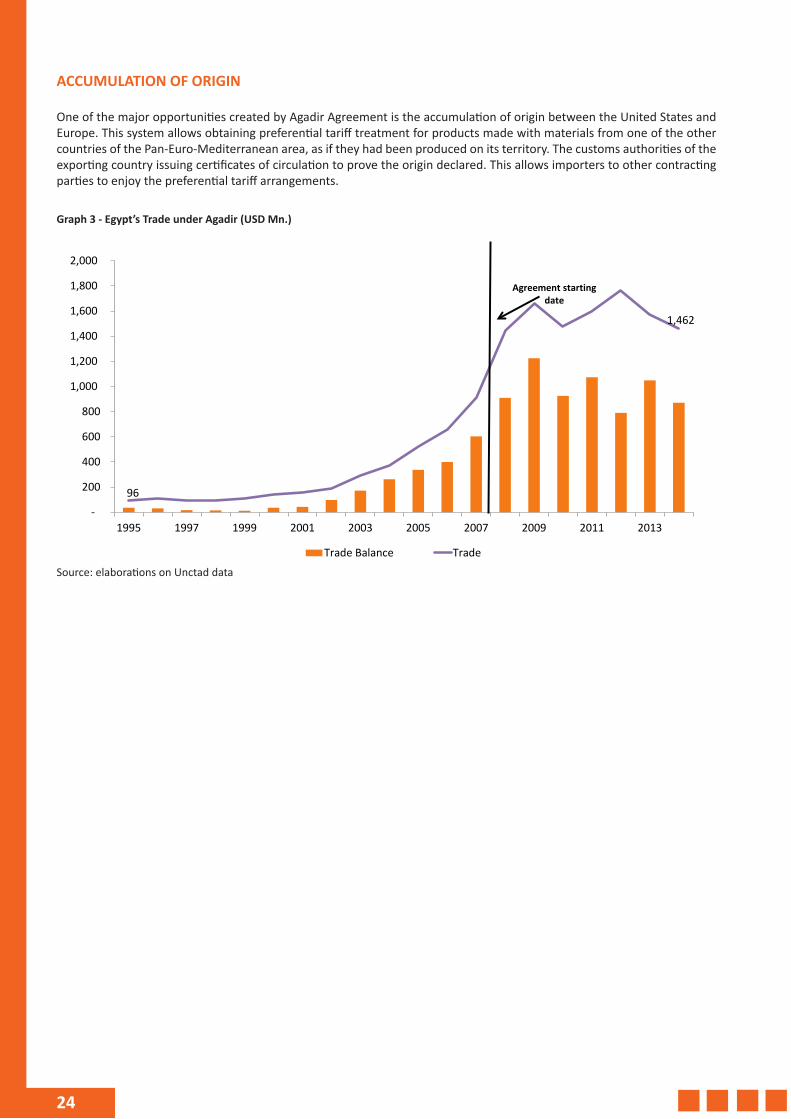
ACCUMULATION OF ORIGIN
One of the major opportunities created by Agadir Agreement is the accumulation of origin between the United States and Europe. This system allows obtaining preferential tariff treatment for products made with materials from one of the other countries of the Pan-Euro-Mediterranean area, as if they had been produced on its territory. The customs authorities of the exporting country issuing certificates of circulation to prove the origin declared. This allows importers to other contracting parties to enjoy the preferential tariff arrangements.
Graph 3 - Egypt’s Trade under Agadir (USD Mn.)
96
1,462
-
200
400
600
800
1,000
1,200
1,400
1,600
1,800
2,000
1995 1997 1999 2001 2003 2005 2007 2009 2011 2013
Trade Balance Trade
Agreement starting date
Source: elaborations on Unctad data
25
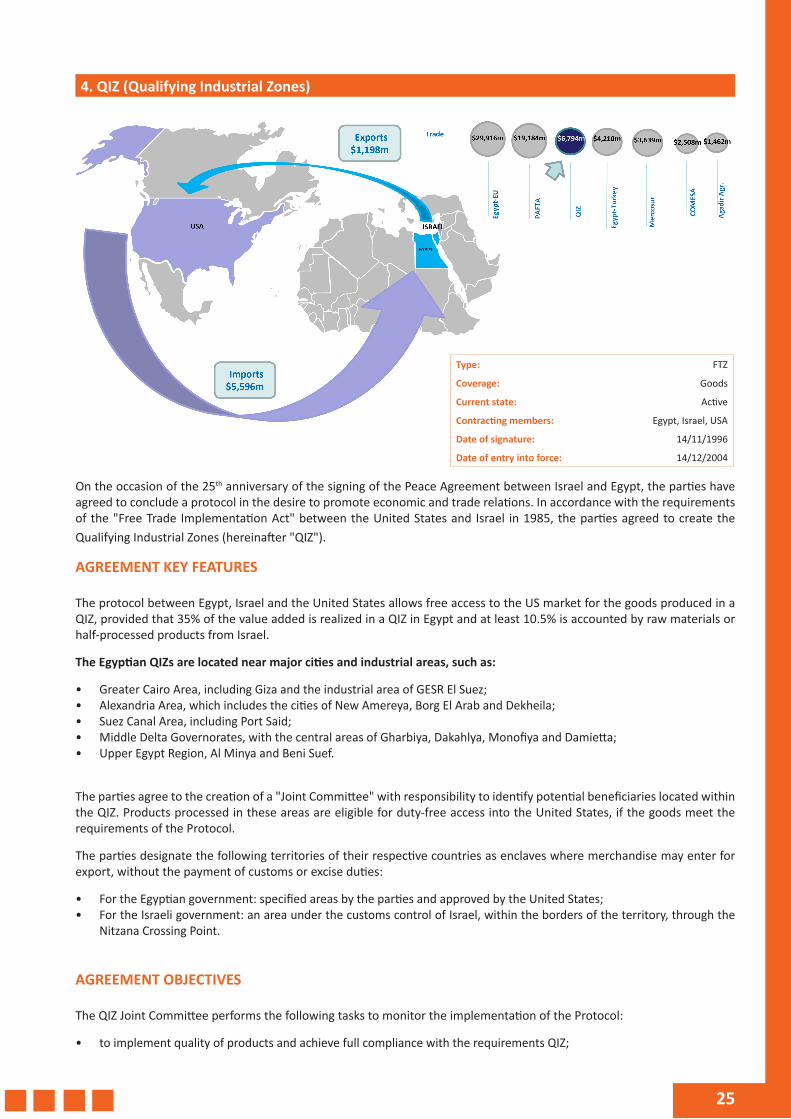
4. QIZ (Qualifying Industrial Zones)
On the occasion of the 25th anniversary of the signing of the Peace Agreement between Israel and Egypt, the parties have agreed to conclude a protocol in the desire to promote economic and trade relations. In accordance with the requirements of the "Free Trade Implementation Act" between the United States and Israel in 1985, the parties agreed to create the Qualifying Industrial Zones (hereinafter "QIZ").
AGREEMENT KEY FEATURES
The protocol between Egypt, Israel and the United States allows free access to the US market for the goods produced in a QIZ, provided that 35% of the value added is realized in a QIZ in Egypt and at least 10.5% is accounted by raw materials or half-processed products from Israel.
The Egyptian QIZs are located near major cities and industrial areas, such as:
• Greater Cairo Area, including Giza and the industrial area of GESR El Suez;• Alexandria Area, which includes the cities of New Amereya, Borg El Arab and Dekheila;• Suez Canal Area, including Port Said;• Middle Delta Governorates, with the central areas of Gharbiya, Dakahlya, Monofiya and Damietta;• Upper Egypt Region, Al Minya and Beni Suef.
The parties agree to the creation of a "Joint Committee" with responsibility to identify potential beneficiaries located within the QIZ. Products processed in these areas are eligible for duty-free access into the United States, if the goods meet the requirements of the Protocol.
The parties designate the following territories of their respective countries as enclaves where merchandise may enter for export, without the payment of customs or excise duties:
• For the Egyptian government: specified areas by the parties and approved by the United States;• For the Israeli government: an area under the customs control of Israel, within the borders of the territory, through the
Nitzana Crossing Point.
AGREEMENT OBJECTIVES
The QIZ Joint Committee performs the following tasks to monitor the implementation of the Protocol:
• to implement quality of products and achieve full compliance with the requirements QIZ;
Type: FTZ
Coverage: Goods
Current state: Active
Contracting members: Egypt, Israel, USA
Date of signature: 14/11/1996
Date of entry into force: 14/12/2004
26
• to ensure the above qualities through the issuance of certificates under the Protocol;• to improve performance of manufacturing plants in order to increase the number of appearances included in the lists of
companies than the standards required by the Protocol;• to present, through an annual report submitted to the ministers, the results of virtuous societies.
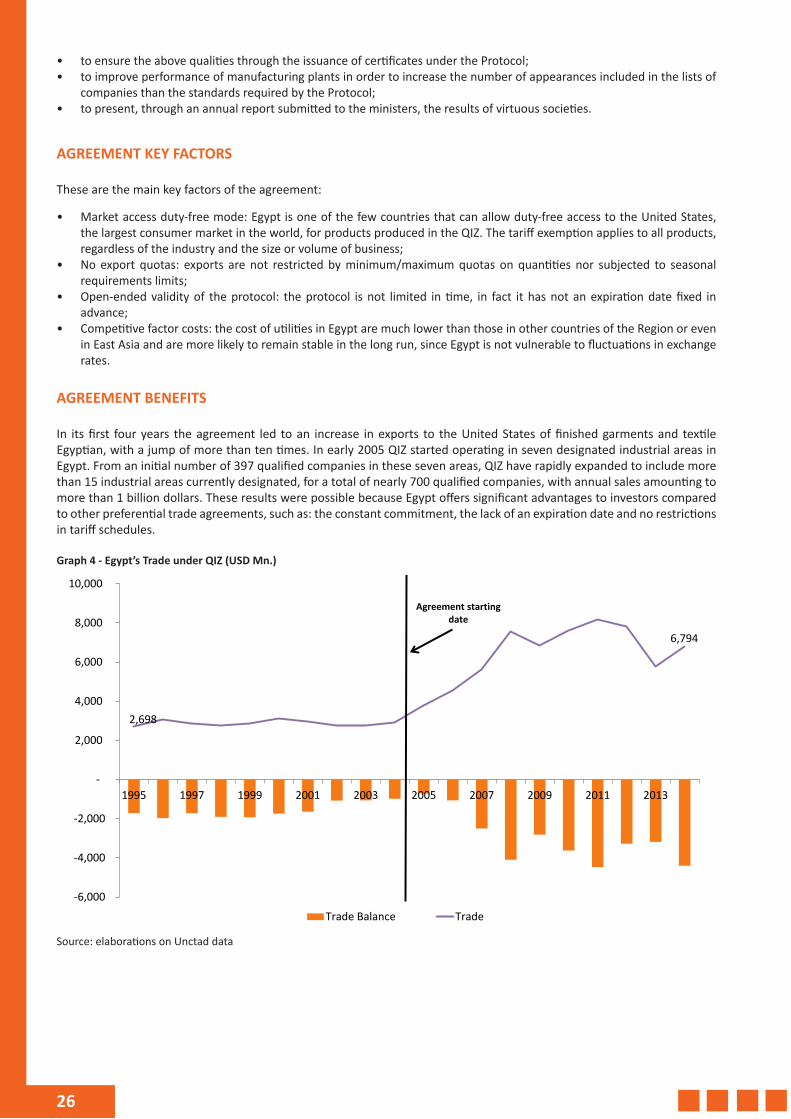
AGREEMENT KEY FACTORS
These are the main key factors of the agreement:
• Market access duty-free mode: Egypt is one of the few countries that can allow duty-free access to the United States, the largest consumer market in the world, for products produced in the QIZ. The tariff exemption applies to all products, regardless of the industry and the size or volume of business;
• No export quotas: exports are not restricted by minimum/maximum quotas on quantities nor subjected to seasonal requirements limits;
• Open-ended validity of the protocol: the protocol is not limited in time, in fact it has not an expiration date fixed in advance;
• Competitive factor costs: the cost of utilities in Egypt are much lower than those in other countries of the Region or even in East Asia and are more likely to remain stable in the long run, since Egypt is not vulnerable to fluctuations in exchange rates.
AGREEMENT BENEFITS
In its first four years the agreement led to an increase in exports to the United States of finished garments and textile Egyptian, with a jump of more than ten times. In early 2005 QIZ started operating in seven designated industrial areas in Egypt. From an initial number of 397 qualified companies in these seven areas, QIZ have rapidly expanded to include more than 15 industrial areas currently designated, for a total of nearly 700 qualified companies, with annual sales amounting to more than 1 billion dollars. These results were possible because Egypt offers significant advantages to investors compared to other preferential trade agreements, such as: the constant commitment, the lack of an expiration date and no restrictions in tariff schedules.
Graph 4 - Egypt’s Trade under QIZ (USD Mn.)
2,698
6,794
-2,000
-4,000
-6,000
-
2,000
4,000
6,000
8,000
10,000
1995 1997 1999 2001 2003 2005 2007 2009 2011 2013
Trade Balance Trade
Agreement starting date
Source: elaborations on Unctad data
27
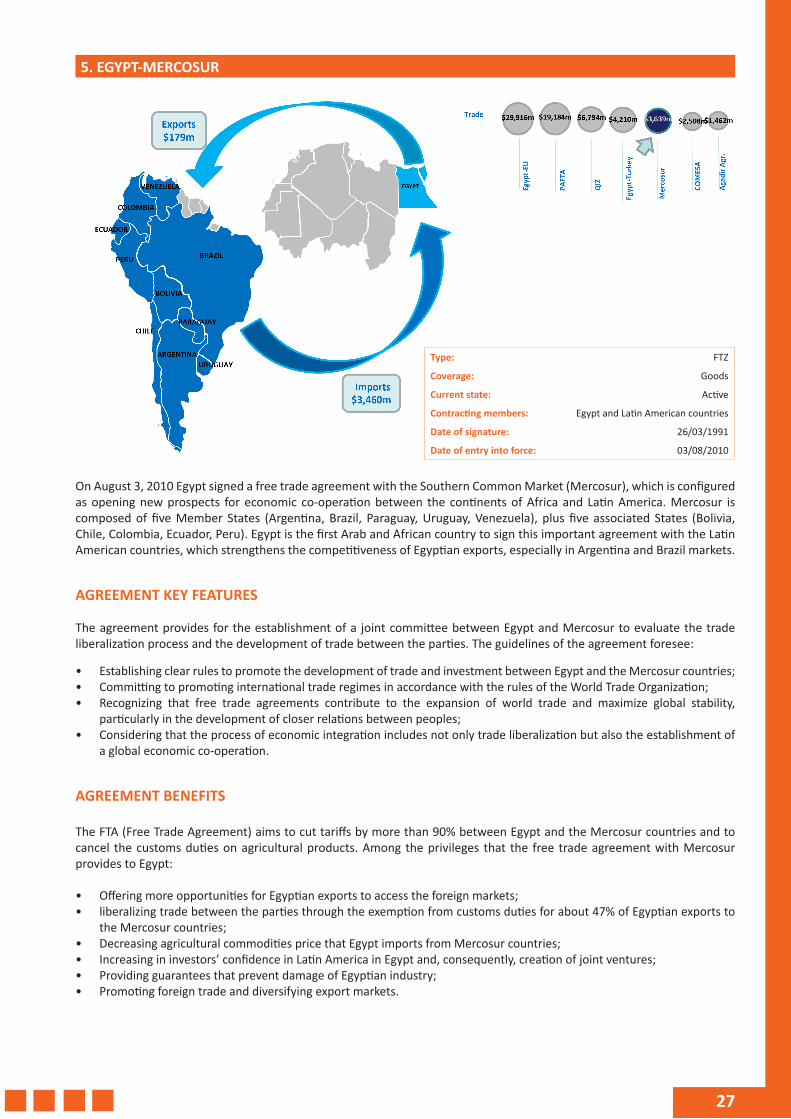
5. EGYPT-MERCOSUR
On August 3, 2010 Egypt signed a free trade agreement with the Southern Common Market (Mercosur), which is configured as opening new prospects for economic co-operation between the continents of Africa and Latin America. Mercosur is composed of five Member States (Argentina, Brazil, Paraguay, Uruguay, Venezuela), plus five associated States (Bolivia, Chile, Colombia, Ecuador, Peru). Egypt is the first Arab and African country to sign this important agreement with the Latin American countries, which strengthens the competitiveness of Egyptian exports, especially in Argentina and Brazil markets.
AGREEMENT KEY FEATURES
The agreement provides for the establishment of a joint committee between Egypt and Mercosur to evaluate the trade liberalization process and the development of trade between the parties. The guidelines of the agreement foresee:
• Establishing clear rules to promote the development of trade and investment between Egypt and the Mercosur countries;• Committing to promoting international trade regimes in accordance with the rules of the World Trade Organization;• Recognizing that free trade agreements contribute to the expansion of world trade and maximize global stability,
particularly in the development of closer relations between peoples;• Considering that the process of economic integration includes not only trade liberalization but also the establishment of
a global economic co-operation.
AGREEMENT BENEFITS
The FTA (Free Trade Agreement) aims to cut tariffs by more than 90% between Egypt and the Mercosur countries and to cancel the customs duties on agricultural products. Among the privileges that the free trade agreement with Mercosur provides to Egypt:
• Offering more opportunities for Egyptian exports to access the foreign markets;• liberalizing trade between the parties through the exemption from customs duties for about 47% of Egyptian exports to
the Mercosur countries;• Decreasing agricultural commodities price that Egypt imports from Mercosur countries;• Increasing in investors’ confidence in Latin America in Egypt and, consequently, creation of joint ventures;• Providing guarantees that prevent damage of Egyptian industry;• Promoting foreign trade and diversifying export markets.
Type: FTZ
Coverage: Goods
Current state: Active
Contracting members: Egypt and Latin American countries
Date of signature: 26/03/1991
Date of entry into force: 03/08/2010
28
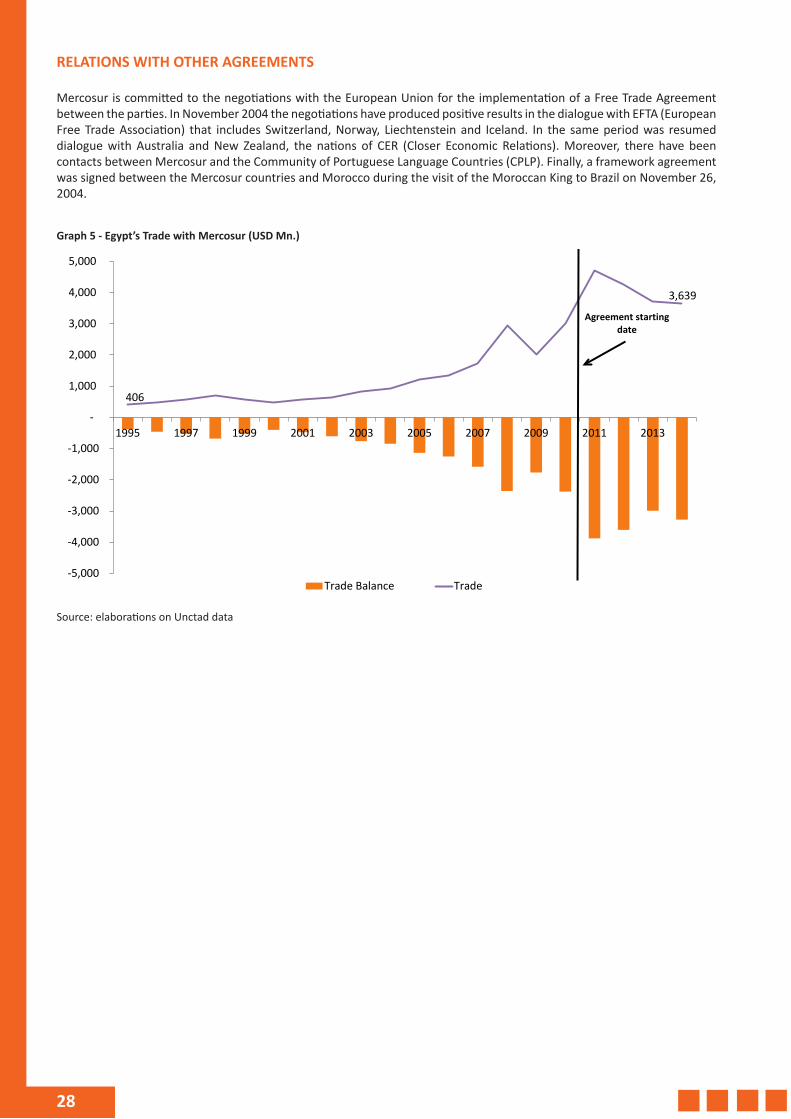
RELATIONS WITH OTHER AGREEMENTS
Mercosur is committed to the negotiations with the European Union for the implementation of a Free Trade Agreement between the parties. In November 2004 the negotiations have produced positive results in the dialogue with EFTA (European Free Trade Association) that includes Switzerland, Norway, Liechtenstein and Iceland. In the same period was resumed dialogue with Australia and New Zealand, the nations of CER (Closer Economic Relations). Moreover, there have been contacts between Mercosur and the Community of Portuguese Language Countries (CPLP). Finally, a framework agreement was signed between the Mercosur countries and Morocco during the visit of the Moroccan King to Brazil on November 26, 2004.
Graph 5 - Egypt’s Trade with Mercosur (USD Mn.)
406
3,639
-1,000
-2,000
-3,000
-4,000
-5,000
-
1,000
2,000
3,000
4,000
5,000
1995 1997 1999 2001 2003 2005 2007 2009 2011 2013
Trade Balance Trade
Agreement starting date
Source: elaborations on Unctad data
29
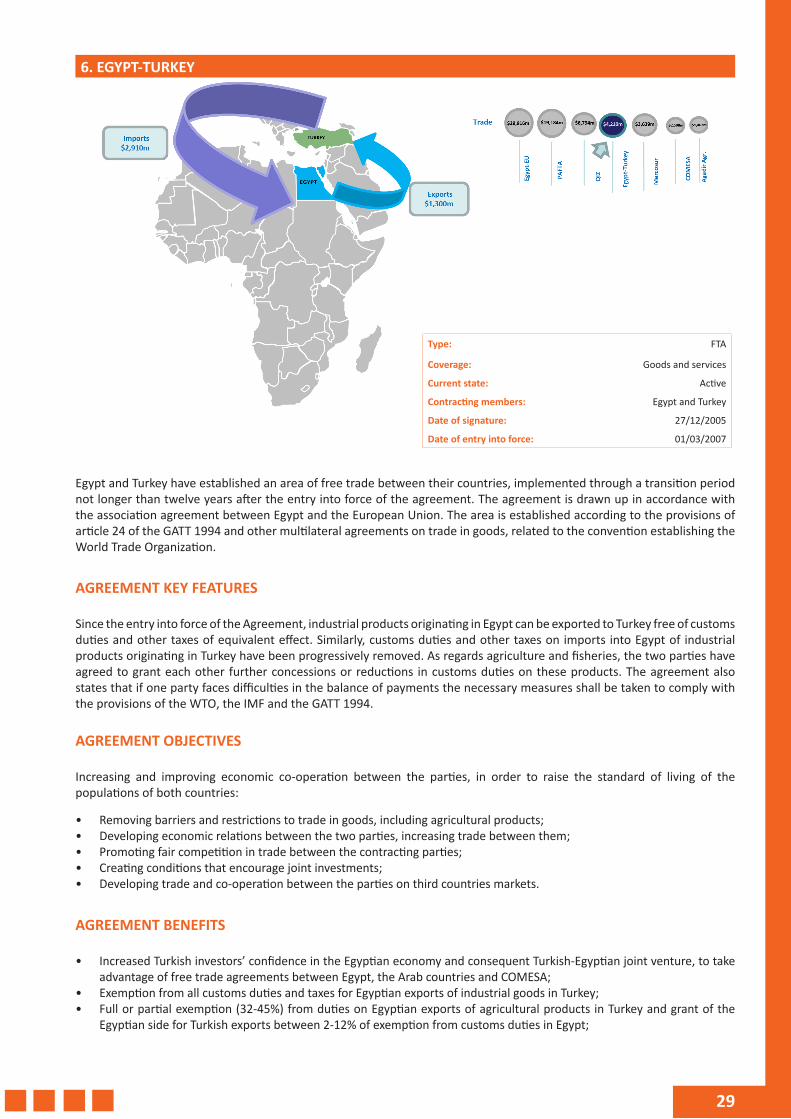
6. EGYPT-TURKEY
Egypt and Turkey have established an area of free trade between their countries, implemented through a transition period not longer than twelve years after the entry into force of the agreement. The agreement is drawn up in accordance with the association agreement between Egypt and the European Union. The area is established according to the provisions of article 24 of the GATT 1994 and other multilateral agreements on trade in goods, related to the convention establishing the World Trade Organization.
AGREEMENT KEY FEATURES
Since the entry into force of the Agreement, industrial products originating in Egypt can be exported to Turkey free of customs duties and other taxes of equivalent effect. Similarly, customs duties and other taxes on imports into Egypt of industrial products originating in Turkey have been progressively removed. As regards agriculture and fisheries, the two parties have agreed to grant each other further concessions or reductions in customs duties on these products. The agreement also states that if one party faces difficulties in the balance of payments the necessary measures shall be taken to comply with the provisions of the WTO, the IMF and the GATT 1994.
AGREEMENT OBJECTIVES
Increasing and improving economic co-operation between the parties, in order to raise the standard of living of the populations of both countries:
• Removing barriers and restrictions to trade in goods, including agricultural products;• Developing economic relations between the two parties, increasing trade between them;• Promoting fair competition in trade between the contracting parties;• Creating conditions that encourage joint investments;• Developing trade and co-operation between the parties on third countries markets.
AGREEMENT BENEFITS
• Increased Turkish investors’ confidence in the Egyptian economy and consequent Turkish-Egyptian joint venture, to take advantage of free trade agreements between Egypt, the Arab countries and COMESA;
• Exemption from all customs duties and taxes for Egyptian exports of industrial goods in Turkey;• Full or partial exemption (32-45%) from duties on Egyptian exports of agricultural products in Turkey and grant of the
Egyptian side for Turkish exports between 2-12% of exemption from customs duties in Egypt;
Type: FTA
Coverage: Goods and services
Current state: Active
Contracting members: Egypt and Turkey
Date of signature: 27/12/2005
Date of entry into force: 01/03/2007
30
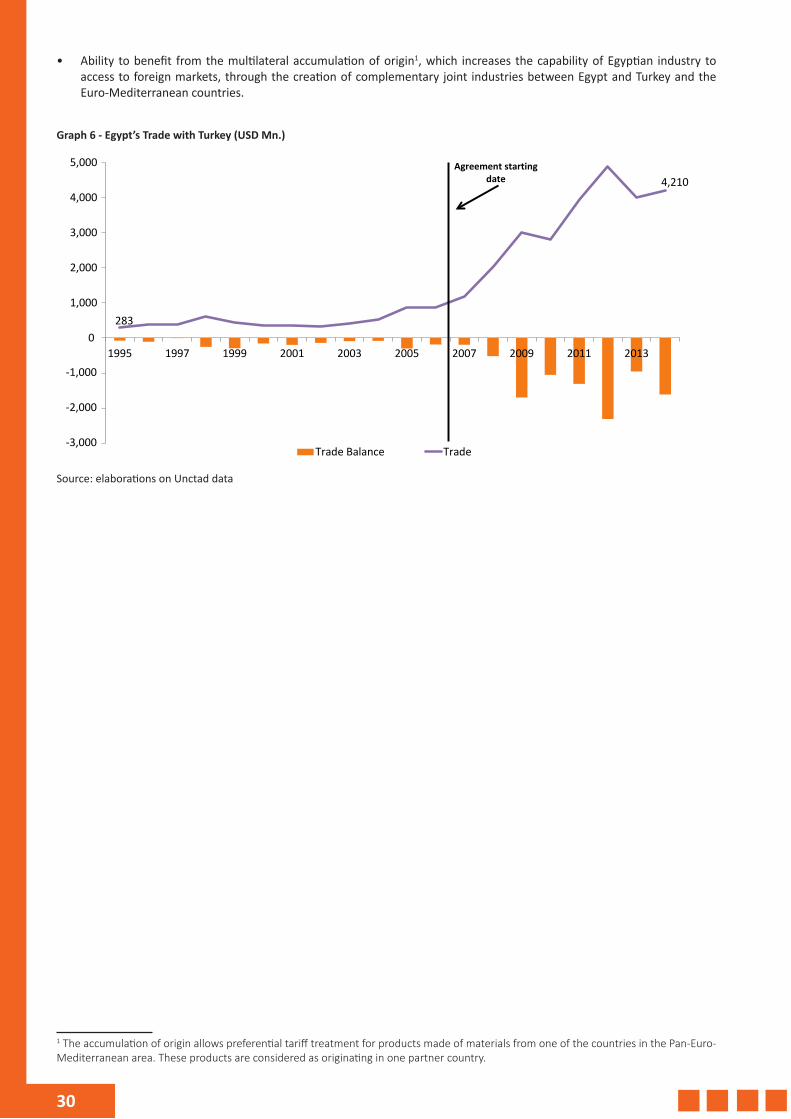
• Ability to benefit from the multilateral accumulation of origin1, which increases the capability of Egyptian industry to access to foreign markets, through the creation of complementary joint industries between Egypt and Turkey and the Euro-Mediterranean countries.
Graph 6 - Egypt’s Trade with Turkey (USD Mn.)
283
4,210
-1,000
-2,000
-3,000
0
1,000
2,000
3,000
4,000
5,000
1995 1997 1999 2001 2003 2005 2007 2009 2011 2013
Trade Balance Trade
Agreement starting date
Source: elaborations on Unctad data
1 The accumulation of origin allows preferential tariff treatment for products made of materials from one of the countries in the Pan-Euro-Mediterranean area. These products are considered as originating in one partner country.
31
7. COMESA (COMMON MARKET FOR EASTERN AND SOUTHERN AFRICA)
AGREEMENT KEY FEATURES
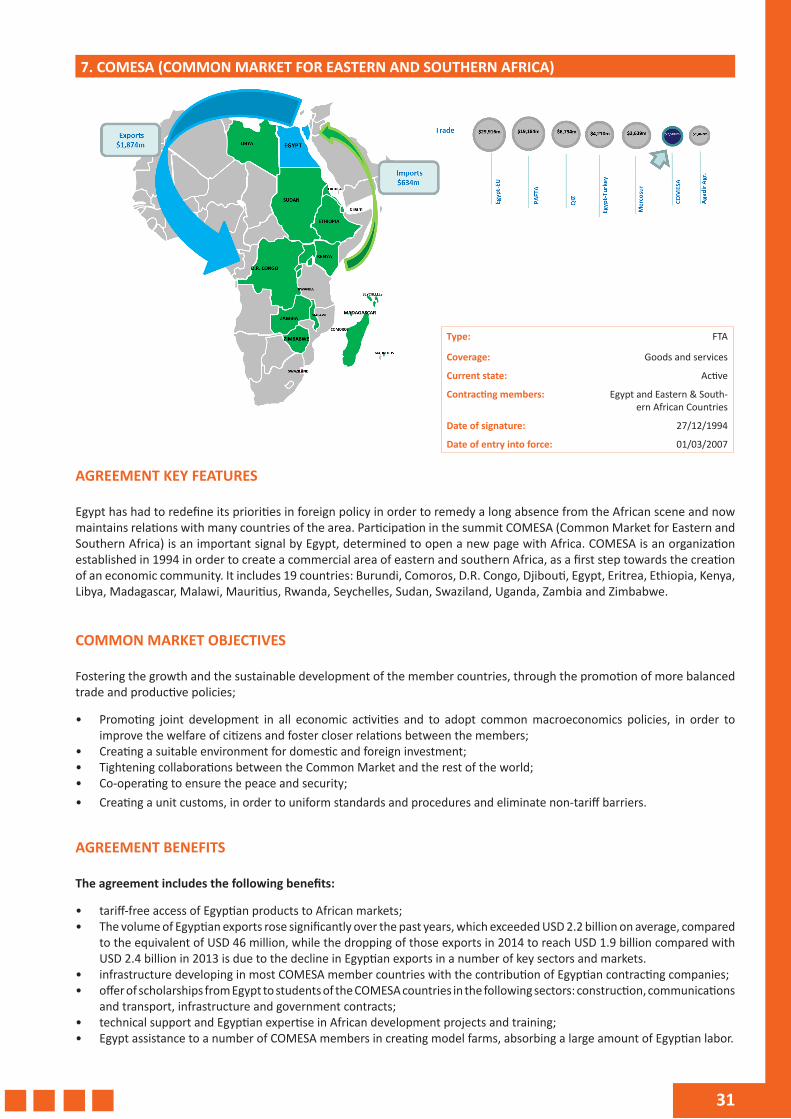
Egypt has had to redefine its priorities in foreign policy in order to remedy a long absence from the African scene and now maintains relations with many countries of the area. Participation in the summit COMESA (Common Market for Eastern and Southern Africa) is an important signal by Egypt, determined to open a new page with Africa. COMESA is an organization established in 1994 in order to create a commercial area of eastern and southern Africa, as a first step towards the creation of an economic community. It includes 19 countries: Burundi, Comoros, D.R. Congo, Djibouti, Egypt, Eritrea, Ethiopia, Kenya, Libya, Madagascar, Malawi, Mauritius, Rwanda, Seychelles, Sudan, Swaziland, Uganda, Zambia and Zimbabwe.
COMMON MARKET OBJECTIVES
Fostering the growth and the sustainable development of the member countries, through the promotion of more balanced trade and productive policies;
• Promoting joint development in all economic activities and to adopt common macroeconomics policies, in order to improve the welfare of citizens and foster closer relations between the members;
• Creating a suitable environment for domestic and foreign investment;• Tightening collaborations between the Common Market and the rest of the world;• Co-operating to ensure the peace and security;• Creating a unit customs, in order to uniform standards and procedures and eliminate non-tariff barriers.
AGREEMENT BENEFITS
The agreement includes the following benefits:
• tariff-free access of Egyptian products to African markets;• The volume of Egyptian exports rose significantly over the past years, which exceeded USD 2.2 billion on average, compared
to the equivalent of USD 46 million, while the dropping of those exports in 2014 to reach USD 1.9 billion compared with USD 2.4 billion in 2013 is due to the decline in Egyptian exports in a number of key sectors and markets.
• infrastructure developing in most COMESA member countries with the contribution of Egyptian contracting companies;• offer of scholarships from Egypt to students of the COMESA countries in the following sectors: construction, communications
and transport, infrastructure and government contracts;• technical support and Egyptian expertise in African development projects and training;• Egypt assistance to a number of COMESA members in creating model farms, absorbing a large amount of Egyptian labor.
Type: FTA
Coverage: Goods and services
Current state: Active
Contracting members: Egypt and Eastern & South-ern African Countries
Date of signature: 27/12/1994
Date of entry into force: 01/03/2007
32
RELATIONS WITH OTHER AGREEMENTS
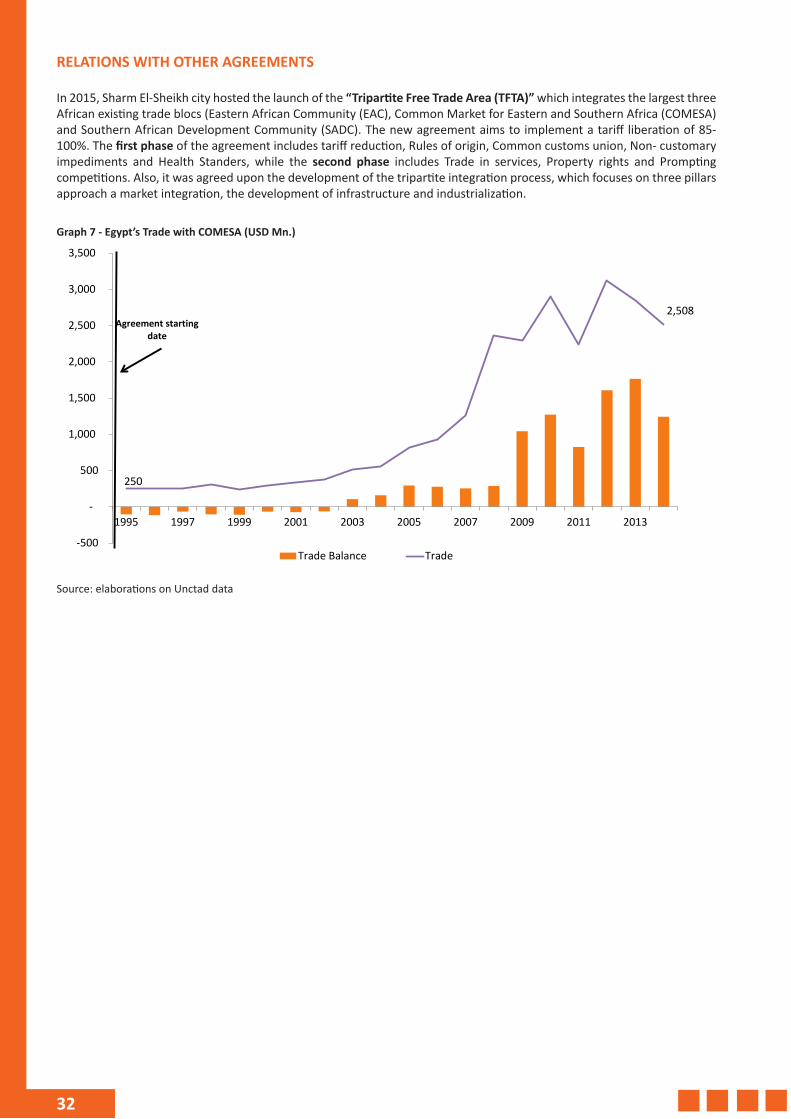
In 2015, Sharm El-Sheikh city hosted the launch of the “Tripartite Free Trade Area (TFTA)” which integrates the largest three African existing trade blocs (Eastern African Community (EAC), Common Market for Eastern and Southern Africa (COMESA) and Southern African Development Community (SADC). The new agreement aims to implement a tariff liberation of 85-100%. The first phase of the agreement includes tariff reduction, Rules of origin, Common customs union, Non- customary impediments and Health Standers, while the second phase includes Trade in services, Property rights and Prompting competitions. Also, it was agreed upon the development of the tripartite integration process, which focuses on three pillars approach a market integration, the development of infrastructure and industrialization.
Graph 7 - Egypt’s Trade with COMESA (USD Mn.)
250
2,508
-500
-
500
1,000
1,500
2,000
2,500
3,000
3,500
1995 1997 1999 2001 2003 2005 2007 2009 2011 2013
Trade Balance Trade
Agreement starting date
Source: elaborations on Unctad data
33
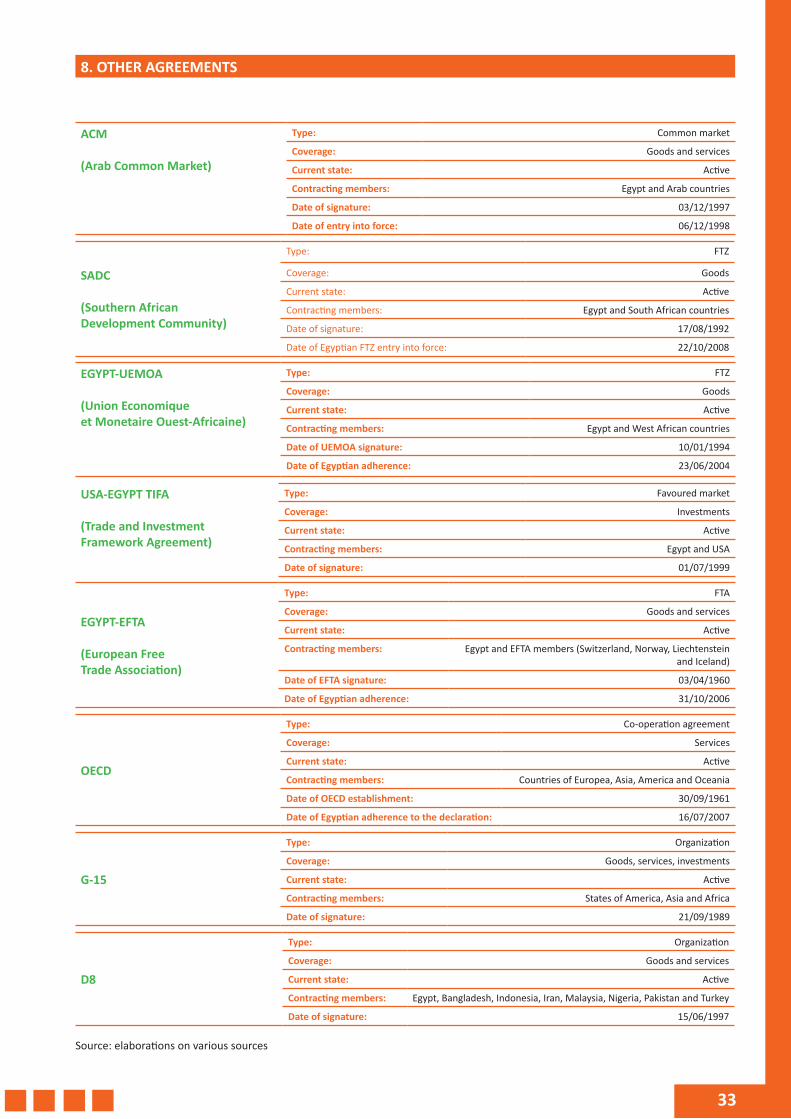
8. OTHER AGREEMENTS
ACM
(Arab Common Market)
Type: Common market
Coverage: Goods and services
Current state: Active
Contracting members: Egypt and Arab countries
Date of signature: 03/12/1997
Date of entry into force: 06/12/1998
SADC
(Southern African Development Community)
Type: FTZ
Coverage: Goods
Current state: Active
Contracting members: Egypt and South African countries
Date of signature: 17/08/1992
Date of Egyptian FTZ entry into force: 22/10/2008
EGYPT-UEMOA
(Union Economique et Monetaire Ouest-Africaine)
Type: FTZ
Coverage: Goods
Current state: Active
Contracting members: Egypt and West African countries
Date of UEMOA signature: 10/01/1994
Date of Egyptian adherence: 23/06/2004
USA-EGYPT TIFA
(Trade and Investment Framework Agreement)
Type: Favoured market
Coverage: Investments
Current state: Active
Contracting members: Egypt and USA
Date of signature: 01/07/1999
EGYPT-EFTA
(European Free Trade Association)
Type: FTA
Coverage: Goods and services
Current state: Active
Contracting members: Egypt and EFTA members (Switzerland, Norway, Liechtenstein and Iceland)
Date of EFTA signature: 03/04/1960
Date of Egyptian adherence: 31/10/2006
OECD
Type: Co-operation agreement
Coverage: Services
Current state: Active
Contracting members: Countries of Europea, Asia, America and Oceania
Date of OECD establishment: 30/09/1961
Date of Egyptian adherence to the declaration: 16/07/2007
G-15
Type: Organization
Coverage: Goods, services, investments
Current state: Active
Contracting members: States of America, Asia and Africa
Date of signature: 21/09/1989
D8
Type: Organization
Coverage: Goods and services
Current state: Active
Contracting members: Egypt, Bangladesh, Indonesia, Iran, Malaysia, Nigeria, Pakistan and Turkey
Date of signature: 15/06/1997
Source: elaborations on various sources
34
EUROPEAN TRADE POLICY
Over the next years, 90% of world demand will be generated outside Europe. That is why it is a key priority for the EU to tap into this growth potential by opening up market opportunities for European businesses abroad. One way of ensuring this is through negotiating agreements with the European key partners. In terms of employment, these agreements could generate 2.2 million new jobs or additional 1% of the EU total workforce. The EU aims to conclude Deep and Comprehensive Free Trade Agreements (DCFTA) that, on top of removing tariffs, also open up markets on services, investment, public procurement and include regulatory issues. The EU has successfully concluded a number of important trade agreements with trading partners and is in the process of negotiating agreements with many more.
EU-AFRICA TRADE AGREEMENTS
One of the priorities of the Africa-EU partnership will be to help Africa improve its productive capacities and become less dependent on other countries, and thus participate in the global economy. In order to achieve this, the key goals which will be pursued by Africa-EU cooperation on trade and regional integration will be:
1. private sector development, supported by foreign investments;2. the development and strengthening of physical infrastructure networks and related services, which are needed for the
movement of persons, goods, information;3. trade integration.
In line with the Abuja Treaty, establishing the African Economic Community, trade and integration are recognised as essential components of the wider process of regional integration and development. Regional Economic Communities will play an essential role as building blocks of the continental integration process. In order to do so, Africa and the EU will work together to put in place programmes and mechanisms to develop norms, standards and quality control with reference to international standards of trade, customs and industrial policies.
EU-Africa cooperation is aimed to the development of trading relationships between Africa and the EU, through the implementation of Economic Partnership Agreements (EPA) with African regions. The negotiations started in 2002 and have covered five regional groups: West Africa, Central Africa, Eastern and Southern Africa (ESA), Eastern African Community (EAC), South African Development Community (SADC) EPA Group. All EPAs have their origins in the trade chapter of the Cotonou Agreement, they are aimed at promoting sustainable development and growth, poverty reduction, better governance and the gradual integration of that countries into the world economy.
ON-GOING NEGOTIATIONS
The EU Negotiations are now entering a decisive phase in the Eastern African community (EAC) and the Southern African Development Community (SADC) EPA Group.
FREE TRADE AGREEMENTS ALREADY IN PLACE
Economic Partnership Agreements are being implemented in two regions: Eastern and Southern Africa (four ESA countries - Zimbabwe, Mauritius, Madagascar, the Seychelles) and South Africa.
• In the path to trade liberalization, Egyptian authorities exerted great efforts during the last two decades to amend trade regulations and boost its volume. Egypt signed different agreements covering the main economic blocks all over the world in addition to many bilateral ones to support its economic and trade relations with other countries.
• Free Trade Agreements (FTAs) aim in general to remove barriers to trade and investment. They also include the protection of intellectual property rights and dispute settlement. Therefore, exporters can benefit from agreements Egypt signed as:
• A total or partial elimination of tariffs and customs imposed on Egyptian exports to member countries of Egypt’s trade agreements.
• Goods produced in Egypt shall be accorded the same treatment as national products in any other members.• Unified rules and procedures for importing and exporting in addition to unified standards and specifications for all
products which can offer an easier access to external markets.
35
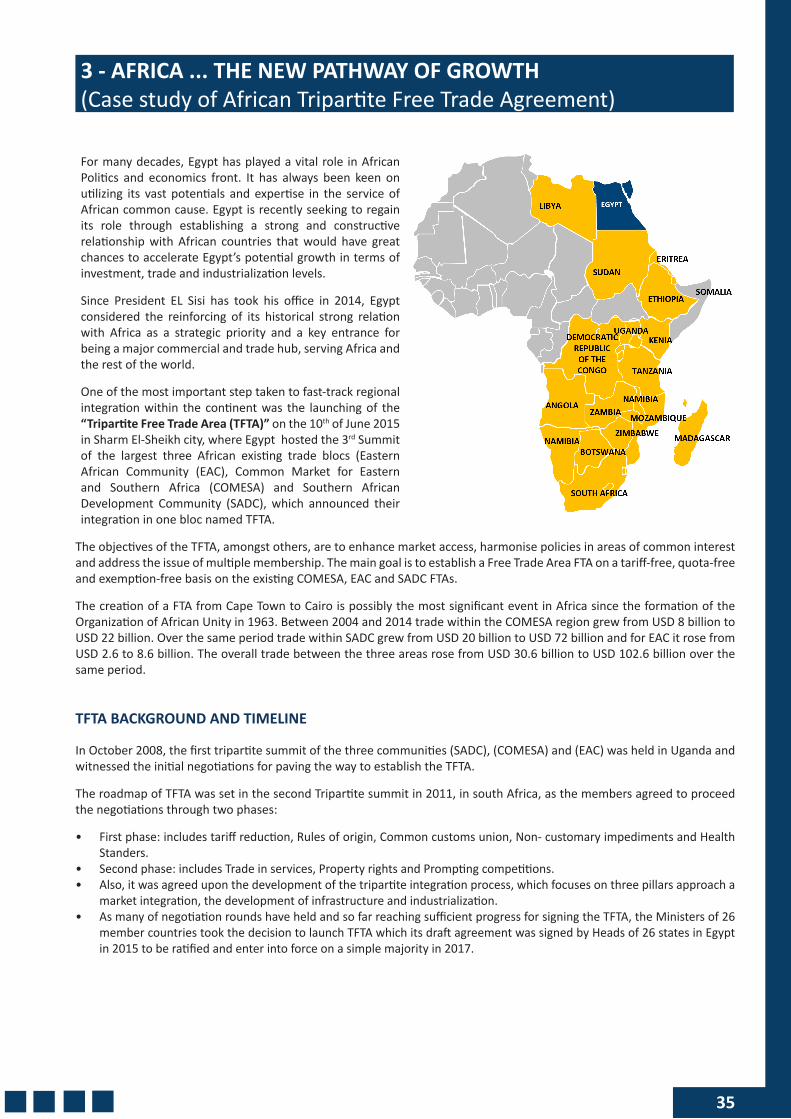
3 - AFRICA ... THE NEW PATHWAY OF GROWTH (Case study of African Tripartite Free Trade Agreement)
For many decades, Egypt has played a vital role in African Politics and economics front. It has always been keen on utilizing its vast potentials and expertise in the service of African common cause. Egypt is recently seeking to regain its role through establishing a strong and constructive relationship with African countries that would have great chances to accelerate Egypt’s potential growth in terms of investment, trade and industrialization levels.
Since President EL Sisi has took his office in 2014, Egypt considered the reinforcing of its historical strong relation with Africa as a strategic priority and a key entrance for being a major commercial and trade hub, serving Africa and the rest of the world.
One of the most important step taken to fast-track regional integration within the continent was the launching of the “Tripartite Free Trade Area (TFTA)” on the 10th of June 2015 in Sharm El-Sheikh city, where Egypt hosted the 3rd Summit of the largest three African existing trade blocs (Eastern African Community (EAC), Common Market for Eastern and Southern Africa (COMESA) and Southern African Development Community (SADC), which announced their integration in one bloc named TFTA.
The objectives of the TFTA, amongst others, are to enhance market access, harmonise policies in areas of common interest and address the issue of multiple membership. The main goal is to establish a Free Trade Area FTA on a tariff-free, quota-free and exemption-free basis on the existing COMESA, EAC and SADC FTAs.
The creation of a FTA from Cape Town to Cairo is possibly the most significant event in Africa since the formation of the Organization of African Unity in 1963. Between 2004 and 2014 trade within the COMESA region grew from USD 8 billion to USD 22 billion. Over the same period trade within SADC grew from USD 20 billion to USD 72 billion and for EAC it rose from USD 2.6 to 8.6 billion. The overall trade between the three areas rose from USD 30.6 billion to USD 102.6 billion over the same period.
TFTA BACKGROUND AND TIMELINE
In October 2008, the first tripartite summit of the three communities (SADC), (COMESA) and (EAC) was held in Uganda and witnessed the initial negotiations for paving the way to establish the TFTA.
The roadmap of TFTA was set in the second Tripartite summit in 2011, in south Africa, as the members agreed to proceed the negotiations through two phases:
• First phase: includes tariff reduction, Rules of origin, Common customs union, Non- customary impediments and Health Standers.
• Second phase: includes Trade in services, Property rights and Prompting competitions.• Also, it was agreed upon the development of the tripartite integration process, which focuses on three pillars approach a
market integration, the development of infrastructure and industrialization. • As many of negotiation rounds have held and so far reaching sufficient progress for signing the TFTA, the Ministers of 26
member countries took the decision to launch TFTA which its draft agreement was signed by Heads of 26 states in Egypt in 2015 to be ratified and enter into force on a simple majority in 2017.
36
POTENTIALS OF TFTA
TFTA will create the largest African free trade area, offering massive potentials for its members as follows:
• Enlarged market with a combined 26 member-states will help to maintain economic growth at 6–7% per year. At this rate the combined GDP of Africa is expected to reach USD 29 trillion by 2050, which would be equal to the current combined GDP of the EU and the US. With additional advanced policies, such growth will contribute significantly to spreading prosperity and eliminating poverty.
• Facilitating market access to more than 626 million citizens, presenting numerous opportunities for creating regional trade chains, which are still poor, where only 12 % of Africa’s imported intermediates is obtained from the region.
• Boosting Intra-African Trade as the removal of tariff barriers within Africa on goods only could raise the share of intra-African trade from 10.2 % in 2013 to 15.5 % in 10 years and can be double by 2022, as a result of enhancing trade facilitation and reducing trade costs.
• The agreement will also open new opportunities for foreign and domestic investments in more internal attractive markets, which have many of promising sectors such as energy, transportation and logistics, oil and gas. etc.
• The elimination of import duties under the proposed TFTA will enable members to import necessary raw materials within Africa at a cheaper cost. In turn, this will reduce the cost of production of goods manufactured for export from those materials making them more competitive on the regional and international markets
• The large free trade area that will be offered by TFTA will also help to stimulate trade in services. The first beneficiary is likely to be the financial sector, which will be able to benefit from economies of scale. Such financial services will reinforce the increase in cross-border investments by emerging African firms.
• By providing a single economic space with harmonized trade policies and a regulatory framework, the TFTA solves the problem of multiple memberships, rationalizes trade negotiations, reduces the cost of doing business, supports industrialization, and stimulates cross-border infrastructure projects.
The benefits of TFTA can be classified into three pillars; Trade, Investment and industrialization as follows:
TRADE
TFTA aims to implement a tariff liberation of 85-100% which will have a significant impact in facilitate the cross-border flow of goods and services,boosting the growth of intra-regional trade that amounted only 12% of Africa's trade compared to 22% for South America, 40% for North America, 50% for Asia and 70% for Western Europe. Some member-states are already exchanging tariff exemptions, while others will proceed with negotiations to liberalize the tariff rates based on each country’s tariff lines.
• The launch of the TFTA targets mainly to eliminate all tariff and non-tariff barriers by 100%, therefor an agreement has been reached that countries are committed to liberalize 85% of tariff lines within 5-8 years. The remaining 15% of the tariff lines are to be negotiated afterwards
• In order to achieve the liberalization of 85% of tariff lines, Egypt established an agreed-upon list of tariff lines divided into three categories:
• Category A: liberalizing up to 60% of tariff lines (includes goods with an applied tariff rates of 0%, 2%, and 5. and other goods with higher tariff rates)
• Category B: liberalizing up to 25% of tariff lines( includes goods that are subject to 10% and 20% tariff rates). • Category C: liberalizing up to 15% of tariff lines (includes goods with a 30% tariff rate or above)
The Box below represents the Non Tariff Barriers (NTBs) TFTA will work on eliminating them:
Most Common NTBs within COMESA, EAC & SADC
• Unnecessary delays in clearing goods at borders
• Cumbersome customs procedures
• Use of arbitrary and fictitious customs valuation of imports for purposes of charging duty
• Restricive of Cumbersome import/export licensing or permits
• Demand for bribes of unauthorised payments
• Varying procedures for issuance of certification marks, inspection and testing
• Numerous institutions involved in issunace and approving varied certification and testing procedures and inspection of conformity to National Standards
• Inconsistent, unreasonable and impartial application of Rules of Origin
• Harassment by border officials
Source: www.tradebarriers.org
37
INVESTMENT
Although the improving of business environment Africa witnessed over the past decade, which reflected in rising the private equity investment by 26 %, that made Africa one of the highest return on investment across emerging markets, it is still untapped market based on the massive potentials it enjoys such as:
• Africa is the second largest continent in the world in terms of area (30.2 sq. Km) and population (1.7 billion citizens). It has the second fastest growing middle class in the world and ranked as the second fastest growing region in 2013 with GDP amounted USD 2.2 trillion.
• Many African countries are considered key players in the global mineral and metal production market and more important on regional and international levels .The continent has 90% of global cobalt,50% of global phosphates and gold ,64% of the world's manganese and 40% of the world’s platinum.
• Africa is wealthy of natural resources especially in oil and natural gas sectors as there were several discoveries in Egypt, Chad, Uganda, Mozambique, Ghana, Tanzania, Côte d’Ivoire, Mali and similar prospects in Kenya.
• Africa is a major producer of food and agricultural raw materials with 76% of world cocoa, 60% of global coffee, and 50% of world palm oil.
• The tourism sector is ranked as Africa's third great natural resource after agriculture and mineral wealth. • Although Africa’s huge infrastructure gap is considered one of main challenges faces the development, it provides
enormous investment and financing opportunities for investors, where there are enormous investment opportunities in fields such as irrigation and water conservation facilities, road and rail network, construction of ports containers terminal, power plants as well as Solar panels, health care, and manufacturing.
In this respect, the TFTA will serve as a motive for investment in Africa's infrastructure. It is estimated that Africa needs to invest nearly USD 100 billion annually in infrastructure over the next decade. Less than half of this target is met currently. One of the reasons for the low level of investment has been poor coordination across the African different trading blocs, and that will be addressed under the TFTA.
INDUSTRIALIZATION
The high dependence in the raw materials in production and exports is still the main challenge faces African economies. The share of manufacturing in industrial output is 33 %, while its contribution to industrial growth remains slight hovering at 5%.The result was that the majority of exports were still being in raw format, with little or no local value addition. As a consequence, African economies have high exposure to external shocks and commodity price fluctuations:
• Some African blocs have designed industrialization programs, such as (EAC), (SADC) and the Economic Community of West African States (ECOWAS), but most of these programs didn’t achieve their goals due to the disconnection among each other.
• As Industrialization is one of the main pillars of the TFTA negotiations, it will focus on unifying policies of the three blocks, using the benefits of trade liberalization in maximize the add value of exchange trade among the member countries.
• The TFTA is keen on foster industrialization to create an essential mechanism for growth and facilitate general development. Africa’s industrialization should take advantage of its abundant and diverse resources including agricultural and mineral resources, which will enhance industrial development through having an added advantage of diversifying Africa's economies that are largely dependent on raw materials.
EGYPT’S ENGAGEMENTS IN AFRICA
Despite of the historical role and partnership in Africa, Egypt has so far not exploited the opportunities offered by the growth seen in the continent, Egypt’s share of African trade just has averaged about 0.5% over the last 3 decades.
Over the years, Egypt did not convert a lot of its advantages to improve trade with Africa although it is an active member in numbers of African blocs (COMESA, SADC and UEMOA), and it is wealthy with a solid industrial base that can serve as a viable manufacturing hub for most of the continent. Egypt’s geographical closeness to the rest of Africa provides an enormous opportunity for Egypt to access abundant raw materials from Africa and to export to near markets competitively, as Egypt’s export matched the import basket of most African economies.
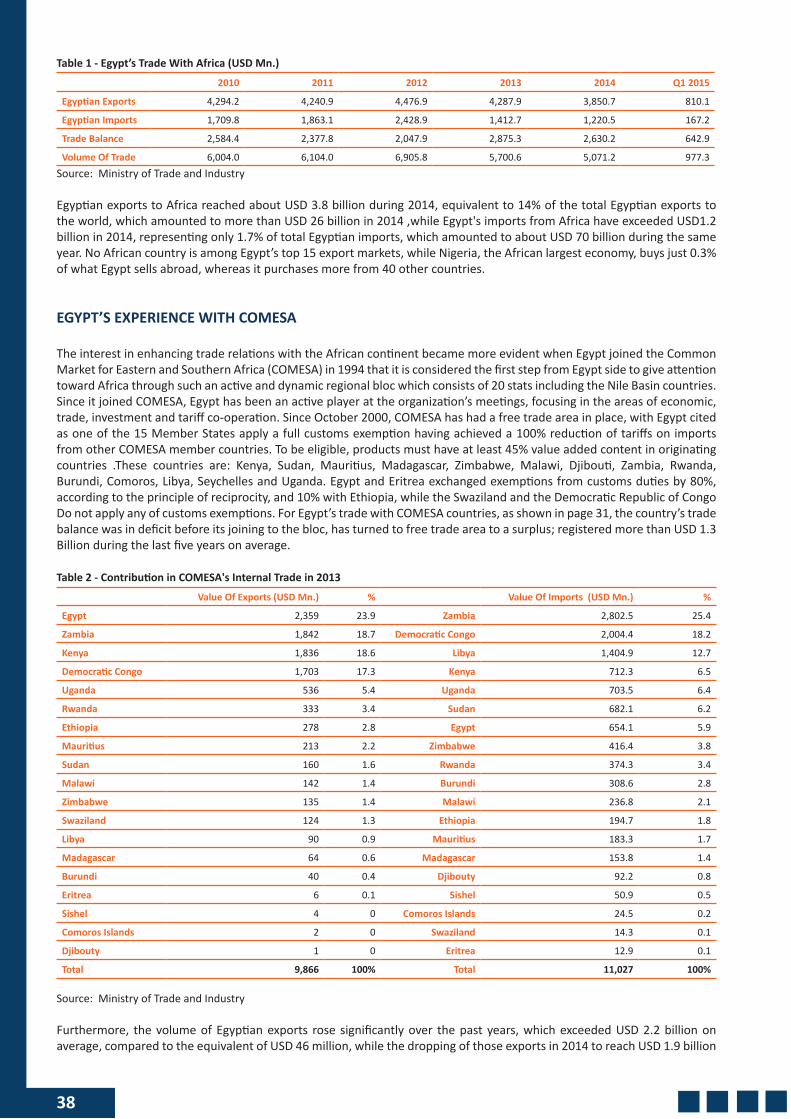
38
Table 1 - Egypt’s Trade With Africa (USD Mn.)
2010 2011 2012 2013 2014 Q1 2015
Egyptian Exports 4,294.2 4,240.9 4,476.9 4,287.9 3,850.7 810.1
Egyptian Imports 1,709.8 1,863.1 2,428.9 1,412.7 1,220.5 167.2
Trade Balance 2,584.4 2,377.8 2,047.9 2,875.3 2,630.2 642.9
Volume Of Trade 6,004.0 6,104.0 6,905.8 5,700.6 5,071.2 977.3Source: Ministry of Trade and Industry
Egyptian exports to Africa reached about USD 3.8 billion during 2014, equivalent to 14% of the total Egyptian exports to the world, which amounted to more than USD 26 billion in 2014 ,while Egypt's imports from Africa have exceeded USD1.2 billion in 2014, representing only 1.7% of total Egyptian imports, which amounted to about USD 70 billion during the same year. No African country is among Egypt’s top 15 export markets, while Nigeria, the African largest economy, buys just 0.3% of what Egypt sells abroad, whereas it purchases more from 40 other countries.
EGYPT’S EXPERIENCE WITH COMESA
The interest in enhancing trade relations with the African continent became more evident when Egypt joined the Common Market for Eastern and Southern Africa (COMESA) in 1994 that it is considered the first step from Egypt side to give attention toward Africa through such an active and dynamic regional bloc which consists of 20 stats including the Nile Basin countries. Since it joined COMESA, Egypt has been an active player at the organization’s meetings, focusing in the areas of economic, trade, investment and tariff co-operation. Since October 2000, COMESA has had a free trade area in place, with Egypt cited as one of the 15 Member States apply a full customs exemption having achieved a 100% reduction of tariffs on imports from other COMESA member countries. To be eligible, products must have at least 45% value added content in originating countries .These countries are: Kenya, Sudan, Mauritius, Madagascar, Zimbabwe, Malawi, Djibouti, Zambia, Rwanda, Burundi, Comoros, Libya, Seychelles and Uganda. Egypt and Eritrea exchanged exemptions from customs duties by 80%, according to the principle of reciprocity, and 10% with Ethiopia, while the Swaziland and the Democratic Republic of Congo Do not apply any of customs exemptions. For Egypt’s trade with COMESA countries, as shown in page 31, the country’s trade balance was in deficit before its joining to the bloc, has turned to free trade area to a surplus; registered more than USD 1.3 Billion during the last five years on average.
Table 2 - Contribution in COMESA's Internal Trade in 2013
Value Of Exports (USD Mn.) % Value Of Imports (USD Mn.) %
Egypt 2,359 23.9 Zambia 2,802.5 25.4
Zambia 1,842 18.7 Democratic Congo 2,004.4 18.2
Kenya 1,836 18.6 Libya 1,404.9 12.7
Democratic Congo 1,703 17.3 Kenya 712.3 6.5
Uganda 536 5.4 Uganda 703.5 6.4
Rwanda 333 3.4 Sudan 682.1 6.2
Ethiopia 278 2.8 Egypt 654.1 5.9
Mauritius 213 2.2 Zimbabwe 416.4 3.8
Sudan 160 1.6 Rwanda 374.3 3.4
Malawi 142 1.4 Burundi 308.6 2.8
Zimbabwe 135 1.4 Malawi 236.8 2.1
Swaziland 124 1.3 Ethiopia 194.7 1.8
Libya 90 0.9 Mauritius 183.3 1.7
Madagascar 64 0.6 Madagascar 153.8 1.4
Burundi 40 0.4 Djibouty 92.2 0.8
Eritrea 6 0.1 Sishel 50.9 0.5
Sishel 4 0 Comoros Islands 24.5 0.2
Comoros Islands 2 0 Swaziland 14.3 0.1
Djibouty 1 0 Eritrea 12.9 0.1
Total 9,866 100% Total 11,027 100%
Source: Ministry of Trade and Industry
Furthermore, the volume of Egyptian exports rose significantly over the past years, which exceeded USD 2.2 billion on average, compared to the equivalent of USD 46 million, while the dropping of those exports in 2014 to reach USD 1.9 billion
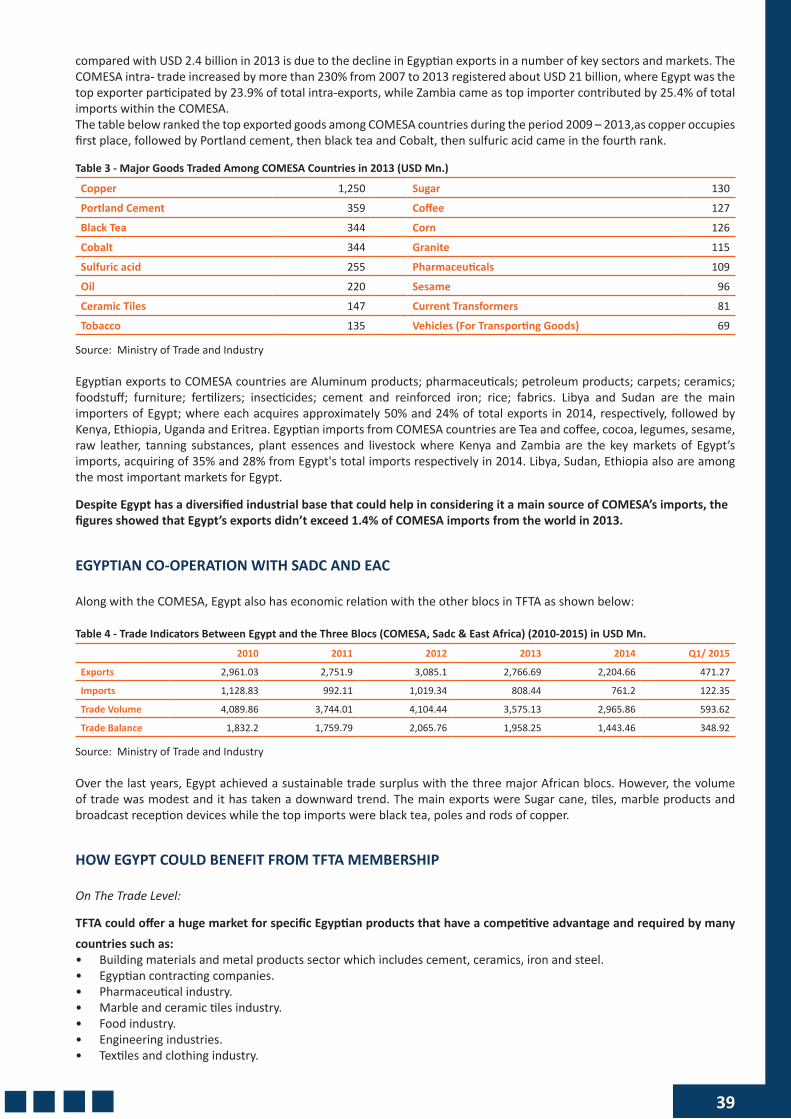
39
compared with USD 2.4 billion in 2013 is due to the decline in Egyptian exports in a number of key sectors and markets. The COMESA intra- trade increased by more than 230% from 2007 to 2013 registered about USD 21 billion, where Egypt was the top exporter participated by 23.9% of total intra-exports, while Zambia came as top importer contributed by 25.4% of total imports within the COMESA.The table below ranked the top exported goods among COMESA countries during the period 2009 – 2013,as copper occupies first place, followed by Portland cement, then black tea and Cobalt, then sulfuric acid came in the fourth rank.
Table 3 - Major Goods Traded Among COMESA Countries in 2013 (USD Mn.)
Copper 1,250 Sugar 130
Portland Cement 359 Coffee 127
Black Tea 344 Corn 126
Cobalt 344 Granite 115
Sulfuric acid 255 Pharmaceuticals 109
Oil 220 Sesame 96
Ceramic Tiles 147 Current Transformers 81
Tobacco 135 Vehicles (For Transporting Goods) 69
Source: Ministry of Trade and Industry
Egyptian exports to COMESA countries are Aluminum products; pharmaceuticals; petroleum products; carpets; ceramics; foodstuff; furniture; fertilizers; insecticides; cement and reinforced iron; rice; fabrics. Libya and Sudan are the main importers of Egypt; where each acquires approximately 50% and 24% of total exports in 2014, respectively, followed by Kenya, Ethiopia, Uganda and Eritrea. Egyptian imports from COMESA countries are Tea and coffee, cocoa, legumes, sesame, raw leather, tanning substances, plant essences and livestock where Kenya and Zambia are the key markets of Egypt’s imports, acquiring of 35% and 28% from Egypt's total imports respectively in 2014. Libya, Sudan, Ethiopia also are among the most important markets for Egypt.
Despite Egypt has a diversified industrial base that could help in considering it a main source of COMESA’s imports, the figures showed that Egypt’s exports didn’t exceed 1.4% of COMESA imports from the world in 2013.
EGYPTIAN CO-OPERATION WITH SADC AND EAC
Along with the COMESA, Egypt also has economic relation with the other blocs in TFTA as shown below:
Table 4 - Trade Indicators Between Egypt and the Three Blocs (COMESA, Sadc & East Africa) (2010-2015) in USD Mn.
2010 2011 2012 2013 2014 Q1/ 2015
Exports 2,961.03 2,751.9 3,085.1 2,766.69 2,204.66 471.27
Imports 1,128.83 992.11 1,019.34 808.44 761.2 122.35
Trade Volume 4,089.86 3,744.01 4,104.44 3,575.13 2,965.86 593.62
Trade Balance 1,832.2 1,759.79 2,065.76 1,958.25 1,443.46 348.92
Source: Ministry of Trade and Industry
Over the last years, Egypt achieved a sustainable trade surplus with the three major African blocs. However, the volume of trade was modest and it has taken a downward trend. The main exports were Sugar cane, tiles, marble products and broadcast reception devices while the top imports were black tea, poles and rods of copper.
HOW EGYPT COULD BENEFIT FROM TFTA MEMBERSHIP
On The Trade Level:
TFTA could offer a huge market for specific Egyptian products that have a competitive advantage and required by many countries such as: • Building materials and metal products sector which includes cement, ceramics, iron and steel. • Egyptian contracting companies. • Pharmaceutical industry.• Marble and ceramic tiles industry.• Food industry. • Engineering industries. • Textiles and clothing industry.
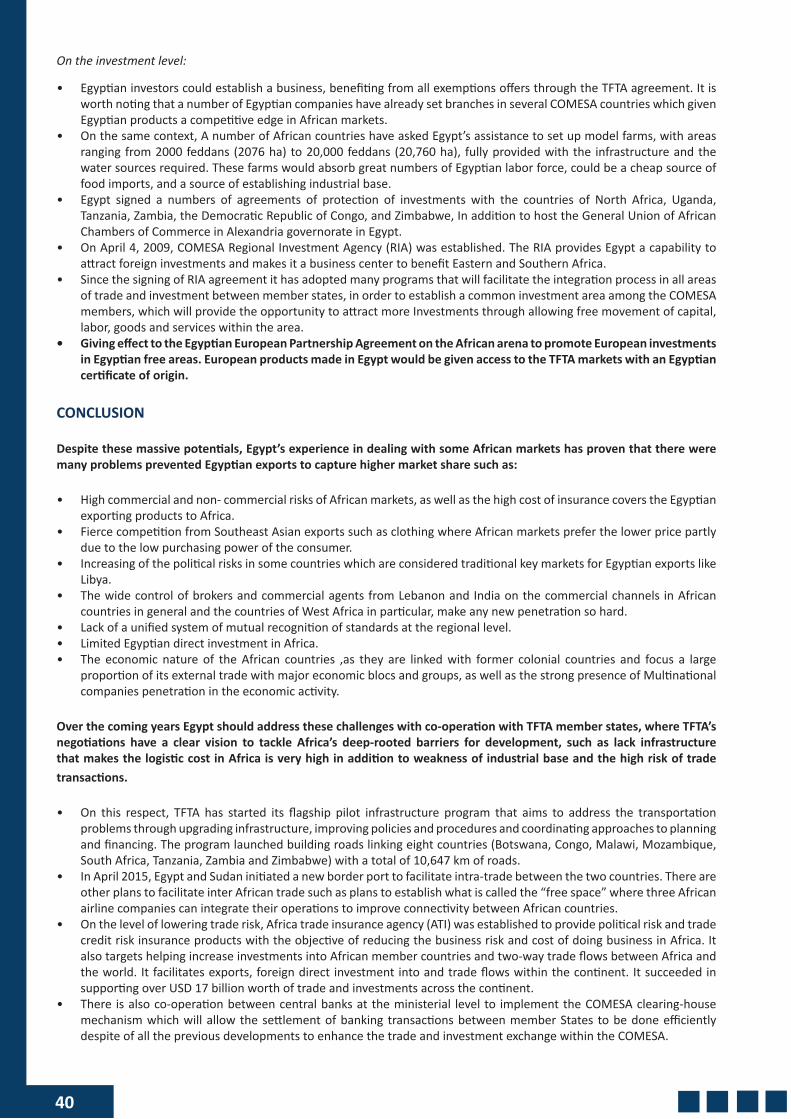
40
On the investment level:
• Egyptian investors could establish a business, benefiting from all exemptions offers through the TFTA agreement. It is worth noting that a number of Egyptian companies have already set branches in several COMESA countries which given Egyptian products a competitive edge in African markets.
• On the same context, A number of African countries have asked Egypt’s assistance to set up model farms, with areas ranging from 2000 feddans (2076 ha) to 20,000 feddans (20,760 ha), fully provided with the infrastructure and the water sources required. These farms would absorb great numbers of Egyptian labor force, could be a cheap source of food imports, and a source of establishing industrial base.
• Egypt signed a numbers of agreements of protection of investments with the countries of North Africa, Uganda, Tanzania, Zambia, the Democratic Republic of Congo, and Zimbabwe, In addition to host the General Union of African Chambers of Commerce in Alexandria governorate in Egypt.
• On April 4, 2009, COMESA Regional Investment Agency (RIA) was established. The RIA provides Egypt a capability to attract foreign investments and makes it a business center to benefit Eastern and Southern Africa.
• Since the signing of RIA agreement it has adopted many programs that will facilitate the integration process in all areas of trade and investment between member states, in order to establish a common investment area among the COMESA members, which will provide the opportunity to attract more Investments through allowing free movement of capital, labor, goods and services within the area.
• Giving effect to the Egyptian European Partnership Agreement on the African arena to promote European investments in Egyptian free areas. European products made in Egypt would be given access to the TFTA markets with an Egyptian certificate of origin.
CONCLUSION
Despite these massive potentials, Egypt’s experience in dealing with some African markets has proven that there were many problems prevented Egyptian exports to capture higher market share such as:
• High commercial and non- commercial risks of African markets, as well as the high cost of insurance covers the Egyptian exporting products to Africa.
• Fierce competition from Southeast Asian exports such as clothing where African markets prefer the lower price partly due to the low purchasing power of the consumer.
• Increasing of the political risks in some countries which are considered traditional key markets for Egyptian exports like Libya.
• The wide control of brokers and commercial agents from Lebanon and India on the commercial channels in African countries in general and the countries of West Africa in particular, make any new penetration so hard.
• Lack of a unified system of mutual recognition of standards at the regional level.• Limited Egyptian direct investment in Africa.• The economic nature of the African countries ,as they are linked with former colonial countries and focus a large
proportion of its external trade with major economic blocs and groups, as well as the strong presence of Multinational companies penetration in the economic activity.
Over the coming years Egypt should address these challenges with co-operation with TFTA member states, where TFTA’s negotiations have a clear vision to tackle Africa’s deep-rooted barriers for development, such as lack infrastructure that makes the logistic cost in Africa is very high in addition to weakness of industrial base and the high risk of trade transactions.
• On this respect, TFTA has started its flagship pilot infrastructure program that aims to address the transportation problems through upgrading infrastructure, improving policies and procedures and coordinating approaches to planning and financing. The program launched building roads linking eight countries (Botswana, Congo, Malawi, Mozambique, South Africa, Tanzania, Zambia and Zimbabwe) with a total of 10,647 km of roads.
• In April 2015, Egypt and Sudan initiated a new border port to facilitate intra-trade between the two countries. There are other plans to facilitate inter African trade such as plans to establish what is called the “free space” where three African airline companies can integrate their operations to improve connectivity between African countries.
• On the level of lowering trade risk, Africa trade insurance agency (ATI) was established to provide political risk and trade credit risk insurance products with the objective of reducing the business risk and cost of doing business in Africa. It also targets helping increase investments into African member countries and two-way trade flows between Africa and the world. It facilitates exports, foreign direct investment into and trade flows within the continent. It succeeded in supporting over USD 17 billion worth of trade and investments across the continent.
• There is also co-operation between central banks at the ministerial level to implement the COMESA clearing-house mechanism which will allow the settlement of banking transactions between member States to be done efficiently despite of all the previous developments to enhance the trade and investment exchange within the COMESA.
41
4 - THE NEW SUEZ CANAL: A BOOST FOR INTERNATIONAL TRADE
INTRODUCTION
The purpose of this section is to highlight the main economic effects involving the shipping, logistics and tourism sector, as well as all the activities directly or indirectly tied to intercontinental maritime shipping, which will stem from the extension of the Suez Canal and from the synergic logistic activities planned by the Egyptian Government coming to completion in the next years. We will assess the impacts resulting from the opening of the New canal on maritime traffic in the Mediterranean and, in particular, on Italian ports. The analysis offers an exhaustive overview of the expanding work in the Suez Canal as well as the enlargement of the ports on the Egyptian Mediterranean and Red Sea coasts which can be the principal beneficiaries of the work along with those overlooking the Gulf. The last part contains a summary of the evaluation of the direct and indirect economic effects, with an insight on maritime and port economy.
THE NEW SUEZ CANAL
The Suez Canal has become the main communication route between Asia and Europe. Every year, about 7% and 8% of the total of the worldwide exchange of goods transits through the canal1. This translates into the movement of 822,9 million of tons of products in 2015 (2014: 822,3 million of tons). The modernization of the Canal, inaugurated in August 2015, through a series of works on a stretch of 72km today allows the simultaneous transit of a greater number of ships, doubling by 50% the capacity of the previous Canal. The works included the excavation of a new 35km long route placed side by side to the old one and the expansion and deepening of the present Canal on a 37km path. Furthermore the current way will be dredged up to the depth of -24 m. The estimated cost for the overall project amounted to USD 8.2 billion. According to the press, the Egyptian Government declared that the investment costs will not affect the Canal fares2. As a result of the works the daily capacity of the Canal increased by up to 97 vessels. The new Canal solves the issues related to the ships’ long waiting times at the entrance of the Canal and at the by-pass points. The estimated average time for anchorage in the roadstead during transit in the Canal was a maximum of 18 hours. The overall navigational time amounts to 12-16 hours. The waiting time is a maximum of 3 hours. Overall, it is estimated a time reduction of half a day.
EXPECTED IMPACTS ON MARITIME TRAFFIC AND THE ECONOMIC EFFECTS
When choosing which routes to cross between Asia and the East Coast of the United States, maritime companies take into account the following strategic elements:• the possibility of getting the most out of the economies of scale in the consumption of bunkers by using large-sized
ships (for example, exceeding the 14,500 TEU limit, the maximum capacity threshold needed to gain access to the new Panama canal, which will be launched in 2016);
• the possibility to direct several routes through the most relevant hubs, of capital importance for the balance of the flows, such as Colombo, Dubai, Port Said, Gioia Tauro, Malta, Algeciras, Tangier;
• the cost of crossing the canals.
The new canal allows for more reliability of the maritime shipping services on every main route, especially thanks to the reduction of waiting times. The traffic which will benefit more from the New Canal is going to be the one related to containerships, which account for the biggest part of predominant traffic, with a tonnage share greater than 50% of the total. With the increase of container traffic and the concentration of supply, the leading maritime companies have become increasingly selective when choosing their ports of call. In an environment rampant with “ship gigantism” and growing oligopolies, it is necessary to change one’s approach to logistic organization between port structures, land-based terminals and multimodal corridors. The ports are also turning into a place filled with industrial activities where one should locate parts of the productive chain with a high added value, which rely on warehouses and services offered by logistic centres. These topics are particularly relevant not only for the arising reality in Egypt, but also because of the gateway ports of Italy, which receive a relevant share of the traffic through Suez. For example, this value amounts to 51% of the containers moved in Genoa, to 47% of the one transiting by the La Spezia port and to 40% by Gioia Tauro. The Suez Canal is crossed by a wide variety of ships which consequently have very different operating costs. We come to estimate that the total value every year is EUR 180 million due to lower operating costs3.The estimates of reduction in annual cost refer to the typical vessels which currently cross the canal (for example, container ships with an average
1 World Shipping Council, The Suez Canal - A vital shortcut for global commerce, 2014.2 Saleh H., “Sisi bolsters nationalist appeal with USD 8 billion Suez Canal investment”, Financial Times, September 1st 2014.3 Further information is available on SRM in collaboration with ALEXBANK research team “The New Suez Canal: Economic Impact on Mediterranean Maritime Trade”, 2015, http://www.srm-maritimeconomy.com/product/the-new-suez-canal-economic-impact-on-mediterranean-maritime-trade/
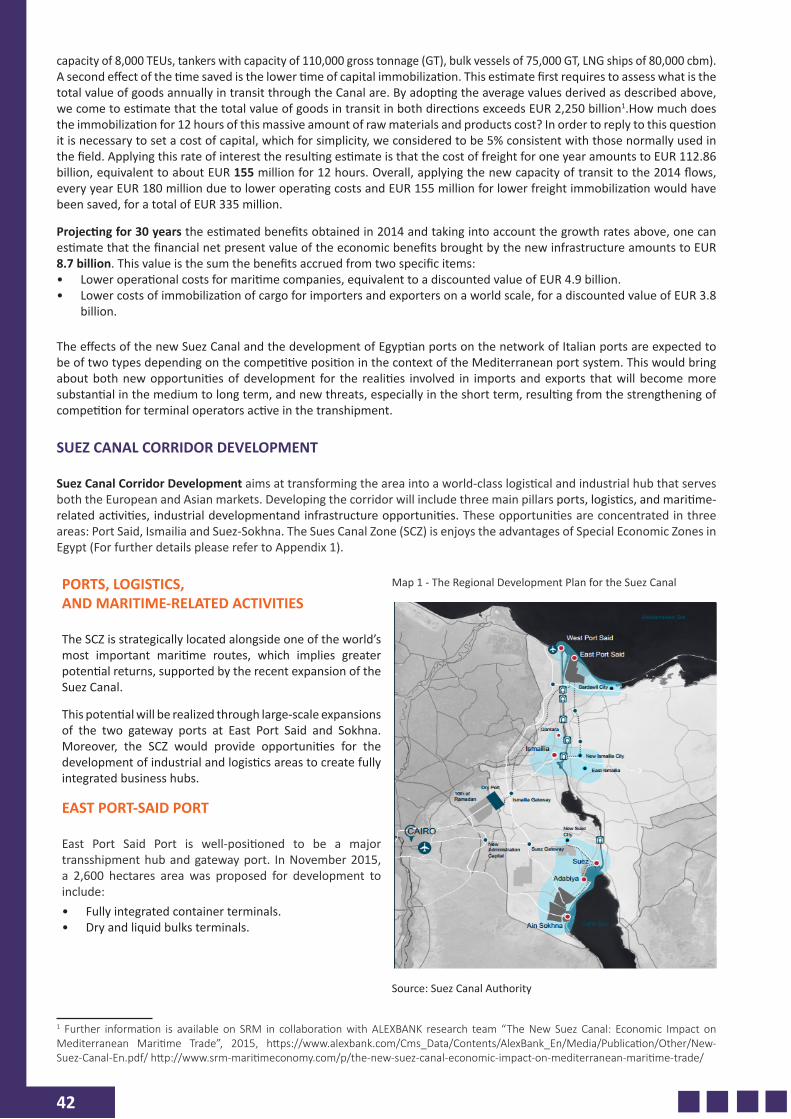
42
capacity of 8,000 TEUs, tankers with capacity of 110,000 gross tonnage (GT), bulk vessels of 75,000 GT, LNG ships of 80,000 cbm). A second effect of the time saved is the lower time of capital immobilization. This estimate first requires to assess what is the total value of goods annually in transit through the Canal are. By adopting the average values derived as described above, we come to estimate that the total value of goods in transit in both directions exceeds EUR 2,250 billion1.How much does the immobilization for 12 hours of this massive amount of raw materials and products cost? In order to reply to this question it is necessary to set a cost of capital, which for simplicity, we considered to be 5% consistent with those normally used in the field. Applying this rate of interest the resulting estimate is that the cost of freight for one year amounts to EUR 112.86 billion, equivalent to about EUR 155 million for 12 hours. Overall, applying the new capacity of transit to the 2014 flows, every year EUR 180 million due to lower operating costs and EUR 155 million for lower freight immobilization would have been saved, for a total of EUR 335 million.
Projecting for 30 years the estimated benefits obtained in 2014 and taking into account the growth rates above, one can estimate that the financial net present value of the economic benefits brought by the new infrastructure amounts to EUR 8.7 billion. This value is the sum the benefits accrued from two specific items: • Lower operational costs for maritime companies, equivalent to a discounted value of EUR 4.9 billion. • Lower costs of immobilization of cargo for importers and exporters on a world scale, for a discounted value of EUR 3.8
billion.
The effects of the new Suez Canal and the development of Egyptian ports on the network of Italian ports are expected to be of two types depending on the competitive position in the context of the Mediterranean port system. This would bring about both new opportunities of development for the realities involved in imports and exports that will become more substantial in the medium to long term, and new threats, especially in the short term, resulting from the strengthening of competition for terminal operators active in the transhipment.
SUEZ CANAL CORRIDOR DEVELOPMENT
Suez Canal Corridor Development aims at transforming the area into a world-class logistical and industrial hub that serves both the European and Asian markets. Developing the corridor will include three main pillars ports, logistics, and maritime-related activities, industrial development and infrastructure opportunities. These opportunities are concentrated in three areas: Port Said, Ismailia and Suez-Sokhna. The Sues Canal Zone (SCZ) is enjoys the advantages of Special Economic Zones in Egypt (For further details please refer to Appendix 1).
PORTS, LOGISTICS, AND MARITIME-RELATED ACTIVITIES The SCZ is strategically located alongside one of the world’s most important maritime routes, which implies greater potential returns, supported by the recent expansion of the Suez Canal.
This potential will be realized through large-scale expansions of the two gateway ports at East Port Said and Sokhna. Moreover, the SCZ would provide opportunities for the development of industrial and logistics areas to create fully integrated business hubs.
EAST PORT-SAID PORT
East Port Said Port is well-positioned to be a major transshipment hub and gateway port. In November 2015, a 2,600 hectares area was proposed for development to include: • Fully integrated container terminals.• Dry and liquid bulks terminals.
Map 1 - The Regional Development Plan for the Suez Canal
Source: Suez Canal Authority
1 Further information is available on SRM in collaboration with ALEXBANK research team “The New Suez Canal: Economic Impact on Mediterranean Maritime Trade”, 2015, https://www.alexbank.com/Cms_Data/Contents/AlexBank_En/Media/Publication/Other/New-Suez-Canal-En.pdf/ http://www.srm-maritimeconomy.com/p/the-new-suez-canal-economic-impact-on-mediterranean-maritime-trade/
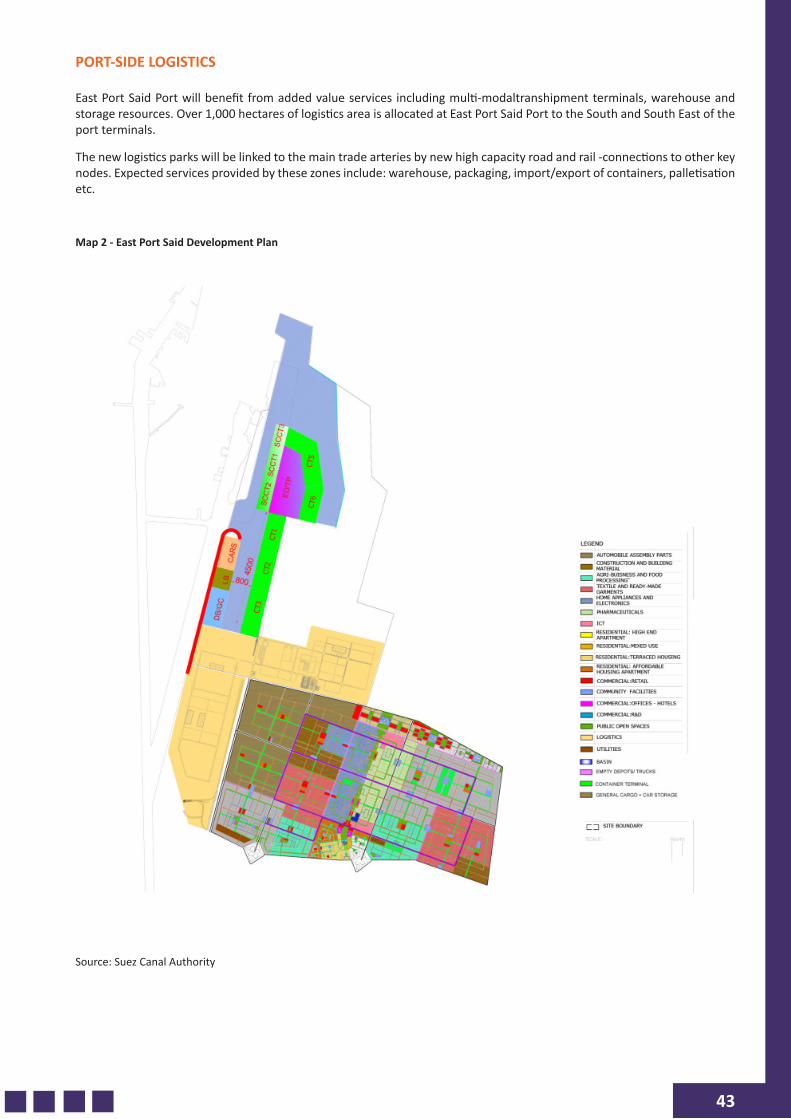
43
PORT-SIDE LOGISTICS
East Port Said Port will benefit from added value services including multi-modaltranshipment terminals, warehouse and storage resources. Over 1,000 hectares of logistics area is allocated at East Port Said Port to the South and South East of the port terminals.
The new logistics parks will be linked to the main trade arteries by new high capacity road and rail -connections to other key nodes. Expected services provided by these zones include: warehouse, packaging, import/export of containers, palletisation etc.
Map 2 - East Port Said Development Plan
Source: Suez Canal Authority
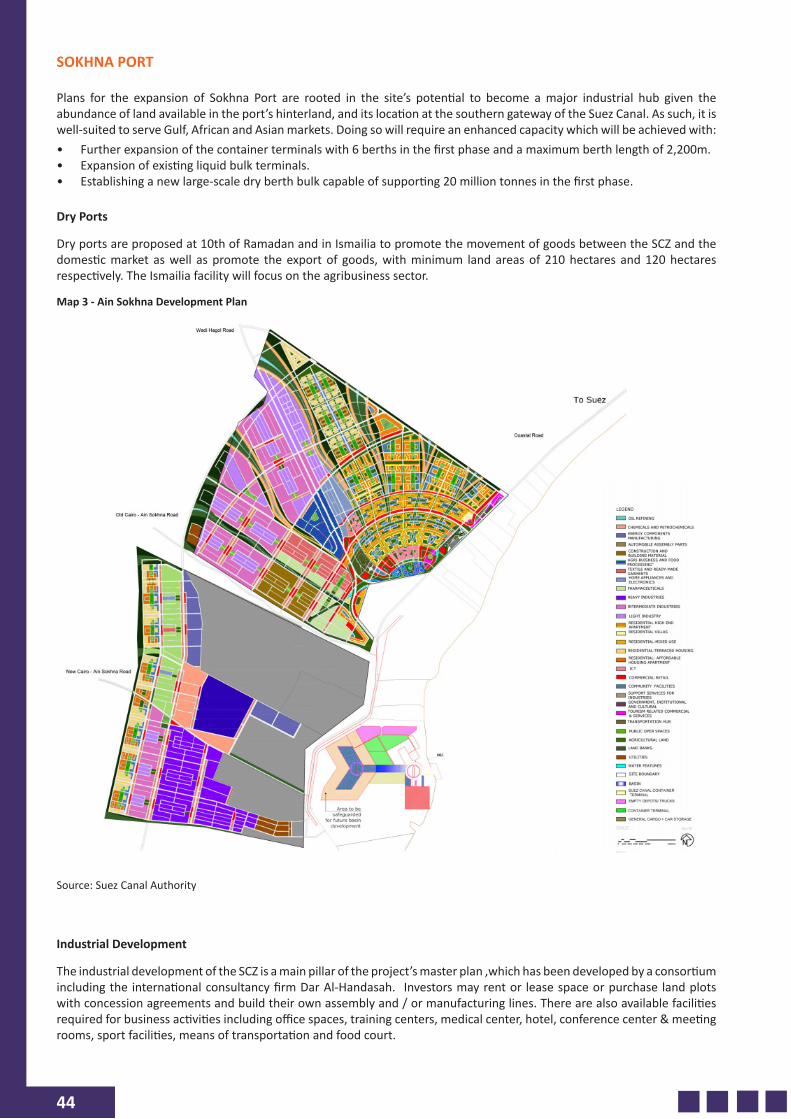
44
SOKHNA PORT
Plans for the expansion of Sokhna Port are rooted in the site’s potential to become a major industrial hub given the abundance of land available in the port’s hinterland, and its location at the southern gateway of the Suez Canal. As such, it is well-suited to serve Gulf, African and Asian markets. Doing so will require an enhanced capacity which will be achieved with: • Further expansion of the container terminals with 6 berths in the first phase and a maximum berth length of 2,200m. • Expansion of existing liquid bulk terminals. • Establishing a new large-scale dry berth bulk capable of supporting 20 million tonnes in the first phase.
Dry Ports
Dry ports are proposed at 10th of Ramadan and in Ismailia to promote the movement of goods between the SCZ and the domestic market as well as promote the export of goods, with minimum land areas of 210 hectares and 120 hectares respectively. The Ismailia facility will focus on the agribusiness sector.
Map 3 - Ain Sokhna Development Plan
Source: Suez Canal Authority
Industrial Development
The industrial development of the SCZ is a main pillar of the project’s master plan ,which has been developed by a consortium including the international consultancy firm Dar Al-Handasah. Investors may rent or lease space or purchase land plots with concession agreements and build their own assembly and / or manufacturing lines. There are also available facilities required for business activities including office spaces, training centers, medical center, hotel, conference center & meeting rooms, sport facilities, means of transportation and food court.
45
EAST PORT SAID
The East Port Said Port and Industrial Development Complex will be Egypt’s foremost transhipment hub, about 4,000 hectares available for development as follows:• 3.800 hectares: allocated to light and medium manufacturing activities (around 80% of total developable land).
Opportunities identified in automotive parts and vehicle assembly. Pharmaceuticals, agribusiness, textiles and consumer electronics.
• 100 hectares: for commercial uses including offices, hotels business parks ICT and R&D activities.• 130 hectares: for retail space.• 273 hectares: of residential development with a total of 104.000 housing units.• 435 hectares: of green and open spaces.
QANT ARA
Qantara is a vibrant and thriving mixed-use residential community set in the agricultural heartland of Ismailia, with about 670 hectares available for development as follows:
• 153 hectares: Allocated to light and medium manufacturing activities including textiles, consumer electronics and general manufacturing.
• 21.5 hectares: For commercial uses including offices, business parks, ICT and R&D.• 70 hectares: For retail space.• 80 hectares: For community facilities.• 300 hectares: Of green and open spaces.
AIN SOKHNA
Ain Sokhna Port and Industrial Zone is Egypt’s main gateway to the GCC, East Africa and Asia , with about 8,000 hectares available for development as follows:
• 4,000 hectares: for high and medium manufacturing activities. Strong opportunities in construction and building materials, automotive parts and vehicle assembly, consumer electronics and home appliances.
• 2,260 hectares: for heavy manufacturing including oil refining and petrochemicals.• 325 hectares: for commercial uses including offices, business parks, ICT and R&D activities.• 1,616 hectares: of residential development with over 202,000 housing unit capacity.
Infrastructure Opportunities
Investments in these zones will be supported by new transport and infrastructure linkages including:
• A new major expressway linking East Port Said to the regional network. • 6 new road and rail tunnels to increase cross canal connectivity. • Power, water and telecommunication networks to support integrated development.
A POSITIVE OUTLOOK
The Egyptian government expects that the project’s second phase, which includes developing the Suez Canal area, would create 1 million job opportunities and generate about USD 100 billion revenues.
Egypt is one of the best countries worldwide in terms of logistics performance as it ranked the 19th out of 157 countries in the UNCTAD’s Liner Shipping Connectivity Index for 2014. Egypt’s position is expected to further improve after opening the new canal, which would positively impact the per capita income that is correlated to logistics performance. The index measures competitiveness in the maritime system in general.
Global trade is expected to grow 8% a year by 2017-20 as the global economy strengthens, reversing the weak growth recorded over the past few years, with the value of goods exported globally has grown on average by only around 1.5% a year in 2012-14.
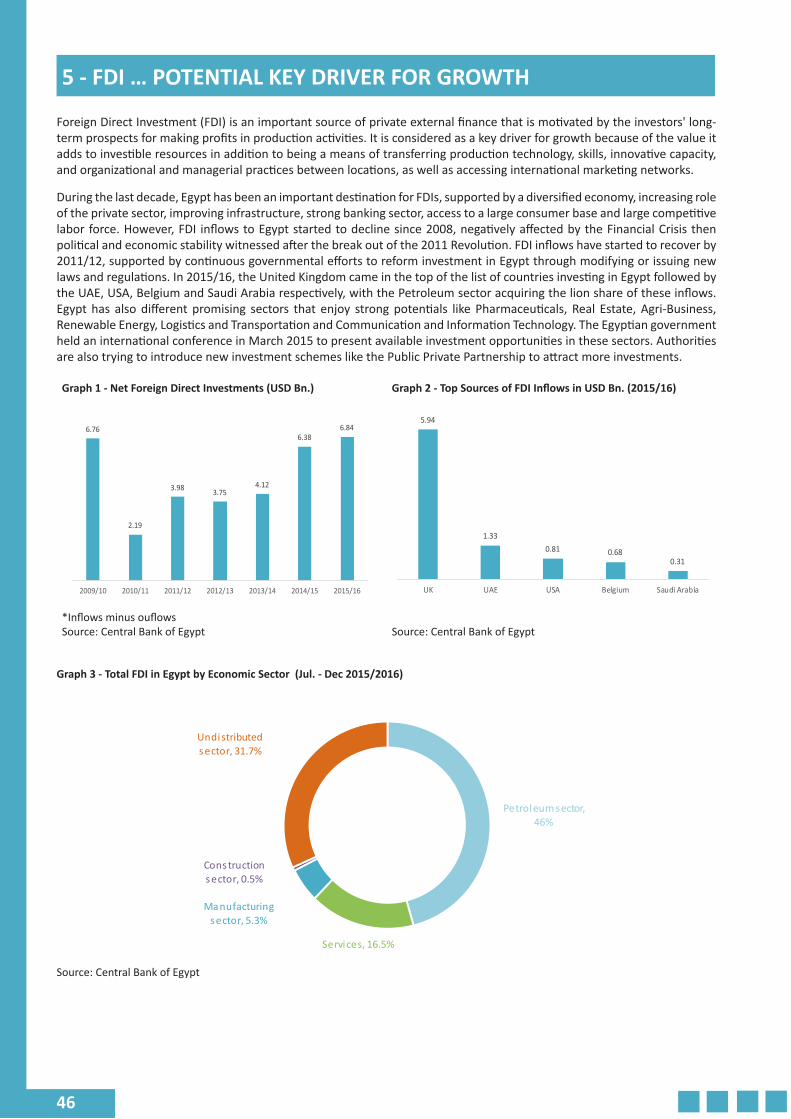
46
5 - FDI … POTENTIAL KEY DRIVER FOR GROWTH
Foreign Direct Investment (FDI) is an important source of private external finance that is motivated by the investors' long-term prospects for making profits in production activities. It is considered as a key driver for growth because of the value it adds to investible resources in addition to being a means of transferring production technology, skills, innovative capacity, and organizational and managerial practices between locations, as well as accessing international marketing networks.
During the last decade, Egypt has been an important destination for FDIs, supported by a diversified economy, increasing role of the private sector, improving infrastructure, strong banking sector, access to a large consumer base and large competitive labor force. However, FDI inflows to Egypt started to decline since 2008, negatively affected by the Financial Crisis then political and economic stability witnessed after the break out of the 2011 Revolution. FDI inflows have started to recover by 2011/12, supported by continuous governmental efforts to reform investment in Egypt through modifying or issuing new laws and regulations. In 2015/16, the United Kingdom came in the top of the list of countries investing in Egypt followed by the UAE, USA, Belgium and Saudi Arabia respectively, with the Petroleum sector acquiring the lion share of these inflows. Egypt has also different promising sectors that enjoy strong potentials like Pharmaceuticals, Real Estate, Agri-Business, Renewable Energy, Logistics and Transportation and Communication and Information Technology. The Egyptian government held an international conference in March 2015 to present available investment opportunities in these sectors. Authorities are also trying to introduce new investment schemes like the Public Private Partnership to attract more investments.
Graph 1 - Net Foreign Direct Investments (USD Bn.) Graph 2 - Top Sources of FDI Inflows in USD Bn. (2015/16)
6.76
2.19
3.98 3.754.12
6.386.84
2009/10 2010/11 2011/12 2012/13 2013/14 2014/15 2015/16
*Inflows minus ouflowsSource: Central Bank of Egypt Source: Central Bank of Egypt
Graph 3 - Total FDI in Egypt by Economic Sector (Jul. - Dec 2015/2016)
Petroleum sector, 46%
Services, 16.5%
Manufacturing sector, 5.3%
Construction sector, 0.5%
Undistributed sector, 31.7%
Source: Central Bank of Egypt
5.94
1.330.81 0.68
0.31
UK UAE USA Belgium Saudi Arabia
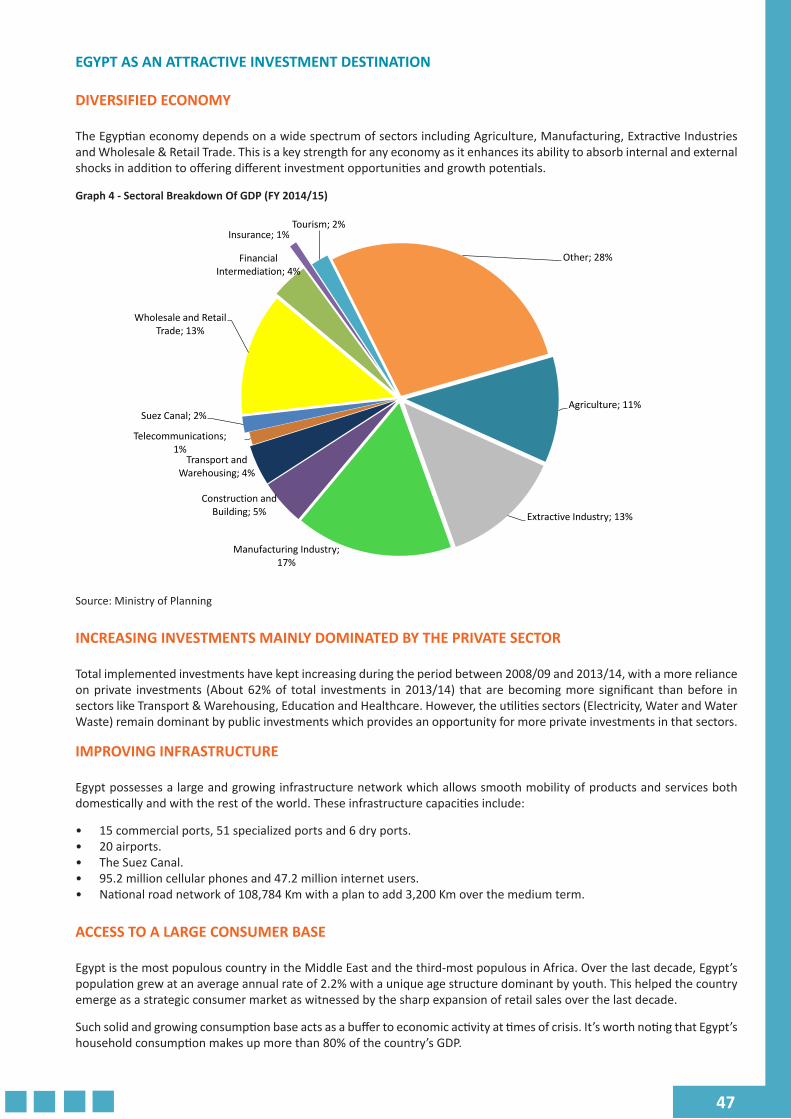
47
EGYPT AS AN ATTRACTIVE INVESTMENT DESTINATION
DIVERSIFIED ECONOMY
The Egyptian economy depends on a wide spectrum of sectors including Agriculture, Manufacturing, Extractive Industries and Wholesale & Retail Trade. This is a key strength for any economy as it enhances its ability to absorb internal and external shocks in addition to offering different investment opportunities and growth potentials.
Graph 4 - Sectoral Breakdown Of GDP (FY 2014/15)
Agriculture; 11%
Extractive Industry; 13%
Manufacturing Industry; 17%
Construction and Building; 5%
Transport and Warehousing; 4%
Telecommunications; 1%
Suez Canal; 2%
Wholesale and Retail Trade; 13%
Financial Intermediation; 4%
Insurance; 1% Tourism; 2%
Other; 28%
Source: Ministry of Planning
INCREASING INVESTMENTS MAINLY DOMINATED BY THE PRIVATE SECTOR
Total implemented investments have kept increasing during the period between 2008/09 and 2013/14, with a more reliance on private investments (About 62% of total investments in 2013/14) that are becoming more significant than before in sectors like Transport & Warehousing, Education and Healthcare. However, the utilities sectors (Electricity, Water and Water Waste) remain dominant by public investments which provides an opportunity for more private investments in that sectors.
IMPROVING INFRASTRUCTURE
Egypt possesses a large and growing infrastructure network which allows smooth mobility of products and services both domestically and with the rest of the world. These infrastructure capacities include:
• 15 commercial ports, 51 specialized ports and 6 dry ports.• 20 airports.• The Suez Canal.• 95.2 million cellular phones and 47.2 million internet users. • National road network of 108,784 Km with a plan to add 3,200 Km over the medium term.
ACCESS TO A LARGE CONSUMER BASE
Egypt is the most populous country in the Middle East and the third-most populous in Africa. Over the last decade, Egypt’s population grew at an average annual rate of 2.2% with a unique age structure dominant by youth. This helped the country emerge as a strategic consumer market as witnessed by the sharp expansion of retail sales over the last decade.
Such solid and growing consumption base acts as a buffer to economic activity at times of crisis. It’s worth noting that Egypt’s household consumption makes up more than 80% of the country’s GDP.
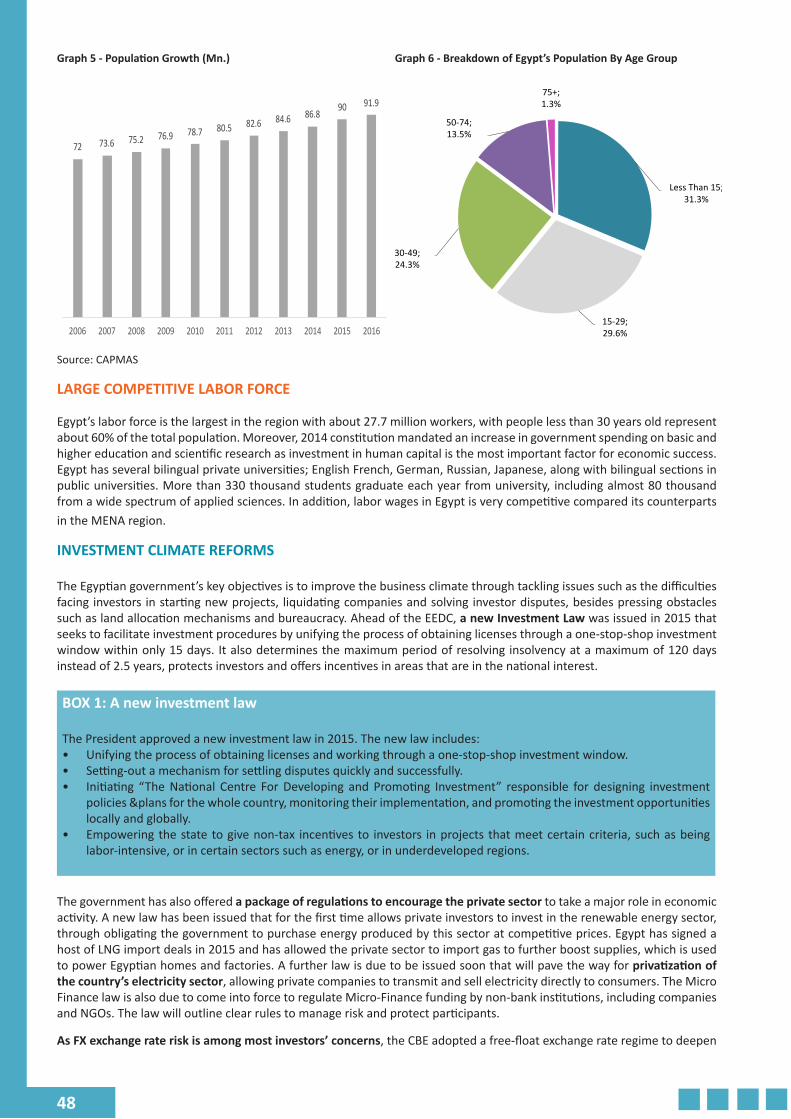
48
Graph 5 - Population Growth (Mn.) Graph 6 - Breakdown of Egypt’s Population By Age Group
72 73.6 75.2 76.9 78.7 80.5 82.6 84.6 86.890 91.9
2006 2007 2008 2009 2010 2011 2012 2013 2014 2015 2016
Less Than 15; 31.3%
15-29; 29.6%
30-49; 24.3%
50-74; 13.5%
75+;1.3%
Source: CAPMAS
LARGE COMPETITIVE LABOR FORCE
Egypt’s labor force is the largest in the region with about 27.7 million workers, with people less than 30 years old represent about 60% of the total population. Moreover, 2014 constitution mandated an increase in government spending on basic and higher education and scientific research as investment in human capital is the most important factor for economic success. Egypt has several bilingual private universities; English French, German, Russian, Japanese, along with bilingual sections in public universities. More than 330 thousand students graduate each year from university, including almost 80 thousand from a wide spectrum of applied sciences. In addition, labor wages in Egypt is very competitive compared its counterparts in the MENA region.
INVESTMENT CLIMATE REFORMS
The Egyptian government’s key objectives is to improve the business climate through tackling issues such as the difficulties facing investors in starting new projects, liquidating companies and solving investor disputes, besides pressing obstacles such as land allocation mechanisms and bureaucracy. Ahead of the EEDC, a new Investment Law was issued in 2015 that seeks to facilitate investment procedures by unifying the process of obtaining licenses through a one-stop-shop investment window within only 15 days. It also determines the maximum period of resolving insolvency at a maximum of 120 days instead of 2.5 years, protects investors and offers incentives in areas that are in the national interest.
BOX 1: A new investment law
The President approved a new investment law in 2015. The new law includes:• Unifying the process of obtaining licenses and working through a one-stop-shop investment window.• Setting-out a mechanism for settling disputes quickly and successfully.• Initiating “The National Centre For Developing and Promoting Investment” responsible for designing investment
policies &plans for the whole country, monitoring their implementation, and promoting the investment opportunities locally and globally.
• Empowering the state to give non-tax incentives to investors in projects that meet certain criteria, such as being labor-intensive, or in certain sectors such as energy, or in underdeveloped regions.
The government has also offered a package of regulations to encourage the private sector to take a major role in economic activity. A new law has been issued that for the first time allows private investors to invest in the renewable energy sector, through obligating the government to purchase energy produced by this sector at competitive prices. Egypt has signed a host of LNG import deals in 2015 and has allowed the private sector to import gas to further boost supplies, which is used to power Egyptian homes and factories. A further law is due to be issued soon that will pave the way for privatization of the country’s electricity sector, allowing private companies to transmit and sell electricity directly to consumers. The Micro Finance law is also due to come into force to regulate Micro-Finance funding by non-bank institutions, including companies and NGOs. The law will outline clear rules to manage risk and protect participants.
As FX exchange rate risk is among most investors’ concerns, the CBE adopted a free-float exchange rate regime to deepen
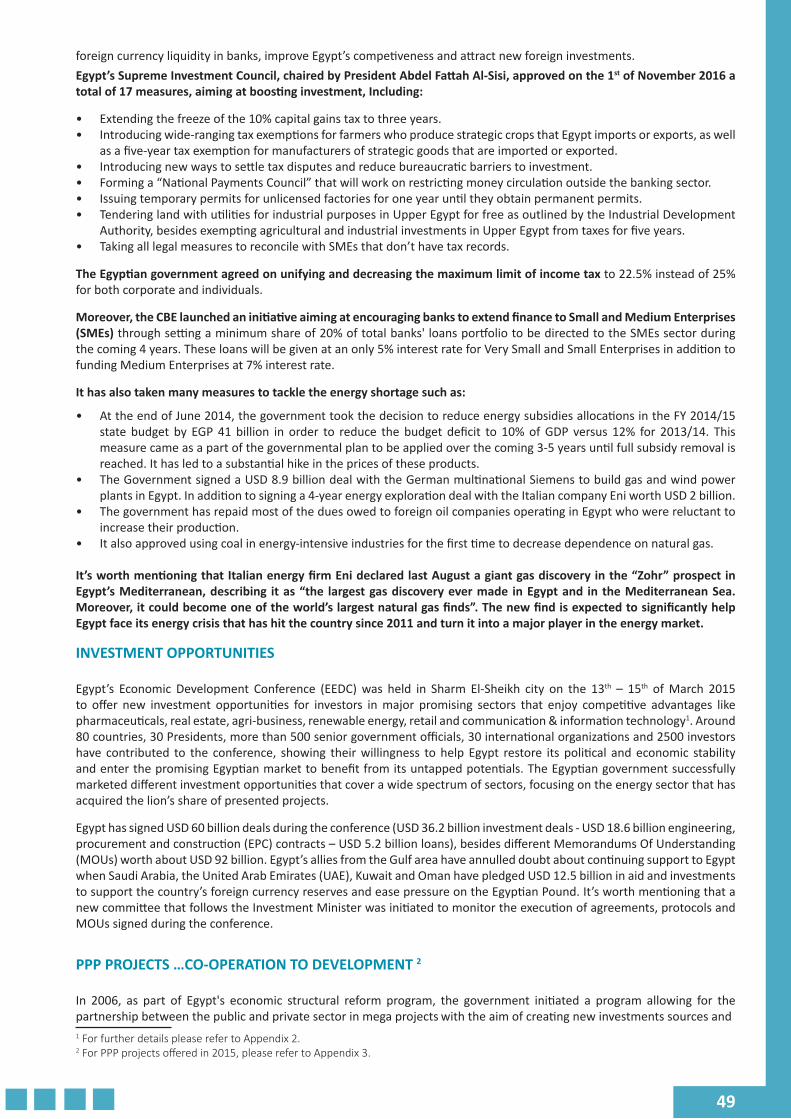
49
foreign currency liquidity in banks, improve Egypt’s competiveness and attract new foreign investments.Egypt’s Supreme Investment Council, chaired by President Abdel Fattah Al-Sisi, approved on the 1st of November 2016 a total of 17 measures, aiming at boosting investment, Including:
• Extending the freeze of the 10% capital gains tax to three years.• Introducing wide-ranging tax exemptions for farmers who produce strategic crops that Egypt imports or exports, as well
as a five-year tax exemption for manufacturers of strategic goods that are imported or exported.• Introducing new ways to settle tax disputes and reduce bureaucratic barriers to investment.• Forming a “National Payments Council” that will work on restricting money circulation outside the banking sector.• Issuing temporary permits for unlicensed factories for one year until they obtain permanent permits.• Tendering land with utilities for industrial purposes in Upper Egypt for free as outlined by the Industrial Development
Authority, besides exempting agricultural and industrial investments in Upper Egypt from taxes for five years.• Taking all legal measures to reconcile with SMEs that don’t have tax records.
The Egyptian government agreed on unifying and decreasing the maximum limit of income tax to 22.5% instead of 25% for both corporate and individuals.
Moreover, the CBE launched an initiative aiming at encouraging banks to extend finance to Small and Medium Enterprises (SMEs) through setting a minimum share of 20% of total banks' loans portfolio to be directed to the SMEs sector during the coming 4 years. These loans will be given at an only 5% interest rate for Very Small and Small Enterprises in addition to funding Medium Enterprises at 7% interest rate.
It has also taken many measures to tackle the energy shortage such as:
• At the end of June 2014, the government took the decision to reduce energy subsidies allocations in the FY 2014/15 state budget by EGP 41 billion in order to reduce the budget deficit to 10% of GDP versus 12% for 2013/14. This measure came as a part of the governmental plan to be applied over the coming 3-5 years until full subsidy removal is reached. It has led to a substantial hike in the prices of these products.
• The Government signed a USD 8.9 billion deal with the German multinational Siemens to build gas and wind power plants in Egypt. In addition to signing a 4-year energy exploration deal with the Italian company Eni worth USD 2 billion.
• The government has repaid most of the dues owed to foreign oil companies operating in Egypt who were reluctant to increase their production.
• It also approved using coal in energy-intensive industries for the first time to decrease dependence on natural gas.
It’s worth mentioning that Italian energy firm Eni declared last August a giant gas discovery in the “Zohr” prospect in Egypt’s Mediterranean, describing it as “the largest gas discovery ever made in Egypt and in the Mediterranean Sea. Moreover, it could become one of the world’s largest natural gas finds”. The new find is expected to significantly help Egypt face its energy crisis that has hit the country since 2011 and turn it into a major player in the energy market.
INVESTMENT OPPORTUNITIES
Egypt’s Economic Development Conference (EEDC) was held in Sharm El-Sheikh city on the 13th – 15th of March 2015 to offer new investment opportunities for investors in major promising sectors that enjoy competitive advantages like pharmaceuticals, real estate, agri-business, renewable energy, retail and communication & information technology1. Around 80 countries, 30 Presidents, more than 500 senior government officials, 30 international organizations and 2500 investors have contributed to the conference, showing their willingness to help Egypt restore its political and economic stability and enter the promising Egyptian market to benefit from its untapped potentials. The Egyptian government successfully marketed different investment opportunities that cover a wide spectrum of sectors, focusing on the energy sector that has acquired the lion’s share of presented projects.
Egypt has signed USD 60 billion deals during the conference (USD 36.2 billion investment deals - USD 18.6 billion engineering, procurement and construction (EPC) contracts – USD 5.2 billion loans), besides different Memorandums Of Understanding (MOUs) worth about USD 92 billion. Egypt’s allies from the Gulf area have annulled doubt about continuing support to Egypt when Saudi Arabia, the United Arab Emirates (UAE), Kuwait and Oman have pledged USD 12.5 billion in aid and investments to support the country’s foreign currency reserves and ease pressure on the Egyptian Pound. It’s worth mentioning that a new committee that follows the Investment Minister was initiated to monitor the execution of agreements, protocols and MOUs signed during the conference.
PPP PROJECTS …CO-OPERATION TO DEVELOPMENT 2
In 2006, as part of Egypt's economic structural reform program, the government initiated a program allowing for the partnership between the public and private sector in mega projects with the aim of creating new investments sources and1 For further details please refer to Appendix 2.2 For PPP projects offered in 2015, please refer to Appendix 3.
50
facilitating finance to the needed infrastructure projects along with curbing the government's spending on public services and projects, involving the private sector in the local development processes, without losing its control over these facilities during the operation phase and until the state retains these projects at the end of the contract term. The PPP projects have a numerous number of benefits for the private investor, being local or foreign one, where the project risks are shared between the two parties, allowing the private investor to take part in mega projects that he/she can't bear their costs alone, thus enabling the investor to tap new markets not available before, not to forget also that the government will facilitate all legal and administrative procedures for its private sector partners. The program Egypt has adopted was able to create new sustainable long term finance for the state either being domestic or local finance, injecting fresh job opportunities to the market, and making the best use of specialties and experiences the private sector enjoys, thus enhancing the overall quality and efficiency of these facilities with special focus on the public infrastructure projects.
For the purpose of efficiently implement the new Public-Private Partnership (PPP) mechanism, the government established the PPP central unit at the Finance Ministry with the responsibility of acting as the government's main interface in the coordination between different ministries, public authorities, and the private sector concerning the first initiation of PPP projects, providing necessary technical, legal and administrative assistance in cooperation with both Egyptian and foreign professionals. The PPP unit is also responsible for the implementation of the Law No.67 for 2010 (The PPP Law) which provides a framework for the obtainment of infrastructure projects as well as other utility projects and services under the Public Private Partnership model. Furthermore, the Supreme Committee for PPP Affairs, chaired by the Prime Minister, is in charge with overseeing national policy and general approaches towards PPPs in the coming period. The coming period will see the government utilizing the PPP tool more in order to enhance the role of the private sector in development. Between 1990 and 2005 the private sector took part in partnerships with the public sector in a number of sectors including (telecommunications, transportation, water and sanitation) in around 20 projects at an overall investment of USD7.5 billion.
More recently, the government has launched the construction and operation of schools as part of a program that aims to build in 2210 a new school, and new projects for wastewater treatment in Cairo and the Burj Al Arab, pumping billions of dollars in new road projects to facilitate traffic between the north and south, and between industrial areas and ports. At the beginning of 2016, the ministry of Telecommunication launched its plan for the participation with the private sector in a number of projects worth around EGP1 billion in a number of sectors including the automation of the public services such as health, education and transportation throughout the next 10 years.
The Housing Ministry has also prepared an investment strategy during 2016, which included the signing of 4 contracts worth EGP130 billion with Mountain View, the Saudi Sisban Holding, Arabia for real estate development, and Palm Hills for the development of around 2027 fedans in New cairo and 6th of October City. The Housing Minister has also proposed around 22 projects on the Saudi Arabian investors in the new administrative capital, Cairo, and 6th of October and other cities during the latest meeting of the Egyptian-Saudi Coordination Council. The PPP unit has launched a number of projects with the private sector in a number of sectors such as (health, education, infrastructure, etc.) at an estimated investment costs of EGP6.9 billion, which included the Abu Rawash Drainage Water Treatment Plant that was signed in November 2015 and awarded to Orascom Construction Company, the Smouha Maternity University Hospital and a Blood Bank Project, that was signed in April 2012 for Bareeq Hospitals Consortium, while other projects are still not signed such as the Maadi Technological Area Project, qualifying, reorganization and mechanization of the notary public offices and the qualifying and reorganization of the Commercial Registry Offices.
Other projects that are yet to be launched during the FY 2015/16 includes the Red Sea Desalination Plant in Tur City, Greater Cairo River Bus Development Project, Developing Safaga Mining Port (Abu Tartour) to be an industrial mining port, with an overall estimated investment of EGP4.15 billion. The PPP unit is also preparing for launching future projects in partnership with the private sector during the next fiscal year with an overall estimated investment exceeding EGP 4 billion. In the transport sector alone, it is expected to pump USD 16.45 billion in PPP investments in order to improve railways, roads, ports and transport indigo level over the next five years. Around USD9.14 billion of private sector investments will be pumped in ports; USD 5.48 billion in the construction and development of roads and USD3.66 billion in the railway. Worth noting that full details of these projects including the description, investment cost, duration and winners are listed in the third appendix at the end of the study.
ITALIAN EGYPTIAN ECONOMIC RELATIONS
This chapter deals with the economic relations between Italy and Egypt. In particular, five aspects have been studied: 1) trade (imports and exports) relations between Italy and Egypt; 2) Italy’s Manufacturing exports to Egypt with a sectorial breakdown and the 2014-2017 scenario; 3) the dynamic of the value of Italy’s Foreign Direct investment (FDI) in Egypt; 4) Italy’s business presence in Egypt in terms of number of companies, number of persons employed in these companies and total turnover generated by them; 5) The performances (in terms of growth, profitability and financial soundness) of a sample of Italian companies in Egypt.
TRADEThis paragraph analyses Italy’s trade (imports and exports) with Egypt during the period between 2011 and 2015. Imports-
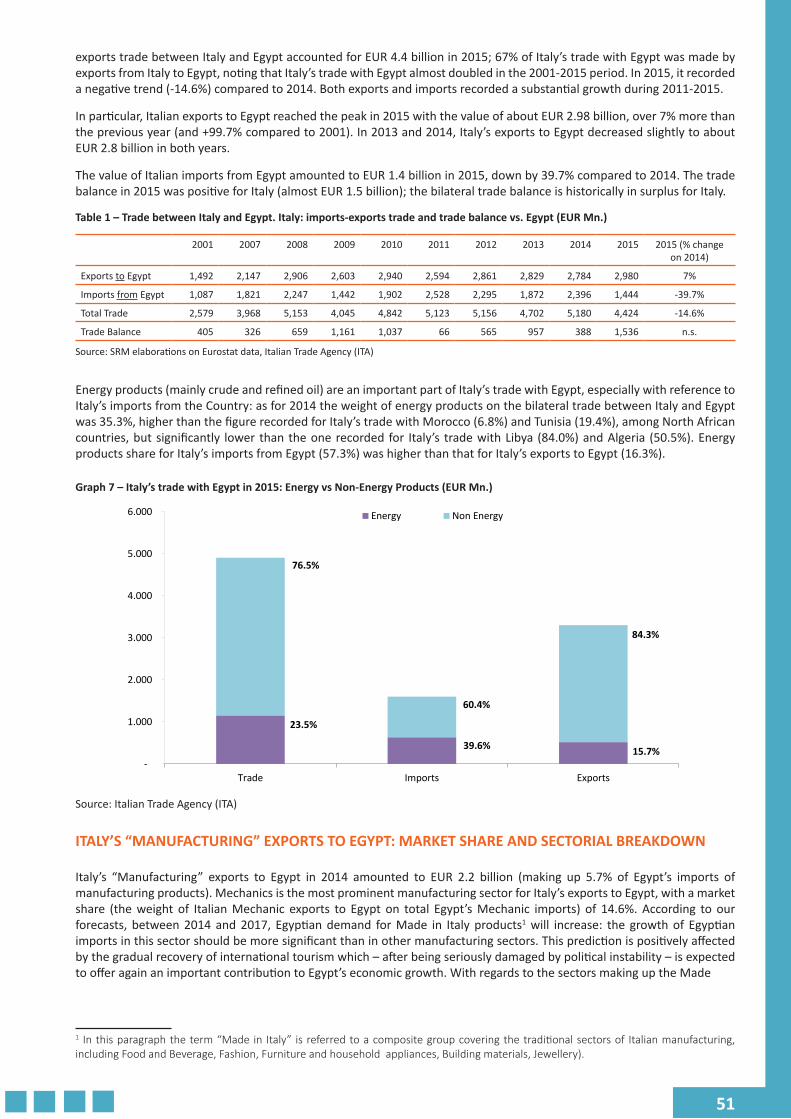
51
exports trade between Italy and Egypt accounted for EUR 4.4 billion in 2015; 67% of Italy’s trade with Egypt was made by exports from Italy to Egypt, noting that Italy’s trade with Egypt almost doubled in the 2001-2015 period. In 2015, it recorded a negative trend (-14.6%) compared to 2014. Both exports and imports recorded a substantial growth during 2011-2015.
In particular, Italian exports to Egypt reached the peak in 2015 with the value of about EUR 2.98 billion, over 7% more than the previous year (and +99.7% compared to 2001). In 2013 and 2014, Italy’s exports to Egypt decreased slightly to about EUR 2.8 billion in both years.
The value of Italian imports from Egypt amounted to EUR 1.4 billion in 2015, down by 39.7% compared to 2014. The trade balance in 2015 was positive for Italy (almost EUR 1.5 billion); the bilateral trade balance is historically in surplus for Italy.
Table 1 – Trade between Italy and Egypt. Italy: imports-exports trade and trade balance vs. Egypt (EUR Mn.)
2001 2007 2008 2009 2010 2011 2012 2013 2014 2015 2015 (% change on 2014)
Exports to Egypt 1,492 2,147 2,906 2,603 2,940 2,594 2,861 2,829 2,784 2,980 7%
Imports from Egypt 1,087 1,821 2,247 1,442 1,902 2,528 2,295 1,872 2,396 1,444 -39.7%
Total Trade 2,579 3,968 5,153 4,045 4,842 5,123 5,156 4,702 5,180 4,424 -14.6%
Trade Balance 405 326 659 1,161 1,037 66 565 957 388 1,536 n.s.
Source: SRM elaborations on Eurostat data, Italian Trade Agency (ITA)
Energy products (mainly crude and refined oil) are an important part of Italy’s trade with Egypt, especially with reference to Italy’s imports from the Country: as for 2014 the weight of energy products on the bilateral trade between Italy and Egypt was 35.3%, higher than the figure recorded for Italy’s trade with Morocco (6.8%) and Tunisia (19.4%), among North African countries, but significantly lower than the one recorded for Italy’s trade with Libya (84.0%) and Algeria (50.5%). Energy products share for Italy’s imports from Egypt (57.3%) was higher than that for Italy’s exports to Egypt (16.3%).
Graph 7 – Italy’s trade with Egypt in 2015: Energy vs Non-Energy Products (EUR Mn.)
23.5%
39.6% 15.7%
76.5%
60.4%
84.3%
-
1.000
2.000
3.000
4.000
5.000
6.000
Trade Imports Exports
Energy Non Energy
Source: Italian Trade Agency (ITA)
ITALY’S “MANUFACTURING” EXPORTS TO EGYPT: MARKET SHARE AND SECTORIAL BREAKDOWN
Italy’s “Manufacturing” exports to Egypt in 2014 amounted to EUR 2.2 billion (making up 5.7% of Egypt’s imports of manufacturing products). Mechanics is the most prominent manufacturing sector for Italy’s exports to Egypt, with a market share (the weight of Italian Mechanic exports to Egypt on total Egypt’s Mechanic imports) of 14.6%. According to our forecasts, between 2014 and 2017, Egyptian demand for Made in Italy products1 will increase: the growth of Egyptian imports in this sector should be more significant than in other manufacturing sectors. This prediction is positively affected by the gradual recovery of international tourism which – after being seriously damaged by political instability – is expected to offer again an important contribution to Egypt’s economic growth. With regards to the sectors making up the Made
1 In this paragraph the term “Made in Italy” is referred to a composite group covering the traditional sectors of Italian manufacturing, including Food and Beverage, Fashion, Furniture and household appliances, Building materials, Jewellery).
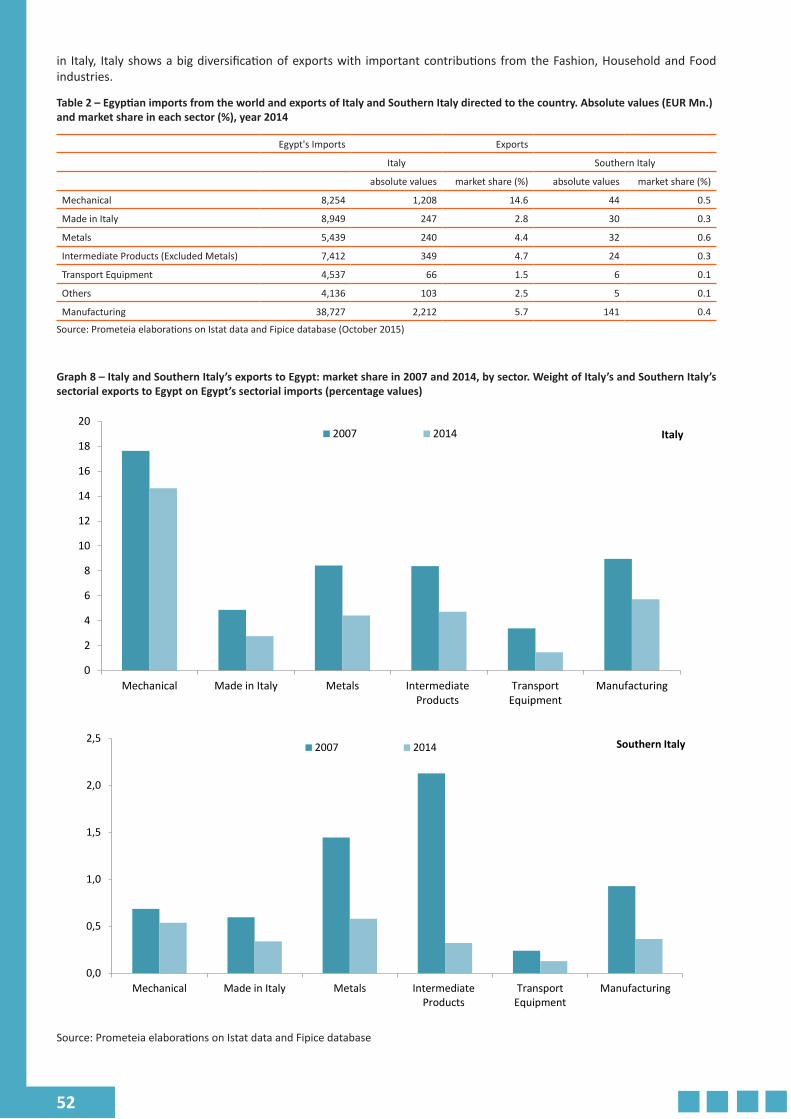
52
in Italy, Italy shows a big diversification of exports with important contributions from the Fashion, Household and Food industries.
Table 2 – Egyptian imports from the world and exports of Italy and Southern Italy directed to the country. Absolute values (EUR Mn.) and market share in each sector (%), year 2014
Egypt's Imports Exports
Italy Southern Italy
absolute values market share (%) absolute values market share (%)
Mechanical 8,254 1,208 14.6 44 0.5
Made in Italy 8,949 247 2.8 30 0.3
Metals 5,439 240 4.4 32 0.6
Intermediate Products (Excluded Metals) 7,412 349 4.7 24 0.3
Transport Equipment 4,537 66 1.5 6 0.1
Others 4,136 103 2.5 5 0.1
Manufacturing 38,727 2,212 5.7 141 0.4
Source: Prometeia elaborations on Istat data and Fipice database (October 2015)
Graph 8 – Italy and Southern Italy’s exports to Egypt: market share in 2007 and 2014, by sector. Weight of Italy’s and Southern Italy’s sectorial exports to Egypt on Egypt’s sectorial imports (percentage values)
0
2
4
6
8
10
12
14
16
18
20
Mechanical Made in Italy Metals IntermediateProducts
TransportEquipment
Manufacturing
2007 2014 Italy
0,0
0,5
1,0
1,5
2,0
2,5
Mechanical Made in Italy Metals IntermediateProducts
TransportEquipment
Manufacturing
2007 2014 Southern Italy
Source: Prometeia elaborations on Istat data and Fipice database
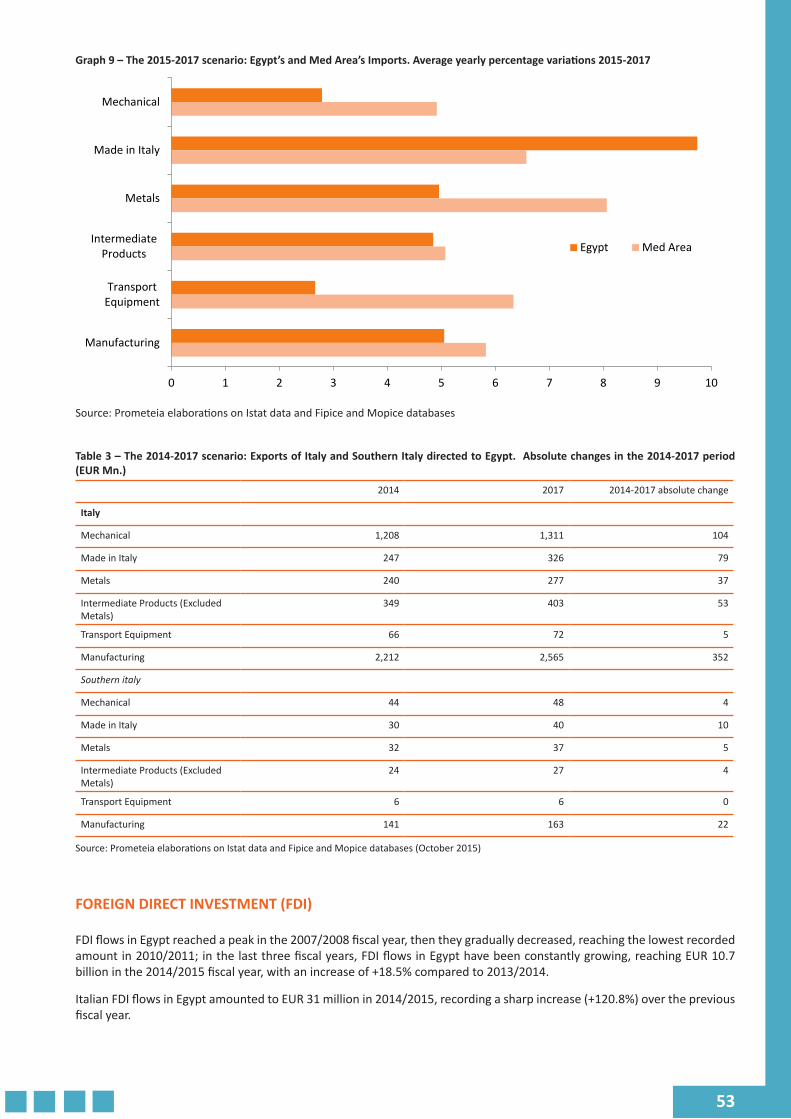
53
Graph 9 – The 2015-2017 scenario: Egypt’s and Med Area’s Imports. Average yearly percentage variations 2015-2017
0 1 2 3 4 5 6 7 8 9 10
Mechanical
Made in Italy
Metals
IntermediateProducts
TransportEquipment
Manufacturing
Egypt Med Area
Source: Prometeia elaborations on Istat data and Fipice and Mopice databases
Table 3 – The 2014-2017 scenario: Exports of Italy and Southern Italy directed to Egypt. Absolute changes in the 2014-2017 period (EUR Mn.)
2014 2017 2014-2017 absolute change
Italy
Mechanical 1,208 1,311 104
Made in Italy 247 326 79
Metals 240 277 37
Intermediate Products (Excluded Metals)
349 403 53
Transport Equipment 66 72 5
Manufacturing 2,212 2,565 352
Southern italy
Mechanical 44 48 4
Made in Italy 30 40 10
Metals 32 37 5
Intermediate Products (Excluded Metals)
24 27 4
Transport Equipment 6 6 0
Manufacturing 141 163 22
Source: Prometeia elaborations on Istat data and Fipice and Mopice databases (October 2015)
FOREIGN DIRECT INVESTMENT (FDI)
FDI flows in Egypt reached a peak in the 2007/2008 fiscal year, then they gradually decreased, reaching the lowest recorded amount in 2010/2011; in the last three fiscal years, FDI flows in Egypt have been constantly growing, reaching EUR 10.7 billion in the 2014/2015 fiscal year, with an increase of +18.5% compared to 2013/2014.
Italian FDI flows in Egypt amounted to EUR 31 million in 2014/2015, recording a sharp increase (+120.8%) over the previous fiscal year.
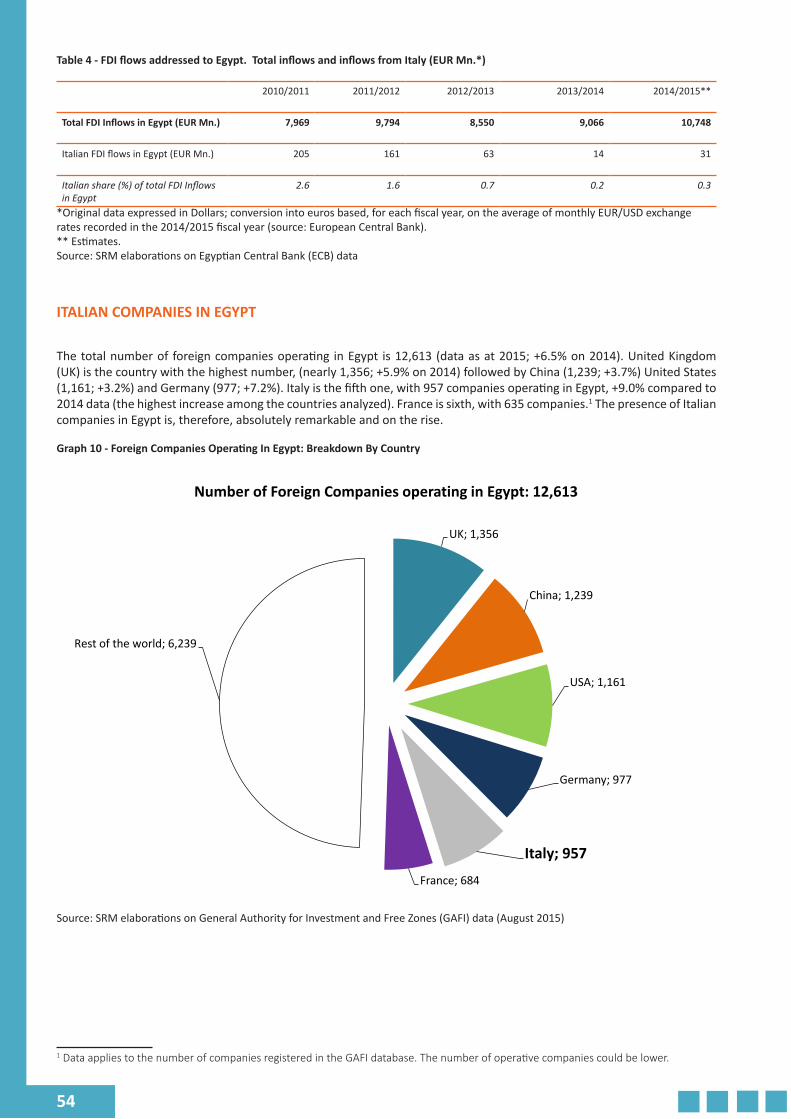
54
Table 4 - FDI flows addressed to Egypt. Total inflows and inflows from Italy (EUR Mn.*)
2010/2011 2011/2012 2012/2013 2013/2014 2014/2015**
Total FDI Inflows in Egypt (EUR Mn.) 7,969 9,794 8,550 9,066 10,748
Italian FDI flows in Egypt (EUR Mn.) 205 161 63 14 31
Italian share (%) of total FDI Inflows in Egypt
2.6 1.6 0.7 0.2 0.3
*Original data expressed in Dollars; conversion into euros based, for each fiscal year, on the average of monthly EUR/USD exchange rates recorded in the 2014/2015 fiscal year (source: European Central Bank).** Estimates.Source: SRM elaborations on Egyptian Central Bank (ECB) data
ITALIAN COMPANIES IN EGYPT
The total number of foreign companies operating in Egypt is 12,613 (data as at 2015; +6.5% on 2014). United Kingdom (UK) is the country with the highest number, (nearly 1,356; +5.9% on 2014) followed by China (1,239; +3.7%) United States (1,161; +3.2%) and Germany (977; +7.2%). Italy is the fifth one, with 957 companies operating in Egypt, +9.0% compared to 2014 data (the highest increase among the countries analyzed). France is sixth, with 635 companies.1 The presence of Italian companies in Egypt is, therefore, absolutely remarkable and on the rise.
Graph 10 - Foreign Companies Operating In Egypt: Breakdown By Country
UK; 1,356
China; 1,239
USA; 1,161
Germany; 977
Italy; 957
France; 684
Rest of the world; 6,239
Number of Foreign Companies operating in Egypt: 12,613
Source: SRM elaborations on General Authority for Investment and Free Zones (GAFI) data (August 2015)
1 Data applies to the number of companies registered in the GAFI database. The number of operative companies could be lower.
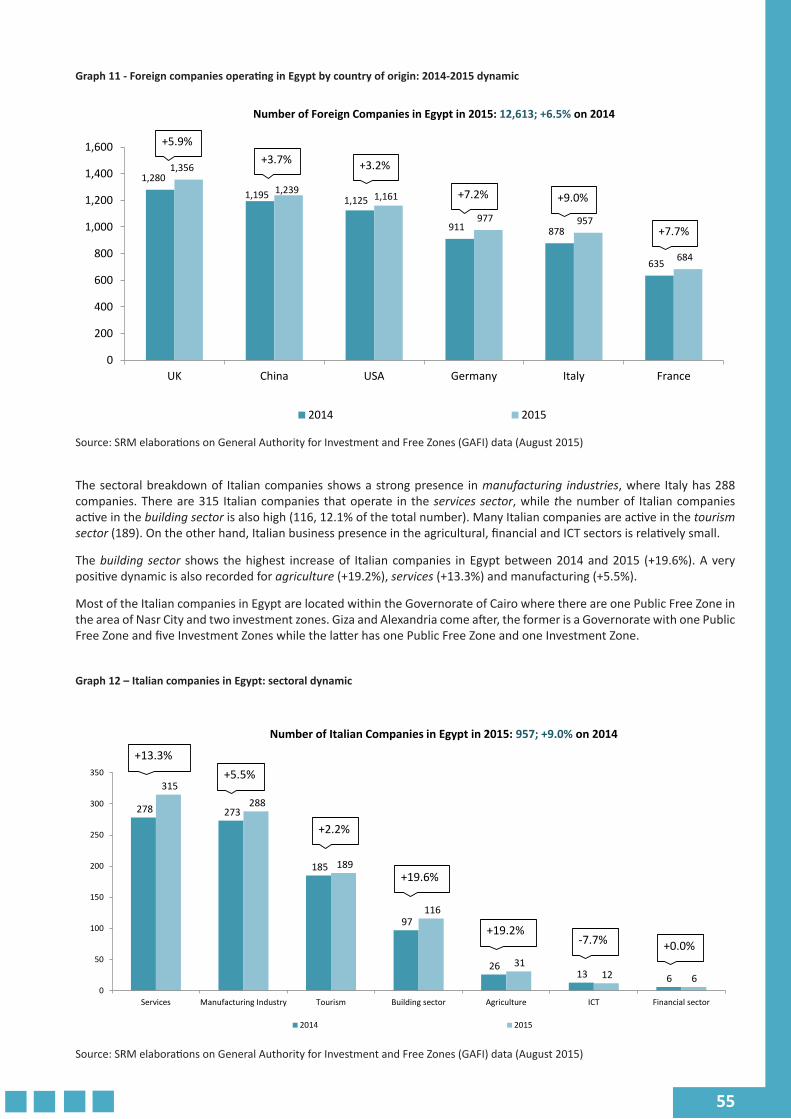
55
Graph 11 - Foreign companies operating in Egypt by country of origin: 2014-2015 dynamic
1,280
911 878
635
1,356
1,195 1,2391,125 1,161
977 957
684
0
200
400
600
800
1,000
1,200
1,400
1,600
UK China USA Germany Italy France
2014 2015
+5.9%
+7.7%
+9.0%+7.2%
+3.2%+3.7%
Number of Foreign Companies in Egypt in 2015: 12,613; +6.5% on 2014
Source: SRM elaborations on General Authority for Investment and Free Zones (GAFI) data (August 2015)
The sectoral breakdown of Italian companies shows a strong presence in manufacturing industries, where Italy has 288 companies. There are 315 Italian companies that operate in the services sector, while the number of Italian companies active in the building sector is also high (116, 12.1% of the total number). Many Italian companies are active in the tourism sector (189). On the other hand, Italian business presence in the agricultural, financial and ICT sectors is relatively small.
The building sector shows the highest increase of Italian companies in Egypt between 2014 and 2015 (+19.6%). A very positive dynamic is also recorded for agriculture (+19.2%), services (+13.3%) and manufacturing (+5.5%).
Most of the Italian companies in Egypt are located within the Governorate of Cairo where there are one Public Free Zone in the area of Nasr City and two investment zones. Giza and Alexandria come after, the former is a Governorate with one Public Free Zone and five Investment Zones while the latter has one Public Free Zone and one Investment Zone.
Graph 12 – Italian companies in Egypt: sectoral dynamic
278 273
185
97
26 13 6
315 288
189
116
31 12 6
0
50
100
150
200
250
300
350
Services Manufacturing Industry Tourism Building sector Agriculture ICT Financial sector
2014 2015
+13.3%
-7.7%+19.2%
+19.6%
+2.2%
+5.5%
Number of Italian Companies in Egypt in 2015: 957; +9.0% on 2014
+0.0%
Source: SRM elaborations on General Authority for Investment and Free Zones (GAFI) data (August 2015)
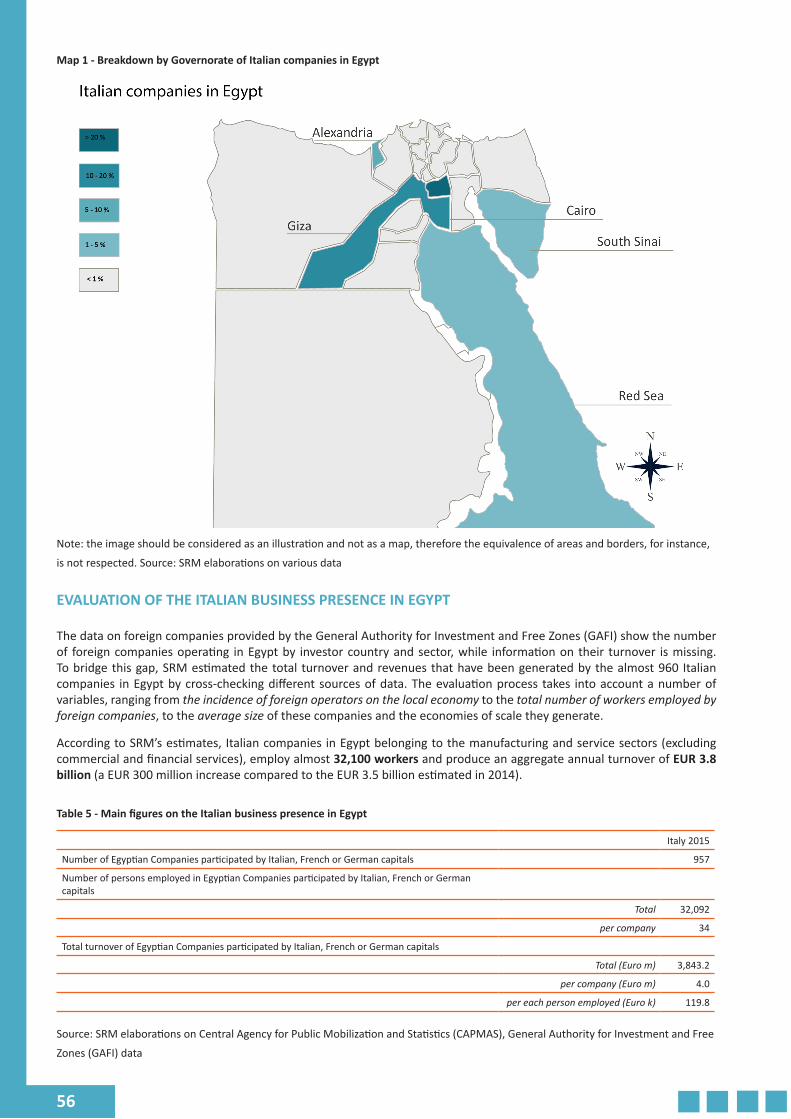
56
Map 1 - Breakdown by Governorate of Italian companies in Egypt
Note: the image should be considered as an illustration and not as a map, therefore the equivalence of areas and borders, for instance,
is not respected. Source: SRM elaborations on various data
EVALUATION OF THE ITALIAN BUSINESS PRESENCE IN EGYPT
The data on foreign companies provided by the General Authority for Investment and Free Zones (GAFI) show the number of foreign companies operating in Egypt by investor country and sector, while information on their turnover is missing. To bridge this gap, SRM estimated the total turnover and revenues that have been generated by the almost 960 Italian companies in Egypt by cross-checking different sources of data. The evaluation process takes into account a number of variables, ranging from the incidence of foreign operators on the local economy to the total number of workers employed by foreign companies, to the average size of these companies and the economies of scale they generate.
According to SRM’s estimates, Italian companies in Egypt belonging to the manufacturing and service sectors (excluding commercial and financial services), employ almost 32,100 workers and produce an aggregate annual turnover of EUR 3.8 billion (a EUR 300 million increase compared to the EUR 3.5 billion estimated in 2014).
Table 5 - Main figures on the Italian business presence in Egypt
Italy 2015
Number of Egyptian Companies participated by Italian, French or German capitals 957
Number of persons employed in Egyptian Companies participated by Italian, French or German capitals
Total 32,092
per company 34
Total turnover of Egyptian Companies participated by Italian, French or German capitals
Total (Euro m) 3,843.2
per company (Euro m) 4.0
per each person employed (Euro k) 119.8
Source: SRM elaborations on Central Agency for Public Mobilization and Statistics (CAPMAS), General Authority for Investment and Free
Zones (GAFI) data
57
A COMPARATIVE ANALYSIS OF THE PERFORMANCES OF TWO SAMPLES OF FOREIGN COMPANIES IN EGYPT: THE ITALIAN COMPANIES AND THE ONES OF OTHER NATIONS
Italian Companies in Egypt: growth, profitability and financial situation
In order to monitor the economic and financial health status of Italian companies operating in Egypt, SRM conducted an analysis on data coming from the 2010-2014 balance sheets of a closed sample of Egyptian companies participated with “Italian capital” by a significant share (at least 10% of the share capital); the results have been compared with the ones relating to the balance sheets of a sample of Egyptian companies participated with “foreign, non-Italian capital” by an equally significant quota (also, in this case, of at least 10%).1 Both samples include the manufacturing, energy and building sectors. The analysis focuses on three aspects - growth, profitability and financial situation - in order to provide an overview of market trends, profitability and financial health of the Italian investment in Egypt. In the rest of the text we will refer to the first sample as “Italian companies in Egypt” and to the second as “foreign companies in Egypt”.
Growth and profitability
The analysis of the economic performances in the 2010-2012 period shows that, despite the decrease of activity recorded as a result of the events of the so-called Arab Spring, the Italian companies operating in Egypt had good levels of profitability. Then, in 2014, Italian companies recorded a strong recovery in their activities, with a strong growth in the operating revenue and in the assets. Meanwhile profitability still remained high. More in detail, in 2011 – the year of the outbreak of public protests – the performances of the Italian companies in Egypt were extensively negative: total revenues decreased by 18.8% and a reduction of the total investment (-9.0%) and especially of the current assets (-26.7%) was recorded. However, the assets decline did not affect tangible assets, whose value remained relatively stable compared to 2010 (+1.9%). Therefore, their structure remained intact and no special divestitures were recorded. Although 2011 was a negative year growth-wise, the Italian companies preserved good indices of profitability: the Return on Equity (RoE) amounted to 13%; the Return on Asset (RoA) amounted to 5.9% and the Return on Sales (RoS), which shows the amount of sales that translates to operating income, amounted to 12.8%.2 In 2011, foreign companies in Egypt recorded better performances, although not so far away from the ones recorded for the Italian companies. With regard to 2012, a general improvement in the growth indices of Italian companies in Egypt was recorded: revenues continued to shrink but with a much lower intensity than in 2011 (-1.2%), while total investment kept on growing (+1.1%), with a stronger dynamic for investments in tangible assets (+3.6%); in addition, current assets increased (+4.2%), a sign of recovery of the companies' operating activities. The indices of profitability went through a slight worsening between 2011 and 2012, while still remaining at decent levels: the RoE was equal to 10.9%, the RoA to 4.8% and the RoS to 10.6%. The foreign companies recorded better performances than Italian companies in 2012 as well, both in growth indices and profitability indices. In 2013, the profitability of Italian companies in Egypt was better than in the previous year. The RoE reached 11%, the RoA was 5.4% and the RoS was 12.4%. Again the profitability was better for foreign companies in Egypt.
In 2014, Italian companies in Egypt recorded e strong recovery in their activities: the operating revenue grew by 19.8%, while total assets had an increase of 5.7%. Particularly high was the growth of current assets. Even though, Italian companies in Egypt reported a slight decrease of the RoE in 2014 (to 9.4%, from 11.0% in 2013), their overall profitability remained still high. There are two general interesting aspects emerging from the analysis (that allows to better qualify the characteristics of Italian companies in Egypt compared to the other foreign companies): the turnover ratio and the incidence of non-operating income.
The turnover ratio is the ratio of turnover to total assets; for Italian companies it was always around 0.5 over the period analyzed (each Euro invested in the company generated a turnover of about EUR 0.5), while for foreign companies it was around 0.8. This is probably due to the fact that many Italian companies in Egypt have been recently established, thus their investment is not yet fully exploited. Given the high efficiency of these companies (the RoS is very high), an improvement in the turnover ratio (therefore in the ability to increase their business, with the same quantity of investment) would result in a further increase in profitability. The other aspect mentioned concerns the incidence of non-operating income (or non-core income), which is calculated by dividing the net income of the company by its operating income. An index greater than 1 is the consequence of a positive result in terms of non-operating income, while if it is lower than 1, it means that losses can be detected in "non-core" activities. In 2013, for Italian companies based in Egypt this index was 1.6 (i.e., a "positive" non-operating income), while for foreign companies it amounted to 0.5 (a "negative" non-operating income). So Italian companies in Egypt seem to be better at managing non-core activities than their competitors.
In conclusion, according to the analysis of the indicators of growth and profitability, the following points can be highlighted:
1. in 2011, the socio-political crisis that affected Egypt significantly slowed down the level of activity of Italian companies based in the country, with a substantial drop in the turnover compared to 2010. This, however, did not affect the structure of the companies, that did not disinvest their fixed assets;
1 In the Egyptian companies participated by “foreign assets” we did not include, of course, the ones participated by Italian companies. 2 However, profitability in 2010 was much higher: RoE was equal to 20.5%, RoI amounted to 14.1% and RoS to 26.7%.
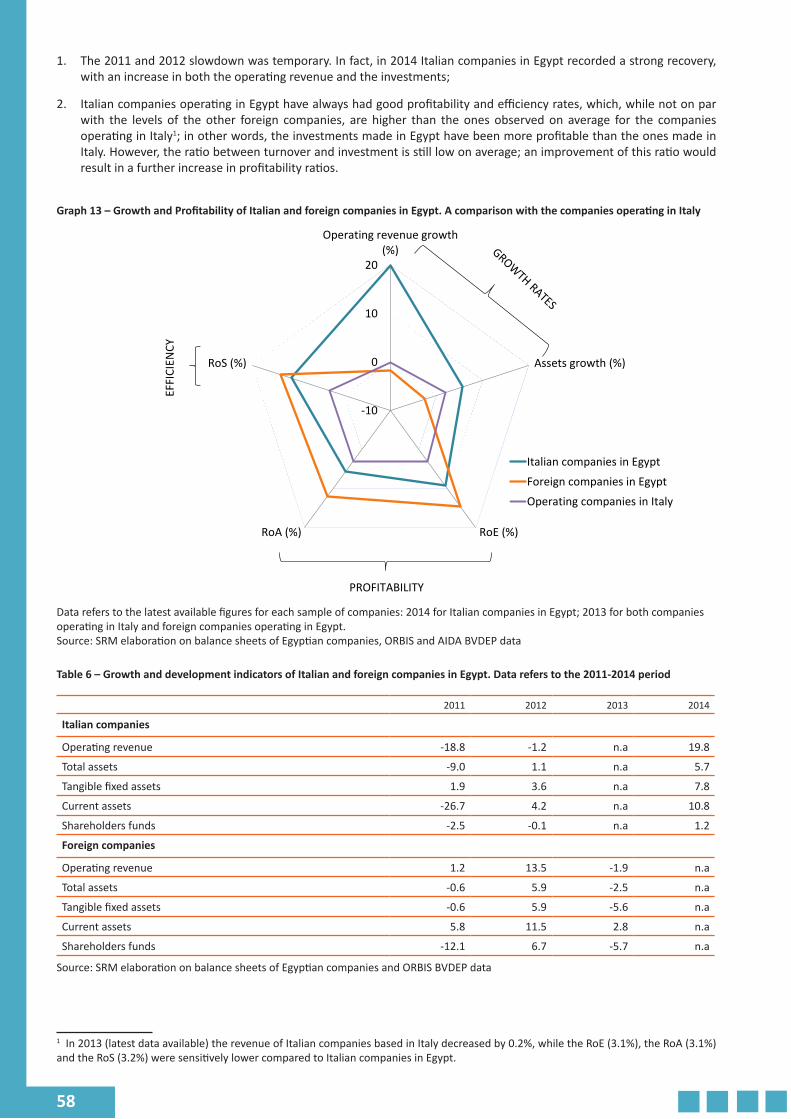
58
1. The 2011 and 2012 slowdown was temporary. In fact, in 2014 Italian companies in Egypt recorded a strong recovery, with an increase in both the operating revenue and the investments;
2. Italian companies operating in Egypt have always had good profitability and efficiency rates, which, while not on par with the levels of the other foreign companies, are higher than the ones observed on average for the companies operating in Italy1; in other words, the investments made in Egypt have been more profitable than the ones made in Italy. However, the ratio between turnover and investment is still low on average; an improvement of this ratio would result in a further increase in profitability ratios.
Graph 13 – Growth and Profitability of Italian and foreign companies in Egypt. A comparison with the companies operating in Italy
-10
0
10
20
Operating revenue growth(%)
Assets growth (%)
RoE (%)RoA (%)
RoS (%)
Italian companies in Egypt
Foreign companies in Egypt
Operating companies in Italy
PROFITABILITY
EFFI
CIEN
CY
Data refers to the latest available figures for each sample of companies: 2014 for Italian companies in Egypt; 2013 for both companies operating in Italy and foreign companies operating in Egypt.Source: SRM elaboration on balance sheets of Egyptian companies, ORBIS and AIDA BVDEP data
Table 6 – Growth and development indicators of Italian and foreign companies in Egypt. Data refers to the 2011-2014 period
2011 2012 2013 2014
Italian companies Operating revenue -18.8 -1.2 n.a 19.8
Total assets -9.0 1.1 n.a 5.7
Tangible fixed assets 1.9 3.6 n.a 7.8
Current assets -26.7 4.2 n.a 10.8
Shareholders funds -2.5 -0.1 n.a 1.2
Foreign companies
Operating revenue 1.2 13.5 -1.9 n.a
Total assets -0.6 5.9 -2.5 n.a
Tangible fixed assets -0.6 5.9 -5.6 n.a
Current assets 5.8 11.5 2.8 n.a
Shareholders funds -12.1 6.7 -5.7 n.a
Source: SRM elaboration on balance sheets of Egyptian companies and ORBIS BVDEP data
1 In 2013 (latest data available) the revenue of Italian companies based in Italy decreased by 0.2%, while the RoE (3.1%), the RoA (3.1%) and the RoS (3.2%) were sensitively lower compared to Italian companies in Egypt.
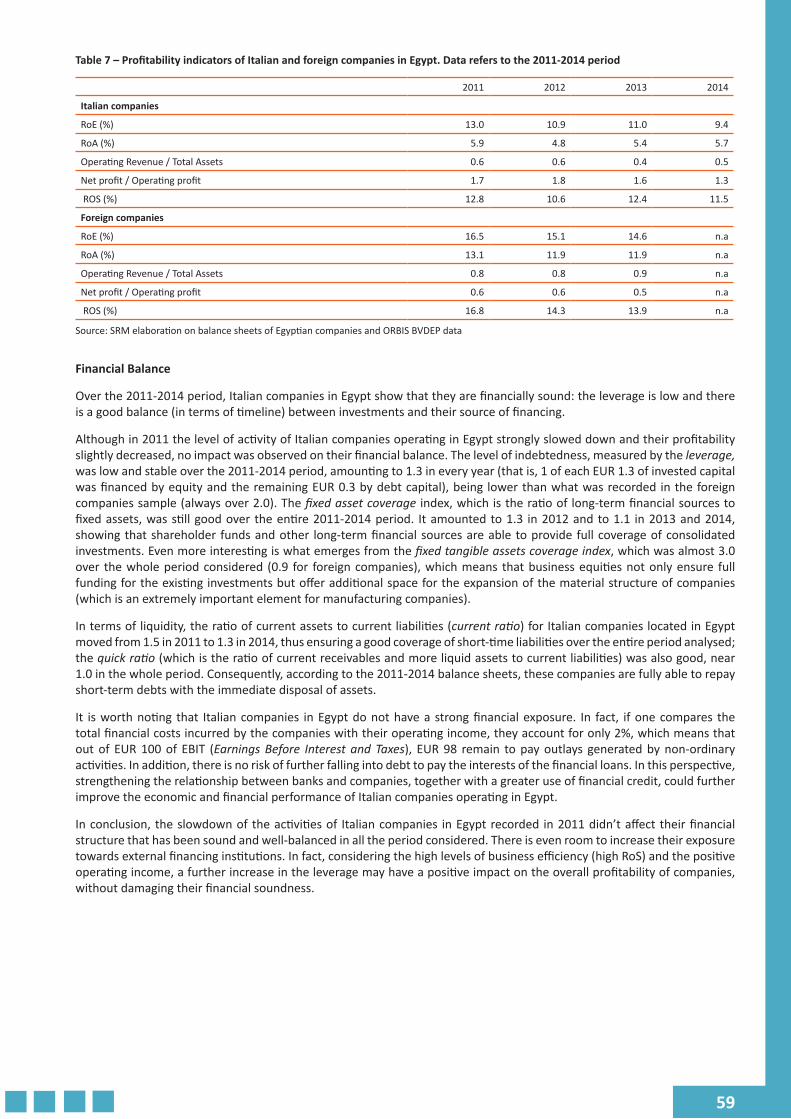
59
Table 7 – Profitability indicators of Italian and foreign companies in Egypt. Data refers to the 2011-2014 period
2011 2012 2013 2014
Italian companies
RoE (%) 13.0 10.9 11.0 9.4
RoA (%) 5.9 4.8 5.4 5.7
Operating Revenue / Total Assets 0.6 0.6 0.4 0.5
Net profit / Operating profit 1.7 1.8 1.6 1.3
ROS (%) 12.8 10.6 12.4 11.5
Foreign companies
RoE (%) 16.5 15.1 14.6 n.a
RoA (%) 13.1 11.9 11.9 n.a
Operating Revenue / Total Assets 0.8 0.8 0.9 n.a
Net profit / Operating profit 0.6 0.6 0.5 n.a
ROS (%) 16.8 14.3 13.9 n.a
Source: SRM elaboration on balance sheets of Egyptian companies and ORBIS BVDEP data
Financial Balance
Over the 2011-2014 period, Italian companies in Egypt show that they are financially sound: the leverage is low and there is a good balance (in terms of timeline) between investments and their source of financing.
Although in 2011 the level of activity of Italian companies operating in Egypt strongly slowed down and their profitability slightly decreased, no impact was observed on their financial balance. The level of indebtedness, measured by the leverage, was low and stable over the 2011-2014 period, amounting to 1.3 in every year (that is, 1 of each EUR 1.3 of invested capital was financed by equity and the remaining EUR 0.3 by debt capital), being lower than what was recorded in the foreign companies sample (always over 2.0). The fixed asset coverage index, which is the ratio of long-term financial sources to fixed assets, was still good over the entire 2011-2014 period. It amounted to 1.3 in 2012 and to 1.1 in 2013 and 2014, showing that shareholder funds and other long-term financial sources are able to provide full coverage of consolidated investments. Even more interesting is what emerges from the fixed tangible assets coverage index, which was almost 3.0 over the whole period considered (0.9 for foreign companies), which means that business equities not only ensure full funding for the existing investments but offer additional space for the expansion of the material structure of companies (which is an extremely important element for manufacturing companies).
In terms of liquidity, the ratio of current assets to current liabilities (current ratio) for Italian companies located in Egypt moved from 1.5 in 2011 to 1.3 in 2014, thus ensuring a good coverage of short-time liabilities over the entire period analysed; the quick ratio (which is the ratio of current receivables and more liquid assets to current liabilities) was also good, near 1.0 in the whole period. Consequently, according to the 2011-2014 balance sheets, these companies are fully able to repay short-term debts with the immediate disposal of assets.
It is worth noting that Italian companies in Egypt do not have a strong financial exposure. In fact, if one compares the total financial costs incurred by the companies with their operating income, they account for only 2%, which means that out of EUR 100 of EBIT (Earnings Before Interest and Taxes), EUR 98 remain to pay outlays generated by non-ordinary activities. In addition, there is no risk of further falling into debt to pay the interests of the financial loans. In this perspective, strengthening the relationship between banks and companies, together with a greater use of financial credit, could further improve the economic and financial performance of Italian companies operating in Egypt.
In conclusion, the slowdown of the activities of Italian companies in Egypt recorded in 2011 didn’t affect their financial structure that has been sound and well-balanced in all the period considered. There is even room to increase their exposure towards external financing institutions. In fact, considering the high levels of business efficiency (high RoS) and the positive operating income, a further increase in the leverage may have a positive impact on the overall profitability of companies, without damaging their financial soundness.
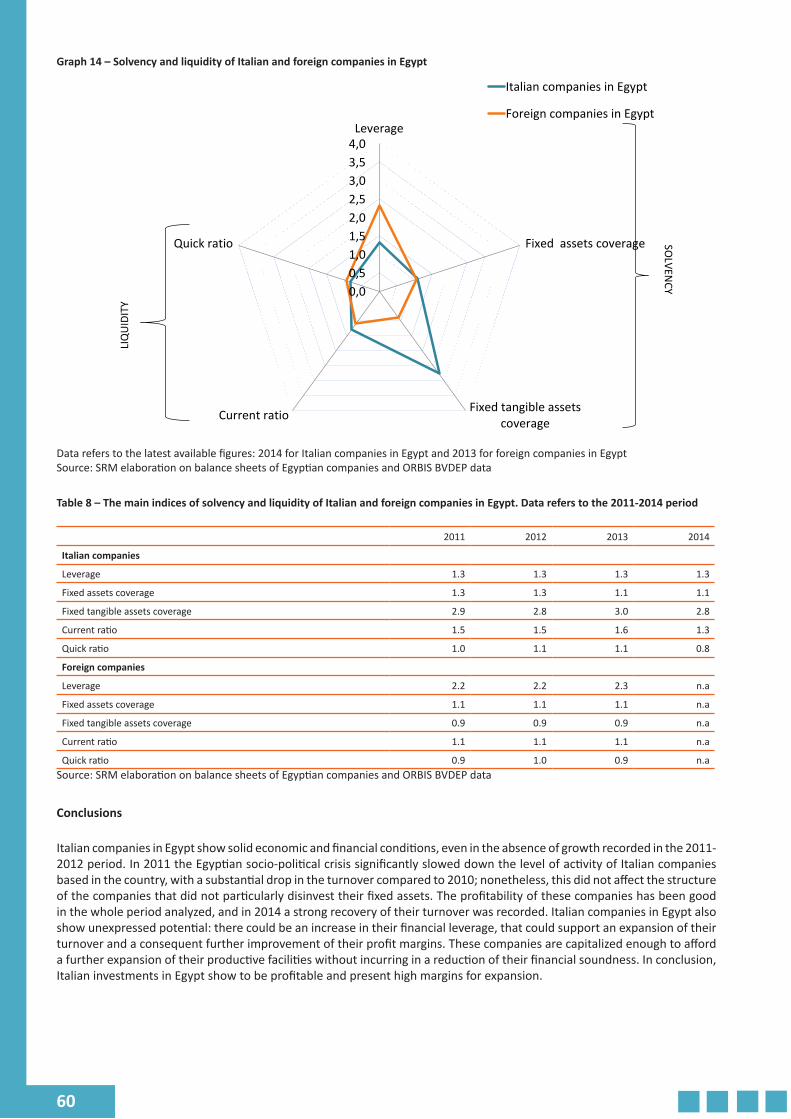
60
Graph 14 – Solvency and liquidity of Italian and foreign companies in Egypt
0,00,51,01,52,02,53,03,54,0Leverage
Fixed assets coverage
Fixed tangible assetscoverageCurrent ratio
Quick ratio
Italian companies in Egypt
Foreign companies in EgyptSO
LVENCY
LIQ
UID
ITY
Data refers to the latest available figures: 2014 for Italian companies in Egypt and 2013 for foreign companies in EgyptSource: SRM elaboration on balance sheets of Egyptian companies and ORBIS BVDEP data
Table 8 – The main indices of solvency and liquidity of Italian and foreign companies in Egypt. Data refers to the 2011-2014 period
2011 2012 2013 2014
Italian companies
Leverage 1.3 1.3 1.3 1.3
Fixed assets coverage 1.3 1.3 1.1 1.1
Fixed tangible assets coverage 2.9 2.8 3.0 2.8
Current ratio 1.5 1.5 1.6 1.3
Quick ratio 1.0 1.1 1.1 0.8
Foreign companies
Leverage 2.2 2.2 2.3 n.a
Fixed assets coverage 1.1 1.1 1.1 n.a
Fixed tangible assets coverage 0.9 0.9 0.9 n.a
Current ratio 1.1 1.1 1.1 n.a
Quick ratio 0.9 1.0 0.9 n.aSource: SRM elaboration on balance sheets of Egyptian companies and ORBIS BVDEP data
Conclusions
Italian companies in Egypt show solid economic and financial conditions, even in the absence of growth recorded in the 2011-2012 period. In 2011 the Egyptian socio-political crisis significantly slowed down the level of activity of Italian companies based in the country, with a substantial drop in the turnover compared to 2010; nonetheless, this did not affect the structure of the companies that did not particularly disinvest their fixed assets. The profitability of these companies has been good in the whole period analyzed, and in 2014 a strong recovery of their turnover was recorded. Italian companies in Egypt also show unexpressed potential: there could be an increase in their financial leverage, that could support an expansion of their turnover and a consequent further improvement of their profit margins. These companies are capitalized enough to afford a further expansion of their productive facilities without incurring in a reduction of their financial soundness. In conclusion, Italian investments in Egypt show to be profitable and present high margins for expansion.
61
CONCLUSION
Trade and local production can help Egypt in boosting development and create job opportunities by generating growth through increased trade exchange, while broadening the productive base through private sector development. Hence, Egypt has adopted a comprehensive plan toward trade liberalization since 1991. It has joined the WTO in 1995, issuing or amending different legislative acts since then to improve the institutional and legislative framework for adopted technical barriers to trade (technical regulations, standards, and conformity assessment procedures for traded goods and services). It has also engaged in regional and international agreements based on common and mutual interests, as well as benefited from preferential access to various markets.
For more trade liberalization and integration with its neighbors, Egypt, alongside with other 25 African countries, signed a free trade pact under the name of “Tripartite Free Trade Area” (TFTA) to create a common market with preferential tariffs that aims at easing the movement of goods over a large market with 625 million citizens. Moreover and due to the fact that FDI is another key driver growth for any developing economy, the Egyptian government took many steps to improve the investment climate and attract more private investments as highlighted in many international conferences organized to present available investment opportunities in promising sectors.
This study has aimed to illustrate the potential for European investors, to possibly consider the opportunity to base certain stages of their production and business cycles in Egypt, in order to gain a favorable access to new markets.
Alongside with its unique geography, Egypt is a nation with a higher potential to be an economic and industrial hub, linking all of Europe, the Middle East and Africa in a unique trade and development triangle, connected to the world via the Suez Canal and being a key participant in some of the world’s most prominent trade agreements.
62
APPENDIX 1. THE INVESTMENT CLIMATE
Authorities and Institutions involved in the policy of attraction of investment
The GAFI, General Authority for Investment and Free Zones, established in 1971 within the activity of the Ministry of Investment, is the main governmental authority involved in regulating and simplifying the Investment in the Country. It operates as a one stop shop for every needed function and the necessary procedures in completing the investment.
The main services provided by GAFI concern:
• Advice and support in evaluating Egypt as a potential investment location;• An efficient and professional service response to the investors' questions;• Assist investors in obtaining all necessary approvals;• Identify suitable Egyptian partners; • Increase the specialization of the Federation of the Egyptian Chambers of Commerce office in Cairo’s one stop shop to
provide new services; • Opening new branches of GAFI' One Stop Shop during one year;• GAFI has established "Bedaya Center for Entrepreneurship and SME Development" in January 2010, to support and
develop Small and Medium Investments. • The Investors' Dispute Settlement Center was established in 2009 to settle the disputes that may arise between investors
through mediation.
Reference legislation and additional tools
Investment Regimes
The initiatives aimed at increasing exports volume are prominent in the Egyptian economic policy, and they do so by taking a strong policy of attraction of investment, translating in a diversified framework of investment regimes.
These various investment regimes are as follows:
1. Inland Investments;2. Special Economic Zones;3. Industrial Zones;4. Investment Zones;5. Free Zones.
1. INLAND INVESTMENTS
Inland investment is governed by the Investment Incentives and Guarantees Law 8/1997 and Companies Law 159/1981. The GAFI acts as official regulator for all incorporations and licenses governed by both legislations.
Incentives and Guarantees:
• Protection against expropriation and compulsory pricing.• Full right to repatriate profits and dividends.• No export requirements.• Access to dispute resolution committees administered by GAFI.• Unfettered access to land in Upper Egypt.Other incentives include a standard income tax rate of 20%; a 10-year tax exemption for land cultivation and husbandry activities; export duties ranging from 5-25% of the value of wholesale transactions; and import duties ranging from 2-32%. Investment Law No. 8/1997 has been a resounding success.
The Provisions of the Investment Law:
• The right to remit income earned in Egypt.• 100% foreign ownership of ventures.
63
• The right to own land.• The right to maintain foreign currency bank accounts.• The right to repatriate capital and profit.• Free hiring of Egyptian staff.• Equal treatment regardless of nationality.
Investment Law Fields:
1. Air, maritime and river transportation.2. Animal, fish and poultry husbandry.3. Industry and mining.4. Land reclamation and cultivation of desert lands.5. Refrigerated transportation.6. Tourism.7. Real estate development.8. Oil production.9. Hospitals and medical centers.10. Venture capital.11. Computer software and electronic production.12. Technology zones.13. Credit classification.14. Industrial projects and utilities.15. Waste collection and treatment projects.16. Projects financed by the Social Fund for Development.Some projects require prior approval from relevant ministries in addition to GAFI.
Corporate Law No. 159/1981 and its amendments cover investors in sectors not specifically mentioned in Investment Law 8/1997. The law allows for automatic registration of a company upon presentation of the application to the Companies Department and for acquisition of legal status 15 days after annotation in the Commercial Register.
Law 159/1981 also removes the restriction that 49% of shareholders must be Egyptian; allows 100% foreign representation on the board of directors; and redefines accounting standards.
2. SPECIAL ECONOMIC ZONES (SEZONE)
SEZONE is the first economic zone with a special nature established in Egypt by law 83 of 2002, mainly to utilize foreign investment, develop industries and export. The development of SEZONE is intended to provide an attractive environment for medium and small industries to create new employment opportunities.
Location: SEZONE is located in the Suez Governorate in the Sokhna area, adjacent to the Sokhna Port.
Unique location
Sokhna is fast becoming a new industrial hub for Egypt and the gateway of choice for Egyptian trade with Asia and the Middle East.
SEZONE strategic location offers competitive cost and most comprehensive market access program.
SEZONE is strategically located on the main international ocean trade routes. It's adjacent to the New Port of Sokhna, with direct access to the Mediterranean sea and the Indian Ocean.
64
SOKHNA PORT
In 1999, the Egyptian government decided to establish this deepwater port on the Red Sea, 40km from the southern entrance of The Suez Canal and 140 km southeast of Cairo. Represented by Ports of The Red Sea Authority, the Government took bank loans worth of EGP 1 billion to build the Sokhna Port. The managing company was formerly known as Sokhna Port Development Company (SPDC) and changed its name to DP World Sokhna in January 2009. DP World initiated its investments in the Egyptian market in February 2008, when it acquired a 90% controlling stake in SPDC for USD 670 million. The remaining 10% shares remain with Amiral Holdings Limited.
Current port facilities comprise of:
• Container terminal• General cargo/Ro-Ro terminal• Bulk terminal• Livestock terminal• Logistics Center• Internationally certified inspection laboratories• Ship fuelling.
Technology in use at the Port consists of:• Modern Post-Panamax ship-to-shore container gantry and stacking cranes;• Fully computerized Terminal Handling and Planning System;• Fully automated vessel, shipping, customs and port processes, integrated into Sokhna Port’s state-of-the-art IT
systems.
The port's total size is 24 million square m:• 3,400,000 the water area;• 21,519,337 the land area;• 1,000,000 the Customs center;• The largest dock's size is 7 km long and 5.5 km wide.
The quays are designed to handle super post Panamax vessels (8,000 TEU), Capesize bulk carriers and heavy lift project cargo, with water depths of 17.0m.Internationally accredited laboratories are located at the port. The laboratories act as one-stop-shop for verifying maximum cost efficiency, speed of handling, safety and quality.In 2014 DP World has signed an agreement with the Egyptian Ministry of Transport to begin construction of the second dock, which includes two new container terminals. Construction of the new dock will take two years, with total investments likely to be close to USD 750 million.The container volumes at Port Sokhna started to recover during 2014, following a drop of 30% over the past year. DP World expects container traffic to further recover next year after the implementation of these new expansions. Traffic: Approximately 5,000,000 t of cargo, 450,000 TEU and 500 vessels handled annually.Future prospects (2020)DPW-Sokhna aims to attract further industries to the Port. By 2020, DP World-Sokhna plans to develop into an administrative and management nodalcenter, acting as a hub for product transport chains. By 2020, the Egyptian Government envisages an increase of 90 million tons in cargo volumes; with some 4 million TEUs. Handling these volumes, however, will necessitate over 8,000 ship calls a year, together with the construction of extra 12km of berths minimum.
VisionCreate a superior business environment for attracting investments to Egypt while ensuring maximum benefits to the local community that upgrades the quality of life over the coming 15 years.
MissionEstablish a special economic zone in the heart of the Suez Gulf in Egypt. The SEZONE will develop a competitive business location that provides Egyptian and foreign investors with top-class infrastructure, market access, and streamlined administrative procedures.
Development Objectives• Development of the Zone.
65
• Attract foreign investments.• Direct employment creation• Increase Egypt's share in the international trade.• Increase exports diversification
Incentives and BenefitsSEZONE presents unrivaled incentives & guarantees comparing to the other economic zones in the region:1. 10% unified income tax in the SEZONE (versus 20% outside of SEZONE) 2. 5% income tax. (versus 10% - 20% outside the SEZONE )3. A one-stop shop through legislation that provides the body with single-point authority over other government agencies
in core areas.4. A supreme committee that supervises the taxation system in SEZONE.5. A special customs service under the supervision of a Supreme customs committee.6. Lowest cost production center in the Middle East-North Africa.7. Allowing enterprises access to the domestic market.8. Access to productive skilled Egyptian labor in a number of manufacturing sectors at competitive costs.9. The dispute shall only be referred to court after having been submitted to the Dispute Settlement Center.
Targeted Cluster's:SEZONE Authority aims to develop industries on a "Cluster Based Policy". This will enable specified industries to achieve more productivity, efficiency in terms of time management and operating costs. It will also improve access of local SME's to the international market and increasing their productivity.1. Automotive.2. Chemicals and Petrochemicals.3. Construction and Building Materials.4. Textile and Readymade Garments.5. Agribusiness and Food Processing.6. Home Appliances and Electronics.7. Logistics and Warehousing.8. Pharmaceuticals.
3. INDUSTRIAL ZONES
Egypt has adopted a great quantity of industrial zones, for medium and small sized traditional productive activities and for industries with a bigger size and environmental impact; there are 75 Industrial Zones in Egypt, Suez Canal Region has the greater number of Industrial Zones (16) followed by Greater Cairo Region with 15 Industrial Zones. Industrial Zones cover an area of more than 81,000 Acre.
4. INVESTMENT ZONES
Investment Zones were created under Law no. 19 of 2007. The new law allowed the establishment of investment zones as per a Prime Minister decree No. 1675 of 2007 issued and specialized to regulate work at investment zones in whatever investment domain stipulated.Mission: Support Egypt's economic growth through effective investment system characterized by the ease and convenience in dealing with investors
Objectives• Establishing integrated clusters in all fields. • Widening the scope of economic and social development across the country • Investment development in Small and Medium Enterprises
Incentives• Business homogeneousness in the single zone, offering operating and marketing’ competitive costs.• Companies which are established in the investment zones are exempted from stamp & documentation tax for a period
of five years, from the date of registering the company at the commercial register.• Companies within the investment zone shouldn’t be nationalized or Confiscated.• It is not permitted impose receivership on companies and enterprises or seizure or freeze its money and assets.• Is not permissible for any administrative party to intervene in the pricing of companies 'products.• Is not permissible for any administrative party to Cancel or suspend the use of real estate license.• The board of director is responsible for approving the projects that will be established in the investment zone and
entitle to issue all licenses required to facilitate the procedures.
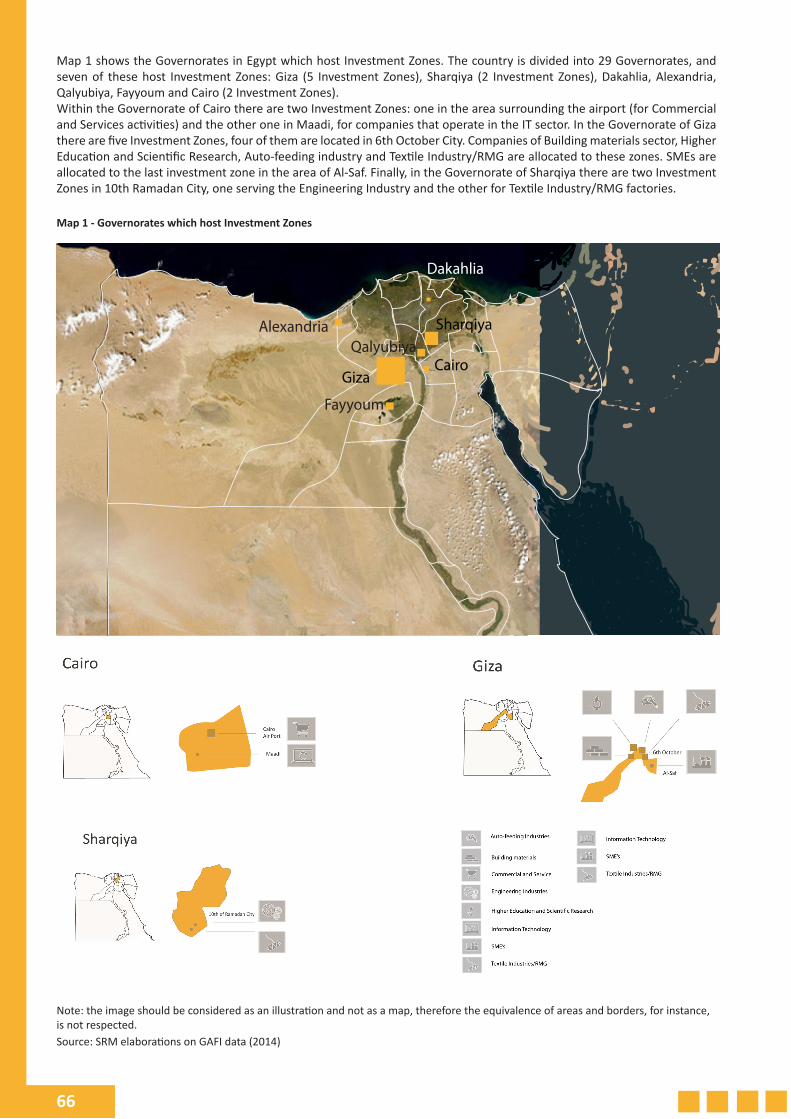
66
Map 1 shows the Governorates in Egypt which host Investment Zones. The country is divided into 29 Governorates, and seven of these host Investment Zones: Giza (5 Investment Zones), Sharqiya (2 Investment Zones), Dakahlia, Alexandria, Qalyubiya, Fayyoum and Cairo (2 Investment Zones).Within the Governorate of Cairo there are two Investment Zones: one in the area surrounding the airport (for Commercial and Services activities) and the other one in Maadi, for companies that operate in the IT sector. In the Governorate of Giza there are five Investment Zones, four of them are located in 6th October City. Companies of Building materials sector, Higher Education and Scientific Research, Auto-feeding industry and Textile Industry/RMG are allocated to these zones. SMEs are allocated to the last investment zone in the area of Al-Saf. Finally, in the Governorate of Sharqiya there are two Investment Zones in 10th Ramadan City, one serving the Engineering Industry and the other for Textile Industry/RMG factories.
Map 1 - Governorates which host Investment Zones
Dakahlia
AlexandriaQalyubiya
Sharqiya
Giza
Fayyoum
Cairo
Note: the image should be considered as an illustration and not as a map, therefore the equivalence of areas and borders, for instance, is not respected. Source: SRM elaborations on GAFI data (2014)
67
5. FREE ZONES
Free Zones are one of the distinguished investment patterns where investors can establish their own project under the umbrella of this system according to the provisions of Incentives and Securities of Investment Law No. 8 of 1997. This system is applied by GAFI.A free zone is a part of the state land that exists within its political boundaries and subjected to its administrative authority. The treatment aspects that are related to goods movement, to the customs, import, monetary system and other aspects, differs from the procedures applied inside the country in regards to the similar transactions. There are two patterns of free zones:1- Public Free ZoneIt is a piece of land completely surrounded by fences and is specified for establishing industrial service and storage investment, according to the benefits and stipulations specified in law 8 of 1997 for investment insurances and incentives.The government has held 9 free zones distributed all over the republic and supplied with facilities and essential infrastructural services. In addition there is an integrated and independent customs unit in each zone for serving the projects there. 2- Private free zoneIt is a piece of land that is located out of a public free zone, which is specified for projects because of lack of areas on the public free zone or because of this location have a positive influence on the economies of running this project.The investor usually chooses the location of his project meant to be a private free zone, moreover he undertakes supplying the utilities to this site and providing the representatives of customs, ports security and the authority to clear the procedures of goods’ entrance and discharge.
Vision - GAFI seeks to make the Egyptian free zones a business destination that is able to attract direct investments all over the world.
Mission - The growth of the Egyptian national income, and supporting the national industry through developing of goods and services exportation.
Goals - Supporting investment and adopting effective policy to serve the investors.
The Free Zones are aimed to:• Provide job opportunities along with developing technical and productive talents.• Developing exports and providing alternatives for imports.• Attract local and foreign capitals • Achieve integration among the free zones and the local market.• Increase the national industry to fulfill needs of exportation.
The benefits of investment1 Choose the field of investment.2 No limitations to transfer profits and invested money.3 Set prices of services and products.4 Able to import and export and registering in exporters and importers record.
Investment incentives1 Lack of restrictions on the capital nationality.2 Lack of limits on the amount of capital.3 Imports and exports are not subject to import and customs rules.4 Foreign investors are granted facilities to stay in the country.5 Foreigners who work in the project are granted residence permits.
Exemptions1 Exempt the production requirements from taxes and customs fees.2 Exempt the exports and the imports from taxes and customs fees.3 All the local components are free from customs fees in the case of selling in the local market.
68
Investment insurances1 Guarantee no nationalization and seizure of the project.2 Guarantee no filing a public lawsuit against the project after taking the approval of GAFI.
Investment feesFees for services (1\2 per a thousand annually) of the investment costs of the project, minimum 100 Dollar and maximum 1000 Dollars.1% Fee It is calculated according to the nature of the project activity as follows:1 The manufacturing project shall pay it according to the value added to the commodity in manufacturing or what
assembly process it has when out of the free zone.2 The Storage project shall pay it according to the values of the goods immediately after its entering to the free zone.3 The services project shall pay it that its basic activity does not require entering or exiting goods.
Goods insurance One per thousand of the insurance value is what provided by the Egyptian Customs Authority as an insurance of the customs taxes and duties on the goods, during moving or transporting the goods from the customs circles to the free zones or vice versa; or between the free zones.
Letter of indemnity The project shall provide a final letter of indemnity under the name of GAFI to guarantee its payment. The letter shall be valued according to the nature of the project as follows:• 1% for " industrial activity", 5,000 dollars at minimum, and 50,000 dollar at maximum • 2% for "storage activity", 10,000 dollars at minimum and 100,000 dollars at maximum • 1% for "services activity”, 10,000 dollars at minimum and 100,000 dollars at maximum.
In the all previously mentioned cases the authority shall commit itself to the following:1 Reducing the financial guarantee with a (15%) rate, in case of the project pays its value in cash and not less than the
specified minimum rate.2 Reducing the financial guarantee with a (50%) rate in case of the project regulates in paying the authority dues throughout
the last three consecutive years and was in good stand with the authority.
Table 1 - Vacant area available for Public Investment in each Free Zone as at January 2015, figures in sq. m.
Alexandria Port Said Nasr City Suez Ismailia Damietta Shibin Al Kom Qaft
26,893.40 32,146.88 25,917.69 246,746.65 26,150.22 - 2,204.20 443,953.52Source: SRM elaborations on GAFI data (November 2015)
Investment in Free Zones It is possible for any investor to establish his project in one of public free zones in any of the different industrial fields activities permitted by the system of the free zones in accordance with the provisions of Law No. 8 of 1997.
Activities which may not be permitted by free zones system:• Tobacco Industries.• Alcohol and alcoholic beverages Industries.• Weapons, ammunition, explosives and other industries related to the national security of the country.
The General Investment Authority allows the investor to establish his own project under the private free zones system to practice some fields of industrial activities, which are not allowed within the general free zones in accordance with the requirements of public free zones system in one of the following fields:• Ports development and the related logistic services.• Trading in containers and the related technical services.• Specialized petroleum industries.• Designing, construction, management, and maintenance of electricity power plants.• Labor-intensive Industrial fields achieving high-added value for the national economy.• Agricultural and food industries.• Reclamation and cultivation of land.• Breeding of cattle, poultry and fish.
69
The investor can also establish his own project under the private free zones system outside the scope of public free zones, in one of the following cases:• The lack of space available for the establishment of the project in the public free.• The nature of the business activity that may require technical and environmental requirements which may not conform
to the nature of the free zones.
Conditions of the establishment of an industrial project under the private free zone system1. Provided that there isn’t an appropriate site for an activity of a project within the public free zones and the required site
in the private free zone is the determining factor for the economics of the project.2. If the project takes the form of holding company or limited liability company or a branch, in one of the following cases:
• A branch of a foreign company, in this case the project is committed to provide the parent company's commercial register authenticated from the Egyptian embassy abroad before issuing the license for the project.
• A branch of one of the companies operating in the domestic investment system provided the presence of the parent company within the customs departments.
• The expansion of a private free zones projects in a location other than its current location.3. The paid up capital or the issued capital of the project is not less than USD 10 million, and its investment costs of USD 20
million. 4. The number of permanent employment in the project is not less than 500 workers.5. The proportion of exporting products of the project should not be less than 75%.6. The local ingredients ratio used by the project is not less than 20% excluding the mining raw materials or the extracted
from the component ratio. 7. Providing a schedule to begin in carrying on the activity with a commitment to the conditions and duration mentioned
in the approval decision of the GAFI.8. Procuring the approval of all competent authorities related to the activity of the project.9. Providing a statement for the power source required by the project and a pledge to abide by the Supreme Council of
Energy resolutions.10. Receiving good security query results of the shareholders and foreign partners in the project. 11. complying with implementing the requirements for buildings within the project site:
Conditions under which the establishment of an industrial project under the private free zone system may be exemptedThe general authority for investment allows the investor to establish his project under private free zones system without complying with the minimum requirements of the private free zones in the following cases:• In case the site area is included in the national plan of the country targeted to attract - investment for its development. • To be shareholders in the project a world-famous company. • The project is practicing one of labor-intensive industrial activities.
Provided the project meets the following percentages of the requirements prescribed:• 50% of the minimum paid-up capital or issued • 50% of the minimum for the investment costs • 50% of the minimum for the area of the project • 75% of the minimum for the number of workforce
Provided complete 100% of these requirements within a period not exceeding three years from the date of issuance of the license to practice the activity.
Requirements to establish a service project under private free zones system1. The issued capital for the project shall not be less than five million US dollars; in the case of establishing a project to practice maritime transport and shipping agency activity, the required investment costs is not less than ten million US dollars.2. The shipping transport projects and shipping agency shall begin to own or lease at least one ship.3. Procuring the approval of the competent authorities.4. Receiving good security query results of the shareholders and foreign partners in the project.5. Providing the ownership document of the site.
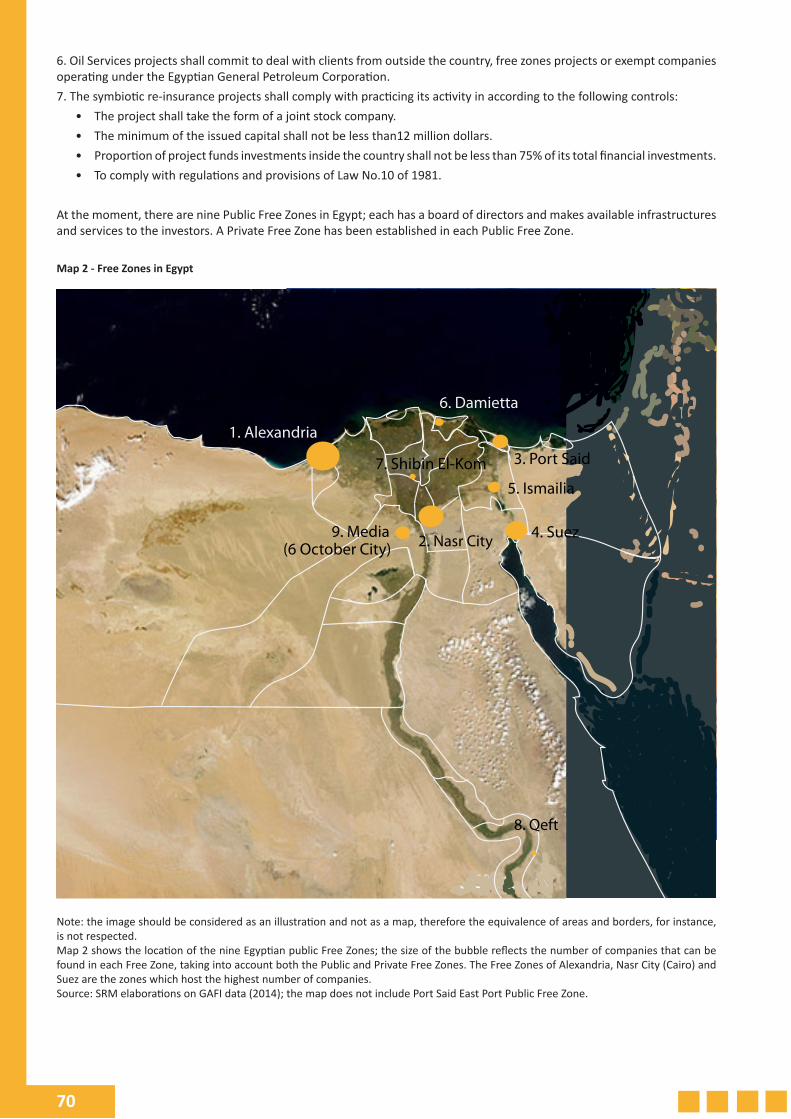
70
6. Oil Services projects shall commit to deal with clients from outside the country, free zones projects or exempt companies operating under the Egyptian General Petroleum Corporation. 7. The symbiotic re-insurance projects shall comply with practicing its activity in according to the following controls:
• The project shall take the form of a joint stock company.• The minimum of the issued capital shall not be less than12 million dollars.• Proportion of project funds investments inside the country shall not be less than 75% of its total financial investments.• To comply with regulations and provisions of Law No.10 of 1981.
At the moment, there are nine Public Free Zones in Egypt; each has a board of directors and makes available infrastructures and services to the investors. A Private Free Zone has been established in each Public Free Zone.
Map 2 - Free Zones in Egypt
8. Qeft
2. Nasr City
1. Alexandria 3. Port Said
4. Suez
5. Ismailia
6. Damietta
7. Shibin El-Kom
9. Media
(6 October City)
Note: the image should be considered as an illustration and not as a map, therefore the equivalence of areas and borders, for instance, is not respected. Map 2 shows the location of the nine Egyptian public Free Zones; the size of the bubble reflects the number of companies that can be found in each Free Zone, taking into account both the Public and Private Free Zones. The Free Zones of Alexandria, Nasr City (Cairo) and Suez are the zones which host the highest number of companies.Source: SRM elaborations on GAFI data (2014); the map does not include Port Said East Port Public Free Zone.
71
6. NEW TARGETED FREE ZONES
In the light of the rise of the economic returns attained by the Egyptian free zones, reaching 25% of industrial exports out of the country, the GAFI is seeking to expand by establishing three new public free zones.
6.1 Badr City Public Free Zone
Origin and beginning
The decree of the Prime Minister No. 806 of 2004 was issued with the approval of establishing a public free zone on an area of 1600 acres in Badr City.
Location benefits
The zone is located on the Cairo-Suez highway. Population of 2.5 million.
Distances: 20 Km from Cairo international airport; 60 Km from Suez port; 80 Km from El Sokhna port.
Implementation status
GAFI is coordinating with the administrative office of Badr city, the new urban communities authority and the National Centre for Planning State Lands Usage, to acquire the available remnant area of the location under the free of charge assets property transfer system, to enable the GAFI to finance and implement the location’s development and improving processes.
Vision and targets
An international public free zone for export-oriented industries with the investment cost expected to exceed EGP 2.25 billion for developing and improving the site on 5 phases for a range of 15 years
Suggested investment activities
• Renewable Energy generating technology • Engineering and electronic industries • Food processing and related industries • Medicines and medical supplements manufacturing
Targeted economic returns
• Attracting investments exceeding 3.5 billion USD by the end of the zone’s establishment’s last phase.• Creating around 150 thousand job opportunities.• Investments are expected to exceed 9 billion USD per year.• Exports are estimated to exceed 6 billion USD per year.
6.2 El Minya Public Free Zone
Origin and beginning
The decree of the Minya governorate No. 812 of 2012 was issued with the approval of allocating an area of 306.7 acres at the expansions area South of the Industrial park at El Matahra.
Location benefits
Distances
12 Km from Minya city the governorate’s; 300 Km from El Sokhna port through the Upper Egypt highway; located at the center of the industrial park and Matahra’s agriculture assemblies.
Natural resources
• The world’s finest limestone • The purest marble, sand and agricultural soil• The humidity of the climate helps in the ginning of the Extra- long staple cotton.• The most common crops are: grape. Onion and potatoes.• The sugar cane honey is known for its highest quality.
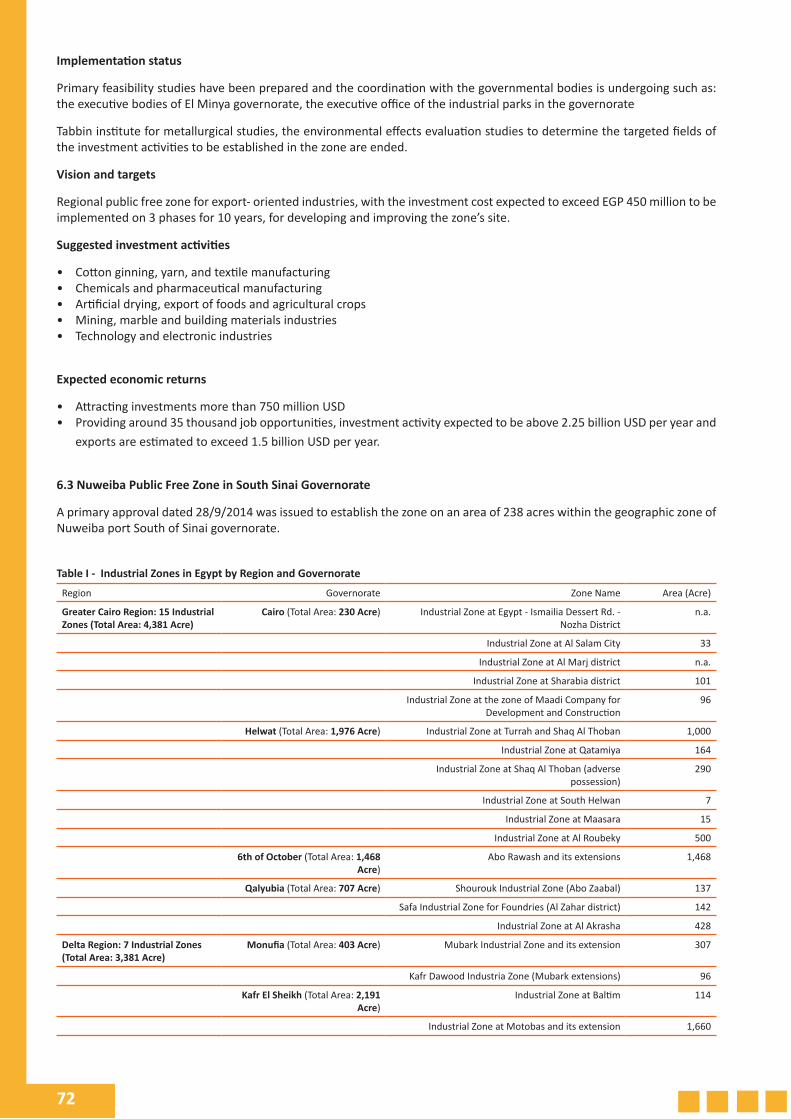
72
Implementation status
Primary feasibility studies have been prepared and the coordination with the governmental bodies is undergoing such as: the executive bodies of El Minya governorate, the executive office of the industrial parks in the governorate
Tabbin institute for metallurgical studies, the environmental effects evaluation studies to determine the targeted fields of the investment activities to be established in the zone are ended.
Vision and targets
Regional public free zone for export- oriented industries, with the investment cost expected to exceed EGP 450 million to be implemented on 3 phases for 10 years, for developing and improving the zone’s site.
Suggested investment activities
• Cotton ginning, yarn, and textile manufacturing • Chemicals and pharmaceutical manufacturing • Artificial drying, export of foods and agricultural crops• Mining, marble and building materials industries• Technology and electronic industries
Expected economic returns
• Attracting investments more than 750 million USD• Providing around 35 thousand job opportunities, investment activity expected to be above 2.25 billion USD per year and
exports are estimated to exceed 1.5 billion USD per year.
6.3 Nuweiba Public Free Zone in South Sinai Governorate
A primary approval dated 28/9/2014 was issued to establish the zone on an area of 238 acres within the geographic zone of Nuweiba port South of Sinai governorate.
Table I - Industrial Zones in Egypt by Region and Governorate
Region Governorate Zone Name Area (Acre)
Greater Cairo Region: 15 Industrial Zones (Total Area: 4,381 Acre)
Cairo (Total Area: 230 Acre) Industrial Zone at Egypt - Ismailia Dessert Rd. - Nozha District
n.a.
Industrial Zone at Al Salam City 33
Industrial Zone at Al Marj district n.a.
Industrial Zone at Sharabia district 101
Industrial Zone at the zone of Maadi Company for Development and Construction
96
Helwat (Total Area: 1,976 Acre) Industrial Zone at Turrah and Shaq Al Thoban 1,000
Industrial Zone at Qatamiya 164
Industrial Zone at Shaq Al Thoban (adverse possession)
290
Industrial Zone at South Helwan 7
Industrial Zone at Maasara 15
Industrial Zone at Al Roubeky 500
6th of October (Total Area: 1,468 Acre)
Abo Rawash and its extensions 1,468
Qalyubia (Total Area: 707 Acre) Shourouk Industrial Zone (Abo Zaabal) 137
Safa Industrial Zone for Foundries (Al Zahar district) 142
Industrial Zone at Al Akrasha 428
Delta Region: 7 Industrial Zones (Total Area: 3,381 Acre)
Monufia (Total Area: 403 Acre) Mubark Industrial Zone and its extension 307
Kafr Dawood Industria Zone (Mubark extensions) 96
Kafr El Sheikh (Total Area: 2,191 Acre)
Industrial Zone at Baltim 114
Industrial Zone at Motobas and its extension 1,660
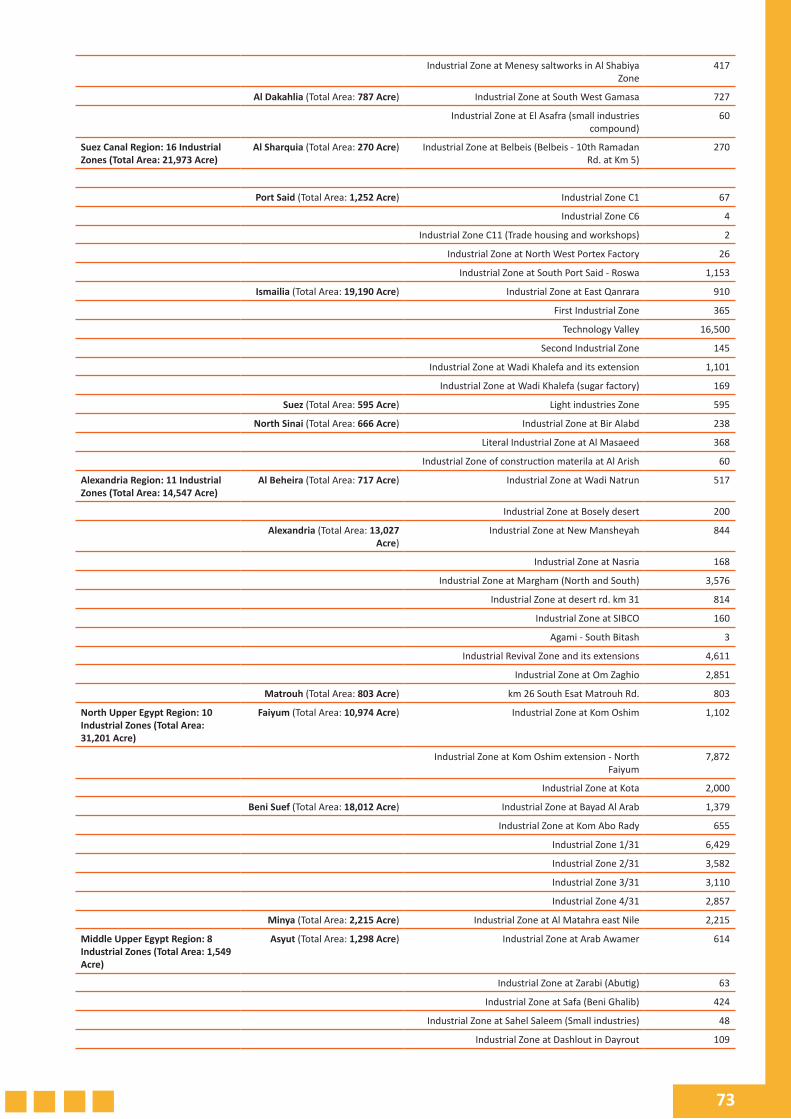
73
Industrial Zone at Menesy saltworks in Al Shabiya Zone
417
Al Dakahlia (Total Area: 787 Acre) Industrial Zone at South West Gamasa 727
Industrial Zone at El Asafra (small industries compound)
60
Suez Canal Region: 16 Industrial Zones (Total Area: 21,973 Acre)
Al Sharquia (Total Area: 270 Acre) Industrial Zone at Belbeis (Belbeis - 10th Ramadan Rd. at Km 5)
270
Port Said (Total Area: 1,252 Acre) Industrial Zone C1 67
Industrial Zone C6 4
Industrial Zone C11 (Trade housing and workshops) 2
Industrial Zone at North West Portex Factory 26
Industrial Zone at South Port Said - Roswa 1,153
Ismailia (Total Area: 19,190 Acre) Industrial Zone at East Qanrara 910
First Industrial Zone 365
Technology Valley 16,500
Second Industrial Zone 145
Industrial Zone at Wadi Khalefa and its extension 1,101
Industrial Zone at Wadi Khalefa (sugar factory) 169
Suez (Total Area: 595 Acre) Light industries Zone 595
North Sinai (Total Area: 666 Acre) Industrial Zone at Bir Alabd 238
Literal Industrial Zone at Al Masaeed 368
Industrial Zone of construction materila at Al Arish 60
Alexandria Region: 11 Industrial Zones (Total Area: 14,547 Acre)
Al Beheira (Total Area: 717 Acre) Industrial Zone at Wadi Natrun 517
Industrial Zone at Bosely desert 200
Alexandria (Total Area: 13,027 Acre)
Industrial Zone at New Mansheyah 844
Industrial Zone at Nasria 168
Industrial Zone at Margham (North and South) 3,576
Industrial Zone at desert rd. km 31 814
Industrial Zone at SIBCO 160
Agami - South Bitash 3
Industrial Revival Zone and its extensions 4,611
Industrial Zone at Om Zaghio 2,851
Matrouh (Total Area: 803 Acre) km 26 South Esat Matrouh Rd. 803
North Upper Egypt Region: 10 Industrial Zones (Total Area: 31,201 Acre)
Faiyum (Total Area: 10,974 Acre) Industrial Zone at Kom Oshim 1,102
Industrial Zone at Kom Oshim extension - North Faiyum
7,872
Industrial Zone at Kota 2,000
Beni Suef (Total Area: 18,012 Acre) Industrial Zone at Bayad Al Arab 1,379
Industrial Zone at Kom Abo Rady 655
Industrial Zone 1/31 6,429
Industrial Zone 2/31 3,582
Industrial Zone 3/31 3,110
Industrial Zone 4/31 2,857
Minya (Total Area: 2,215 Acre) Industrial Zone at Al Matahra east Nile 2,215
Middle Upper Egypt Region: 8 Industrial Zones (Total Area: 1,549 Acre)
Asyut (Total Area: 1,298 Acre) Industrial Zone at Arab Awamer 614
Industrial Zone at Zarabi (Abutig) 63
Industrial Zone at Safa (Beni Ghalib) 424
Industrial Zone at Sahel Saleem (Small industries) 48
Industrial Zone at Dashlout in Dayrout 109
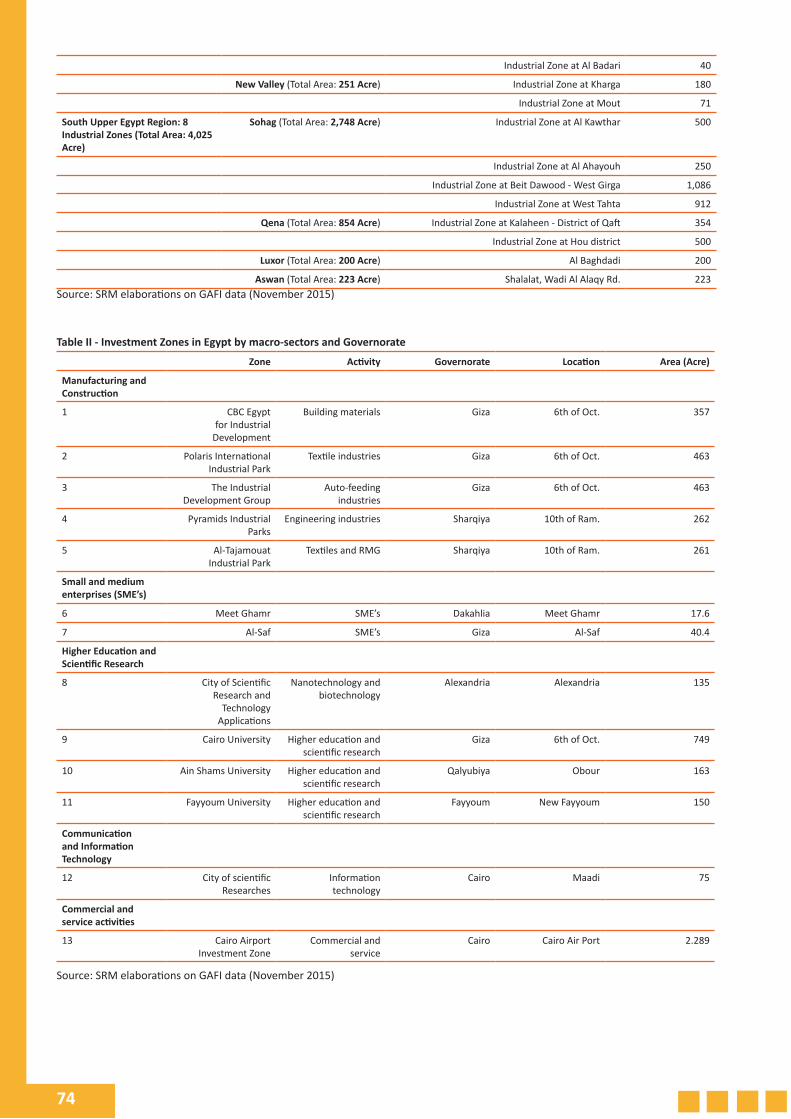
74
Industrial Zone at Al Badari 40
New Valley (Total Area: 251 Acre) Industrial Zone at Kharga 180
Industrial Zone at Mout 71
South Upper Egypt Region: 8 Industrial Zones (Total Area: 4,025 Acre)
Sohag (Total Area: 2,748 Acre) Industrial Zone at Al Kawthar 500
Industrial Zone at Al Ahayouh 250
Industrial Zone at Beit Dawood - West Girga 1,086
Industrial Zone at West Tahta 912
Qena (Total Area: 854 Acre) Industrial Zone at Kalaheen - District of Qaft 354
Industrial Zone at Hou district 500
Luxor (Total Area: 200 Acre) Al Baghdadi 200
Aswan (Total Area: 223 Acre) Shalalat, Wadi Al Alaqy Rd. 223Source: SRM elaborations on GAFI data (November 2015)
Table II - Investment Zones in Egypt by macro-sectors and Governorate
Zone Activity Governorate Location Area (Acre)
Manufacturing and Construction
1 CBC Egypt for Industrial
Development
Building materials Giza 6th of Oct. 357
2 Polaris International Industrial Park
Textile industries Giza 6th of Oct. 463
3 The Industrial Development Group
Auto-feeding industries
Giza 6th of Oct. 463
4 Pyramids Industrial Parks
Engineering industries Sharqiya 10th of Ram. 262
5 Al-Tajamouat Industrial Park
Textiles and RMG Sharqiya 10th of Ram. 261
Small and medium enterprises (SME’s)
6 Meet Ghamr SME’s Dakahlia Meet Ghamr 17.6
7 Al-Saf SME’s Giza Al-Saf 40.4
Higher Education and Scientific Research
8 City of Scientific Research and
Technology Applications
Nanotechnology and biotechnology
Alexandria Alexandria 135
9 Cairo University Higher education and scientific research
Giza 6th of Oct. 749
10 Ain Shams University Higher education and scientific research
Qalyubiya Obour 163
11 Fayyoum University Higher education and scientific research
Fayyoum New Fayyoum 150
Communication and Information Technology
12 City of scientific Researches
Information technology
Cairo Maadi 75
Commercial and service activities
13 Cairo Airport Investment Zone
Commercial and service
Cairo Cairo Air Port 2.289
Source: SRM elaborations on GAFI data (November 2015)
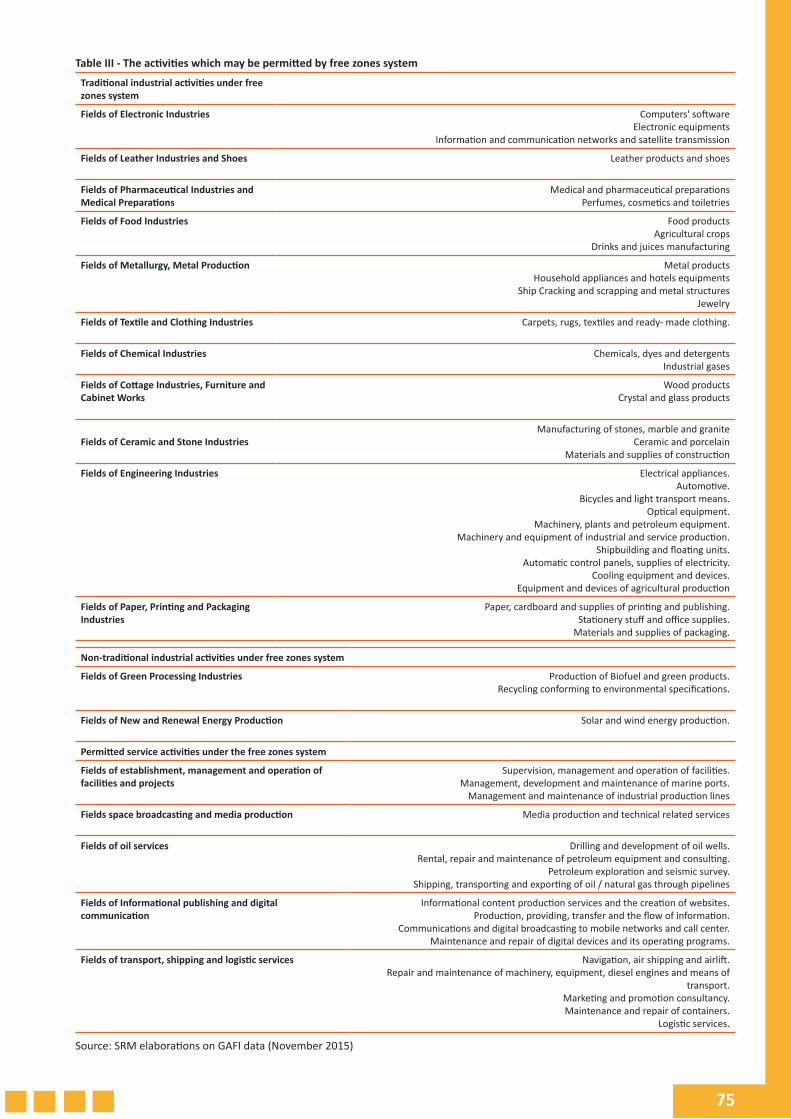
75
Table III - The activities which may be permitted by free zones system
Traditional industrial activities under free zones system
Fields of Electronic Industries Computers' softwareElectronic equipments
Information and communication networks and satellite transmission
Fields of Leather Industries and Shoes Leather products and shoes
Fields of Pharmaceutical Industries and Medical Preparations
Medical and pharmaceutical preparationsPerfumes, cosmetics and toiletries
Fields of Food Industries Food productsAgricultural crops
Drinks and juices manufacturing
Fields of Metallurgy, Metal Production Metal products Household appliances and hotels equipments
Ship Cracking and scrapping and metal structuresJewelry
Fields of Textile and Clothing Industries Carpets, rugs, textiles and ready- made clothing.
Fields of Chemical Industries Chemicals, dyes and detergentsIndustrial gases
Fields of Cottage Industries, Furniture and Cabinet Works
Wood productsCrystal and glass products
Fields of Ceramic and Stone IndustriesManufacturing of stones, marble and granite
Ceramic and porcelain Materials and supplies of construction
Fields of Engineering Industries Electrical appliances. Automotive.
Bicycles and light transport means. Optical equipment.
Machinery, plants and petroleum equipment. Machinery and equipment of industrial and service production.
Shipbuilding and floating units. Automatic control panels, supplies of electricity.
Cooling equipment and devices.Equipment and devices of agricultural production
Fields of Paper, Printing and Packaging Industries
Paper, cardboard and supplies of printing and publishing. Stationery stuff and office supplies.
Materials and supplies of packaging.
Non-traditional industrial activities under free zones system
Fields of Green Processing Industries Production of Biofuel and green products.Recycling conforming to environmental specifications.
Fields of New and Renewal Energy Production Solar and wind energy production.
Permitted service activities under the free zones system
Fields of establishment, management and operation of facilities and projects
Supervision, management and operation of facilities. Management, development and maintenance of marine ports.
Management and maintenance of industrial production lines
Fields space broadcasting and media production Media production and technical related services
Fields of oil services Drilling and development of oil wells. Rental, repair and maintenance of petroleum equipment and consulting.
Petroleum exploration and seismic survey. Shipping, transporting and exporting of oil / natural gas through pipelines
Fields of Informational publishing and digital communication
Informational content production services and the creation of websites. Production, providing, transfer and the flow of information.
Communications and digital broadcasting to mobile networks and call center.Maintenance and repair of digital devices and its operating programs.
Fields of transport, shipping and logistic services Navigation, air shipping and airlift. Repair and maintenance of machinery, equipment, diesel engines and means of
transport.Marketing and promotion consultancy. Maintenance and repair of containers.
Logistic services.
Source: SRM elaborations on GAFI data (November 2015)
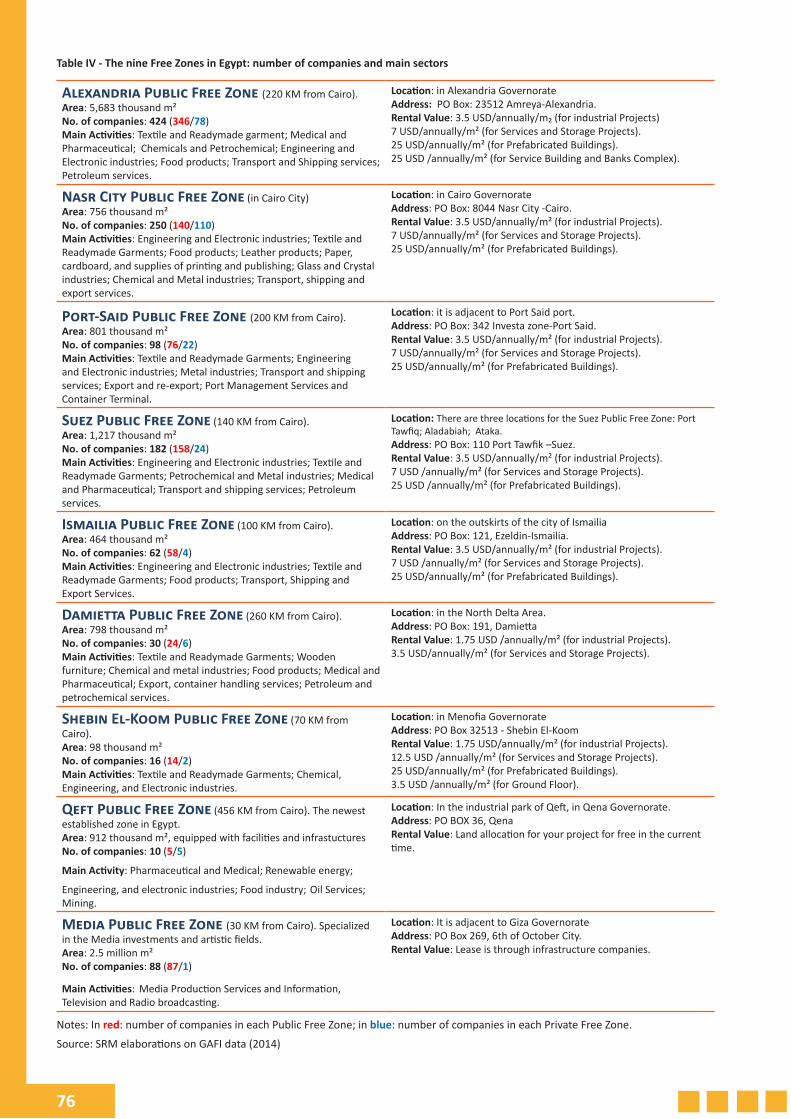
76
Table IV - The nine Free Zones in Egypt: number of companies and main sectors
Alexandria Public Free Zone (220 KM from Cairo). Area: 5,683 thousand m²No. of companies: 424 (346/78)Main Activities: Textile and Readymade garment; Medical and Pharmaceutical; Chemicals and Petrochemical; Engineering and Electronic industries; Food products; Transport and Shipping services; Petroleum services.
Location: in Alexandria Governorate Address: PO Box: 23512 Amreya-Alexandria.Rental Value: 3.5 USD/annually/m₂ (for industrial Projects)7 USD/annually/m² (for Services and Storage Projects).25 USD/annually/m² (for Prefabricated Buildings). 25 USD /annually/m² (for Service Building and Banks Complex).
Nasr City Public Free Zone (in Cairo City)Area: 756 thousand m² No. of companies: 250 (140/110)Main Activities: Engineering and Electronic industries; Textile and Readymade Garments; Food products; Leather products; Paper, cardboard, and supplies of printing and publishing; Glass and Crystal industries; Chemical and Metal industries; Transport, shipping and export services.
Location: in Cairo Governorate Address: PO Box: 8044 Nasr City -Cairo.Rental Value: 3.5 USD/annually/m² (for industrial Projects).7 USD/annually/m² (for Services and Storage Projects).25 USD/annually/m² (for Prefabricated Buildings).
Port-Said Public Free Zone (200 KM from Cairo). Area: 801 thousand m²No. of companies: 98 (76/22)Main Activities: Textile and Readymade Garments; Engineering and Electronic industries; Metal industries; Transport and shipping services; Export and re-export; Port Management Services and Container Terminal.
Location: it is adjacent to Port Said port.Address: PO Box: 342 Investa zone-Port Said.Rental Value: 3.5 USD/annually/m² (for industrial Projects).7 USD/annually/m² (for Services and Storage Projects). 25 USD/annually/m² (for Prefabricated Buildings).
Suez Public Free Zone (140 KM from Cairo).Area: 1,217 thousand m² No. of companies: 182 (158/24)Main Activities: Engineering and Electronic industries; Textile and Readymade Garments; Petrochemical and Metal industries; Medical and Pharmaceutical; Transport and shipping services; Petroleum services.
Location: There are three locations for the Suez Public Free Zone: Port Tawfiq; Aladabiah; Ataka.Address: PO Box: 110 Port Tawfik –Suez.Rental Value: 3.5 USD/annually/m² (for industrial Projects).7 USD /annually/m² (for Services and Storage Projects). 25 USD /annually/m² (for Prefabricated Buildings).
Ismailia Public Free Zone (100 KM from Cairo).Area: 464 thousand m²No. of companies: 62 (58/4)Main Activities: Engineering and Electronic industries; Textile and Readymade Garments; Food products; Transport, Shipping and Export Services.
Location: on the outskirts of the city of IsmailiaAddress: PO Box: 121, Ezeldin-Ismailia.Rental Value: 3.5 USD/annually/m² (for industrial Projects).7 USD /annually/m² (for Services and Storage Projects).25 USD/annually/m² (for Prefabricated Buildings).
Damietta Public Free Zone (260 KM from Cairo).Area: 798 thousand m²No. of companies: 30 (24/6)Main Activities: Textile and Readymade Garments; Wooden furniture; Chemical and metal industries; Food products; Medical and Pharmaceutical; Export, container handling services; Petroleum and petrochemical services.
Location: in the North Delta Area. Address: PO Box: 191, DamiettaRental Value: 1.75 USD /annually/m² (for industrial Projects).3.5 USD/annually/m² (for Services and Storage Projects).
Shebin El-Koom Public Free Zone (70 KM from Cairo).Area: 98 thousand m²No. of companies: 16 (14/2)Main Activities: Textile and Readymade Garments; Chemical, Engineering, and Electronic industries.
Location: in Menofia Governorate Address: PO Box 32513 - Shebin El-KoomRental Value: 1.75 USD/annually/m² (for industrial Projects).12.5 USD /annually/m² (for Services and Storage Projects).25 USD/annually/m² (for Prefabricated Buildings).3.5 USD /annually/m² (for Ground Floor).
Qeft Public Free Zone (456 KM from Cairo). The newest established zone in Egypt.Area: 912 thousand m², equipped with facilities and infrastucturesNo. of companies: 10 (5/5)
Main Activity: Pharmaceutical and Medical; Renewable energy; Engineering, and electronic industries; Food industry; Oil Services; Mining.
Location: In the industrial park of Qeft, in Qena Governorate.Address: PO BOX 36, QenaRental Value: Land allocation for your project for free in the current time.
Media Public Free Zone (30 KM from Cairo). Specialized in the Media investments and artistic fields. Area: 2.5 million m²No. of companies: 88 (87/1)
Main Activities: Media Production Services and Information, Television and Radio broadcasting.
Location: It is adjacent to Giza GovernorateAddress: PO Box 269, 6th of October City.Rental Value: Lease is through infrastructure companies.
Notes: In red: number of companies in each Public Free Zone; in blue: number of companies in each Private Free Zone.
Source: SRM elaborations on GAFI data (2014)
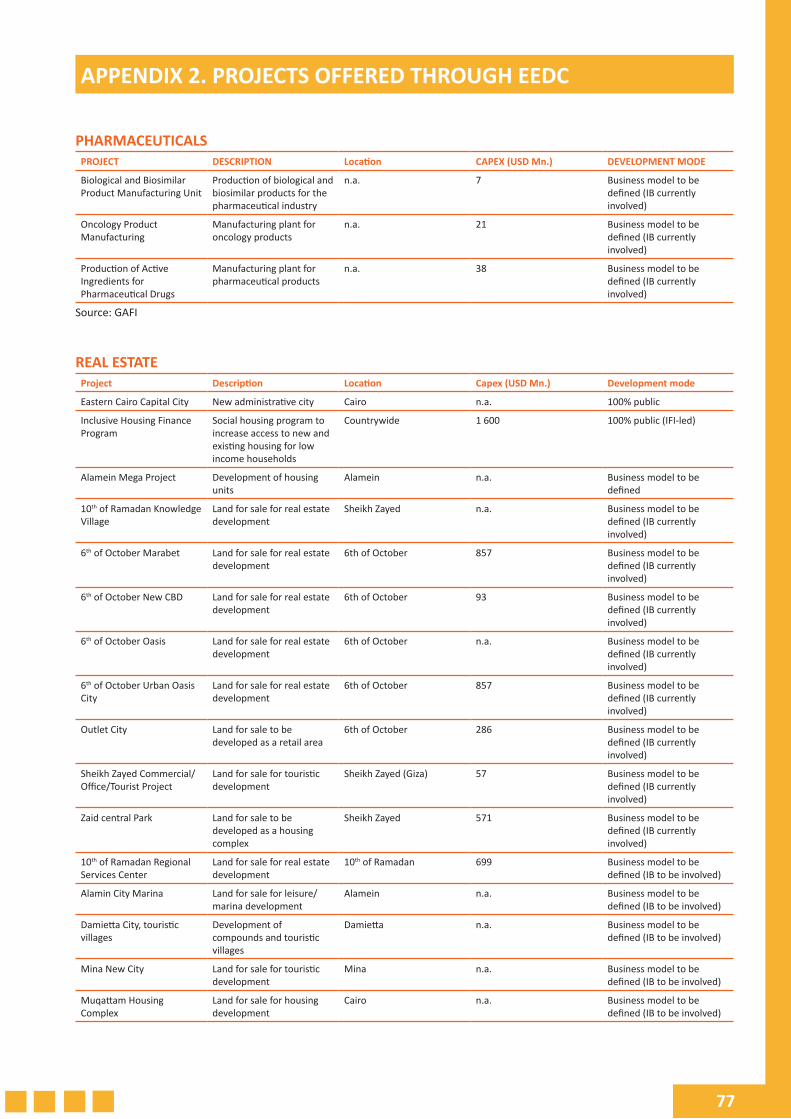
77
APPENDIX 2. PROJECTS OFFERED THROUGH EEDC
PHARMACEUTICALSPROJECT DESCRIPTION Location CAPEX (USD Mn.) DEVELOPMENT MODE
Biological and Biosimilar Product Manufacturing Unit
Production of biological and biosimilar products for the pharmaceutical industry
n.a. 7 Business model to be defined (IB currently involved)
Oncology Product Manufacturing
Manufacturing plant for oncology products
n.a. 21 Business model to be defined (IB currently involved)
Production of Active Ingredients for Pharmaceutical Drugs
Manufacturing plant for pharmaceutical products
n.a. 38 Business model to be defined (IB currently involved)
Source: GAFI
REAL ESTATEProject Description Location Capex (USD Mn.) Development mode
Eastern Cairo Capital City New administrative city Cairo n.a. 100% public
Inclusive Housing Finance Program
Social housing program to increase access to new and existing housing for low income households
Countrywide 1 600 100% public (IFI-led)
Alamein Mega Project Development of housing units
Alamein n.a. Business model to be defined
10th of Ramadan Knowledge Village
Land for sale for real estate development
Sheikh Zayed n.a. Business model to be defined (IB currently involved)
6th of October Marabet Land for sale for real estate development
6th of October 857 Business model to be defined (IB currently involved)
6th of October New CBD Land for sale for real estate development
6th of October 93 Business model to be defined (IB currently involved)
6th of October Oasis Land for sale for real estate development
6th of October n.a. Business model to be defined (IB currently involved)
6th of October Urban Oasis City
Land for sale for real estate development
6th of October 857 Business model to be defined (IB currently involved)
Outlet City Land for sale to be developed as a retail area
6th of October 286 Business model to be defined (IB currently involved)
Sheikh Zayed Commercial/Office/Tourist Project
Land for sale for touristic development
Sheikh Zayed (Giza) 57 Business model to be defined (IB currently involved)
Zaid central Park Land for sale to be developed as a housing complex
Sheikh Zayed 571 Business model to be defined (IB currently involved)
10th of Ramadan Regional Services Center
Land for sale for real estate development
10th of Ramadan 699 Business model to be defined (IB to be involved)
Alamin City Marina Land for sale for leisure/marina development
Alamein n.a. Business model to be defined (IB to be involved)
Damietta City, touristic villages
Development of compounds and touristic villages
Damietta n.a. Business model to be defined (IB to be involved)
Mina New City Land for sale for touristic development
Mina n.a. Business model to be defined (IB to be involved)
Muqattam Housing Complex
Land for sale for housing development
Cairo n.a. Business model to be defined (IB to be involved)
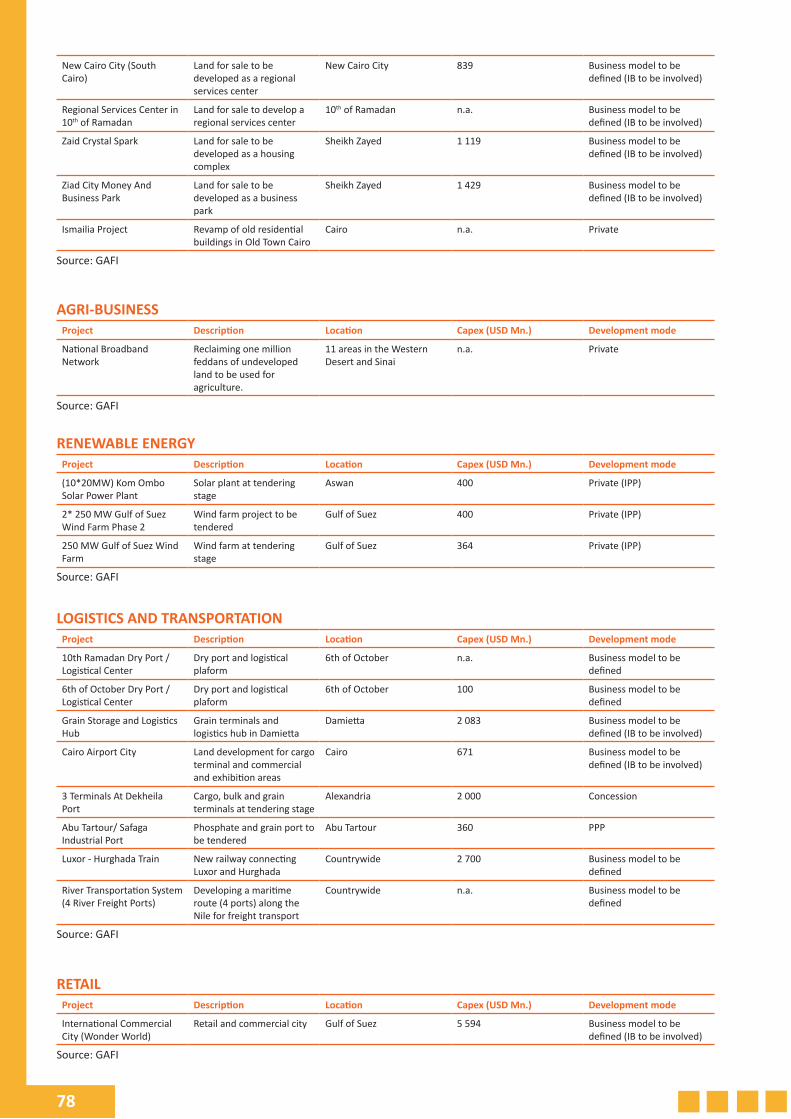
78
New Cairo City (South Cairo)
Land for sale to be developed as a regional services center
New Cairo City 839 Business model to be defined (IB to be involved)
Regional Services Center in 10th of Ramadan
Land for sale to develop a regional services center
10th of Ramadan n.a. Business model to be defined (IB to be involved)
Zaid Crystal Spark Land for sale to be developed as a housing complex
Sheikh Zayed 1 119 Business model to be defined (IB to be involved)
Ziad City Money And Business Park
Land for sale to be developed as a business park
Sheikh Zayed 1 429 Business model to be defined (IB to be involved)
Ismailia Project Revamp of old residential buildings in Old Town Cairo
Cairo n.a. Private
Source: GAFI
AGRI-BUSINESSProject Description Location Capex (USD Mn.) Development mode
National Broadband Network
Reclaiming one million feddans of undeveloped land to be used for agriculture.
11 areas in the Western Desert and Sinai
n.a. Private
Source: GAFI
RENEWABLE ENERGYProject Description Location Capex (USD Mn.) Development mode
(10*20MW) Kom Ombo Solar Power Plant
Solar plant at tendering stage
Aswan 400 Private (IPP)
2* 250 MW Gulf of Suez Wind Farm Phase 2
Wind farm project to be tendered
Gulf of Suez 400 Private (IPP)
250 MW Gulf of Suez Wind Farm
Wind farm at tendering stage
Gulf of Suez 364 Private (IPP)
Source: GAFI
LOGISTICS AND TRANSPORTATIONProject Description Location Capex (USD Mn.) Development mode
10th Ramadan Dry Port / Logistical Center
Dry port and logistical plaform
6th of October n.a. Business model to be defined
6th of October Dry Port / Logistical Center
Dry port and logistical plaform
6th of October 100 Business model to be defined
Grain Storage and Logistics Hub
Grain terminals and logistics hub in Damietta
Damietta 2 083 Business model to be defined (IB to be involved)
Cairo Airport City Land development for cargo terminal and commercial and exhibition areas
Cairo 671 Business model to be defined (IB to be involved)
3 Terminals At Dekheila Port
Cargo, bulk and grain terminals at tendering stage
Alexandria 2 000 Concession
Abu Tartour/ Safaga Industrial Port
Phosphate and grain port to be tendered
Abu Tartour 360 PPP
Luxor - Hurghada Train New railway connecting Luxor and Hurghada
Countrywide 2 700 Business model to be defined
River Transportation System (4 River Freight Ports)
Developing a maritime route (4 ports) along the Nile for freight transport
Countrywide n.a. Business model to be defined
Source: GAFI
RETAILProject Description Location Capex (USD Mn.) Development mode
International Commercial City (Wonder World)
Retail and commercial city Gulf of Suez 5 594 Business model to be defined (IB to be involved)
Source: GAFI
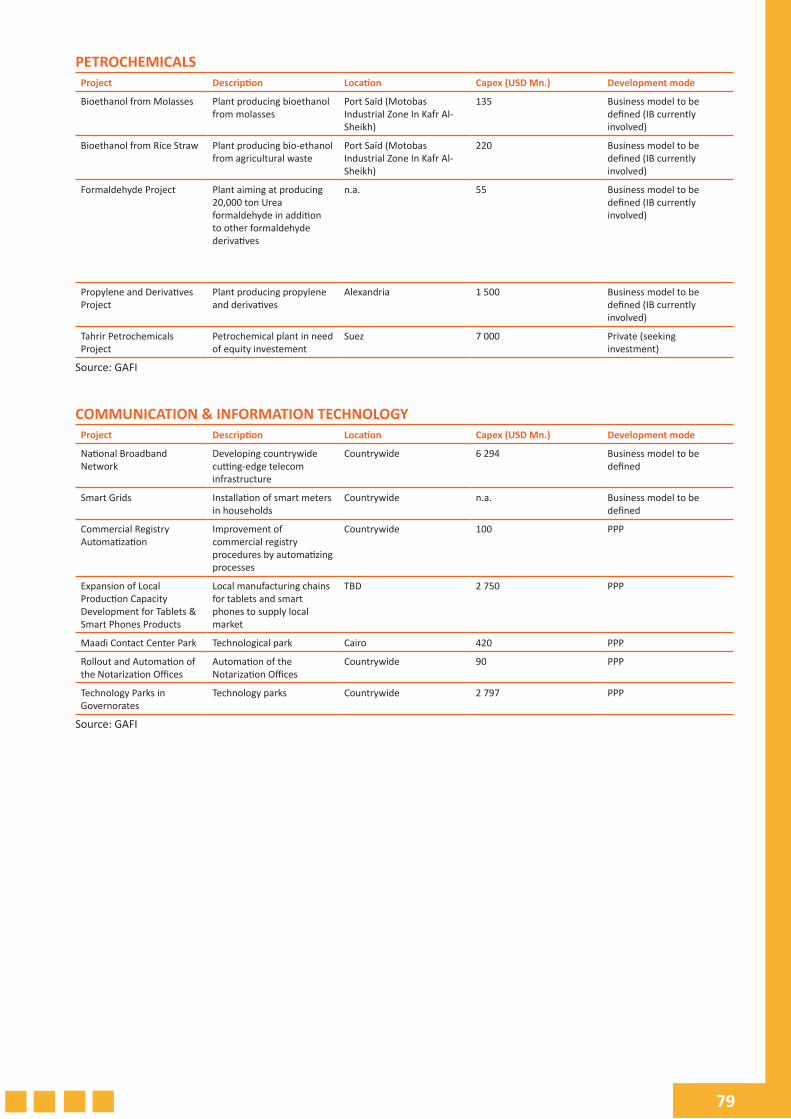
79
PETROCHEMICALSProject Description Location Capex (USD Mn.) Development mode
Bioethanol from Molasses Plant producing bioethanol from molasses
Port Saïd (Motobas Industrial Zone In Kafr Al-Sheikh)
135 Business model to be defined (IB currently involved)
Bioethanol from Rice Straw Plant producing bio-ethanol from agricultural waste
Port Saïd (Motobas Industrial Zone In Kafr Al-Sheikh)
220 Business model to be defined (IB currently involved)
Formaldehyde Project Plant aiming at producing 20,000 ton Urea formaldehyde in addition to other formaldehyde derivatives
n.a. 55 Business model to be defined (IB currently involved)
Propylene and Derivatives Project
Plant producing propylene and derivatives
Alexandria 1 500 Business model to be defined (IB currently involved)
Tahrir Petrochemicals Project
Petrochemical plant in need of equity investement
Suez 7 000 Private (seeking investment)
Source: GAFI
COMMUNICATION & INFORMATION TECHNOLOGY Project Description Location Capex (USD Mn.) Development mode
National Broadband Network
Developing countrywide cutting-edge telecom infrastructure
Countrywide 6 294 Business model to be defined
Smart Grids Installation of smart meters in households
Countrywide n.a. Business model to be defined
Commercial Registry Automatization
Improvement of commercial registry procedures by automatizing processes
Countrywide 100 PPP
Expansion of Local Production Capacity Development for Tablets & Smart Phones Products
Local manufacturing chains for tablets and smart phones to supply local market
TBD 2 750 PPP
Maadi Contact Center Park Technological park Cairo 420 PPP
Rollout and Automation of the Notarization Offices
Automation of the Notarization Offices
Countrywide 90 PPP
Technology Parks in Governorates
Technology parks Countrywide 2 797 PPP
Source: GAFI
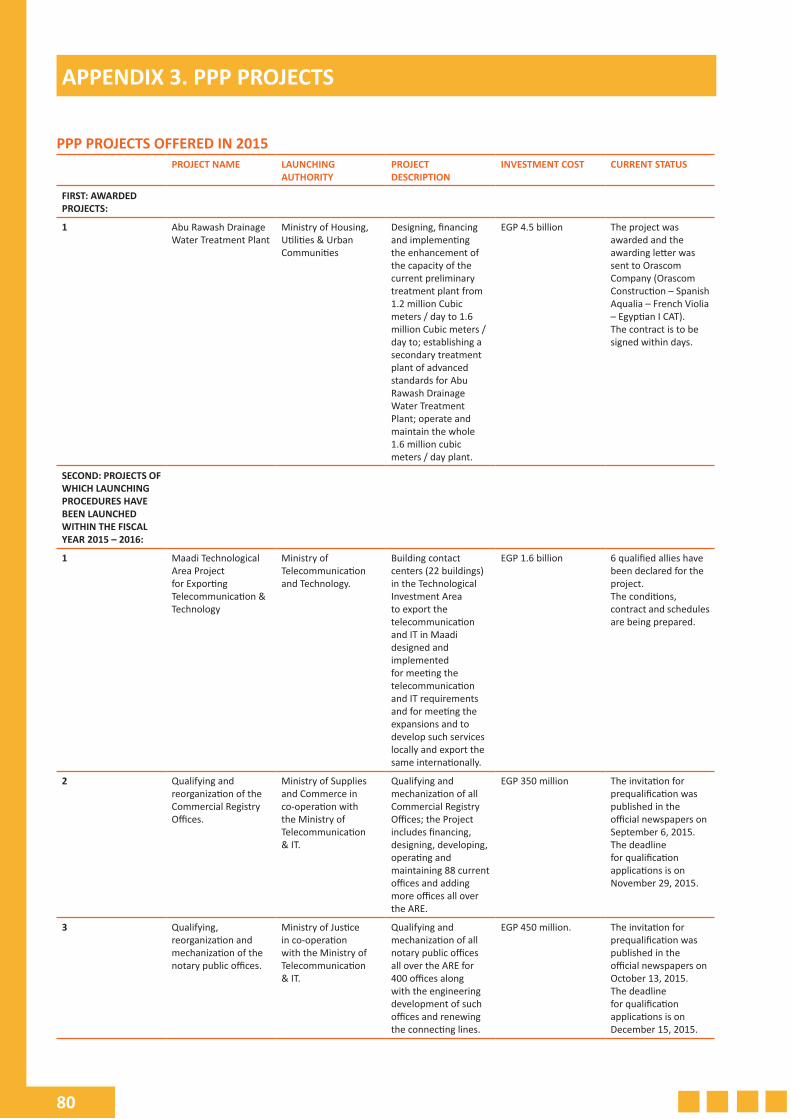
80
APPENDIX 3. PPP PROJECTS
PPP PROJECTS OFFERED IN 2015PROJECT NAME LAUNCHING
AUTHORITYPROJECT DESCRIPTION
INVESTMENT COST CURRENT STATUS
FIRST: AWARDED PROJECTS:
1 Abu Rawash Drainage Water Treatment Plant
Ministry of Housing, Utilities & Urban Communities
Designing, financing and implementing the enhancement of the capacity of the current preliminary treatment plant from 1.2 million Cubic meters / day to 1.6 million Cubic meters / day to; establishing a secondary treatment plant of advanced standards for Abu Rawash Drainage Water Treatment Plant; operate and maintain the whole 1.6 million cubic meters / day plant.
EGP 4.5 billion The project was awarded and the awarding letter was sent to Orascom Company (Orascom Construction – Spanish Aqualia – French Violia – Egyptian I CAT). The contract is to be signed within days.
SECOND: PROJECTS OF WHICH LAUNCHING PROCEDURES HAVE BEEN LAUNCHED WITHIN THE FISCAL YEAR 2015 – 2016:
1 Maadi Technological Area Project for Exporting Telecommunication & Technology
Ministry of Telecommunication and Technology.
Building contact centers (22 buildings) in the Technological Investment Area to export the telecommunication and IT in Maadi designed and implemented for meeting the telecommunication and IT requirements and for meeting the expansions and to develop such services locally and export the same internationally.
EGP 1.6 billion 6 qualified allies have been declared for the project. The conditions, contract and schedules are being prepared.
2 Qualifying and reorganization of the Commercial Registry Offices.
Ministry of Supplies and Commerce in co-operation with the Ministry of Telecommunication & IT.
Qualifying and mechanization of all Commercial Registry Offices; the Project includes financing, designing, developing, operating and maintaining 88 current offices and adding more offices all over the ARE.
EGP 350 million The invitation for prequalification was published in the official newspapers on September 6, 2015. The deadline for qualification applications is on November 29, 2015.
3 Qualifying, reorganization and mechanization of the notary public offices.
Ministry of Justice in co-operation with the Ministry of Telecommunication & IT.
Qualifying and mechanization of all notary public offices all over the ARE for 400 offices along with the engineering development of such offices and renewing the connecting lines.
EGP 450 million. The invitation for prequalification was published in the official newspapers on October 13, 2015. The deadline for qualification applications is on December 15, 2015.
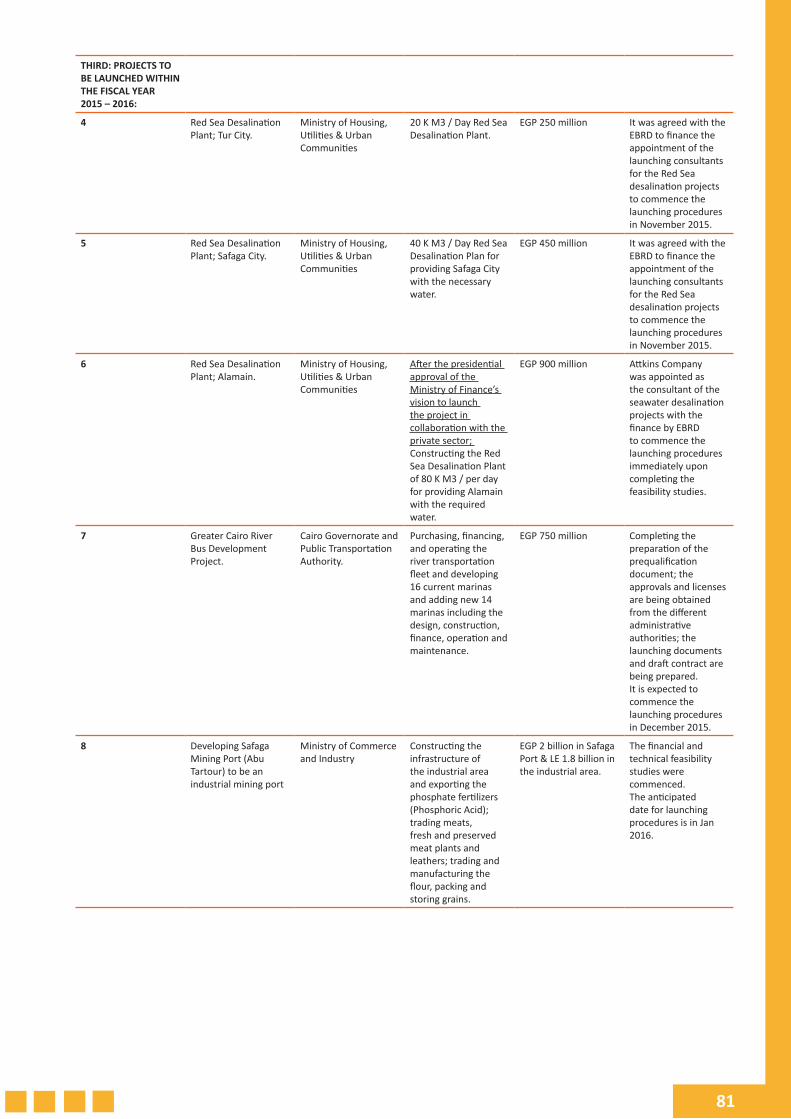
81
THIRD: PROJECTS TO BE LAUNCHED WITHIN THE FISCAL YEAR 2015 – 2016:
4 Red Sea Desalination Plant; Tur City.
Ministry of Housing, Utilities & Urban Communities
20 K M3 / Day Red Sea Desalination Plant.
EGP 250 million It was agreed with the EBRD to finance the appointment of the launching consultants for the Red Sea desalination projects to commence the launching procedures in November 2015.
5 Red Sea Desalination Plant; Safaga City.
Ministry of Housing, Utilities & Urban Communities
40 K M3 / Day Red Sea Desalination Plan for providing Safaga City with the necessary water.
EGP 450 million It was agreed with the EBRD to finance the appointment of the launching consultants for the Red Sea desalination projects to commence the launching procedures in November 2015.
6 Red Sea Desalination Plant; Alamain.
Ministry of Housing, Utilities & Urban Communities
After the presidential approval of the Ministry of Finance’s vision to launch the project in collaboration with the private sector; Constructing the Red Sea Desalination Plant of 80 K M3 / per day for providing Alamain with the required water.
EGP 900 million Attkins Company was appointed as the consultant of the seawater desalination projects with the finance by EBRD to commence the launching procedures immediately upon completing the feasibility studies.
7 Greater Cairo River Bus Development Project.
Cairo Governorate and Public Transportation Authority.
Purchasing, financing, and operating the river transportation fleet and developing 16 current marinas and adding new 14 marinas including the design, construction, finance, operation and maintenance.
EGP 750 million Completing the preparation of the prequalification document; the approvals and licenses are being obtained from the different administrative authorities; the launching documents and draft contract are being prepared. It is expected to commence the launching procedures in December 2015.
8 Developing Safaga Mining Port (Abu Tartour) to be an industrial mining port
Ministry of Commerce and Industry
Constructing the infrastructure of the industrial area and exporting the phosphate fertilizers (Phosphoric Acid); trading meats, fresh and preserved meat plants and leathers; trading and manufacturing the flour, packing and storing grains.
EGP 2 billion in Safaga Port & LE 1.8 billion in the industrial area.
The financial and technical feasibility studies were commenced. The anticipated date for launching procedures is in Jan 2016.
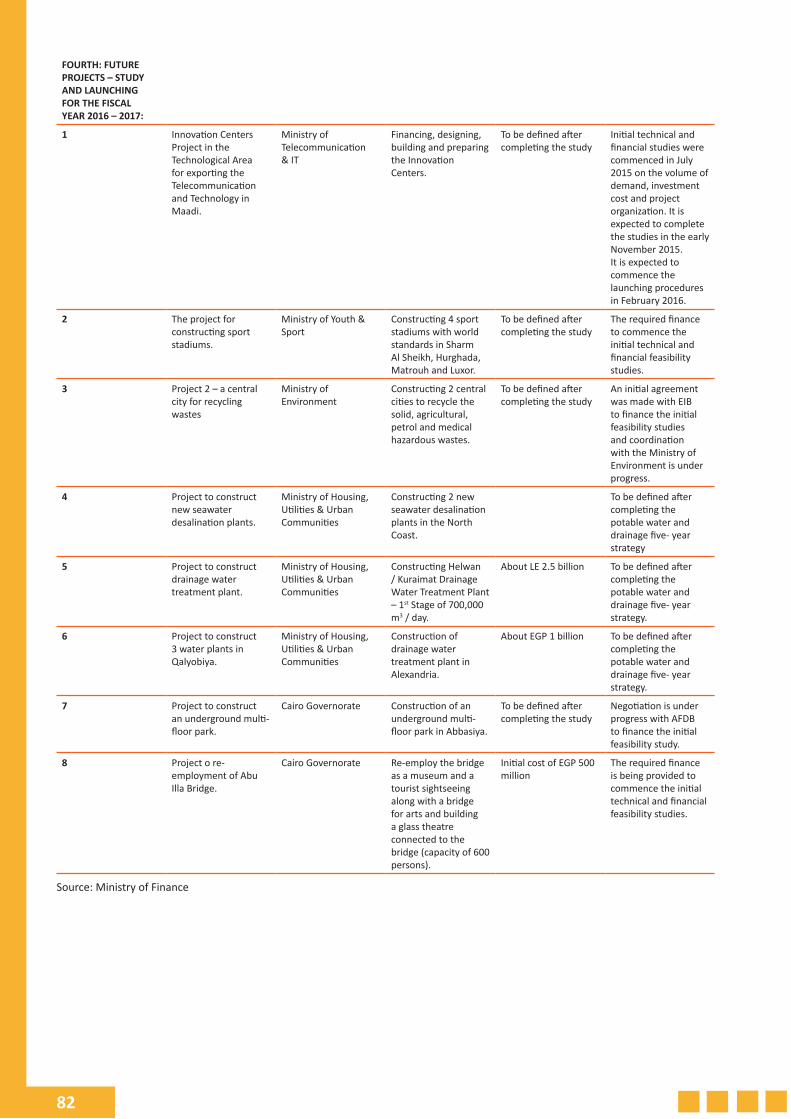
82
FOURTH: FUTURE PROJECTS – STUDY AND LAUNCHING FOR THE FISCAL YEAR 2016 – 2017:
1 Innovation Centers Project in the Technological Area for exporting the Telecommunication and Technology in Maadi.
Ministry of Telecommunication & IT
Financing, designing, building and preparing the Innovation Centers.
To be defined after completing the study
Initial technical and financial studies were commenced in July 2015 on the volume of demand, investment cost and project organization. It is expected to complete the studies in the early November 2015. It is expected to commence the launching procedures in February 2016.
2 The project for constructing sport stadiums.
Ministry of Youth & Sport
Constructing 4 sport stadiums with world standards in Sharm Al Sheikh, Hurghada, Matrouh and Luxor.
To be defined after completing the study
The required finance to commence the initial technical and financial feasibility studies.
3 Project 2 – a central city for recycling wastes
Ministry of Environment
Constructing 2 central cities to recycle the solid, agricultural, petrol and medical hazardous wastes.
To be defined after completing the study
An initial agreement was made with EIB to finance the initial feasibility studies and coordination with the Ministry of Environment is under progress.
4 Project to construct new seawater desalination plants.
Ministry of Housing, Utilities & Urban Communities
Constructing 2 new seawater desalination plants in the North Coast.
To be defined after completing the potable water and drainage five- year strategy
5 Project to construct drainage water treatment plant.
Ministry of Housing, Utilities & Urban Communities
Constructing Helwan / Kuraimat Drainage Water Treatment Plant – 1st Stage of 700,000 m3 / day.
About LE 2.5 billion To be defined after completing the potable water and drainage five- year strategy.
6 Project to construct 3 water plants in Qalyobiya.
Ministry of Housing, Utilities & Urban Communities
Construction of drainage water treatment plant in Alexandria.
About EGP 1 billion To be defined after completing the potable water and drainage five- year strategy.
7 Project to construct an underground multi- floor park.
Cairo Governorate Construction of an underground multi- floor park in Abbasiya.
To be defined after completing the study
Negotiation is under progress with AFDB to finance the initial feasibility study.
8 Project o re-employment of Abu Illa Bridge.
Cairo Governorate Re-employ the bridge as a museum and a tourist sightseeing along with a bridge for arts and building a glass theatre connected to the bridge (capacity of 600 persons).
Initial cost of EGP 500 million
The required finance is being provided to commence the initial technical and financial feasibility studies.
Source: Ministry of Finance
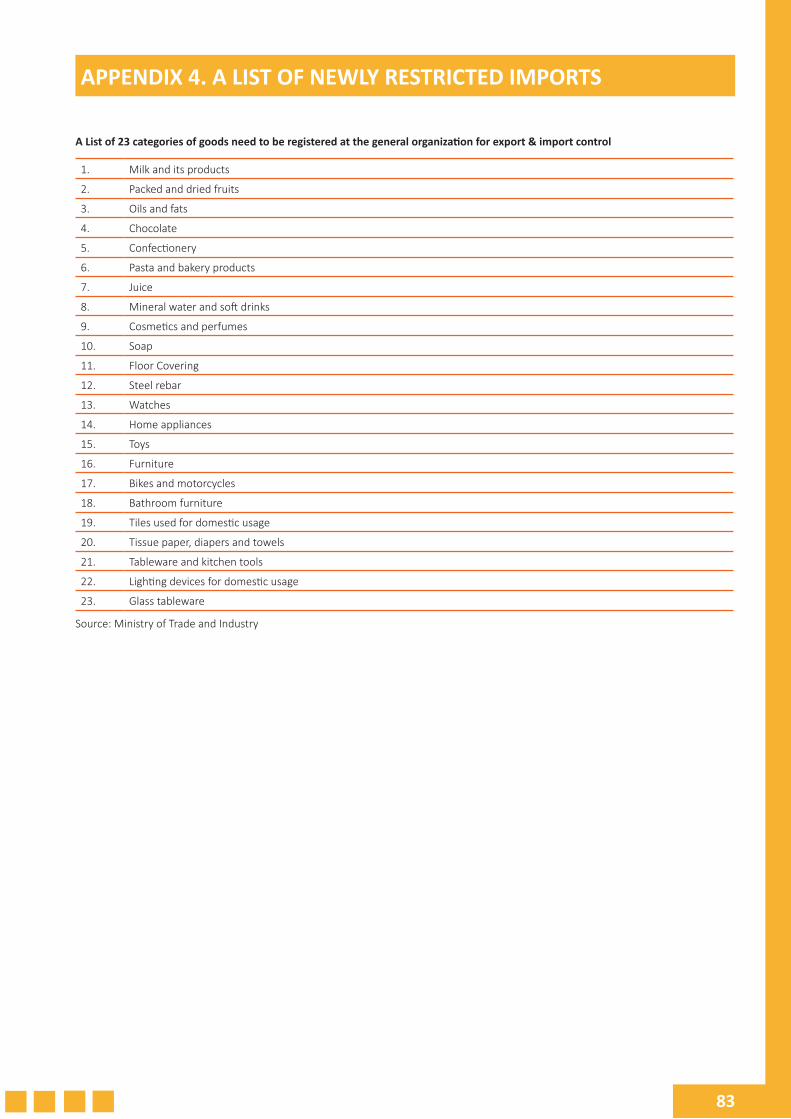
83
APPENDIX 4. A LIST OF NEWLY RESTRICTED IMPORTS
A List of 23 categories of goods need to be registered at the general organization for export & import control
1. Milk and its products
2. Packed and dried fruits
3. Oils and fats
4. Chocolate
5. Confectionery
6. Pasta and bakery products
7. Juice
8. Mineral water and soft drinks
9. Cosmetics and perfumes
10. Soap
11. Floor Covering
12. Steel rebar
13. Watches
14. Home appliances
15. Toys
16. Furniture
17. Bikes and motorcycles
18. Bathroom furniture
19. Tiles used for domestic usage
20. Tissue paper, diapers and towels
21. Tableware and kitchen tools
22. Lighting devices for domestic usage
23. Glass tableware
Source: Ministry of Trade and Industry
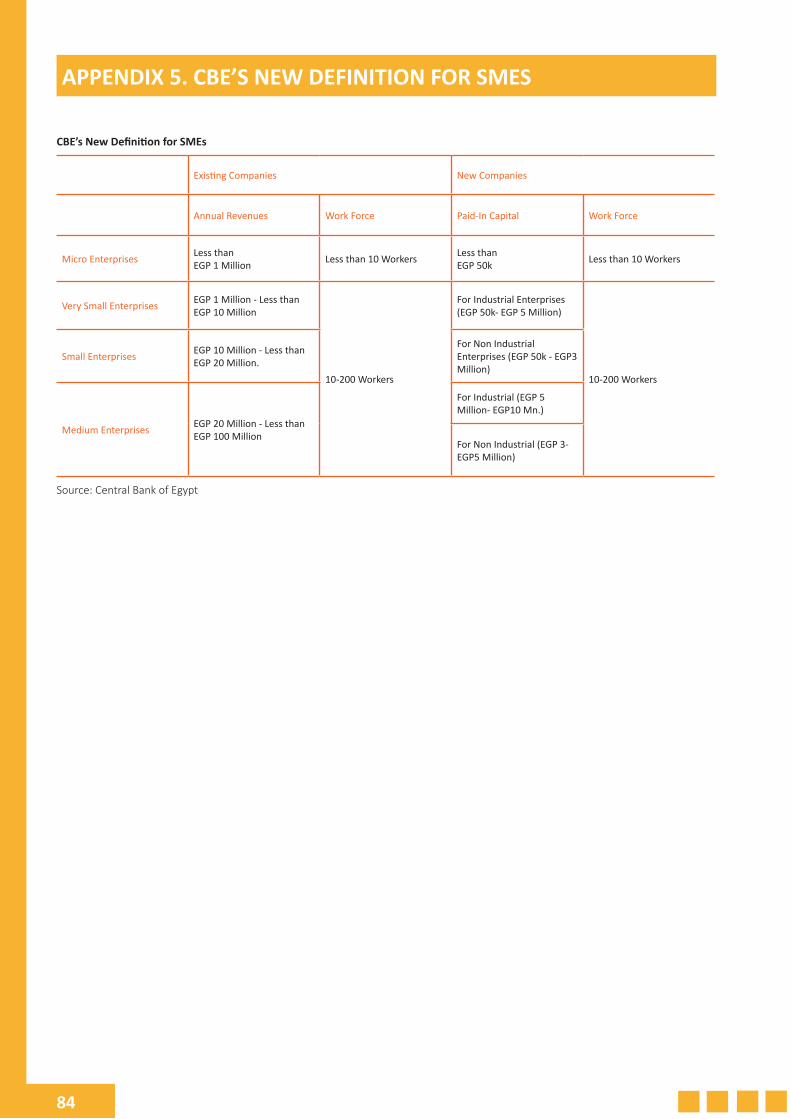
84
APPENDIX 5. CBE’S NEW DEFINITION FOR SMES
CBE’s New Definition for SMEs
Existing Companies New Companies
Annual Revenues Work Force Paid-In Capital Work Force
Micro Enterprises Less thanEGP 1 Million Less than 10 Workers Less than
EGP 50k Less than 10 Workers
Very Small Enterprises EGP 1 Million - Less than EGP 10 Million
10-200 Workers
For Industrial Enterprises (EGP 50k- EGP 5 Million)
10-200 Workers
Small Enterprises EGP 10 Million - Less than EGP 20 Million.
For Non Industrial Enterprises (EGP 50k - EGP3 Million)
Medium Enterprises EGP 20 Million - Less than EGP 100 Million
For Industrial (EGP 5 Million- EGP10 Mn.)
For Non Industrial (EGP 3- EGP5 Million)
Source: Central Bank of Egypt
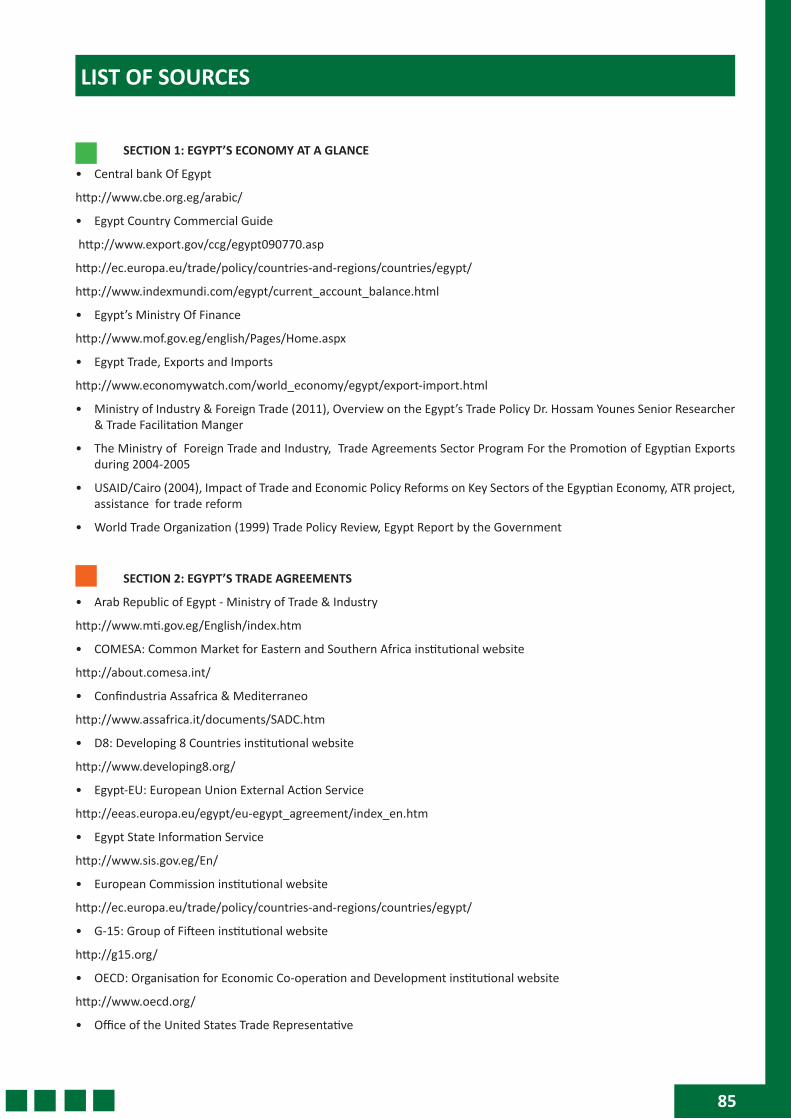
85
LIST OF SOURCES
SECTION 1: EGYPT’S ECONOMY AT A GLANCE
• Central bank Of Egypt
http://www.cbe.org.eg/arabic/
• Egypt Country Commercial Guide
http://www.export.gov/ccg/egypt090770.asp
http://ec.europa.eu/trade/policy/countries-and-regions/countries/egypt/
http://www.indexmundi.com/egypt/current_account_balance.html
• Egypt’s Ministry Of Finance
http://www.mof.gov.eg/english/Pages/Home.aspx
• Egypt Trade, Exports and Imports
http://www.economywatch.com/world_economy/egypt/export-import.html
• Ministry of Industry & Foreign Trade (2011), Overview on the Egypt’s Trade Policy Dr. Hossam Younes Senior Researcher & Trade Facilitation Manger
• The Ministry of Foreign Trade and Industry, Trade Agreements Sector Program For the Promotion of Egyptian Exports during 2004-2005
• USAID/Cairo (2004), Impact of Trade and Economic Policy Reforms on Key Sectors of the Egyptian Economy, ATR project, assistance for trade reform
• World Trade Organization (1999) Trade Policy Review, Egypt Report by the Government
SECTION 2: EGYPT’S TRADE AGREEMENTS
• Arab Republic of Egypt - Ministry of Trade & Industry
http://www.mti.gov.eg/English/index.htm
• COMESA: Common Market for Eastern and Southern Africa institutional website
http://about.comesa.int/
• Confindustria Assafrica & Mediterraneo
http://www.assafrica.it/documents/SADC.htm
• D8: Developing 8 Countries institutional website
http://www.developing8.org/
• Egypt-EU: European Union External Action Service
http://eeas.europa.eu/egypt/eu-egypt_agreement/index_en.htm
• Egypt State Information Service
http://www.sis.gov.eg/En/
• European Commission institutional website
http://ec.europa.eu/trade/policy/countries-and-regions/countries/egypt/
• G-15: Group of Fifteen institutional website
http://g15.org/
• OECD: Organisation for Economic Co-operation and Development institutional website
http://www.oecd.org/
• Office of the United States Trade Representative
86
https://ustr.gov/trade-agreements/trade-investment-framework-agreements
• QIZ: Egypt Qualifying Industrial Zones institutional website
http://www.qizegypt.gov.eg/
• SADC: Southern African Development Community institutional website
http://www.sadc.int/
• TIFA: American Chamber of Commerce in Egypt
http://www.amcham.org.eg/
• UEMOA: Ministry of Trade & Industry (Trade Agreement Sector)
http://www.tas.gov.eg/English/Trade%20Agreements/Countries%20and%20Regions/Africa/agreements
• Unctad Stat
http://unctad.org/en/Pages/Statistics.aspx
SECTION 3: AFRICA….THE NEW PATHWAY OF GROWTH
• AFREXIMBANK, Egypt Business Forum (February 24, 2015), Facilitating Egypt-Africa Trade in the Context of Opportunities in Africa, by Dr. Benedict Oramah
• A Trinity of Trade: Africa soon to Launch TFTA.
http://www.cipe.org/blog/2015/06/18/a-trinity-of-trade-africa-soon-to-launch-tfta/
• Attracting international private finance for African infrastructure, Paul Collier , Journal of African Trade, September 2014
http://www.sciencedirect.com/science/journal/22148515
• Center(IQPC) (2015), State of the Market: Transport Infrastructure Projects in Egypt, International Quality and Productively
• Ministry of Industry continues free trade negotiations with African IMO, CEMAC blocs, http://www.dailynewsegypt.com/2015/08/08/ministry-of-industry-continues-free-trade-negotiations-with-african-imo-cemac-blocs/
• N Gage Consulting (October 2015), African Tripartite Free Trade Agreement ,Egyptian-African Workshop, General Report
• OECD (2014), Business Climate Review of Egypt ,Investment Policies and Public-Private Partnerships
www.tradebarriers.org
• The industrialization challenge for Africa: Towards a commodities based industrialization path, Mike Morris & Judith Fessehaie, , Journal of African Trade, November 2014
http://www.sciencedirect.com/science/journal/22148515
• The Ministry of Trade and Industry (June 2015), Egyptian-African commercial relationship ,the development of Egypt’s relation with COMESA and African blocs during 2010-Q1 2015
• The Tripartite Free Trade Africa: Is It the Way to Deepen Integration in Africa?
http://www.brookings.edu/blogs/africa-in-focus/posts/2014/11/04-tripartite-free-trade-area-integration-africa-de-melo
• Tripartite Free Trade Area (TFTA),Jun 2015
http://www.ngage-consulting.com/
• United Nations, Economic commission for Africa (2015), Industrialization Through Trade, Economic Report on Africa
• United States Trade Representative (2015), National Trade Estimate Report on Foreign Trade Barriers, Ambassador Michael B.G. Froman
• United States Trade Representative (2014), National Trade Estimate Report on Foreign Trade Barriers
SECTION 4: THE NEW SUEZ CANAL AND BOOSTING INTERNATIONAL TRADE
• Bernhofen D., El-Sahli Z. and Kneller R. (2013), “Estimating the Effects of the Container Revolution on World Trade”, Lund University, Working Paper, n°4
• Drewry (2015), “Ship Operating Costs Annual review and Forecast”, Annual Report 2014/15
87
• Kenawy E. M. (2015), “The expected economic effects of the new Suez Canal project in Egypt”, European Journal of Academic Essays, 1(12): 13-22
• Notteboom T., Rodrigue J. R. (2011), “Challenges to and challengers of the Suez Canal”, Port Technology International, Bernard Henry, London
• SRM (2015), Italian Maritime Economy, 2nd Annual Report, Giannini Editore, Naples
• SRM-ALEXBANK (in cooperation with), 2015, The New Suez Canal: economic impact on Mediterranean Maritime Trade
• SRM (2014), Economic Relations between Italy and Mediterranean Area. Annual Report, Giannini Editore, Naples
• Suez Canal Authority, Brief Fiscal year Statistical Report,
www.suezcanal.gov.eg
SECTION 5: FDI… POTENTIAL KEY DRIVER FOR GROWTH
• Egypt’s Ministry Of Investments
www.investment.gov.eg/
• Eurostat – International Trade Statistics
http://ec.europa.eu/eurostat/data/database
• Fipice - Databank
• General Authority For Investments & Free Zones (GAFI)
www.gafi.gov.eg/
• Egypt’s Central Agency For Public Mobilization & Statistics (CAPMAS)
www.capmas.gov.eg/
• Egypt Economic Development Conference (March 2015), Egypt Five Year Macroeconomic Framework and Strategy FY14/15-FY18/19, official publication of the government of Egypt
• Istat (coeweb)
www.istat.it
• ORBIS BVDEP – Databank
• PPP program in Egypt structure – procedures – projects, Atter Hannoura (29 November 2015), The New Suez Canal-Economic Impact on Mediterranean Maritime Trade
• SRM (2015), Economic Relations between Italy and the Mediterranean Area, 4th Annual Report, Giannini, Naples
• World Bank
www.worldbank.org/
• Suez Canal Authority
www.suezcanal.gov.eg/