Embed Size (px)
Citation preview
ENVIRONMENTALHEALTH PERSPECTIVES
This article will be available in its final, 508-conformant form 2–4 months after Advance Publication. If you require assistance accessing this article before then, please contact Dorothy L. Ritter, EHP Web Editor. EHP will provide an accessible version within 3 working days of request.
http://www.ehponline.org
ehpFirst Steps toward Harmonized Human Biomonitoring in Europe: Demonstration Project to Perform Human
Biomonitoring on a European Scale
Elly Den Hond, Eva Govarts, Hanny Willems, Roel Smolders, Ludwine Casteleyn, Marike Kolossa-Gehring, Gerda Schwedler, Margarete Seiwert, Ulrike Fiddicke,
Argelia Castaño, Marta Esteban, Jürgen Angerer, Holger M. Koch, Birgit K. Schindler, Ovnair Sepai, Karen Exley, Louis Bloemen, Milena Horvat, Lisbeth E. Knudsen, Anke Joas, Reinhard Joas, Pierre Biot, Dominique Aerts,
Gudrun Koppen, Andromachi Katsonouri, Adamos Hadjipanayis, Andrea Krskova, Marek Maly, Thit A. Mørck, Peter Rudnai, Szilvia Kozepesy,
Maurice Mulcahy, Rory Mannion, Arno C. Gutleb, Marc E. Fischer, Danuta Ligocka, Marek Jakubowski, M. Fátima Reis, Sónia Namorado, Anca Elena Gurzau,
Ioana-Rodica Lupsa, Katarina Halzlova, Michal Jajcaj, Darja Mazej, Janja Snoj Tratnik, Ana López, Estrella Lopez, Marika Berglund, Kristin Larsson,
Andrea Lehmann, Pierre Crettaz, and Greet Schoeters
http://dx.doi.org/10.1289/ehp.1408616
Received: 28 April 2014Accepted: 10 December 2014
Advance Publication: 11 December 2014
1
First Steps toward Harmonized Human Biomonitoring in Europe:
Demonstration Project to Perform Human Biomonitoring on a
European Scale
Elly Den Hond,1 Eva Govarts,1 Hanny Willems,1 Roel Smolders,1 Ludwine Casteleyn,2 Marike
Kolossa-Gehring,3 Gerda Schwedler,3 Margarete Seiwert,3 Ulrike Fiddicke,3 Argelia Castaño,4
Marta Esteban,4 Jürgen Angerer,5 Holger M. Koch,5 Birgit K. Schindler,5 Ovnair Sepai,6 Karen
Exley,6 Louis Bloemen,7 Milena Horvat,8 Lisbeth E. Knudsen,9 Anke Joas,10 Reinhard Joas,10
Pierre Biot,11 Dominique Aerts,11 Gudrun Koppen,1 Andromachi Katsonouri,12 Adamos
Hadjipanayis,13 Andrea Krskova,14 Marek Maly,14 Thit A. Mørck,9 Peter Rudnai,15 Szilvia
Kozepesy,15 Maurice Mulcahy,16 Rory Mannion,16 Arno C. Gutleb,17 Marc E. Fischer,18 Danuta
Ligocka,19 Marek Jakubowski,19 M. Fátima Reis,20 Sónia Namorado,20 Anca Elena Gurzau,21
Ioana-Rodica Lupsa,21 Katarina Halzlova,22 Michal Jajcaj,22 Darja Mazej,8 Janja Snoj Tratnik,8
Ana López,4 Estrella Lopez,4 Marika Berglund,23 Kristin Larsson,23 Andrea Lehmann,24 Pierre
Crettaz,24 and Greet Schoeters1,25,26
1Unit Environmental Risk and Health, VITO, Mol, Belgium; 2University of Leuven, Leuven,
Belgium; 3Umweltbundesamt (UBA), Berlin, Germany; 4Instituto de Salud Carlos III,
Majadahonda (Madrid), Spain; 5Institute for Prevention and Occupational Medicine of the
German Social Accident Insurance, Institute of the Ruhr-Universität Bochum (IPA), Bochum,
Germany; 6Public Health England, Chilton, United Kingdom; 7Environmental Health Sciences
International, Hulst, the Netherlands; 8Jožef Stefan Institute, Ljubljana, Slovenia; 9University of
Copenhagen, Copenhagen, Denmark; 10BiPRO, Munich, Germany; 11FPS Health, Food chain
safety and Environment, Brussels, Belgium; 12State General Laboratory, Nicosia, Cyprus; 13Paediatric clinic, Larnaca General Hospital, Larnaca, Cyprus; 14National Institute of Public
Health, Praha, Czech Republic; 15National Institute of Environmental Health, Budapest,
Hungary; 16Health Service Executive, Dublin, Ireland; 17Centre de Recherche Public – Gabriel
Lippmann, Belvaux, Luxembourg; 18Laboratoire National de Santé, Dudelange, Luxembourg; 19Nofer Institute of Occupational Medicine, Lodz, Poland; 20Faculdade de Medicina da
Universidade de Lisboa, Lisbon, Portugal; 21Environmental Health Center, Cluj-Napoca,
2
Romania; 22Urad Verejneho Zdravotnictva Slovenskej Republiky, Bratislava, Slovakia; 23Karolinska Institutet, Stockholm, Sweden; 24Federal Office of Public Health (FOPH), Bern,
Switzerland; 25University of Antwerp, Antwerpen, Belgium; 26University of Southern Denmark,
Odense, Denmark
Address correspondence to Greet Schoeters, VITO – Unit Environmental Risk and Health,
Boeretang 200, B-2400 Mol, Belgium. Telephone: +32 14 335167. Mobile: + 32 477 427 746. E-
mail: [email protected]
Running title: Harmonized Human Biomonitoring in Europe
Acknowledgment: The authors are grateful to the members of the statistical working group for
their contribution to the study design.
The research leading to these results has received funding for the COPHES project (COnsortium
to Perform Human biomonitoring on a European Scale) from the European Community's
Seventh Framework Programme ([FP7/2007-2013] [FP7/2007-2011]) under grant agreement n°
[244237].
DEMOCOPHES (DEMOnstration of a study to COordinate and Perform Human biomonitoring
on a European Scale) was cofunded (50%:50%) by the European Commission LIFE+
Programme (LIFE09/ENV/BE/000410) and the partners.
For information on both projects as well as on the national co-funding institutions: see
http://www.eu-hbm.info/.
The sponsors had no role in the study design, data collection, data analysis, data interpretation or
writing of the report.
Competing financial interests: E.D.H., E.G., H.W., R.S., G.K., and G. Schoeters are employed
by the Unit Environmental Risk and Health, VITO, Mol, Belgium, a public non-profit research
institute that receives core funding from the Flemish authorities and in-part funding through
contracts from the public and private sector. L.B. is employed by Environmental Health Sciences
International, Hulst, The Netherlands, a consulting company that has not consulted for industry
during the last three years. A.J. and R.J. are employed by BiPRO, Munich, Germany, a
consulting company for the public and private sectors. A.C.G. is employed by the Centre de
3
Recherche Public – Gabriel Lippmann, Belvaux, Luxembourg, a public non-profit research
institute that receives core funding from the Luxembourg authorities and partial funding through
contracts from the public and private sectors. D.L. and M.J. are employed by the Nofer Institute
of Occupational Medicine, Lodz, Poland, a scientific research center that deals with issues
related to public health, environmental health, and occupational medicine and receives core
funding from the Polish Ministry of Health and Ministry of Science and Higher Education and
in-part funding from the public and private sectors for analyses made by ISO 17025 accredited
laboratories or expertise-specific GLP laboratories. M.F.R. and S.N. are employed by the
Faculdade de Medicina da Universidade de Lisboa, Lisbon, Portugal, a public academic and
research institute that receives partial funding from industrial contracts. A.E.G. and I.R.L. are
employed by the Environmental Health Center, Cluj-Napoca, Romania, which offers consulting
services to industry but does not receive funding from industry. These authors declare that no
private funding was used to perform work related to this manuscript. The other authors declare
they have no actual or potential competing financial interests.
4
Abstract
Background: For Europe as a whole, data on internal exposure to environmental chemicals do
not yet exist. Characterization of the internal individual chemical environment is expected to
enhance understanding of the environmental threats to health.
Objectives: We developed and applied a harmonized protocol to collect comparable human
biomonitoring data all over Europe.
Methods: In 17 European countries, we measured mercury in hair and cotinine, phthalate
metabolites and cadmium in urine of 1844 children (5-11 years) and their mothers. Specimens
were collected over a 5 month period in 2011-2012. We obtained information on personal
characteristics, environment, and life style. We used the resulting database to compare
concentrations of exposure biomarkers within Europe, to identify determinants of exposure, and
to compare exposure biomarkers with health-based guidelines.
Results: Biomarker concentrations showed a wide variability in the European population.
However, levels in children and mothers were highly correlated. Most biomarker concentrations
were below the health-based guidance values.
Conclusions: We have taken the first steps to assess personal chemical exposures in Europe as a
whole. Key success factors were the harmonised protocol development, intensive training and
capacity building for field work, chemical analysis and communication, as well as stringent
quality control programs for chemical and data analysis. Our project demonstrates the feasibility
of a European-wide human biomonitoring framework to support the decision-making process of
environmental measures to protect public health.
5
Introduction
Human biomonitoring (HBM) measures the levels of environmental chemicals or their
metabolites in easily accessible body fluids and tissues (Angerer et al. 2006), and reflects all
routes of uptake - oral, dermal, inhalative - and all relevant sources. The power of HBM to
identify spatial and temporal trends in human exposures has contributed successfully to initiate
policy measures and to focus on protection of susceptible populations such as children and
pregnant mothers. The ban of lead from gasoline was triggered by elevated blood lead levels in
the National Health and Nutrition Examination Survey (NHANES) (Pirkle et al. 1994). Results
of the German Environmental Survey (GerES) led to recommendations to avoid mercury
containing amalgam teeth fillings in children (Becker et al. 2013) and contributed to restriction
of phthalate use in plastics (Goen et al. 2011). Increasing levels of polybrominated
diphenylethers (PBDEs) in maternal milk samples of Sweden have lead to the gradual phasing
out of lower PBDEs (Meironyte et al. 1999).
Experience with human biomonitoring in the general population differs among European
countries, with long standing traditions in countries such as Germany (Becker et al. 2008),
France (Frery et al. 2012), the Czech Republic (Cerna et al. 2012), Belgium (Flanders)(Schoeters
et al. 2011), Spain (Perez-Gomez, 2013) while other countries have no experience at all.
The ‘European Environment and Health Action Plan’ (Communication from the Commission,
2004) prioritized the need to harmonize HBM in Europe to allow comparison of data among
countries and provide tools for follow-up of temporal and spatial trends in chemical exposures.
The preparation of the protocol, including the selection of chemicals, study populations, started
in 2005 with the Expert team to Support BIOmonitoring in Europe (ESBIO) project. With the
6
funding of the Consortium to Perform Human Biomonitoring on a European Scale (COPHES)
and its demonstration project DEMOCOPHES, the feasibility of a harmonized HBM approach
was tested(Human Biomonitoring in Europe, 2012). COPHES designed the final protocol and
made justified choices for exposure biomarkers, sample size and recruitment strategy.
DEMOCOPHES allowed 17 European countries to put this protocol into practice. Selected
chemicals included phthalates that are present in some consumer products and foodpackaging
(Koch and Calafat 2009), mercury and cadmium as ubiquitous developmental toxicants of
concern (Grandjean and Landrigan 2006), urinary cotinine (Avila-Tang et al. 2013) as a
biomarker for exposure to cigarette smoke; urinary creatinine was included as a measure for
urine dilution. Young children and mothers of childbearing age were selected as vulnerable age
groups. Mercury in hair (Budtz-Jorgensen et al. 2004) and urinary cadmium (Akerstrom et al.
2013) are markers of chemicals that accumulate in the body over a longer time period, urinary
phthalate metabolites (Wittassek et al. 2011) and cotinine (Avila-Tang et al. 2013) measured in
spot urine samples represent short-time exposure.
Methods
Study design and participants
The cross-sectional survey was designed to include 120 children (5-11 years) and their mothers
in each country, with 60 mother-child pairs in Cyprus and Luxembourg due to the countries’
smaller populations. We sampled the children and mothersbetween September 2011 and
February 2012, either through schools or population registries. These were convenience samples
with equal shares in an urban and a rural location as defined according to regional standards. We
included only healthy children and mothers (no metabolic disturbances), who had sufficient
knowledge of the local language and had been living at least for 5 years at the sampling location.
7
Details and rationale for the study design are reported by Becker et al. (Becker et al. 2014). The
sample size allowed us to estimate preliminary country specific reference values (Poulsen et al.
1997) and a minimally important difference in mean biomarker values of 30% between countries
(α= 0.05, β= 0.80). Field workers from the national study centers were trained, instructions were
provided centrally and adapted at national level to the language, cultural conventions, ethical and
legal requirements. Information on characteristics of the study population and potential
determinants of internal exposure were obtained through personalised interviews using
questionnaires. Standard Operation Procedures (SOPs) to collect hair and morning urine samples
were implemented (Becker et al. 2014). The study was approved by ethics committees in each
country (list of ethics committees per country: see Supplemental Material, Table S1); mothers
and children gave written informed consent or assent, respectively. All procedures followed the
national data protection requirements including notification to data protection authorities.
Chemical analysis
We established a Quality Assurance Program to guarantee the quality and comparability of
analytical results among laboratories (Schindler et al. 2014). Each participating laboratory
received SOPs for sampling, sample conservation and chemical analysis (Becker et al. 2014;
Schindler et al. 2014). We organized two Interlaboratory Comparison Investigations and two
External Quality Assessment Schemes (ICI/EQUAS) with native control material (hair, urine)
sent to all laboratories willing to participate. For the evaluation of the ICIs we calculated
consensus values as the mean of the results of the participating laboratories (after exclusion of
outliers). For the evaluation of the EQUAS, we calculated assigned values (target values) from
the results of experienced, renowned reference laboratories. Laboratories were defined as
‘qualified laboratories’ if they participated successfully in at least one ICI and one EQUAS
8
round or in two EQUAS rounds (Schindler et al. 2014). The number of laboratories that qualified
for each analyte was: mercury, 15; cotinine, 9; cadmium, 14; phthalate metabolites (MEHP,
5OH-MEPH, 5oxo-MEHP, MEP, MBzP, MnBP, MuBP), 7 and creatinine, 14.
Database management and statistical analysis
National data centers applied uniform rules for database construction by using one centrally
developed code book with pre-defined variable names, unities, formats and coding rules. Quality
controls on the data were performed with centrally developed programs (SAS or SPSS). These
strict and uniform rules for database construction allowed us to pool all country-specific data into
one central European database. We used SAS software, version 9.3 (SAS Institute Inc.) for
analysis of the central database. We replaced values below the LOQ by ½LOQ and transformed
biomarker data to natural log-transformed concentrations (ln). We excluded samples with
creatinine concentrations below 300 mg/L or above 3000 mg/L from statistical analysis
(WHO,1996). We calculated weighted geometric means (GM) (95% confidence interval,
95%CI) and 90th percentiles (P90) (95% CI) so that the countries were equally represented except
for Cyprus and Luxembourg that contributed only half. Using multiple mixed regression models
with country as random factor, we identified determinants of exposure biomarkers by including
pre-specified confounders and significant covariates (P<0.25 from univariate model to enter and
P<0.05 to stay) in a stepwise model. We expressed urinary biomarkers in µg/L with urinary
creatinine included as confounder. We expressed results as % change (95% CI) of biomarker
concentration for change of the determinant, after adjustment for all other variables in the model.
Detailed methodology and full models are given in the Supplemental Material (“Identification of
determinants of exposure; Comparison of results between countries” and Table S2).
9
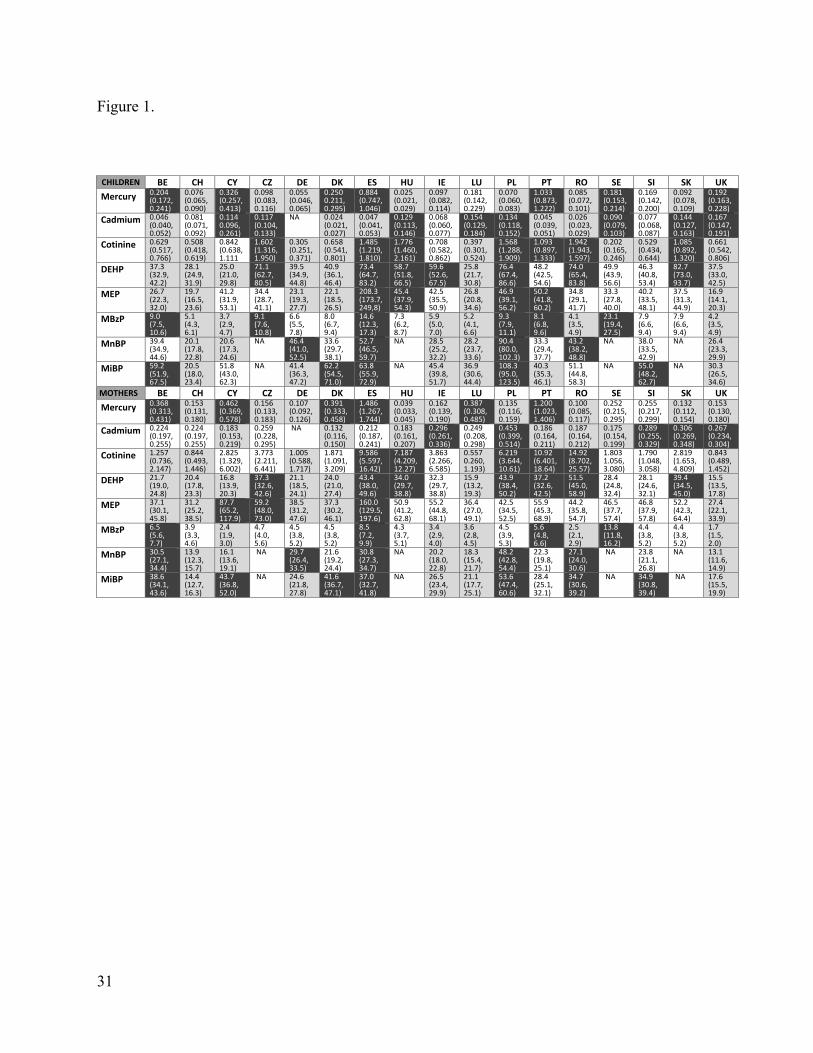
To compare biomarker values among countries, we compared the GM of a country with the
European GM by mixed linear regression analysis, after adjustment for pre-specified
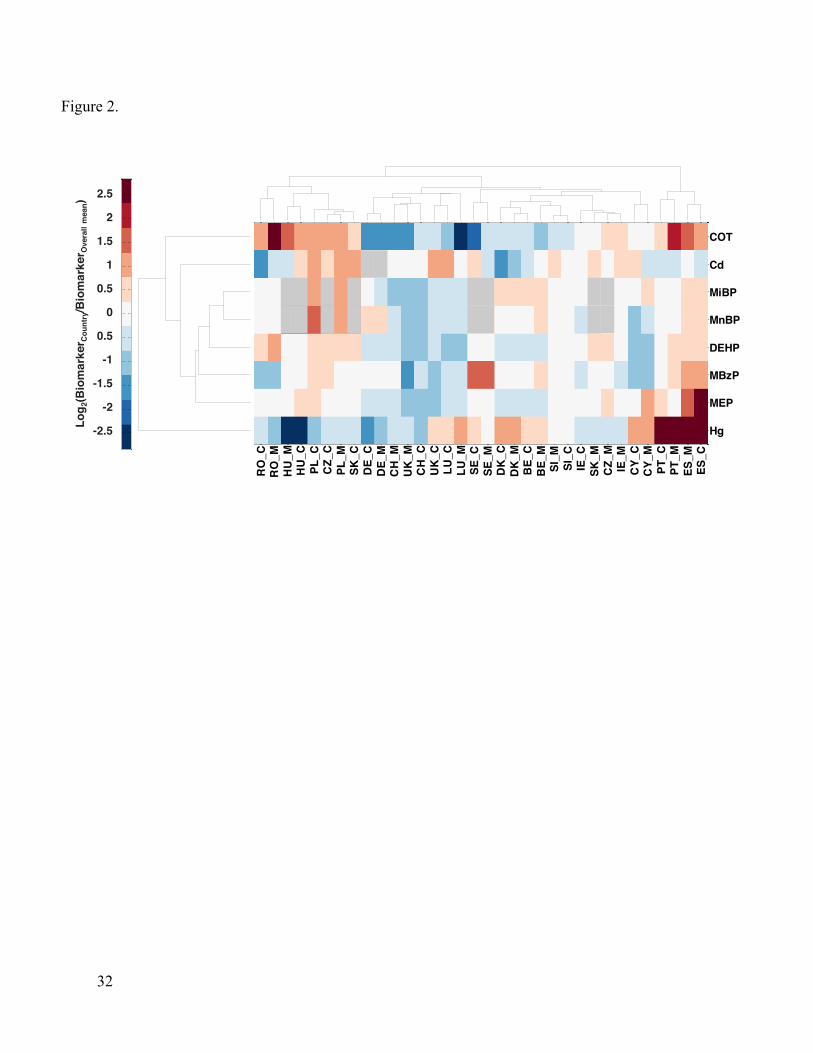
confounders (Figure 1). To visualize similarity between the biomarker levels and between
different countries and/or mothers and children from the same country a heat map was generated
using the clustergram function (Matlab, The MathWorks Inc. Massachusetts, USA) (Figure 2).
Hierarchical clustering with Euclidean distance metric and average linkage was used to generate
the hierarchical tree. Prior to analysis the GM of each country was divided by the European GM.
The ratio was calculated for mothers and children separately and was logarithmically
transformed (log2 base) to obtain symmetry around 0 (= log2(1)). The nearest-neighbor method
was applied to impute missing data.
To put the results in a health risk context, we calculated the proportion of individuals with levels
above health-based guidance values (Aylward et al. 2009a;Aylward et al. 2009b;Hays et al.
2008;Joint Expert Committee on Food Additives 2003;Schulz et al. 2012).
Results
Determinants of biomarker concentrations
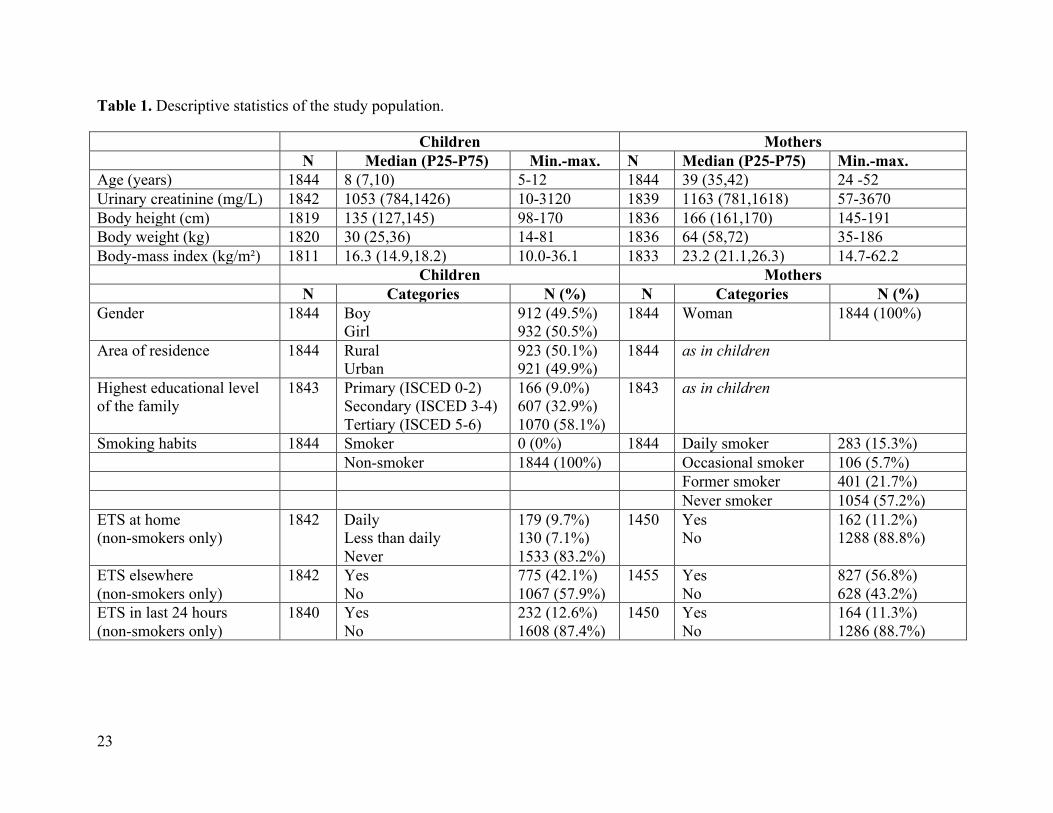
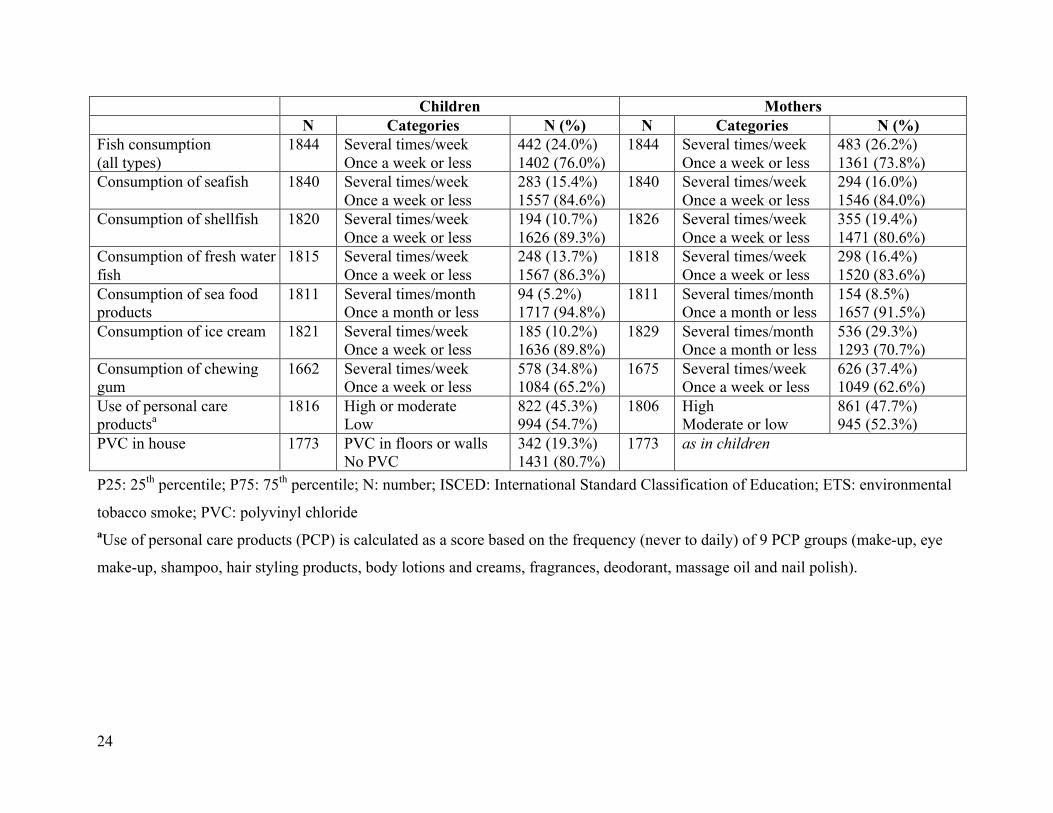
Descriptive statistics of 1844 children and mothers included in the study are given in Table 1.
Participants were equally recruited according to predefined strata of gender, age and sampling
area in each country. Descriptive statistics of the biomarkers and multiple regression models are
given in the Supplemental Material (Tables S3-S19).
Fish consumption was the major predictor of mercury levels in hair, both in children and in
mothers (Supplemental Material, Tables S4 and S5). Consumption of sea fish, shellfish or fresh
water fish in the past four weeks independently contributed to mercury levels in the body. In
10
multiple regression models, frequent (several times/week) compared to sporadic (once/week or
less) sea fish consumption was associated with 46% (95% CI: 26-69%) higher mercury levels in
children and 51% (34-71%) in mothers; shellfish with 56% (35-79%) in children and 38% (24-
55%) in mothers, fresh water fish with 23% (8-39%) in children and 23% (11-37%) in mothers.
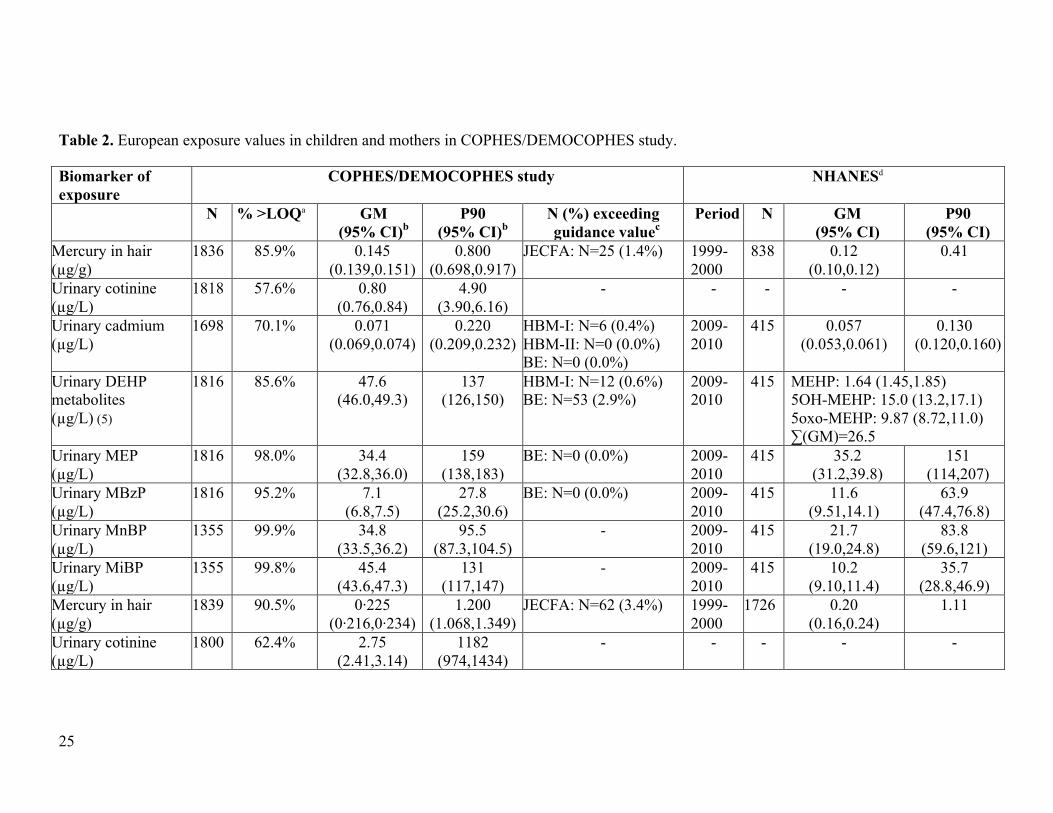
The GM mercury levels of mothers were higher than those of the children (Table 2), but levels of
mothers and children were higly correlated (Spearman’s r = 0.72, p<0.001, n= 1833). Older
mothers had 15% (5-24%) higher levels compared to the youngest age group (Supplemental
Material, Table S5). Younger children of 5-8 years showed 8% (0-17%) higher levels compared
to the older group of 9-11 years (Supplemental Material, Table S4). Participants from families
with a higher educational level (tertiary vs. primary education) had 19% (4-31%) higher levels of
mercury in children and 25% (13-36%) in mothers
Cadmium levels in mothers were significantly higher in active smoking mothers and this was
independent of age. The GM were higher in mothers than in children (Table 2). Older mothers
had 25% (18-32%) higher levels than younger mothers (Supplemental Material, Table S9).
Levels in mothers and children showed a low but significant correlation (Spearman’s r = 0.24,
p<0.001, n= 1660). After adjustment for age and smoking, mothers from families with a tertiary
education had 34% (17-54%) lower levels compared to those with a primary education. In
children, except for age and creatinine, no significant determinants were identified
(Supplemental Material, Table S8).
The urinary levels of MEHP, 5OH-MEHP and 5oxo-MEH were highly correlated (Pearson’s
r>0.70), and thus their sum was used in the analyses. The GM of urinary phthalate metabolites
(except MEP, related to PCP use) were higher in children than in mothers (Table 2). Phthalate
levels of mothers and children were significantly correlated (p<0.001): Spearman’s r ranged
11
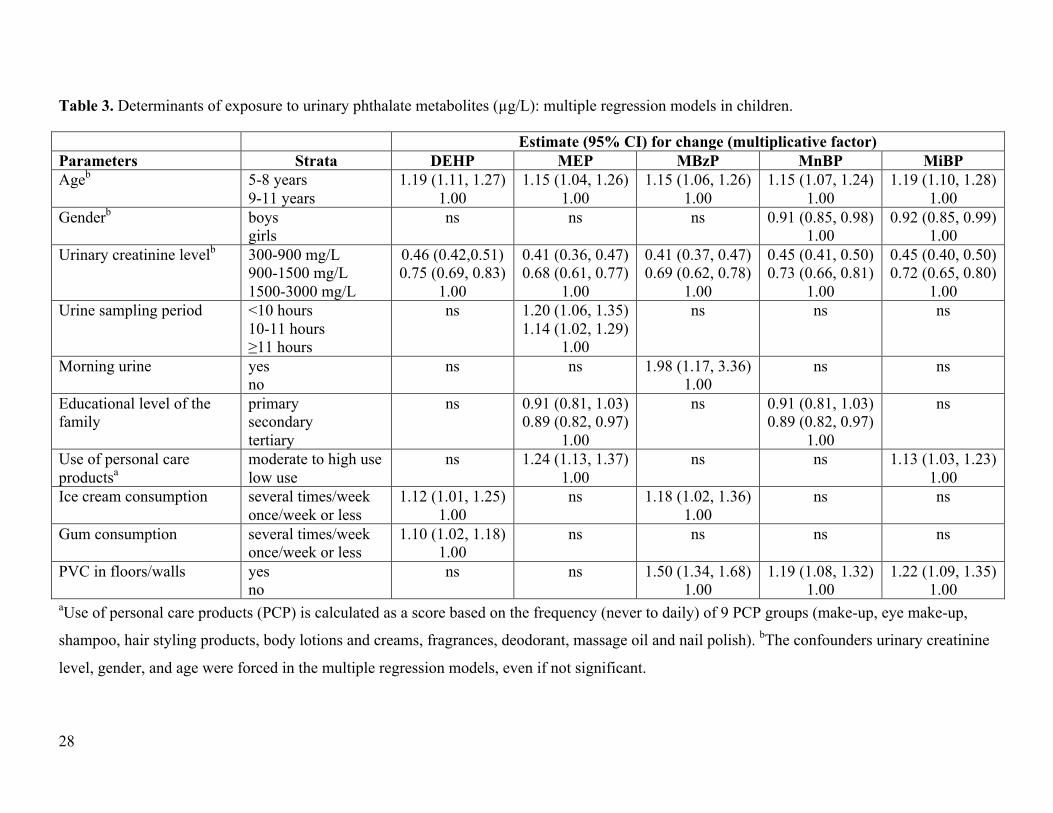
between 0.40 and 0.49. Multiple regression models (Table 3) showed that younger children of 5-
8 years showed higher levels compared to the older group of 9-11 years. Participants from
families reporting to have PVC floors or walls, had significantly increased levels of MBzP and
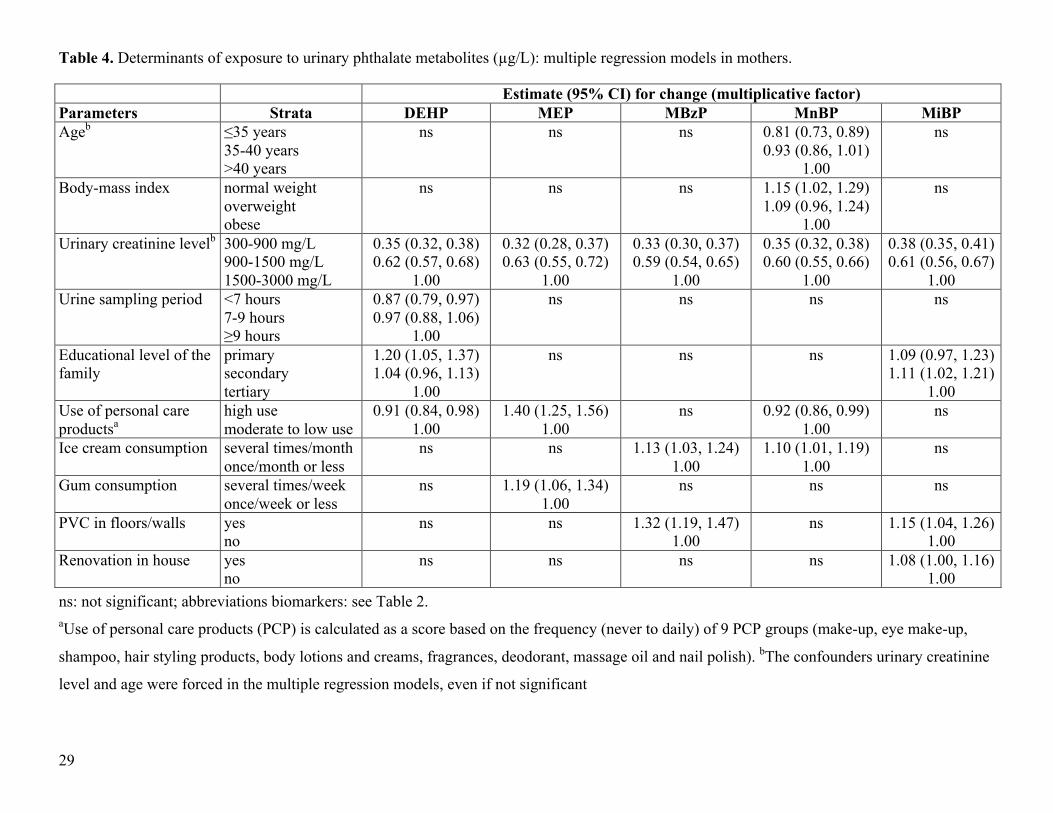
MiBP in children and mothers and of MnBP in children (Table 3 and 4). A small effect of recent
renovation works on MiBP was seen in mothers who reported renovation in the house in the past
two years. Frequent use of personal care products (PCP) increased urinary MEP levels in
mothers and children and urinary MiBP levels in children. Unexpectedly, urinary levels of
DEHP metabolites and MnBP in mothers were lower in high PCP users. High consumption of
ice cream was associated with higher urinary levels of DEHP metabolites and MBzP levels in
children and with higher MnBP and MBzP levels in mothers. High consumption of chewing
gum was related to higher urinary levels of DEHP metabolites in children and to higher MEP
levels in mothers. After adjustment for confounders and significant covariates, educational level
was still a predictor of phthalate biomarkers, i.e. significantly higher urinary levels were found
for DEHP metabolites in mothers from families with a primary education, for MiBP (mothers)
and MEP (children) in families with secondary education and for MnBP (children) in families
with tertiary education.
In mothers, the effect of active smoking on cotinine levels was dominant (Supplemental
Material, Table S7). Levels in mothers and children correlated strongly (Spearman’s r = 0.71,
p<0.001, n= 1777). The younger children of 5-8 years showed 16% (8-25%) higher levels
compared to the older group of 9-11 years (Supplemental Material, Table S6). In children,
environmental tobacco smoke (ETS) at home was the strongest predictor. Compared to children
who were never exposed to ETS at home, children with daily exposure had 5 times higher values
(+504% (429-593%)) and children with less than daily exposure had almost double values
12
(+181% (155-211%)). Exposure to ETS in other places than home resulted in 19% (10-29%)
higher values. In comparison with children from families with a tertiary education, those with a
secondary education had 20% (10-30%) higher cotinine levels in urine and those with primary
education had 49% (29-72%) higher values.
The geographical aspect
Residence in urban or rural area did not show up as a significant determinant of internal exposure
at the EU level. Only mercury in hair showed, independently of fish consumption, higher levels
in urban areas compared to rural areas: 35% (23-47%) higher in children and 30% (19-41%) in
mothers (Supplemental Material, Table S4 and S5).
The average biomarker concentrations varied significantly among the European countries. This
holds for the unadjusted data (Supplemental Material, Table S20-S35) and for data after
adjustment for age, gender and weighing for equal group sizes (Figure 1). The average biomarker
concentrations of mercury in hair of Spanish and Portugese children were respectively 6 and 7
times higher than the European average. Cadmium varied less among the countries: average
urinary cadmium levels in Polish and Slovak mothers were respectively 1.9 and 1.7 times higher
than the European average. In Romania and Hungary average cotinine levels were respectively
2.4 and 2.2 times higher than the European average reflecting the weak anti-smoking legislation
in these countries. Swedish children had on average 3 times higher urinary MBzP levels than the
average European value. Slovak children had almost twice the average European biomarker
concentrations of DEHP metabolites, while Polish children showed the highest average levels of
MnBP and MiBP. Average MEP levels in Spain were 6 times higher than the European average.
The heat map (Figure 2) showed that biomarker data from mothers and children clustered
13
together except in Czech Republic and Slovakia. Overall the biomarker clustering followed
geographical grouping. The South European countries (ES, PT) clustered separately from the
other countries; Eastern European countries (RO, HU, PL, CZ, SK) formed a further cluster;
West European countries (DE, BE, LU, DK) also showed fairly good resemblance.
Although the sampling frame of the European biomonitoring program differs from that of the US
national program, the geometric means and P90 of COPHES/DEMOCOPHES are well in line
with the results obtained in NHANES (Center for Disease Control (CDC) 2013; McDowell et al.
2004) (Table 2). For MiBP, higher values were observed in Europe compared to the US (factor
3-4), both in mothers and children (Table 2). Differences for other biomarkers were modest with
a trend in Europe for lower biomarker concentrations of MBzP and MEP, higher concentrations
of MnBP and DEHP and similar levels for cadmium and mercury.
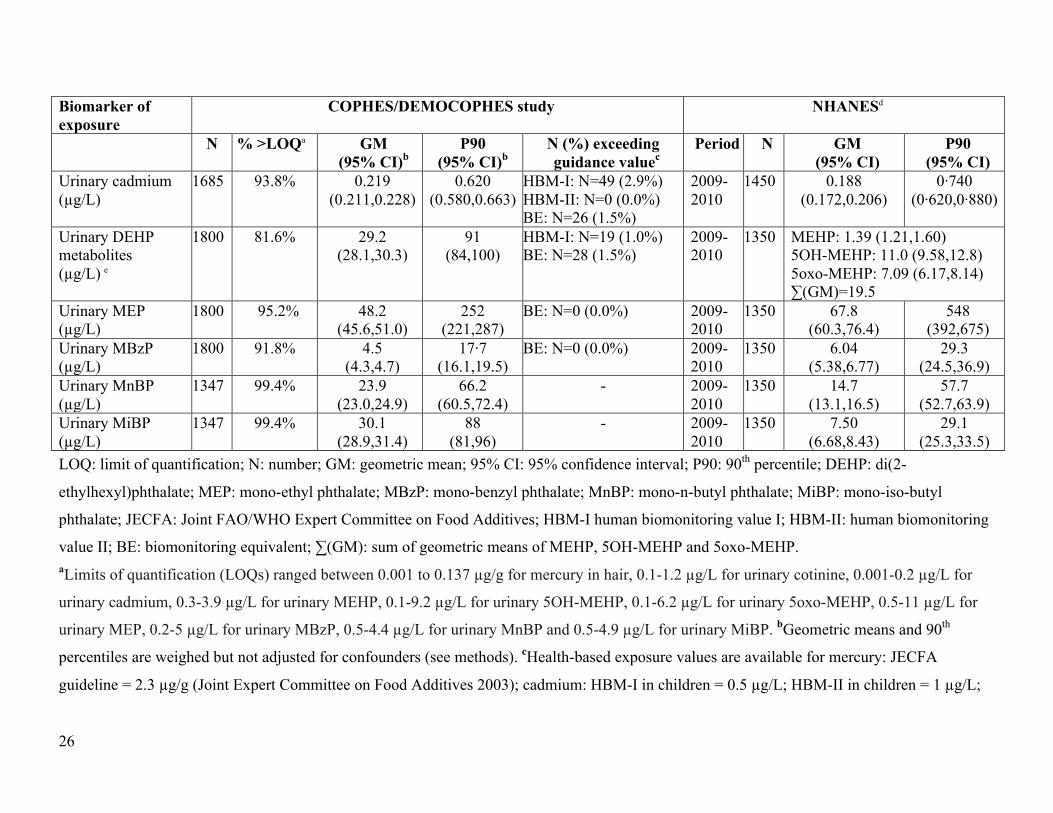
Available health-based guidance values allow to put the observed biomarker concentrations in a
risk context. Few participants exceeded these values (Table 2). The P90 of the biomarker values
are far below the guidance values, only for urinary cadmium P90 of mothers and children were
within a factor two of the concentration below which no risk for adverse health effects is
expected (Schulz et al. 2012) and for mercury they are below a factor three.
Discussion
This first Europe-wide program provides biomarker data from mothers and children of 17
European countries. Since we recruited in one rural and one urban area per country, our sample
was not representative for the EU population.Yet, the recruited sample had a similar smoking
behavior as the average European population (Currie 2010). Also, the countries ranked for their
reported fish consumption according to national statistics (FAO,2008). The educational level of
14
the participants was skewed towards a higher educational level. The study design allowed to
conclude that exposure to mercury, cadmium, phthalates, and nicotine is widespread in the
European population.
Differences in environment and life style influenced individual biomarker values and country
specific averages. If we compared average levels between countries, the biomarker patterns
varied according to geographic trends. Yet, few study participants exceeded the available health-
based guidance values. The major strength of our study is comparable data from 17 European
countries produced through a harmonized process including the use of a commonly developed
protocol, intensive training and capacity building for field work, chemical analyses, reporting
and communication, as well as stringent quality control programs for chemical and data analysis.
This allowed us to measure both well-known pollutants such as cadmium, cotinine or mercury
and new emerging chemicals such as phthalates.
Our current study identified younger children as more exposed to phthalates (except MEP),
cotinine and mercury. These results are in line with US data for exposure to phthalates (Silva et
al.,2004) and ETS (Bernert et al.,2010). The underlying reasons cannot be derived from this
study but may be explained by higher exposure relative to body size through inhalation of dust or
food intake; by typical exposure patterns in children, e.g. contact with toys, more time spent on
the floor, more frequent hand-mouth contact; or by differences in metabolism. Additionally, the
higher cotinine levels in younger children might be due to the fact that they spend more time at
home, and thus may be more exposed to nicotine, since smoking in public buildings is much
more controlled than in private homes. We observed a significant influence of social class
(represented by the highest educational level within the family) on each of the biomarker levels
even after adjustment for confounders and significant covariates: mercury level in hair increased
15
in children and mothers if social class was higher, while cotinine, cadmium, phthalate
metabolites were lower with increasing educational level of the family. Possibly, underlying life-
style factors that vary with socio-economic status, and were not considered in the questionnaires,
may account for these findings. These associations between social class and biomarker
concentrations are in line with US data (Tyrrell et al. 2013) and may partly be mediated by
smoking, occupation and diet (fish consumption, local food, convenience food). Our findings,
like others, thus indicate that public health remediation measures to decrease environmental
exposure and disease burden within a society should be stratified according to age groups and
social strata within the population.
Fish consumption and social status were identified as important and independent determinants of
mercury levels, both in mothers and children. This is in line with results from several populations
with moderate to high fish consumption (Deroma et al. 2013). Mercury levels in children and in
women of childbearing age are important parameters to monitor since pre- and postnatal mercury
exposure, even at low levels, has adverse neurodevelopmental effects (Karagas et al. 2012).
Although several high fish consuming countries such as France, Finland, Lithuania, Malta
and Italy are not participating in DEMOCOPHES, at present, 1.4% of the children and 3.4% of
the mothers in our study population had mercury levels above the JECFA/WHO provisional
threshold value of 2.3 µg/g hair. This proportion differs considerably by country with 0% of
participants exceeding the threshold in most northern and central European countries and up to
33% of the mothers with levels above the safe dose in countries with high fish consumption with
implications for loss of IQ points and costs (Bellanger et al. 2013). If these data urge policy
makers to take actions, current biomarker concentrations can be used as baseline for follow-up,
both for the exposure of the population and the environment. The major exposure route for
16
DEHP is food (Koch and Calafat 2009). Therefore, we were not surprised to find an association
between DEHP metabolites with chewing gum and ice cream consumption. Most probably, these
two food items are not specific sources, but rather represent predilection for flavored, packed, or
processed food, and thus may be proxies for convenience food. The association between urinary
MBzP and PVC materials in the home is in accordance with recent findings in children
(Carlstedt et al. 2012). Although high molecular weight phthalates like DEHP are the major
phthalates used in PVC, no association was found between the presence of PVC at home and
urinary DEHP metabolites. Given the facts that DEHP exposure is dominated by foodstuff (Koch
et al. 2013) and that DEHP house dust does not correlate with DEHP body burden (Becker et al.
2004), a significant correlation was not really expected. The lower levels of DEHP metabolites
and MnBP in mothers that were high PCP users was not expected and may relate to cross
correlation with other personal habits. The relative levels of phthalate metabolites differ
substantially among countries which points to different sources, products on the market or
behavior characteristics. Despite legal restrictions on the use of DEHP, di-n-butyl phthalate, and
diisobutyl phthalate as imposed by EU directives, these compounds are still ubiquitous in
Europeans. They are short-lived in the body, implying that exposures to these compounds are
still part of current daily life. Diethylphthalate, one of the principal phthalates in cosmetic
products (Koch and Calafat 2009), is not yet restricted. High levels of its metabolite MEP were
found.
The health impact of cigarette smoking is well documuented (U.S.Department of Health and
Human Services 2004). The home environment appears to be the most important predictor of the
cotinine levels in children. Further awareness of parents therefor is needed. The importance of
anti-smoke legislation pays off as countries with a stronger legislation that was longer in place
17
showed the lowest cotinine levels (http://ec.europa.eu/health/tobacco/docs/
tobacco_overview2011_en.pdf). The effectiveness of anti-smoke legislation on health outcomes
has been demonstrated on a population level (Cox et al. 2013).
Conclusion
This HBM study presents the first steps, for Europe as a whole, to register internal chemical
exposures at individual level. Although the sampling protocol is not yet reprentative for the
geographivcal distribution of the population in the country, the results show remarkable
differences in the biomarker concentration profiles by country residence. Personal habits and life
style are strong determinants of internal exposure. The harmonized protocols and stringent
quality control measures ensure that these are true differences, not related to variability in
protocols, analytical measurements, or interpretation. These data offer policy makers direct
means to evaluate whether implementation of protective measures and legislations related to
chemicals are adequate to protect health of the entire population or whether they need to be
adjusted.
18
References
Akerstrom M, Barregard L, Lundh T, Sallsten G. 2013. The relationship between cadmium in
kidney and cadmium in urine and blood in an environmentally exposed population. Toxicol
Appl Pharmacol 268:286-293.
Angerer J, Bird MG, Burke TA, Doerrer NG, Needham L, Robison SH, et al. 2006. Strategic
biomonitoring initiatives: moving the science forward. Toxicol Sci 93:3-10.
Avila-Tang E, Al-Delaimy WK, Ashley DL, Benowitz N, Bernert JT, Kim S, et al. 2013.
Assessing secondhand smoke using biological markers. Tob Control 22:164-171.
Aylward LL, Hays SM, Gagne M, Krishnan K. 2009a. Derivation of Biomonitoring Equivalents
for di(2-ethylhexyl)phthalate (CAS No. 117-81-7). Regul Toxicol Pharmacol 55:249-258.
Aylward LL, Hays SM, Gagne M, Krishnan K. 2009b. Derivation of Biomonitoring Equivalents
for di-n-butyl phthalate (DBP), benzylbutyl phthalate (BzBP), and diethyl phthalate (DEP).
Regul Toxicol Pharmacol 55:259-267.
Becker K, Müssig-Zufika M, Conrad A, Lüdecke A, Schulz C, Seiwert M, et al. 2008. German
Environmental Survey for Children 2003/06. GerES IV - Human Biomonitoring. Berlin,
Germany:Federal Environment Agency (UBA).
Becker K, Schroeter-Kermani C, Seiwert M, Ruther M, Conrad A, Schulz C, et al. 2013. German
health-related environmental monitoring: Assessing time trends of the general population's
exposure to heavy metals. Int J Hyg Environ Health 216:250-254..
Becker K, Seiwert M, Angerer J, Heger W, Koch HM, Nagorka R, et al. 2004. DEHP
metabolites in urine of children and DEHP in house dust. Int J Hyg Environ Health 207:409-
417.
Becker K, Seiwert M, Casteleyn L, Joas R, Joas A, Biot P, et al. 2014. A systematic approach for
designing a HBM Pilot Study for Europe. Int J Hyg Environ Health 217:213-322.
Bellanger M, Pichery C, Aerts D, Berglund M, Castano A, Cejchanova M, et al. 2013. Economic
benefits of methylmercury exposure control in Europe: Monetary value of neurotoxicity
prevention. Environ Health 12:3.
Bernert JT, Pirkle JL, Xia Y, Jain RB, Ashley DL, Sampson EJ. Urine concentrations of a
tobacco-specific nitrosamine carcinogen in the U.S. population from secondhand smoke
exposure. Cancer Epidemiol Biomarkers Prev 2010; 19:2969-77.
19
Budtz-Jorgensen E, Grandjean P, Jorgensen PJ, Weihe P, Keiding N. 2004. Association between
mercury concentrations in blood and hair in methylmercury-exposed subjects at different
ages. Environ Res 95:385-393.
Carlstedt F, Jonsson BA, Bornehag CG. 2012. PVC flooring is related to human uptake of
phthalates in infants. Indoor Air 23:32-39.
Center for Disease Control (CDC). 2013. The fourth National Report on Human Exposure to
Environmental Chemicals, Updated Tables.
Cerna M, Krskova A, Cejchanova M, Spevackova V. 2012. Human biomonitoring in the Czech
Republic: an overview. Int J Hyg Environ Health 215:109-119.
Communication from the Commission to the Council, the European Parliament, the European
Economic and Social Committee - "The European Environment & Health Action Plan 2004-
2010". Available: http://eur-lex.europa.eu/legal-
content/EN/TXT/?uri=CELEX:52004DC0416 [accessed 27 November 2014].
Cox B, Martens E, Nemery B, Vangronsveld J, Nawrot TS. 2013. Impact of a stepwise
introduction of smoke-free legislation on the rate of preterm births: analysis of routinely
collected birth data. BMJ 346:f441.
Currie C. 2010. Social determinants of Health and Well-being Among Young People, Health
Behaviour in School-aged Chirlden (HBSC Study): Internation report from the 2009/2010
Survey.:WHO Regional Office for Europe, Copenhagen.
Deroma L, Parpinel M, Tognin V, Channoufi L, Tratnik J, Horvat M, et al. 2013.
Neuropsychological assessment at school-age and prenatal low-level exposure to mercury
through fish consumption in an Italian birth cohort living near a contaminated site. Int J Hyg
Environ Health 216:486-493.
FAO (Food and Agriculture Organization). 2013. Fishery and Aquaculture statistics. FAO
Yearbook 2008. Available: http://www.fao.org/docrep/013/i1890t/i1890t.pdf [Accessed 5
May 2013].
Frery N, Vandentorren S, Etchevers A, Fillol C. 2012. Highlights of recent studies and future
plans for the French human biomonitoring (HBM) programme. Int J Hyg Environ Health
215:127-132.
20
Goen T, Dobler L, Koschorreck J, Muller J, Wiesmuller GA, Drexler H, et al. 2011. Trends of
the internal phthalate exposure of young adults in Germany--follow-up of a retrospective
human biomonitoring study. Int J Hyg Environ Health 215:36-45.
Grandjean P, Landrigan PJ. 2006. Developmental neurotoxicity of industrial chemicals. Lancet
368:2167-2178.
Hays SM, Nordberg M, Yager JW, Aylward LL. 2008. Biomonitoring Equivalents (BE) dossier
for cadmium (Cd) (CAS No. 7440-43-9). Regul Toxicol Pharmacol 51:S49-S56.
Human biomonitoring in Europe: from fragmentation to harmonsiation. Available:
http://www.eu-hbm.info [accessed 27 November 2014].
Joas R, Casteleyn L, Biot P, Kolossa-Gehring M, Castano A, Angerer J, et al. 2012. Harmonised
human biomonitoring in Europe: activities towards an EU HBM framework. Int J Hyg
Environ Health 215:172-175.
Joint Expert Committee on Food Additives. 2003. Summary and conclusions. Sixty-first meeting
of the Joint FAO/WHO Expert Committee on Food Additives held in Rome, 10-19 June
2003. Available: http://whqlibdoc.who.int/trs/WHO_TRS_922.pdf [Accessed 27 November
2014].
Karagas MR, Choi AL, Oken E, Horvat M, Schoeny R, Kamai E, et al. 2012. Evidence on the
human health effects of low-level methylmercury exposure. Environ Health Perspect
120:799-806.
Koch HM, Calafat AM. 2009. Human body burdens of chemicals used in plastic manufacture.
Philos Trans R Soc Lond B Biol Sci 364:2063-2078.
Koch HM, Lorber M, Christensen KL, Palmke C, Koslitz S, Bruning T. 2013. Identifying
sources of phthalate exposure with human biomonitoring: results of a 48h fasting study with
urine collection and personal activity patterns. Int J Hyg Environ Health 216:672-681.
McDowell MA, Dillon CF, Osterloh J, Bolger PM, Pellizzari E, Fernando R, et al. 2004. Hair
mercury levels in U.S. children and women of childbearing age: reference range data from
NHANES 1999-2000. Environ Health Perspect 112:1165-1171.
Meironyte D, Noren K, Bergman A. 1999. Analysis of polybrominated diphenyl ethers in
Swedish human milk. A time-related trend study, 1972-1997. J Toxicol Environ Health A
58:329-341.
21
Pérez-Gómez B, Pastor-Barriuso R, Cervantes-Amat M, Esteban M, Ruiz-Moraga M, Aragonés
N, Pollán M, Navarro C, Calvo E, Román J, López-Abente G, Castaño A.
BIOAMBIENT.ES study protocol: rationale and design of a cross-sectional human
biomonitoring survey in Spain. 2013. Environ Sci Pollut Res Int 20:1193-202.
Pirkle JL, Brody DJ, Gunter EW, Kramer RA, Paschal DC, Flegal KM, et al. 1994. The decline
in blood lead levels in the United States. The National Health and Nutrition Examination
Surveys (NHANES). JAMA 272:284-291.
Poulsen OM, Holst E, Christensen JM. 1997. Calculation and application of coverage intervals
for biological reference values. Pure & Appl Chem 69:1601-1611.
Schindler BK, et al. 2014. The European COPHES/DEMOCOPHES project: towards
transnational comparability and reliability of human biomonitoring results. Int J Hyg
Environ Health 217:653-661.
Schoeters G, Colles A, Den Hond E, Croes K, Vrijens J, Baeyens W, et al. 2011. The Flemish
Environment and Health Study (FLEHS) – second survey (2007-2011): establishing
reference values for biomarkers of exposure in the Flemish population. In: Biomarkers and
Human Biomonitoring Volume 1: Ongoing Programs and Exposures (Knudsen LE, Merlo
DF, eds).Royal Society of Medicine, 135-165.
Schulz C, Wilhelm M, Heudorf U, Kolossa-Gehring M. 2012. Update of the reference and HBM
values derived by the German Human Biomonitoring Commission. Int J Hyg Environ
Health 215:150-158.
Silva MJ, Barr DB, Reidy JA, Malek NA, Hodge CC, Caudill SP, Brock JW, Needham LL,
Calafat AM. Urinary levels of seven phthalate metabolites in the U.S. population from the
National Health and NutritionExamination Survey (NHANES) 1999-2000. Environ Health
Perspect 2004; 112:331-8.
Tyrrell J, Melzer D, Henley W, Galloway TS, Osborne NJ. 2013. Associations between
socioeconomic status and environmental toxicant concentrations in adults in the USA:
NHANES 2001-2010. Environ Int 59:328-335.
22
U.S.Department of Health and Human Services. 2004. The Health Consequences of Smoking: A
Report of the Surgeon General.:Atlanta, GA: U.S. Department of Health and Human
Services, Centers for Disease Control and Prevention, National Center for Chronic Disease
Prevention and Health Promotion. Available:
http://www.cdc.gov/tobacco/data_statistics/sgr/2004/complete_report/index.htm [accessed
27 November 2014]
WHO. 1996. Biological Monitoring of Chemical Exposure in the Workplace. Geneva: World
Health Organisation. Available:
http://whqlibdoc.who.int/hq/1996/WHO_HPR_OCH_96.1.pdf [accessed 27 November
2014]
Wittassek M, Koch HM, Angerer J, Bruning T. 2011. Assessing exposure to phthalates - the
human biomonitoring approach. Mol Nutr Food Res 55:7-31.
23
Table 1. Descriptive statistics of the study population.
Children Mothers N Median (P25-P75) Min.-max. N Median (P25-P75) Min.-max. Age (years) 1844 8 (7,10) 5-12 1844 39 (35,42) 24 -52 Urinary creatinine (mg/L) 1842 1053 (784,1426) 10-3120 1839 1163 (781,1618) 57-3670 Body height (cm) 1819 135 (127,145) 98-170 1836 166 (161,170) 145-191 Body weight (kg) 1820 30 (25,36) 14-81 1836 64 (58,72) 35-186 Body-mass index (kg/m²) 1811 16.3 (14.9,18.2) 10.0-36.1 1833 23.2 (21.1,26.3) 14.7-62.2 Children Mothers N Categories N (%) N Categories N (%) Gender 1844 Boy
Girl 912 (49.5%) 932 (50.5%)
1844 Woman 1844 (100%)
Area of residence 1844 Rural Urban
923 (50.1%) 921 (49.9%)
1844 as in children
Highest educational level of the family
1843 Primary (ISCED 0-2) Secondary (ISCED 3-4) Tertiary (ISCED 5-6)
166 (9.0%) 607 (32.9%) 1070 (58.1%)
1843 as in children
Smoking habits 1844 Smoker 0 (0%) 1844 Daily smoker 283 (15.3%) Non-smoker 1844 (100%) Occasional smoker 106 (5.7%)
Former smoker 401 (21.7%) Never smoker 1054 (57.2%) ETS at home (non-smokers only)
1842 Daily Less than daily Never
179 (9.7%) 130 (7.1%) 1533 (83.2%)
1450 Yes No
162 (11.2%) 1288 (88.8%)
ETS elsewhere (non-smokers only)
1842 Yes No
775 (42.1%) 1067 (57.9%)
1455 Yes No
827 (56.8%) 628 (43.2%)
ETS in last 24 hours (non-smokers only)
1840 Yes No
232 (12.6%) 1608 (87.4%)
1450 Yes No
164 (11.3%) 1286 (88.7%)
24
Children Mothers N Categories N (%) N Categories N (%) Fish consumption 1844 Several times/week 442 (24.0%) 1844 Several times/week 483 (26.2%) (all types) Once a week or less 1402 (76.0%) Once a week or less 1361 (73.8%) Consumption of seafish 1840 Several times/week
Once a week or less 283 (15.4%) 1557 (84.6%)
1840 Several times/week Once a week or less
294 (16.0%) 1546 (84.0%)
Consumption of shellfish 1820 Several times/week Once a week or less
194 (10.7%) 1626 (89.3%)
1826 Several times/week Once a week or less
355 (19.4%) 1471 (80.6%)
Consumption of fresh water fish
1815 Several times/week Once a week or less
248 (13.7%) 1567 (86.3%)
1818 Several times/week Once a week or less
298 (16.4%) 1520 (83.6%)
Consumption of sea food products
1811 Several times/month Once a month or less
94 (5.2%) 1717 (94.8%)
1811 Several times/month Once a month or less
154 (8.5%) 1657 (91.5%)
Consumption of ice cream 1821 Several times/week Once a week or less
185 (10.2%) 1636 (89.8%)
1829 Several times/month Once a month or less
536 (29.3%) 1293 (70.7%)
Consumption of chewing gum
1662 Several times/week Once a week or less
578 (34.8%) 1084 (65.2%)
1675 Several times/week Once a week or less
626 (37.4%) 1049 (62.6%)
Use of personal care productsa
1816 High or moderate Low
822 (45.3%) 994 (54.7%)
1806 High Moderate or low
861 (47.7%) 945 (52.3%)
PVC in house 1773 PVC in floors or walls No PVC
342 (19.3%) 1431 (80.7%)
1773 as in children
P25: 25th percentile; P75: 75th percentile; N: number; ISCED: International Standard Classification of Education; ETS: environmental
tobacco smoke; PVC: polyvinyl chloride aUse of personal care products (PCP) is calculated as a score based on the frequency (never to daily) of 9 PCP groups (make-up, eye
make-up, shampoo, hair styling products, body lotions and creams, fragrances, deodorant, massage oil and nail polish).
25
Table 2. European exposure values in children and mothers in COPHES/DEMOCOPHES study.
Biomarker of exposure
COPHES/DEMOCOPHES study NHANESd
N % >LOQa GM (95% CI)b
P90 (95% CI)b
N (%) exceeding guidance valuec
Period N GM (95% CI)
P90 (95% CI)
Mercury in hair (µg/g)
1836 85.9% 0.145 (0.139,0.151)
0.800 (0.698,0.917)
JECFA: N=25 (1.4%) 1999-2000
838 0.12 (0.10,0.12)
0.41
Urinary cotinine (µg/L)
1818 57.6% 0.80 (0.76,0.84)
4.90 (3.90,6.16)
- - - - -
Urinary cadmium (µg/L)
1698 70.1% 0.071 (0.069,0.074)
0.220 (0.209,0.232)
HBM-I: N=6 (0.4%) HBM-II: N=0 (0.0%) BE: N=0 (0.0%)
2009-2010
415 0.057 (0.053,0.061)
0.130 (0.120,0.160)
Urinary DEHP metabolites (µg/L) (5)
1816 85.6% 47.6 (46.0,49.3)
137 (126,150)
HBM-I: N=12 (0.6%) BE: N=53 (2.9%)
2009-2010
415 MEHP: 1.64 (1.45,1.85) 5OH-MEHP: 15.0 (13.2,17.1) 5oxo-MEHP: 9.87 (8.72,11.0) ∑(GM)=26.5
Urinary MEP (µg/L)
1816 98.0% 34.4 (32.8,36.0)
159 (138,183)
BE: N=0 (0.0%) 2009-2010
415 35.2 (31.2,39.8)
151 (114,207)
Urinary MBzP (µg/L)
1816 95.2% 7.1 (6.8,7.5)
27.8 (25.2,30.6)
BE: N=0 (0.0%) 2009-2010
415 11.6 (9.51,14.1)
63.9 (47.4,76.8)
Urinary MnBP (µg/L)
1355 99.9% 34.8 (33.5,36.2)
95.5 (87.3,104.5)
- 2009-2010
415 21.7 (19.0,24.8)
83.8 (59.6,121)
Urinary MiBP (µg/L)
1355 99.8% 45.4 (43.6,47.3)
131 (117,147)
- 2009-2010
415 10.2 (9.10,11.4)
35.7 (28.8,46.9)
Mercury in hair (µg/g)
1839 90.5% 0·225 (0·216,0·234)
1.200 (1.068,1.349)
JECFA: N=62 (3.4%) 1999-2000
1726 0.20 (0.16,0.24)
1.11
Urinary cotinine (µg/L)
1800 62.4% 2.75 (2.41,3.14)
1182 (974,1434)
- - - - -
26
Biomarker of exposure
COPHES/DEMOCOPHES study NHANESd
N % >LOQa GM (95% CI)b
P90 (95% CI)b
N (%) exceeding guidance valuec
Period N GM (95% CI)
P90 (95% CI)
Urinary cadmium (µg/L)
1685 93.8% 0.219 (0.211,0.228)
0.620 (0.580,0.663)
HBM-I: N=49 (2.9%) HBM-II: N=0 (0.0%) BE: N=26 (1.5%)
2009-2010
1450 0.188 (0.172,0.206)
0·740 (0·620,0·880)
Urinary DEHP metabolites (µg/L) e
1800 81.6% 29.2 (28.1,30.3)
91 (84,100)
HBM-I: N=19 (1.0%) BE: N=28 (1.5%)
2009-2010
1350 MEHP: 1.39 (1.21,1.60) 5OH-MEHP: 11.0 (9.58,12.8) 5oxo-MEHP: 7.09 (6.17,8.14) ∑(GM)=19.5
Urinary MEP (µg/L)
1800 95.2% 48.2 (45.6,51.0)
252 (221,287)
BE: N=0 (0.0%) 2009-2010
1350 67.8 (60.3,76.4)
548 (392,675)
Urinary MBzP (µg/L)
1800 91.8% 4.5 (4.3,4.7)
17·7 (16.1,19.5)
BE: N=0 (0.0%) 2009-2010
1350 6.04 (5.38,6.77)
29.3 (24.5,36.9)
Urinary MnBP (µg/L)
1347 99.4% 23.9 (23.0,24.9)
66.2 (60.5,72.4)
- 2009-2010
1350 14.7 (13.1,16.5)
57.7 (52.7,63.9)
Urinary MiBP (µg/L)
1347 99.4% 30.1 (28.9,31.4)
88 (81,96)
- 2009-2010
1350 7.50 (6.68,8.43)
29.1 (25.3,33.5)
LOQ: limit of quantification; N: number; GM: geometric mean; 95% CI: 95% confidence interval; P90: 90th percentile; DEHP: di(2-
ethylhexyl)phthalate; MEP: mono-ethyl phthalate; MBzP: mono-benzyl phthalate; MnBP: mono-n-butyl phthalate; MiBP: mono-iso-butyl
phthalate; JECFA: Joint FAO/WHO Expert Committee on Food Additives; HBM-I human biomonitoring value I; HBM-II: human biomonitoring
value II; BE: biomonitoring equivalent; ∑(GM): sum of geometric means of MEHP, 5OH-MEHP and 5oxo-MEHP. aLimits of quantification (LOQs) ranged between 0.001 to 0.137 µg/g for mercury in hair, 0.1-1.2 µg/L for urinary cotinine, 0.001-0.2 µg/L for
urinary cadmium, 0.3-3.9 µg/L for urinary MEHP, 0.1-9.2 µg/L for urinary 5OH-MEHP, 0.1-6.2 µg/L for urinary 5oxo-MEHP, 0.5-11 µg/L for
urinary MEP, 0.2-5 µg/L for urinary MBzP, 0.5-4.4 µg/L for urinary MnBP and 0.5-4.9 µg/L for urinary MiBP. bGeometric means and 90th
percentiles are weighed but not adjusted for confounders (see methods). cHealth-based exposure values are available for mercury: JECFA
guideline = 2.3 µg/g (Joint Expert Committee on Food Additives 2003); cadmium: HBM-I in children = 0.5 µg/L; HBM-II in children = 1 µg/L;
27
HBM-I in adults = 1.0 µg/L; HBM-II in adults = 4.0 µg/L (Schulz et al. 2012); BE in children and in mothers = 1.2 µg/L (Hays et al. 2008);
phthalate metabolites: HBM-I value for DEHP metabolites are based on the sum of 5OH-MEHP and 5oxo-MEHP and equal 500 µg/L in children
and 300 µg/L in adults (Schulz et al. 2012); BE’s for DEHP metabolites are based on the sum of MEHP, 5OH-MEHP and 5oxo-MEHP and equal
260 µg/L in children and in mothers (Aylward et al. 2009a); BE for MEP in mothers and children = 18 mg/L (Aylward et al. 2009b); BE for
MBzP in children and adults = 3.8 mg/L (Aylward et al. 2009b). dNHANES: data of urinary cadmium and urinary phthalate metabolites from ‘The
Fourth National Report on Human Exposure to Environmental Chemicals, Updated Tables, March 2013’ (Center for Disease Control (CDC)
2013); data of mercury in hair: from McDowell et all. (McDowell et al. 2004) Data of COPHES/DEMOCOPHES children are compared with
NHANES subgroup ‘Age group 6-11 years’; data of COPHES/DEMOCOPHES mothers are compared with NHANES subgroup ‘Females’. eUrinary DEHP metabolites: sum of MEHP, 5OH-MEHP and 5oxo-MEHP.
28
Table 3. Determinants of exposure to urinary phthalate metabolites (µg/L): multiple regression models in children.
Estimate (95% CI) for change (multiplicative factor) Parameters Strata DEHP MEP MBzP MnBP MiBP Ageb 5-8 years
9-11 years 1.19 (1.11, 1.27)
1.00 1.15 (1.04, 1.26)
1.00 1.15 (1.06, 1.26)
1.00 1.15 (1.07, 1.24)
1.00 1.19 (1.10, 1.28)
1.00 Genderb boys
girls ns ns ns 0.91 (0.85, 0.98)
1.00 0.92 (0.85, 0.99)
1.00 Urinary creatinine levelb 300-900 mg/L
900-1500 mg/L 1500-3000 mg/L
0.46 (0.42,0.51) 0.75 (0.69, 0.83)
1.00
0.41 (0.36, 0.47) 0.68 (0.61, 0.77)
1.00
0.41 (0.37, 0.47) 0.69 (0.62, 0.78)
1.00
0.45 (0.41, 0.50) 0.73 (0.66, 0.81)
1.00
0.45 (0.40, 0.50) 0.72 (0.65, 0.80)
1.00 Urine sampling period <10 hours
10-11 hours ≥11 hours
ns 1.20 (1.06, 1.35) 1.14 (1.02, 1.29)
1.00
ns ns ns
Morning urine yes no
ns ns 1.98 (1.17, 3.36) 1.00
ns ns
Educational level of the family
primary secondary tertiary
ns 0.91 (0.81, 1.03) 0.89 (0.82, 0.97)
1.00
ns 0.91 (0.81, 1.03) 0.89 (0.82, 0.97)
1.00
ns
Use of personal care productsa
moderate to high use low use
ns 1.24 (1.13, 1.37) 1.00
ns ns 1.13 (1.03, 1.23) 1.00
Ice cream consumption several times/week once/week or less
1.12 (1.01, 1.25) 1.00
ns 1.18 (1.02, 1.36) 1.00
ns ns
Gum consumption several times/week once/week or less
1.10 (1.02, 1.18) 1.00
ns ns ns ns
PVC in floors/walls yes no
ns ns 1.50 (1.34, 1.68) 1.00
1.19 (1.08, 1.32) 1.00
1.22 (1.09, 1.35) 1.00
aUse of personal care products (PCP) is calculated as a score based on the frequency (never to daily) of 9 PCP groups (make-up, eye make-up,
shampoo, hair styling products, body lotions and creams, fragrances, deodorant, massage oil and nail polish). bThe confounders urinary creatinine
level, gender, and age were forced in the multiple regression models, even if not significant.
29
Table 4. Determinants of exposure to urinary phthalate metabolites (µg/L): multiple regression models in mothers.
Estimate (95% CI) for change (multiplicative factor) Parameters Strata DEHP MEP MBzP MnBP MiBP Ageb ≤35 years
35-40 years >40 years
ns ns ns 0.81 (0.73, 0.89) 0.93 (0.86, 1.01)
1.00
ns
Body-mass index normal weight overweight obese
ns ns ns 1.15 (1.02, 1.29) 1.09 (0.96, 1.24)
1.00
ns
Urinary creatinine levelb 300-900 mg/L 900-1500 mg/L 1500-3000 mg/L
0.35 (0.32, 0.38) 0.62 (0.57, 0.68)
1.00
0.32 (0.28, 0.37) 0.63 (0.55, 0.72)
1.00
0.33 (0.30, 0.37) 0.59 (0.54, 0.65)
1.00
0.35 (0.32, 0.38) 0.60 (0.55, 0.66)
1.00
0.38 (0.35, 0.41) 0.61 (0.56, 0.67)
1.00 Urine sampling period <7 hours
7-9 hours ≥9 hours
0.87 (0.79, 0.97) 0.97 (0.88, 1.06)
1.00
ns ns ns ns
Educational level of the family
primary secondary tertiary
1.20 (1.05, 1.37) 1.04 (0.96, 1.13)
1.00
ns ns ns 1.09 (0.97, 1.23) 1.11 (1.02, 1.21)
1.00 Use of personal care productsa
high use moderate to low use
0.91 (0.84, 0.98) 1.00
1.40 (1.25, 1.56) 1.00
ns 0.92 (0.86, 0.99) 1.00
ns
Ice cream consumption several times/month once/month or less
ns ns 1.13 (1.03, 1.24) 1.00
1.10 (1.01, 1.19) 1.00
ns
Gum consumption several times/week once/week or less
ns 1.19 (1.06, 1.34) 1.00
ns ns ns
PVC in floors/walls yes no
ns ns 1.32 (1.19, 1.47) 1.00
ns 1.15 (1.04, 1.26) 1.00
Renovation in house yes no
ns ns ns ns 1.08 (1.00, 1.16) 1.00
ns: not significant; abbreviations biomarkers: see Table 2. aUse of personal care products (PCP) is calculated as a score based on the frequency (never to daily) of 9 PCP groups (make-up, eye make-up,
shampoo, hair styling products, body lotions and creams, fragrances, deodorant, massage oil and nail polish). bThe confounders urinary creatinine
level and age were forced in the multiple regression models, even if not significant
30
Figure legends
Figure 1. Overview of geometric means (95% CI) of biomarker concentrations (µg/L) in
children and mothers of the participating countries. Country codes: Belgium (BE); Switzerland
(CH), Cyprus (CY), Czech Republic (CZ), Germany (DE), Denmark (DK), Spain (ES), Hungary
(HU), Ireland (IE), Luxembourg (LU), Poland (PL), Portugal (PT), Romania (RO), Sweden (SE),
Slovenia (SI), Slovak Republic (SK) and United Kingdom (UK). Abbeviations biomarkers: see
Table 2.All data in children are adjusted for age and gender; urinary metabolites are additionally
adjusted for urinary creatinine; all data in mothers are adjusted for age; urinary metabolites are
additionally adjusted for urinary creatinine; urinary cadmium is additionally adjusted for
smoking. Light grey: GM of country significantly below European GM. Dark grey: GM of
country is significantly above European GM. White: no significant difference between GM of
country and European GM. NA: no biomarker data available. European GMs: see Table 2.
Figure 2. Heat map showing clustering of biomarkers (dendrogram to the left side) and
clustering of countries (dendrogram at the top). Red and blue intensities indicate fold increases
respectively decreases (expressed as log2) in country specific biomarker concentrations adjusted
for age and gender relative to the European geometric mean. Country codes: see Figure 1.
Country codes followed by M present concentrations in mothers, countrycodes followed by C
present concentrations in children. White rectangles: missing data.
31
Figure 1.
CHILDREN BE CH CY CZ DE DK ES HU IE LU PL PT RO SE SI SK UK Mercury 0.204
(0.172, 0.241)
0.076 (0.065, 0.090)
0.326 (0.257, 0.413)
0.098 (0.083, 0.116)
0.055 (0.046, 0.065)
0.250 0.211, 0.295)
0.884 (0.747, 1.046)
0.025 (0.021, 0.029)
0.097 (0.082, 0.114)
0.181 (0.142, 0.229)
0.070 (0.060, 0.083)
1.033 (0.873, 1.222)
0.085 (0.072, 0.101)
0.181 (0.153, 0.214)
0.169 (0.142, 0.200)
0.092 (0.078, 0.109)
0.192 (0.163, 0.228)
Cadmium 0.046 (0.040, 0.052)
0.081 (0.071, 0.092)
0.114 0.096, 0.261)
0.117 (0.104, 0.133)
NA 0.024 (0.021, 0.027)
0.047 (0.041, 0.053)
0.129 (0.113, 0.146)
0.068 (0.060, 0.077)
0.154 (0.129, 0.184)
0.134 (0.118, 0.152)
0.045 (0.039, 0.051)
0.026 (0.023, 0.029)
0.090 (0.079, 0.103)
0.077 (0.068, 0.087)
0.144 (0.127, 0.163)
0.167 (0.147, 0.191)
Cotinine 0.629 (0.517, 0.766)
0.508 (0.418, 0.619)
0.842 (0.638, 1.111
1.602 (1.316, 1.950)
0.305 (0.251, 0.371)
0.658 (0.541, 0.801)
1.485 (1.219, 1.810)
1.776 (1.460, 2.161)
0.708 (0.582, 0.862)
0.397 (0.301, 0.524)
1.568 (1.288, 1.909)
1.093 (0.897, 1.333)
1.942 (1.943, 1.597)
0.202 (0.165, 0.246)
0.529 (0.434, 0.644)
1.085 (0.892, 1.320)
0.661 (0.542, 0.806)
DEHP 37.3 (32.9, 42.2)
28.1 (24.9, 31.9)
25.0 (21.0, 29.8)
71.1 (62.7, 80.5)
39.5 (34.9, 44.8)
40.9 (36.1, 46.4)
73.4 (64.7, 83.2)
58.7 (51.8, 66.5)
59.6 (52.6, 67.5)
25.8 (21.7, 30.8)
76.4 (67.4, 86.6)
48.2 (42.5, 54.6)
74.0 (65.4, 83.8)
49.9 (43.9, 56.6)
46.3 (40.8, 53.4)
82.7 (73.0, 93.7)
37.5 (33.0, 42.5)
MEP 26.7 (22.3, 32.0)
19.7 (16.5, 23.6)
41.2 (31.9, 53.1)
34.4 (28.7, 41.1)
23.1 (19.3, 27.7)
22.1 (18.5, 26.5)
208.3 (173.7, 249,8)
45.4 (37.9, 54.3)
42.5 (35.5, 50.9)
26.8 (20.8, 34.6)
46.9 (39.1, 56.2)
50.2 (41.8, 60.2)
34.8 (29.1, 41.7)
33.3 (27.8, 40.0)
40.2 (33.5, 48.1)
37.5 (31.3, 44.9)
16.9 (14.1, 20.3)
MBzP 9.0 (7.5, 10.6)
5.1 (4.3, 6.1)
3.7 (2.9, 4.7)
9.1 (7.6, 10.8)
6.6 (5.5, 7.8)
8.0 (6.7, 9.4)
14.6 (12.3, 17.3)
7.3 (6.2, 8.7)
5.9 (5.0, 7.0)
5.2 (4.1, 6.6)
9.3 (7.9, 11.1)
8.1 (6.8, 9.6)
4.1 (3.5, 4.9)
23.1 (19.4, 27.5)
7.9 (6.6, 9.4)
7.9 (6.6, 9.4)
4.2 (3.5, 4.9)
MnBP 39.4 (34.9, 44.6)
20.1 (17.8, 22.8)
20.6 (17.3, 24.6)
NA 46.4 (41.0, 52.5)
33.6 (29.7, 38.1)
52.7 (46.5, 59.7)
NA 28.5 (25.2, 32.2)
28.2 (23.7, 33.6)
90.4 (80.0, 102.3)
33.3 (29.4, 37.7)
43.2 (38.2, 48.8)
NA 38.0 (33.5, 42.9)
NA 26.4 (23.3, 29.9)
MiBP 59.2 (51.9, 67.5)
20.5 (18.0, 23.4)
51.8 (43.0, 62.3)
NA 41.4 (36.3, 47.2)
62.2 (54.5, 71.0)
63.8 (55.9, 72.9)
NA 45.4 (39.8, 51.7)
36.9 (30.6, 44.4)
108.3 (95.0, 123.5)
40.3 (35.3, 46.1)
51.1 (44.8, 58.3)
NA 55.0 (48.2, 62.7)
NA 30.3 (26.5, 34.6)
MOTHERS BE CH CY CZ DE DK ES HU IE LU PL PT RO SE SI SK UK Mercury 0.368
(0.313, 0.431)
0.153 (0.131, 0.180)
0.462 (0.369, 0.578)
0.156 (0.133, 0.183)
0.107 (0.092, 0.126)
0.391 (0.333, 0.458)
1.486 (1.267, 1.744)
0.039 (0.033, 0.045)
0.162 (0.139, 0.190)
0.387 (0.308, 0.485)
0.135 (0.116, 0.159)
1.200 (1.023, 1.406)
0.100 (0.085, 0.117)
0.252 (0.215, 0.295)
0.255 (0.217, 0.299)
0.132 (0.112, 0.154)
0.153 (0.130, 0.180)
Cadmium 0.224 (0.197, 0.255)
0.224 (0.197, 0.255)
0.183 (0.153, 0.219)
0.259 (0.228, 0.295)
NA 0.132 (0.116, 0.150)
0.212 (0.187, 0.241)
0.183 (0.161, 0.207)
0.296 (0.261, 0.336)
0.249 (0.208, 0.298)
0.453 (0.399, 0.514)
0.186 (0.164, 0.211)
0.187 (0.164, 0.212)
0.175 (0.154, 0.199)
0.289 (0.255, 0.329)
0.306 (0.269, 0.348)
0.267 (0.234, 0.304)
Cotinine 1.257 (0.736, 2.147)
0.844 (0.493, 1.446)
2.825 (1.329, 6.002)
3.773 (2.211, 6.441)
1.005 (0.588, 1.717)
1.871 (1.091, 3.209)
9.586 (5.597, 16.42)
7.187 (4.209, 12.27)
3.863 (2.266, 6.585)
0.557 0.260, 1.193)
6.219 (3.644, 10.61)
10.92 (6.401, 18.64)
14.92 (8.702, 25.57)
1.803 1.056, 3.080)
1.790 (1.048, 3.058)
2.819 (1.653, 4.809)
0.843 (0.489, 1.452)
DEHP 21.7 (19.0, 24.8)
20.4 (17.8, 23.3)
16.8 (13.9, 20.3)
37.3 (32.6, 42.6)
21.1 (18.5, 24.1)
24.0 (21.0, 27.4)
43.4 (38.0, 49.6)
34.0 (29.7, 38.8)
32.3 (29.7, 38.8)
15.9 (13.2, 19.3)
43.9 (38.4, 50.2)
37.2 (32.6, 42.5)
51.5 (45.0, 58.9)
28.4 (24.8, 32.4)
28.1 (24.6, 32.1)
39.4 (34.5, 45.0)
15.5 (13.5, 17.8)
MEP 37.1 (30.1, 45.8)
31.2 (25.2, 38.5)
87.7 (65.2, 117.9)
59.2 (48.0, 73.0)
38.5 (31.2, 47.6)
37.3 (30.2, 46.1)
160.0 (129.5, 197.6)
50.9 (41.2, 62.8)
55.2 (44.8, 68.1)
36.4 (27.0, 49.1)
42.5 (34.5, 52.5)
55.9 (45.3, 68.9)
44.2 (35.8, 54.7)
46.5 (37.7, 57.4)
46.8 (37.9, 57.8)
52.2 (42.3, 64.4)
27.4 (22.1, 33.9)
MBzP 6.5 (5.6, 7.7)
3.9 (3.3, 4.6)
2.4 (1.9, 3.0)
4.7 (4.0, 5.6)
4.5 (3.8, 5.2)
4.5 (3.8, 5.2)
8.5 (7.2, 9.9)
4.3 (3.7, 5.1)
3.4 (2.9, 4.0)
3.6 (2.8, 4.5)
4.5 (3.9, 5.3)
5.6 (4.8, 6.6)
2.5 (2.1, 2.9)
13.8 (11.8, 16.2)
4.4 (3.8, 5.2)
4.4 (3.8, 5.2)
1.7 (1.5, 2.0)
MnBP 30.5 (27.1, 34.4)
13.9 (12.3, 15.7)
16.1 (13.6, 19.1)
NA 29.7 (26.4, 33.5)
21.6 (19.2, 24.4)
30.8 (27.3, 34.7)
NA 20.2 (18.0, 22.8)
18.3 (15.4, 21.7)
48.2 (42.8, 54.4)
22.3 (19.8, 25.1)
27.1 (24.0, 30.6)
NA 23.8 (21.1, 26.8)
NA 13.1 (11.6, 14.9)
MiBP 38.6 (34.1, 43.6)
14.4 (12.7, 16.3)
43.7 (36.8, 52.0)
NA 24.6 (21.8, 27.8)
41.6 (36.7, 47.1)
37.0 (32.7, 41.8)
NA 26.5 (23.4, 29.9)
21.1 (17.7, 25.1)
53.6 (47.4, 60.6)
28.4 (25.1, 32.1)
34.7 (30.6, 39.2)
NA 34.9 (30.8, 39.4)
NA 17.6 (15.5, 19.9)
32
Figure 2.
Hg
MEP
MBzP
DEHP
MnBP
MiBP
Cd
COT
RO
_CR
O_M
HU
_MH
U_C
PL_C
CZ_
CPL
_MSK
_CD
E_C
DE_
MC
H_M
UK
_MC
H_C
UK
_CLU
_CLU
_MSE
_CSE
_MD
K_C
DK
_MB
E_C
BE_
MSI
_MSI
_CIE
_CSK
_MC
Z_M
IE_M
CY_
CC
Y_M
PT_C
PT_M
ES_M
ES_C
-2.5
-2
-1.5
-1
-0.5
0
0.5
1
1.5
2
2.5
Hg
MEP
MBzP
DEHP
MnBP
MiBP
Cd
COT
RO
_CR
O_M
HU
_MH
U_C
PL_C
CZ_
CPL
_MSK
_CD
E_C
DE_
MC
H_M
UK
_MC
H_C
UK
_CLU
_CLU
_MSE
_CSE
_MD
K_C
DK
_MB
E_C
BE_
MSI
_MSI
_CIE
_CSK
_MC
Z_M
IE_M
CY_
CC
Y_M
PT_C
PT_M
ES_M
ES_C
-2.5
-2
-1.5
-1
-0.5
0
0.5
1
1.5
2
2.52.5
2
1.5
1
0.5
0
0.5
-1
-1.5
-2
-2.5 Log 2
(Bio
mar
ker C
ount
ry/B
iom
arke
r Ove
rall m
ean)