Embed Size (px)
Citation preview
Patterns of global biomass trade. Implications for food sovereignty and socio-environmental conflicts
March, 2015
ejolt report
no. 20
ejolt report
no. 20
Report written by Andreas Mayer, Anke Schaffartzik,
Willi Haas, and Arnulfo Rojas Sepulveda
with contributions by World Rainforest Movement (WRM), GRAIN, Alina Brad,
Melanie Pichler, Christina Plank, and Hailemariam Birke Andarge
Patterns of global biomass trade
Implications for food sovereignty
and socio-environmental conflicts
Implications for food sovereignty and
socio-environmental conflicts

Patterns of global biomass trade. Implications for food sovereignty and socio-environmental conflicts
March - 2015
EJOLT Report No.: 20
This document should be cited as:
Mayer, A., Schaffartzik, A., Haas, W., Rojas-Sepúlveda, A. 2015. Patterns of global biomass trade – Implications
for food sovereignty and socio-environmental conflicts. EJOLT Report No. 20, 106 p.
Report written by:
Andreas Mayer1, Anke Schaffartzik
1, Willi Haas
1,
Arnulfo Rojas-Sepúlveda1,
World Rainforest Movement, GRAIN,
Alina Brad2, Melanie Pichler
2, Christina Plank
2,
Hailemariam Birke Andarge3
1 Institute of Social Ecology,
Alpen-Adria University, Vienna, Austria 2 Department of Political Science,
University of Vienna, Austria 3 University of Gondar, Ethiopia
Layout:
Andreas Mayer
Series editor:
Beatriz Rodríguez-Labajos
The contents of this report may be reproduced in
whole or in part for educational or non-profit
services without special permission from the
authors, provided acknowledgement of the source
is made.
This publication was developed as a part of the
project Environmental Justice Organisations,
Liabilities and Trade (EJOLT) (FP7-Science in
Society-2010-1).
The EJOLT project (2011-15) has received funding
from the European Union’s 7th Framework
Programme for research, technological
development and demonstration under grant
agreement no 266642. The views and opinions
expressed in this report the authors’ view and the
European Union is not liable for any use that may
be made of the information contained therein.
Patterns
of
global
biomass
trade Implications
for food
sovereignty
and socio-
environmental
conflicts
Patterns of global biomass trade.
Implications for food sovereignty and socio-environmental conflicts
Abstract
In the late 20th and early 21
st centuries, global trade in agricultural products grew
more than three times faster than agricultural production. Nearly all the new land
that had been put into production since 1986 was used to produce export crops.
While higher volumes of agricultural production and trade increased the global
availability of agricultural products, their benefits and negative impacts are not
evenly distributed globally. From a regional perspective, the surge in agricultural
production for export is most pronounced in Latin America and in some Southeast
Asian and Eastern European countries. This export orientation is often associated
with negative impacts on food self-sufficiency and a potential threat to food
sovereignty in the producing countries.
This report examines the global evolution of food production and international food
trade and identifies related drivers of socio-environmental conflicts. Evidence from
case studies of two important agricultural exporters – Indonesia and Paraguay –
suggests that the focus on the extraction of primary materials for export
(extractivism) in the agricultural sector can be linked to rising potential for socio-
environmental conflict. This evidence in turn sheds new light on the third case
study on Ethiopia, a country currently modernizing its agricultural sector with the
aim of becoming an exporter of agricultural products. Focusing on drivers of land
use conflicts, the results presented in this report cover topics of importance for
sustainability research and policy at large.
Keywords
Agricultural Production
Agricultural Trade
Agrofuels
Biomass
Drivers of Land Use
Food Regimes
Food Security
Food Sovereignty
Land Grabbing
Land Use Conflicts
Material Flow Accounting
Socio-Environmental Conflicts

Patterns of global biomass trade.
Implications for food sovereignty and socio-environmental conflicts
Contents
Foreword 5
1 Introduction 8
1.1 Biomass and land: hosting, feeding, and fueling humanity 8
1.2 Colonization of ecosystems and food regime theory 12
1.3 Feedstock for the industrial biomass metabolism as another demand upon the land system 17
2 International trade policies 24
2.1 Liberalization of international trade: From GATT to WTO 24
2.2 The WTO agreement on agriculture 25
2.3 The Common Agricultural Policy (CAP) and its impacts on the global South 27
2.4 Consequences of trade liberalization 28
3 Patterns of global biomass production and trade 30
3.1 Global biomass production 30
3.2 Global biomass trade 33
3.3 Country groupings 34
3.4 Metabolic profiles of country groupings 37
3.5 Extraction of biomass by country groupings 40
3.6 Biomass trade by country groupings 43
4 Threats to food sovereignty and the potential of social conflicts 46
4.1 Food self-sufficiency and international trade 46
4.2 Patterns of maize production and consumption 48
4.3 Patterns of rice production and consumption 51
4.4 Patterns of wheat production and consumption 53
Patterns of global biomass trade.
Implications for food sovereignty and socio-environmental conflicts
5 Country case studies 56
5.1 Power over land:
The expansion of oil palm plantations in Indonesia 56
5.2 The republic of soy – agricultural development in Paraguay 64
5.3 The balancing act: Large scale land investments
to boost exports and secure food in Ethiopia 73
6 Conclusions 86
Acknowledgments 92
References 93
References chapters 1, 2, 3, 4, and 6 93
References 5.1 Indonesia 101
References 5.2 Paraguay 103
References 5.3 Ethiopia 104
Patterns of global biomass trade.
Implications for food sovereignty and socio-environmental conflicts
Acronyms
ADLI Agricultural Development-Led Industrialization
AMS Aggregate Measures of Total Domestic Support
BAL Basic Agrarian Law in Indonesia
BFL Basic Forestry Law in Indonesia
Bn Billion
BVRio Bolsa Verde do Rio de Janeiro
CAP Common Agricultural Policy
Cap Capita
CRA Forest Restoration Credit
CSO Civil Society Organizations
CSR Corporate Social Responsibility
DAP Desarrollo Agrícola del Paraguay
DBE Development Bank of Ethiopia
DE Domestic Extraction
DFID UK’s Department for International Development
DMC Domestic Material Consumption
EC European Communities
EIA Ethiopian Investment Agency
EIA Environmental Impact Assessment
EJO Environmental Justice Organizations
ERPDF Ethiopian Peoples’ Revolutionary Democratic Front
EU European Union
FAOSTAT Food and Agriculture Organization Corporate
Statistical Database
FSC Forest Sustainability Certificate
FW Fresh Weight
GATT General Agreement on Tariffs and Trade
GDP Gross Domestic Product
GM Genetically Modified
Gt Gigaton (1 Billion Tons)
ha Hectare
IATP Institute for Agriculture and Trade Policy
IMF International Monetary Fund
ITO International Trade Organization
ITPs Industrial Tree Plantations
LDC Least Developed Countries
LIFDC Low-Income Food-Deficit Countries
MFA Material Flow Accounting
Mha Million Hectares
NTB Non-Tariff Barriers
NTM Non-Tariff Measures
OECD Organization for Economic Cooperation
and Development
PSNP Productive Safety Net Program
PTB Physical Trade Balance
RR Roundup Ready
RSB Roundtable of Sustainable Biomaterials
SPSs Sanitary and Phytosanitary Measures
t Metric Ton
TBT Technical Barriers to Trade
TE Tariff Equivalents
UNCTAD United Nations Conference on Trade
and Development
USAID United States Agency for International Development
VAT Value Added Tax
WRM World Rainforest Movement
WTO World Trade Organization
WWF World Wide Fund for Nature
The ISO 4217 standard is used for the currency codes (e.g. USD for US dollar or BRL for Brazil real).
Patterns of global biomass trade.
Implications for food sovereignty and socio-environmental conflicts
Page 5
Foreword
Conflicts over resource extraction or waste disposal increase in number as the
world economy uses more materials and energy. Civil society organizations
(CSOs) active in environmental justice issues focus on the link between the need
for environmental security and the defence of basic human rights.
The EJOLT project (Environmental Justice Organizations, Liabilities and Trade,
www.ejolt.org) is an FP7 Science in Society project that runs from 2011 to 2015.
EJOLT brings together a consortium of 23 academic and civil society
organizations across a range of fields to promote collaboration and mutual
learning among stakeholders who research or use Sustainability Sciences,
particularly regarding aspects of ecological distribution. One main goal is to
empower environmental justice organizations (EJOs) and the communities they
support, which bear an unfair share of environmental burdens, in defending or
reclaiming their rights. This will be done through a process of two-way knowledge
transfer, encouraging participatory action research and the transfer of
methodologies with which EJOs, communities, and citizen movements can
monitor and describe the state of their environment and document its degradation.
The transfer is designed to enable learning from other experiences and from
academic research and to provide arguments in combatting the growth of
environmental liabilities or ecological debts. Thus, EJOLT will increase EJOs’
capacity to use scientific concepts and methods for the quantification of
environmental and health impacts, increasing their knowledge of environmental
risks and of legal mechanisms of redress. On the other hand, EJOLT will greatly
enrich research in the Sustainability Sciences by mobilising the accumulated
‘activist knowledge’ of the EJOs and making it available to the sustainability
research community. Finally, EJOLT will help translate the findings of this mutual
learning process for the policy arena, supporting the further development of
evidence-based decision making and broadening the information base. The focus
is on the use of concepts such as ecological debt, environmental liabilities, and
ecologically unequal exchange in science and in environmental activism and
policy-making.
The overall aim of EJOLT is to improve policy responses to and support
collaborative research on environmental conflicts through capacity building of
environmental justice groups and multi-stakeholder problem solving. A key goal of
the EJOLT research has been to understand the links between increased societal
metabolism (in terms of energy and materials) and resource extraction and waste
disposal conflicts in order to address the following pressing concerns:
Patterns of global biomass trade.
Implications for food sovereignty and socio-environmental conflicts
Page 6
What are the causes of increasing ecological distribution conflicts at different
scales and how can such conflicts become positive forces in achieving greater
environmental sustainability?
International physical trade of agricultural products was traditionally low compared
to the trade in fossil fuels, metals, and highly processed commodities. The
reasons behind were in part the comparatively low prices attainable for those
agricultural products traded in bulk and the relative ubiquity of biomass as a
resource. In contrast, most non-renewable resources are point resources that are
much more concentrated in specific regions than in others, with trade in these
materials being a prerequisite for their availability in many countries. From 1960,
global trade in agricultural products grew by factor 6 while production only grew by
factor 2. For several crop types, growth was even more pronounced: Exports of
oil-bearing crops, for example, grew by factor 10 while production of this crop type
grew by factor 5. Nearly all new land areas that were brought into production after
1986 were used to produce export crops (Kastner et al., 2013).
From a regional perspective, this export orientation can be observed to be most
pronounced in Latin America, in some Southeast Asian and Eastern European
countries, and (to a far lower degree) in Sub-Saharan Africa. The revenues
generated by exports are commonly required to finance imports. In some cases,
they were partly distributed among the poorer segments of the respective
populations through social welfare programs, such as the ‘Bolsa Família’ in Brazil
and other programs in Latin America. On the other hand, within the last four years,
the EJOLT project collected 218 cases documenting a link between biomass
extraction and land use conflicts. This report aims to reveal the biophysical
conditions and structural drivers of these conflicts and thus to identify conflict
potentials that result from the dominant model of industrialized agricultural
production (Hamilton, 1993).
Chapter 1 of this report offers a general description of the environmental, political,
and economic development within which agricultural production occurs. Theories
and methods, which have proven useful in addressing socio-environmental
conflicts driven by different claims on the land system, are also presented in this
chapter.
The case of the expansion of industrial tree plantations in the global South for the
biomass demands of industrialized regions, analysed by Winnie Overbeek and
colleagues from the World Rainforest Movement, illustrates this framework by
describing one increasing claim on the land system that – ceteris paribus –
reduces fertile land for other purposes.
Chapter 2 summarizes international trade policies that have driven agricultural
production and trade flows since the 1950s. We elaborate the functioning and
influence of the World Trade Organization (WTO) and investigate how its policies
have triggered changes in agricultural patterns in many parts of the world.
Chapter 3 contains the empirical section of this report and analyses patterns of
food import dependency at the country level in 2010. In an export-oriented
agricultural production system, we consider the degree of food import dependency
Patterns of global biomass trade.
Implications for food sovereignty and socio-environmental conflicts
Page 7
coupled with the lack of access to financial capital to be a systemic driver of socio-
environmental conflicts.
In conclusion of the report’s section on global patterns, an analysis of the
vulnerability of food systems is presented at the country level for rice, maize, and
wheat in chapter 4.
Following the global analysis of agricultural production and trade, we present three
country level case studies in chapter 5. While Indonesia and Paraguay are
already important providers of agricultural products on the global market, Ethiopia
is currently entering a phase of development leading toward greater export
orientation.
Chapter 6 provides a synthesis from the global analysis and the country case
studies. This synthesis highlights the fact that smallholder inclusion in agricultural
development often contrasts with the increasing land concentration that can be
observed in the agricultural sector.
Introduction
Page 8
1
Introduction
1.1 Biomass and land: hosting, feeding, and fueling humanity
Industrialization is as much a metabolic process as it is an economic, political, and
social transformation. As an economy industrializes, agriculture tends to lose
importance in terms of employment and income. The resource base shifts from
one dominated by biomass to one dominated by minerals (Krausmann et al.,
2008b). Nonetheless, all economies, whether industrialized or not, continue to
require inputs of biomass for the direct and indirect consumption of their
population and often also in order to meet final demand elsewhere through
exports.
Biomass is the sum of recent, non-fossil organic material of biological origin, i.e.,
derived from living (plants) or recently living organisms (e.g., meat). Despite the
dominating importance of non-renewable resources in industrial societies, plant-
based biomass still accounted for more than one third of global material
consumption in 2010 (Schaffartzik et al., 2014). The most essential human use of
biomass is the provision of food for humans and of feed for domesticated animals,
and despite some advances in the production of artificial food, biomass for food
and feed is not substitutable. Biomass is also used as raw material in industrial
processes, for construction (wood), manufacturing of clothes, pulp and paper, and
a broad variety of other purposes.
Next to these purposes, biomass is still the most important energy carrier for a
large part of the population in low-income countries (Krausmann et al., 2008).
During recent years, another demand grew massively, mostly in the highly
industrialized world. Agrofuels1 contain energy from living organisms, mostly
plants. Agrofuels are produced in direct or indirect competition with food, feed
crops or natural lands, thus increasing human pressure on the land system.
Currently, around two-thirds of the terrestrial surface of the earth are used by
humans in order to produce biomass (Erb et al., 2007; Lambin and Meyfroidt,
2011). Only a relatively small share of one-fifth of the global land is still regarded
as ‘wilderness’ and is mostly to be found in the very northern parts of the
1 The term ‘agrofuels’ (and hence agrodiesel) is used here to underline the focus on large-scale
agricultural production of biofuel feedstock. When we use the term biofuel, we refer to the official
use of this term, such as biofuel policy or EU biofuel mandate.
Agrofuels are
produced in direct or
indirect competition
with food, feed crops
or natural lands, thus
increasing human
pressure on the land
system.
Introduction
Page 9
Americas and Russia, although there are still some areas in the tropical zone that
are considered as wilderness (Sanderson et al., 2002)2. However, whether these
areas are still without human interference is debatable.
Between 1960 and 2010, global biomass consumption more than doubled in
absolute terms causing per capita availability of biomass to remain almost
constant at around 3 tons per person per year despite shifts from biomass-based
energy such as firewood to fossil fuels (Schaffartzik et al., 2014). Alongside
changes in the structure of global biomass production, the overall growth of the
resource hunger of the global economy has pushed extraction frontiers further into
areas that were previously beyond the reach of industrial extraction, production,
and transport infrastructure.
Landscapes outside of the densely poulated centers of global capitalism have
traditionally been seen as underused and ripe for societal use. Making an analogy
to the depictions during colonial times, Wylie (2007) sums the current land rush up
as follows
... non-European landscape is equally simultaneously pictured as natural and
pristine, as untouched and untransformed. This symbolic erasure of other possible
histories of land occupation of course parallels more literal processes of imperialist
land appropriation and indigenous repression... It also ... tends to ‘empty’ the
landscape, just as much as cartography advances a blank space of the unknown
before itself. In this way, as untouched nature, the landscape is pictured as ripe for
settlement and colonialisation (Wylie, 2007: 133, cited in: Scoones et al., 2014: 5).
Land supports a multitude of functions for the existence and reproduction of all
sorts of forms of life, including human societies (Haberl, 2014). The functions for
human societies are: Services that range from supporting systems such as soil
formation and genetic diversity to provisioning services in the form of food, fuels,
and fibres, regulating services such as carbon sequestration, or cultural services
in the form of recreation, sacred groves, and inspiration. However, through the
maximisation of one specific form of land use, competition with other uses and
related conflicts may arise. For example, the extension of areas used for the
production of energy crops may reduce the area available for smallholder food
production or biodiversity conservation or may cut or block corridors that are used
by transhumant pastoralists (Fritsche et al., 2010; Smith et al., 2010).
In an ever more globalized world, increased interactions over long distances
shape global land use and increase land use competition. EU biofuel mandates
2 It is important to mention that the term ‘human interference’ is not a straightforward description of the
way humans interact with their environment. The dominant (Western) view describes a vision of
humans separated from nature, with humans dominating, changing, and impacting their natural
environment. On the other hand, there are still many (indigenous peoples’) cultures alive - although
under severe threat - where other visions of a co-existence between humans and nature in which
humans are considered an integral part of nature exist or are being reinvented (e.g., the buen vivir
concept in Latin America).
Introduction
Page 10
are a poignant example, as they create a growing demand which may shift
agricultural production in third countries (especially in Africa, Asia, or Latin
America) away from food production for domestic use towards the production of
agrofuel feedstocks that are exported to the EU (Liu et al., 2013). Biofuel
mandates can additionally trigger indirect land use change when oil crops
previously available for food production are used as agrofuel feedstocks, causing
the expansion of oil crops elsewhere. As this example illustrates, the growth in
social metabolism in the industrialized and industrializing world regions is a major
driver of the expansion of resource extraction. This in turn increases the pressure
on land area.
Beyond food biomass
There is a large body of academic interdisciplinary and non-academic literature on
the societal use of biomass for food, feed, fibre, and energy production and the
effects such uses have across scales from the local to the national and the global.
This study draws mainly on concepts from the transdisciplinary collaboration of the
scientific fields of social ecology, land use science, and food systems research,
together with NGOs and EJOs concerned with the expansion of industrial tree
plantations and small farmers’ struggles for community-controlled and biodiversity-
based food systems.
We use the concepts of colonization of ecosystems, food security, food
sovereignty, and food regimes to position and discuss our empirical findings on
biomass flows. Biophysical patterns of biomass extraction and trade and the
related forms of land use at the national, supranational or global level have been
analysed thoroughly (Kastner et al., 2014; Krausmann et al., 2008a, 2008b;
Schaffartzik et al., 2014; Steinberger et al., 2010; Haberl et al., 2007; Erb et al.,
2009; Krausmann et al., 2013, 2009). These studies centre on biophysical flows
related to biomass use, although only a few touch on the social, economic, and
political contexts connected to the biophysical patterns analysed.
One aspect that is well studied concerns patterns of biomass use for human
consumption. Out of the four aspects of food security, i.e., availability, access,
stability, and utilisation (Ericksen et al., 2009), the studies mentioned above focus
most on food availability. This focus is mainly due to the availability of biophysical
data at the national level, including data on biomass trade. While the concept of
food security provides fruitful links for interdisciplinary work, there is criticism of
the strong focus on food availability at the cost of other relevant questions, such
as access to and utilisation of biomass across scales.
The EJOLT work package 5 (biomass and land conflicts) is centred on the
following question: Who owns what land and what does owning or leasing land
actually mean?
In our globalised economy, with its increasing land and food commodity
speculation, the question of land ownership and access has become a matter of
life-or-death for millions of people in the global South.
Introduction
Page 11
In order to operationalize this rather broad question, we discuss empirical findings
on the development of biomass extraction and trade from 1950 to 2010 and
examine how these trends are linked to food security and sovereignty, as well as
to the theory of food regimes. Biomass extraction, and to a large extent biomass
trade, have undergone significant changes in composition and absolute mass
flows over these years. There is an indication that some of these trends have
induced socio-environmental conflicts. In order to identify and trace the drivers for
these conflicts, we have linked biomass extraction and trade to food import
dependency, which we consider a proxy for food sovereignty.
The food sovereignty’s biophysical realities
Food sovereignty, a term coined by members of the social movement of peasants,
‘La Via Campesina’ in 1996, describes the right of people to decide which food
system they want to have (Chaifetz and Jagger, 2014; Laroche Dupraz and
Postolle, 2013). Most proponents of food sovereignty put the peasant communities
and populations who produce, distribute, and consume food at the core of food
systems and policies, rather than the corporations and market institutions that
dominate the global food system. Some scholars such as Miguel Altieri place the
concept on a more general level, defining food sovereignty as the right of each
nation or region to maintain and develop their capacity to produce basic food
crops with the corresponding productive and cultural diversity (Altieri, 2009). This
definition of food sovereignty includes political, economic, and social aspects,
while biophysical aspects remain underrepresented. Numerous papers and books
have been published on various aspects of food sovereignty, such as community-
building, access to seeds, community supported agriculture, slow food
movements, and other food sovereignty movements (see Chaifetz and Jagger,
2014 for examples and more references).
What is clearly missing is an investigation of biophysical flows (including trade)
related to food sovereignty (Burnett and Murphy, 2014; Ng and Aksoy, 2008), as
well as of the historical development of food regimes themselves. To understand
the role which food import dependency plays in global biomass trade patterns, in
this study, we use the degree of food import dependency (share of imports in
relation to domestic extraction (DE) of the most important cereal using material
flow accounting (MFA) methods (EUROSTAT, 2012)) and the level of economic
wealth (measured as GDP/cap) as a proxy for access to (market) food on a
country-wide level. We aim to provide an empirical link between the concepts of
food security and food sovereignty in relation to biomass trade. We have
distinguished eight country clusters based on the countries’ economic wealth and
the particular form and degree of their integration into global food trade. We
consider these characteristics of biomass trade as potential contributing factors in
resource conflicts between different societal groups.
The following report provides a biophysical overview of the evolution of global
biomass flows from 1950 to 2010 and links these results to questions related to
food import dependency. To provide an epistemological background, we first
summarize the theory of food regimes (Friedmann, 2009; Friedmann and
McMichael, 1989; McMichael et al., 2007; McMichael, 2011). This theory
Food sovereignty
describes the right of
people to decide
which food system
they want to have.

Introduction
Page 12
differentiates between three food regimes since the end of the 19th century which
shape and are shaped by global patterns of biomass extraction and trade. There
is increasing evidence that each of these global patterns is related to specific
forms of food insecurity. The global food crises of 2008 and 2011, for example,
demonstrated the vulnerability of food-import dependent, low-income nations to
food-price spikes and export restrictions. Following the introduction of food regime
theory, we discuss the impact of the spread of industrial tree plantations (ITPs) in
the global South, before we analyse global patterns of biomass extraction and
exports. We then provide a debate on major developments in biomass exporting
nations, such as the focus on extractivist economies in Latin America or South-
Eastern Asia, as well as on large-scale land deals in African countries.
1.2 Colonization of ecosystems and food regime theory
The manner in and extent to which a society colonizes ecosystems is decisive for
its internal organization. Colonization of ecosystems can be defined as the
purposeful human intervention into these ecosystems with the aim of changing
and maintaining them in a form that is more useful for society than it would be
without these alterations (Fischer-Kowalski et al., 1997). Since society is not a
single-minded actor, different groups within society may having competing
interests when it comes to the colonization of a specific ecosystem. Peasant
farming and industrial monocropping activities, for example, are both forms of
ecosystem colonization with benefits and negative impacts for different groups. In
general, agriculture and forestry are two prominent examples of societal
colonization activities. Forms of subsistence can be distinguished by the
colonization strategies through which metabolic needs are met: hunters and
gatherers, agricultural societies, and industrial societies (Sieferle, 1997). This
distinction of sociometabolic regimes was developed for historical analyses and
can also be applied to contemporary societies. For this report, it serves as a
background for the country cluster analysis.
The three different food regimes which Friedman and McMichael distinguish in the
period since 1870 (Friedmann and McMichael, 1989; McMichael, 2011) all occur
in the context of a transition to the industrial sociometabolic regime in different
countries and/or world regions. The first food regime (1870–1930s) was
characterized by imports from largely agrarian tropical regions to industrialized
Europe (most notably to the UK). During the second food regime (1950s–70s),
which Friedmann and McMichael define to have emerged with the global Marshal
plan and after the decolonisation of many countries in Africa and Aisa, surplus
flows from the industrialized US were re-routed to the US dominated ... informal
empire on the strategic perimeters of the Cold War (NZPA, 2014). Under the third
food regime (late 1980s until today), defined by a set of new international trade
conventions, new countries (e.g., Brazil, China) were integrated in the network of
global food production and trade, especially through the increasingly fragmented
supply and use chains for animal protein. Simultaneously, the supermarket
‘revolution’ for the global upper-and middle-class occurred and urbanization (with
Food regime theory
describes capitalist
accumulation in
global food production
and trade.
Introduction
Page 13
inter- and subnational migration from rural areas to cities and often into informal
urban settlements) rapidly progressed as small-scale farming became less viable,
especially in the global South (McMichael, 2009). This urbanization entails a
transition from the agrarian sociometabolic regime which still dominates rural
areas in many countries to the industrial metabolic regime in cities (Fischer-
Kowalski et al., 2014).
In the following, the main characteristics of the three food regimes are discussed
in the context of changing society-nature interaction. Land grabbing and
neoextractivism as currently dominant phenomena in the global food system can
be understood as expressions of this changing interaction which are in turn linked
to resource competition, scarcity, and environmental conflict.
McMichael classifies the 20th century as a continued assault on farming systems
across the world where a model of ‘agriculture without farmers’ is imposed
(McMichael, 2013b). According to McMichael (2013: 3), the central agro-exporting
principle of the latest food regime has served to displace producers by violent
processes of land grabbing on the one hand, and market dumping on the other.
Under a capitalist economic system, land grabbing can be understood as a
necessary percursor if land accumulation is achieved by dispossesion (Harvey,
2005). “Market dumping3” started with the second food regime after World War II
and systematically undermines smallholder farming through both Southern debt
management and Northern subsidies (McMichael, 2013b).
1.2.1 The first food regime (1870–1930s)
During this expansive regime of the late 19th century and early 20
th century,
current structures of globalized food production (including large-scale plantations)
and international biomass trade were established that continue to shape conflicts
around the world today.
The first food regime falls into a period that is sometimes referred to as that of
‘new imperialism’ (e.g., Harvey, 2005) and is characterized by colonial expansion
into regions under the agrarian sociometabolic regime and the simultaneous
industrialization of imperial centres. It is no coincidence that the first food regime
falls into the same period during which the steam engine came into wider use and
enabled the production of high-grade steel to build large transport infrastructure.
For the first time, global trade included not only highly priced luxury goods (such
as spices and rare metals) but also basic staples such as grains and livestock
which European countries imported from their colonies (McMichael, 2009).
In order to feed the growing landless working class in Europe, large areas abroad
were claimed for food production. Agricultural systems dominated by monoculture
production were imposed in the colonies, often eradicating existing food
3 McMichael defines “market dumping” as dumping of northern foodstuffs in southern markets
characterized the 1980s-90s, and this has extended in the twenty-first century to the experience of
Eastern European countries joining the EU and being subject to German and French supermarket
colonization (McMichael, 2013: 3).
Introduction
Page 14
production systems and appropriating a large share of the ecological resources in
these areas (McMichael, 2009). This expansion was often contested and led to
conflict with the colonies’ inhabitants (Woodroffe et al., 2005).
1.2.2 The second food regime (1950s–70s)
The second food regime, or the post WW II food regime (Fairbairn, 2008), was
rooted in the organization of the world economy under US hegemony. Friedmann
and McMichael (1989) define two basic, yet contradictory relations of production
and consumption that coined the second food regime. First, the extension of the
state system in former colonies in Africa and Asia that destroyed the basis for
colonial specialization as it still happened in the first food regime. The integration
into the second food regime proceeded on two new fronts, imports of wheat from
the US and the decline of markets for their own tropical exports. These relations
created dependence on the ohe hand, and on the other hand new markets for the
US. Second, the industrialization of agriculture (i.e., the Green Revolution) created
an intrasectoral integration of agricultural relations across national states
With the Green Revolution, growth in agricultural production output was obtained
by increasing yields through higher inputs (of energy, water, fertilizers, and
pesticides) into production. The Haber-Bosch process, an extremely energy-
intensive technique to capture nitrogen from the air in order to be able to use it as
agricultural fertilizer, made it possible to bypass previous nutrient limitations in
agriculture. Together with other developments of the Green Revolution, this
triggered massive yield increases in the US (and a bit later in Europe, too) during
the second half of the 20th century. Next to the application of fertilizers and
pesticides (Pimentel et al., 1973; Tilman et al., 2002; Smil, 2001), the
development of modern crop varieties (Evenson and Gollin, 2003) was an
important component of the Green Revolution. Overall, agriculture began to
depend more heavily on direct and indirect inputs of fossil energy. From the
industrialized and industrializing countries, the Green Revolution was spread to
the global South.
As global agricultural production grew, ‘food self-sufficiency’ dominated the
discourse on food sovereignty during the second food regime (Fairbairn, 2008).
Nonetheless, increased agricultural output was often dedicated not only to
domestic consumption but also to trade and a zero-import objective was neither
desirable nor attainable for most countries. At the same time, agribusiness
strengthened its transnational linkages through a stronger international division of
labour and a re-integration of single production steps into integrated (although
globally fragmented) supply chains (e.g., the transnational animal protein complex
linking crop production and livestock husbandry) (McMichael, 2009). Overall, the
second food regime was characterized by massive increases in agricultural yields
and an expansion of croplands (Ramankutty and Foley, 1999) leading to strong
growth in agricultural output. Due to rapid population growth, increased biomass
extraction did not translate into higher per capita availability (Krausmann et al.,
2009, Schaffartzik et al., 2014).
Introduction
Page 15
1.2.3 The third food regime (1980s – today)
The third food regime is also referred to as the ‘corporate food regime’ and began
in the 1980s as neoliberal policies were implemented which sought to liberalize
international trade by removing perceived trade barriers. Transnational institutions
such as the World Bank and the International Monetary Fund (IMF) were
instrumental in attaining the implementation of these policies which were intended
to boost international trade and increase (market-driven) food security.
Transnational animal protein chains integrated new regions through a further
division of labour (e.g., through the production of soy for animal feed in Latin
America and its export to countries with large and/or growing livestock sectors in
Europe or Asia). While the number of countries thus involved in global food
production increased, food provisioning and consumption also changed
fundamentally. The global transition towards a market-oriented food regime is
referred to as the ‘supermarket revolution” (Reardon and Timmer, 2014) and
provided access to fresh fruits, vegetables, and animal products to those with
sufficient monetary funds.
The increasing marketization of food provisioning not only favours more affluent
segments of the global population, it also has additional social and environmental
impacts. For example, as large-scale agriculture displaces small-scale farming,
the increased market-orientation of food production contributes to urbanization
and rural exodus, or to increasing concentration of supply. The latter may increase
market prices due to a lack of competition betweeen suppliers.
Large-scale agriculture and the associated standardisation of production may be
associated with the loss of seed variety. McMichael (2009) considers this
emerging global food/fuel agricultural complex as creating tension with various
forms of localism, such as the slow food movement or diverse food sovereigny
movements.
During the third food regime, movements against the dominant agricultural model
began to emerge, making claims to food sovereignty, locally grown food,
community supported agriculture, and small-scale organic production. Chaifetz
and Jagger (2014) describe these movements as an ‘industrial detox’ against
trade-driven global food markets.
1.2.4 Food regime crisis and conflicts
Global biomass production has undergone massive changes since WW II. Rudel
et al. (2009) show that while significant increases in global average crop yields
were reached, this intensification was also accompanied by a substantial
expansion of croplands, by 32% between 1963 and 2005. Due to population
growth, the increasing production of biomass does not translate into growing
metabolic rates (i.e., per capita availability of biomass) – instead, these rates
decreased slightly during the second half of the 20th century. However, the picture
has been changing since the beginning of the 21st century, since when per capita
rates slightly increase (Schaffartzik et al., 2014).
Introduction
Page 16
Driven by a growing industrial use of biomass (e.g., for agrofuels) and by changing
dietary patterns (e.g., meat consumption of growing middle classes), biomass
extraction and trade are likely to continue increasing in the future (Erb et al.,
2012a; Odegard and van der Voet, 2014). Business, policy, and research interest
thus coincides in increasing biomass production through intensification, closing
yield gaps (Mueller et al., 2012) or through the expansion of agricultural activities
into land considered unused or underused (Carvalho et al., 2002; Young, 1999). In
order to avoid the negative environmental and social impacts of intensification, a
growing body of research seeks to find ways to sustainably intensify land use
(Beddington, 2010; Godfray et al., 2010a; 2010b). Other studies make claims that
there are vast underused land areas that carry huge potential for growing drought-
resistant energy crops, mostly in dry regions of Sub-Saharan Africa, but also in
Latin America (Jumbe et al., 2009).
Despite the large body of research on improving biomass production, McMichael
(2013) underlines the inability of the current industrial food regime to significantly
reduce global hunger. The global food crises of 2008 and 2011 resulted from a
dangerous simultaneous occurrence of supply shortages (caused by both natural
conditions such as droughts and man-made conditions such as decreased grain
stocks) and demand surges (caused by the emergence of agricultural futures on
the stock markets and of new industrial biomass uses such as agrofuel
production). Global trade as a balancing factor failed, as many important grain
exporters imposed export bans to secure the food supply for their own population.
The consequences of export bans were especially felt by food import dependent
countries (McMichael, 2013b).
By mid-2009, almost one-sixth of humanity (about 1 billion people) were
considered at risk of hunger or malnutrition (McMichael, 2009). Despite this
alarming signal, proposed solutions to combat hunger remain one-dimensional, as
Brunett and Murphy (2014, 2) note: The Agreement on Agriculture prescribes a
model for agriculture that has basically only one dimension: increasing agricultural
production for exports, importing what cannot be produced without tariff protection
or subsidies to producers. Madeley stated already in 2000 (54-55) that while 90
percent of agricultural expenditures in Latin America were devoted to food crop
research in the 1980s, during the 1990s 80 percent focused on export crops. It is
very likely that this trend has continued in the 21st century.
In light of these multiple demands for land, the current development of the land-
use system is characterized by a continuous expansion and land-use
intensification. This partially entails a shift in food production for global markets to
the global South, where costs and environmental regulations are often lower than
in the global North (see Box 1). The resulting challenges for smallholders are
twofold: First, not to lose control over or access to land and second, to manage
the transformation of their farming practices which often accompanies the
integration into global value-chains. This, in the end, is very likely to produce a
similar outcome to the green revolution in the global North, where the
industrialization of agriculture reduced the amount of farmers significantly. If these
people are able to secure an income in other sectors than agriculture, at least their
While 90 percent of
agricultural
expenditures in Latin
America were devoted
to food crop research
in the 1980s, during
the 1990s 80 percent
focused on export
crops (Madeley, 2000)
Introduction
Page 17
livelihood are possibly secured, while it may also can trigger an alienation from
their livelihood. In world regions where smallholders still provide most of the
calories for the respective populations, this transition may be conflictive and not
without victims. In order words, we can resume it with John Madeley’s findings of
the analysis from 27 impact assessments on the effects of trade liberalization. He
stated that WTO-style ‘free trade’ benefits only the rich, while making the poor
more vulnerable to food insecurity (Madeley, 2000).
Box 1 Forest restoration credits in Brazil
In 2012, Brazil adopted a revised Forest Code. The forest legislation retains the requirement that land owners maintain a certain percentage of the forest intact. The size of this intact area depends on the forest type. In comparison with the previous legislation, the requirements have been reduced along streams, for example. The more
fundamental change however was that the 2012 revision of the Forest Code requires that land owners who in the past destroyed more land than was allowed, would have to restore the land within a certain number of years. Previously, if they had not restored the land, they would have risked a fine (though there was little enforcement) and
above all, losing eligibility for rural credit options, thus borrowing money would become more expensive for them. The revised 2012 Forest Code introduced the option that the land owner buys a ‘forest restoration credit’ (CRA), as an alternative to the land owner restoring the illegally cleared forest on his own land. The credit is sold as promise
that someone else somewhere else has protected more of the same type of forest than was necessary under the Forest Code, and therefore has made up for the excess destruction of forest committed by the buyer of the CRA. These CRAs are now traded, among others, on the environmental exchange in Rio de Janeiro, the Bolsa Verde do
Rio de Janeiro (BVRio). This enables land owners in places where land prices are high and where destructive practices are lucrative to continue with business as usual by buying cheaper offset ‘forest restoration credit’, including from regions where the threat of deforestation is much lower (WRM 2014d, 27)
1.3 Feedstock for the industrial biomass metabolism as another demand upon the land system 4
The following part of this report summarises the work that the World Rainforest
Movement (WRM) has contributed to EJOLT WP5 on land use conflicts. WRM has
extensive expertise in the global spread of industrial tree plantations (ITPs), which
supply biomass that is not used for food purposes but that is mainly utilized in the
global North for e.g., rubber products or as pulp for paper production. The
expansion of ITPs places a further demand on services from the land system
which increases competition with other land uses, such as crop production or
natural forests. The massive expansion of ITPs, especially in countries in the
global South such as Brazil, Uruguay, Indonesia or Chile, is often closely related
to conflicts, as the following chapter shows.
Since the 1960s and 1970s, ITPs have been expanding significantly on a global
scale. Such plantations are defined here as large-scale monocultures of
intensively-managed and equal-age trees. Their expansion has been pushed for
by corporations and consultancy companies, with the support of financial
institutions and national governments (Overbeek et al., 2012).
4 Chapter 1.3 is contributed by Winnie Overbeek from World Rainforest Movement (WRM).
Introduction
Page 18
Over the past decades, ITPs have expanded more in the global South than in the
global North. The FAO does not yet have explicit figures for ITPs but we consider
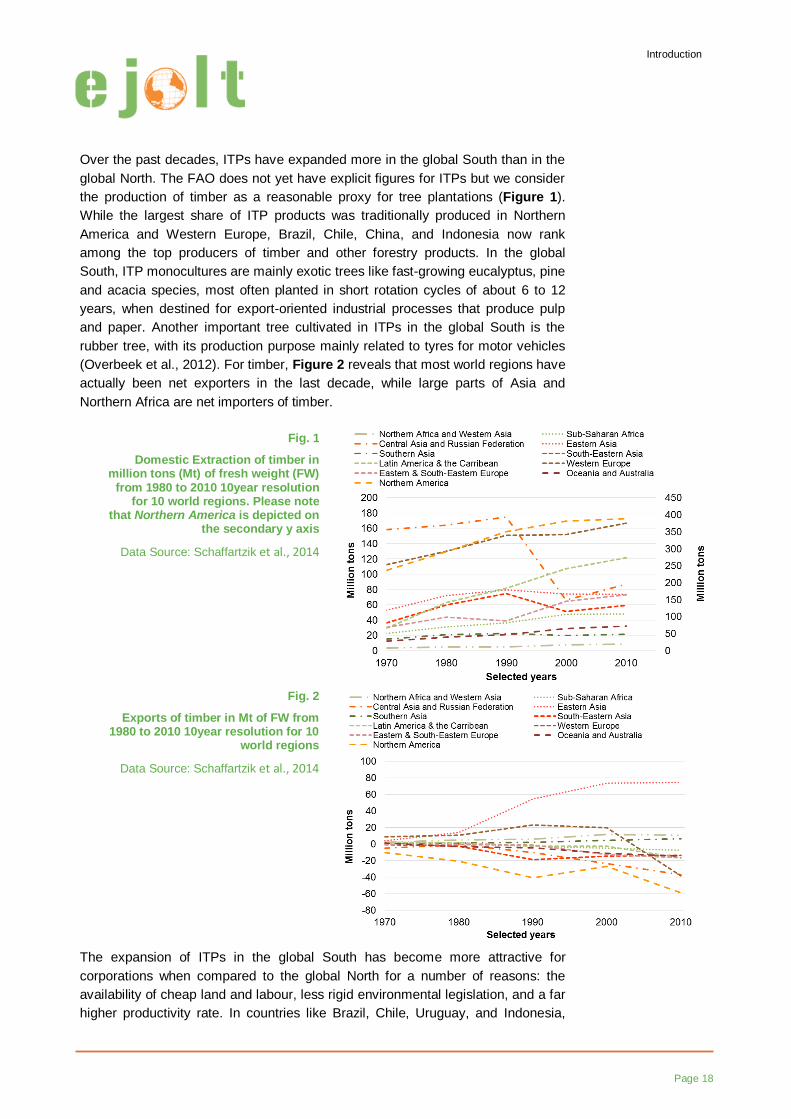
the production of timber as a reasonable proxy for tree plantations (Figure 1).
While the largest share of ITP products was traditionally produced in Northern
America and Western Europe, Brazil, Chile, China, and Indonesia now rank
among the top producers of timber and other forestry products. In the global
South, ITP monocultures are mainly exotic trees like fast-growing eucalyptus, pine
and acacia species, most often planted in short rotation cycles of about 6 to 12
years, when destined for export-oriented industrial processes that produce pulp
and paper. Another important tree cultivated in ITPs in the global South is the
rubber tree, with its production purpose mainly related to tyres for motor vehicles
(Overbeek et al., 2012). For timber, Figure 2 reveals that most world regions have
actually been net exporters in the last decade, while large parts of Asia and
Northern Africa are net importers of timber.
The expansion of ITPs in the global South has become more attractive for
corporations when compared to the global North for a number of reasons: the
availability of cheap land and labour, less rigid environmental legislation, and a far
higher productivity rate. In countries like Brazil, Chile, Uruguay, and Indonesia,
Fig. 2
Exports of timber in Mt of FW from 1980 to 2010 10year resolution for 10
world regions
Data Source: Schaffartzik et al., 2014
Fig. 1
Domestic Extraction of timber in million tons (Mt) of fresh weight (FW)
from 1980 to 2010 10year resolution for 10 world regions. Please note
that Northern America is depicted on the secondary y axis
Data Source: Schaffartzik et al., 2014
Introduction
Page 19
corporations can obtain productivity rates of 20-44 m3/ha/year with eucalyptus
hardwood (Overbeek et al., 2012). An area planted with spruce and pine or typical
pulpwood species like birch trees in countries in the North like Finland and
Sweden, produces much less with a typical productivity rate of 2 m3/ha/year.
Nonetheless, these economies are heavily based on so-called ‘forestry products’
(Gartland et al., 2003).
For rural communities in the global South in the expansion areas of ITPs, such
plantations have become a major threat to their livelihoods and the biodiversity
upon which they depend. Plantation corporations have a preference for flat, fertile
lands, because they can obtain the highest productivity rates, mechanize
production, and thus obtain higher profit rates. But these lands are also the
territories of indigenous peoples, traditional or peasant communities, who practice
small-scale agriculture in such fertile areas. These communities also obtain
benefits from the biodiversity present in forests and other biomes on which their
livelihoods depend. Therefore, the land grabbing process and environmental
destruction provoked by ITPs have resulted and continue to result in incalculable
losses for and bitter conflicts with communities (Overbeek et al., 2012).
The impact of ITPs on food sovereignty is a main concern. For example, when
confronted with the invasion of large-scale monoculture tree plantations on their
territories, Brazilian peasants have protested against such plantations with the
slogan: “But nobody eats eucalyptus”.
Data on industrial tree plantations should be treated with caution. They are based
mostly on FAO data, which has its limitations (Overbeek et al., 2012). The data
that are available, however, show a strong increase of ITPs in the past few
decades in the global South, from about 13 million hectares at the end of the
1980s to about 45 million hectares in 2010. Eucalyptus is the main tree crop being
cultivated. Eucalyptus plantations occupied 16-19 million hectares in 2010 and
were concentrated particularly in South America and especially in Brazil, where
eucalyptus plantations covered 7 million hectares in 2014. The main companies
operating in Brazil are the Brazil-based Fibria and Suzano and the Swedish-
Finnish pulp and paper giant Stora Enso. Rubber comes second on the list of tree
crops, with 10 million hectares of plantations in the global South. Most rubber
plantations are located in Asia and are managed mainly by transnational
companies like Bridgestone (Japan) and Michelin (France). The third and fourth
most widespread tree crops are acacia and pine, again species of relevance for
pulp production. Acacia is mainly planted in Indonesia by companies like Asian
Pulp & Paper (APP) and APRIL, and pine plantations are promoted for example in
Chile by the Chilean-based companies Arauco and Forestal Mininco (Overbeek et
al., 2012).
As a consequence of this plantation expansion, huge pulp mills were built in
countries like Brazil, Uruguay, Chile, and Indonesia. Most of the pulp mills that
have been built in the global South use chemical production processes, resulting
in so-called chemical wood pulp. Between 1980 and 2012, global chemical wood
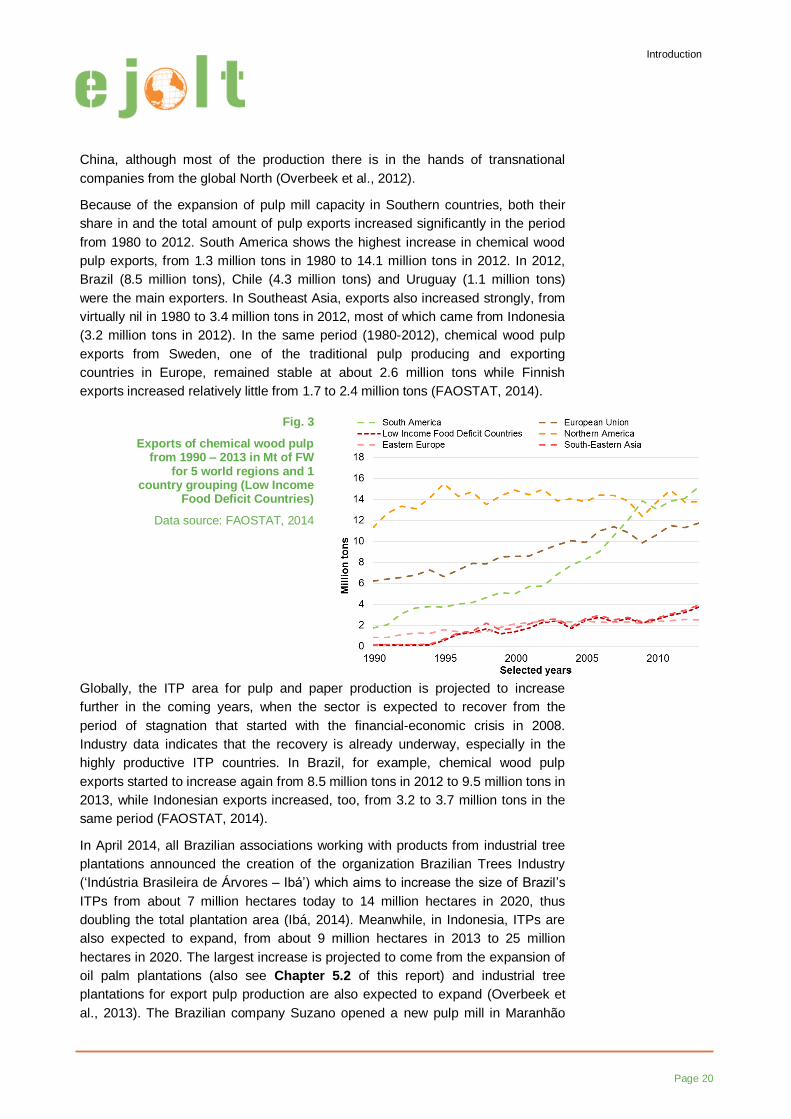
pulp exports increased by 252% from 18.1 million tons to 45.9 million tons (Figure
3). Most of this pulp production is destined for paper and paperboard mills in
Introduction
Page 20
China, although most of the production there is in the hands of transnational
companies from the global North (Overbeek et al., 2012).
Because of the expansion of pulp mill capacity in Southern countries, both their
share in and the total amount of pulp exports increased significantly in the period
from 1980 to 2012. South America shows the highest increase in chemical wood
pulp exports, from 1.3 million tons in 1980 to 14.1 million tons in 2012. In 2012,
Brazil (8.5 million tons), Chile (4.3 million tons) and Uruguay (1.1 million tons)
were the main exporters. In Southeast Asia, exports also increased strongly, from
virtually nil in 1980 to 3.4 million tons in 2012, most of which came from Indonesia
(3.2 million tons in 2012). In the same period (1980-2012), chemical wood pulp
exports from Sweden, one of the traditional pulp producing and exporting
countries in Europe, remained stable at about 2.6 million tons while Finnish
exports increased relatively little from 1.7 to 2.4 million tons (FAOSTAT, 2014).
Globally, the ITP area for pulp and paper production is projected to increase
further in the coming years, when the sector is expected to recover from the
period of stagnation that started with the financial-economic crisis in 2008.
Industry data indicates that the recovery is already underway, especially in the
highly productive ITP countries. In Brazil, for example, chemical wood pulp
exports started to increase again from 8.5 million tons in 2012 to 9.5 million tons in
2013, while Indonesian exports increased, too, from 3.2 to 3.7 million tons in the
same period (FAOSTAT, 2014).
In April 2014, all Brazilian associations working with products from industrial tree
plantations announced the creation of the organization Brazilian Trees Industry
(‘Indústria Brasileira de Árvores – Ibá’) which aims to increase the size of Brazil’s
ITPs from about 7 million hectares today to 14 million hectares in 2020, thus
doubling the total plantation area (Ibá, 2014). Meanwhile, in Indonesia, ITPs are
also expected to expand, from about 9 million hectares in 2013 to 25 million
hectares in 2020. The largest increase is projected to come from the expansion of
oil palm plantations (also see Chapter 5.2 of this report) and industrial tree
plantations for export pulp production are also expected to expand (Overbeek et
al., 2013). The Brazilian company Suzano opened a new pulp mill in Maranhão
Fig. 3
Exports of chemical wood pulp from 1990 – 2013 in Mt of FW
for 5 world regions and 1 country grouping (Low Income
Food Deficit Countries)
Data source: FAOSTAT, 2014
Introduction
Page 21
(Brazil) in March 2014, with a production capacity of 1.5 million tons of chemical
wood pulp per year (Suzano, 2014). Meanwhile, a new mill run by APP with a 2
million ton capacity is currently being built on Sumatra (Indonesia) and is expected
to start operations in 2016 (KSH Consulting, 2014). In Uruguay, Montes del Plata's
(a joint venture by Stora Enso and Arauco) new pulp mill started operations in
September 2014, with a 1.3 million ton capacity (Espectador.com, 2014).
1.3.1 New drivers of expansion
In addition to expanding their plantations, ITP companies have also been
exploring new opportunities and markets. Especially after the financial-economic
crisis, since 2008, mainly Northern investment funds have invested in lands
managed by ITP companies because their holdings are considered a secure
investment for these funds. The Brazilian company Fibria, for example, sold about
210,000 hectares of their land holdings to the investment group Parkia
Participações in 2013. The sale, worth BRL 1.65 billion (approximately USD 660
million), was announced as beneficial for Fibria. On the one hand, it improved
cash flow to pay back accrued debt while being able to maintain access to timber.
On the other hand, after the end of the 24-year contract duration, Aracruz will
have a preferential option to buy back the lands (E&N Negocios, 2013). Other
investment funds, including a fund owned by Harvard University in the US, are
increasingly investing in ITP areas in Brazil, Argentina, and Uruguay (World
Rainforest Movement, 2014a).
Another related trend to generate additional income from plantations involves
marketing ITPs as carbon sinks and selling so-called CO2 or carbon credits to
polluting countries or industries. The eucalyptus tree planting project of the
Brazilian company Plantar, for example, succeeded in having their tree planting
approved as a Clean Development Mechanism (CDM) project. Carbon credits are
generated and sold from thousands of hectares of eucalyptus ITPs from which
charcoal is produced. Charcoal is presented as a ‘renewable energy’ source for a
pig iron industry that mainly produces the raw materials for cars, trucks (Overbeek
et al., 2014), and energy infrastructure.
Another promising new market opportunity for ITP companies is the
transformation of plantation wood into wood pellets as a form of ‘renewable
energy’ and as a newly created commodity that can be transported globally. This
trend is very much a result of the European Union’s (EU) 20% renewable energy
target for 2020, most of which is expected to be achieved by burning wood (World
Rainforest Movement, 2014b). This has already resulted in increased pressure on
European forest which are, however, not able to meet the increasing demand in
the EU.
FAO figures on wood pellet imports into Europe have only been available since
2012 and they already show a significant increase from 8.5 million tons of imports
in 2012 to 11.3 million tons in 2013. The UK alone registered an increase in
imported wood pellets from 1.4 to 3.4 million tons (FAOSTAT, 2014). Most of the
imported pellets come from the US, where wood pellets exports increased by
more than 50% between 2012 and 2013, from 1.9 million tons to 2.9 million tons.
Northern investment
funds increasingly
invest in ITPs, the
marketing of ITPs as
carbon sinks attracts
CDM credits, driving
the further expansion
of ITPs in the global
South.
Introduction
Page 22
Other important exporters of wood pellets are Canada (1.6 million tons exported in
2013) and Russia (0.7 million tons exported in 2013). Increasing demand for wood
in the EU causes – in the medium and long term – increasing pressure on land in
the global South.
Wood pellets are also produced for export in the global South. In Maranhão, the
company Suzano started to implement a model of specific eucalyptus ITPs for
biomass energy. In such plantations, the rotation cycle of the trees is much shorter
than usual (1.5-2 years instead of 6-7). Besides this, the eucalyptus trees are
much more densely planted (about 8,000 trees per hectare versus 1,000/1,600
trees in a pulpwood plantation). The expected production is around 80 m3/ha/year,
double the wood productivity of ITPs for pulp production (Souza and Overbeek,
2013).
Another wood-based ‘renewable energy’ option is also being promoted: the
transformation of wood into liquid fuel, also called cellulosic ethanol. Currently, this
is much more costly than producing wood pellets, for example, and therefore yet
not a viable option for industry to invest in without sufficient subsidies (World
Rainforest Movement, 2014c).
ITP companies are increasingly investing in research on genetically modified or
engineered (GE) trees for more efficient and cheaper pulp production as well as to
get improved results from ‘renewable energy’ options (woody biomass and
cellulosic ethanol). The main objective is to increase production of cellulose for
paper, or of woody biomass for wood pellets, as well as to improve the viability of
ethanol production. In recent years, applications for the commercial use of GE
eucalyptus trees have been submitted by companies both in Brazil and in the US.
It remains to be seen whether the governments of Brazil and the US will uphold
the precautionary principle and conduct detailed and long-term studies on the
impacts of GE trees, as recommended by the Convention on Biological Diversity
(CBD), before releasing these trees on a commercial scale.
GE trees add a number of potential risks and impacts to the already long list of
negative impacts caused by ITPs. These include an even higher use of pesticides,
water and soil nutrients as well as the risk of contamination of other non-GE trees
and forests. ‘More productive’ plantations in Brazil, for example, will also be a
further stimulus for the expansion of ITPs rather than leading to a reduction of the
ITP area.
1.3.2 FSC certification as an essential tool for ITP expansion
When the Brazilian company Suzano opened its aforementioned new pulp mill in
Maranhão in 2014, it announced that all of the wood consumed by the mill would
be certified by the Forest Stewardship Council (FSC) (Suzano, 2014). FSC
certification has become a powerful tool for ITP companies in legitimising their
continuous expansion as a ‘sustainable’ business, in spite of the fact that ITPs
continue to damage the environment and violate communities’ rights (Souza and
Overbeek, 2013). It has turned out to be an opportunity for corporate business to
‘greenwash’ practices that are unsustainable by definition. Neither the planting of
trees in extensive monocultures that depend on the regular application of agro-
FSC-certification has
become a powerful
tool for ITP
companies to
legitimise their
continuous expansion
as a ‘sustainable‘
business.
Introduction
Page 23
toxins and chemical fertilizers, nor the apparently unlimited large-scale model that
inevitably concentrates land that was once used by communities to sustain their
livelihoods in the hands of a few represent significant obstacles to certification.
Instead of the FSC challenging this unsustainable production model of paper and
other wood-based products by calling on consumers to stop buying products from
this model in the first place or, at least, to consume less, it merely suggests that
consumers opt for certified products. Meanwhile, a market-based tool such as
FSC certification is very attractive for the industry, because it does not challenge
their expansion projects and plans.
The area of industrial tree plantations certified by FSC has steadily increased. In
September 2014, 16.7 million ha of ITPs were FSC-certified worldwide, compared
with 13.7 million ha in 2013 and 13.0 million ha in September 2012, an increase of
28% within two years (FSC Forest Stewardship Council, 2014a).
FSC has begun to engage with and accompany these new market opportunities
which lead to plantation growth. Adding new product lines derived from plantations
that can be FSC-certified also represents new business opportunities for those
consultancy companies that carry out the profitable FSC certification audits.
The expansion of ITPs, both for ‘traditional’ uses such as pulp and paper and
rubber products, as well as for the new uses such as carbon sequestration and
renewable energy, mainly driven by Northern interests, represents a threat to the
territories and livelihoods of rural communities in the global South. The continuing
‘greenwashing’ provided by FSC to such plantations seems to further drive rather
than halt this expansion.
International trade policies
Page 24
2
International
trade policies
This chapter explores the impacts of international trade policy on agriculture in
developing countries. We examine the foundation of the World Trade Organization
(WTO) and investigate how its policies have triggered changes in agricultural
patterns in developing and least developed countries. The establishment of major
international trade agreements coincided with increasing international trade
volumes of agricultural products and also changed country-level trade patterns
(see Chapter 3). We end this chapter with a discussion of the consequences of
WTO trade policies for the global South.
2.1 Liberalization of international trade: From GATT to WTO
At the end of World War II, the perceived need for future political stability led to the
establishment of multilateral international organizations which could help launch
and maintain a new economic world order. In addition to the IMF and the World
Bank, a third pillar, the International Trade Organization (ITO), was negotiated as
a specialized agency of the United Nations. In 1946, 23 contracting parties had
concluded trade negotiations, which resulted in 45,000 tariff concessions covering
about one-fifth of world trade. This set of tariff concessions and rules was then
known as the General Agreement on Tariffs and Trade (GATT) and entered into
force in January 1948. The aim of this agreement was to boost international trade
by lowering trade barriers and to end protectionist measures that had been
implemented during wartime. Based on the principle of free trade, GATT regulated
customs tariffs and provided for harmonized legislation among its members
(Reich, 2004), banning all commercial discrimination and promoting transparency.
Over time, the number of contracting partners increased and reached 125
partners in 1995. Despite its transient nature, the General Agreement remained,
with a limited number of amendments, as the only multilateral instrument
governing international trade until the creation of the World Trade Organization
(WTO) in 1995.
In the general framework of GATT, a number of multilateral negotiations, termed
‘rounds’, were conducted. The main rounds, such as the Kennedy Round and the
International trade policies
Page 25
Tokyo Round, resulted in a reduction of tariffs. The Uruguay Round became
another milestone. Opened in September 1986, it focused on negotiating tariffs
specifically for agriculture, textiles, and services, and also included the principle of
intellectual property.
The WTO is based on a multilateral agreement between countries which provides
a forum for negotiating trade concessions and removing trade barriers, and
controlling and reglementing the multilateral trading system. The basic principle of
the WTO is that goods and services imported to one country from another must
generally have free market access in the importing country. The WTO provides
the basis for negotiations on whether existing tariffs violate this free access and
may also concern itself with non-tariff measures in certain situations.
The principles shaping WTO policies are:
Non-discrimination: The members of the WTO must (a) provide equal
treatment in trade matters to all members, and (b) imported goods and
services must receive treatment equal to that of domestic products.
The free movement of goods and services: Trade liberalization is achieved
through multilateral trade negotiations to reduce trade barriers in the form of
tariffs and non-tariff barriers such as import licenses or quotas.
Predictability: The attempt to keep the business environment stable and
predictable.
Competition: The WTO discourages unfair trade practices such as dumping
and export subsidies.
Aid to less developed countries: Developing countries have more time, and
receive special treatment and greater flexibility to adjust to trade
commitments after signing the WTO treaty.
In 2014, the WTO had 160 member countries, with developing countries
accounting for almost 80% of the total member countries. In 2014, there were 24
observer governments who have been negotiating for admission. Other
organizations such as the Organization for Economic Cooperation and
Development (OECD) and several specialized UN agencies, including the UN
Conference on Trade and Development (UNCTAD), the World Bank and the IMF
have observer status in the WTO’s General Council.
2.2 The WTO agreement on agriculture
Agriculture is an integral part of the WTO agreements. The related regulations
cover both primary and processed agricultural products. Before GATT in 1947,
international regulations applying to the agricultural sector were less strict and did
not have the goal of homogenizing exchanges globally. Countries were therefore
free to apply higher rates if they considered these necessary to protect their
internal market against imports. Developed countries in particular maintained high
tariffs and imposed quotas as well as discretionary and variable fees on their
products.Thus, in order to be competitive in an export-oriented economy, export
International trade policies
Page 26
subsidies were inevitably encouraged. Against this backdrop, the WTO Agreement
on Agriculture requires a progressive agricultural reform the main objective of
which is the establishment of an agricultural trade system that is intended to be
fair and equitable for WTO members and market-oriented (Gonzalez, 2002). As
part of this agreement, the regulations include: (a) tariff measures, which
increase market access, focus on quotas; various import taxes, minimum prices
for import, discretionary import licensing and volunteer export restrictions. A key
element is that all countries, including the least developed countries (LDC), are
required to bind all tariffs5 on agricultural products; and (b) to convert non-tariff
barriers into tariff equivalents. Non-tariff barriers (NTBs) refer to restrictions that
result from prohibitions, conditions, or specific market requirements that make
importing or exporting products difficult and/or costly. NTBs also include
unjustified and/or improper application of non-tariff measures (NTMs), such as
sanitary and phytosanitary (SPS) measures and other technical barriers to trade
(TBT) (Cadot et al., 2012). To harmonize reductions of these barriers, WTO
members have agreed to convert non-tariff barriers into tariff equivalents (TE).
These would be calculated on the basis of the average world market price, subject
to tariff barriers, and the local price in the importing country as follows: TE = (local
price - external price) / external price.
Other measures and commitments of the Agreement on Agriculture are as follows:
Tariff reductions: Least developed countries (LDC) are not required to
reduce their tariffs, but all members must undertake their best endeavours.
Non-tariff measures may, however, be kept in place if imports of a specific
product represent less than 3% of the domestic consumption or if the
product has received special treatment based on food security (e.g., staple
foods in developing countries) or on environmental concerns.
Special safeguards: This agreement regulates special safeguards for
imports. The measures address the concerns of importing countries who
fear that the elimination of quotas will lead to import surges that disrupt local
markets.
Commitments on changing national support to producers: The disturbances
observed in the international market are not only due to local export product
protections, but also to domestic support of producers by member countries
such as export subsidies or direct payments to producers by the
government.
Aggregate measures of total domestic support (AMS): Developed and
developing countries are required to reduce their AMS (with longer
deadlines for developing countries). There is no reduction required for
LDCs.
5 Binding tariffs means the commitment of member countries ... not to increase a rate of duty beyond
an agreed level. Once a rate of duty is bound, it may not be raised without compensating the
affected parties (WTO, 2015)
International trade policies
Page 27
2.3 The Common Agricultural Policy (CAP) and its impacts on the global South
The Common Agricultural Policy (CAP) is the oldest and one of the most important
policies of the EU. First characterized in the Treaty of Rome in 1957, it came into
force in 1962 with the objective of:
- increasing agricultural productivity,
- ensuring a fair standard of living for farmers,
- stabilizing markets,
- ensuring security of supply, and
- ensuring reasonable prices for consumers.
The CAP has benefited farmers through indirect aid (‘guaranteed prices’), which
ensures a minimum price for export products by subsidizing the difference
between the market price and the guaranteed price. The CAP also benefits EU
farmers through the enforcement of an internal policy within the EU to protect the
European market from competition of cheaper, imported products.
The CAP has been criticized for benefiting large farmers at the expense of smaller
producers. The blogger Angela Shoeman (2010) states that CAP has led to a
redistribution based on the level of production. Hence, until the nineties, far from
supporting small farmers, 80% of CAP subsidies were redistributed to the 20% of
the farms producing 80% of agricultural outputs. In addition, it triggered great
distorting effects: Agricultural and food products’ prices greatly increased at the
expense of consumers (especially impacting the poorest households). It
encouraged farmers to overproduce, which in turn induced the EU to dump world
markets with those goods. For example, the 25% largest farms in the EU-27
received 74% of total CAP support, whilst the 25% smallest farms received only
3% of total CAP support in 2007 (Fritz, 2011; GRAIN, 2014).
Over-production in the EU member states is often ‘dumped’ on export markets
and has contributed to an increased import dependency among the world’s
poorest regions, especially the 70 low-income food-deficit countries (LIFDC). More
than half of the LIFDCs have a very high cereal import dependency, relying on
imports for more than 30% of their cereal consumption (Fritz, 2011).
The nearly 50-year-old CAP has both shaped EU policies on agriculture and
agricultural trade and also contributed significantly to European integration.
However, despite a variety of policy reforms that changed the character of the
CAP, there are several aspects that can be seen as potentially problematic (Fritz,
2011; Skogstad et al., 2013):
European agribusiness has been and continues to be a key beneficiary of
developing countries’ import dependency.
Developing countries have gradually lost their agricultural export shares
while the EU has increased its own share of global exports.
International trade policies
Page 28
CAP intervention prices and export subsidy payments stimulate
overproduction in the EU, which then facilitates European food industry to
dump these products on international markets.
The rise of the EU as an agricultural trade power has triggered conflicts with
the US, which has increasingly lost market shares to European competitors.
To defend their trade positions on third country markets, both trade powers
have entered into a costly subsidy race.
European wheat dumping has also contributed to changing dietary patterns
in the South, favouring the production and consumption of wheat-derived
products instead of locally grown crops like cassava, sorghum, millet, maize
or rice.
Box 2 International food aid
Besides trade policies, food aid is another factor influencing global trade and production patterns. International food aid involves the export of food commodities for free or at very low prices. The impact of food aid is not always positive (FAO, 2001). Food aid, backed by the dominant industrial agriculture model, has become a key driver in
gaining access to food markets.
The example of Ethiopia (also see Chapter 5.3) demonstrates how food aid can become a disincentive for local production, as Gelan (2007) has documented. This is because when the market is flooded with cheap or free food,
local production is no longer competitive. Producers who manage to produce despite the difficulties are unable to sell their goods.
Berthelot (2001) found that donations increase when prices on the world market are lowest, i.e., when it does not pay
to sell the surplus production of cereals from Northern countries. The emergency situation faced by vulnerable populations is not necessarily the single driver behind donations made.
For example, the Institute for Agriculture and Trade Policy (IATP) states explicitly who the beneficiaries of American
food aid are (Murphey 2005):
- In 2003, the US government purchased products intended for food aid from its agro-industrial companies at prices 11% to 70% higher than the market average.
- During the period 2000-2002, nearly 40% of the cost of American food aid was paid to American shipping companies.
Food aid as it is organized today provides food to those in need but may simultaneously damage local production in
recipient countries and be used to dispose of agricultural surplus production and provide an entry point into new markets (Kripke, 2005).
2.4 Consequences of trade liberalization
The liberalization of trade in agricultural products has provided agribusiness
corporations with international market access. This has been done by enforcing
international treaties, such as that of the WTO, which enabled Northern
investments in transnational supply chains and which is considered a precursor of
the current land grab (McMichael, 2013a). These treaties contain prerequisites
which farmers must fulfill if they wish to participate in international markets. These
prerequisites curb farmers’ freedom to choose which seeds they plant, for
example, and also include the imposition of a land market, based on private
property, without regard for local land tenure and use systems (McMichael et al.,
2007; McMichael, 2013a; 2013b; NZPA, 2015).
As a result of trade liberalization, some developing countries tend to focus on cash
crops with export value, often at the expense of food crops for local consumption.
The consequence of this reorientation is that the countries become increasingly

International trade policies
Page 29
dependent on imports. If prices of imported food increase, the country may face a
foreign exchange deficit, which in turn undermines the ability to purchase enough
food for its population.
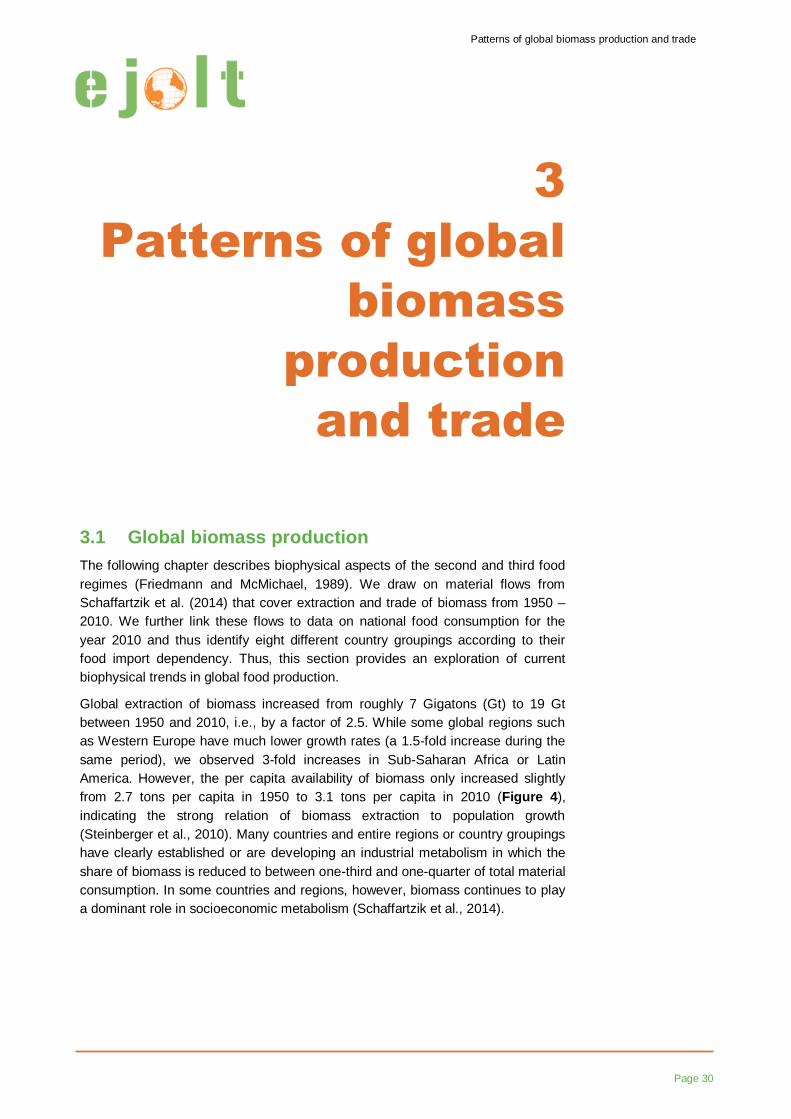
Patterns of global biomass production and trade
Page 30
3
Patterns of global
biomass
production
and trade
3.1 Global biomass production
The following chapter describes biophysical aspects of the second and third food
regimes (Friedmann and McMichael, 1989). We draw on material flows from
Schaffartzik et al. (2014) that cover extraction and trade of biomass from 1950 –
2010. We further link these flows to data on national food consumption for the
year 2010 and thus identify eight different country groupings according to their
food import dependency. Thus, this section provides an exploration of current
biophysical trends in global food production.
Global extraction of biomass increased from roughly 7 Gigatons (Gt) to 19 Gt
between 1950 and 2010, i.e., by a factor of 2.5. While some global regions such
as Western Europe have much lower growth rates (a 1.5-fold increase during the
same period), we observed 3-fold increases in Sub-Saharan Africa or Latin
America. However, the per capita availability of biomass only increased slightly
from 2.7 tons per capita in 1950 to 3.1 tons per capita in 2010 (Figure 4),
indicating the strong relation of biomass extraction to population growth
(Steinberger et al., 2010). Many countries and entire regions or country groupings
have clearly established or are developing an industrial metabolism in which the
share of biomass is reduced to between one-third and one-quarter of total material
consumption. In some countries and regions, however, biomass continues to play
a dominant role in socioeconomic metabolism (Schaffartzik et al., 2014).
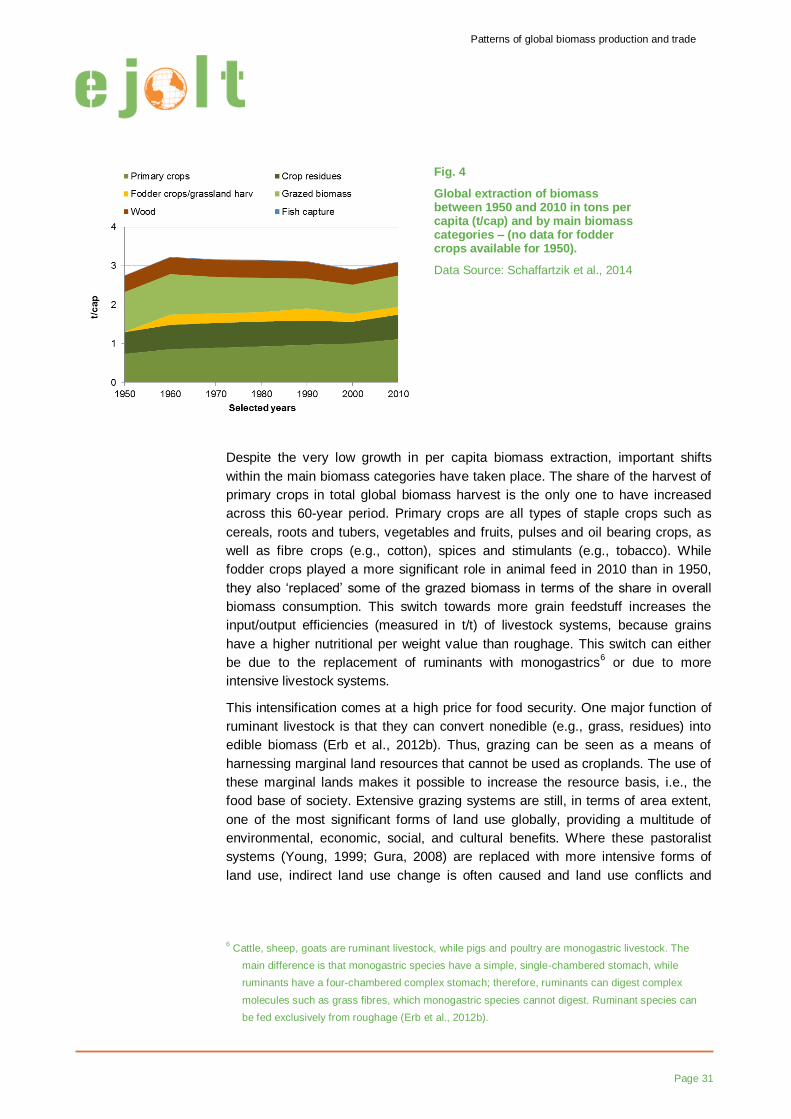
Patterns of global biomass production and trade
Page 31
Despite the very low growth in per capita biomass extraction, important shifts
within the main biomass categories have taken place. The share of the harvest of
primary crops in total global biomass harvest is the only one to have increased
across this 60-year period. Primary crops are all types of staple crops such as
cereals, roots and tubers, vegetables and fruits, pulses and oil bearing crops, as
well as fibre crops (e.g., cotton), spices and stimulants (e.g., tobacco). While
fodder crops played a more significant role in animal feed in 2010 than in 1950,
they also ‘replaced’ some of the grazed biomass in terms of the share in overall
biomass consumption. This switch towards more grain feedstuff increases the
input/output efficiencies (measured in t/t) of livestock systems, because grains
have a higher nutritional per weight value than roughage. This switch can either
be due to the replacement of ruminants with monogastrics6 or due to more
intensive livestock systems.
This intensification comes at a high price for food security. One major function of
ruminant livestock is that they can convert nonedible (e.g., grass, residues) into
edible biomass (Erb et al., 2012b). Thus, grazing can be seen as a means of
harnessing marginal land resources that cannot be used as croplands. The use of
these marginal lands makes it possible to increase the resource basis, i.e., the
food base of society. Extensive grazing systems are still, in terms of area extent,
one of the most significant forms of land use globally, providing a multitude of
environmental, economic, social, and cultural benefits. Where these pastoralist
systems (Young, 1999; Gura, 2008) are replaced with more intensive forms of
land use, indirect land use change is often caused and land use conflicts and
6 Cattle, sheep, goats are ruminant livestock, while pigs and poultry are monogastric livestock. The
main difference is that monogastric species have a simple, single-chambered stomach, while
ruminants have a four-chambered complex stomach; therefore, ruminants can digest complex
molecules such as grass fibres, which monogastric species cannot digest. Ruminant species can
be fed exclusively from roughage (Erb et al., 2012b).
Fig. 4
Global extraction of biomass between 1950 and 2010 in tons per capita (t/cap) and by main biomass categories – (no data for fodder crops available for 1950).
Data Source: Schaffartzik et al., 2014
Patterns of global biomass production and trade
Page 32
threats to local food security and sovereignty result (Fischer et al., 2009, 2001;
Lapola et al., 2010).
The relatively constant per capita figures for wood extraction conceal an important
shift from wood fuels to industrial timber, i.e., from a comparatively low to high
degree of industrialization of wood production and use, respectively. Wood fuels
are often substituted by fossil fuels, and the use of timber for pulp, paper and
other industrial uses of biomass increases with industrialization.
From 1950 to 2010, global harvest of primary crops increased by a factor of 4,
from 1.9 Gt in 1950 to 7.7 Gt in 2010. At the same time, the reported harvested
area associated with the production of these primary crops expanded from 1.1
billion hectares (Gigahectares - Gha) in 1961 to 1.5 Gha in 2010, thus increasing
by a factor of 1.4 (FAOSTAT, 2014)7 and indicating both a quantitative and a
qualitative transformation of the land use associated with primary crops
production. During this period of time, arable land and land covered by permanent
crops also increased by 0.16 Gha and the increase in harvested area was not only
due to multi-cropping (i.e., harvesting of the same area more than once or for
more than one crop during the agricultural year). The disproportionate increase in
harvested primary crops compared to the area expansion is an indicator for higher
yields and the intensification of land use. The highest yields in 2010 can be found
in Western Europe, Northern America, but also in South and Southeast Asia, the
lowest yields in Sub-Saharan Africa, Central Asia and Russia, and in Northern
Africa and Western Asia with rates that are 50-60 percent lower than the highest
yields (Mueller et al., 2012).
The difference between observed yields and those attainable in a given region,
referred to as the ‘yield gap’, is currently under debate among scholars interested
in food security (Mueller et al., 2012; West et al., 2014). The critical issue lies in
the word ‘attainable’ which is difficult to define. Yields in highly industrialized
regions are based on a multitude of factors, including agricultural inputs such as
water, fertilizers, and pesticides as well as technological and scientific advances in
machinery and crop breeding. The possibilities of closing yield gaps, i.e.,
increasing observed yields until they match attainable yields, vary considerably by
region and current intensity of land use. Next to the challenges that are related to
economic and organizational requirements, avoiding the environmental burdens of
intensification is not trivial. Most yield increases were reached through a higher
application of inputs such as fertilizers and pesticides, where parts of the applied
inputs leach into ground water (Gunkel et al., 2007). While some improvements of
yields may be reached with relatively simple changes, more harvest does not
always imply improved livelihoods, as the debate around land grabbing clearly
shows (GRAIN et al., 2014).
7 These figures correspond to ‘area harvested’ as reported by the FAO. Where the same area is
harvested more than once during the agricultural year (multi-cropping), it will also be accounted for
more than once in this indicator so that it may be larger than, for example, total arable land.
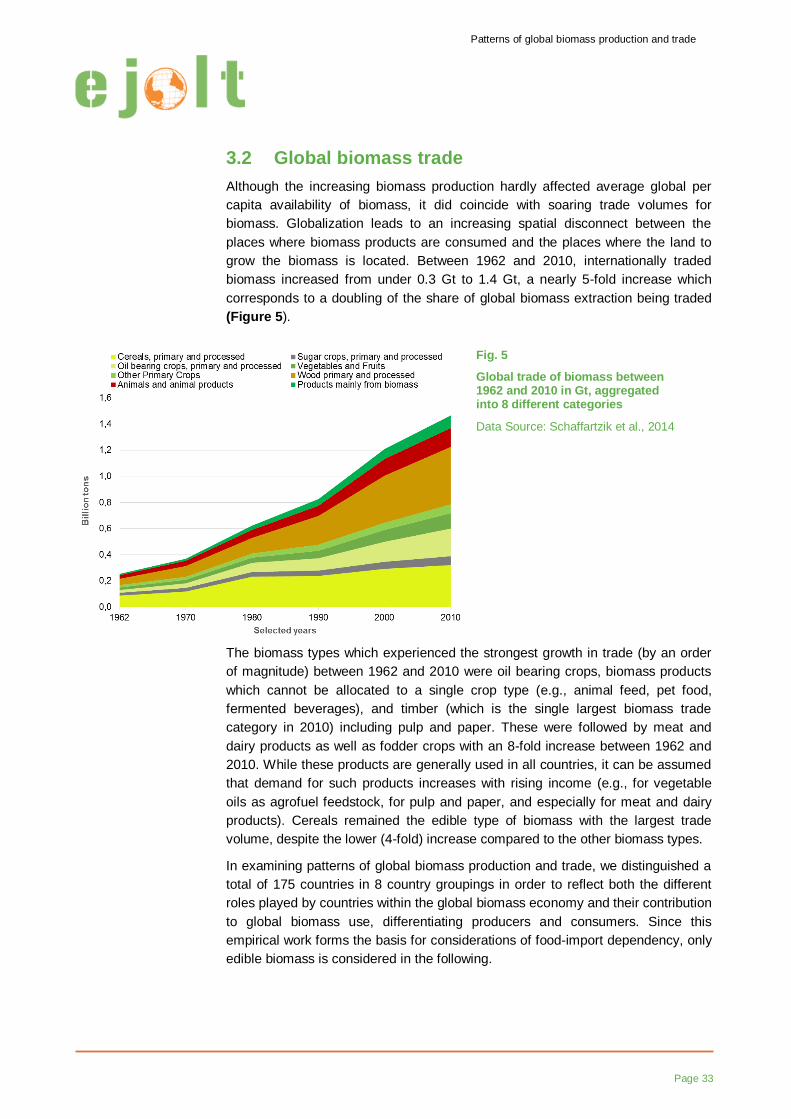
Patterns of global biomass production and trade
Page 33
3.2 Global biomass trade
Although the increasing biomass production hardly affected average global per
capita availability of biomass, it did coincide with soaring trade volumes for
biomass. Globalization leads to an increasing spatial disconnect between the
places where biomass products are consumed and the places where the land to
grow the biomass is located. Between 1962 and 2010, internationally traded
biomass increased from under 0.3 Gt to 1.4 Gt, a nearly 5-fold increase which
corresponds to a doubling of the share of global biomass extraction being traded
(Figure 5).
The biomass types which experienced the strongest growth in trade (by an order
of magnitude) between 1962 and 2010 were oil bearing crops, biomass products
which cannot be allocated to a single crop type (e.g., animal feed, pet food,
fermented beverages), and timber (which is the single largest biomass trade
category in 2010) including pulp and paper. These were followed by meat and
dairy products as well as fodder crops with an 8-fold increase between 1962 and
2010. While these products are generally used in all countries, it can be assumed
that demand for such products increases with rising income (e.g., for vegetable
oils as agrofuel feedstock, for pulp and paper, and especially for meat and dairy
products). Cereals remained the edible type of biomass with the largest trade
volume, despite the lower (4-fold) increase compared to the other biomass types.
In examining patterns of global biomass production and trade, we distinguished a
total of 175 countries in 8 country groupings in order to reflect both the different
roles played by countries within the global biomass economy and their contribution
to global biomass use, differentiating producers and consumers. Since this
empirical work forms the basis for considerations of food-import dependency, only
edible biomass is considered in the following.
Fig. 5
Global trade of biomass between 1962 and 2010 in Gt, aggregated into 8 different categories
Data Source: Schaffartzik et al., 2014
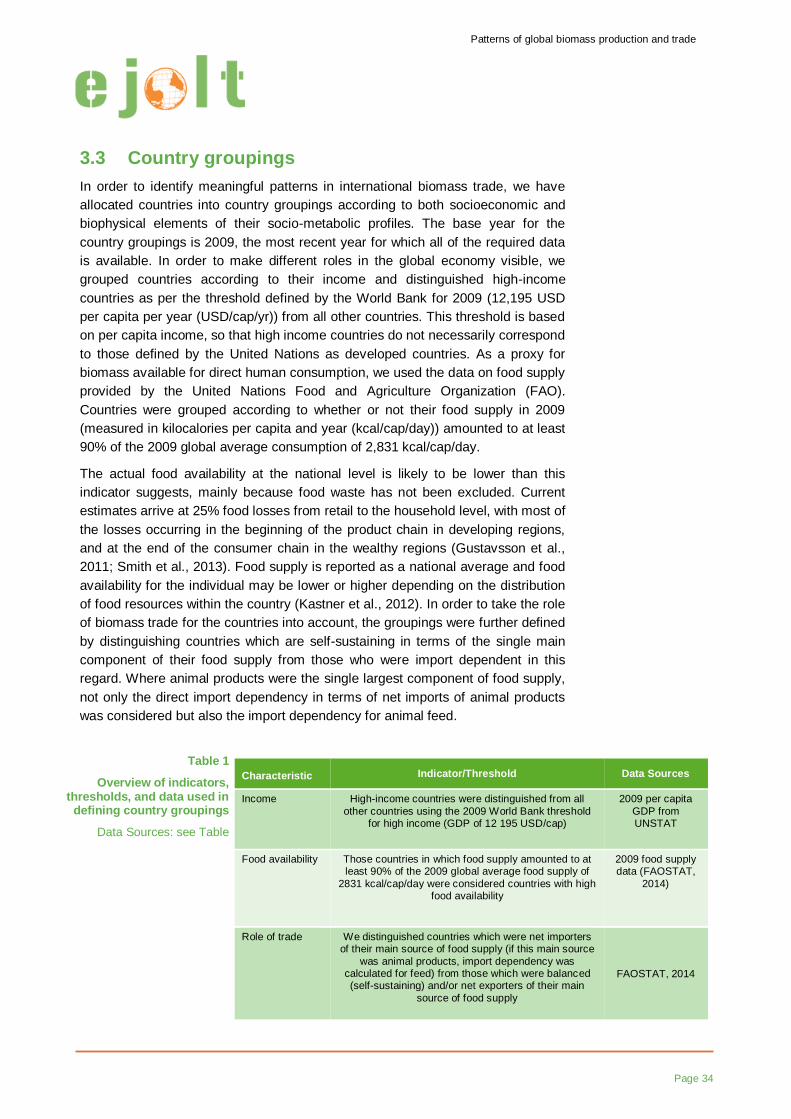
Patterns of global biomass production and trade
Page 34
3.3 Country groupings
In order to identify meaningful patterns in international biomass trade, we have
allocated countries into country groupings according to both socioeconomic and
biophysical elements of their socio-metabolic profiles. The base year for the
country groupings is 2009, the most recent year for which all of the required data
is available. In order to make different roles in the global economy visible, we
grouped countries according to their income and distinguished high-income
countries as per the threshold defined by the World Bank for 2009 (12,195 USD
per capita per year (USD/cap/yr)) from all other countries. This threshold is based
on per capita income, so that high income countries do not necessarily correspond
to those defined by the United Nations as developed countries. As a proxy for
biomass available for direct human consumption, we used the data on food supply
provided by the United Nations Food and Agriculture Organization (FAO).
Countries were grouped according to whether or not their food supply in 2009
(measured in kilocalories per capita and year (kcal/cap/day)) amounted to at least
90% of the 2009 global average consumption of 2,831 kcal/cap/day.
The actual food availability at the national level is likely to be lower than this
indicator suggests, mainly because food waste has not been excluded. Current
estimates arrive at 25% food losses from retail to the household level, with most of
the losses occurring in the beginning of the product chain in developing regions,
and at the end of the consumer chain in the wealthy regions (Gustavsson et al.,
2011; Smith et al., 2013). Food supply is reported as a national average and food
availability for the individual may be lower or higher depending on the distribution
of food resources within the country (Kastner et al., 2012). In order to take the role
of biomass trade for the countries into account, the groupings were further defined
by distinguishing countries which are self-sustaining in terms of the single main
component of their food supply from those who were import dependent in this
regard. Where animal products were the single largest component of food supply,
not only the direct import dependency in terms of net imports of animal products
was considered but also the import dependency for animal feed.
Characteristic Indicator/Threshold Data Sources
Income High-income countries were distinguished from all
other countries using the 2009 World Bank threshold for high income (GDP of 12 195 USD/cap)
2009 per capita
GDP from UNSTAT
Food availability Those countries in which food supply amounted to at least 90% of the 2009 global average food supply of
2831 kcal/cap/day were considered countries with high food availability
2009 food supply data (FAOSTAT,
2014)
Role of trade We distinguished countries which were net importers of their main source of food supply (if this main source
was animal products, import dependency was calculated for feed) from those which were balanced (self-sustaining) and/or net exporters of their main
source of food supply
FAOSTAT, 2014
Table 1
Overview of indicators, thresholds, and data used in
defining country groupings
Data Sources: see Table
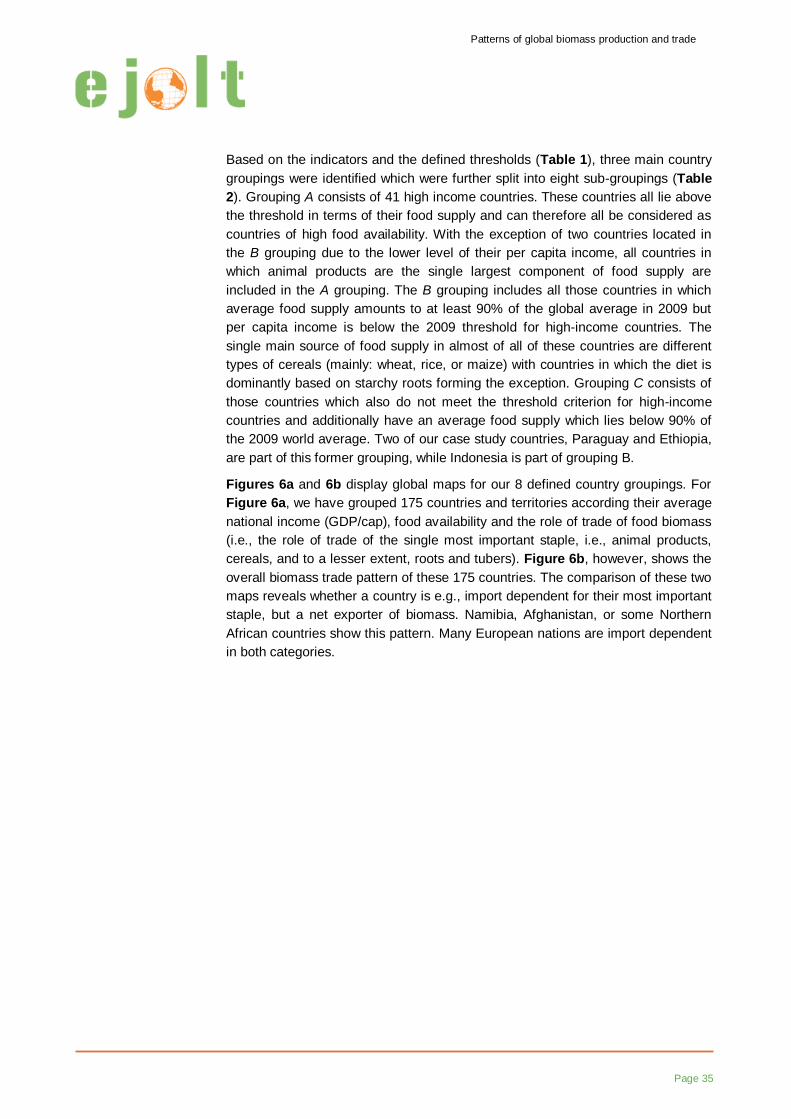
Patterns of global biomass production and trade
Page 35
Based on the indicators and the defined thresholds (Table 1), three main country
groupings were identified which were further split into eight sub-groupings (Table
2). Grouping A consists of 41 high income countries. These countries all lie above
the threshold in terms of their food supply and can therefore all be considered as
countries of high food availability. With the exception of two countries located in
the B grouping due to the lower level of their per capita income, all countries in
which animal products are the single largest component of food supply are
included in the A grouping. The B grouping includes all those countries in which
average food supply amounts to at least 90% of the global average in 2009 but
per capita income is below the 2009 threshold for high-income countries. The
single main source of food supply in almost of all of these countries are different
types of cereals (mainly: wheat, rice, or maize) with countries in which the diet is
dominantly based on starchy roots forming the exception. Grouping C consists of
those countries which also do not meet the threshold criterion for high-income
countries and additionally have an average food supply which lies below 90% of
the 2009 world average. Two of our case study countries, Paraguay and Ethiopia,
are part of this former grouping, while Indonesia is part of grouping B.
Figures 6a and 6b display global maps for our 8 defined country groupings. For
Figure 6a, we have grouped 175 countries and territories according their average
national income (GDP/cap), food availability and the role of trade of food biomass
(i.e., the role of trade of the single most important staple, i.e., animal products,
cereals, and to a lesser extent, roots and tubers). Figure 6b, however, shows the
overall biomass trade pattern of these 175 countries. The comparison of these two
maps reveals whether a country is e.g., import dependent for their most important
staple, but a net exporter of biomass. Namibia, Afghanistan, or some Northern
African countries show this pattern. Many European nations are import dependent
in both categories.
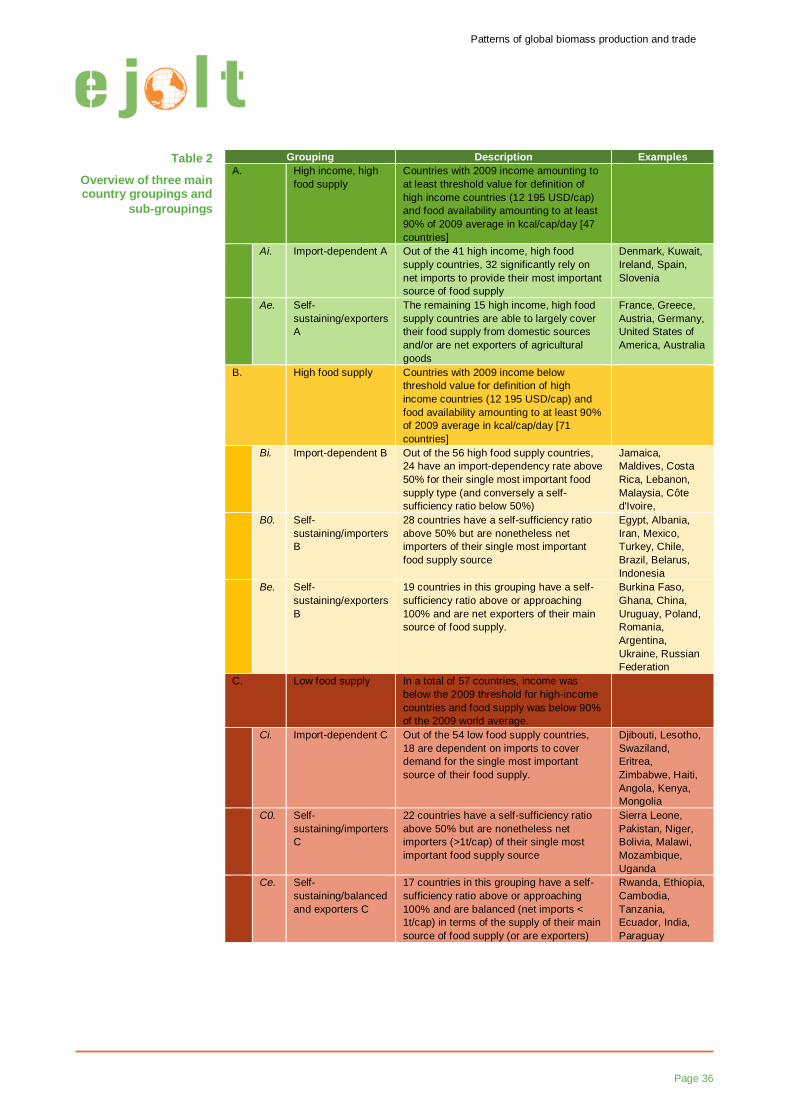
Patterns of global biomass production and trade
Page 36
Grouping Description Examples
A. High income, high
food supply
Countries with 2009 income amounting to
at least threshold value for definition of
high income countries (12 195 USD/cap)
and food availability amounting to at least
90% of 2009 average in kcal/cap/day [47
countries]
Ai. Import-dependent A Out of the 41 high income, high food
supply countries, 32 significantly rely on
net imports to provide their most important
source of food supply
Denmark, Kuwait,
Ireland, Spain,
Slovenia
Ae. Self-
sustaining/exporters
A
The remaining 15 high income, high food
supply countries are able to largely cover
their food supply from domestic sources
and/or are net exporters of agricultural
goods
France, Greece,
Austria, Germany,
United States of
America, Australia
B. High food supply Countries with 2009 income below
threshold value for definition of high
income countries (12 195 USD/cap) and
food availability amounting to at least 90%
of 2009 average in kcal/cap/day [71
countries]
Bi. Import-dependent B Out of the 56 high food supply countries,
24 have an import-dependency rate above
50% for their single most important food
supply type (and conversely a self-
sufficiency ratio below 50%)
Jamaica,
Maldives, Costa
Rica, Lebanon,
Malaysia, Côte
d'Ivoire,
B0. Self-
sustaining/importers
B
28 countries have a self-sufficiency ratio
above 50% but are nonetheless net
importers of their single most important
food supply source
Egypt, Albania,
Iran, Mexico,
Turkey, Chile,
Brazil, Belarus,
Indonesia
Be. Self-
sustaining/exporters
B
19 countries in this grouping have a self-
sufficiency ratio above or approaching
100% and are net exporters of their main
source of food supply.
Burkina Faso,
Ghana, China,
Uruguay, Poland,
Romania,
Argentina,
Ukraine, Russian
Federation
C. Low food supply In a total of 57 countries, income was
below the 2009 threshold for high-income
countries and food supply was below 90%
of the 2009 world average.
Ci. Import-dependent C Out of the 54 low food supply countries,
18 are dependent on imports to cover
demand for the single most important
source of their food supply.
Djibouti, Lesotho,
Swaziland,
Eritrea,
Zimbabwe, Haiti,
Angola, Kenya,
Mongolia
C0. Self-
sustaining/importers
C
22 countries have a self-sufficiency ratio
above 50% but are nonetheless net
importers (>1t/cap) of their single most
important food supply source
Sierra Leone,
Pakistan, Niger,
Bolivia, Malawi,
Mozambique,
Uganda
Ce. Self-
sustaining/balanced
and exporters C
17 countries in this grouping have a self-
sufficiency ratio above or approaching
100% and are balanced (net imports <
1t/cap) in terms of the supply of their main
source of food supply (or are exporters)
Rwanda, Ethiopia,
Cambodia,
Tanzania,
Ecuador, India,
Paraguay
Table 2
Overview of three main country groupings and
sub-groupings
Patterns of global biomass production and trade
Page 37
3.4 Metabolic profiles of country groupings
Upon examining the overall apparent material consumption of the country
groupings (Figure 7), we find that grouping A, home to slightly over 1 billion (Bn)
people in 2010, is characterized by a large overall metabolism in the same year. It
includes countries such as the US and Canada, Australia, Europe, and some
Middle Eastern Countries. At 15.3 t/cap, domestic material consumption in this
grouping is 1.5 times as large as the world average that same year. The metabolic
profiles of countries in this grouping show the pattern of mature industrialized
economies: High per capita use of resources8 and relatively high shares of non-
renewable resources with mostly stagnating or even shrinking shares of biomass.
8 There are considerable differences among countries in this grouping which are mostly rooted in
population density: Densely populated countries have lower metabolic rates than sparsely
populated countries.
Fig. 6a
Global map of countries grouped by average national income (GDP/cap), food availability and the role of trade in food biomass
Data Source: Schaffartzik et al.
2014
Fig. 6b
Global map of countries grouped by average national income (GDP/cap), food availability and the role of overall biomass trade (all biomass categories included)
Data Source: Schaffartzik et al. 2014
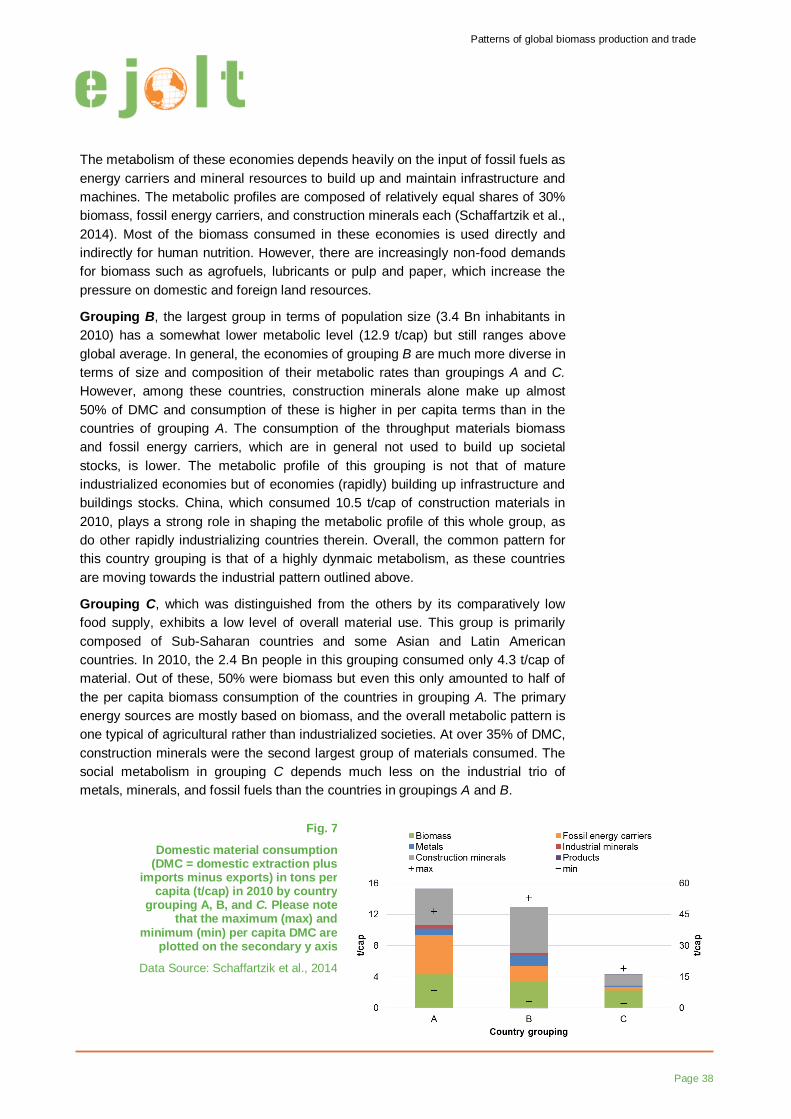
Patterns of global biomass production and trade
Page 38
The metabolism of these economies depends heavily on the input of fossil fuels as
energy carriers and mineral resources to build up and maintain infrastructure and
machines. The metabolic profiles are composed of relatively equal shares of 30%
biomass, fossil energy carriers, and construction minerals each (Schaffartzik et al.,
2014). Most of the biomass consumed in these economies is used directly and
indirectly for human nutrition. However, there are increasingly non-food demands
for biomass such as agrofuels, lubricants or pulp and paper, which increase the
pressure on domestic and foreign land resources.
Grouping B, the largest group in terms of population size (3.4 Bn inhabitants in
2010) has a somewhat lower metabolic level (12.9 t/cap) but still ranges above
global average. In general, the economies of grouping B are much more diverse in
terms of size and composition of their metabolic rates than groupings A and C.
However, among these countries, construction minerals alone make up almost
50% of DMC and consumption of these is higher in per capita terms than in the
countries of grouping A. The consumption of the throughput materials biomass
and fossil energy carriers, which are in general not used to build up societal
stocks, is lower. The metabolic profile of this grouping is not that of mature
industrialized economies but of economies (rapidly) building up infrastructure and
buildings stocks. China, which consumed 10.5 t/cap of construction materials in
2010, plays a strong role in shaping the metabolic profile of this whole group, as
do other rapidly industrializing countries therein. Overall, the common pattern for
this country grouping is that of a highly dynmaic metabolism, as these countries
are moving towards the industrial pattern outlined above.
Grouping C, which was distinguished from the others by its comparatively low
food supply, exhibits a low level of overall material use. This group is primarily
composed of Sub-Saharan countries and some Asian and Latin American
countries. In 2010, the 2.4 Bn people in this grouping consumed only 4.3 t/cap of
material. Out of these, 50% were biomass but even this only amounted to half of
the per capita biomass consumption of the countries in grouping A. The primary
energy sources are mostly based on biomass, and the overall metabolic pattern is
one typical of agricultural rather than industrialized societies. At over 35% of DMC,
construction minerals were the second largest group of materials consumed. The
social metabolism in grouping C depends much less on the industrial trio of
metals, minerals, and fossil fuels than the countries in groupings A and B.
Fig. 7
Domestic material consumption (DMC = domestic extraction plus
imports minus exports) in tons per capita (t/cap) in 2010 by country
grouping A, B, and C. Please note that the maximum (max) and
minimum (min) per capita DMC are plotted on the secondary y axis
Data Source: Schaffartzik et al., 2014
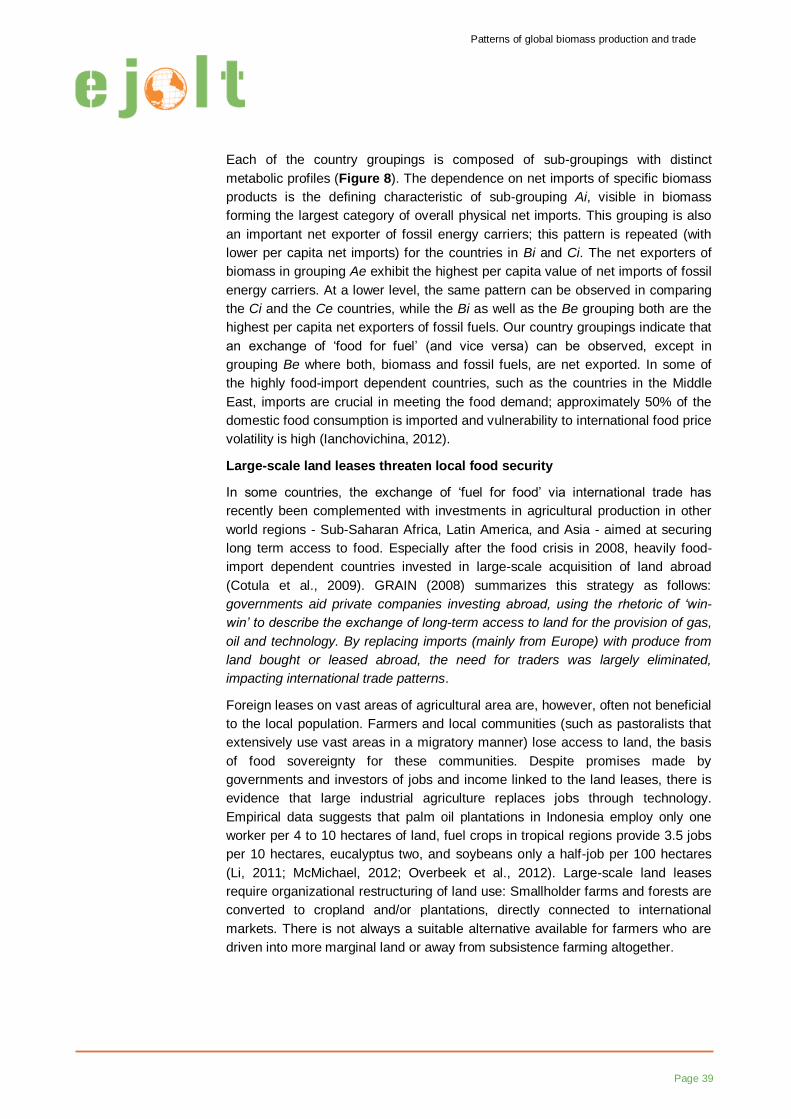
Patterns of global biomass production and trade
Page 39
Each of the country groupings is composed of sub-groupings with distinct
metabolic profiles (Figure 8). The dependence on net imports of specific biomass
products is the defining characteristic of sub-grouping Ai, visible in biomass
forming the largest category of overall physical net imports. This grouping is also
an important net exporter of fossil energy carriers; this pattern is repeated (with
lower per capita net imports) for the countries in Bi and Ci. The net exporters of
biomass in grouping Ae exhibit the highest per capita value of net imports of fossil
energy carriers. At a lower level, the same pattern can be observed in comparing
the Ci and the Ce countries, while the Bi as well as the Be grouping both are the
highest per capita net exporters of fossil fuels. Our country groupings indicate that
an exchange of ‘food for fuel’ (and vice versa) can be observed, except in
grouping Be where both, biomass and fossil fuels, are net exported. In some of
the highly food-import dependent countries, such as the countries in the Middle
East, imports are crucial in meeting the food demand; approximately 50% of the
domestic food consumption is imported and vulnerability to international food price
volatility is high (Ianchovichina, 2012).
Large-scale land leases threaten local food security
In some countries, the exchange of ‘fuel for food’ via international trade has
recently been complemented with investments in agricultural production in other
world regions - Sub-Saharan Africa, Latin America, and Asia - aimed at securing
long term access to food. Especially after the food crisis in 2008, heavily food-
import dependent countries invested in large-scale acquisition of land abroad
(Cotula et al., 2009). GRAIN (2008) summarizes this strategy as follows:
governments aid private companies investing abroad, using the rhetoric of ‘win-
win’ to describe the exchange of long-term access to land for the provision of gas,
oil and technology. By replacing imports (mainly from Europe) with produce from
land bought or leased abroad, the need for traders was largely eliminated,
impacting international trade patterns.
Foreign leases on vast areas of agricultural area are, however, often not beneficial
to the local population. Farmers and local communities (such as pastoralists that
extensively use vast areas in a migratory manner) lose access to land, the basis
of food sovereignty for these communities. Despite promises made by
governments and investors of jobs and income linked to the land leases, there is
evidence that large industrial agriculture replaces jobs through technology.
Empirical data suggests that palm oil plantations in Indonesia employ only one
worker per 4 to 10 hectares of land, fuel crops in tropical regions provide 3.5 jobs
per 10 hectares, eucalyptus two, and soybeans only a half-job per 100 hectares
(Li, 2011; McMichael, 2012; Overbeek et al., 2012). Large-scale land leases
require organizational restructuring of land use: Smallholder farms and forests are
converted to cropland and/or plantations, directly connected to international
markets. There is not always a suitable alternative available for farmers who are
driven into more marginal land or away from subsistence farming altogether.
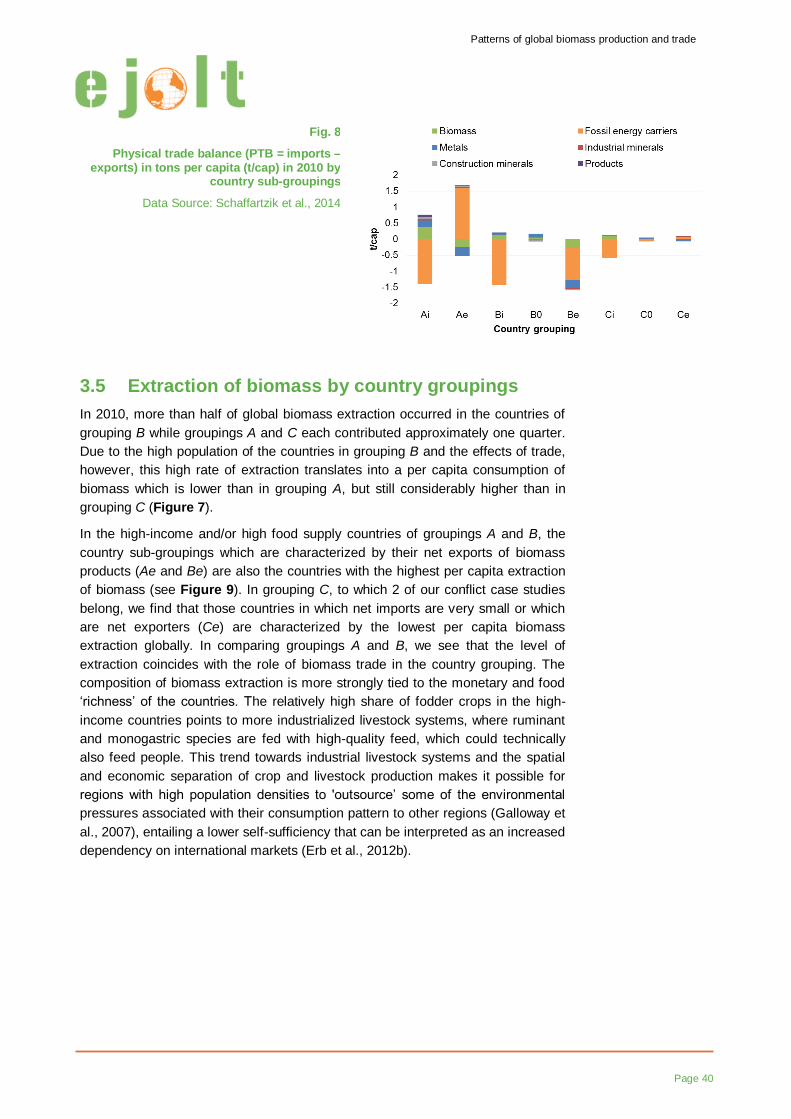
Patterns of global biomass production and trade
Page 40
3.5 Extraction of biomass by country groupings
In 2010, more than half of global biomass extraction occurred in the countries of
grouping B while groupings A and C each contributed approximately one quarter.
Due to the high population of the countries in grouping B and the effects of trade,
however, this high rate of extraction translates into a per capita consumption of
biomass which is lower than in grouping A, but still considerably higher than in
grouping C (Figure 7).
In the high-income and/or high food supply countries of groupings A and B, the
country sub-groupings which are characterized by their net exports of biomass
products (Ae and Be) are also the countries with the highest per capita extraction
of biomass (see Figure 9). In grouping C, to which 2 of our conflict case studies
belong, we find that those countries in which net imports are very small or which
are net exporters (Ce) are characterized by the lowest per capita biomass
extraction globally. In comparing groupings A and B, we see that the level of
extraction coincides with the role of biomass trade in the country grouping. The
composition of biomass extraction is more strongly tied to the monetary and food
‘richness’ of the countries. The relatively high share of fodder crops in the high-
income countries points to more industrialized livestock systems, where ruminant
and monogastric species are fed with high-quality feed, which could technically
also feed people. This trend towards industrial livestock systems and the spatial
and economic separation of crop and livestock production makes it possible for
regions with high population densities to 'outsource’ some of the environmental
pressures associated with their consumption pattern to other regions (Galloway et
al., 2007), entailing a lower self-sufficiency that can be interpreted as an increased
dependency on international markets (Erb et al., 2012b).
Fig. 8
Physical trade balance (PTB = imports – exports) in tons per capita (t/cap) in 2010 by
country sub-groupings
Data Source: Schaffartzik et al., 2014
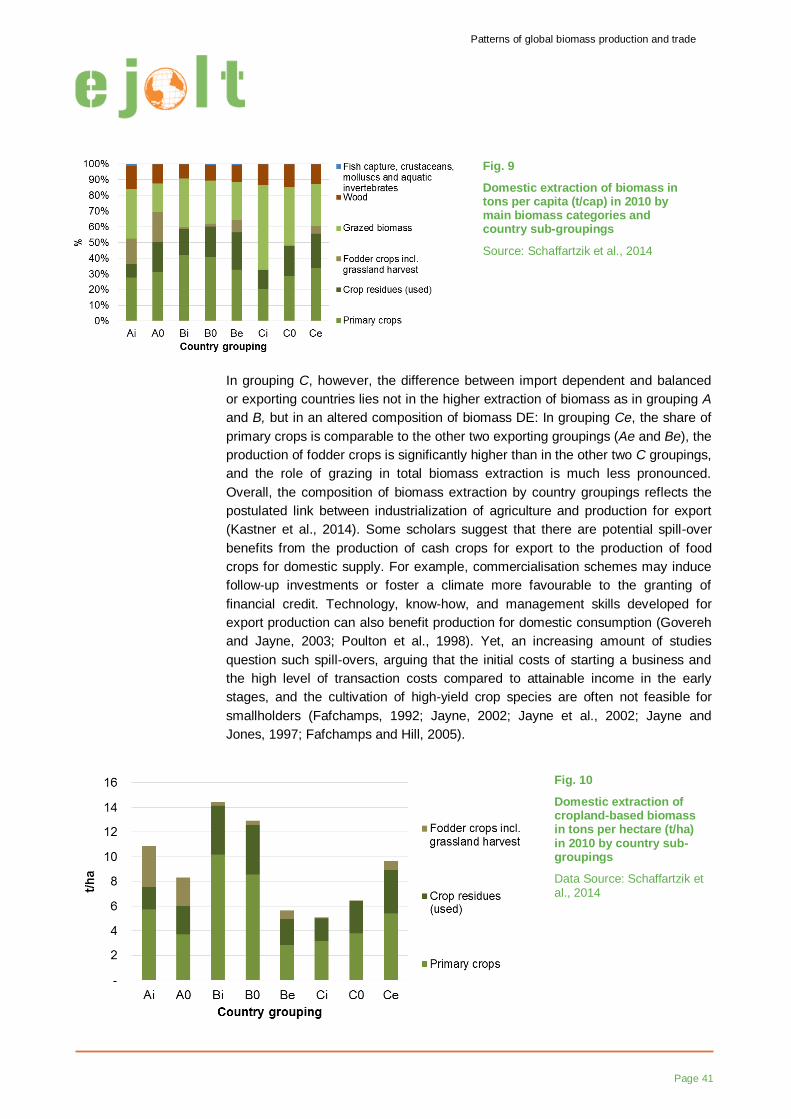
Patterns of global biomass production and trade
Page 41
In grouping C, however, the difference between import dependent and balanced
or exporting countries lies not in the higher extraction of biomass as in grouping A
and B, but in an altered composition of biomass DE: In grouping Ce, the share of
primary crops is comparable to the other two exporting groupings (Ae and Be), the
production of fodder crops is significantly higher than in the other two C groupings,
and the role of grazing in total biomass extraction is much less pronounced.
Overall, the composition of biomass extraction by country groupings reflects the
postulated link between industrialization of agriculture and production for export
(Kastner et al., 2014). Some scholars suggest that there are potential spill-over
benefits from the production of cash crops for export to the production of food
crops for domestic supply. For example, commercialisation schemes may induce
follow-up investments or foster a climate more favourable to the granting of
financial credit. Technology, know-how, and management skills developed for
export production can also benefit production for domestic consumption (Govereh
and Jayne, 2003; Poulton et al., 1998). Yet, an increasing amount of studies
question such spill-overs, arguing that the initial costs of starting a business and
the high level of transaction costs compared to attainable income in the early
stages, and the cultivation of high-yield crop species are often not feasible for
smallholders (Fafchamps, 1992; Jayne, 2002; Jayne et al., 2002; Jayne and
Jones, 1997; Fafchamps and Hill, 2005).
Fig. 9
Domestic extraction of biomass in tons per capita (t/cap) in 2010 by main biomass categories and country sub-groupings
Source: Schaffartzik et al., 2014
Fig. 10
Domestic extraction of cropland-based biomass in tons per hectare (t/ha) in 2010 by country sub-groupings
Data Source: Schaffartzik et al., 2014
Patterns of global biomass production and trade
Page 42
The extraction of biomass resources is both dependent on the availability of and
access to agricultural land (i.e., cropland or pastures) and harvest achievable on
that land under given conditions of production. In order to include this aspect in
the analysis of our country groupings, we have calculated the relationship
between primary crops and fodder crops harvest and the available arable land
(Figure 10).
The fodder crops harvest indicated here includes grassland harvest (e.g., hay), so
that the values may represent an overestimation for those country groupings in
which the share of grassland harvest in the fodder crops category is high. The
trends which can be identified within the A and B country groupings on the one
hand and the C country grouping on the other hand differ quite substantially: in the
export-oriented economies of grouping A and B (i.e., Ae and Be), the ratio of crops
harvest to arable land is lower than in the import dependent country groupings. In
the Ae grouping, much more biomass is harvested than in the Ai grouping but the
arable land required to generate this harvest is disproportionately larger.
Additionally, grouping A produces a high amount of fodder crops per area,
indicating that its livestock is fed with rather intensively produced crops. In the Be
grouping, more biomass is harvested than in the Bi grouping but, again, a
disproportionate amount of arable land is required to enable this harvest.
Within grouping C, on the other hand, the export-oriented economies (Ce) are
able to harvest more biomass from each unit of arable land than the import
dependent economies in this grouping. This pattern in grouping Ce is different to
the patterns in groups Ai, Bi and B0, where the countries that can produce more
on their arable land use a larger share of this production domestically. This pattern
is important as those countries that are food insecure anyway use a larger share
of their productive land for exports than the food secure countries in groupings Ai,
Bi, and Be. It is thus an indication of an export-oriented development path in these
countries, eventually favouring export production instead of the production of
domestic food crops.

Patterns of global biomass production and trade
Page 43
3.6 Biomass trade by country groupings
Trade accounts for the difference between the biomass extracted and the biomass
available for consumption within the country groupings. Thus, it also plays a
crucial role in explaining the level of food supply according to which grouping a
country was allocated.
In 2010, country grouping A was a net exporter of biomass while groupings B and
C were net importers. However, if we examine the different types of biomass
traded, we find that the role of each grouping as a global supplier or consumer
varies by type of biomass (Figure 11).
Grouping A supplies cereals, the most important single source of food supply in
the majority of countries, to groupings B and C. This pattern is critical for food
security in groupings B and C, as these countries are dependent on world markets
for their local food availability. Price peaks or export bans have a strong influence
on these countries, as became apparent during the food crises of 2008 and 2011
(Moseley et al., 2010). Grouping A is also a global supplier of fodder crops and
pulses.
Net exports from grouping B of sugar crops, oil bearing crops, and vegetables and
from groupings B and C of fruits, fibres, and other crops are the basis of the net
imports of grouping A. While grouping A is a global supplier of food staples,
regions B and C are suppliers of luxury foods such as vegetables and fruits, while
meat and animal products flow from grouping A mostly to grouping B. Figure 11a
demonstrates the legacies of the second food regime, where food aid and
subsidized food production from rich to poor nations dominated the global trade
flows of biomass (Friedmann and McMichael, 1989).
Fig. 11
Exports (to the left of the y axis) and imports (to the right of the y axis) by biomass category and main country grouping in 2010 in Megatons (Mt)
Data Source: Schaffartzik et al., 2014

Patterns of global biomass production and trade
Page 44
The overall pattern of grouping C as a net importer of biomass may seem to
contrast with the description of unequal exchange in the context of food regime
theory. According to this conceptual approach, poor countries increasingly export
primary goods mostly to industrialized countries that lack fertile soils and ‘expand’
their territories through long-term land acquisitions abroad (McMichael, 2013b).
But a more detailed look reveals that some export crops have undergone massive
growth, while the dependency on staple crop imports remains.
An expansion of markets in these poor countries can help to overcome temporary
problems of food supply, but the same market expansion often occurs at the cost
of smallholders and other marginalized segments of the population (Pokorny et al.,
2013). It is questionable whether the expansion of market-oriented agriculture in
these countries can secure long-term food security and sovereignty, which the
corporate food regime has failed to deliver.
Overall, grouping C has a comparably low level of integration into global markets
for biomass, as biomass imports correspond to 2% of biomass DE, and exports
correspond to 1% ( 19% and 20% for the A grouping). The ongoing market
integration of the countries in grouping C supports the hypothesis that until now,
‘non-participating’ countries in world trade are those regions where new land-
grabbing conflicts are sparked (see e.g., the Land Matrix Global Observatory,
2015).
Within the main groupings, we can again distinguish the net exporting countries
from the net importing ones fairly clearly for grouping A and B (Figure 12). It may
be surprising that grouping B0 has higher net imports than grouping Bi, which is
explained by the fact that this grouping is home to 10 times as many people as Bi,
reducing the per capita rates to a third of the values in grouping Bi.
The exports of fruits and oil-bearing crops from grouping Ce are almost negligible
at the global scale, although relevant in terms of the overall biomass availability in
these countries. The importance of these crops at the local level and the dynamics
of the production volumes of these crops can be linked to changes in food security
Fig. 12
Net trade flows (net exports to the left of the y axis and net
imports to the right y axis) by biomass category and country
sub-grouping in 2010 in Megatons (Mt)
Data Source: Schaffartzik et al., 2014
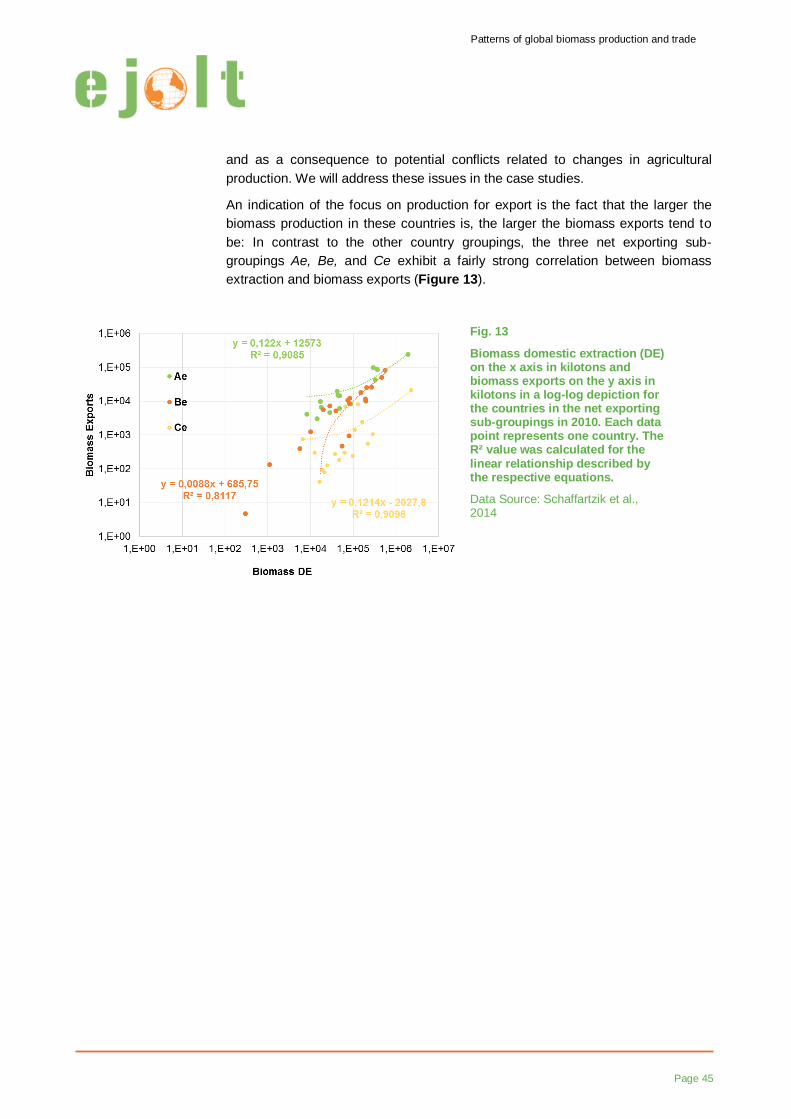
Patterns of global biomass production and trade
Page 45
and as a consequence to potential conflicts related to changes in agricultural
production. We will address these issues in the case studies.
An indication of the focus on production for export is the fact that the larger the
biomass production in these countries is, the larger the biomass exports tend to
be: In contrast to the other country groupings, the three net exporting sub-
groupings Ae, Be, and Ce exhibit a fairly strong correlation between biomass
extraction and biomass exports (Figure 13).
Fig. 13
Biomass domestic extraction (DE) on the x axis in kilotons and biomass exports on the y axis in kilotons in a log-log depiction for the countries in the net exporting sub-groupings in 2010. Each data point represents one country. The R² value was calculated for the linear relationship described by the respective equations.
Data Source: Schaffartzik et al., 2014

Threats to food sovereignty and the potential of social conflicts
Page 46
4
Threats to food
sovereignty and
the potential of
social conflicts
4.1 Food self-sufficiency and international trade
The following section relates biophysical patterns of biomass extraction and trade
to drivers of social conflicts arising from the rapid and market-oriented
development of agriculture in the global South. Conflicts in 2008, for example,
were sparked when food import dependent countries in the global South could not
meet the minimum calorific requirements for their populations via global grain
markets. Next to such insufficient access to global markets and associated
distributive failures, socio-environmental conflict may also be related to the form of
agricultural production. The conflicts surrounding land grabbing are an example as
well as those which are evoked by the socio-environmental impacts of agricultural
intensification (e.g., leaching of pesticides and fertilizers and land degradation).
Agricultural production practices may undermine local livelihoods of smallholders,
peasant communities, indigenous groups or transhumant communities. Where
conflicts become manifest, this is due to a multitude of social, political, cultural,
economic, and biophysical factors. Even where conditions with high conflict
potential are given, the government or another actor may be able to suppress the
conflict as the example of Indonesia (Chapter 5.1) shows. The biophysical
patterns of biomass extraction and trade discussed in the following must therefore
be understood as providing one set of drivers of socio-environmental conflict
potential which may be enforced or lessened by other factors.
Between 1962 and 2010, internationally traded biomass increased from less than
0.3 Gt to 1.4 Gt, a nearly 5-fold increase from 3% to 8% of total biomass
extraction (Figure 5). This surge in trade illustrates how the corporate food regime
increasingly connects remote places through long value chains. The related
Threats to food sovereignty and the potential of social conflicts
Page 47
expansion of corporate structures in global trade is reflected in the increasing
influence of business in the political-institutional context (McMichael, 2011).
As the corporate food regime has developed, perceptions of how food security
might be achieved have changed. In post WWII development, national food
security was central and agricultural commodities were exempt from GATT. The
Uruguay round (1986-1994), in which central WTO regulations on agriculture were
negotiated and confirmed, redefined food security as obtainable via internationally
managed market relations (McMichael, 2006). These international market
relations are interpreted to offer the possibility of overcoming domestic shortages
in food supply via imports and of producing agricultural products where this can be
done at the lowest economic (and by extension environmental and social) cost
whilst simultaneously providing revenue for exporting nations. There has,
however, also been widespread critique of the corporate food regime as export-
oriented agricultural production increasingly threatens small-scale farming and the
associated food production and income for rural communities, especially in the
global South (Godfray et al., 2010a; GRAIN et al., 2014; Pokorny et al., 2013).
Biomass-based products, which serve the elementary purpose of feeding a
country’s population, are important traded commodities and sources of revenue.
These two uses of biomass, food or export, often directly and indirectly compete
with one another in a manner strongly linked to the potential for social conflict
(Hendrix and Brinkman, 2013; Messer and Cohen, 2006).
The focus on agricultural production for export may threaten both food security
and food sovereignity. Food security is commonly measured as the availability of
food calories for a given population and is the result of food availability, access,
utilization, and the stability of food supply. Any one of these factors can threaten
food security. Whether food calories stem from domestic production or imports
may influence food security if it impacts one of the aforementioned factors, e.g., if
access to international food markets is more limited than access to subsistence
agriculture previously was.
The claim to not only consider food security but to strive for food sovereignty
postulates the right of people to choose their own food systems. Food sovereignity
may be threatened, for example, if multinational corporations and business
practices compete with smallholders over fertile lands in an asymmetric network of
power relations. It expands the food security question of ‘how much is available for
whom?’ to include ‘how are agricultural products produced and who decides this?’
In the following section, four different factors which may threaten food security are
examined empirically:
1. Food import dependency (Moseley et al., 2010) refers to a country’s
dependency on the international market in providing the necessary calories for its
population. Food import dependency may become a risk to food security when
bans in exporting countries or price peaks increase costs for importing nations.
2. Competition between the use of cereals for human food and animal feed
may reduce the availability of calories for direct human consumption through the
Threats to food sovereignty and the potential of social conflicts
Page 48
lower EROI of animal products compared to crops that may be directly consumed
by humans (Erb et al., 2012b).
3. Provisioning difficulties (Lipinski, 2013; Gustavsson et al., 2011) are
defined as the amount of the commodity in question lost during the year at all
stages between production and household consumption (FAOSTAT, 2014). While
in industrialized countries the largest shares of food are lost during the final stages
of the life cycle (i.e., after food was purchased by end-consumers), the largest
losses in developing countries occur during the production, processing, and
distribution phases (up to 90% in Sub-Saharan Africa and Latin America). Food
waste and food losses made up between 120 kg/cap in South and Southeast Asia
and and nearly 300 kg/cap in Northern America in 2007 (Gustavsson et al., 2011).
4. Export dependency refers to countries with agricultural systems that
export significant shares of their production (Gudynas, 2010; Watkins, 1963). This
export-orientation may be detrimental to the local population if export revenues
are not evenly distributed, especially if import-dependency for staple crops exists
simultaneously and subsistence agriculture is replaced (Borras et al., 2012;
McMichael, 2011).
For our analysis of threats to food security, we investigated these four factors
regarding the domestic main staples at the country level. The most important
single source of food in most of the countries facing food insecurity are cereals
which are also the most widely traded agricultural commodity (Figure 6). Globally,
wheat and rice are by far the two most important cereals consumed as human
food with maize coming in third: In 2009, wheat represented 45% of the cereals
consumed, rice 36%, and maize 12% (FAOSTAT, 2014). We have thus classified
countries into three groupings according to the cereal which is the main source of
food in a country, i.e., wheat, maize or rice.
The four factors potentially threatening food security may also be observed in
high-income countries with high food supply. Some EU member states, for
example, import significant shares of the cereal they consume, of which a large
share may be used to feed livestock. Neither this import dependency nor limited
food sovereignty have provoked any major discussion in the EU, although some
concerns have been recently voiced (Franco and Borras, 2013). These focus on
the almost exclusively corporate-based agricultural development in the EU which
may undermine local and/or sustainable food systems. Since other factors
minimize the potential for conflict, the countries of grouping A (see Table 2 in
Chapter 3) have mostly been excluded from the following analysis, except where
they are helpful to understand the following conflict patterns.
4.2 Patterns of maize production and consumption
Figure M1 provides an overview of the seven countries with the highest import
dependence for maize and in which maize is the single most important staple
crop. Of these, Lesotho, Swaziland, Zimbabwe, Namibia, and Kenya, all located in
Sub-Saharan Africa, import more than 40% of their domestic food supply, either
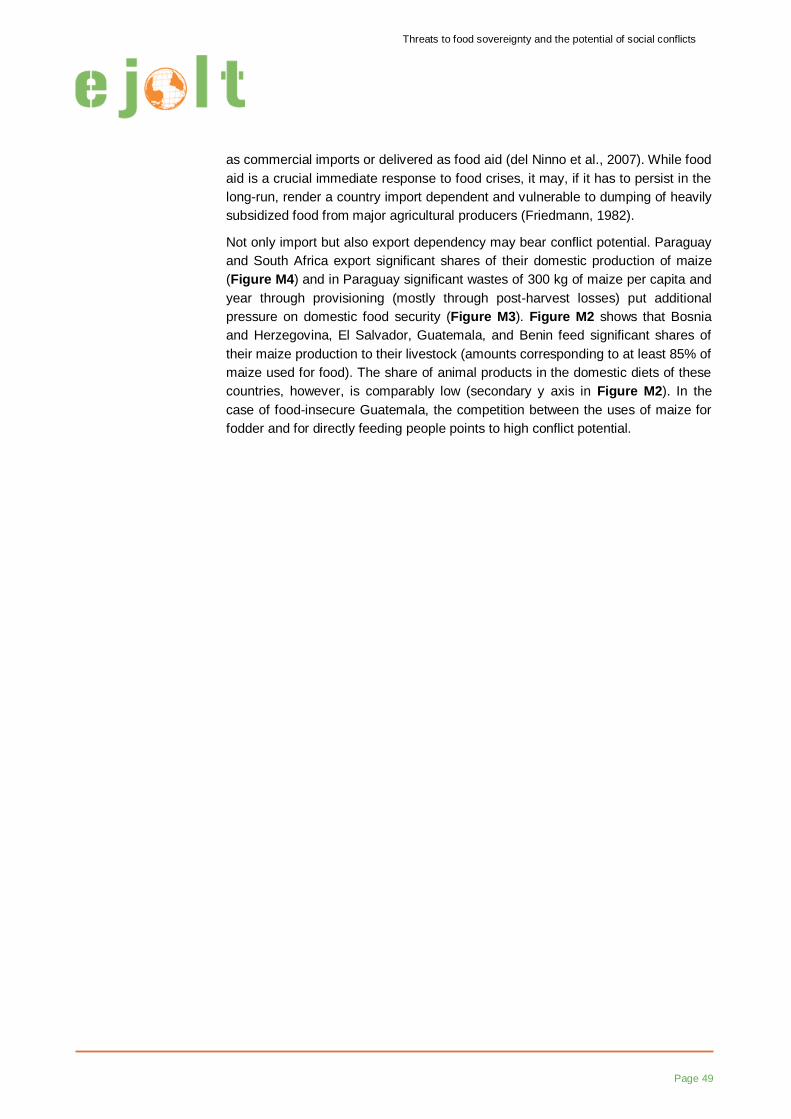
Threats to food sovereignty and the potential of social conflicts
Page 49
as commercial imports or delivered as food aid (del Ninno et al., 2007). While food
aid is a crucial immediate response to food crises, it may, if it has to persist in the
long-run, render a country import dependent and vulnerable to dumping of heavily
subsidized food from major agricultural producers (Friedmann, 1982).
Not only import but also export dependency may bear conflict potential. Paraguay
and South Africa export significant shares of their domestic production of maize
(Figure M4) and in Paraguay significant wastes of 300 kg of maize per capita and
year through provisioning (mostly through post-harvest losses) put additional
pressure on domestic food security (Figure M3). Figure M2 shows that Bosnia
and Herzegovina, El Salvador, Guatemala, and Benin feed significant shares of
their maize production to their livestock (amounts corresponding to at least 85% of
maize used for food). The share of animal products in the domestic diets of these
countries, however, is comparably low (secondary y axis in Figure M2). In the
case of food-insecure Guatemala, the competition between the uses of maize for
fodder and for directly feeding people points to high conflict potential.
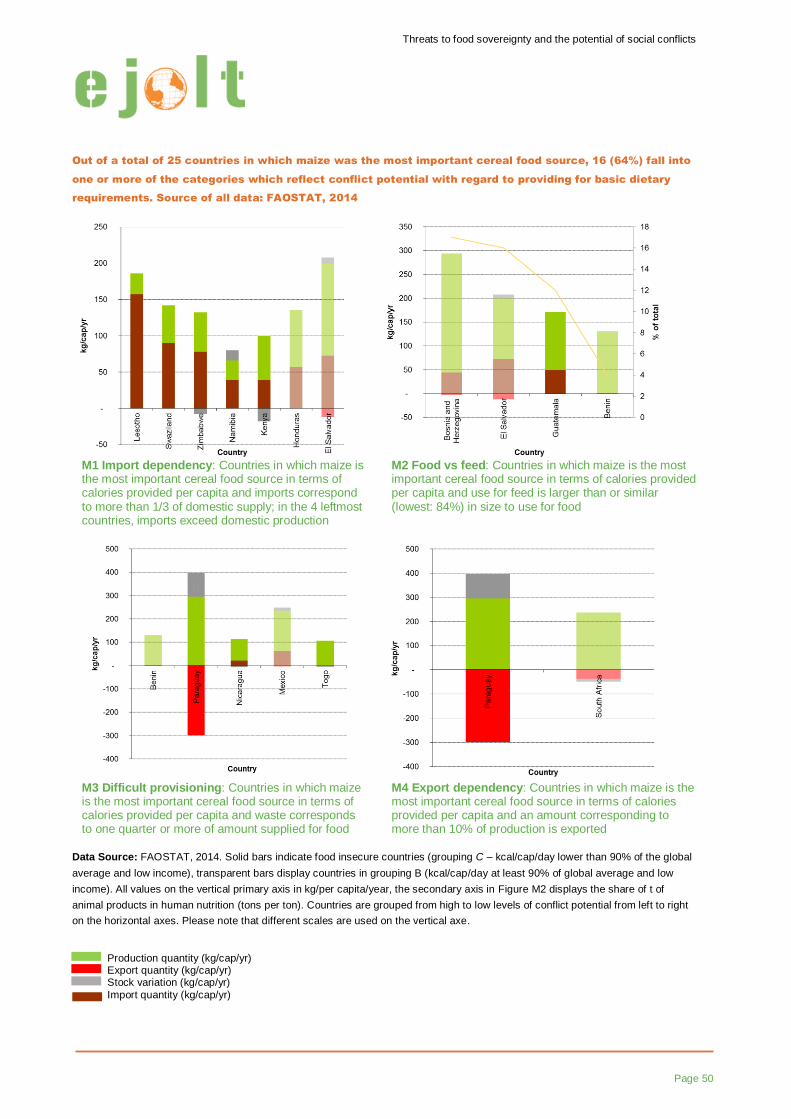
Threats to food sovereignty and the potential of social conflicts
Page 50
Out of a total of 25 countries in which maize was the most important cereal food source, 16 (64%) fall into
one or more of the categories which reflect conflict potential with regard to providing for basic dietary
requirements. Source of all data: FAOSTAT, 2014
M1 Import dependency: Countries in which maize is the most important cereal food source in terms of calories provided per capita and imports correspond to more than 1/3 of domestic supply; in the 4 leftmost countries, imports exceed domestic production
M2 Food vs feed: Countries in which maize is the most important cereal food source in terms of calories provided per capita and use for feed is larger than or similar (lowest: 84%) in size to use for food
M3 Difficult provisioning: Countries in which maize is the most important cereal food source in terms of calories provided per capita and waste corresponds to one quarter or more of amount supplied for food
M4 Export dependency: Countries in which maize is the most important cereal food source in terms of calories provided per capita and an amount corresponding to more than 10% of production is exported
Data Source: FAOSTAT, 2014. Solid bars indicate food insecure countries (grouping C – kcal/cap/day lower than 90% of the global
average and low income), transparent bars display countries in grouping B (kcal/cap/day at least 90% of global average and low
income). All values on the vertical primary axis in kg/per capita/year, the secondary axis in Figure M2 displays the share of t of
animal products in human nutrition (tons per ton). Countries are grouped from high to low levels of conflict potential from left to right
on the horizontal axes. Please note that different scales are used on the vertical axe.
Production quantity (kg/cap/yr) Export quantity (kg/cap/yr) Stock variation (kg/cap/yr)
Import quantity (kg/cap/yr)
Threats to food sovereignty and the potential of social conflicts
Page 51
4.3 Patterns of rice production and consumption
Rice is the most important staple crop in many East and Southeast Asian
countries and also in some Sub-Saharan and a few Latin American countries. Out
of a total of rice-dominated 35 countries, 11 countries are classified as import
dependent (i.e., more than one-third of domestic supply stems from imports), out
of which 6 countries are classified as food insecure (Figure R1). Brunei
Darussalam has one of the highest GDP/capita globally and can ‘counterbalance’
the low domestic food production with high revenues from oil and gas exports.
Most countries of groupings B and C do not, however, have such a de-escalating
mechanism. Gambia and Côte d’Ivoire, belonging to grouping B, were severely
affected by the global food crisis in 2008 and also suffer from periodic food
insecurity (Moseley et al., 2010). On a global level, rice only plays a minor role as
livestock feed, but in Suriname, Guyana, and Myanmar, significant shares of rice
are fed to the monogastric and ruminant livestock (Figure R2).
If not only crop residues but also the grains as such are fed to livestock,
competition between food and feed may arise, particularly if the provisioning
infrastructures are additionally inefficient. In Suriname, Guyana, and Myanmar,
waste corresponds to between 30% and 44% of domestic supply (Figure R3).
Guyana and Suriname are also major rice exporters (Figure R4), underlining that
these economies have highly specialized agricultural sectors. During the last
years of high international staple crop prices, this development path secured
foreign revenues through exports, but in times of low world market prices, these
important sources of income may decrease (Barbier, 2010; Watkins, 1963).
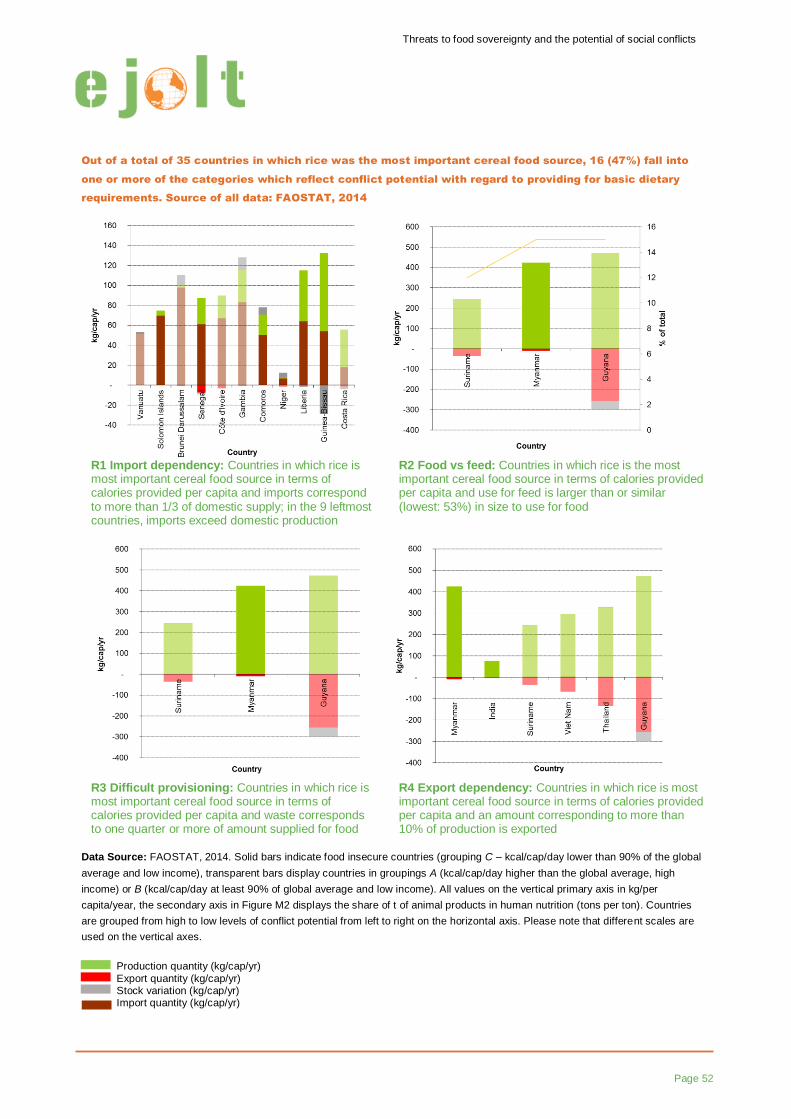
Threats to food sovereignty and the potential of social conflicts
Page 52
Out of a total of 35 countries in which rice was the most important cereal food source, 16 (47%) fall into
one or more of the categories which reflect conflict potential with regard to providing for basic dietary
requirements. Source of all data: FAOSTAT, 2014
R1 Import dependency: Countries in which rice is most important cereal food source in terms of calories provided per capita and imports correspond to more than 1/3 of domestic supply; in the 9 leftmost countries, imports exceed domestic production
R2 Food vs feed: Countries in which rice is the most important cereal food source in terms of calories provided per capita and use for feed is larger than or similar (lowest: 53%) in size to use for food
R3 Difficult provisioning: Countries in which rice is most important cereal food source in terms of calories provided per capita and waste corresponds to one quarter or more of amount supplied for food
R4 Export dependency: Countries in which rice is most important cereal food source in terms of calories provided per capita and an amount corresponding to more than 10% of production is exported
Data Source: FAOSTAT, 2014. Solid bars indicate food insecure countries (grouping C – kcal/cap/day lower than 90% of the global
average and low income), transparent bars display countries in groupings A (kcal/cap/day higher than the global average, high
income) or B (kcal/cap/day at least 90% of global average and low income). All values on the vertical primary axis in kg/per
capita/year, the secondary axis in Figure M2 displays the share of t of animal products in human nutrition (tons per ton). Countries
are grouped from high to low levels of conflict potential from left to right on the horizontal axis. Please note that different scales are
used on the vertical axes.
Production quantity (kg/cap/yr)
Export quantity (kg/cap/yr) Stock variation (kg/cap/yr) Import quantity (kg/cap/yr)
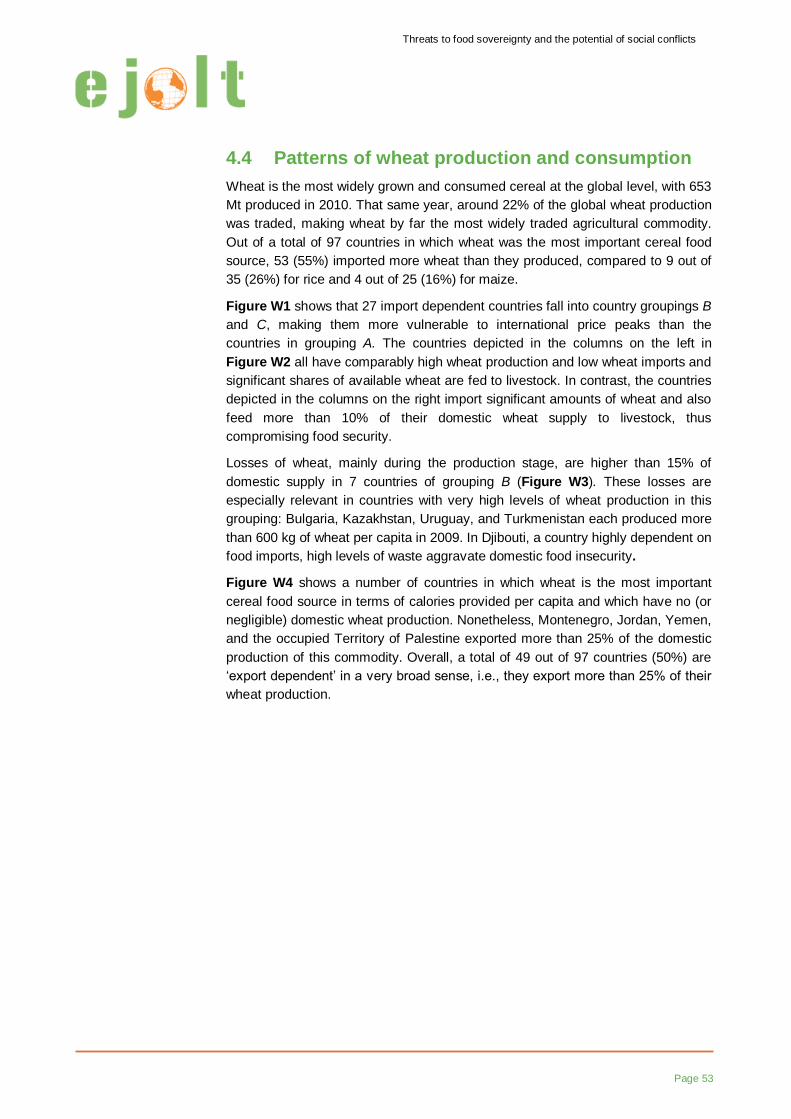
Threats to food sovereignty and the potential of social conflicts
Page 53
4.4 Patterns of wheat production and consumption
Wheat is the most widely grown and consumed cereal at the global level, with 653
Mt produced in 2010. That same year, around 22% of the global wheat production
was traded, making wheat by far the most widely traded agricultural commodity.
Out of a total of 97 countries in which wheat was the most important cereal food
source, 53 (55%) imported more wheat than they produced, compared to 9 out of
35 (26%) for rice and 4 out of 25 (16%) for maize.
Figure W1 shows that 27 import dependent countries fall into country groupings B
and C, making them more vulnerable to international price peaks than the
countries in grouping A. The countries depicted in the columns on the left in
Figure W2 all have comparably high wheat production and low wheat imports and
significant shares of available wheat are fed to livestock. In contrast, the countries
depicted in the columns on the right import significant amounts of wheat and also
feed more than 10% of their domestic wheat supply to livestock, thus
compromising food security.
Losses of wheat, mainly during the production stage, are higher than 15% of
domestic supply in 7 countries of grouping B (Figure W3). These losses are
especially relevant in countries with very high levels of wheat production in this
grouping: Bulgaria, Kazakhstan, Uruguay, and Turkmenistan each produced more
than 600 kg of wheat per capita in 2009. In Djibouti, a country highly dependent on
food imports, high levels of waste aggravate domestic food insecurity.
Figure W4 shows a number of countries in which wheat is the most important
cereal food source in terms of calories provided per capita and which have no (or
negligible) domestic wheat production. Nonetheless, Montenegro, Jordan, Yemen,
and the occupied Territory of Palestine exported more than 25% of the domestic
production of this commodity. Overall, a total of 49 out of 97 countries (50%) are
‘export dependent’ in a very broad sense, i.e., they export more than 25% of their
wheat production.
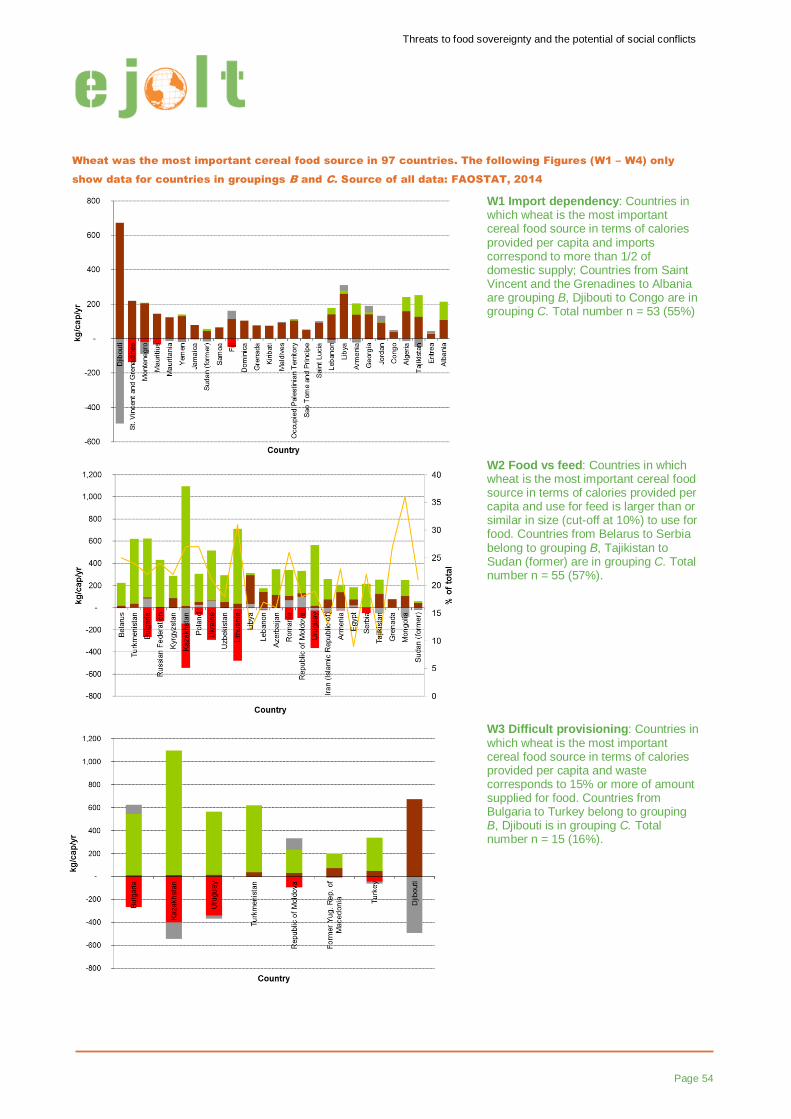
Threats to food sovereignty and the potential of social conflicts
Page 54
Wheat was the most important cereal food source in 97 countries. The following Figures (W1 – W4) only
show data for countries in groupings B and C. Source of all data: FAOSTAT, 2014
W1 Import dependency: Countries in which wheat is the most important cereal food source in terms of calories provided per capita and imports correspond to more than 1/2 of domestic supply; Countries from Saint Vincent and the Grenadines to Albania are grouping B, Djibouti to Congo are in grouping C. Total number n = 53 (55%)
W2 Food vs feed: Countries in which wheat is the most important cereal food source in terms of calories provided per capita and use for feed is larger than or similar in size (cut-off at 10%) to use for food. Countries from Belarus to Serbia belong to grouping B, Tajikistan to Sudan (former) are in grouping C. Total number n = 55 (57%).
W3 Difficult provisioning: Countries in which wheat is the most important cereal food source in terms of calories provided per capita and waste corresponds to 15% or more of amount supplied for food. Countries from Bulgaria to Turkey belong to grouping B, Djibouti is in grouping C. Total number n = 15 (16%).
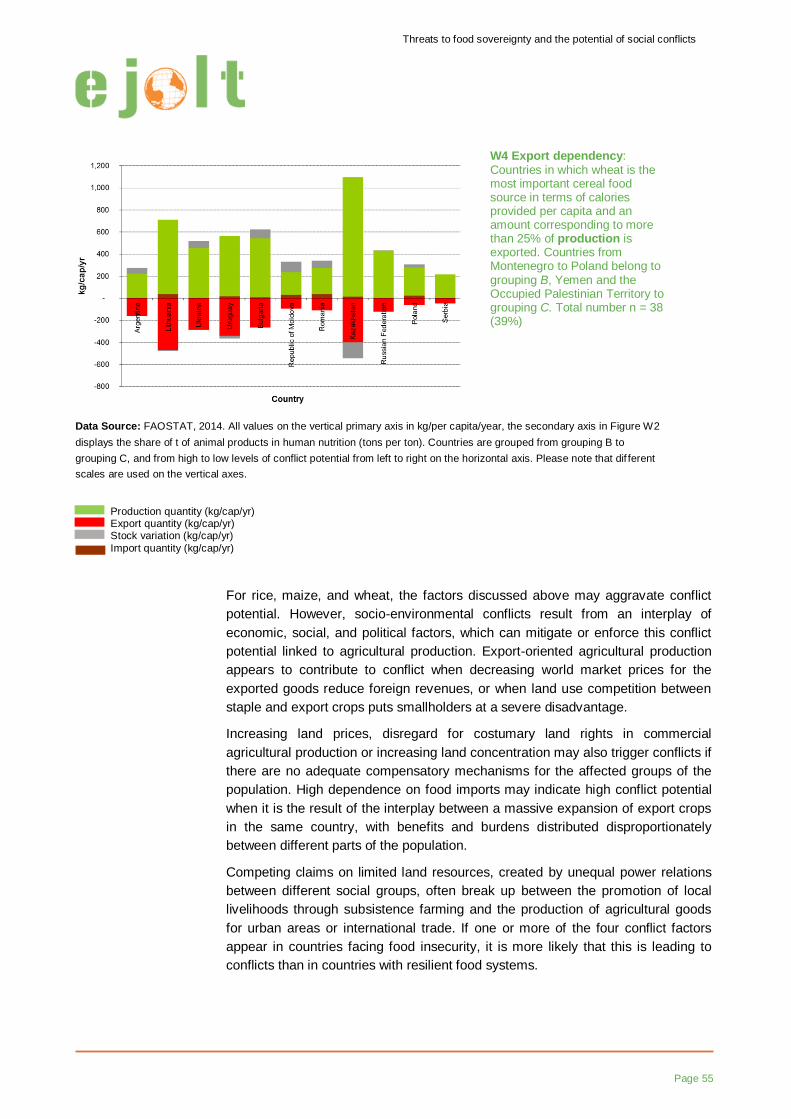
Threats to food sovereignty and the potential of social conflicts
Page 55
W4 Export dependency: Countries in which wheat is the most important cereal food source in terms of calories provided per capita and an amount corresponding to more than 25% of production is exported. Countries from Montenegro to Poland belong to grouping B, Yemen and the Occupied Palestinian Territory to grouping C. Total number n = 38 (39%)
Data Source: FAOSTAT, 2014. All values on the vertical primary axis in kg/per capita/year, the secondary axis in Figure W2
displays the share of t of animal products in human nutrition (tons per ton). Countries are grouped from grouping B to
grouping C, and from high to low levels of conflict potential from left to right on the horizontal axis. Please note that dif ferent
scales are used on the vertical axes.
Production quantity (kg/cap/yr) Export quantity (kg/cap/yr) Stock variation (kg/cap/yr)
Import quantity (kg/cap/yr)
For rice, maize, and wheat, the factors discussed above may aggravate conflict
potential. However, socio-environmental conflicts result from an interplay of
economic, social, and political factors, which can mitigate or enforce this conflict
potential linked to agricultural production. Export-oriented agricultural production
appears to contribute to conflict when decreasing world market prices for the
exported goods reduce foreign revenues, or when land use competition between
staple and export crops puts smallholders at a severe disadvantage.
Increasing land prices, disregard for costumary land rights in commercial
agricultural production or increasing land concentration may also trigger conflicts if
there are no adequate compensatory mechanisms for the affected groups of the
population. High dependence on food imports may indicate high conflict potential
when it is the result of the interplay between a massive expansion of export crops
in the same country, with benefits and burdens distributed disproportionately
between different parts of the population.
Competing claims on limited land resources, created by unequal power relations
between different social groups, often break up between the promotion of local
livelihoods through subsistence farming and the production of agricultural goods
for urban areas or international trade. If one or more of the four conflict factors
appear in countries facing food insecurity, it is more likely that this is leading to
conflicts than in countries with resilient food systems.
Country case studies
Page 56
5
Country
case studies
The following chapter provides three different country case studies, one from
Southeast Asia (Indonesia), one from Latin America (Paraguay), and one from
Sub-Saharan Africa (Ethiopia). This selection allows us to specifically examine
three countries with increasing exports of primary agricultural products. Paraguay
and Indonesia are examples of countries with a history of biomass exports and
Ethiopia is considered to have considerable potential for further expand its
biomass production and exports.
5.1 Power over land: The expansion of oil palm plantations in Indonesia9
The EJOLT environmental justice atlas currently documents 27 cases of
environmental conflict in Indonesia, out of which 24 are related to biomass
extraction and/or are land conflicts. The following case study of the expansion of
oil palm plantations documents some of the history of control over land in
Indonesia during the second half of the 20th century. While the significance of
limited access to land in sparking conflict is commonly considered, the
development of plantation agriculture in this Southeast Asian country further
shows that limiting access to land may also be a strategy for avoiding (or
postponing) conflict as well as a reaction to perceived injustices in prevailing forms
of land control and use.
5.1.1 Indonesia’s booming palm oil production
In terms of the quantity consumed, palm oil is one of the most important edible
vegetable oils. It is used both for cooking and as an ingredient in many processed
foods. More than 50% of palm oil produced globally is, however, used for
industrial purposes, mainly in soaps and cosmetics but also increasingly as a
feedstock for the production of agrodiesel. Palm plantations are considered the
fastest growing monoculture in the world (Gerber, 2011) and almost half of global
9 Chapter 5.1 was written by Anke Schaffartzik, Alina Brad, Melanie Pichler, and Christina Plank
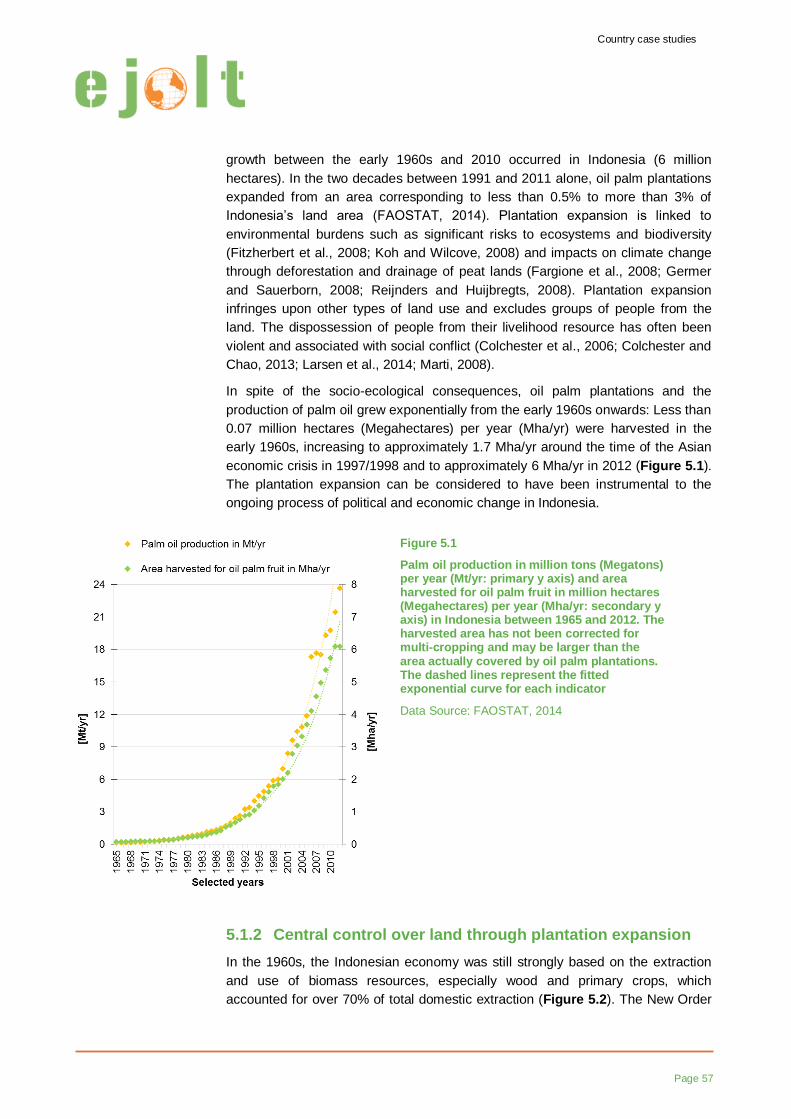
Country case studies
Page 57
growth between the early 1960s and 2010 occurred in Indonesia (6 million
hectares). In the two decades between 1991 and 2011 alone, oil palm plantations
expanded from an area corresponding to less than 0.5% to more than 3% of
Indonesia’s land area (FAOSTAT, 2014). Plantation expansion is linked to
environmental burdens such as significant risks to ecosystems and biodiversity
(Fitzherbert et al., 2008; Koh and Wilcove, 2008) and impacts on climate change
through deforestation and drainage of peat lands (Fargione et al., 2008; Germer
and Sauerborn, 2008; Reijnders and Huijbregts, 2008). Plantation expansion
infringes upon other types of land use and excludes groups of people from the
land. The dispossession of people from their livelihood resource has often been
violent and associated with social conflict (Colchester et al., 2006; Colchester and
Chao, 2013; Larsen et al., 2014; Marti, 2008).
In spite of the socio-ecological consequences, oil palm plantations and the
production of palm oil grew exponentially from the early 1960s onwards: Less than
0.07 million hectares (Megahectares) per year (Mha/yr) were harvested in the
early 1960s, increasing to approximately 1.7 Mha/yr around the time of the Asian
economic crisis in 1997/1998 and to approximately 6 Mha/yr in 2012 (Figure 5.1).
The plantation expansion can be considered to have been instrumental to the
ongoing process of political and economic change in Indonesia.
5.1.2 Central control over land through plantation expansion
In the 1960s, the Indonesian economy was still strongly based on the extraction
and use of biomass resources, especially wood and primary crops, which
accounted for over 70% of total domestic extraction (Figure 5.2). The New Order
Figure 5.1
Palm oil production in million tons (Megatons) per year (Mt/yr: primary y axis) and area harvested for oil palm fruit in million hectares (Megahectares) per year (Mha/yr: secondary y axis) in Indonesia between 1965 and 2012. The harvested area has not been corrected for multi-cropping and may be larger than the area actually covered by oil palm plantations. The dashed lines represent the fitted exponential curve for each indicator
Data Source: FAOSTAT, 2014
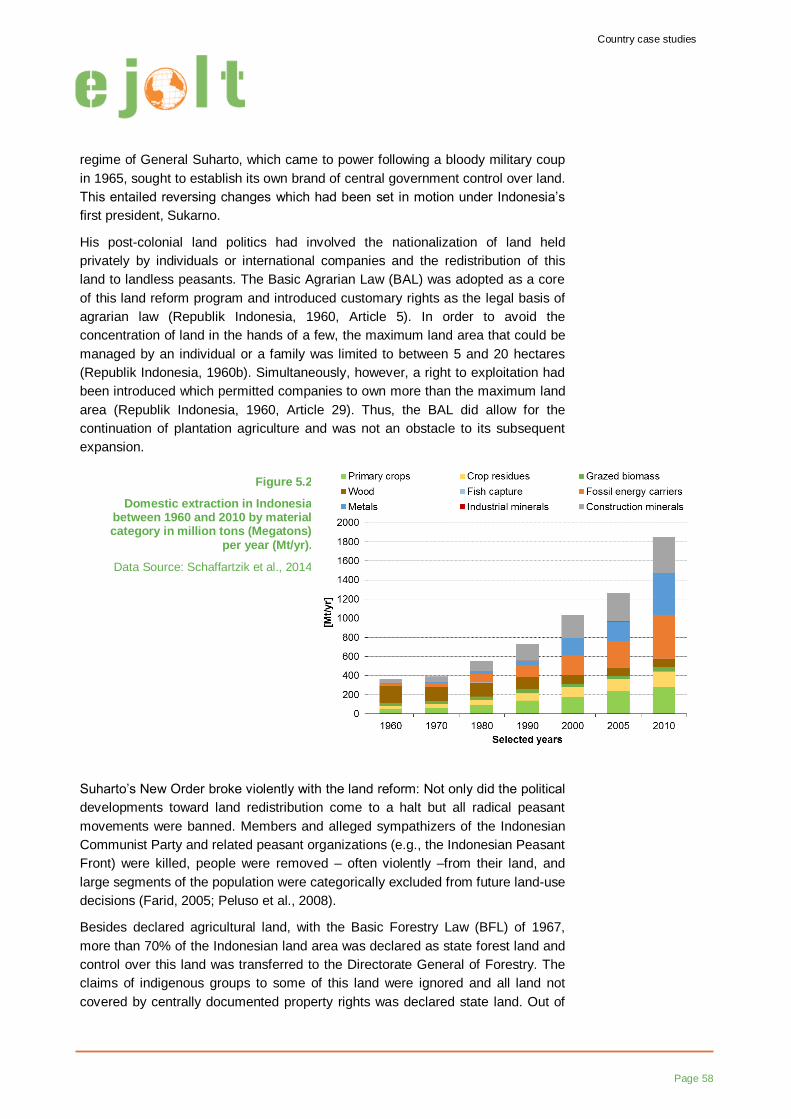
Country case studies
Page 58
regime of General Suharto, which came to power following a bloody military coup
in 1965, sought to establish its own brand of central government control over land.
This entailed reversing changes which had been set in motion under Indonesia’s
first president, Sukarno.
His post-colonial land politics had involved the nationalization of land held
privately by individuals or international companies and the redistribution of this
land to landless peasants. The Basic Agrarian Law (BAL) was adopted as a core
of this land reform program and introduced customary rights as the legal basis of
agrarian law (Republik Indonesia, 1960, Article 5). In order to avoid the
concentration of land in the hands of a few, the maximum land area that could be
managed by an individual or a family was limited to between 5 and 20 hectares
(Republik Indonesia, 1960b). Simultaneously, however, a right to exploitation had
been introduced which permitted companies to own more than the maximum land
area (Republik Indonesia, 1960, Article 29). Thus, the BAL did allow for the
continuation of plantation agriculture and was not an obstacle to its subsequent
expansion.
Suharto’s New Order broke violently with the land reform: Not only did the political
developments toward land redistribution come to a halt but all radical peasant
movements were banned. Members and alleged sympathizers of the Indonesian
Communist Party and related peasant organizations (e.g., the Indonesian Peasant
Front) were killed, people were removed – often violently –from their land, and
large segments of the population were categorically excluded from future land-use
decisions (Farid, 2005; Peluso et al., 2008).
Besides declared agricultural land, with the Basic Forestry Law (BFL) of 1967,
more than 70% of the Indonesian land area was declared as state forest land and
control over this land was transferred to the Directorate General of Forestry. The
claims of indigenous groups to some of this land were ignored and all land not
covered by centrally documented property rights was declared state land. Out of
Figure 5.2
Domestic extraction in Indonesia between 1960 and 2010 by material category in million tons (Megatons)
per year (Mt/yr).
Data Source: Schaffartzik et al., 2014
Country case studies
Page 59
this state forest land, more than two thirds (over 90 Mha) were classified as
production land, allowing for the establishment of commercial logging as a major
pillar of the Indonesian economy and, in 1970, more than 140 Mt of wood
(corresponding to more than one third of the country’s total domestic extraction)
were harvested from Indonesia’s forests (Figure 5.2).
The dispossession of people and the classification of land, for which the BFL
provided the legal preconditions, further facilitated the expansion of plantations
into fallows, grasslands, scrub, and secondary forests (Colchester et al., 2006).
Through the instrument of contract farming, the expansion of plantation agriculture
was useful to the central government in extending its control to provinces beyond
Jakarta and islands other than Java10
and, by extension, to the rural population.
Smallholders were integrated into a core-smallholder scheme of plantation
agriculture with plots of approximately two hectares per family, in a core-to-
smallholder ratio of about 20:80 or 30:70 (Zen, Barlow, and Gondowarsito 2005).
The core plantation was either state-owned or strongly tied to the central
government which assisted the company in gaining access to land, by developing
infrastructure, and providing subsidized capital for plantation development.
Under Suharto’s New Order, oil palm plantations grew at high rates of
approximately 6% per year (Figure 5.1) while the overall income from the
agriculture sector continuously fell from over 50% of GDP in 1965 to 36% in 1976
(Pitt, 1980). Fossil energy carriers, especially crude petroleum, were becoming an
increasingly important source of income: With the oil crises of the early 1970s,
Indonesia significantly increased its exports of fossil fuels which accounted for
80% of Indonesia’s physical exports by 1980 (Schaffartzik et al., 2014b).
Revenues from petroleum increased the budget of the Indonesian economy and,
along with long-term loans procured by the government, allowed for greater
financial investments into agriculture. With the goal of decreasing the country’s
dependency on imports and aid to provide rice, its most important staple11
, a
‘Green Revolution’12
(promoted in Indonesia by the World Bank and the Asian
Development Bank) was implemented.
Following requirements made by the loan-granting banks, the higher outputs of
agricultural commodities (also see Figure 5.2) were almost exclusively dedicated
to export: While only 2% of Indonesia’s physical exports were of biomass origin in
1960, this share rose continuously to 10% by 1990 (Schaffartzik et al., 2014b).
High levels of domestic and foreign demand for palm oil provided an incentive for
10
Until 1980, oil palm plantations were essentially confined to three provinces in northern Sumatra
where they followed in the trodden paths of colonial rubber plantations (Kementerian Pertanian
Republik Indonesia, 2013). 11
For a general discussion of the relevance of import-dependence for staple crops, see also Section 3
of this report. 12
The ‘Green Revolution’ was essentially aimed at establishing a high-input high-output agricultural
system in which higher yields were to be achieved through the use of fertilizers, pesticides and
herbicides, agricultural technology, and new crops types along with efficient management
techniques.
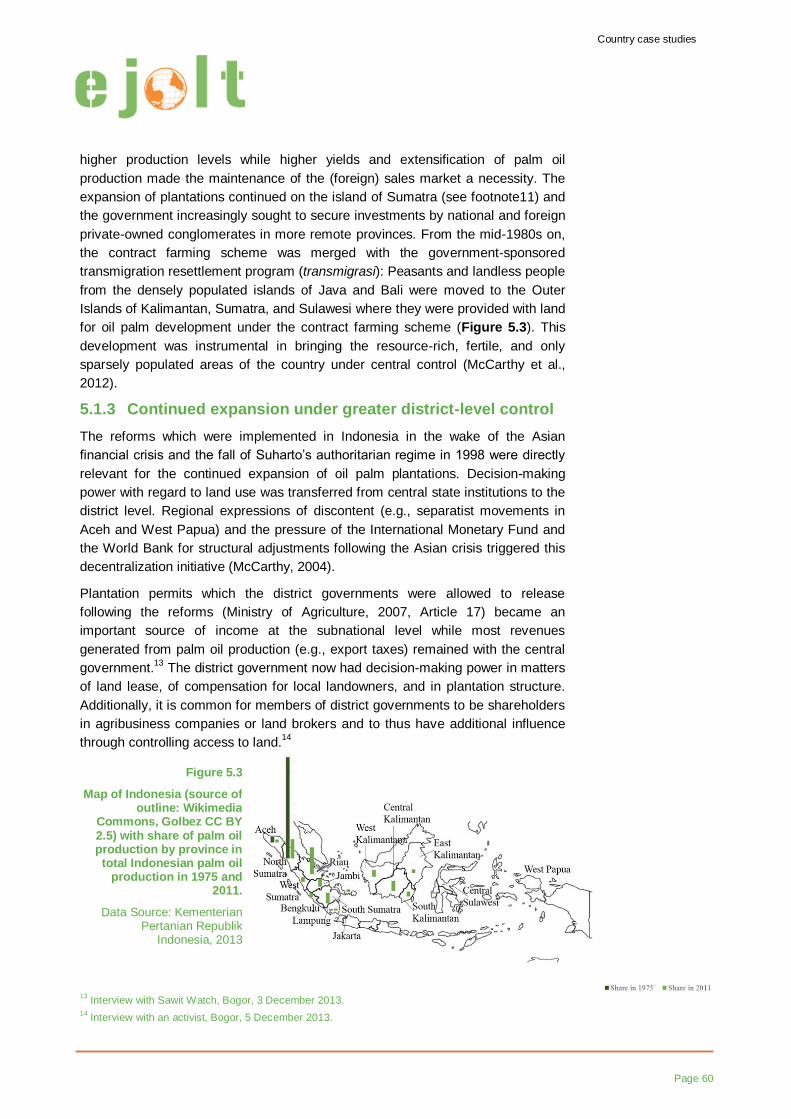
Country case studies
Page 60
higher production levels while higher yields and extensification of palm oil
production made the maintenance of the (foreign) sales market a necessity. The
expansion of plantations continued on the island of Sumatra (see footnote11) and
the government increasingly sought to secure investments by national and foreign
private-owned conglomerates in more remote provinces. From the mid-1980s on,
the contract farming scheme was merged with the government-sponsored
transmigration resettlement program (transmigrasi): Peasants and landless people
from the densely populated islands of Java and Bali were moved to the Outer
Islands of Kalimantan, Sumatra, and Sulawesi where they were provided with land
for oil palm development under the contract farming scheme (Figure 5.3). This
development was instrumental in bringing the resource-rich, fertile, and only
sparsely populated areas of the country under central control (McCarthy et al.,
2012).
5.1.3 Continued expansion under greater district-level control
The reforms which were implemented in Indonesia in the wake of the Asian
financial crisis and the fall of Suharto’s authoritarian regime in 1998 were directly
relevant for the continued expansion of oil palm plantations. Decision-making
power with regard to land use was transferred from central state institutions to the
district level. Regional expressions of discontent (e.g., separatist movements in
Aceh and West Papua) and the pressure of the International Monetary Fund and
the World Bank for structural adjustments following the Asian crisis triggered this
decentralization initiative (McCarthy, 2004).
Plantation permits which the district governments were allowed to release
following the reforms (Ministry of Agriculture, 2007, Article 17) became an
important source of income at the subnational level while most revenues
generated from palm oil production (e.g., export taxes) remained with the central
government.13
The district government now had decision-making power in matters
of land lease, of compensation for local landowners, and in plantation structure.
Additionally, it is common for members of district governments to be shareholders
in agribusiness companies or land brokers and to thus have additional influence
through controlling access to land.14
13
Interview with Sawit Watch, Bogor, 3 December 2013. 14
Interview with an activist, Bogor, 5 December 2013.
Figure 5.3
Map of Indonesia (source of outline: Wikimedia
Commons, Golbez CC BY 2.5) with share of palm oil production by province in total Indonesian palm oil
production in 1975 and 2011.
Data Source: Kementerian Pertanian Republik
Indonesia, 2013
Country case studies
Page 61
During this period, the previous core-smallholder scheme of plantation agriculture
was replaced by a so-called partnership model with which the Indonesian
government sought to attract private investment in the plantation sector. The core
company now held approximately 80% of the jointly managed plantation area and
only 20% was allocated to smallholders (McCarthy et al., 2012).
Unlike in former contract farming schemes, the companies were entitled to
negotiate access to and integration of land into the plantation structure directly
with local landowners (Republik Indonesia, 2004, Article 9). Dividends of the
plantation’s profit, promised in return for the loss of land, attracted landowners to
this scheme (Li, 2011). Between 2001 and 2010, the number of smallholders tied
to plantation companies as contract farmers increased by 140% (Badan Pusat
Statistik, 2012).
During the reform period, biomass resources contributed decreasing shares to
total material extraction in Indonesia: From over one half of domestic extraction in
1990, biomass decreased to under one third by 2010 (Figure 5.2). Palm oil
production, nonetheless, continued to grow at unprecedented rates (Figure 5.1).
This growth was partially driven by an increasing domestic and foreign demand for
Indonesian palm oil. Especially in the South-Eastern Asia region, this oil was one
of the most important feedstocks in the production of agrodiesel (Zhou and
Thomson, 2009); internationally, the growing use of other vegetable oils (rape
seed, soybean, sunflower) for agrodiesel production necessitated a substitute for
these oils in human nutrition and other industrial uses.
As palm oil production grew, plantations expanded farther into the Outer Islands
and into economically less developed regions and districts (see Figure 5.3). While
in 1975, almost 90% of oil palm plantation land was located in one province (North
Sumatra), in 2011, the largest share of oil palm plantation area (21%) was in the
Riau province (on the island of Sumatra) and 31% of all oil palm plantation area
was on the island of Kalimantan (Kementerian Pertanian Republik Indonesia,
2013). Overall, out of the 6 million hectares on which oil palm plantations in
Indonesia expanded between 1962 and 2012, more than 70%, or 4.3 million
hectares, were planted during the last 14 years alone (FAOSTAT, 2014).
5.1.4 Competing land claims and conflicts
According to the Indonesian NGO Sawit Watch, a great deal of the expansion of
oil palm plantations occurred on contested lands. During Suharto’s authoritarian
regime, competing claims to land were not resolved but suppressed and conflict
potential with regard to land was and is generally high. That this potential
becomes manifest is documented in the EJOLT environmental justice atlas. The
exclusion of certain groups of people from land-use decisions was upheld during
the reform period, fostering struggles to (re)claim land for other people and/or
other uses. Several different claims have been made to land in the context of
plantation expansion in Indonesia. They can be distinguished by the group(s)
which make(s) the respective claim and by the argument on which they base their
claim.
Country case studies
Page 62
Customary land rights
Since the colonial period, customary land tenure, which is generally recognized by
both the Indonesian Constitution and the BAL, was largely ignored. Customary
rights were violated by several laws and regulations – especially the Basic
Forestry Law (BFL, see 5.2.2.). Under Suharto, resistance to large-scale
dispossession was violently suppressed. The greater political freedom of the
reform period was conducive to the reassertion of the claim to customary land
rights (Benda-Beckmann and Benda-Beckmann, 2010). Intense lobbying on the
part of the Alliance of Indigenous Peoples (AMAN – Aliansi Masyarakat Adat
Nusantara)15
and other civil society organizations led to a landmark ruling of the
Constitutional Court in 2013 according to which forest land covered by customary
rights was to be excluded from state forest land. This ruling provided indigenous
people and their representatives with a recognized legal basis for an alternative
mode of access to and control over land.
Social justice
The redistribution of land to peasants and landless poor has been identified as a
prerequisite for social justice and food sovereignty (also see Chapter 6 of this
report). In Indonesia, agrarian movements such as the Indonesian Peasant Union
(SPI – Serikat Petani Indonesia) and the Consortium for Agrarian Reform (KPA –
Konsorsium Pembaruan Agraria) actively lobby for a new attempt at the
implementation of land redistribution as outlined in the post-colonial land reform
program. During New Order, the program of the Basic Agrarian Law (Republik
Indonesia, 1960), was implemented only selectively, focusing on the
dispossession of people for the sake of national development. While agrarian
movements were violently suppressed under New Order, the reform period re-
opened some political maneuvering room and brought agrarian reform initiatives
back to the agenda.16
Next to lobbying in state institutions, the claim has also
been pursued via land occupation and settlement projects of landless farmers.
Economic growth
International financial institutions such as the World Bank as well as the
Indonesian National Land Agency call for the redistribution of land in favour of
individual land titles and deem the current rate of state control over land to be
excessive. The resulting free land market would, so goes the claim, lead to
economic growth (e.g., World Bank, 2014). Although the agrarian movement (see
above) had intensively lobbied with the central government for comprehensive
agrarian reform and redistribution of land within the Land Management and Policy
Development Project, funded by the World Bank, the National Land Agency has
basically only issued land titles for those already using state land (Rachman,
2011). Approximately 1 million land titles were issued between 2004 and 2009
15
For more information see: http://www.aman.or.id/ 16
Interview with KPA, Jakarta, 12 July 2011.
Country case studies
Page 63
(Waren and Lucas, 2013), securing land tenure for some and simultaneously
establishing a land market.
Environmental protection
International organizations like Conservation International or the World Wildlife
Fund (WWF) call for the establishment of nature conservation reserves and
wildlife corridors in Indonesia (Maddox et al., 2007) in order to protect the local
and the global environment. They argue that the deforestation associated with
plantation expansion must be stopped and that nature conservation in some
regions requires the prohibition of agricultural and foraging activities altogether. In
the past, these claims have had to be asserted by violent means: Nature reserves
depend on the police, the military or private security companies to enforce
boundaries and limit access. Conflicts have arisen, for example, between claims
to land for ecosystem restoration and for subsistence agriculture and livelihood
purposes.
The expansion of oil palm plantations in Indonesia continues to threaten rural
livelihoods and cause irreversible environmental damage. The rate and degree of
this expansion was largely enabled through state control over land and thus over
access to resources. Government control over land in Indonesia has been
instrumental not only in securing this access to resources but also in keeping the
multi-ethnic Indonesian population in the 15th largest country in the world,
dispersed on over 18,000 islands, under some form of central control. The
expansion of plantation agriculture in Indonesia must therefore be understood not
only as a potential source of conflict but also as a response to the perceived
potential for conflict. The political and economic conditions under which this
expansion could occur must be understood within the context of the exerted power
over both nature and people which they represent. Better understanding these
power relations is paramount to understanding both the causes of and potential
responses to environmental conflicts in Indonesia.
Country case studies
Page 64
5.2 The republic of soy – agricultural development in Paraguay17
The agricultural system of Paraguay has been rapidly industrializing within the last
15 years. Three main factors have primarily shaped this development: (1) the
increasing market- and export-orientation of soy production, (2) growing land
concentration - especially by foreign investment from neighbouring Brazil in border
zones, and (3) the rapid replacement of family farming by agribusinesses
(Galeano, 2012). We will describe economic and political features of the
agricultural and the food system of Paraguay and how these developments
evolved over the last 40 years, especially since the introduction of soybeans. We
will then investigate how these developments have influenced international trade
patterns of this country. We conclude this section by discussing these
developments together with environmental conflicts in Paraguay.
Paraguay is a landlocked country, which is bordered and crossed by navigable
rivers: the Rio Paraguay splits the country into eastern and western regions. The
eastern region is officially called Eastern Paraguay (‘Paraguay Oriental’) and also
identified as the Paranena region. The western region is officially named Western
Paraguay (‘Paraguay Occidental’) and also called the Chaco. As the Paranena
region extends towards the south and the Chaco region to the north, the country
experiences both subtropical and tropical climates. Paraguay’s natural regions are
also defined by the regions of Paranena and Chaco. The first one is a combination
of plateaus, rolling hills, and valleys and the Chaco is a vast piedmont plain. Close
to 95% of Paraguay's population lives in the Paranena region, having all the major
orographic types and the more predictable climate. Paraguay is surrounded by
three significantly larger countries: Bolivia, Argentina, and Brazil.
5.2.1 Eating up the land – biophysical and socioeconomic characteristics of Paraguay
Paraguay is one of the smallest countries in South America. Despite intense
internal migration to urban areas, it remains a country in which 40% of the
population live in rural areas in 2013 (Figure 5.6) and its economic growth is
mainly based on agriculture, the exports of which (mainly soybeans and beef)
represent about 80% of all exports in physical terms. The growth of GDP in
Paraguay reached annual rates up to 10% in the last decade, while in 2009 and
2012, growth rates were even negative (World Bank, 2015). Paraguay is the sixth
largest producer and the fourth largest exporter of soybeans in the world. Despite
the rapid economic growth, there is doubt that the economic benefits are
distributed equally among the population, as a very high Gini index documents
(Guereña, 2013)
Figures 5.4a and 5.4b display the biophysical patterns of the apparent
consumption (domestic material consumption DMC) in Paraguay between 1960
and 2010. Figure 5.4a clearly indicates that, at 90%, biomass dominates DMC,
17
Chapter 5.2 was written by Arnulfo Rojas Sepulveda and Andreas Mayer
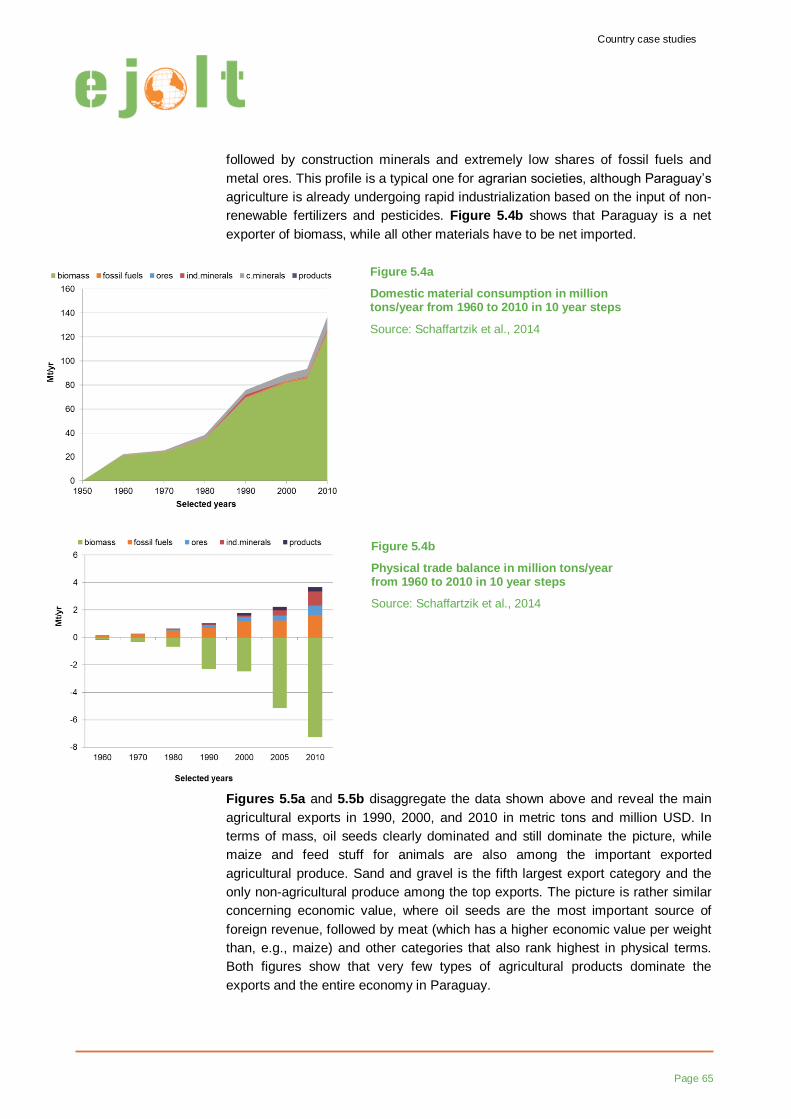
Country case studies
Page 65
followed by construction minerals and extremely low shares of fossil fuels and
metal ores. This profile is a typical one for agrarian societies, although Paraguay’s
agriculture is already undergoing rapid industrialization based on the input of non-
renewable fertilizers and pesticides. Figure 5.4b shows that Paraguay is a net
exporter of biomass, while all other materials have to be net imported.
Figures 5.5a and 5.5b disaggregate the data shown above and reveal the main
agricultural exports in 1990, 2000, and 2010 in metric tons and million USD. In
terms of mass, oil seeds clearly dominated and still dominate the picture, while
maize and feed stuff for animals are also among the important exported
agricultural produce. Sand and gravel is the fifth largest export category and the
only non-agricultural produce among the top exports. The picture is rather similar
concerning economic value, where oil seeds are the most important source of
foreign revenue, followed by meat (which has a higher economic value per weight
than, e.g., maize) and other categories that also rank highest in physical terms.
Both figures show that very few types of agricultural products dominate the
exports and the entire economy in Paraguay.
Figure 5.4a
Domestic material consumption in million tons/year from 1960 to 2010 in 10 year steps
Source: Schaffartzik et al., 2014
Figure 5.4b
Physical trade balance in million tons/year from 1960 to 2010 in 10 year steps
Source: Schaffartzik et al., 2014
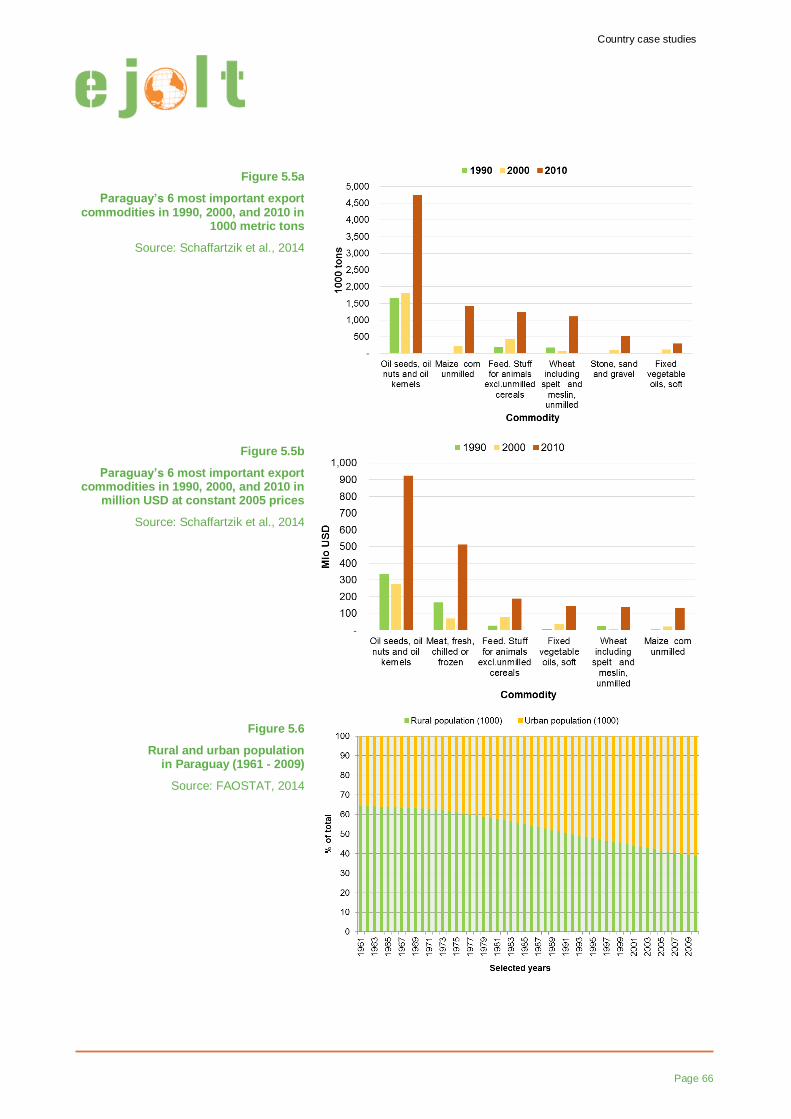
Country case studies
Page 66
Figure 5.5a
Paraguay’s 6 most important export commodities in 1990, 2000, and 2010 in
1000 metric tons
Source: Schaffartzik et al., 2014
Figure 5.5b
Paraguay’s 6 most important export commodities in 1990, 2000, and 2010 in
million USD at constant 2005 prices
Source: Schaffartzik et al., 2014
Figure 5.6
Rural and urban population in Paraguay (1961 - 2009)
Source: FAOSTAT, 2014
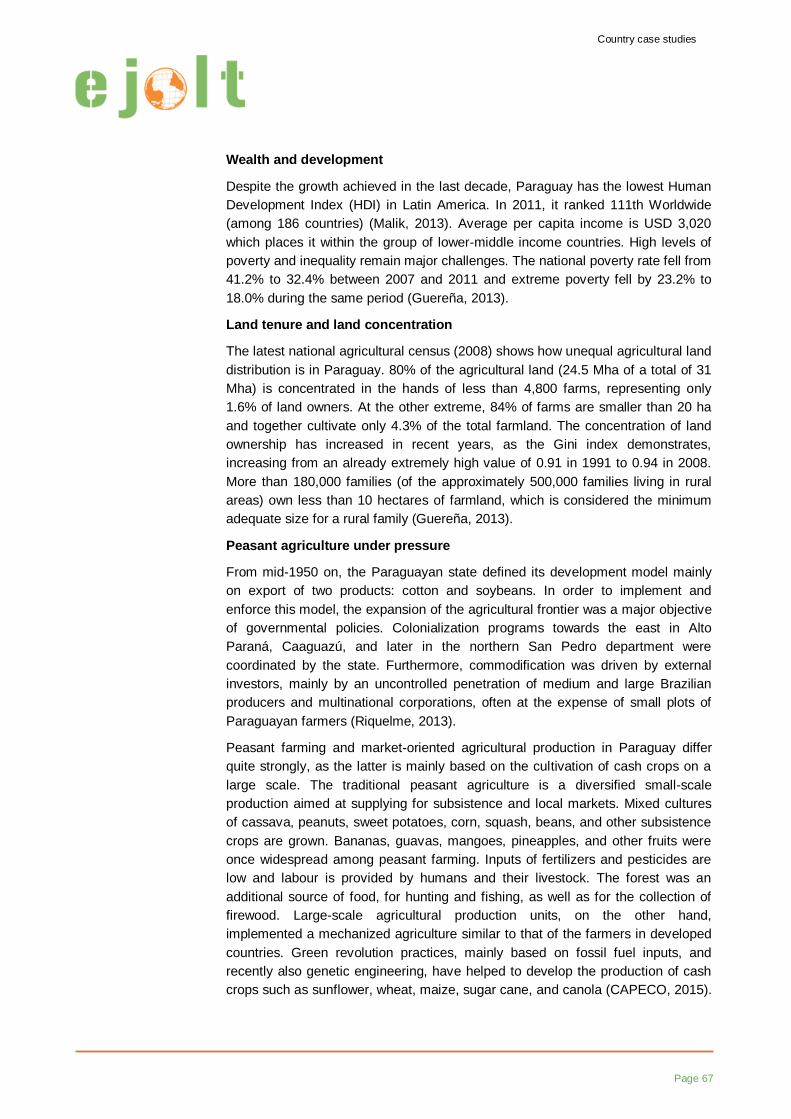
Country case studies
Page 67
Wealth and development
Despite the growth achieved in the last decade, Paraguay has the lowest Human
Development Index (HDI) in Latin America. In 2011, it ranked 111th Worldwide
(among 186 countries) (Malik, 2013). Average per capita income is USD 3,020
which places it within the group of lower-middle income countries. High levels of
poverty and inequality remain major challenges. The national poverty rate fell from
41.2% to 32.4% between 2007 and 2011 and extreme poverty fell by 23.2% to
18.0% during the same period (Guereña, 2013).
Land tenure and land concentration
The latest national agricultural census (2008) shows how unequal agricultural land
distribution is in Paraguay. 80% of the agricultural land (24.5 Mha of a total of 31
Mha) is concentrated in the hands of less than 4,800 farms, representing only
1.6% of land owners. At the other extreme, 84% of farms are smaller than 20 ha
and together cultivate only 4.3% of the total farmland. The concentration of land
ownership has increased in recent years, as the Gini index demonstrates,
increasing from an already extremely high value of 0.91 in 1991 to 0.94 in 2008.
More than 180,000 families (of the approximately 500,000 families living in rural
areas) own less than 10 hectares of farmland, which is considered the minimum
adequate size for a rural family (Guereña, 2013).
Peasant agriculture under pressure
From mid-1950 on, the Paraguayan state defined its development model mainly
on export of two products: cotton and soybeans. In order to implement and
enforce this model, the expansion of the agricultural frontier was a major objective
of governmental policies. Colonialization programs towards the east in Alto
Paraná, Caaguazú, and later in the northern San Pedro department were
coordinated by the state. Furthermore, commodification was driven by external
investors, mainly by an uncontrolled penetration of medium and large Brazilian
producers and multinational corporations, often at the expense of small plots of
Paraguayan farmers (Riquelme, 2013).
Peasant farming and market-oriented agricultural production in Paraguay differ
quite strongly, as the latter is mainly based on the cultivation of cash crops on a
large scale. The traditional peasant agriculture is a diversified small-scale
production aimed at supplying for subsistence and local markets. Mixed cultures
of cassava, peanuts, sweet potatoes, corn, squash, beans, and other subsistence
crops are grown. Bananas, guavas, mangoes, pineapples, and other fruits were
once widespread among peasant farming. Inputs of fertilizers and pesticides are
low and labour is provided by humans and their livestock. The forest was an
additional source of food, for hunting and fishing, as well as for the collection of
firewood. Large-scale agricultural production units, on the other hand,
implemented a mechanized agriculture similar to that of the farmers in developed
countries. Green revolution practices, mainly based on fossil fuel inputs, and
recently also genetic engineering, have helped to develop the production of cash
crops such as sunflower, wheat, maize, sugar cane, and canola (CAPECO, 2015).
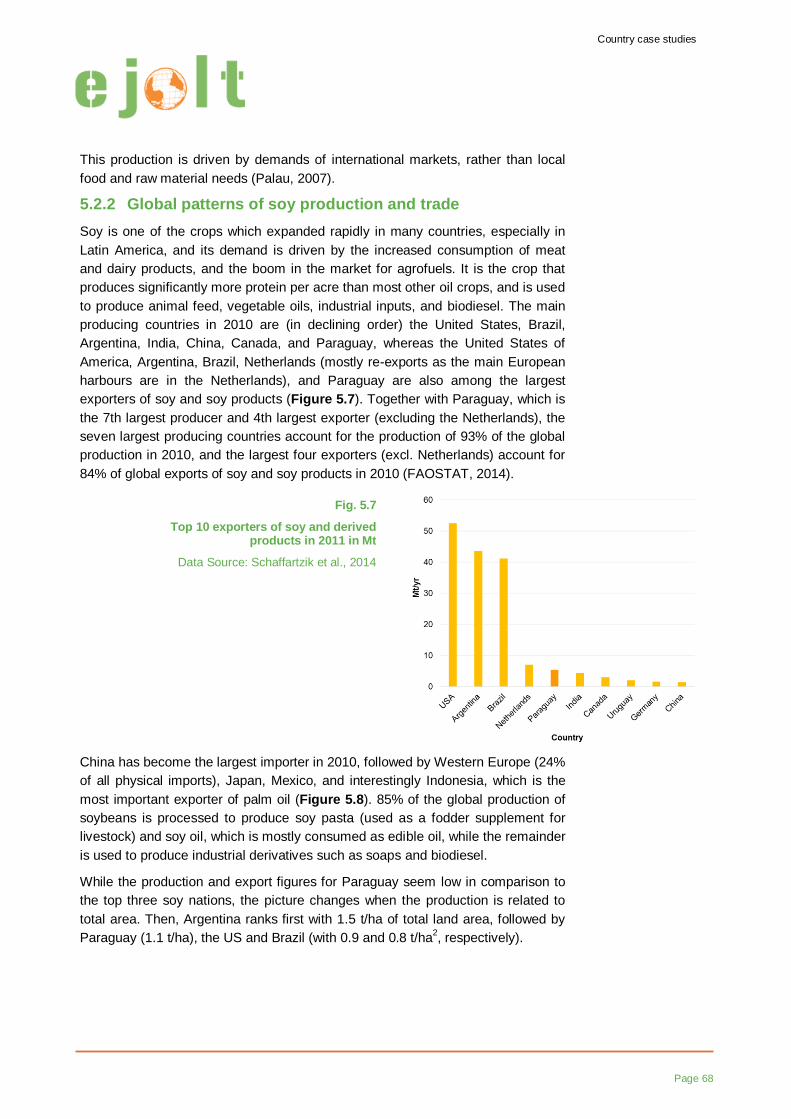
Country case studies
Page 68
This production is driven by demands of international markets, rather than local
food and raw material needs (Palau, 2007).
5.2.2 Global patterns of soy production and trade
Soy is one of the crops which expanded rapidly in many countries, especially in
Latin America, and its demand is driven by the increased consumption of meat
and dairy products, and the boom in the market for agrofuels. It is the crop that
produces significantly more protein per acre than most other oil crops, and is used
to produce animal feed, vegetable oils, industrial inputs, and biodiesel. The main
producing countries in 2010 are (in declining order) the United States, Brazil,
Argentina, India, China, Canada, and Paraguay, whereas the United States of
America, Argentina, Brazil, Netherlands (mostly re-exports as the main European
harbours are in the Netherlands), and Paraguay are also among the largest
exporters of soy and soy products (Figure 5.7). Together with Paraguay, which is
the 7th largest producer and 4th largest exporter (excluding the Netherlands), the
seven largest producing countries account for the production of 93% of the global
production in 2010, and the largest four exporters (excl. Netherlands) account for
84% of global exports of soy and soy products in 2010 (FAOSTAT, 2014).
China has become the largest importer in 2010, followed by Western Europe (24%
of all physical imports), Japan, Mexico, and interestingly Indonesia, which is the
most important exporter of palm oil (Figure 5.8). 85% of the global production of
soybeans is processed to produce soy pasta (used as a fodder supplement for
livestock) and soy oil, which is mostly consumed as edible oil, while the remainder
is used to produce industrial derivatives such as soaps and biodiesel.
While the production and export figures for Paraguay seem low in comparison to
the top three soy nations, the picture changes when the production is related to
total area. Then, Argentina ranks first with 1.5 t/ha of total land area, followed by
Paraguay (1.1 t/ha), the US and Brazil (with 0.9 and 0.8 t/ha2, respectively).
Fig. 5.7
Top 10 exporters of soy and derived products in 2011 in Mt
Data Source: Schaffartzik et al., 2014
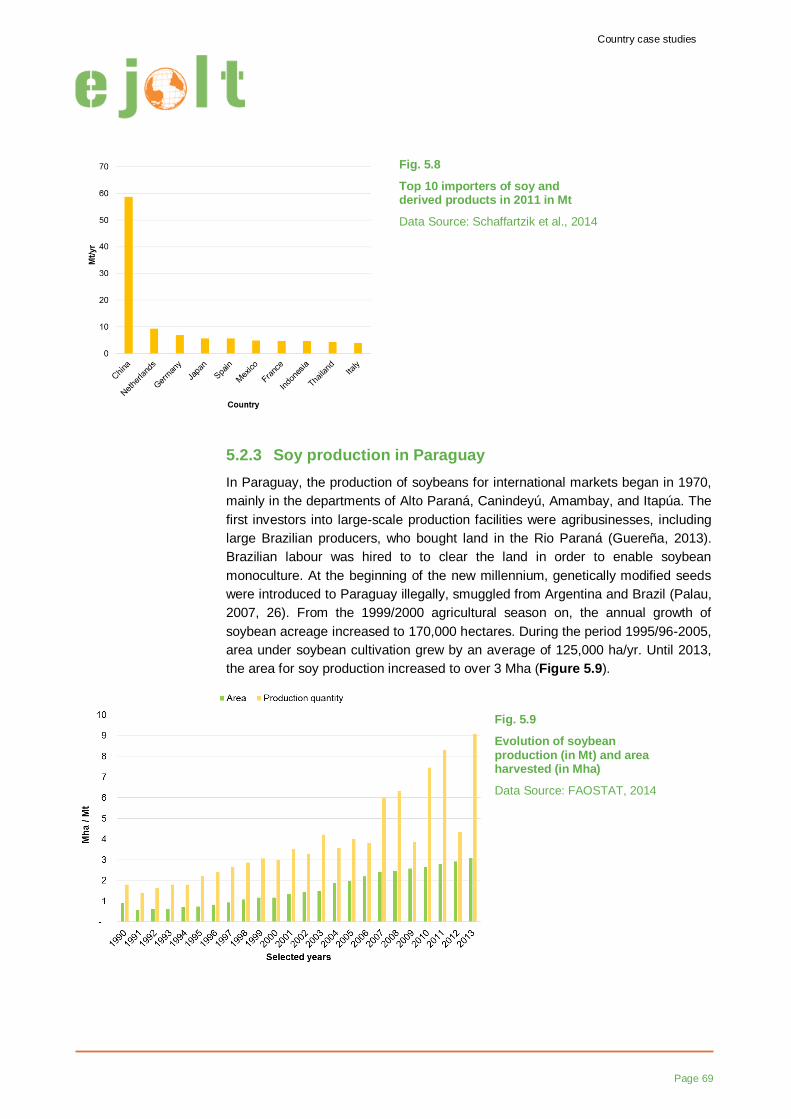
Country case studies
Page 69
5.2.3 Soy production in Paraguay
In Paraguay, the production of soybeans for international markets began in 1970,
mainly in the departments of Alto Paraná, Canindeyú, Amambay, and Itapúa. The
first investors into large-scale production facilities were agribusinesses, including
large Brazilian producers, who bought land in the Rio Paraná (Guereña, 2013).
Brazilian labour was hired to to clear the land in order to enable soybean
monoculture. At the beginning of the new millennium, genetically modified seeds
were introduced to Paraguay illegally, smuggled from Argentina and Brazil (Palau,
2007, 26). From the 1999/2000 agricultural season on, the annual growth of
soybean acreage increased to 170,000 hectares. During the period 1995/96-2005,
area under soybean cultivation grew by an average of 125,000 ha/yr. Until 2013,
the area for soy production increased to over 3 Mha (Figure 5.9).
Fig. 5.8
Top 10 importers of soy and derived products in 2011 in Mt
Data Source: Schaffartzik et al., 2014
Fig. 5.9
Evolution of soybean production (in Mt) and area harvested (in Mha)
Data Source: FAOSTAT, 2014
Country case studies
Page 70
Of the 40 Mha that form the total area of Paraguay, about 21 Mha were used for
agricultural production in 2012 and 3.6 Mha were used for crop production.
Figure 5.9 shows that, between 2006 and 2013, the soybean sector underwent a
strong expansion in terms of area cultivated and production quantity. The
cultivated area doubled between 2003 and 2013 to occupy 80% of the total
cropland (World Bank, 2014). About half of this land was formerly used for
commercial cattle ranching while the other half was used by peasant and/or
indigenous families (Guereña, 2013). In many cases, these families sold or rented
their property or gave up their occupancy rights for soybean crops, often forced to
live with the impacts of pesticides used during soy cultivation.
According to the agricultural census of Paraguay, less than 17% of total croplands
are dedicated to the production of food, even considering that a fraction of
soybeans are used to produce food (Guereña, 2013). Overall, there is a high
dynamic in the growth of production of soy (and the livestock sector, closely linked
to the soy complex), as well as in the expansion of areas under soy production in
Paraguay, competing with other claims to the land, such as peasant farming or
forest preservation.
The role of agribusiness and foreign investments
Soybean production essentially requires large plantations. In 2008, nearly 90% of
soybeans were planted on farms of more than 100 hectares and 63% of the farms
were bigger than 500 hectares. Some analysts argue that the minimum area to
produce soybeans at a profitable scale is 1,000 hectares. Most of the soybean
area in Paraguay is owned by Brazilians (64% nationwide and up to 80-81% in
some districts of the border area) (Guereña, 2013).
Policies related to soy expansion
Between 1995 and 2000, over 70% of public expenditure on agriculture in
Paraguay consisted of subsidies, most of which benefited large producers
engaged in export production (e.g., fuel subsidies are almost exclusively claimed
by large producers). Paraguay is the only country in Latin America in which soy
exports are tax-free. Rural properties are subject to a property tax which, at an
average of 0.16 USD/ha is 23.5 times lower than the average in Latin America and
45 times lower than in developed countries (Guereña 2013, 12).
According to Paraguayan Law 60/90, agribusinesses are exempt from value
added tax (VAT) on all purchased goods, from tariffs and taxes on imported goods
and equipment for agriculture, and from 95% of income tax during the first five
years of business, extendable to ten years inareas of preferential development.
The Bank of Agricultural Credit, originally established to support small production,
has channelled 90% of the credits it offers18
to large farmers and cattle ranchers.
Since 2005, Paraguay has a law on the promotion of agrofuels which declares the
18
Based on an interview by Guereña (2013) with Luis Rojas, Researcher at Base IS, on February the
11th, 2013.
Country case studies
Page 71
production of raw materials for production of agrodiesel and -ethanol a national
interest (Guereña, 2013).
5.2.4 The impacts of soy production in Paraguay on local livelihoods and the environment
The most important factor that triggers conflict with regard to soy production in
Paraguay is the incompatibility of soy monocultures and small-scale farming. Even
where peasants retain land, they are often forced to migrate by the detrimental
environmental conditions caused by near-by large-scale soy farming. The current
model of soybean monoculture thus undermines the right to a healthy existence of
rural populations (Palau, 2007).
Cash crops and local livelihoods
It is nearly impossible to produce soybeans in small-scale farming because the
production requires external inputs, such as chemical fertilizers and heavy
machinery, and therefore capital (i.e., access to credit). This makes soy only
economically viable under conditions that most family farms do not have. There
are some studies that shed light on the costs and benefits of organic soy
production, but such farming practices are rarely found in Paraguay (McBride and
Greene, 2009). Oxfam interviewed one company in Paraguay which invests in
organic soy production, the Desarrollo Agrícola del Paraguay (DAP). Farmers had
to bear all the investment risk and were often found to be indebted after one bad
harvest (Oxfam, 2014).
Import dependency of food and agricultural inputs
Peasant leaders emphasize that since 2000, a process of abandonment of
subsistence practices in farming communities has been observed (Palau, 2007).
Declining domestic food production was balanced by increasing imports of
staples, which may be considered as an indication of declining food sovereignty.
According to the FAO, per capita food availability in Paraguay remained relatively
stable from 1989 to 2009 at a level of 2,500 kcal/cap/day, below the 2009 global
average food supply of 2,831 kcal/cap/day. During the same period, food imports
increased by a factor of 5 in physical terms. Between 2008 and 2011, the value of
food imports increased by 48.5% from 234 to 454 million USD (data not inflation-
adjusted) (Riquelme, 2013). In the districts with the largest expansion of corporate
farming, a decrease in the production of staple foods such as cassava, beans, and
peanuts was observed. Between 2008 and 2011, imports of chemicals inputs and
equipment used for industrial agriculture increased by 40% (Guereña, 2013).
Impacts on labour
Due to its high degree of mechanization in farming operations, soy generates little
employment. It is estimated that it only requires one worker per 200 hectares of
crops (Guereña, 2013 based on the report of the ‘Coalición Holandesa de la
Soya’, 2011). Most work occurs during the phase of converting cattle farms into
plantations. Manual work is required to remove weeds that have become
increasingly resistant to herbicides and plantations commonly contract a small
number of people from neighboring communities to perform this work. These
Country case studies
Page 72
workers have indicated in interview situations that cattle ranches provide more
jobs than do soy plantations (Guereña, 2013).
Conflicts triggered by the massive expansion of GM crops
Paraguay is the country with the highest proportion (66%) of cultivated genetically
modified (GM) crops.19
GM soybean seeds were first used in Paraguay in 1997,
i.e., before this was legally allowed. In Paraguay, 95% of soy is Roundup Ready
(RR), a GM seed that tolerates glyphosate, the active ingredient in Roundup which
is a nonselective herbicide that is applied throughout the crop cycle. Monsanto
holds the patent on the seed and the herbicide and earns 35 million USD annually
in royalties in Paraguay. In response, a strong opposition to GM crops is
developing place in Paraguay in which both the state and companies that violate
environmental laws are being challenged by those affected.
Local communities often attempted to stop massive pesticide application through
public demonstrations, which have led to massive repression by local authorities
and the police. Attempts have been made to criminalize protest, in order to
demobilize the resistance to monocultures. Between 2008 and 2009, 819 people
were arrested for their resistance to the advance of agribusiness. In 2002, the
residents of a community in Ipecuá, in the department of Caaguazú, organized
road blockades to protest against fumigation. In the course of these protests, the
police opened fire on a truck carrying a group of 40 people belonging to this
community. Two farmers were killed and several were seriously injured (Guereña,
2013).
19
Based on Heinemann (2009); calculation of hectares in GM cultivation according to James (2007)
and total arable land plus permanent crops according to FAOSTAT in 2003: See James (2007).
Country case studies
Page 73
5.3 The balancing act: Large scale land investments to boost exports and secure food in Ethiopia20
The biomass economy of Ethiopia is characterized by three key features. First,
rural Ethiopia shows patterns of an agrarian society. Most people are subsistence
farmers with little surplus production and consequently very small outflows, even
to local markets. Although Ethiopian crop exports are increasing, they remain at a
very low level of 0.8% to 3.5% of the annual crop production in the period 2001-
2011. Even the aggregated five most exported crops amount to only 3%-11% of
their domestic production (FAOSTAT, 2014). Second, hardly any fossil fuel-based
inputs are used to intensify agricultural production. Thus, agricultural production
lacks modern machinery and depends almost entirely on human labour and
animal power. Additionally, only very small quantities of industrially produced
mineral fertilizers are used. Third, Ethiopia is rated as being highly food insecure.
According to the Food Security Risk Index21
for 2010 (Maplecroft, 2014), it is one
of 10 countries considered to be at extreme risk, and is ranked as having the 6th
highest risk out of 163 countries surveyed. Due to insufficient food production,
Ethiopia needed annual food imports of about 7 Mt in the period 2009-2011
(Figure 5.11).
Against this backdrop, the government developed a strategy to boost exports. In
recent years, large areas have been made available for land investments. While
this is hardly visible in terms of absolute export flows (with 2011 as the latest
available year from international statistics), in relative terms, crop exports more
than tripled from 2000 to 2011, to roughly 6 Mt.
Exports related to foreign land acquisitions are directly or indirectly related to
environmental conflicts in Ethiopia. This case study presents the slowly changing
patterns of agricultural production, describes policies responsible for these
changes, and provides an overview of environmental conflicts related to biomass
exports.
5.3.1. The food system of Ethiopia: domestic production, exports and imports
Overall crop production increased from 13 Mt in 1993 to 34 Mt in 2011 (a factor
2.6 increase; Figure 5.11), mainly based in an increase in harvested area. Yields
per hectare improved only by factor 1.25 over the period from 1993 to 2011.
Figure 5.11 provides the overall picture for production, imports, exports, and
domestic consumption (the latter equals production plus imports minus exports) of
crops. Production and imports are dominating, while exports are comparably
small. Crops for domestic consumption grew by factor 2.6 (including food waste).
20
Chapter 5.3 was written by by Willi Haas and Hailemariam Birke Andarge 21
The Food Security Risk Index 2010, released by risk analysis and rating firm Maplecroft, evaluates
the risks to the supply of basic food staples for 163 countries. It uses 12 criteria developed in
collaboration with the World Food Programme to calculate the ranking, including: the nutritional and
health status of populations, cereal production and imports, GDP per capita, natural disasters,
conflict, and the effectiveness of government.
Country case studies
Page 74
Therefore, crops available for human consumption were actually lower throughout
the whole period.
In the period from 1993 to 2010, for which detailed crop data are available,
population increased from 53 to 83 million people (a factor 1.6 increase, Figure
5.10). Consequently, the amount of food available per capita from crops increased
from 260 to 470 kg/cap (a factor 1.8 increase, Figure 5.12).
The main crops produced in Ethiopia were teff22
, a type of cereal, maize, and
arracacha, arrowroot, and chufa (types of roots and tubers), sorghum, and wheat,
which together make up 63% of the total crop production in 2012 (see Figure
5.13). All of these crops were entirely consumed domestically, except for maize,
which was also exported, albeit at a very low level. Of the 6 Mt of maize produced
in 2011, only 0.06 t (1%) were exported. In contrast to maize, sesame and coffee
are more strongly produced for export, with export shares of nearly 100% and
40%, respectively in the same year. Dry beans are produced for both domestic
consumption and exports, with an average export share of 20% during the period
2001 to 2011. Sesame, coffee, and dry beans dominate crop exports (56% of crop
exports in 2011, see Figure 5.14). While crop exports are relatively small
compared to overall crop production, they are increasing significantly. Over the
period 1993 to 2011, overall crop exports increased by factor 9. Only the export of
coffee as a long-standing export crop grew more slowly (factor 2). Sesame played
a minor role in Ethiopian exports in 2001, while it constituted almost 30% of the
entire crop exports in 2011.
22
Teff is an annual grass native to the Ethiopian and Eritrean Highlands, similar in cooking to millet.
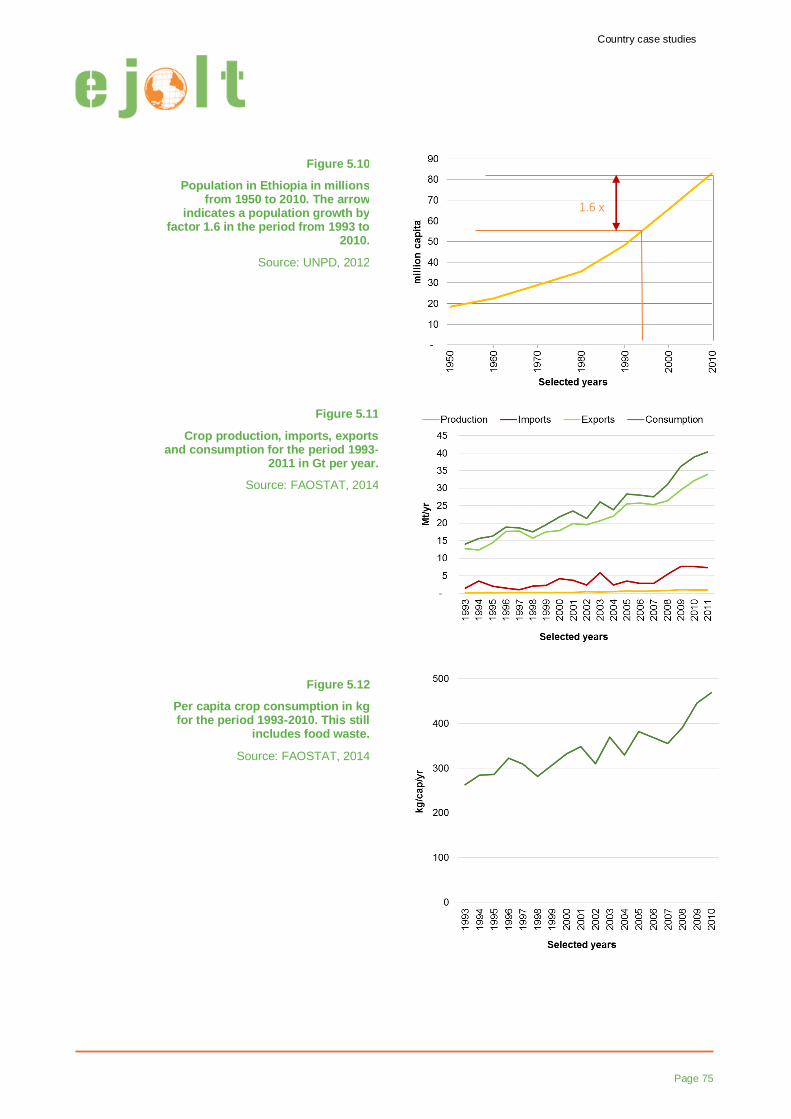
Country case studies
Page 75
Figure 5.10
Population in Ethiopia in millions from 1950 to 2010. The arrow
indicates a population growth by factor 1.6 in the period from 1993 to
2010.
Source: UNPD, 2012
Figure 5.11
Crop production, imports, exports and consumption for the period 1993-
2011 in Gt per year.
Source: FAOSTAT, 2014
Figure 5.12
Per capita crop consumption in kg for the period 1993-2010. This still
includes food waste.
Source: FAOSTAT, 2014
1.6 x
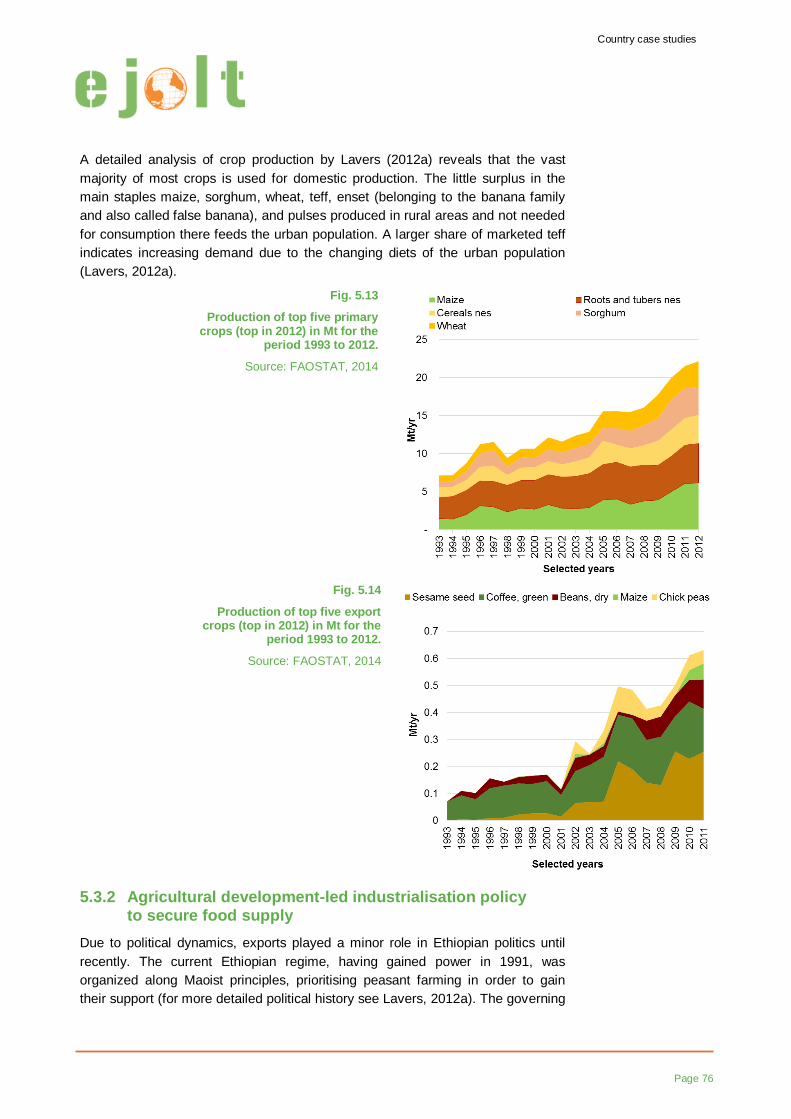
Country case studies
Page 76
A detailed analysis of crop production by Lavers (2012a) reveals that the vast
majority of most crops is used for domestic production. The little surplus in the
main staples maize, sorghum, wheat, teff, enset (belonging to the banana family
and also called false banana), and pulses produced in rural areas and not needed
for consumption there feeds the urban population. A larger share of marketed teff
indicates increasing demand due to the changing diets of the urban population
(Lavers, 2012a).
5.3.2 Agricultural development-led industrialisation policy to secure food supply
Due to political dynamics, exports played a minor role in Ethiopian politics until
recently. The current Ethiopian regime, having gained power in 1991, was
organized along Maoist principles, prioritising peasant farming in order to gain
their support (for more detailed political history see Lavers, 2012a). The governing
Fig. 5.13
Production of top five primary crops (top in 2012) in Mt for the
period 1993 to 2012.
Source: FAOSTAT, 2014
Fig. 5.14
Production of top five export crops (top in 2012) in Mt for the
period 1993 to 2012.
Source: FAOSTAT, 2014

Country case studies
Page 77
party was re-established as the Ethiopian Peoples’ Revolutionary Democratic
Front (ERPDF) after they have seized power on the national level, which aimed at
securing international legitimacy and development assistance by claiming to have
switched to a market-based development strategy while still maintaining tight
control over the economy.
Since a large share of the population primarily depends on agriculture, according
to the government, development requires rapid agricultural growth (MoFED,
2003). Since 1993 the government has deployed a strategy of ‘agricultural
development-led industrialisation’ (ADLI), which assesses that Ethiopian
agriculture is labour-rich and capital-poor. Agricultural development measures
should implement labour-intensive, and non-mechanised measures, while
simultaneously, government policies support technologies such as irrigation, use
of fertilisers and of improved seed varieties, which increase yields but do not
replace labour (MoFED, 2003). It is intended that increased agricultural
productivity should lead to national food security, equitable growth, and
smallholder security (MoFED, 2003).
The land policy is based on state ownership of land with a guarantee of usufruct
rights for smallholders, which is not a property right for land, but the right to use
and sell the harvest. The government claims that the usufruct right protects
peasants from displacement. However, it can also be seen as a populist policy,
which appeals to the party’s political base. By placing restrictions on land
transactions and land transfers, the land policy limits the emergence of large
landholders, and consequently creates landless peasant. The government sees
the latter as source of economic, political and social instabilities (MoFED 2002, 56;
Rahmato, 2009; Lavers, 2012b). Consequently, there was virtually no capitalist
agriculture in Ethiopia until recently, and smallholder production accounted for
95% of agricultural output (CSA, 2009). The wealth of households varies by their
access to land, labour, oxen, and irrigation. Farmers rely primarily on the labour
provided by their own household, resulting in just minimal class differentiation in
rural areas (Rahmato, 2003; Lavers, 2012b).
ADLI has yet not achieved food security and many rural areas still rely on food aid.
In 2011, the major donor was the US, followed by the United Nations (WFP, 2012;
also see Figure 5.15). In reaction to domestic shortages, a directive issued in
2006 banned most cereal exports (MoTI, 2008). This measure was intended to
hinder profits made from the export of crops which were urgently needed for
domestic food supply.
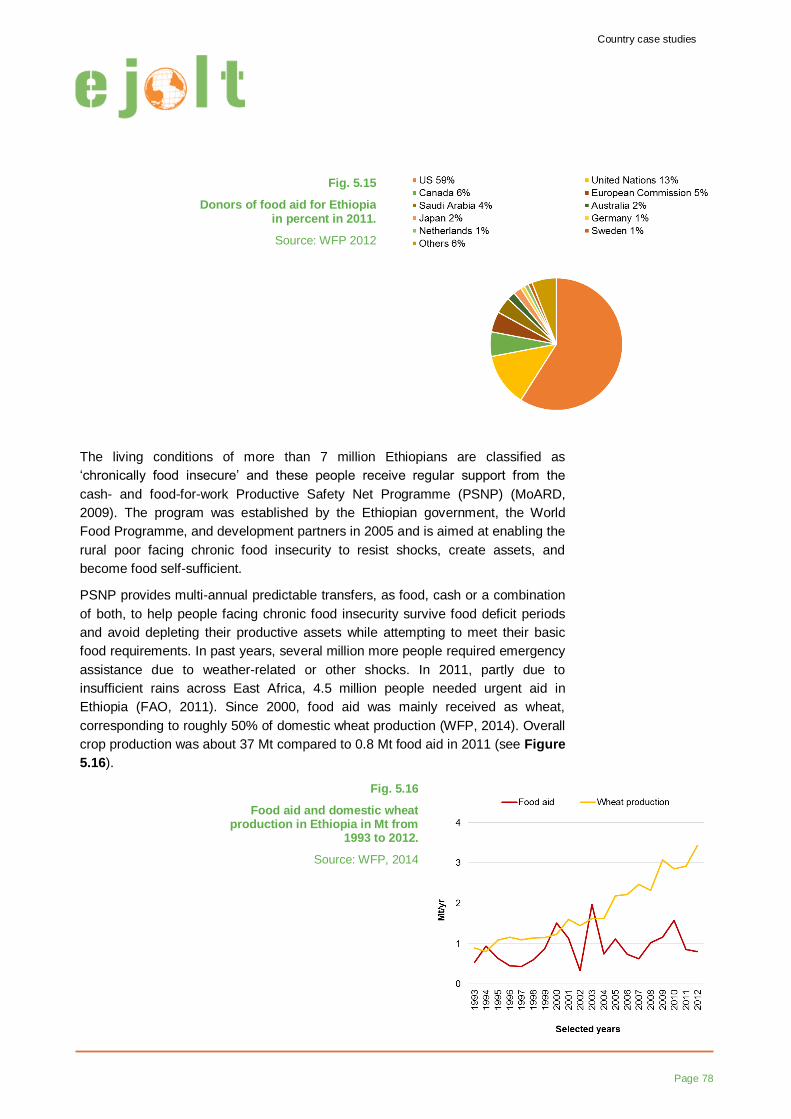
Country case studies
Page 78
The living conditions of more than 7 million Ethiopians are classified as
‘chronically food insecure’ and these people receive regular support from the
cash- and food-for-work Productive Safety Net Programme (PSNP) (MoARD,
2009). The program was established by the Ethiopian government, the World
Food Programme, and development partners in 2005 and is aimed at enabling the
rural poor facing chronic food insecurity to resist shocks, create assets, and
become food self-sufficient.
PSNP provides multi-annual predictable transfers, as food, cash or a combination
of both, to help people facing chronic food insecurity survive food deficit periods
and avoid depleting their productive assets while attempting to meet their basic
food requirements. In past years, several million more people required emergency
assistance due to weather-related or other shocks. In 2011, partly due to
insufficient rains across East Africa, 4.5 million people needed urgent aid in
Ethiopia (FAO, 2011). Since 2000, food aid was mainly received as wheat,
corresponding to roughly 50% of domestic wheat production (WFP, 2014). Overall
crop production was about 37 Mt compared to 0.8 Mt food aid in 2011 (see Figure
5.16).
Fig. 5.15
Donors of food aid for Ethiopia in percent in 2011.
Source: WFP 2012
Fig. 5.16
Food aid and domestic wheat production in Ethiopia in Mt from
1993 to 2012.
Source: WFP, 2014
Country case studies
Page 79
While ADLI is focused on improving food security though domestic production,
exports are required to generate revenue to allow for food imports, but also for
imports of capital goods required for industrialisation (MoFED, 2002).
5.3.3 Policy shifts towards (foreign) large scale investments
There is growing evidence that ADLI has not provided the envisaged successes in
terms of food security, while at the same time the population is growing strongly
and Ethiopia is increasingly dependent on food aid. Policies focusing on domestic
production alone seemed not to suffice. Additionally, many donors like the World
Bank exert increasing pressure in favour of agricultural commercialisation
(Teshome, 2006).
While the extent of lobbying for market and land access of foreign investors
remains unclear, changes in policies on agricultural development have been
implemented. Currently, the largest investors in Ethiopia are companies from
India, Germany, Israel, and Saudi Arabia.
ADLI, despite claiming to promote mainly smallholder-based agriculture, has also
continuously allowed for large-scale agricultural development with the proviso that
it not threatens the interests of smallholders (MoFED, 2002). However, only in
recent years has there been a fundamental change, with large-scale agriculture
being used as a new strategy. According to Lavers (2012b), this might possibly be
due to two causes: First, stagnation in the smallholder sector and second,
international drivers of the land grab (Friis and Reenberg, 2010).
In seeking commercialisation of agriculture and foreign investment, the Ethiopian
government developed a spatially differentiated dual approach: First, smallholders
in the highlands were supported in improving cereal productivity and specialising
in ‘niches’ of high-value export commodities and second, foreign and domestic
investment for supporting the development of large-scale commercial agriculture
where it is feasible (MoFED, 2005, 47) was attracted. The government claims that
these two approaches are entirely separate, since ‘unused’ land that smallholders
could not develop due to a lack of resources is provided for these investments to
expand production, while avoiding displacement.
Government officials expect foreign investment in agriculture to increase
production of biomass for food and industrial uses (e.g., cotton). This in turn
should improve food security and promote industrialisation (Lavers, 2012b).
Furthermore, foreign investment should boost production of export crops in order
to earn foreign exchange (MoFED, 2005; 2010), strengthening the role of trade in
the Ethiopian development strategy.
5.3.4 Agricultural investments in recent years
The government aims to implement its agricultural development strategies with
objectives including increasing production of export crops and food, expanding
industrial processing and creating employment as well as raising productivity in
the smallholder sector. Agricultural investments should contribute to these
objectives and are closely monitored by the government. Investors must obtain a
general investment licence from Ethiopian government institutions before they are
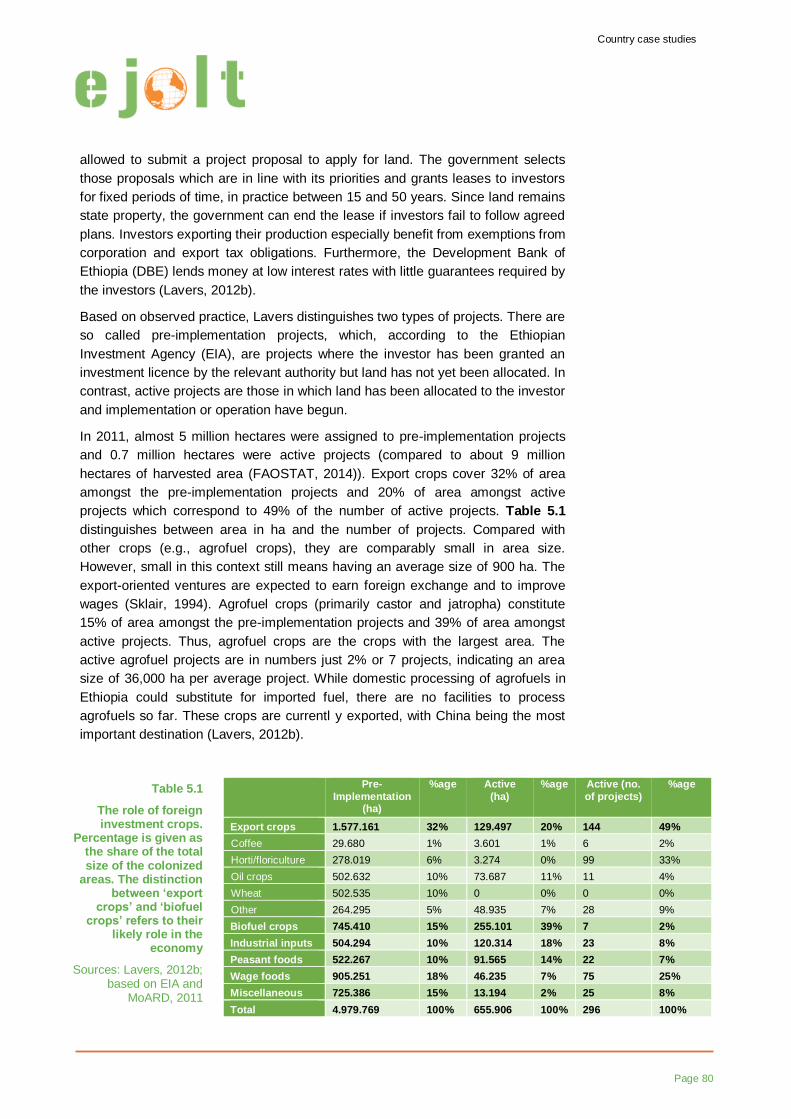
Country case studies
Page 80
allowed to submit a project proposal to apply for land. The government selects
those proposals which are in line with its priorities and grants leases to investors
for fixed periods of time, in practice between 15 and 50 years. Since land remains
state property, the government can end the lease if investors fail to follow agreed
plans. Investors exporting their production especially benefit from exemptions from
corporation and export tax obligations. Furthermore, the Development Bank of
Ethiopia (DBE) lends money at low interest rates with little guarantees required by
the investors (Lavers, 2012b).
Based on observed practice, Lavers distinguishes two types of projects. There are
so called pre-implementation projects, which, according to the Ethiopian
Investment Agency (EIA), are projects where the investor has been granted an
investment licence by the relevant authority but land has not yet been allocated. In
contrast, active projects are those in which land has been allocated to the investor
and implementation or operation have begun.
In 2011, almost 5 million hectares were assigned to pre-implementation projects
and 0.7 million hectares were active projects (compared to about 9 million
hectares of harvested area (FAOSTAT, 2014)). Export crops cover 32% of area
amongst the pre-implementation projects and 20% of area amongst active
projects which correspond to 49% of the number of active projects. Table 5.1
distinguishes between area in ha and the number of projects. Compared with
other crops (e.g., agrofuel crops), they are comparably small in area size.
However, small in this context still means having an average size of 900 ha. The
export-oriented ventures are expected to earn foreign exchange and to improve
wages (Sklair, 1994). Agrofuel crops (primarily castor and jatropha) constitute
15% of area amongst the pre-implementation projects and 39% of area amongst
active projects. Thus, agrofuel crops are the crops with the largest area. The
active agrofuel projects are in numbers just 2% or 7 projects, indicating an area
size of 36,000 ha per average project. While domestic processing of agrofuels in
Ethiopia could substitute for imported fuel, there are no facilities to process
agrofuels so far. These crops are currentl y exported, with China being the most
important destination (Lavers, 2012b).
Pre-
Implementation (ha)
%age Active
(ha)
%age Active (no.
of projects)
%age
Export crops 1.577.161 32% 129.497 20% 144 49%
Coffee 29.680 1% 3.601 1% 6 2%
Horti/floriculture 278.019 6% 3.274 0% 99 33%
Oil crops 502.632 10% 73.687 11% 11 4%
Wheat 502.535 10% 0 0% 0 0%
Other 264.295 5% 48.935 7% 28 9%
Biofuel crops 745.410 15% 255.101 39% 7 2%
Industrial inputs 504.294 10% 120.314 18% 23 8%
Peasant foods 522.267 10% 91.565 14% 22 7%
Wage foods 905.251 18% 46.235 7% 75 25%
Miscellaneous 725.386 15% 13.194 2% 25 8%
Total 4.979.769 100% 655.906 100% 296 100%
Table 5.1
The role of foreign investment crops.
Percentage is given as the share of the total size of the colonized
areas. The distinction between ‘export
crops’ and ‘biofuel crops’ refers to their
likely role in the economy
Sources: Lavers, 2012b; based on EIA and
MoARD, 2011
Country case studies
Page 81
7% of the active projects contribute to ‘peasant food’ availability, producing
cereals and pulses. A major investor is Karuturi, an Indian investor which has
stated hat it intends to sell the crops on local markets in Ethiopia, with the
remainder destined for neighbouring African countries. A few other foreign
investors that produce rice and wheat for export, according to their corporate
social responsibility (CSR) strategy, have volunteered to sell a part of their
produce domestically (Empora, 2009; Capital Newspaper, 2010). However, these
projects can make a small contribution at best to rural food security in Ethiopia.
Mainly livestock projects producing meat are listed under ‘wage foods’ in Table
5.1. Specific details for these projects remain rather unclear. Some projects are
intended to contribute to industrialisation via integrating local food processing. A
few exemplary projects contribute directly to local processing, with rice and
sesame dryers planned by investors to cater to expanded production (Alemu,
2010). A Chinese sugarcane plantation (size 25,000 hectare) in Gambella
(MoARD, 2011) promises the development of local processing facilities since, in
order to prevent fermentation, sugarcane requires processing shortly after being
cut. With cotton, as the major crop for industrial use, the case is different, since it
can be exported easily, allowing for processing outside Ethiopia. It therefore
remains unclear to what extent cotton projects contribute to the industrialisation in
Ethiopia (Lavers, 2012b).
5.3.5 Conflicts
There are several sources that provide evidence on environmental conflicts
resulting from land acquisition projects as discussed above.
The Oakland land investment country report on Ethiopia
The most comprehensive source is a report issued in 2011 by the California-
based Oakland Institute (Oakland Institute, 2014). The report is based on
interviews with impacted communities, government officials, investors, civil
society, and others and analyses the situation in order to provide an
understanding of the impacts of land investments on the land and its people.
The general findings regarding the process of awarding millions of hectares of
land to foreign and national agricultural investors show significant environmental
conflicts and questionable benefits. At least 3,619,509 ha of land have been
transferred to investors, although the actual figure may be higher. Commercial
investment is expected to increase rates of food insecurity in the vicinity of land
investments. While there are no mechanisms in place to improve local food
security, there are numerous incentives to ensure that food production is exported
out of the country, providing foreign exchange at the expense of local food
supplies. Despite the Ethiopian government’s objective of technology transfer via
land investments, no mechanism has been established to secure such a transfer.
The report states that large discrepancies exist between publicly stated positions,
laws, policies, and procedures on the one hand and what is actually happening on
the other hand. While the Ethiopian government claims to have conducted
consultations for all land deals and states that only ‘unused’ land has been
Country case studies
Page 82
provided and that no farmers were displaced, the report’s investigations did not
find a single incidence of community consultation. Furthermore, virtually every
investment site the research team visited involved the loss of some local farmland
and every investment area exhibited a variety of land uses and socio-
cultural/ecological values associated with it prior to land investment.
The research team encountered a great lack of local knowledge about these land
investments, with local communities only becoming aware of such changes once
bulldozers arrive to clear the land. Local people were displaced from their
farmlands and communal areas in almost every lease area visited by the research
team. The majority of these investments occurred in the lowland areas. Since the
government pays little attention to patterns of shifting cultivation, pastoralism, or
communally used areas, they claim that the respective lands are ‘unused’. People
who were displaced are forced to find farmland elsewhere, which may in turn lead
to tensions with other farmers over access to land and resources. Due to a lack of
pre-project assessments, potential benefits are not generated. The report states
that forests are being cleared, critical wildlife habitat lost, and livelihoods
destroyed.
The EJOLT database
Another source is EJOLT’s own database on environmental conflicts. In
September 2014, this contained 1 case related to a hydro power dam and 5 cases
related to biomass for Ethiopia. The latter cases are listed in Table 5.2 and are
marked in Figure 5.17. Most of the commodities produced in these cases are
typical crops for exports and are recorded for the Gambella Region and for the
Lower Omo Valley.
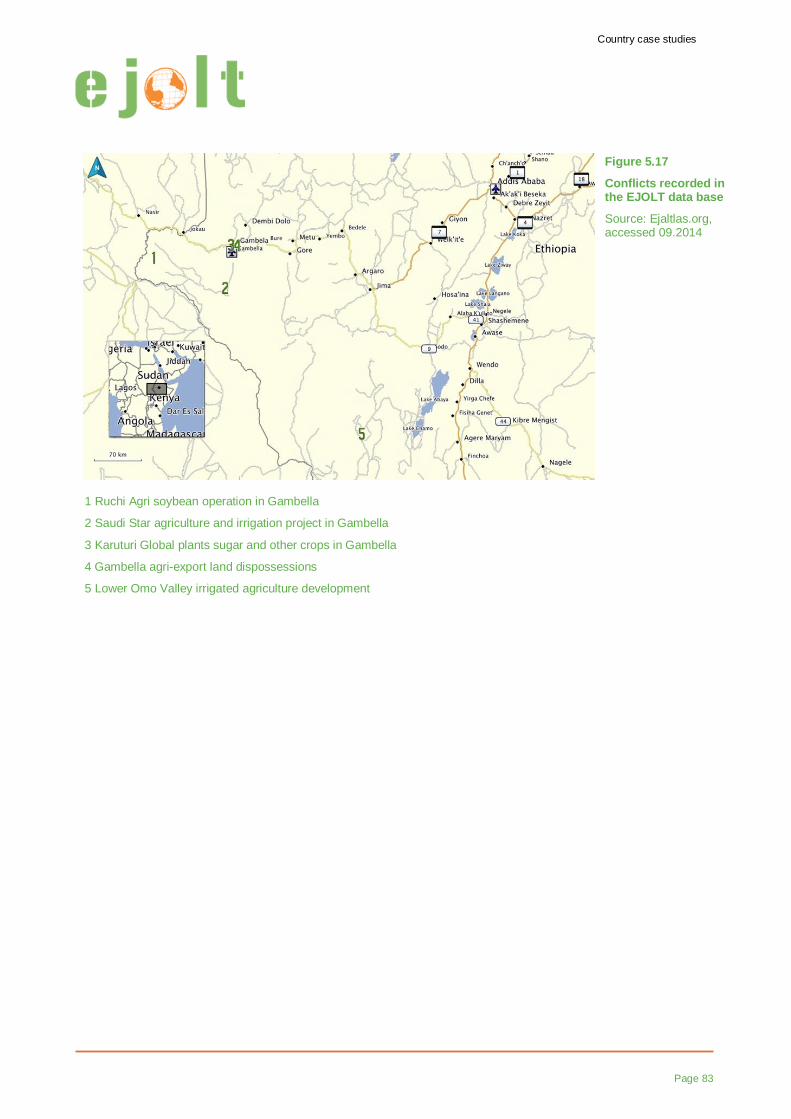
Country case studies
Page 83
1 Ruchi Agri soybean operation in Gambella
2 Saudi Star agriculture and irrigation project in Gambella
3 Karuturi Global plants sugar and other crops in Gambella
4 Gambella agri-export land dispossessions
5 Lower Omo Valley irrigated agriculture development
Figure 5.17
Conflicts recorded in the EJOLT data base
Source: Ejaltlas.org, accessed 09.2014

Country case studies
Page 84
Name Commodities Description
1 Ruchi Agri
soybean operation in
Gambella
Soybeans
processing
facilities
Ruchi Group, the leading cooking oil manufacturer in India, signed a
contract for a 25-year lease on 25,000 ha for the production of soybeans in 2010. The locals and the government disagree as to the status of
occupation of the land. The government claims the land to be unoccupied, 'virgin lands', while multiple accounts of 'villagization' from this region contradicts this claim.
2 Saudi Star
agriculture and irrigation project in Gambella
Rice
Teff
oilseed
sunflowers
water
live animals
sugar
corn/maize
Saudi Star PLC obtained a 60-year concession on 10,000 ha in 2008,
while the total area they leased is 140,000 ha. In 2012 they developed rice production supported by an irrigation project (funded by the government of Ethiopia). In January 2012, Human Rights Watch
reported that local populations were forcibly displaced for the rice project. Conflicts emerged resulting in 5 dead and 11 wounded. Retaliation attacks were reported. Federal police now guard the area. The project is also infringes on Gambella National Park boundaries.
3 Karuturi Global
plants sugar and
other crops in Gambella
Corn/maize
palm oil
sugar
land
rice
The Indian Karuturi Global Ltd signed an agreement in November 2010
for a long-term lease on 11,000 ha in the Oromia Region and a 50-year
lease on 100,000 ha in the Gambella Region. By 2012 only 12,000 ha were planted with rice and corn, prompting the government to renegotiate the lease. Human Rights Watch, the Anywaa Survival
Organisation, and other opposition movements have accused the Ethiopian government of forcing farmers from the area leased to Karuturi (and other international companies).
4 Gambella agri-export land
dispossessions
Cut flowers
land
sugar
palm oil
rice
Another Karuturi Global land lease deprives about 5,000 Ilea indigenous people from the lands they use for farming along the Openo
River. The Ilea people were not consulted about the deal. Rents for this area were reported to be as low as 15-20 ETB per ha (USD1-1.25). Another major company involved in the Gambella region is Saudi Star
Agricultural Development Company. Legal analyses of the land lease contracts raises concerns about lease rates per hectare, infrastructure development, water use provisions and environmental responsibility.
5 Lower Omo
Valley irrigated agriculture
development
Sugar Massive agricultural developments in the form of state-run sugar
plantations and commercially leased land for the Lower Omo Valley are planned by the government. These plans are linked to the controversial Gibe III dam upstream of the Lower Omo Valley for large-scale irrigation
agriculture. The sugar plantations are linked to the country’s plans to increase its international market share of the commodity. However, the Lower Omo Valley is home to an estimated 200,000 agro-pastoralists,
who would be negatively affected in terms of their access to water for growing crops and their ability to exercise their way of life. Reports based on interviews with inhabitants of the region indicate that forced
evictions, denial of access to subsistence land, beatings, killings, rapes, imprisonment, intimidation, political coercion, and the denial of government assistance are all being used as tools of forced resettlement
(Oakland Institute, 2013). International donors have been accused of supporting the programs connected with the resettlement sites. The US Agency for International Development (USAID) and the UK’s Department
for International Development (DFID) conducted a joint field investigation, but did not find evidence to support the claims of human right violations. The field visit performed by the Oakland Institute (2013)
thereafter, in stark contrast, provided testimony from the affected communities showing that egregious human rights violations have taken place.
Ethiopia’s policy of ‘villagization’ in other parts of the country has been widely criticized for a lack of consultation with local communities, for
intimidation and force. The Lower Omo Valley seems to be no exception in this, as the same approach is being adopted.
Table 5.2
Basic information on
cases extracted from the EJOLT
database and edited.
Source: ejatlas.org,
accessed
09.2014
Country case studies
Page 85
Field research on acquisition in Bako, Oromia and Gambella regions
The research paper by Yassin (2010), as part of his Master Thesis at the
International Institute of Social Studies, Erasmus University of Rotterdam covers
large scale transnational land acquisition in Ethiopia with specific reference to two
agrofuel and food crop production corporation in Bako23
and in the Oromia and
Gambella24
regions. Primary and secondary data were collected from local
communities, corporations, government offices, civil society organization, and
NGOs, with access to government documents and land deal contracts being the
major obstacle.
According to this account, local farmers in Bako reported we are victims of time.
The land which local farmers had used for grazing and additional farming was no
longer accessible to them since land was fenced and grazing lands and river
waters were controlled by the corporations. The small area of grazing land left was
insufficient for the local farmers’ cattle. Consequently, farmers were forced to sell
their cattle, resulting in a reduction of cattle prices in a nearby market by 40%
(Tamrat, 2009). Complaints to the corporation led to promises of cattle feed to
compensate for the lost grazing areas. This scheme was not implemented and the
local community is now forced to travel 8 km away in search of pasture for grazing
and water as the road providing a shortcut to the nearest river is blocked.
The analysis indicates that investors receive arable lands and displace local
people. Despite constitutional provisions which grant compensation in case of
displacement, no compensation has yet been provided in either the Bako or
Gambella areas where the local population’s livelihood is based on farming and
cattle herding. Local mango fruit production on the land has been cleared without
compensation. Corporations cleared the land and burned trees and shrubs in
order to increase the fertility of the soil.
5.3.6 Concluding remarks
In Ethiopia, a country with a high level of food insecurity, the government has
provided substantial amounts of land for foreign and national investors (14% of
agricultural land are in the pre-implementation phase and 2% are actively used in
2011). Most of the produce from this land is exported (e.g., coffee, floriculture, oil
crops, and agrofuel crops) and thus does not contribute to an improvement of the
domestic food situation. Instead of beneficial effects, adverse ones have been
reported. People have been forced from the lands they were using, depriving them
of access to environmental resources that are crucial to their livelihood.
23
Karuturi Global Plc is an investor in Bako region (the same investor as in case 3 in Table 5.2) 24
Saudi Star PLC is an investor in Gambella (the same investor as in case 2 in Table 5.2)
Hazards of the corporate food regime and the importance of smallholder farming
Page 86
6
Conclusions
Hazards of the corporate
food regime and the
importance of smallholder
farming for global food
security and food
sovereignty 25
The concept of food regimes can be used to analyse developments in the global
socio-economic system through the lenses of food production, distribution, and
consumption. The first food regime was the phase during which imports from the
colonies to Europe were the main trade flows of agricultural produce. The second
food regime began after WW II, when global powers striving for hegemony sought
to obtain access to new markets for surplus agricultural production and
simultaneously increase their influence in the peripheries. Some of the present-
day import dependency for agricultural commodities of countries around the world
stems from this period. The third food regime, in general observed to have
emerged since the late 1980s, exhibits several patterns that were already present
in the second regime and also establishes new forms of dependency and
interrelations in the global (agricultural) system.
While agricultural trade mainly flowed from the global North to the South during
the second food regime, the global South increasingly produced food, feed, fibres,
and fuels for the global market, especially for the demands of the global North,
during the third regime. In some countries, the export of agricultural produce
contributed substantially to economic growth. Brazil, for example, became a major
global supplier of soy, sugar cane, meat, and several fruits in following this
development pathway (GRAIN et al., 2014). Other Latin American countries have
followed this same pathway, such as Argentina, Paraguay, or Uruguay, mainly
based on biomass exports, while other economies extract and export non-
25
With contributions from GRAIN
A kind of reverse
agrarian reform is
taking place in many
countries (GRAIN,
2014).
Hazards of the corporate food regime and the importance of smallholder farming
Page 87
renewable resources such as oil, gas, and mineral resources. Where progressive
governments are in power, the export revenues have partly been used to finance
social programs for the poorest inhabitants (Yates and Bakker, 2013).
However, several concerns have been raised with regard to this export-based
development by impacted populations, scholars, EJOs, and the media. The
current global restructuring of agriculture is often referred to as accumulation by
dispossession (Dörre, 2011; Harvey, 2005; Zeller, 2007). This term describes the
continuous process of appropriation (of land, in this case) driven by the need to
accumulate capital under the current economic system. Increased opportunities to
make land-based profits are partly related to changing diets and demand for
biomass in many parts of the world: As more animal products are consumed, the
demand for animal feed rises. Overall, an agri-food system in which a higher
share of calories consumed by humans stems from animal products has a higher
total calorie throughput. Cereals and oil crops which could have been directly
consumed by humans, are consumed indirectly in animal products with according
food energy losses along the production chain (Erb et al., 2012b). Next to the use
of biomass for food, other uses have also contributed to the expansion of
production frontiers. Fibre crops, wood and other forestry products, as well as oil-
bearing crops are (increasingly) grown for non-food purposes such as use in
textile production (fibre crops), paper and paperboard production (wood, pulp),
and in production of oils used in cosmetics, lubricants or agrofuels (oil-bearing
crops). Industrial tree plantations of, for example, eucalyptus, acacia or oil palm
are expanding rapidly, often linked to dispossession of smallholders and peasant
communities (see EJOLT report 3 on industrial tree plantations (Overbeek et al.,
2012)). Direct competition may emerge between food uses (e.g., plant-based and
animal-based diets) and between food and non-food uses. This competition may
direct when one plot of land can only be used to grow one particular crop or
indirect when new production patterns impact the price of certain commodities as
was the case with the food price peaks of 2008.
Export-oriented development seeks to obtain revenues with which resources not
locally available can be purchased (via imports). People living in urban areas
depend almost entirely on markets in order to meet their nutritional needs so that
the existence of urban and rural areas necessitates the existence of a food
market. Simultaneously, market penetration to rural areas changes the ways in
which non-urban populations satisfy their dietary needs as well. The majority of
the population in the global South depends on food that is produced by
smallholders or in subsistence farming. This mode of agricultural production
requires land that is often described as – compared to yields reached in industrial
agriculture – ‘underused’. Whether they live in urban or rural areas, people that
rely on market food require functioning markets and distribution systems, and of
course the financial means to access these markets.
Next to potential obstacles to food security in market-based food systems, the
production side of food security is also severely threatened by pressures faced by
smallholders with mainly low-input low-output agricultural systems. These
While agricultural
trade mainly flowed
from the global North
to the South during
the second food
regime, the global
South now produces
food, feed, fibres, and
fuels for the global
market, especially for
the demand of the
global North.
Hazards of the corporate food regime and the importance of smallholder farming
Page 88
pressures and their impacts are illustrated by the following developments (GRAIN,
2014):
1. The vast majority of farms in the world today are small and getting
smaller, while at the same time more and more land concentrates in the
hands of less people. What is happening in many countries right now is a
kind of reverse agrarian reform, whether it's through corporate land
grabbing in Africa, the recent agribusiness-driven coup d'état in Paraguay,
the massive expansion of soybean plantations in Latin America, the
opening up of Burma to foreign investors, or the extension of the
European Union and its agricultural model eastward. In all of these
processes, control over land is being usurped from small producers and
their families, with elites and corporate powers pushing people onto
smaller and smaller land holdings, or off the land entirely into camps or
cities.
2. Small farms (less than 2 ha in size) currently occupy only one quarter of
the world's farmland.
3. In many places, the number of farms and of farmers are declining while
large agroholdings are increasing in area. Monoculture plantations are
rapidly growing. In the last 50 years, 140 Mha – roughly the same area as
all the farmland in the European Union - have been taken over for
soybean, oil palm, rapeseed, and sugar cane alone since 1960.
4. In spite of the decline in small farms, they continue to be the major food
producers in the world. Peasant agriculture prioritises food production for
local and national markets as well as for farmers' own families – not
commodities or export crops.
5. Small farms are are not in general less productive than big farms.
Industrial farms have enormous power, clout and resources, but small
farms may even outperform big farms in terms of productivity (GRAIN,
2014.
6. The majority of small farmers are women. In many countries, women do
not have the same rights to own land as men do, despite the fact that they
mainly work this land (e.g., Nwakeze and Schaffartzik, 2014).
This pressure on small-scale farming is both a result of and contributes to the
global restructuring of agricultural production which leads to an increased
concentration of agricultural lands, increasing homogeneity in global food
supplies, and growing interdependence among countries in their food supply
(Khoury et al., 2014). GRAIN (2014) has referred to these processes as the
invasion of megafarms. The expansion of industrial commodity crop farms is
perhaps the single most important driver threatening the future of small-scale
farming. The demands of food and energy industries are shifting farmland and
water away from direct local food production to the production of commodities for
industrial processing. The graph below (Figure 14) shows how just four crops –
soybean, oil palm, rapeseed, and sugar cane – have quadrupled in terms of the
On this topic, the only
real policy
recommendation that
I see is that the
expansion of the
commodity crops
should be stopped and
reversed, and land
should be reverted to
food production in the
hand of small farmers.
(Henk Hobbelink,
personal
communication)
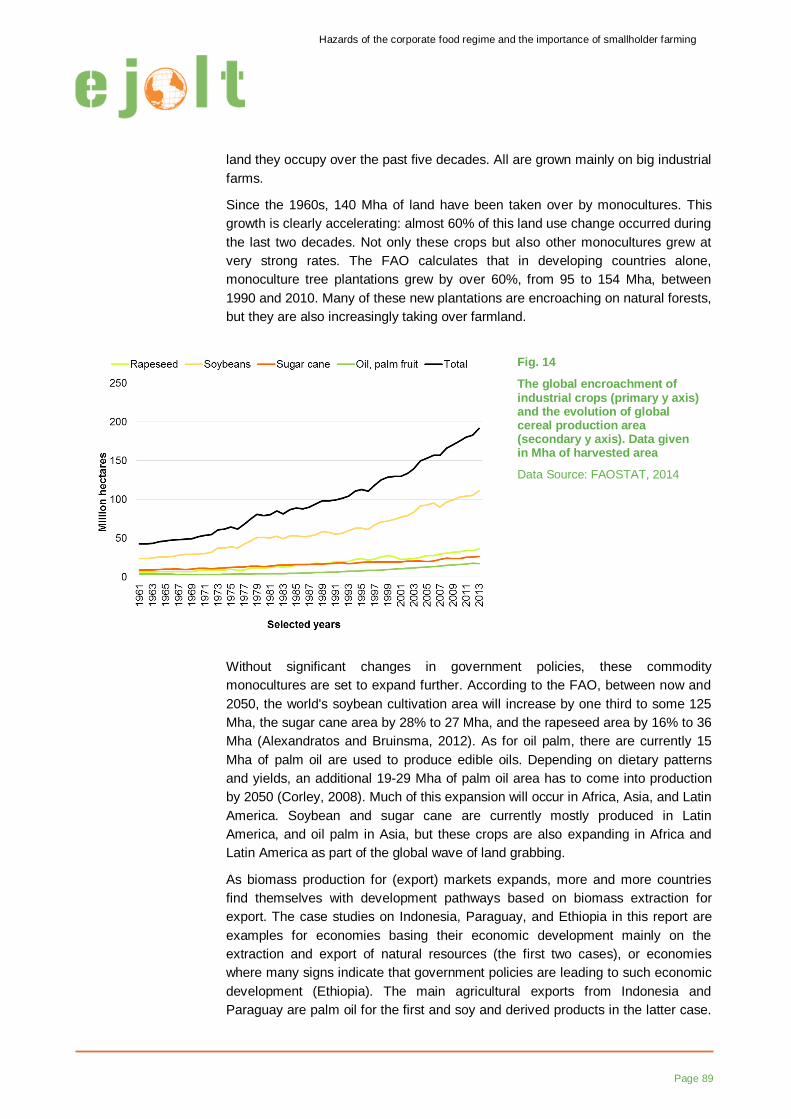
Hazards of the corporate food regime and the importance of smallholder farming
Page 89
land they occupy over the past five decades. All are grown mainly on big industrial
farms.
Since the 1960s, 140 Mha of land have been taken over by monocultures. This
growth is clearly accelerating: almost 60% of this land use change occurred during
the last two decades. Not only these crops but also other monocultures grew at
very strong rates. The FAO calculates that in developing countries alone,
monoculture tree plantations grew by over 60%, from 95 to 154 Mha, between
1990 and 2010. Many of these new plantations are encroaching on natural forests,
but they are also increasingly taking over farmland.
Without significant changes in government policies, these commodity
monocultures are set to expand further. According to the FAO, between now and
2050, the world's soybean cultivation area will increase by one third to some 125
Mha, the sugar cane area by 28% to 27 Mha, and the rapeseed area by 16% to 36
Mha (Alexandratos and Bruinsma, 2012). As for oil palm, there are currently 15
Mha of palm oil are used to produce edible oils. Depending on dietary patterns
and yields, an additional 19-29 Mha of palm oil area has to come into production
by 2050 (Corley, 2008). Much of this expansion will occur in Africa, Asia, and Latin
America. Soybean and sugar cane are currently mostly produced in Latin
America, and oil palm in Asia, but these crops are also expanding in Africa and
Latin America as part of the global wave of land grabbing.
As biomass production for (export) markets expands, more and more countries
find themselves with development pathways based on biomass extraction for
export. The case studies on Indonesia, Paraguay, and Ethiopia in this report are
examples for economies basing their economic development mainly on the
extraction and export of natural resources (the first two cases), or economies
where many signs indicate that government policies are leading to such economic
development (Ethiopia). The main agricultural exports from Indonesia and
Paraguay are palm oil for the first and soy and derived products in the latter case.
Fig. 14
The global encroachment of industrial crops (primary y axis) and the evolution of global cereal production area (secondary y axis). Data given in Mha of harvested area
Data Source: FAOSTAT, 2014

Hazards of the corporate food regime and the importance of smallholder farming
Page 90
Both products stem from so-called flex crops that have a variety of uses, e.g.,
direct human consumption, high protein animal fodder, or for the production of
agrofuels. The flexibility of uses keeps these crops economically viable and prices
less dependent upon global demand for one category of use. Transnational
corporations and investment companies are directing their investment capital
towards the acquisition of lands for the production of such flex crops. In the case
of Indonesian palm oil, a large share is now directed to feed monogastric livestock
in Asia, as well as to be consumed as vegetable oil, mostly in China and India.
These new competitors for Indonesian palm oil trigger shifts in European trade
patterns, traditionally a major consumer of Indonesian palm oil that now has to
seek for other sources for its crop imports. Overall, Europe and East Asia are now
dependent on biomass imports, which is one explaining factor for their
involvement in global investments in large-scale land deals (The Land Matrix
Global Observatory, 2015).
One major target country for large-scale land deals is Ethiopia (Horne and
Mousseau, 2011). Ethiopia has been known to the outside world as a country of
famine, food shortages, endemic hunger, and chronic dependency on foreign aid.
However, the case study on Ethiopia lists 296 active projects focused on the
production of agricultural export commodities currently covering 0.7 Mha and
intended for expansion to nearly 5 Mha. Government officials have clearly
announced that Ethiopia strives to become a major agricultural exporter in the
next decades (Chapter 5.3). This development is intended to bring foreign
revenues to Ethiopia, which is currently one of the largest recipients of food aid
globally.
Whom this export-driven development benefits, depends on how the entailed
income is distributed within the country and how the environmental and social
impacts of this development pathway are regulated or absorbed. Various critical
voices have supplied evidence that adverse environmental and social impacts of
large-scale land acquisitions can already be observed, with few or no alternatives
available to the local population (Horne and Mousseau, 2011). As local
subsistence systems are displaced, important knowledge of smallholders,
pastoralists, indigenous people, and traditional communities for agricultural
production within the limits of local sustainability is lost. The integration of all
population segments into market-based agri-food systems is often not successful
and results in declining local food security and sovereignty (Pokorny et al., 2013).
This report has identified changes in global patterns of biomass production and
trade which have accompanied the development of the third food regime with its
restructuring of global agriculture. The specific form of a country’s integration into
the global food market has been found to be potentially decisive in issues of food
security and sovereignty. Food import dependency signifies that large shares of
the population’s food demand must be met via markets with possibly detrimental
effects for those who do not have unrestricted access to these markets. Import
dependency for staple foods is often linked to a focus on the production of (flex)
crops for export within the country – a production which displaces subsistence
agriculture and causes larger segments of the population to depend on access to
Hazards of the corporate food regime and the importance of smallholder farming
Page 91
food markets. The case studies on Indonesia, Paraguay, and Ethiopia showed
very clearly that an export orientation of agriculture often fails to deliver the
promised or envisioned societal benefits. The numerous socio-environmental
conflicts that were collected during the EJOLT project provide evidence that a
continuation of the third food regime bears high conflict potential.
Acknowledgements
Page 92
Acknowledgments
The authors of the study would like to thank Beatriz Rodríguez-Labajos, Leah
Temper, Joan Martinez-Alier and Serah Munguti for reviewing former versions of
this report, Ursula Lindenberg for help during language editing, and Thomas
Kastner for data support.
References
Page 93
References
References chapters 1, 2, 3, 4, and 6
Alexandratos, N.; Bruinsma, J.,
2012. World agriculture towards
2030/2050. The 2012 revision”, FAO,
Rome.
Altieri, M.A., 2009. Agroecology,
Small Farms, and Food Sovereignty.
Monthly Review 61, 102–113.
Ayres, R.U., 2014. The bubble
economy: is sustainable growth
possible? The MIT Press,
Cambridge, Massachusetts.
Barbier, E.B., 2010. Scarcity and
Frontiers: How Economies Have
Developed Through Natural
Resource Exploitation. Cambridge
University Press.
Beddington, J., 2010. Food security:
contributions from science to a new
and greener revolution. Philosophical
Transactions of the Royal Society B:
Biological Sciences 365, 61 –71.
doi:10.1098/rstb.2009.0201
Berthelot, J., 2001. A qui profite
l’aide alimentaire ? l’Ecologiste 3.
Borras, S.M., Franco, J.C., Gómez,
S., Kay, C., Spoor, M., 2012. Land
grabbing in Latin America and the
Caribbean. Journal of Peasant
Studies 39, 845–872.
doi:10.1080/03066150.2012.679931
Burnett, K., Murphy, S., 2014. What
place for international trade in food
sovereignty? Journal of Peasant
Studies 0, 1–20.
doi:10.1080/03066150.2013.876995
Cadot, O., Malouche, M., Sáez, S.,
2012. Streamlining Non-Tariff
Measures: A Toolkit for Policy
Makers. World Bank Publications.
Carvalho, G.O., Nepstad, D.,
McGrath, D., del Carmen Vera Diaz,
M., Santilli, M., Barros, A.C., 2002.
Frontier Expansion in the Amazon:
Balancing Development and
Sustainability. Environment: Science
and Policy for Sustainable
Development 44, 34–44.
doi:10.1080/00139150209605606
Chaifetz, A., Jagger, P., 2014. 40
Years of dialogue on food
sovereignty: A review and a look
ahead. Global Food Security.
doi:10.1016/j.gfs.2014.04.002
Corley, R.H.V., 2009. How much
palm oil do we need? Environmental
Science & Policy 12, 134–139.
doi:10.1016/j.envsci.2008.10.011
Cotula, L., Vermeulen, S., Leonard,
R., Keeley, J., 2009. Land grab or
development opportunity?:
agricultural investment and
international land deals in Africa.
Iied.
Del Ninno, C., Dorosh, P.A.,
Subbarao, K., 2007. Food aid,
domestic policy and food security:
Contrasting experiences from South
References
Page 94
Asia and sub-Saharan Africa. Food
Policy 32, 413–435.
doi:10.1016/j.foodpol.2006.11.007
Dörre, K., 2011. Social Classes in
the Process of Capitalist
Landnahme: On the Relevance of
Secondary Exploitation. Socialist
Studies / Études socialistes 6.
E&N Negocios, 2013. Parkia e
brasileira, diz fibria sobre venda a
terreno.
Erb, K.-H., Krausmann, F., Lucht,
W., Haberl, H., 2009. Embodied
HANPP: Mapping the spatial
disconnect between global biomass
production and consumption.
Ecological Economics 69, 328–334.
doi:10.1016/j.ecolecon.2009.06.025
Erb, K.-H., Haberl, H., Plutzar, C.,
2012a. Dependency of global
primary bioenergy crop potentials in
2050 on food systems, yields,
biodiversity conservation and
political stability. Energy Policy 47,
260–269.
doi:10.1016/j.enpol.2012.04.066
Erb, K.-H., Mayer, A., Kastner, T.,
Sallet, K., Haberl, H., 2012b. The
Impact of Industrial Grain Fed
Livestock Production on Food
Security: an extended literature
review (No. 136), Social Ecology
Working Paper. Vienna.
Ericksen, P.J., Ingram, J.S.I.,
Liverman, D.M., 2009. Food security
and global environmental change:
emerging challenges. Environmental
Science & Policy 12, 373–377.
doi:10.1016/j.envsci.2009.04.007
Espectador.com, 2014. Montes del
Plata “es el eslabón final que
conecta una cadena productiva muy
grande con el mundo.”
EUROSTAT, 2012. Economy-wide
material flow accounts compilation
guide. EUROSTAT, Bruxelles.
Evans, P., Walsh, J., Unit, E.I.,
Britain, G., 1995. The EIU guide to
world trade under the WTO.
Economist Intelligence Unit.
Evenson, R.E., Gollin, D., 2003.
Assessing the Impact of the Green
Revolution, 1960 to 2000. Science
300, 758–762.
doi:10.1126/science.1078710
Fafchamps, M., 1992. Cash Crop
Production, Food Price Volatility, and
Rural Market Integration in the Third
World. American Journal of
Agricultural Economics 74, 90.
doi:10.2307/1242993
Fafchamps, M., Hill, R.V., 2005.
Selling at the Farmgate or Traveling
to Market. American Journal of
Agricultural Economics 87, 717–734.
doi:10.1111/j.1467-
8276.2005.00758.x
Fairbairn, M., 2008. Framing
resistance: International food
regimes and the roots of food
sovereignty. University of Wisconsin.
FAO, 2001. Ayuda alimentaria en el
contexto de las negociaciones de la
OMC sobre Agricultura [WWW
Document]. URL
http://www.fao.org/docrep/005/y3733
s/y3733s06.htm (accessed
11.12.14).
FAOSTAT, 2014. FAOSTAT
Database. Food and Agriculture
Organization of the United Nations
(FAO), Rome.
Fischer, G., Hizsnyik, E., Prieler, S.,
Shah, M., Veltuizen, H. van, 2009.
Agro-fuels and Food Security. IIASA,
OFID, Vienna, Laxenburg, Austria.
References
Page 95
Fischer, G., Shah, M., van
Velthuizen, H., Nachtergaele, F.,
2001. Global agro-ecological
assessment for agriculture in the
21st century. IIASA.
Fischer-Kowalski, M., Haberl, H.,
Hüttler, W., Payer, H., Schandl, H.,
Winiwarter, V., Zangerl-Weisz, H.,
1997. Gesellschaftlicher
Stoffwechsel und Kolonisierung von
Natur. Ein Versuch in Sozialer
Ökologie. Gordon & Breach
Fakultas, Amsterdam.
Fischer-Kowalski, M., Krausmann,
F., Pallua, I., 2014. A sociometabolic
reading of the Anthropocene: Modes
of subsistence, population size and
human impact on Earth. The
Anthropocene Review
2053019613518033.
doi:10.1177/2053019613518033
Foster, J.B., 2010. Why Ecological
Revolution? Montly Review Issue 08.
Franco, J., Borras, S.M.J., 2013.
Land concentration, land grabbing
and people’s struggles in Europe. a
joint project of TNI, FIAN
International, FIAN Netherlands,
FIAN Germany, FIAN Austria, IGO in
Poland and FDCL in Germany.
Friedmann, H., 1982. The Political
Economy of Food: The Rise and Fall
of the Postwar International Food
Order. American Journal of
Sociology 88, 248–286.
Friedmann, H., 2009. Discussion:
moving food regimes forward:
reflections on symposium essays.
Agriculture and Human Values 26,
335–344. doi:10.1007/s10460-009-
9225-6
Friedmann, H., McMichael, P., 1989.
AGRICULTURE AND THE STATE
SYSTEM: The rise and decline of
national agricultures, 1870 to the
present. Sociologia Ruralis 29, 93–
117. doi:10.1111/j.1467-
9523.1989.tb00360.x
Fritsche, U.R., Sims, R.E.H., Monti,
A., 2010. Direct and indirect land-use
competition issues for energy crops
and their sustainable production - an
overview. Agro-fuels, Bioproducts
and Biorefining 4, 692–704.
doi:10.1002/bbb.258
Fritz, T., 2011. Globalising Hunger:
Food Security and the EU’s
Common Agricultural Policy (CAP).
FDCL-Verlag.
FSC Forest Stewardship Council,
2012. FORESTS AND CLIMATE
CHANGE.
FSC Forest Stewardship Council,
2013. FSC certification and carbon
claims.
FSC Forest Stewardship Council,
2014a. Facts & Figures.
FSC Forest Stewardship Council,
2014b. Green Wood Resources
earns first dual FSC/RSB Bio-fuels
Certification.
Galloway, J.N., Burke, M., Bradford,
G.E., Naylor, R., Falcon, W.,
Chapagain, A.K., Gaskell, J.C.,
McCullough, E., Mooney, H.A.,
Oleson, K.L.L., Steinfeld, H.,
Wassenaar, T., Smil, V., 2007.
International Trade in Meat: The Tip
of the Pork Chop. AMBIO: A Journal
of the Human Environment 36, 622–
629. doi:10.1579/0044-
7447(2007)36[622:ITIMTT]2.0.CO;2
Gartland, K., Kellison, R., Fenning,
T., 2003. FOREST
BIOTECHNOLOGY AND
References
Page 96
EUROPE’S FORESTS OF THE
FUTURE.
Gelan, A.U., 2007. Does food aid
have disincentive effects on local
production? A general equilibrium
perspective on food aid in Ethiopia.
Food Policy 32, 436–458.
Godfray, H.C.J., Beddington, J.R.,
Crute, I.R., Haddad, L., Lawrence,
D., Muir, J.F., Pretty, J., Robinson,
S., Thomas, S.M., Toulmin, C.,
2010a. Food Security: The
Challenge of Feeding 9 Billion
People. Science 327, 812–818.
doi:10.1126/science.1185383
Godfray, H.C.J., Crute, I.R., Haddad,
L., Lawrence, D., Muir, J.F., Nisbett,
N., Pretty, J., Robinson, S., Toulmin,
C., Whiteley, R., 2010b. The future
of the global food system.
Philosophical Transactions of the
Royal Society B: Biological Sciences
365, 2769–2777.
doi:10.1098/rstb.2010.0180
Gonzalez, C., 2002. Institutionalizing
inequality: the WTO Agreement on
Agriculture, food security, and
developing countries. Columbia
Journal of Environmental Law 27,
433.
Govereh, J., Jayne, T. s., 2003.
Cash cropping and food crop
productivity: synergies or trade-offs?
Agricultural Economics 28, 39–50.
doi:10.1111/j.1574-
0862.2003.tb00133.x
GRAIN, 2014. Hungry for land: small
farmers feed the world with less than
a quarter of all farmland. GRAIN,
Barcelona, Spain.
GRAIN, Martinez-Alier, J., Temper,
L., Munguti, S., Matiku, P., Ferreira,
H., Soares, W., Firpo, M.,
Raharinirina, V., Haas, W., Singh,
S.J., Mayer, A., 2014. The many
faces of land grabbing. Cases from
Africa and Latin America (No. 10),
EJOLT report.
Gudynas, E., 2010. The new
extractivism of the 21st century.
Center for International Policy.
Washington, DC.
Gunkel, G., Kosmol, J., Sobral, M.,
Rohn, H., Montenegro, S., Aureliano,
J., 2007. Sugar Cane Industry as a
Source of Water Pollution – Case
Study on the Situation in Ipojuca
River, Pernambuco, Brazil. Water Air
Soil Pollut 180, 261–269.
doi:10.1007/s11270-006-9268-x
Gustavsson, J., Cederberg, C.,
Sonesson, U., Otterdijk, R. van,
Meybeck, A., 2011. Global food
losses and food waste. FAO, Rome.
Haberl, H., 2014. Competition for
land: A sociometabolic perspective.
Ecological Economics.
doi:10.1016/j.ecolecon.2014.10.002
Haberl, H., Erb, K.H., Krausmann,
F., Gaube, V., Bondeau, A., Plutzar,
C., Gingrich, S., Lucht, W., Fischer-
Kowalski, M., 2007. Quantifying and
mapping the human appropriation of
net primary production in earth’s
terrestrial ecosystems. PNAS 104,
12942–12947.
doi:10.1073/pnas.0704243104
Hamilton, N.D., 1993. Agriculture
without Farmers - Is Industrialization
Restructing American Food
Production and Threatening the
Future of Sustainable Agriculture. N.
Ill. U. L. Rev. 14, 613.
Harvey, D., 2005. The new
imperialism. Oxford University Press,
New York.
References
Page 97
Hendrix, C.S., Brinkman, H.-J., 2013.
Food Insecurity and Conflict
Dynamics: Causal Linkages and
Complex Feedbacks. Stability:
International Journal of Security &
Development 2, 26.
doi:10.5334/sta.bm
Ibá, 2014. Ibá - Nova associação
permitirá duplicar base florestal.
Jayne, T.S., 2002. Managing food
price instability in East and Southern
Africa. Global Food Security.
doi:10.1016/j.gfs.2012.10.002
Jayne, T.S., Govereh, J.,
Mwanaumo, A., Nyoro, J.K.,
Chapoto, A., 2002. False Promise or
False Premise? The Experience of
Food and Input Market Reform in
Eastern and Southern Africa. World
Development 30, 1967–1985.
doi:10.1016/S0305-750X(02)00115-
8
Jayne, T.S., Jones, S., 1997. Food
marketing and pricing policy in
Eastern and Southern Africa: A
survey. World Development 25,
1505–1527. doi:10.1016/S0305-
750X(97)00049-1
Jumbe, C.B.L., Msiska, F.B.M.,
Madjera, M., 2009. Agro-fuels
development in Sub-Saharan Africa:
Are the policies conducive? Energy
Policy 37, 4980–4986.
doi:10.1016/j.enpol.2009.06.064
Kastner, T., Erb, K.-H., Haberl, H.,
2014. Rapid growth in agricultural
trade: effects on global area
efficiency and the role of
management. Environ. Res. Lett. 9,
034015. doi:10.1088/1748-
9326/9/3/034015
Kastner, T., Rivas, M.J.I., Koch, W.,
Nonhebel, S., 2012. Global changes
in diets and the consequences for
land requirements for food. PNAS
201117054.
doi:10.1073/pnas.1117054109
Keet, D., 2000. Alternatives to the
WTO regime. Cape Town.
Krausmann, F., Erb, K.-H., Gingrich,
S., Haberl, H., Bondeau, A., Gaube,
V., Lauk, C., Plutzar, C.,
Searchinger, T.D., 2013. Global
human appropriation of net primary
production doubled in the 20th
century. PNAS 201211349.
doi:10.1073/pnas.1211349110
Krausmann, F., Erb, K.H., Gingrich,
S., Lauk, C., Haberl, H., 2008a.
Global patterns of socioeconomic
biomass flows in the year 2000: A
comprehensive assessment of
supply, consumption and constraints.
Ecological Economics 65, 471–487.
Krausmann, F., Fischer‐Kowalski,
M., Schandl, H., Eisenmenger, N.,
2008b. The global sociometabolic
transition. Journal of Industrial
Ecology 12, 637–656.
Krausmann, F., Haberl, H., Erb,
K.H., Wiesinger, M., Gaube, V.,
Gingrich, S., 2009. What determines
geographical patterns of the global
human appropriation of net primary
production? Journal of Land Use
Science 4, 15–33.
KSH Consulting, 2014. Forest
Industry News.
Lapola, D.M., Schaldach, R.,
Alcamo, J., Bondeau, A., Koch, J.,
Koelking, C., Priess, J.A., 2010.
Indirect land-use changes can
overcome carbon savings from agro-
fuels in Brazil. Proceedings of the
National Academy of Sciences 107,
References
Page 98
3388–3393.
doi:10.1073/pnas.0907318107
Laroche Dupraz, C., Postolle, A.,
2013. Food sovereignty and
agricultural trade policy
commitments: How much leeway do
West African nations have? Food
Policy 38, 115–125.
doi:10.1016/j.foodpol.2012.11.005
Li, T.M., 2011. Centering labor in the
land grab debate. J. Peasant Stud.
38, 281–298.
doi:10.1080/03066150.2011.559009
Liu, J., Hull, V., Batistella, M.,
DeFries, R., Dietz, T., Fu, F., Hertel,
T.W., Izaurralde, R.C., Lambin, E.F.,
Li, S., Martinelli, L.A., McConnell,
W.J., Moran, E.F., Naylor, R.,
Ouyang, Z., Polenske, K.R.,
Reenberg, A., de Miranda Rocha,
G., Simmons, C.S., Verburg, P.H.,
Vitousek, P.M., Zhang, F., Zhu, C.,
2013. Framing Sustainability in a
Telecoupled World. Ecology and
Society 18. doi:10.5751/ES-05873-
180226
Madeley, J., 2000. Trade and
Hunger. GRAIN, Barcelona. [WWW
Document] URL.
http://www.grain.org/article/entries/2
12-trade-and-hunger (accessed
11.2.2014)
Mahieu, F.-R., 2008. Face Aux
«Sacrifices Humains», Le
Développement Humainement
Soutenable. Revue Tiers Monde
495–506.
McMichael, A.J., Powles, J.W.,
Butler, C.D., Uauy, R., 2007. Food,
livestock production, energy, climate
change, and health. The Lancet 370,
1253–1263. doi:16/S0140-
6736(07)61256-2
McMichael, P., 2006. Global
Development and The Corporate
Food Regime, in: Research in Rural
Sociology and Development.
Emerald (MCB UP ), Bingley, pp.
265–299.
McMichael, P., 2011. The Food
Regime in the Land Grab:
Articulating “Global Ecology”and
Political Economy, in: International
Conference on Global Land
Grabbing. pp. 6–8.
McMichael, P., 2011. Food system
sustainability: Questions of
environmental governance in the
new world (dis)order. Global
Environmental Change, Symposium
on Social Theory and the
Environment in the New World
(dis)Order 21, 804–812.
doi:10.1016/j.gloenvcha.2011.03.016
McMichael, P., 2012. The land grab
and corporate food regime
restructuring. Journal of Peasant
Studies 39, 681–701.
doi:10.1080/03066150.2012.661369
McMichael, P., 2013a. Land
Grabbing as Security Mercantilism in
International Relations.
Globalizations 10, 47–64.
doi:10.1080/14747731.2013.760925
McMichael, P., 2013b. Historicizing
Rood Sovereignty: a Food Regime
Perspective, in: Food Sovereignty: A
Critical Dialogue. Presented at the
Food Sovereignty: A Critical
Dialogue, Yale University.
Messer, E., Cohen, M.J., 2006.
Conflict, Food Insecurity, and
Globalization, IFPRI Division
Discussion Paper. IFPRI,
Washington D.C.
References
Page 99
Moseley, W.G., Carney, J., Becker,
L., 2010. Neoliberal policy, rural
livelihoods, and urban food security
in West Africa: A comparative study
of The Gambia, Côte d’Ivoire, and
Mali. PNAS 107, 5774–5779.
doi:10.1073/pnas.0905717107
Mueller, N.D., Gerber, J.S.,
Johnston, M., Ray, D.K.,
Ramankutty, N., Foley, J.A., 2012.
Closing yield gaps through nutrient
and water management. Nature 490,
254–257. doi:10.1038/nature11420
Murphy, C.N., 2000. Global
Governance: Poorly done and Poorly
Understood. International Affairs 76,
789–804. doi:10.1111/1468-
2346.00165
Murphy, S., McAfee, K., 2005. US
Food Aid: Time To Get It Right
(Minneapolis: Institute for Agriculture
and Trade Policy).
Ng, F., Aksoy, M.A., 2008. Food
price increases and net food
importing countries: lessons from the
recent past. Agricultural Economics
39, 443–452. doi:10.1111/j.1574-
0862.2008.00350.x
Nwakeze, Ngozi M., and Anke
Schaffartzik. “Revisiting Boserup’s
Hypotheses in the Context of Africa.”
In Ester Boserup’s Legacy on
Sustainability - Orientations for
Contemporary Research, 4:175–88.
Human-Environment Interactions.
Dordrecht, Netherlands: Springer,
2014.
NZPA, 2015. Global Food Regimes
[WWW Document]. URL
http://peasants.org.nz/food/global-
food-regimes/ (accessed 11.12.14).
Odegard, I.Y.R., van der Voet, E.,
2014. The future of food —
Scenarios and the effect on natural
resource use in agriculture in 2050.
Ecological Economics 97, 51–59.
doi:10.1016/j.ecolecon.2013.10.005
Overbeek, W., Kröger, M., Gerber,
J.-F., 2012. An overview of industrial
tree plantation conflicts in the global
South. Conflicts, trends, and
resistance struggles. (No. 03), Ejolt
report.
Pimentel, D., Hurd, L.E., Bellotti,
A.C., Forster, M.J., Oka, I.N.,
Sholes, O.D., Whitman, R.J., 1973.
Food Production and the Energy
Crisis. Science 182, 443–449.
doi:10.1126/science.182.4111.443
Poulton, C., Dorward, A., Kydd, J.,
1998. The revival of smallholder
cash crops in Africa: public and
private roles in the provision of
finance. J. Int. Dev. 10, 85–103.
doi:10.1002/(SICI)1099-
1328(199801)10:1<85::AID-
JID502>3.0.CO;2-V
Reardon, T., Timmer, C.P., 2014.
Five inter-linked transformations in
the Asian agrifood economy: Food
security implications. Global Food
Security.
doi:10.1016/j.gfs.2014.02.001
Reich, A., 2004. WTO as a Law-
Harmonizing Institution, The. U. Pa.
J. Int’l Econ. L. 25, 321.
Rudel, T.K., Schneider, L., Uriarte,
M., Turner, B.L., 2nd, DeFries, R.,
Lawrence, D., Geoghegan, J., Hecht,
S., Ickowitz, A., Lambin, E.F.,
Birkenholtz, T., Baptista, S., Grau,
R., 2009. Agricultural intensification
and changes in cultivated areas,
1970-2005. Proc. Natl. Acad. Sci.
U.S.A. 106, 20675–20680.
doi:10.1073/pnas.0812540106
References
Page 100
Schaffartzik, A., Mayer, A., Gingrich,
S., Eisenmenger, N., Loy, C.,
Krausmann, F., 2014. The global
metabolic transition: Regional
patterns and trends of global
material flows, 1950–2010. Global
Environmental Change 26, 87–97.
doi:10.1016/j.gloenvcha.2014.03.013
Scoones, I., Smalley, R., Hall, R.,
Tsikata, D., 2014. FAC Working
Paper 76. Narratives of scarcity:
understanding the global resource
grab. Brigthon, UK.
Shoeman, A., 2010. The CAP or the
Catastrophic Agricultural Policy |
Europe - 27etc. [WWW Document]
URL. http://blog.slate.fr/europe-
27etc/3377/the-cap-or-the-
catastrophic-agricultural-policy/
(accessed 11.2.2014)
Sieferle, R.P., 1997. Rückblick auf
die Natur: eine Geschichte des
Menschen und seiner Umwelt.
Luchterhand.
Skogstad, G., Skogstad, P. in the D.
of P.S.G., Verdun, A., 2013. THE
COMMON AGRICULTURAL
POLICY - SK: Policy Dynamics in a
Changing Context. Routledge.
Smith, P., Bustamante, M.,
Ahammad, H., Berndes, G.,
Böttcher, H., Clark, H., Dong, H.,
Elsiddig, E.A., Erb, K.H., Haberl, H.,
Harper, R., Herrero, M., HOUSE,
J.I., Jafari, M., Lauk, C., Masera, O.,
Mbow, C., de Siqueira Pinto, A.,
Popp, A., Ravindranath, N.H., Rice,
C.W., Robledo Abad, C.,
Romanovskaya, A., Rose, S.,
Sperling, F., Sohi, S., Tubiello, F.,
Zougmore, R., 2013. How much land
based greenhouse gas mitigation
can be achieved without
compromising food security and
environmental goals? Global Change
Biol 19, 2285–2302.
Smith, P., Gregory, P.J., van Vuuren,
D., Obersteiner, M., Havlík, P.,
Rounsevell, M., Woods, J., Stehfest,
E., Bellarby, J., 2010. Competition
for land. Philosophical Transactions
of the Royal Society B: Biological
Sciences 365, 2941 –2957.
doi:10.1098/rstb.2010.0127
Souza, I.G. de, Overbeek, W., 2013.
Eucalyptus Plantations for Energy: A
Case Study of Suzano’s plantations
for wood pellet exports in the Baixo
Parnaíba region, Maranhão, Brazil,
Biomass: The Chain of Destruction.
WRM and Cepedes.
Steinberger, J.K., Krausmann, F.,
Eisenmenger, N., 2010. Global
patterns of materials use: A
socioeconomic and geophysical
analysis. Ecological Economics 69,
1148–1158.
doi:10.1016/j.ecolecon.2009.12.009
Suzano, 2014. Suzano Papel e
Celulose inaugurou a fábrica em
Imperatriz.
Tekere, M., 2000. The New ACP -
EU (Cotonou) Agreement: User’s
Guide, Part 3; The Trade Provisions
of the New Agreement United.
The Land Matrix Global Observatory,
2015. [WWW Document]. URL.
http://www.landmatrix.org/en/
(accessed 12.2.2015)
Tilman, D., Cassman, K.G., Matson,
P.A., Naylor, R., Polasky, S., 2002.
Agricultural sustainability and
intensive production practices.
Nature 418, 671–677.
doi:10.1038/nature01014
Watkins, M.H., 1963. A Staple
Theory of Economic Growth. The
References
Page 101
Canadian Journal of Economics and
Political Science / Revue canadienne
d’Economique et de Science
politique 29, 141–158.
doi:10.2307/139461
West, P.C., Gerber, J.S., Engstrom,
P.M., Mueller, N.D., Brauman, K.A.,
Carlson, K.M., Cassidy, E.S.,
Johnston, M., MacDonald, G.K.,
Ray, D.K., Siebert, S., 2014.
Leverage points for improving global
food security and the environment.
Science 345, 325–328.
doi:10.1126/science.1246067
Woodroffe, R., Thirgood, S.,
Rabinowitz, A., 2005. People and
Wildlife, Conflict or Co-existence?
Cambridge University Press.
World Rainforest Movement, 2011.
Brazil: The case of Plantar – the
FSC at the service of the sale of
carbon credits.
World Rainforest Movement, 2014a.
Nuevas tendencias en la expansión
de los monocultivos industriales de
árboles en América Latina. WRM.
World Rainforest Movement, 2014b.
EU support for wood-based
“bioenergy” fuels forest destruction
and land-grabbing. WRM.
World Rainforest Movement, 2014c.
Plants designed for deconstruction?
The use of wood cellulose for fuels.
World Rainforest Movement, 2014d.
Trade in Ecosystem Services: When
“payment for environmental services”
delivers a permit to destroy. Report
written by Jutta Kill. WRM.
WTO, 2015. World Trade
Organization Glossary. [WWW
Document] URL
http://www.wto.org/english/thewto_e/
glossary_e/glossary_e.htm
(accessed 11.02.2015)
Young, A., 1999. Is there Really
Spare Land? A Critique of Estimates
of Available Cultivable Land in
Developing Countries. Environment,
Development and Sustainability 1,
3–18. doi:10.1023/A:1010055012699
Zeller, C., 2007. From the gene to
the globe: Extracting rents based on
intellectual property monopolies.
Review of International Political
Economy 15, 86–115.
References 5.1 Indonesia
Badan Pusat Statistik, 2012. Statistik
Kelapa Sawit Indonesia 2012
[Indonesian Palm Oil Statistics].
Badan Pusat Statistik [Statistics
Indonesia], Jakarta.
Benda-Beckmann, F. von, Benda-
Beckmann, K. von, 2010. Multiple
Embeddedness and Systemic
Implications: Struggles over Natural
Resources in Minangkabau since the
Reformasi. Asian J. Soc. Sci. 38,
172–186.
Colchester, M., Chao, S., 2013.
Conflict or Consent? The oil palm
sector at a crossroads. Forest
Peoples Programme, Sawit Watch
and TUK Indonesia.
Colchester, M., Jiwan, N., Sirait, M.,
Andiko, Firdaus, A., Surambo, A.,
Pane, H., 2006. Promised land: Palm
oil and land acquisition in Indonesia:
Implications for local communities
and indigenous peoples. Forest
Peoples Programme (FPP) / Sawit
Watch, Bogor.
FAOSTAT, 2014. FAOSTAT
Database. Food and Agriculture
References
Page 102
Organization of the United Nations
(FAO), Rome.
Fargione, J., Hill, J., Tilman, D.,
Polasky, S., Hawthorne, P., 2008.
Land Clearing and the Agrofuel
Carbon Debt. Science 319, 1235–
1238. doi:10.1126/science.1152747
Farid, H., 2005. Indonesia’s original
sin: mass killings and capitalist
expansion, 1965–66. Inter-Asia Cult.
Stud. 6, 3–16.
doi:10.1080/1462394042000326879
Fitzherbert, E.B., Struebig, M.J.,
Morel, A., Danielsen, F., Brühl, C.A.,
Donald, P.F., Phalan, B., 2008. How
will oil palm expansion affect
biodiversity? Trends Ecol. Evol. 23,
538–545.
doi:10.1016/j.tree.2008.06.012
Gerber, J.-F., 2011. Conflicts over
industrial tree plantations in the
South: Who, how and why? Glob.
Environ. Change 21, 165–176.
doi:10.1016/j.gloenvcha.2010.09.005
Germer, J., Sauerborn, J., 2008.
Estimation of the impact of oil palm
plantation establishment on
greenhouse gas balance. Environ.
Dev. Sustain. 10, 697–716.
doi:10.1007/s10668-006-9080-1
Kementerian Pertanian Republik
Indonesia, 2013. Basis Data Statistik
Pertanian [Agricultural Statistical
Database]. Kementerian Pertanian
Republik Indonesia [Ministry of
Agriculture, Republic of Indonesia],
Jakarta.
Koh, L.P., Wilcove, D.S., 2008. Is oil
palm agriculture really destroying
tropical biodiversity? Conserv. Lett.
1, 60–64. doi:10.1111/j.1755-
263X.2008.00011.x
Larsen, R.K., Jiwan, N., Rompas, A.,
Jenito, J., Osbeck, M., Tarigan, A.,
2014. Towards “hybrid
accountability” in EU agro-fuels
policy? Community grievances and
competing water claims in the
Central Kalimantan oil palm sector.
Geoforum 54, 295–305.
doi:10.1016/j.geoforum.2013.09.010
Li, T.M., 2011. Centering labor in the
land grab debate. J. Peasant Stud.
38, 281–298.
doi:10.1080/03066150.2011.559009
Maddox, T., Priatna, D., Gemita, E.,
Salampessy, A., 2007. The
Conservation of Tigers and Other
Wildlife in Oil Palm Plantations:
Jambi Province, Sumatra, Indonesia,
ZSL Conservation Report. Zoological
Society of London (ZSL), London.
Marti, S., 2008. Losing Ground. The
human rights impacts of oil palm
plantation expansion in Indonesia.
Friends of the Earth, LifeMosaic,
Sawit Watch.
McCarthy, J.F., 2004. Changing to
Gray: Decentralization and the
Emergence of Volatile Socio-Legal
Configurations in Central
Kalimantan, Indonesia. World Dev.
32, 1199–1223.
doi:10.1016/j.worlddev.2004.02.002
McCarthy, J.F., Gillespie, P., Zen, Z.,
2012. Swimming Upstream: Local
Indonesian Production Networks in
“Globalized” Palm Oil Production.
World Dev. 40, 555–569.
doi:10.1016/j.worlddev.2011.07.012
Ministry of Agriculture, 2007.
Regulation of Minister of Agriculture
Number:
26/Permentan/OT.140/2/2007
Regarding Plantation Business
Permit Guidelines. Jakarta.
References
Page 103
Peluso, N.L., Afiff, S., Rachman,
N.F., 2008. Claiming the Grounds for
Reform: Agrarian and Environmental
Movements in Indonesia. J. Agrar.
Change 8, 377–407.
doi:10.1111/j.1471-
0366.2008.00174.x
Rachman, N.F., 2011. The
resurgence of land reform policy and
agrarian movements in Indonesia.
University of California, Berkeley.
Reijnders, L., Huijbregts, M.A.J.,
2008. Palm oil and the emission of
carbon-based greenhouse gases. J.
Clean. Prod. 16, 477–482.
doi:10.1016/j.jclepro.2006.07.054
Republik Indonesia, 1960. Undang-
Undang Republik Indonesia No. 5
Tahun 1960 tentang Peraturan
Dasar Pokok-Pokok Agraria. Jakarta.
Republik Indonesia, 2004. Undang-
Undang Nomor 18 Tahun 2004.
Tentang Perkebunan. Jakarta.
Schaffartzik, A., Mayer, A., Gingrich,
S., Eisenmenger, N., Loy, C.,
Krausmann, F., 2014. The global
metabolic transition: Regional
patterns and trends of global
material flows, 1950–2010. Glob.
Environ. Change 26, 87–97.
doi:10.1016/j.gloenvcha.2014.03.013
Waren, C., Lucas, A., 2013.
Indonesia’s Land Titling Program
(LAP) – the Market Solution?, in:
Waren, C., Lucas, A. (Eds.), Land for
the People: The State and Agrarian
Conflict in Indonesia. Ohio University
Press/Swallow Press, Athens, USA,
pp. 93–113.
World Bank, 2014. Land Policy:
Sector Results Profile. Securing
Land Tenure Rights to Reduce
Poverty and Promote Growth. The
World Bank Group, Washington,
D.C.
Zen, Z., Barlow, C., Gondowarsito,
R., 2005. Oil palm in Indonesian
socio-economic improvement a
review of options, Working Papers in
Trade and Development. Research
School of Pacific and Asian Studies,
ANU, Canberra.
Zhou, Adrian, and Elspeth Thomson.
2009. “The Development of Biofuels
in Asia.” Applied Energy, Bio-fuels in
Asia, 86, Supplement 1 (November):
S11–20.
doi:10.1016/j.apenergy.2009.04.028
References 5.2 Paraguay
CAPECO, 2015. La Cámara
Paraguaya de Exportadores y
Comercializadores de Cereales y
Oleaginosas (Paraguayan chamber
of cereal exporters). [WWW
Document] URL.
http://capeco.edu.pe/web/index.php
(accessed 12.2.2015).
Galeano, Luis A. 2012 Paraguay and
the Expansion of Brazilian and
Argentinian Agribusiness Frontiers.
Canadian Journal of Development
Studies/Revue Canadienne D’études
Du Développement 33(4): 458–470.
Guereña, A. 2013.El Espejismo de
La Soya: Los Límites de La
Responsabilidad Social Empresarial:
El Caso de Desarrollo Agrícola Del
Paraguay. Informes de Oxfam.
Hanratty, D. M., & Meditz, S. W.
1990. Paraguay, a country study. ."
Library of Congress, Federal
Research Division
Heinemann, Jack. 2009. “hope not
hype”. penang: third world network
References
Page 104
Itriago, D. 2012. Taxation in
Paraguay: marginalization of small-
scale farming. Oxfam Research
Reports, May.
Jull, C. (Ed.). 2007. Recent trends in
the law and policy of bioenergy
production, promotion and use (No.
95). Food & Agriculture Org.
Malik, K. 2013. Human development
report 2013. The rise of the South:
Human progress in a diverse world.
McBride, W. d., Greene, C., 2009.
The profitability of organic soybean
production. Renewable Agriculture
and Food Systems 24, 276–284.
doi:10.1017/S1742170509990147.
Palau, T. 2004 Capitalismo Agrario Y
Expulsión Campesina: Avance Del
Monocultivo de Soja Transgénica En
El Paraguay. Universidad Católica.
Palau, T., 2007. Los refugiados del
modelo agroexportador: impactos
del monocultivo de soja en las
comunidades campesinas
paraguayas. BASE Investigaciones
Sociales.
Pengue, W. A. 2009 Cuestiones
Económico-Ambientales De Las
Transformaciones Agrícolas En Las
Pampas. Problemas del Desarrollo.
Revista Latinoamericana de
Economía. [WWW Document]. URL
http://www.redalyc.org/resumen.oa?i
d=11820087002, (accessed 22.10.
2014)
Riquelme, Q.2013 Otra Cara de La
Soja: El Impacto Del Agronegocio
Sobre La Produccion de Alimentos Y
La Agricultura Familiar Campesina
En El Paraguay. [WWW Document].
URL http://www.sidalc.net/cgi-
bin/wxis.exe/?IsisScript=NACION.xis
&method=post&formato=2&cantidad
=1&expresion=mfn=001044,
(accessed 30.10.2014.)
Schaffartzik, A., Mayer, A., Gingrich,
S., Eisenmenger, N., Loy, C.,
Krausmann, F., 2014. The global
metabolic transition: Regional
patterns and trends of global
material flows, 1950–2010. Global
Environmental Change 26, 87–97.
doi:10.1016/j.gloenvcha.2014.03.013
World Bank, 2015. The World Bank
Open Data. [WWW Document]. URL.
http://data.worldbank.org/ (accessed
12.2.2014)
WWF. 2014. The Growth of Soy:
Impacts and Solutions. WWF
International, Gland, Switzerland”
References 5.3 Ethiopia
Alemu, H. 2010. Saudi Star to
swallow 100,000sqm of Bishoftu
land. Addis Fortune. [WWW
Document]. URL
http://www.addisfortune.com/Vol%20
10%20No%20512%20Archive/Saudi
%20Star%20to%20Swallow%20100,
000sqm%20of%20Bishoftu%20Land
.htm (accessed 20.1.2015)
Capital Newspaper, 2010. Ethiopia
attracting huge agro-investment
projects. Capital. . [WWW
Document]. URL
http://www.capitalethiopia.com/index.
php?option=com_content&view=artic
le&id=12317:ethiopia-attracting-
huge-agro-investment-
projects&catid=11:news-in-
brief&Itemid=3 (accessed 20.1.2015)
CSA, 2009. Statistical abstract:
Section B – population. Addis
Ababa: Central Statistical Agency.
Empora, 2009. Investment in
Ethiopia. Coachcraft systems.
[WWW Document]. URL
References
Page 105
http://www.coachcraftsystems.
com/ccs_empora_short_description_
09.pdf (accessed 20.1.2015)
Environmental Justice
Organisations, Liabilities and Trade
(EJOLT), 2015. Mapping
Environmental Justice. [WWW
Document] URL
http://www.ejolt.org/maps/ (accessed
20.1.2015)
FAO, 2011. Crisis in the Horn of
Africa. Food and Agriculture
Organization of the United Nations.
[WWW Document]. URL
http://www.fao.org/emergencies/crisi
s/horn-of-africa/en/ (accessed
8.1.15).
Friis, C. and Reenberg, A. (2010).
Land grab in Africa: Emerging land
system. Drivers in a teleconnected
world. GLP Report No. 1. GLP-IPO,
Copenhagen.
Lavers, T. 2012a. Patterns of
agrarian transformation in Ethiopia:
State-mediated commercialisation
and the ‘land grab’. In: The Journal
of Peasant Studies, 39 (3-4). pp.
795-822
Lavers, T. 2012b. 'Land grab' as
development strategy? The political
economy of agricultural investment
in Ethiopia. Journal of Peasant
Studies, 39 (1). pp. 105-132
Maplecroft, 2014. [WWW
Document]. URL
https://www.maplecroft.com/about/ne
ws/food-security.html (accessed
20.1.2015)
Ministry of Agriculture and Rural
Development (MoARD), 2010. Land
rent contractual agreement made
between Ministry of Agriculture and
Saudi Star Agricultural Development
plc. Addis Ababa: MoARD.
Ministry of Agriculture and Rural
Development (MoARD), 2011.
Ethiopian agricultural portal. [WWW
Document]. URL
http://www.eap.gov.et/index.php?q=
node/835 (accessed 20.1.2015)
Ministry of Finance and Economic
Development (MoFED), 2002.
Ethiopia: sustainable development
and poverty reduction program.
Addis Ababa: MoFED, Federal
Democratic Republic of Ethiopia.
Ministry of Finance and Economic
Development (MoFED), 2003. Rural
development policy and strategies.
Addis Ababa: MoFED.
Ministry of Finance and Economic
Development (MoFED), 2005.
Ethiopia: Building on progress. A
plan for accelerated and sustained
development to end poverty
(PASDEP). Addis Ababa: MoFED.
Ministry of Finance and Economic
Development (MoFED), 2010.
Growth and transformation plan
(GTP). Addis Ababa: MoFED.
Ministry of Trade and Industry
(MoTI), 2008. Prohibition of barley
and millet export. Ministry of Trade
and Industry Directive No., 01-
85/213.
Oakland Institute 2011.
Understanding Land Investment
Deals in Africa – country Report
Ethiopia. Oakland: Oakland Institute.
Rahmato, D. 2003. Poverty and
agricultural involution. In: D.
Rahmato, ed. Some aspects of
poverty in Ethiopia. Addis Ababa:
Forum for Social Studies, pp. 1–15.
References
Page 106
Rahmato, D. 2009. The peasant and
the state: Studies in agrarian change
in Ethiopia 1950s -2000s. Addis
Ababa: Addis Ababa University
Press.
Tamirat, W. 2009. A Stranger Comes
to Town. Fortune News paper.
Volume 10, Number 486
World Food Programme (WFP),
2012. 2011 Food Aid Flows. Report.
[WWW Document]. URL
http://documents.wfp.org/stellent/gro
ups/public/documents/research/wfp2
50070.pdf (accessed 01.09.2014)
World Food Programme (WFP).
2015. Data base. [WWW Document].
URL
http://www.wfp.org/fais/reports/quanti
ties-delivered-two-dimensional-
report/run/cat/All/year/All/recipient/Et
hiopia/donor/All/code/All/mode/All/ba
sis/0/order/0m (accessed 10.1.2015)
Yassin, A. 2010. Large scale
transnational land acquisition in
Ethiopia – is it an acceleration for
development? The case of Bako and
Gambella region in Ethiopia.
Erasmus University of Rotterdam:
International Institute of Social
Studies.
References
Page 2
.org/reports
EJOLT Report No.: 00
.org/reports
EJOLT Report No.: 00
www.
www.