Embed Size (px)
Citation preview
EKONOMIA i ŚRODOWISKO
Journal of the Polish Association of Environmental and Resource Economists
E C O N O M I C S A N D E N V I R O N M E N T
No. 2 (69) • 2019
copyright © by: Fundacja Ekonomistów Środowiska i Zasobów Naturalnych Białystok 2019
ISSN 0867-8898 ISSN 2300-6420 (online)
Published by: Fundacja Ekonomistów Środowiska i Zasobów Naturalnych 15-092 Białystok, ul. Sienkiewicza 22 www.fe.org.pl; e-mail: [email protected]
Publishing: Agencja Wydawnicza EkoPressProcess Manager Andrzej Poskrobko / tel. 601 311 838
Printed by: Zakład Poligraficzny ARES s.c. Roman Józefowicz / tel. 506 177 893
www: www.ekonomiaisrodowisko.pl
ECONOMICS AND ENVIRONMENTJournal of the Polish Association
of Environmental and Resource Economists
EKONOMIA I ŚRODOWISKOCzasopismo Polskiego Stowarzyszenia
Ekonomistów Środowiska i Zasobów Naturalnych
T H E S C I E N T I F I C P R O G R A M M E B O A R D
Prof. Zbigniew Bochniarz (USA) • Prof. Tadeusz Borys • Dr Leon C. Braat (Netherlands) Prof. Adam Budnikowski • Prof. Eva Cudlinova (Czech Republic) • Prof. Józefa Famielec
Prof. Bogusław Fiedor • Prof. Wojciech J. Florkowski (USA) • Prof. Kazimierz Górka Prof. Włodzimierz Kaczyński (USA) • Prof. Teresa Łaguna • Prof. Rafał Miłaszewski
Prof. Bazyli Poskrobko • Prof. Leszek Preisner • Prof. Tomasz Żylicz
E D I T O R I A L T E A M
Editor in chief – Prof. Elżbieta BroniewiczEditors of particular sections – Prof. Stanisław Czaja
Prof. Eugeniusz Kośmicki, Prof. Barbara Kryk Prof. Dariusz Kiełczewski, Prof. Małgorzata Burchard-Dziubińska
The Secretary of Editorial Office – Dr Karolina Ogrodnik
EKONOMIA I ŚRODOWISKO 2 (69) • 2019
THEORETICAL AND METHODOLOGICAL PROBLEMSArnold Bernaciak, Filip Kopczyński, Participatory budgeting – an indicator of social activity of
residents and a tool of environmental protection in Poland: spatial diversity in the east/west configuration ........................................................................................................................ 8
ENVIRONMENTAL POLICY AND MANAGEMENTMateusz Malinowski, Maria Łukasiewicz, Stanisław Famielec, Karina Nowińska, Analysis
of changes in fees for the collection and management of municipal waste as regards the efficiency of waste segregation .......................................................................................... 24
Agnieszka Lorek, Sustainable development policy in the field of renewable energy sources – the European perspective ....................................................................................................... 42
Grażyna Karmowska, Economic development of European Union countries and implementation of the climate and energy package ....................................................... 58
Małgorzata Burchard-Dziubińska, Air pollution and health in Poland: anti-smog movement in the most polluted polish cities ............................................................................................... 76
Tomasz Walczykiewicz, Anna Dubel, Towards better risk estimation for the integrated water resources management .............................................................................................................. 91
STUDIES AND MATERIALSEdyta Rosłon-Szeryńska, Jan Łukaszkiewicz, Beata Fortuna-Antoszkiewicz, The problem with
the valuation of parks in historical manor-houses in rural areas in Poland ....................... 104
Paulina Szyja, Green Cities in Asia – case studies .......................................................................... 115
Józefa Wiater, Dariusz Boruszko, Wojciech Dąbrowski, Radosław Żyłka, Sylwia Antonowicz, Evaluation of sustainable development of dairy industry in Poland ................................... 132
contents
EKONOMIA I ŚRODOWISKO 2 (69) • 2019 www.ekonomiaisrodowisko.pl 5
GENERAL ENVIRONMENTAL AND SOCIAL PROBLEMSSylwia Słupik, Paweł Lorek, Sustainable enterprise by sustainable product? A case
of smart home systems ............................................................................................................ 146
Monika Paradowska, The impact of rivalry and excludability on transport choices: a preliminary research .............................................................................................................. 160
Beata Pater, Implementation of the intergenerational justice postulate in the context of statutory tasks and functions of national parks ............................................................... 179
Mariusz Trela, Sustainable development education at polish universities ................................... 190
Information for Authors – Submission Guidelines ........................................................................ 204

Ekonomia i Środowisko 2 (69) • 2019
Economics and Environment 2 (69) • 2019
THEORETICAL AND METHODOLOGICAL
PROBLEMS
PROBLEMY TEORETYCZNE I METODYCZNE
EKONOMIA I ŚRODOWISKO • 2 (69) • 2019
PARTICIPATORY BUDGETING – AN INDICATOR OF SOCIAL ACTIVITY OF RESIDENTS AND A TOOL OF ENVIRONMENTAL PROTECTION IN POLAND: SPATIAL DIVERSITY IN THE EAST/WEST CONFIGURATION
ABSTRACT: The purpose of the article is to present differentiations in participatory budgeting between Polish communes located in the western, central and eastern part of the country and to discuss the factors that trigger it. We took into account features such as the size of budgets, voter turnout, the total number of selected projects and the number of projects aimed at environmental improvements. The research was conducted in communes of three metropolitan areas: Bialystok, Lodz and Poznan. The research was carried out in 51 communes, excluding central cities from the study. The data was obtained from municipal offices and public statistics. Participatory budgets voted in 2017 and imple-mented in 2018 were analyzed. Projects were classified according to an original typology. There are quite big differences between the eastern and western part of Poland when it comes to the number of implemented participatory budgets and the amount of money allocated for this purpose. This indi-cates the needs and opportunities for the flow of knowledge and exchange of experiences in this area between individual parts of the country and between particular local governments.
KEY WORDS: commune, participatory budgeting, environmental protection
Arnold Bernaciak, Associate Prof. (ORCID: 0000-0003-1099-286X) – WSB University in PoznanFilip Kopczyński, MSc (ORCID: 0000-0001-8268-6576) – WSB University in Poznan
Correspondence address:Powstańców Wielkopolskich Street 5, 61-895, Poznań, Polande-mail: [email protected]
Arnold BERNACIAK • Filip KOPCZYŃSKI
JEL: H72, Q01No. 2(69) 2019 • pages: 8-22 https://doi.org/10.34659/2019/2/18
EKONOMIA I ŚRODOWISKO 2 (69) • 2019 Theoretical and methodological problems 9
Introduction
Participatory budgeting is a relatively new tool of local public financial management. The concept and features of participatory budgeting let us per-ceive it as a tool for the implementation of the rules of sustainable develop-ment. The most important of these features are: citizen involvement, the participation of inhabitants in decision making processes, focusing on local problems, and spending public funds on important goals, agreed upon by voting. Participatory budgeting can also be seen as an indicator of public involvement in solving local problems and of the importance that residents attach to environmental issues.
The research problem of this study comes down to the question about the level of diversity in the field of participatory budgeting between communes located in western, central and eastern part of Poland. There are questions about features such as the size of budgets, the number of submitted projects, types of selected undertakings and the role of projects aimed at solving envi-ronmental problems. The goals of the article are to present this diversity, and to highlight and discuss factors that cause it.
An overview of the literature
Participatory budgeting is quite a new tool of public finance management in Poland. The first participatory budget in the world was organized in Brazil in 1989 (Shah, 2007, p. 92), in Poland it was in 2011 (Krześ, 2014, p. 99). Consequently, it is possible to find numerous studies showing the analyses of participatory budgeting from the global perspective and relatively little anal-ysis on the Polish scale.
Dias (2014) describes the dynamics of the development of participatory budgeting in different parts of the world. It is significant that processes of participatory budgeting origin from rather poor countries of Latin America (Shah, 2007, p. 92-16). The studies of the conditions and processes of the development of participatory budgeting in European countries were con-ducted by Sintomer, Röcke and Herzberg (2016). Using the examples of Spain, Italy, France and many other countries, they present different ways of increas-ing the participation of inhabitants in deciding on the directions of spending public funds. There are a number of studies that present different aspects of participatory budgeting: the creation and evaluation of participatory budget-ing and its rules (e.g. Wampler, 2012; Pape, Lerner, 2016; Sgueo, 2016), the conditions and experiences of different countries (e.g. Baiocchi, Lerner, 2007;
EKONOMIA I ŚRODOWISKO 2 (69) • 2019Theoretical and methodological problems10
He, 2011; McNulty, 2012), regions and cities (Souza, 2001; Zhang, Liao, 2011; Marquetti, Schonerwald da Silva, Campbell, 2011).
There are only a few studies in the field of participatory budgeting in Poland due to the short period in which this tool of public finance manage-ment has been implemented there. The role of social participation in the shaping of local and regional development in Poland, through the participa-tion budgeting, is an issue that is quite often raised (Szaja, 2015; Łukowski, 2017; Michalska-Żyła, Brzeziński, 2017). A few works describe some cases of the implementation of participatory budgeting in Polish cities (Dakowska, 2013; Kowalska, 2014; Polko, 2015; Krawczyk, 2016). Bernaciak, Rzeńca and Sobol (2017) compare the participatory budgeting of three cities: Poznan, Lodz and Katowice. They present and try to explain differences between them. Sobol and Rzeńca carry out the comparative studies of the participa-tory budgeting of small towns in two voivodships (Lower Silesia and Lodzkie) (2018). They point to numerous problems related to the implementation of participatory budgeting in small cities. The most important of them are: insufficient information policy, poor promotion, quite a low level of inhabit-ants’ engagement.
The differentiation of Polish regions is well described in the literature. Many studies present characteristic features of particular regions as well as the causes of differences between them (e.g. Jałowiecki, 1996; Gorzelak, 2007; Nowakowska, 2011). Czyż (2012) compares and classifies Polish sub-regions. A high level of economic development is characteristic of the subre-gion with the metropolitan area of Poznan. The agglomeration is character-ized by the average level and Bialystok metropolitan area by the low level of this feature. The standard of living is indicated as high for the subregion with Poznan agglomeration and average for the subregions with the Lodz and Bia-lystok metropolitan areas.
There is lack of research that would show the development of participa-tory budgeting in Poland, especially in the context of various regional condi-tions. This issue constitutes a research gap, the fulfillment of which was undertaken in the research and presented in this paper.
Research methods
The aim of the research was to identify the diversity in the field of partic-ipatory budgeting between communes located in western, central and east-ern part of Poland. The research was conducted in the communes of three metropolitan: Poznan (west), Lodz (center) and Bialystok (east). Poznan was selected as the representative of the west of the country; the other choices
EKONOMIA I ŚRODOWISKO 2 (69) • 2019 Theoretical and methodological problems 11
were Wroclaw and Szczecin. Lodz metropolitan area was chosen from the group of three agglomerations, including also Bydgoszcz and Katowice. The Lublin metropolitan area was selected as the example of eastern Poland (other agglomerations: Bialystok and Rzeszow). Unfortunately, it turned out that there is no participatory budgeting in the communes of the Lublin agglomeration. It was necessary to repeat the draw. In the second round, the Bialystok agglomeration was drawn.
In the case of the metropolitan areas of Poznan and Bialystok, all com-munes belonging to the poznanski and bialostocki poviats (districts) were taken into account. There is a similar situation in terms of administration in both cases – a ring of communes belonging to one poviat surrounds the cen-tral city. The names of these poviats come from the name of the central city – poviat poznanski and poviat bialostocki, respectively. The situation is slightly different in the case of the Lodz metropolitan area. The central city is adjacent to three poviats: pabianicki, zgierski and lodzki. In this case, the communes selected by Swianiewicz and Klimska (2005, p. 54) as the com-munes of the Lodz agglomeration were included in the research. As a result, the research was carried out in 51 communes: 17 belonged to the Poznan metropolitan area, 19 to the Lodz metropolitan area and 15 to the Bialystok metropolitan area. The central cities of each of the analyzed spatial units (Poznan, Lodz, Bialystok) were excluded from the study, due to their com-pletely different characteristics from other communes.
Participatory budgeting voted in 2017 and implemented in 2018 was take into account. The lists of projects submitted to the participatory budg-ets, as well as the data on the size of participatory budgeting in particular units, was obtained from the official municipal websites or directly from municipal offices. The data on the number of inhabitants was obtained from official statistics.
An original typology was adopted for the analysis of the submitted and implemented projects. All projects aimed at protecting or improving the environment were divided into seven categories: green infrastructure, blue infrastructure, nature conservation, air and atmosphere protection, care of domestic animals, waste management, ecological education, noise protec-tion. The projects were classified into individual categories in accordance with their main purpose or with the area in which the most important envi-ronmental effects are expected. Having in mind that each of the projects can bring environmental effects in more than one area (specific categories), the principle of qualifying the project to one of the selected areas was accepted.
EKONOMIA I ŚRODOWISKO 2 (69) • 2019Theoretical and methodological problems12
The results of the research
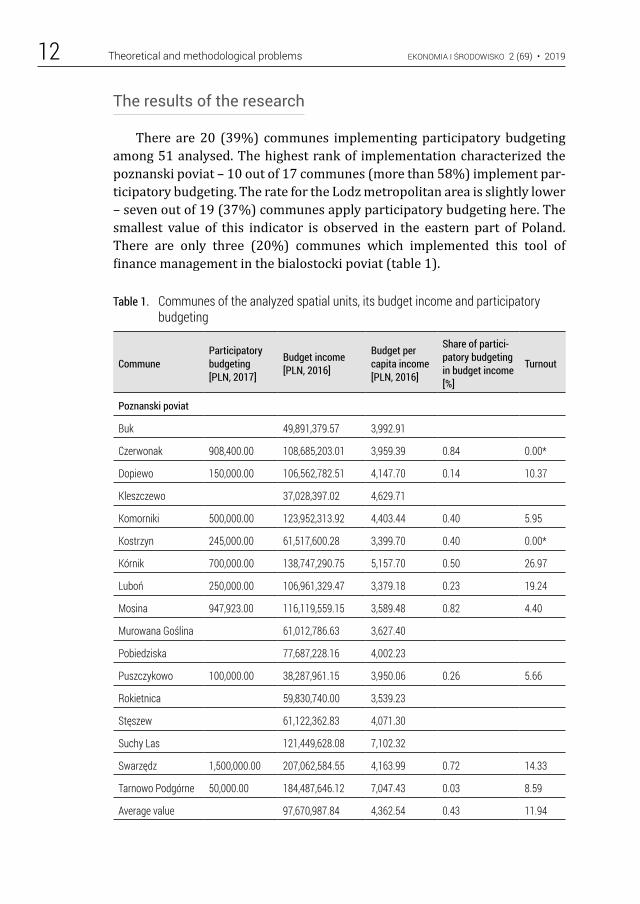
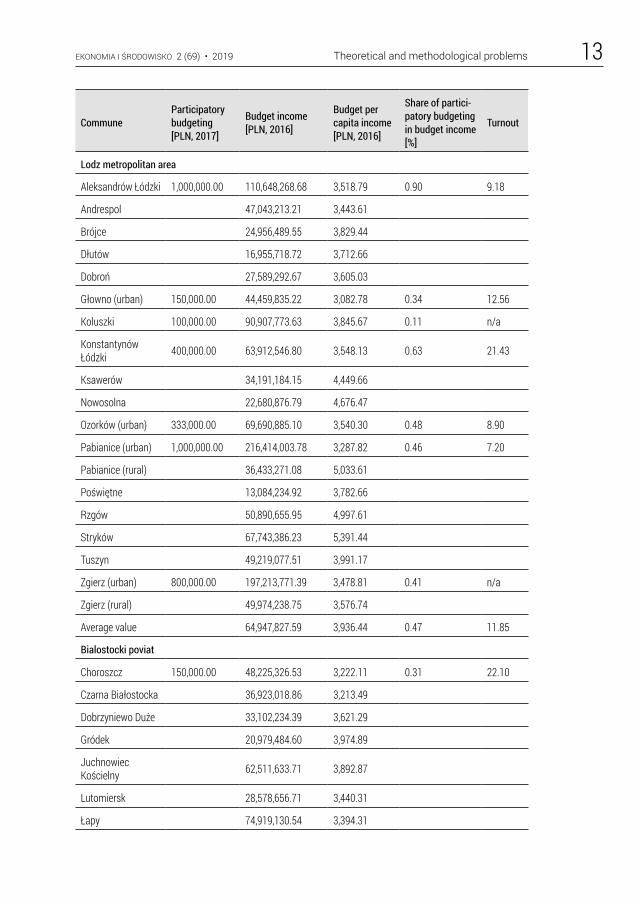
There are 20 (39%) communes implementing participatory budgeting among 51 analysed. The highest rank of implementation characterized the poznanski poviat – 10 out of 17 communes (more than 58%) implement par-ticipatory budgeting. The rate for the Lodz metropolitan area is slightly lower – seven out of 19 (37%) communes apply participatory budgeting here. The smallest value of this indicator is observed in the eastern part of Poland. There are only three (20%) communes which implemented this tool of finance management in the bialostocki poviat (table 1).
Table 1. Communes of the analyzed spatial units, its budget income and participatory budgeting
CommuneParticipatory budgeting [PLN, 2017]
Budget income [PLN, 2016]
Budget per capita income [PLN, 2016]
Share of partici-patory budgeting in budget income [%]
Turnout
Poznanski poviat
Buk 49,891,379.57 3,992.91
Czerwonak 908,400.00 108,685,203.01 3,959.39 0.84 0.00*
Dopiewo 150,000.00 106,562,782.51 4,147.70 0.14 10.37
Kleszczewo 37,028,397.02 4,629.71
Komorniki 500,000.00 123,952,313.92 4,403.44 0.40 5.95
Kostrzyn 245,000.00 61,517,600.28 3,399.70 0.40 0.00*
Kórnik 700,000.00 138,747,290.75 5,157.70 0.50 26.97
Luboń 250,000.00 106,961,329.47 3,379.18 0.23 19.24
Mosina 947,923.00 116,119,559.15 3,589.48 0.82 4.40
Murowana Goślina 61,012,786.63 3,627.40
Pobiedziska 77,687,228.16 4,002.23
Puszczykowo 100,000.00 38,287,961.15 3,950.06 0.26 5.66
Rokietnica 59,830,740.00 3,539.23
Stęszew 61,122,362.83 4,071.30
Suchy Las 121,449,628.08 7,102.32
Swarzędz 1,500,000.00 207,062,584.55 4,163.99 0.72 14.33
Tarnowo Podgórne 50,000.00 184,487,646.12 7,047.43 0.03 8.59
Average value 97,670,987.84 4,362.54 0.43 11.94
EKONOMIA I ŚRODOWISKO 2 (69) • 2019 Theoretical and methodological problems 13
CommuneParticipatory budgeting [PLN, 2017]
Budget income [PLN, 2016]
Budget per capita income [PLN, 2016]
Share of partici-patory budgeting in budget income [%]
Turnout
Lodz metropolitan area
Aleksandrów Łódzki 1,000,000.00 110,648,268.68 3,518.79 0.90 9.18
Andrespol 47,043,213.21 3,443.61
Brójce 24,956,489.55 3,829.44
Dłutów 16,955,718.72 3,712.66
Dobroń 27,589,292.67 3,605.03
Głowno (urban) 150,000.00 44,459,835.22 3,082.78 0.34 12.56
Koluszki 100,000.00 90,907,773.63 3,845.67 0.11 n/a
Konstantynów Łódzki 400,000.00 63,912,546.80 3,548.13 0.63 21.43
Ksawerów 34,191,184.15 4,449.66
Nowosolna 22,680,876.79 4,676.47
Ozorków (urban) 333,000.00 69,690,885.10 3,540.30 0.48 8.90
Pabianice (urban) 1,000,000.00 216,414,003.78 3,287.82 0.46 7.20
Pabianice (rural) 36,433,271.08 5,033.61
Poświętne 13,084,234.92 3,782.66
Rzgów 50,890,655.95 4,997.61
Stryków 67,743,386.23 5,391.44
Tuszyn 49,219,077.51 3,991.17
Zgierz (urban) 800,000.00 197,213,771.39 3,478.81 0.41 n/a
Zgierz (rural) 49,974,238.75 3,576.74
Average value 64,947,827.59 3,936.44 0.47 11.85
Bialostocki poviat
Choroszcz 150,000.00 48,225,326.53 3,222.11 0.31 22.10
Czarna Białostocka 36,923,018.86 3,213.49
Dobrzyniewo Duże 33,102,234.39 3,621.29
Gródek 20,979,484.60 3,974.89
Juchnowiec Kościelny 62,511,633.71 3,892.87
Lutomiersk 28,578,656.71 3,440.31
Łapy 74,919,130.54 3,394.31
EKONOMIA I ŚRODOWISKO 2 (69) • 2019Theoretical and methodological problems14
CommuneParticipatory budgeting [PLN, 2017]
Budget income [PLN, 2016]
Budget per capita income [PLN, 2016]
Share of partici-patory budgeting in budget income [%]
Turnout
Michałowo 29,436,865.93 4,390.94
Supraśl 2,976,814.65 52,032,269.92 3,466.74 5.72 24.01
Suraż 8,640,872.78 4,355.28
Turośń Kościelna 23,946,005.00 3,864.75
Tykocin 24,082,955.08 3,840.37
Wasilków 160,000.00 52,966,755.99 3,235.60 0.30 8.17
Zabłudów 33,651,799.41 3,642.36
Zawady 10,133,926.06 3,666.40
Average value 36,008,729.03 3,681.45 2.11 18.09
* Due to the small number of projects – implementation without votingSource: author’s own work based on data taken from municipality offices.
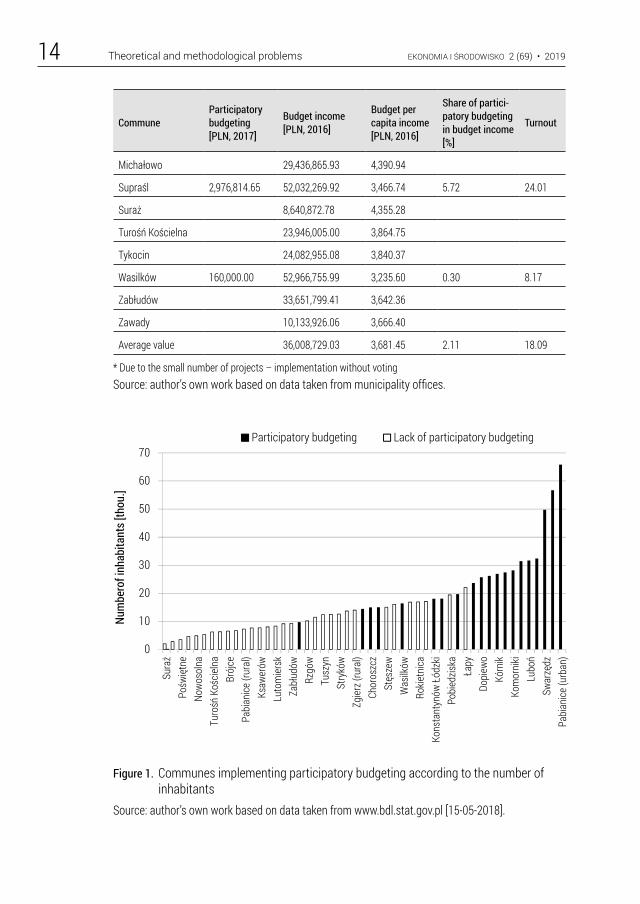
Figure 1. Communes implementing participatory budgeting according to the number of inhabitants
Source: author’s own work based on data taken from www.bdl.stat.gov.pl [15-05-2018].
F1
0
10
20
30
40
50
60
70
Suraż
Pośw
iętne
Nowo
soln
aTu
rośń
Koś
cieln
aBr
ójce
Pabi
anice
(rur
al)
Ksaw
erów
Luto
mier
skZa
błud
ówRz
gów
Tusz
ynSt
rykó
wZg
ierz (
rura
l)Ch
oros
zcz
Stęs
zew
Was
ilków
Rokie
tnica
Kons
tant
ynów
Łód
zki
Pobi
edzis
kaŁa
pyDo
piew
oKó
rnik
Kom
orni
kiLu
boń
Swar
zędz
Pabi
anice
(urb
an)
Num
bero
f inh
abita
nts [
thou
.]
Participatory budgeting Lack of participatory budgeting
EKONOMIA I ŚRODOWISKO 2 (69) • 2019 Theoretical and methodological problems 15
Participatory budgeting is primarily implemented by communes with a large number of inhabitants. The border population from which the munic-ipalities applied this kind of budget in the audited period was 20,000 resi-dents. Only a few municipalities with a smaller number of inhabitants take up the challenge of implementing participatory budgeting. We observe this trend in the communes located in all areas of Poland under analysis (figure 1).
The situation is similar when it comes to the value of commune budget incomes. Participatory budgeting is implemented primarily by communes with a higher level of income. In this case, the border value of income is 100 million PLN. All communes under analysis with income higher than this value have implemented participatory budgeting. On the other hand, there is not a single commune implementing participatory budgeting the income of which is less than 38 million PLN.
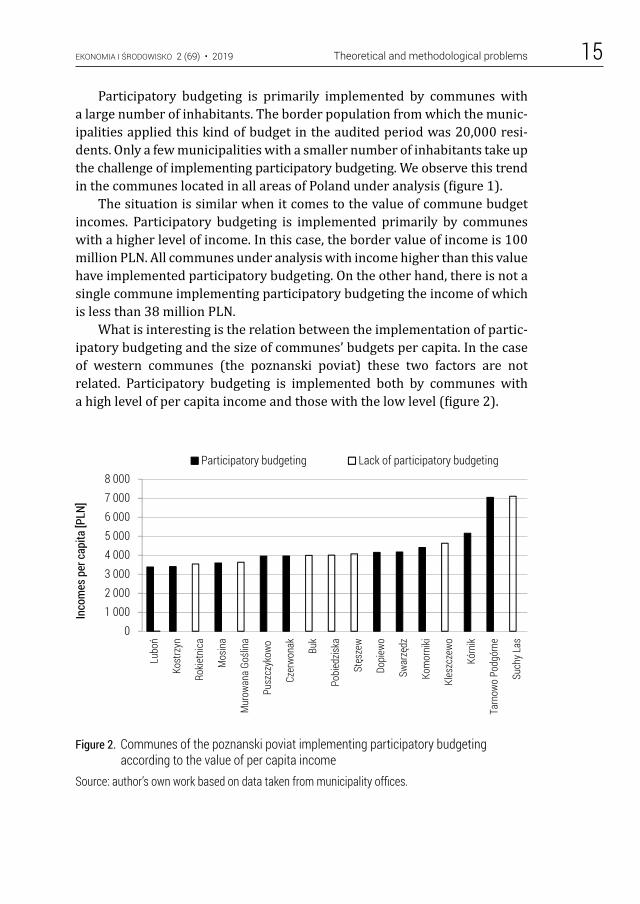
What is interesting is the relation between the implementation of partic-ipatory budgeting and the size of communes’ budgets per capita. In the case of western communes (the poznanski poviat) these two factors are not related. Participatory budgeting is implemented both by communes with a high level of per capita income and those with the low level (figure 2).
Figure 2. Communes of the poznanski poviat implementing participatory budgeting according to the value of per capita income
Source: author’s own work based on data taken from municipality offices.
F2
01 0002 0003 0004 0005 0006 0007 0008 000
Lubo
ń
Kost
rzyn
Rokie
tnica
Mos
ina
Mur
owan
a Go
ślina
Pusz
czyk
owo
Czer
wona
k
Buk
Pobi
edzis
ka
Stęs
zew
Dopi
ewo
Swar
zędz
Kom
orni
ki
Kles
zcze
wo
Kórn
ik
Tarn
owo
Podg
órne
Such
y Las
Inco
mes
per
cap
ita [P
LN]
Participatory budgeting Lack of participatory budgeting
EKONOMIA I ŚRODOWISKO 2 (69) • 2019Theoretical and methodological problems16
F4
01 0002 0003 0004 0005 0006 0007 0008 000
Czar
na B
iało
stoc
ka
Chor
oszc
z
Was
ilków
Łapy
Luto
mier
sk
Supr
aśl
Dobr
zyni
ewo
Duże
Zabł
udów
Zawa
dy
Tyko
cin
Turośń
Koś
cieln
a
Juch
nowi
ec K
oście
lny
Gród
ek
Suraż
Mich
ałow
o
Inco
mes
per
cap
ita [P
LN]
Participatory budgeting Lack of participatory budgeting
F3
01 0002 0003 0004 0005 0006 0007 0008 000
Głow
no (u
rban
)Pa
bian
ice (u
rban
)An
dres
pol
Zgier
z (ur
ban)
Alek
sand
rów Łó
dzki
Ozor
ków
(urb
an)
Kons
tant
ynów
Łódz
kiZg
ierz (
rura
l)Do
broń
Dłut
ówPo
święt
neBr
ójce
Kolu
szki
Tusz
ynKs
awer
ówNo
woso
lna
Rzgó
wPa
bian
ice (r
ural
)St
rykó
w
Inco
mes
per
cap
ita [P
LN]
Participatory budgeting Lack of participatory budgeting
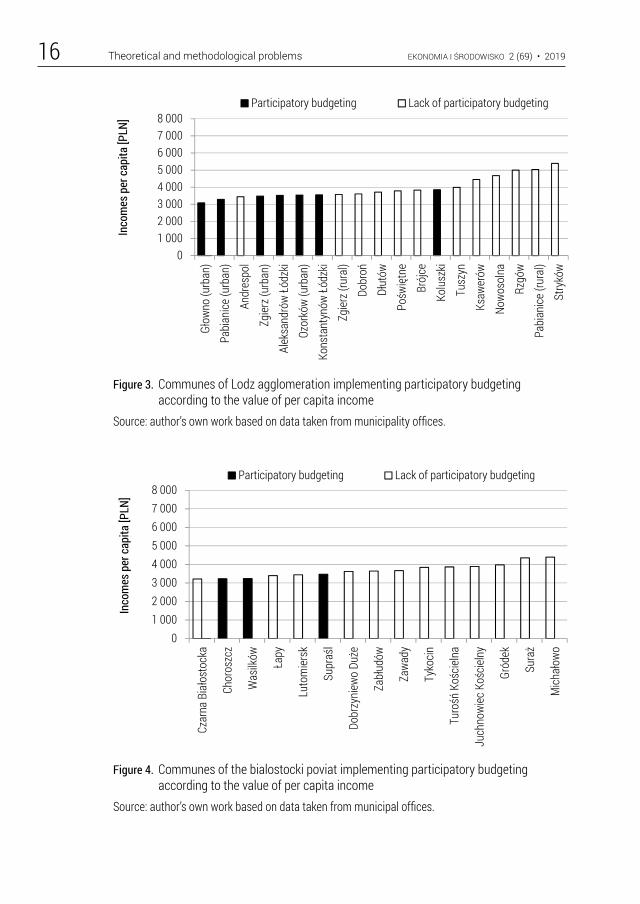
Figure 3. Communes of Lodz agglomeration implementing participatory budgeting according to the value of per capita income
Source: author’s own work based on data taken from municipality offices.
Figure 4. Communes of the bialostocki poviat implementing participatory budgeting according to the value of per capita income
Source: author’s own work based on data taken from municipal offices.
EKONOMIA I ŚRODOWISKO 2 (69) • 2019 Theoretical and methodological problems 17
In turn, in the case of the other two spatial units, certain regularity is noticeable – the communes with the lower level of income realize participa-tory budgeting per capita. There is not a single commune with income higher than 4,000 PLN per capita that implement participatory budgeting in the Lodz metropolitan area (figure 3).
The same relation is observed in the bialostocki poviat – three out of five communes with the lowest per capita income implement participatory budg-eting (figure 4). No communes with income higher than 3,500 PLN do the same.
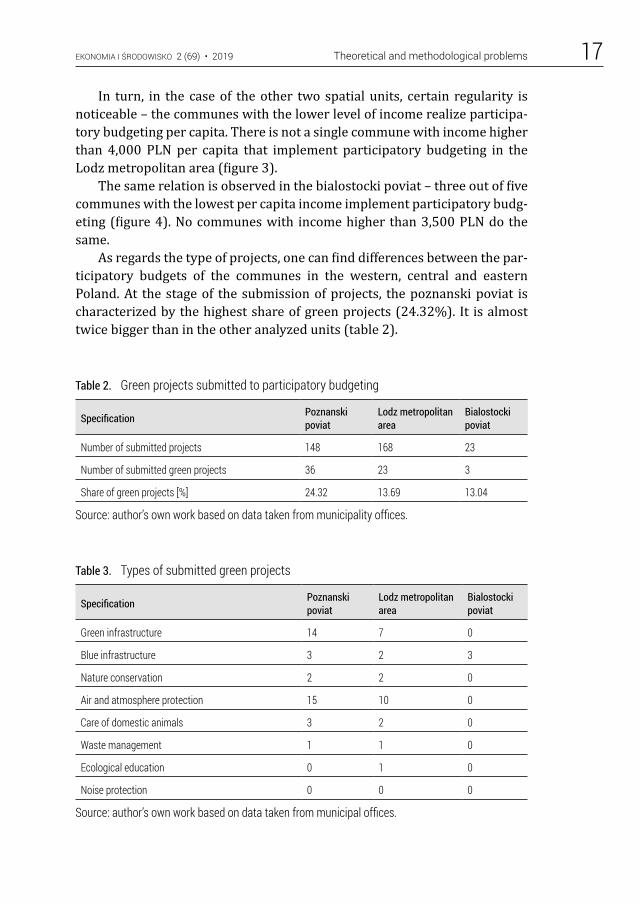
As regards the type of projects, one can find differences between the par-ticipatory budgets of the communes in the western, central and eastern Poland. At the stage of the submission of projects, the poznanski poviat is characterized by the highest share of green projects (24.32%). It is almost twice bigger than in the other analyzed units (table 2).
Table 2. Green projects submitted to participatory budgeting
Specification Poznanski poviat
Lodz metropolitan area
Bialostocki poviat
Number of submitted projects 148 168 23
Number of submitted green projects 36 23 3
Share of green projects [%] 24.32 13.69 13.04
Source: author’s own work based on data taken from municipality offices.
Table 3. Types of submitted green projects
Specification Poznanski poviat
Lodz metropolitan area
Bialostocki poviat
Green infrastructure 14 7 0
Blue infrastructure 3 2 3
Nature conservation 2 2 0
Air and atmosphere protection 15 10 0
Care of domestic animals 3 2 0
Waste management 1 1 0
Ecological education 0 1 0
Noise protection 0 0 0
Source: author’s own work based on data taken from municipal offices.
EKONOMIA I ŚRODOWISKO 2 (69) • 2019Theoretical and methodological problems18
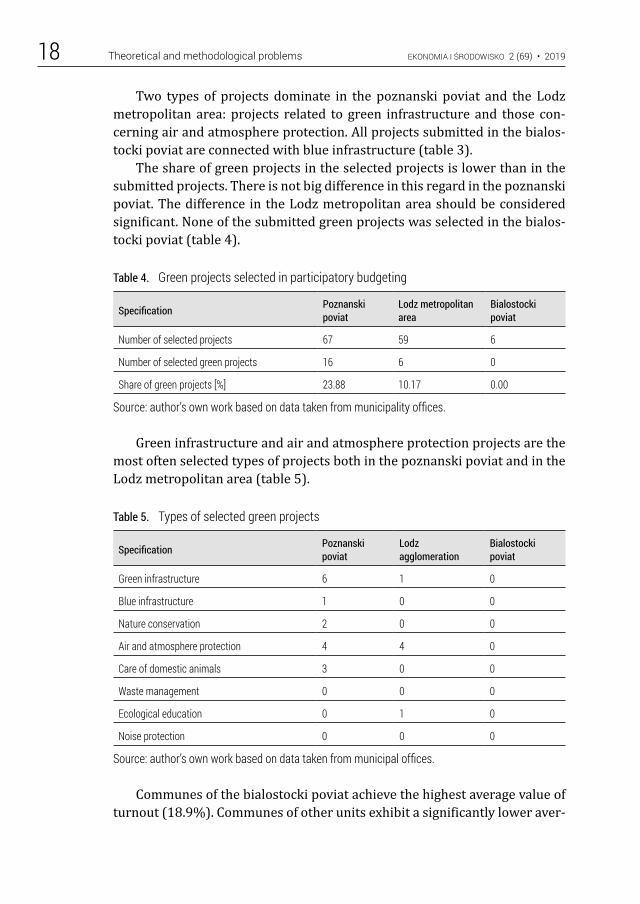
Two types of projects dominate in the poznanski poviat and the Lodz metropolitan area: projects related to green infrastructure and those con-cerning air and atmosphere protection. All projects submitted in the bialos-tocki poviat are connected with blue infrastructure (table 3).
The share of green projects in the selected projects is lower than in the submitted projects. There is not big difference in this regard in the poznanski poviat. The difference in the Lodz metropolitan area should be considered significant. None of the submitted green projects was selected in the bialos-tocki poviat (table 4).
Table 4. Green projects selected in participatory budgeting
Specification Poznanski poviat
Lodz metropolitan area
Bialostocki poviat
Number of selected projects 67 59 6
Number of selected green projects 16 6 0
Share of green projects [%] 23.88 10.17 0.00
Source: author’s own work based on data taken from municipality offices.
Green infrastructure and air and atmosphere protection projects are the most often selected types of projects both in the poznanski poviat and in the Lodz metropolitan area (table 5).
Table 5. Types of selected green projects
Specification Poznanski poviat
Lodz agglomeration
Bialostocki poviat
Green infrastructure 6 1 0
Blue infrastructure 1 0 0
Nature conservation 2 0 0
Air and atmosphere protection 4 4 0
Care of domestic animals 3 0 0
Waste management 0 0 0
Ecological education 0 1 0
Noise protection 0 0 0
Source: author’s own work based on data taken from municipal offices.
Communes of the bialostocki poviat achieve the highest average value of turnout (18.9%). Communes of other units exhibit a significantly lower aver-
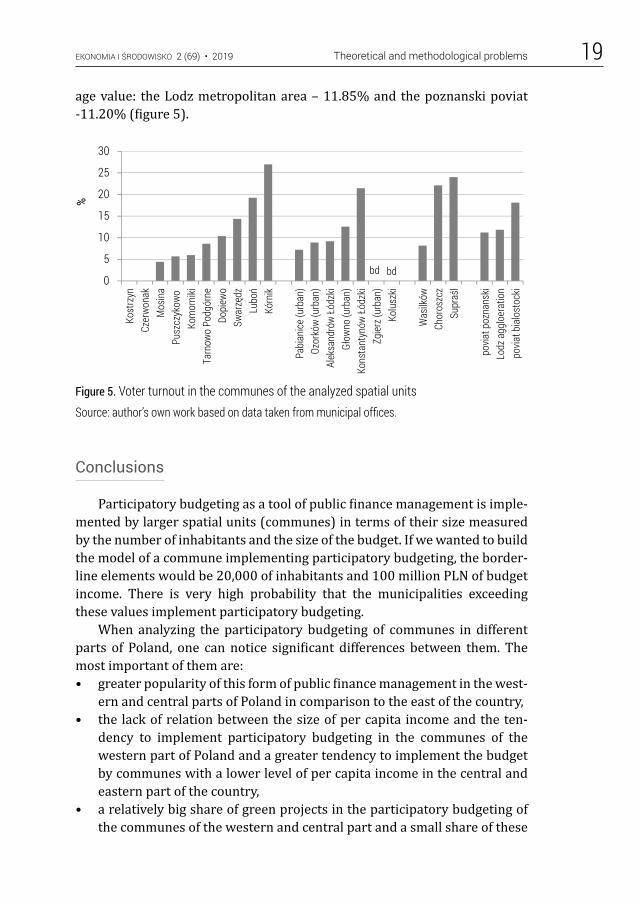
EKONOMIA I ŚRODOWISKO 2 (69) • 2019 Theoretical and methodological problems 19
age value: the Lodz metropolitan area – 11.85% and the poznanski poviat -11.20% (figure 5).
Figure 5. Voter turnout in the communes of the analyzed spatial unitsSource: author’s own work based on data taken from municipal offices.
Conclusions
Participatory budgeting as a tool of public finance management is imple-mented by larger spatial units (communes) in terms of their size measured by the number of inhabitants and the size of the budget. If we wanted to build the model of a commune implementing participatory budgeting, the border-line elements would be 20,000 of inhabitants and 100 million PLN of budget income. There is very high probability that the municipalities exceeding these values implement participatory budgeting.
When analyzing the participatory budgeting of communes in different parts of Poland, one can notice significant differences between them. The most important of them are:• greater popularity of this form of public finance management in the west-
ern and central parts of Poland in comparison to the east of the country,• the lack of relation between the size of per capita income and the ten-
dency to implement participatory budgeting in the communes of the western part of Poland and a greater tendency to implement the budget by communes with a lower level of per capita income in the central and eastern part of the country,
• a relatively big share of green projects in the participatory budgeting of the communes of the western and central part and a small share of these
F5
0
5
10
15
20
25
30
Kost
rzyn
Czer
wona
kM
osin
aPu
szcz
ykow
oKo
mor
niki
Tarn
owo
Podg
órne
Dopi
ewo
Swar
zędz
Lubo
ńKó
rnik
Pabi
anice
(urb
an)
Ozor
ków
(urb
an)
Alek
sand
rów Łó
dzki
Głow
no (u
rban
)Ko
nsta
ntyn
ów Ł
ódzk
iZg
ierz (
urba
n)Ko
lusz
ki
Was
ilków
Chor
oszc
zSu
praś
l
povia
t poz
nans
kiLo
dz a
gglo
erat
ion
povia
t bia
lost
ocki
%
bd bd
EKONOMIA I ŚRODOWISKO 2 (69) • 2019Theoretical and methodological problems20
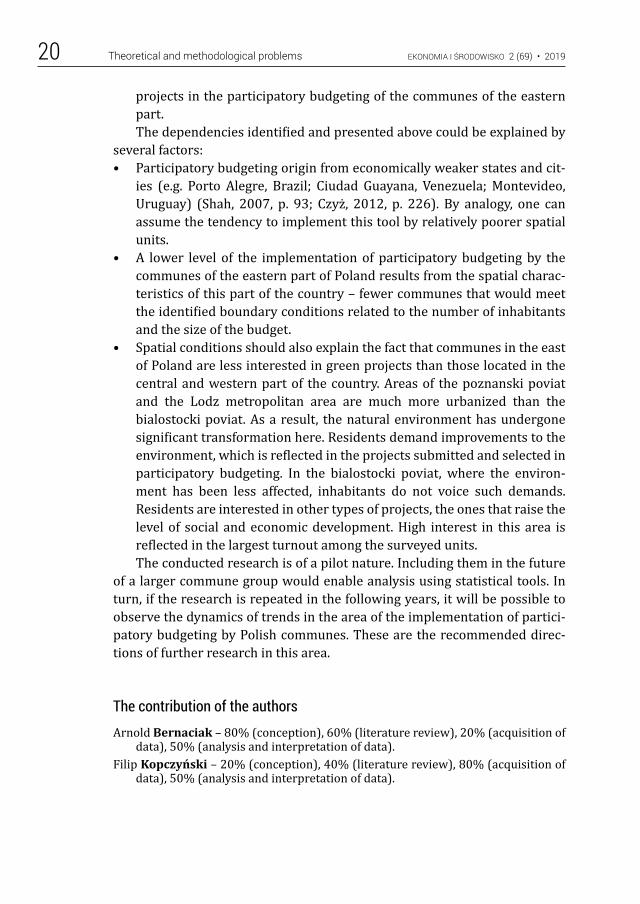
projects in the participatory budgeting of the communes of the eastern part.The dependencies identified and presented above could be explained by
several factors:• Participatory budgeting origin from economically weaker states and cit-
ies (e.g. Porto Alegre, Brazil; Ciudad Guayana, Venezuela; Montevideo, Uruguay) (Shah, 2007, p. 93; Czyż, 2012, p. 226). By analogy, one can assume the tendency to implement this tool by relatively poorer spatial units.
• A lower level of the implementation of participatory budgeting by the communes of the eastern part of Poland results from the spatial charac-teristics of this part of the country – fewer communes that would meet the identified boundary conditions related to the number of inhabitants and the size of the budget.
• Spatial conditions should also explain the fact that communes in the east of Poland are less interested in green projects than those located in the central and western part of the country. Areas of the poznanski poviat and the Lodz metropolitan area are much more urbanized than the bialostocki poviat. As a result, the natural environment has undergone significant transformation here. Residents demand improvements to the environment, which is reflected in the projects submitted and selected in participatory budgeting. In the bialostocki poviat, where the environ-ment has been less affected, inhabitants do not voice such demands. Residents are interested in other types of projects, the ones that raise the level of social and economic development. High interest in this area is reflected in the largest turnout among the surveyed units.The conducted research is of a pilot nature. Including them in the future
of a larger commune group would enable analysis using statistical tools. In turn, if the research is repeated in the following years, it will be possible to observe the dynamics of trends in the area of the implementation of partici-patory budgeting by Polish communes. These are the recommended direc-tions of further research in this area.
The contribution of the authors
Arnold Bernaciak – 80% (conception), 60% (literature review), 20% (acquisition of data), 50% (analysis and interpretation of data).
Filip Kopczyński – 20% (conception), 40% (literature review), 80% (acquisition of data), 50% (analysis and interpretation of data).
EKONOMIA I ŚRODOWISKO 2 (69) • 2019 Theoretical and methodological problems 21
Literature
Baiocchi G., Lerner J. (2007), Could Participatory Budgeting Work in the United States, “The Good Society” No. 16, p. 8-13, DOI: 10.1353/gso.0.0009
Bernaciak A., Rzeńca A., Sobol A. (2017), Participatory Budgeting as a Tool of Environ-mental Improvements in Polish Cities, “Economic and Environmental Studies” No. 17, p. 893-906, DOI: 10.25167/ees.2017.44.16
Czyż T. (2012), Poziom rozwoju społeczno-gospodarczego Polski w ujęciu subregional-nym, „Przegląd Geograficzny” No. 84, p. 219-236, DOI: 10.7163/PrzG.2012.2.3
Dakowska D. (2013), A Polish Case Study: Participatory Budgeting in the City of Plock, in: Y. Sintomer, R. Traub-Merz, J. Zhang (eds.), Participatory Budgeting in Asia and Europe – Key Challenges of Deliberative Democracy, Palgrave Macmillan, Hong Kong, p. 198-209
Dias N. (2014), Hope for Democracy, 25 Years of Participatory Budgeting Worldwide, In-Loco Association
Gorzelak G. (ed.) (2007), Polska regionalna i lokalna w świetle badań EUROREG-u, Wydawnictwo Naukowe Scholar, Warsaw
He B. (2011), Civic Engagement through participatory Budgeting in China: three differ-ent logics at work, “Public Administration and Development” No. 31, p. 122-133, DOI: 10.1002/pad.598
Jałowiecki B. (ed.) (1996), Oblicza polskich regionów, „Studia Regionalne i Lokalne” No. 17
Krawczyk A. (2016), Doskonalenie modelu budżetu obywatelskiego na przykładzie miasta Częstochowy, „Zeszyty Naukowe Politechniki Częstochowskiej. Zarządza-nie” No. 22, p. 242-256, DOI: 10.17512/znpcz.2016.2.21
Krześ A. (2014), Budżet obywatelski jako inicjatywa wspierająca postawę społec-zeństwa obywatelskiego, „Gospodarka i Przestrzeń” No. 341, p. 94-103, DOI: 10.15611/pn.2014.341.08
Kowalska I. (2014), Partycypacja społeczna w kształtowaniu budżetu jednostki samorządu terytorialnego – budżet partycypacyjny, “Economics and Manage-ment” No. 4, p. 108-122, DOI: 10.12846/j.em.2014.04.08
Łukowski W. (2017), O mechanizmach sprawowania władzy na szczeblu lokalnym i nie(obecności) partycypacji, „Studia z Polityki Publicznej” No. 3, p. 48-58
Marquetti A., Schonerwald da Silva C.E., Campbell A. (2011), Participatory Budgeting in Porto Alegre, 1989-2004, “Participatory Economic Democracy in Action” No. 44, p. 62-81, DOI: 10.1177/0486613411418055
McNulty S. (2012), An Unlikely Success: Peru’s Top-Down Participatory Budgeting Experience, “Journal of Public Deliberation” No. 8, Article 4
Michalska-Żyła A., Brzeziński K. (2017), Budżet partycypacyjny jako mechanizm współrządzenia miastem, „Annales Universitatis Mariae Curie-Skłodowska” No. 24, p. 205-223, DOI: 10.17951/k.2017.24.2.205
Nowakowska A. (2011), Regionalny wymiar procesów innowacji, Wydawnictwo Uniw-ersytetu Łódzkiego, Łódź, DOI: 10.18778/7525-541-6
Pape M., Lerner J. (2016), Budgeting for Equity: How can Particpatry Budgeting Advance Equity in the United States, “Journal of Public Deliberation” No. 12, Article 9
EKONOMIA I ŚRODOWISKO 2 (69) • 2019Theoretical and methodological problems22
Polko A. (2015), Models of Participatory Budgeting – the Case Study of Polish City, “Journal of Economics and Management” No. 19, p. 34-44
Sintomer Y., Röcke A., Herzberg C. (2016), Participatory Budgeting in Europe. Democ-racy and Public Govrenance, Routlegde
Sgueo, G. (2016), Participatory Budgeting. An Innovative Approach, European Parlia-mentary Research Service, http://www.europarl.europa.eu/RegData/etudes/BRIE/2016/573894/EPRS_BRI%282016%29573894_EN.pdf [30-09-2018]
Shah A. (ed.) (2007), Participatory budgeting, The World Bank, DOI: 10.1596/978-0-8213-6923-4
Sobol A., Rzeńca A. (2018), Budżet partycypacyjny jako narzędzie polityki rozwoju małych miast województwa śląskiego i łódzkiego, “Space – Society – Economy” No. 24, p. 92-104, DOI: dx.doi.org/10.18778/1733-3180.24.06
Souza S. (2001), Participatory Budgeting in Brazilian Cities: Limits and Possibilities in Building Democratic Institutions, “Environmnet and Urbanization” No. 13, p. 159-184, DOI: 10.1177/095624780101300112
Swianiewicz P., Klimska U. (2005), Społeczne i polityczne zróżnicowanie aglomeracji w Polsce – waniliowe centrum, mozaika przedmieść, „Prace i Studia Geograficzne” No. 35, p. 45-70
Szaja M. (2015), Partycypacja lokalnej społeczności w kształtowaniu procesu rozwoju w gminie, “Ekonomiczne Problemu Usług” No. 118, p. 281-296, DOI: 10.18276/epu.2015.118-20
Wampler B. (2012), Participatory Budgeting: Core principles and Key Impacts, “Jour-nal of Public Deliberation“ No. 8, Article 12
Zhang Y., Liao Y. (2011), Participatory Budgeting in Local Government. Evidence from New Jersey Municipalities, “Public Performance and Management Review” No. 35, p. 281-302, DOI: 10.2753/PMR1530-9576350203
Ekonomia i Środowisko 2 (69) • 2019
Economics and Environment 2 (69) • 2019
ENVIRONMENTAL POLICY AND
MANAGEMENT
POLITYKA EKOLOGICZNAI ZARZĄDZANIE ŚRODOWISKIEM
EKONOMIA I ŚRODOWISKO • 2 (69) • 2019
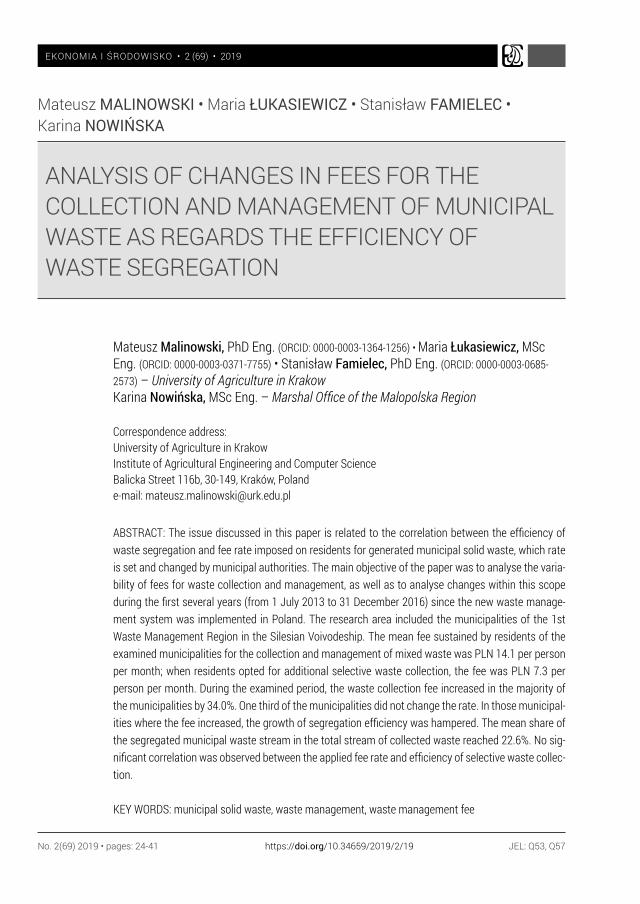
ANALYSIS OF CHANGES IN FEES FOR THE COLLECTION AND MANAGEMENT OF MUNICIPAL WASTE AS REGARDS THE EFFICIENCY OF WASTE SEGREGATION
ABSTRACT: The issue discussed in this paper is related to the correlation between the efficiency of waste segregation and fee rate imposed on residents for generated municipal solid waste, which rate is set and changed by municipal authorities. The main objective of the paper was to analyse the varia-bility of fees for waste collection and management, as well as to analyse changes within this scope during the first several years (from 1 July 2013 to 31 December 2016) since the new waste manage-ment system was implemented in Poland. The research area included the municipalities of the 1st Waste Management Region in the Silesian Voivodeship. The mean fee sustained by residents of the examined municipalities for the collection and management of mixed waste was PLN 14.1 per person per month; when residents opted for additional selective waste collection, the fee was PLN 7.3 per person per month. During the examined period, the waste collection fee increased in the majority of the municipalities by 34.0%. One third of the municipalities did not change the rate. In those municipal-ities where the fee increased, the growth of segregation efficiency was hampered. The mean share of the segregated municipal waste stream in the total stream of collected waste reached 22.6%. No sig-nificant correlation was observed between the applied fee rate and efficiency of selective waste collec-tion.
KEY WORDS: municipal solid waste, waste management, waste management fee
Mateusz Malinowski, PhD Eng. (ORCID: 0000-0003-1364-1256) • Maria Łukasiewicz, MSc Eng. (ORCID: 0000-0003-0371-7755) • Stanisław Famielec, PhD Eng. (ORCID: 0000-0003-0685-2573) – University of Agriculture in KrakowKarina Nowińska, MSc Eng. – Marshal Office of the Malopolska Region
Correspondence address:University of Agriculture in KrakowInstitute of Agricultural Engineering and Computer ScienceBalicka Street 116b, 30-149, Kraków, Polande-mail: [email protected]
Mateusz MALINOWSKI • Maria ŁUKASIEWICZ • Stanisław FAMIELEC • Karina NOWIŃSKA
JEL: Q53, Q57No. 2(69) 2019 • pages: 24-41 https://doi.org/10.34659/2019/2/19
EKONOMIA I ŚRODOWISKO 2 (69) • 2019 Environmental policy and management 25
Introduction
The act of 13 September 1996 on maintenance of cleanliness and order in municipalities (Journal of Laws 2011 no. 152, item 897, as amended), altered the municipal solid waste management system. “The waste revolu-tion” (resulting from the amendments to the act mentioned above), which came into force on 1 July 2013, had local governments of municipalities assume responsibility for waste generated by their residents. The scope of duties municipalities were entrusted with required outlays on the establish-ment and operation of the new municipal solid waste management system, including:• collection, transport, recovery and disposal of municipal solid waste,• establishment and maintenance of municipal solid waste collection
points,• administration of the system,• educational campaigns among residents.
Another essential change was related to establishing the method for res-idents to pay fees for the collection and management of municipal waste. Fees for municipal waste management were not directly associated with the weight of generated waste. They were dependent on the characteristics of households where waste was generated. Dijkgraaf and Gradus (2009), Sakai et al. (2008) and van Beukering et al. (2009) in their articles show the benefit of using fees based on the weight of waste (not for household or per person). These benefits have a financial dimension, but also social and educational. More and more municipalities in Europe are implementing a system “unit-based pricing”. Unfortunately, there are still cases of illegal dumping sites in such communes.
There are many debates in the literature regarding whether a change of waste management fee provides enough of an incentive to encourage waste minimization and recycling. Many authors state that a waste management fee for municipal solid waste should be designed to encourage households to reduce the amount of their waste (Welivita et al., 2015).
In 2012 the basic task of the Polish municipality was to calculate the run-ning costs of the system and their distribution among residents. Initially, the policymaker specified neither minimum nor maximum rates of these fees, granting the municipalities complete freedom within this scope. Each munic-ipality, within specific legal limits, shaped its own fee system for municipal solid waste management (Kiepas-Kokot et al., 2015).
In designing a waste management fee, charging method, payment vehi-cle, features of service package and challenges in implementing should be
EKONOMIA I ŚRODOWISKO 2 (69) • 2019Environmental policy and management26
considered (Welivita et al., 2015). Charging method can be a flat rate (fixed) or unit rate (quantity-based charge). The flat rate has become popular in many developed and developing countries because of easy handling and con-stant revenue generation (Töpfer, 2005). However, some developing coun-tries are facing a problem of fees which are not sufficiently covering the cost of waste management. Further, a price correction is also difficult to do due to public and political opposition (O’Connor, 1996). Quantity-based charge method is also known as the “unit pricing” or “pay as you throw” method where households are charged according to the amount of waste or frequency of collection (Chang et al., 2008). The waste amount is measured on the basis of weight, volume (can, bag, tag/sticker) and frequency (Diaz et al., 2005). This method is popular in many countries due to its ability to give a clear price signal hence encouraging households to reduce their waste. Even though it is popular among developed countries such as Denmark, Finland, Sweden, the Netherlands (Dijkgraaf, Gradus, 2004, 2009; van Beukering et al., 2009), and Belgium (Gellynck, Verhelst, 2007), no proof of its application in developing countries was available in the literature.
In Poland, until 2012, it was waste producers themselves (residents) that were responsible for signing contracts with entrepreneurs licensed to collect and transport municipal solid waste. The municipality served only the regu-latory and control functions, without affecting the management of waste col-lected from its residents (Malinowski, 2011). Both in rural and urban areas, the management of waste was improper, as it entailed combustion in house-hold heating systems and dumping waste in locations not intended for this purpose, which would result in the creation of numerous “illegal dumping sites” (Steinhoff-Wrześniowska, 2015; Ciura et al., 2017). The new municipal waste management system began to function on 1 July 2013. The main assumption behind the amendment was to delegate the authority over waste to the municipality where it was generated (Journal of Laws 2011 no. 152, item 897, as amended). At the same time, the European Union and national legislation committed the local municipal government to achieving specific recycling rates for paper, plastic, glass and metals, to preparing construction waste so that it could be reused and recovered by other means, and to reduc-ing the weight of biodegradable municipal waste intended for landfilling (Malinowski, Kopytko, 2014).
The running costs of the new system are covered by fees paid by resi-dents. These fees will soon rise across the country due to increased costs of waste management. Between 2018 and 2020, fees for waste landfilling will double (Journal of Laws 2017, item 723). Such circumstances will translate into higher amounts offered in tenders for the collection and management of waste and, therefore, increased fees for residents. In fact, the latest amend-
EKONOMIA I ŚRODOWISKO 2 (69) • 2019 Environmental policy and management 27
ment to the act on maintenance of cleanliness and order in municipalities (Journal of Laws 2011 no. 152, item 897, as amended) necessitates manda-tory waste segregation due to the fourfold increase in the waste collection and management fee imposed on residents who will not collect waste selec-tively. To avoid this drastic rise, one should attempt to increase the weight of selectively collected waste, simultaneously decreasing the weight of mixed municipal waste. This solution will enable one to achieve higher recycling rates for paper, plastic, metal and glass.
Selective municipal waste collection is one method to facilitate meeting EU requirements by the municipality. As of 1 July 2017, the Regulation of the Minister of the Environment on detailed method for the selective collection of certain waste fractions came into force (Journal of Laws 2017, item 19). This regulation specifies the detailed method for the selective collection of certain waste fractions and establishes a uniform segregation system for entire Poland. Pursuant to it, collected waste will be divided into the follow-ing fractions: paper, glass, metals and plastics, biodegradable waste and other waste (mixed). The enactment of such regulations in the light of the hitherto most popular waste collection system of two sacks or containers, with the division into segregated and mixed waste, will also cause the cost of its col-lection and management to change.
The municipality is obliged to specify, by way of resolution, the method for setting the fee rate for municipal waste management (Journal of Laws 2011 no. 152, item 897, as amended). The allowed criteria for setting munic-ipal waste management fees are as follows: number of residents on the prop-erty, volume of water used on a specific property or dwelling surface. Reve-nues from fees imposed on residents must cover all running costs of the sys-tem, including not only collection, transport, recovery, disposal of municipal solid waste or establishment and maintenance of selective municipal waste collection points, but also the administration of the system and educational campaigns among residents. In order to encourage residents to consciously handle waste, Municipal Councils very frequently set lower rates for the col-lection of segregated waste. According to Terek, Piotrowska (2013), the fee for municipal waste collection from people who collected waste selectively as the act was being implemented fell between PLN 2.5 and 15 per person per month. The average value for the whole of our country is PLN 8.5 per person per month. If waste is not collected selectively, the fee increases by 40.0% on average and falls between PLN 7 and 25 per person per month (Terek, Piotrowska, 2013).
The source literature emphasises the key role of ecological education in waste management (Kostecka, 2011). In this context, one can point out the special role that the economic factor plays in shaping pro-ecological attitudes
EKONOMIA I ŚRODOWISKO 2 (69) • 2019Environmental policy and management28
(Jaźwiński, 2010). The research into what motivates pro-ecological attitudes shows that instrumental (mainly economic and health-related) factors are the most efficient stimuli (Hłobił, 2009). There are research works which indicate that one municipality’s decisions could be influenced by those of a neighboring municipality (Zafra-Gómez, Chica-Olmo, 2018). Therefore, of significant importance is to research and analyze spatial interrelations of fee rates for waste collection and management.
Some authors, including Dahlén and Lagerkvist (2010), Dijkgraaf and Gradus (2004) and Sakai et al. (2008), claim that changes in the fee rate or in the method of its setting, often resulting in an increase in the fee rate, lead to reduction of municipal waste generated and to an increase in the share of waste directed to composting or recycling processes, which implements the paradigm of circular economy.
The aim of the paper was to analyse the variability of fees charged for waste collection and management and to analyse changes within this scope between 2013 and 2016 in the municipalities of the 1st Waste Management Region in the Silesian Voivodeship as regards the weight of mixed and segre-gated waste and efficiency of its selective collection.
Characteristics of the research area
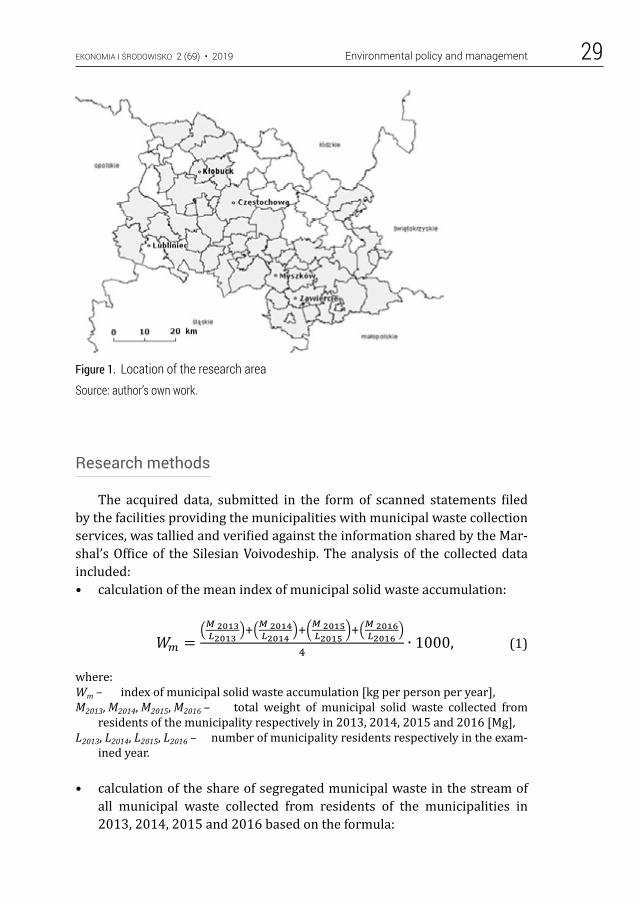
The research was conducted in the 1st Waste Management Region of the Silesian Voivodeship, which includes five counties, namely Częstochowa, Zawiercie, Kłobuck, Lubliniec and Myszków. In 2018, the Municipal Offices from this Waste Management Region were asked to share information neces-sary to prepare the characteristics of waste management fees incurred by residents of the municipalities and data to prepare the characteristics of waste generated in the research area. Thirty seven municipalities answered. The information for the analysis and statistical interpretation of results was obtained from 34 municipalities and applied to the period from 1 July 2013 to 31 December 2016. Some of the data was also acquired from online public information bulletins. Therefore, the ultimate research area covers 34 munic-ipalities whose location is shown in figure 1.
All of the examined municipalities are provided with waste management services by Częstochowskie Przedsiębiorstwo Komunalne Sp. z o. o. (CzPK), which manages the regional municipal solid waste treatment plant (Region-alna Instalacja Przetwarzania Odpadów Komunalnych – RIPOK).
EKONOMIA I ŚRODOWISKO 2 (69) • 2019 Environmental policy and management 29
Research methods
The acquired data, submitted in the form of scanned statements filed by the facilities providing the municipalities with municipal waste collection services, was tallied and verified against the information shared by the Mar-shal’s Office of the Silesian Voivodeship. The analysis of the collected data included:• calculation of the mean index of municipal solid waste accumulation:
(1)
where:Wm – index of municipal solid waste accumulation [kg per person per year],M2013, M2014, M2015, M2016 – total weight of municipal solid waste collected from
residents of the municipality respectively in 2013, 2014, 2015 and 2016 [Mg],L2013, L2014, L2015, L2016 – number of municipality residents respectively in the exam-
ined year.
• calculation of the share of segregated municipal waste in the stream of all municipal waste collected from residents of the municipalities in 2013, 2014, 2015 and 2016 based on the formula:
�� = ����������� ���
���������� ���
���������� ���
���������� �
� ∙ 1000, (1)
�� = �������
∙ 100�%�, (2)
�� = ��������������� � 1� ∙ 100, (3)
��,� = �����,��������,������ � 1� ∙ 100, (4)
Figure 1. Location of the research areaSource: author’s own work.
EKONOMIA I ŚRODOWISKO 2 (69) • 2019Environmental policy and management30
(2)
where:Us – share of segregated municipal waste in the entire municipal waste stream
in a specific year [%],Ms – weight of segregated municipal waste collected from residents of the municipal-
ity in a specific year [Mg],Mz – weight of mixed municipal waste collected from residents of the municipality
in a specific year [Mg].
• specification of the effectiveness of waste segregation by calculating the mean share of segregated waste in the stream of all municipal waste dur-ing the research period , calculated as an arithmetic mean of shares for the four years,
• evaluation of the increase/decrease in the share of segregated municipal waste calculated as the ratio of the segregation share in 2016 to the seg-regation share in 2013:
(3)
where:ΔU – ratio of the segregation share in 2016 to the segregation share in 2013 [%],Us2016 – share of segregated municipal waste in the entire municipal waste stream
in 2016 [%],Us2013 – share of segregated municipal waste in the entire municipal waste stream
in 2013 [%].
• based on the known rates for the collection and management of mixed municipal waste and selectively collected waste from residents in 2013 and 2016, we determined the change of these rates in each municipality throughout the four years:
(4)
where:UZ,S – change in the rate for the collection and management of mixed municipal waste
(z) and selectively collected waste (s) [%],OpZ,S 2016 – rate for the collection and management of mixed municipal waste (z) and
selectively collected waste (s) in 2016 [PLN per person per month],OpZ,S 2013 – rate for the collection and management of mixed municipal waste (z) and
selectively collected waste (s) in 2013 [PLN per person per month].
The ratio of the mean rate for the collection and management of selec-tively collected waste to the mean rate for the collection and management of
�� = ����������� ���
���������� ���
���������� ���
���������� �
� ∙ 1000, (1)
�� = �������
∙ 100�%�, (2)
�� = ��������������� � 1� ∙ 100, (3)
��,� = �����,��������,������ � 1� ∙ 100, (4)
�� = ����������� ���
���������� ���
���������� ���
���������� �
� ∙ 1000, (1)
�� = �������
∙ 100�%�, (2)
�� = ��������������� � 1� ∙ 100, (3)
��,� = �����,��������,������ � 1� ∙ 100, (4)
�� = ����������� ���
���������� ���
���������� ���
���������� �
� ∙ 1000, (1)
�� = �������
∙ 100�%�, (2)
�� = ��������������� � 1� ∙ 100, (3)
��,� = �����,��������,������ � 1� ∙ 100, (4)
EKONOMIA I ŚRODOWISKO 2 (69) • 2019 Environmental policy and management 31
mixed municipal waste will allow us to determine whether the municipality encourages its residents to collect waste selectively in financial terms.
For the mean values of analyzed fee rates and above mentioned indexes standard deviation values were calculated and presented in the text.
Results visualization
The results are presented in graphical form. To prepare the presentation, the ArcView GIS 10 was used. Maps were prepared to present the data on waste management in the specific region. To group the municipalities, we applied the Jenks natural breaks classification method, which meets the fol-lowing assumptions: data of approximate values belong to one class; each class contains a specific number of values; none is an empty set (Jenks, 1967).
Results of the research
Mass accumulation of waste
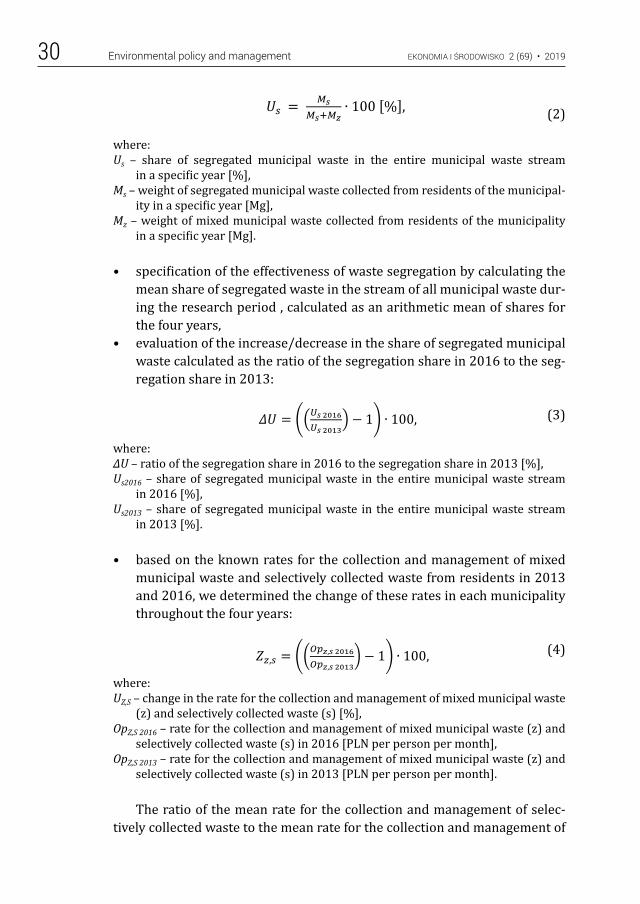
The mean index of mixed municipal solid waste accumulation for the research area was 236±59 kg per person per year. This value is close to the Polish average, which in 2014 was 214 kg per person per year; however, it was smaller than the value for the Silesian Voivodeship, which in 2014 reached 280 kg per person per year (Ochrona środowiska, 2015). The lowest value of the mass accumulation index was 125 kg per person per year and was recorded in the rural municipality of Niegowa, whereas the highest was recorded in the urban municipality of Zawiercie: 341 kg per person per year.
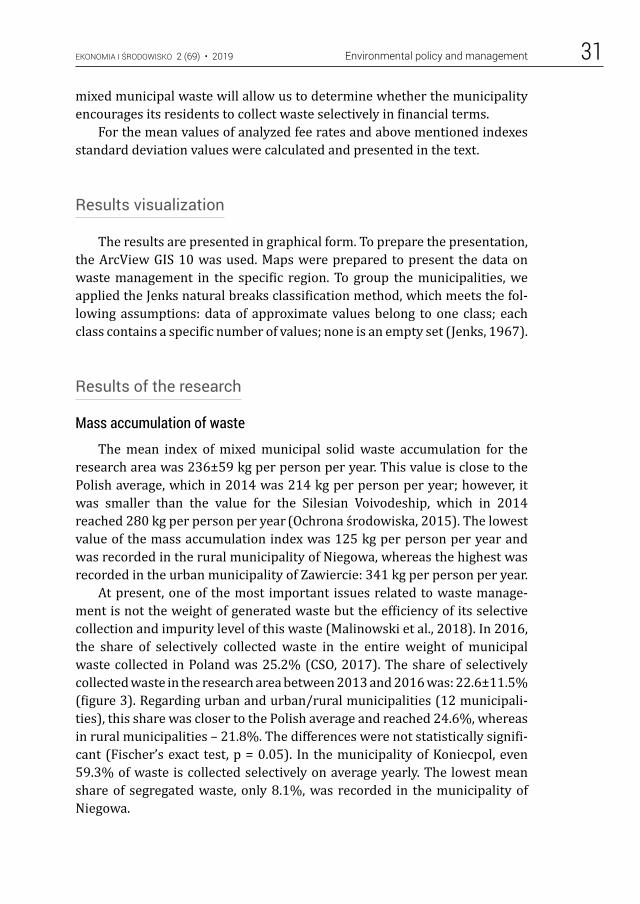
At present, one of the most important issues related to waste manage-ment is not the weight of generated waste but the efficiency of its selective collection and impurity level of this waste (Malinowski et al., 2018). In 2016, the share of selectively collected waste in the entire weight of municipal waste collected in Poland was 25.2% (CSO, 2017). The share of selectively collected waste in the research area between 2013 and 2016 was: 22.6±11.5% (figure 3). Regarding urban and urban/rural municipalities (12 municipali-ties), this share was closer to the Polish average and reached 24.6%, whereas in rural municipalities – 21.8%. The differences were not statistically signifi-cant (Fischer’s exact test, p = 0.05). In the municipality of Koniecpol, even 59.3% of waste is collected selectively on average yearly. The lowest mean share of segregated waste, only 8.1%, was recorded in the municipality of Niegowa.
EKONOMIA I ŚRODOWISKO 2 (69) • 2019Environmental policy and management32
Figure 2. Mean index of mixed municipal solid waste accumulation in the municipalities [kg per person per year]
Source: author’s own work.
Figure 3. Mean share of selectively collected waste in the total stream of municipal solid waste [%]
Source: author’s own work.
EKONOMIA I ŚRODOWISKO 2 (69) • 2019 Environmental policy and management 33
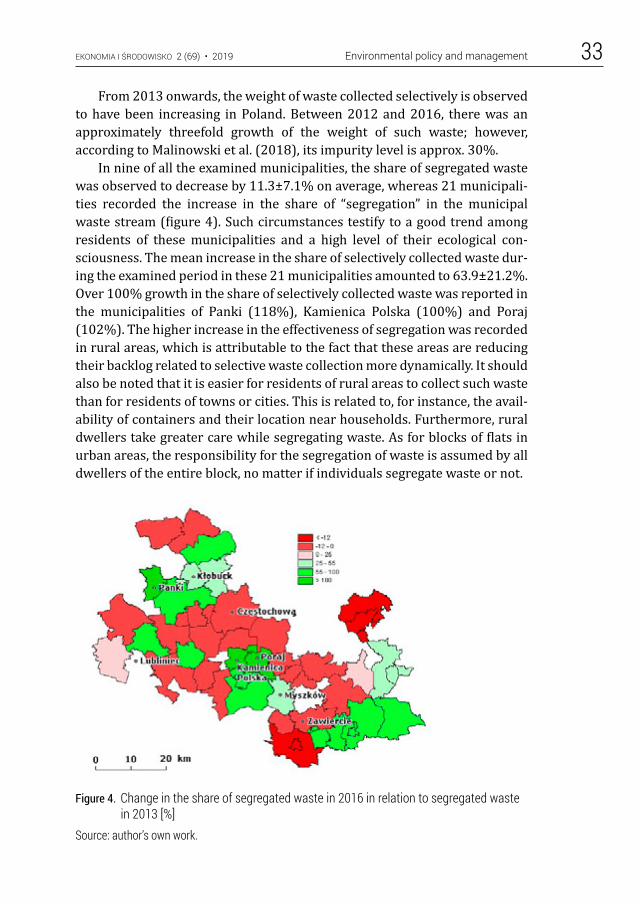
From 2013 onwards, the weight of waste collected selectively is observed to have been increasing in Poland. Between 2012 and 2016, there was an approximately threefold growth of the weight of such waste; however, according to Malinowski et al. (2018), its impurity level is approx. 30%.
In nine of all the examined municipalities, the share of segregated waste was observed to decrease by 11.3±7.1% on average, whereas 21 municipali-ties recorded the increase in the share of “segregation” in the municipal waste stream (figure 4). Such circumstances testify to a good trend among residents of these municipalities and a high level of their ecological con-sciousness. The mean increase in the share of selectively collected waste dur-ing the examined period in these 21 municipalities amounted to 63.9±21.2%. Over 100% growth in the share of selectively collected waste was reported in the municipalities of Panki (118%), Kamienica Polska (100%) and Poraj (102%). The higher increase in the effectiveness of segregation was recorded in rural areas, which is attributable to the fact that these areas are reducing their backlog related to selective waste collection more dynamically. It should also be noted that it is easier for residents of rural areas to collect such waste than for residents of towns or cities. This is related to, for instance, the avail-ability of containers and their location near households. Furthermore, rural dwellers take greater care while segregating waste. As for blocks of flats in urban areas, the responsibility for the segregation of waste is assumed by all dwellers of the entire block, no matter if individuals segregate waste or not.
Figure 4. Change in the share of segregated waste in 2016 in relation to segregated waste in 2013 [%]
Source: author’s own work.
EKONOMIA I ŚRODOWISKO 2 (69) • 2019Environmental policy and management34
Fees paid by residents for waste management
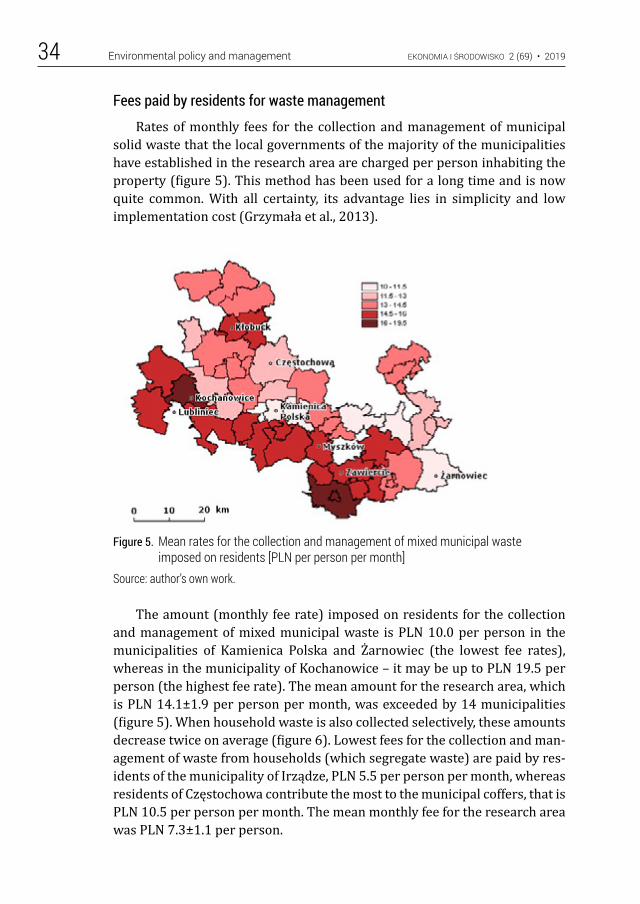
Rates of monthly fees for the collection and management of municipal solid waste that the local governments of the majority of the municipalities have established in the research area are charged per person inhabiting the property (figure 5). This method has been used for a long time and is now quite common. With all certainty, its advantage lies in simplicity and low implementation cost (Grzymała et al., 2013).
Figure 5. Mean rates for the collection and management of mixed municipal waste imposed on residents [PLN per person per month]
Source: author’s own work.
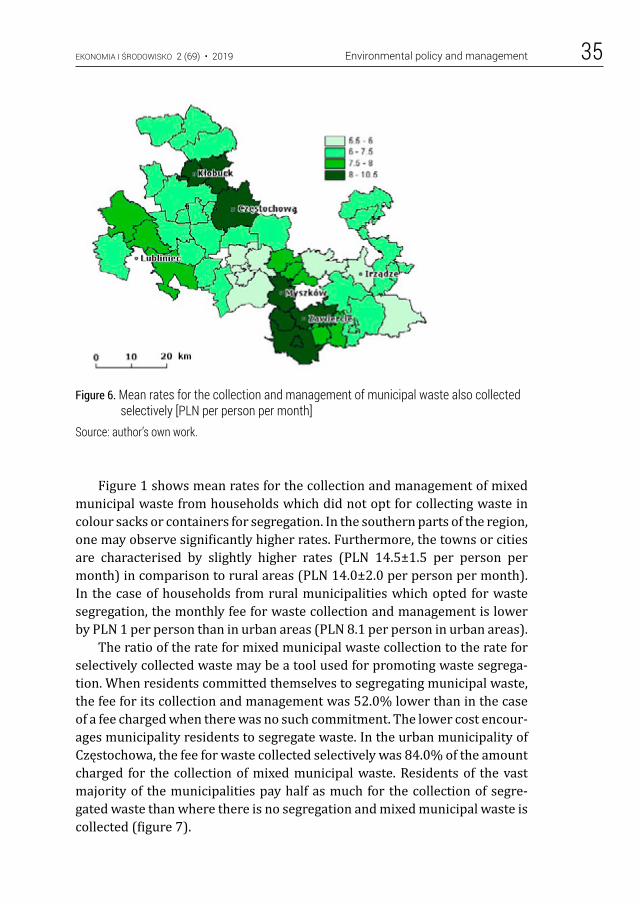
The amount (monthly fee rate) imposed on residents for the collection and management of mixed municipal waste is PLN 10.0 per person in the municipalities of Kamienica Polska and Żarnowiec (the lowest fee rates), whereas in the municipality of Kochanowice – it may be up to PLN 19.5 per person (the highest fee rate). The mean amount for the research area, which is PLN 14.1±1.9 per person per month, was exceeded by 14 municipalities (figure 5). When household waste is also collected selectively, these amounts decrease twice on average (figure 6). Lowest fees for the collection and man-agement of waste from households (which segregate waste) are paid by res-idents of the municipality of Irządze, PLN 5.5 per person per month, whereas residents of Częstochowa contribute the most to the municipal coffers, that is PLN 10.5 per person per month. The mean monthly fee for the research area was PLN 7.3±1.1 per person.
EKONOMIA I ŚRODOWISKO 2 (69) • 2019 Environmental policy and management 35
Figure 6. Mean rates for the collection and management of municipal waste also collected selectively [PLN per person per month]
Source: author’s own work.
Figure 1 shows mean rates for the collection and management of mixed municipal waste from households which did not opt for collecting waste in colour sacks or containers for segregation. In the southern parts of the region, one may observe significantly higher rates. Furthermore, the towns or cities are characterised by slightly higher rates (PLN 14.5±1.5 per person per month) in comparison to rural areas (PLN 14.0±2.0 per person per month). In the case of households from rural municipalities which opted for waste segregation, the monthly fee for waste collection and management is lower by PLN 1 per person than in urban areas (PLN 8.1 per person in urban areas).
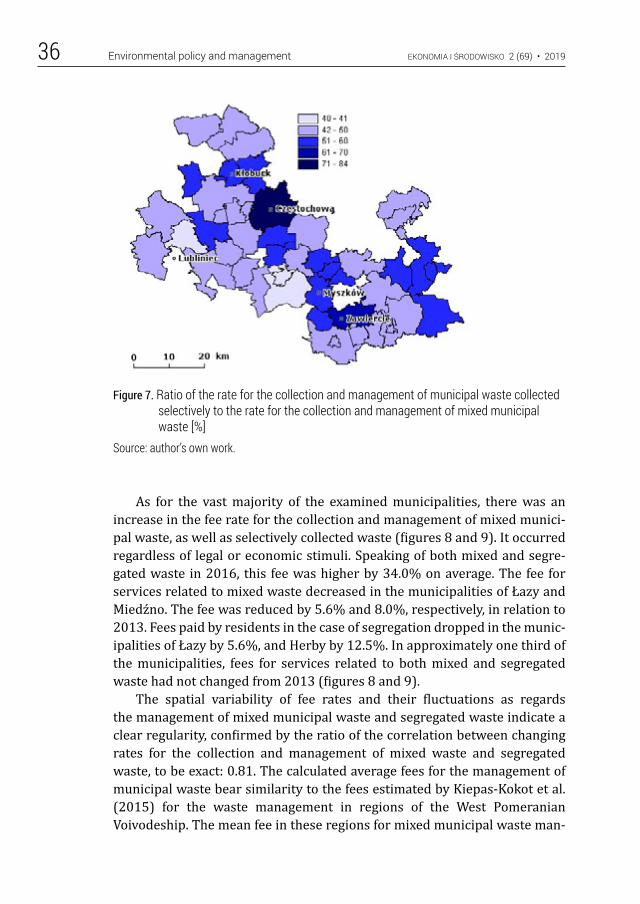
The ratio of the rate for mixed municipal waste collection to the rate for selectively collected waste may be a tool used for promoting waste segrega-tion. When residents committed themselves to segregating municipal waste, the fee for its collection and management was 52.0% lower than in the case of a fee charged when there was no such commitment. The lower cost encour-ages municipality residents to segregate waste. In the urban municipality of Częstochowa, the fee for waste collected selectively was 84.0% of the amount charged for the collection of mixed municipal waste. Residents of the vast majority of the municipalities pay half as much for the collection of segre-gated waste than where there is no segregation and mixed municipal waste is collected (figure 7).
EKONOMIA I ŚRODOWISKO 2 (69) • 2019Environmental policy and management36
Figure 7. Ratio of the rate for the collection and management of municipal waste collected selectively to the rate for the collection and management of mixed municipal waste [%]
Source: author’s own work.
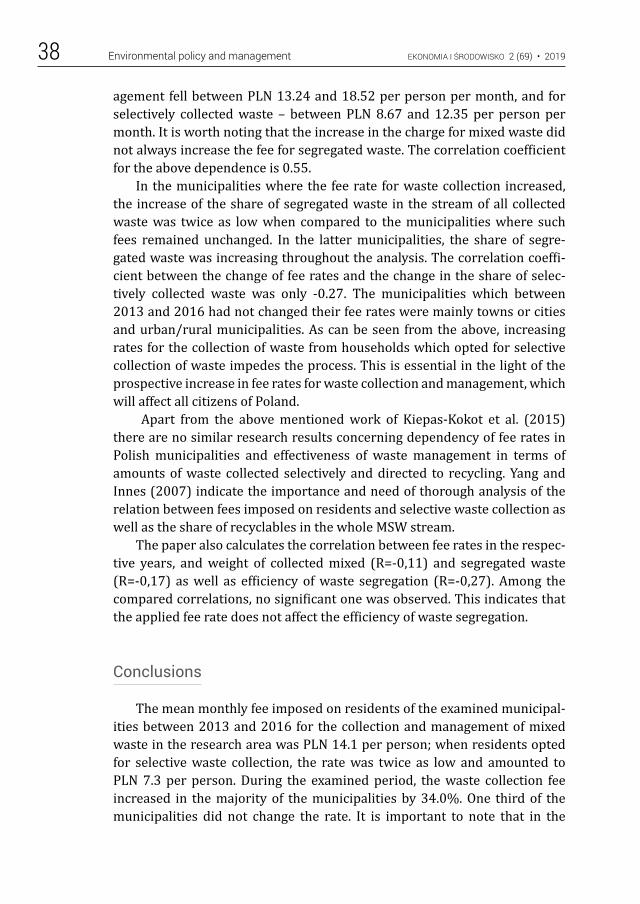
As for the vast majority of the examined municipalities, there was an increase in the fee rate for the collection and management of mixed munici-pal waste, as well as selectively collected waste (figures 8 and 9). It occurred regardless of legal or economic stimuli. Speaking of both mixed and segre-gated waste in 2016, this fee was higher by 34.0% on average. The fee for services related to mixed waste decreased in the municipalities of Łazy and Miedźno. The fee was reduced by 5.6% and 8.0%, respectively, in relation to 2013. Fees paid by residents in the case of segregation dropped in the munic-ipalities of Łazy by 5.6%, and Herby by 12.5%. In approximately one third of the municipalities, fees for services related to both mixed and segregated waste had not changed from 2013 (figures 8 and 9).
The spatial variability of fee rates and their fluctuations as regards the management of mixed municipal waste and segregated waste indicate a clear regularity, confirmed by the ratio of the correlation between changing rates for the collection and management of mixed waste and segregated waste, to be exact: 0.81. The calculated average fees for the management of municipal waste bear similarity to the fees estimated by Kiepas-Kokot et al. (2015) for the waste management in regions of the West Pomeranian Voivodeship. The mean fee in these regions for mixed municipal waste man-
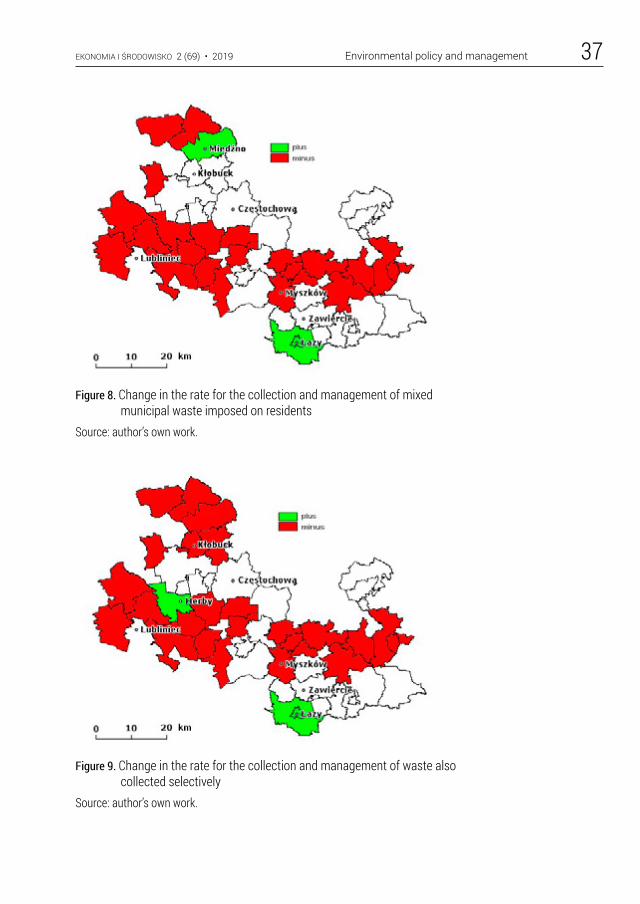
EKONOMIA I ŚRODOWISKO 2 (69) • 2019 Environmental policy and management 37
Figure 9. Change in the rate for the collection and management of waste also collected selectively
Source: author’s own work.
Figure 8. Change in the rate for the collection and management of mixed municipal waste imposed on residents
Source: author’s own work.
EKONOMIA I ŚRODOWISKO 2 (69) • 2019Environmental policy and management38
agement fell between PLN 13.24 and 18.52 per person per month, and for selectively collected waste – between PLN 8.67 and 12.35 per person per month. It is worth noting that the increase in the charge for mixed waste did not always increase the fee for segregated waste. The correlation coefficient for the above dependence is 0.55.
In the municipalities where the fee rate for waste collection increased, the increase of the share of segregated waste in the stream of all collected waste was twice as low when compared to the municipalities where such fees remained unchanged. In the latter municipalities, the share of segre-gated waste was increasing throughout the analysis. The correlation coeffi-cient between the change of fee rates and the change in the share of selec-tively collected waste was only -0.27. The municipalities which between 2013 and 2016 had not changed their fee rates were mainly towns or cities and urban/rural municipalities. As can be seen from the above, increasing rates for the collection of waste from households which opted for selective collection of waste impedes the process. This is essential in the light of the prospective increase in fee rates for waste collection and management, which will affect all citizens of Poland.
Apart from the above mentioned work of Kiepas-Kokot et al. (2015) there are no similar research results concerning dependency of fee rates in Polish municipalities and effectiveness of waste management in terms of amounts of waste collected selectively and directed to recycling. Yang and Innes (2007) indicate the importance and need of thorough analysis of the relation between fees imposed on residents and selective waste collection as well as the share of recyclables in the whole MSW stream.
The paper also calculates the correlation between fee rates in the respec-tive years, and weight of collected mixed (R=-0,11) and segregated waste (R=-0,17) as well as efficiency of waste segregation (R=-0,27). Among the compared correlations, no significant one was observed. This indicates that the applied fee rate does not affect the efficiency of waste segregation.
Conclusions
The mean monthly fee imposed on residents of the examined municipal-ities between 2013 and 2016 for the collection and management of mixed waste in the research area was PLN 14.1 per person; when residents opted for selective waste collection, the rate was twice as low and amounted to PLN 7.3 per person. During the examined period, the waste collection fee increased in the majority of the municipalities by 34.0%. One third of the municipalities did not change the rate. It is important to note that in the
EKONOMIA I ŚRODOWISKO 2 (69) • 2019 Environmental policy and management 39
municipalities where the fee rate was increased, the rise applied to both res-idents who collected only mixed waste and ones who segregated it. Similarly, in the municipalities where the fee was increased, the efficiency of segrega-tion was hampered, which segregation is essential due to the necessity of our meeting UE regulations pertaining to waste recycling.
The mean share of the segregated municipal waste stream in the entire stream of collected waste for the period and region under examination was 22.6%. No significant correlation was observed between the applied fee rate and efficiency of selective waste collection.
Acknowledgements
This research has been supported by Ministry of Science and Higher Edu-cation within the project No. DS 3600/WIPIE.
The contribution of the authors
Mateusz Malinowski – 40% (conception, literature review, data analysis, interpreta-tion, discussion).
Maria Łukasiewicz – 25% (literature review, data analysis).Stanislaw Famielec – 25% (literature review, data analysis, language correction).Karina Nowińska – 10% (data collection, data analysis).
Literature
van Beukering P.J.H. et al. (2009), Effectiveness of unit-based pricing of waste in the Netherlands: applying a general equilibrium model, “Waste Management” Vol. 29, No. 11, p. 2892-2901, DOI: 10.1016/j.wasman.2009.07.002
Ciura D., Łukasiewicz M., Malinowski M. (2017), Analysis of morphological composi-tion of wastes deposited on illegal dumping sites located in the area of Olsztyn dis-trict, “Infrastructure and Ecology of Rural Areas” No. IV(1), p. 1301-1315, DOI: 10.14597/infraeco.2017.4.1.100
Chang Y.M. et al. (2008), Change in MSW characteristics under recent management strategies in Taiwan, “Waste Management” Vol. 28, p. 2443-2455, DOI: 10.1016/ j.wasman.2007.10.014
CSO: Central Statistical Office – GUS (2017), Infrastruktura komunalna w 2016 r., Warszawa
CSO: Central Statistical Office – GUS (2015), Ochrona środowiska, www.stat.gov.pl [10-04-2018]
Dahlén L., Lagerkvist A. (2010), Pay as you throw: strengths and weaknesses of weight-based billing in household waste collection systems in Sweden, “Waste Manage-ment” Vol. 30, No 1. p. 23-31, DOI: 10.1016/j.wasman.2009.09.022
Dijkgraaf E., Gradus R.H.J.M. (2004), Burn or bury? A social cost comparison of final waste disposal methods, “Ecological Economics” Vol. 50, No. 3-4, p. 233-247, DOI: 10.1016/j.ecolecon.2004.03.029
EKONOMIA I ŚRODOWISKO 2 (69) • 2019Environmental policy and management40
Dijkgraaf E., Gradus R.H.J.M. (2009), Environmental activism and dynamics of unit-based pricing systems, “Resource and Energy Economics” Vol. 31, p. 13-23, DOI: 10.1016/j.reseneeco.2008.10.003
EU (2008), Directive 2008/98/EC of the European Parliament and of the Council of 19 November 2008 on waste and repealing certain Directives, L 312
Gellynck X., Verhelst P. (2007), Assessing instruments for mixed household solid waste collection services in the Flemish region of Belgium, “Resources, Conservation and Recycling” Vol. 49, No. 4, p. 372-387, DOI: 10.1016/j.resconrec.2006.05.003
Grzymała Z. et al. (2013), Racjonalizacja gospodarki odpadami komunalnymi w Polsce w świetle zmian Ustawy o utrzymaniu czystości i porządku w gminach, Szkoła Główna Handlowa w Warszawie – Oficyna Wydawnicza, Warszawa
Hłobił A. (2009), Motywy ochrony środowiska a zachowania proekologiczne człowieka, „Monografie Komitetu Inżynierii Środowiska PAN” No. 59, p. 49-54
Jaźwiński I. (2010), Podstawy polityki ekologicznej, in: K. Małachowski (ed.), Gosp-odarka a środowisko i ekologia, Warszawa, p. 209-215
Journal of Laws 2017, item 19, Rozporządzenie Ministra Środowiska z dnia 29 grudnia 2016 r. w sprawie szczegółowego sposobu selektywnego zbierania wybranych frak-cji odpadów (Dz.U. 2017 poz. 19)
Journal of Laws 2017, item 723, Rozporządzenie Rady Ministrów z dnia 6 marca 2017 r. zmieniające rozporządzenie w sprawie opłat za korzystanie ze środowiska (Dz.U. 2017 poz. 723)
Journal of Laws 2011, no. 152, item 897, Ustawa z dnia 1 lipca 2011 r. o zmianie ust-awy o utrzymaniu czystości i porządku w gminach oraz niektórych innych ustaw (Dz.U. 2011. 152 poz. 897 z późn. zm.)
Kostecka J. (2011), Partycypacja społeczna i segregacja odpadów niebezpiecznych w gospodarstwach domowych, „Ekonomia i Środowisko” Vol. 39, No. 1, p. 195-207
Kiepas-Kokot A., Łysko A., Nowak M.J., (2015), Zróżnicowanie obciążeń gospodarstw domowych z tytułu opłat za gospodarowanie odpadami w gminach województwa zachodniopomorskiego, „Ekonomia i Środowisko” Vol. 54, No. 3, p. 154-168
O’Connor D. (1996), Applying Economic Instruments in Developing Countries: From Theory to Implementation, OECD Development Centre, Paris, www.eepsea.org/pub/sp/118126.pdf [27-12-2018]
Malinowski M. (2011), Changes in municipal waste management following the amend-ment of the act on maintaining the cleanliness and order in communes, “Infrastruc-ture and Ecology of Rural Areas” No. 12, p. 103-115
Malinowski M., Kopytko A.M. (2014), Assessment of segregated waste accumulation efficiency in selected suburban communities, “Infrastructure and Ecology of Rural Areas” No. IV/3, p. 1499-1512, DOI: 10.14597/infraeco.2014.4.3.114
Malinowski M., Grzelec K., Gutwin M. (2018), Analiza zanieczyszczeń w selektywnie gromadzonych odpadach tworzyw sztucznych – studium przypadku, ”Infrastruc-ture and Ecology of Rural Areas” No. II/1, p. 465-478, DOI: 10.14597/infra-eco.2017.2.1.031
Sakai S. et al. (2008), Unit-charging programs for municipal solid waste in Japan, “Waste Management” Vol. 28, p. 2815-2825, DOI: 10.1016/j.wasman.2008.07.010
Steinhoff-Wrześniewska A. (2015), The preparing communities at rural areas for waste management in the light of new regulations, „Archiwum Gospodarki Odpad-ami i Ochrony Środowiska” Vol. 17, No. 2, p. 49-58
EKONOMIA I ŚRODOWISKO 2 (69) • 2019 Environmental policy and management 41
Terek K., Piotrowska A. (2013), Płacić każdy może – trochę taniej lub trochę drożej, „Przegląd Komunalny” No. 4(259), p. 49-53
Töpfer K. (ed.) (2005), Selection, Design and Implementation of Economic Instruments in the Solid Waste Management Sector in Kenya The Case of Plastic Bags, United Nations Environment Programme, www.unep.ch/etb/publications/EconInst/Kenya.pdf [27-12-2018]
Welivita I., Wattage P., Gunawardena P. (2015), Review of household solid waste charges for developing countries – A focus on quantity-based charge methods, “Waste Management” Vol. 46, p. 637-645, DOI: 10.1016/j.wasman.2015.08.018
Yang H., Innes R. (2007), Economic incentives and residential waste management in Taiwan: an empirical investigation, “Environmental and Resource Economics” Vol. 37, No. 3, p. 489-519 DOI: 10.1007/s10640-006-9040-0
Zafra-Gómez J.L., Chica-Olmo J. (2019), Spatial spillover effect of delivery forms on cost of public services in small and medium-sized Spanish municipalities, “Cities” Vol. 85, p. 203-216, DOI: 10.1016/j.cities.2018.09.008
EKONOMIA I ŚRODOWISKO • 2 (69) • 2019
SUSTAINABLE DEVELOPMENT POLICY IN THE FIELD OF RENEWABLE ENERGY SOURCES – THE EUROPEAN PERSPECTIVE
ABSTRACT: The aim of the article is to review EU policy towards renewable energy sources (RES) and their assessment, taking into account the principles of sustainable development. The presented devel-opment is of a theoretical nature. Therefore, the basic research method is the analysis of available sources, such as statistical data, EU legal acquis and reports. Many aspects are touched upon in implementing the principles of sustainable development in energy policy. For this reason, the following have been selected for analysis: the share of RES in the overall energy balance, the energy mix of renewable energy sources and the use of soft instruments supporting RES. As a result of the analysis, it has been found that despite undoubted progress regarding the increase in share of RES in the energy balance, many problems remained unresolved. These include the sustainable use of biomass (espe-cially wood resources) and insufficient use (despite the progress made in this area) of soft instru-ments.KEY WORDS: renewable energy sources, sustainable development, bioenergy, soft instruments, Euro-pean Union policy
Agnieszka Lorek, PhD (ORCID 0000-0002-1812-9692) – University of Economics in Katowice
Correspondence address:1 Maja Street 50, 40-287, Katowice, Polande-mail: [email protected]
Agnieszka LOREK
JEL: Q01, Q42, Q48No. 2(69) 2019 • pages: 42-57 https://doi.org/10.34659/2019/2/20
EKONOMIA I ŚRODOWISKO 2 (69) • 2019 Environmental policy and management 43
Introduction
The sustainability of economic development depends on ensuring con-stant access to energy sources. Uninterrupted access to such and an unre-strained increase in production and consumption brings about a situation wherein the demand for energy continues to grow. This results in the deple-tion of some energy resources, as well as the pollution of the environment, and, consequently, climate change. The striving to reduce the negative impact on the environment and to use rationally national resources has, for a good number of years, forced many countries to focus upon developing renewable energy sources and to improve energy efficiency (see: Sathaye et al., 2011; European Commission, 2011; UNECE, 2015; German Energy Agency and UNECE, 2017; European Union and IRENA, 2018; IRENA, 2019). Attributes of renewable energy are the inexhaustibility of resources and the elimination of various types of pollution. However, even the production of energy from renewable sources carries some risks. For example:• biomass production could contribute to excessive deforestation, losses in
ecosystem services and landscape change (see: Firbank, 2008; Evans et al., 2013; Olesen et al., 2016; Costanza et al., 2015; Tarr, Rubino, Costanza, 2016; Costanza et al., 2017). It is worth mentioning that land-use change and subsequent habitat destruction have been the major cause of biodi-versity loss in terrestrial ecosystems over the last 50 years (Millenium Ecosystem Assessment, 2005; Secretariat of the Convention on Biological Diversity, 2010; WWF, 2012),
• dams for hydroelectric production cause flooding of huge tracts of space, hence, contributing to social, as well as environmental losses (see: The World Commission on Dams, 2000; Richter et al., 2010),
• the production of wind energy contributes locally to the generation of noise and to social costs (see: Upreti, 2004; Jobert et al., 2007; Wüstenha-gen et al., 2007; Wolsink, 2010).Nevertheless, it is with renewable energy that the world has the greatest
hope for sustainable development. The policy of sustainable development in the field of energy should recognize and minimize such threats, taking into account existing social needs. Moreover, it should maintain dialogue with local communities. However, the controversy regarding the use of renewable energy sources mentioned above raises the questions: ‘Can all elements and activities in the field of supporting renewable energy sources be considered fully sustainable?’ and ‘Which activity should be adjusted?’. In this context, the aim of the article is to review the EU policy towards renewable energy sources (RES) and its subsequent assessment, taking into account the princi-
EKONOMIA I ŚRODOWISKO 2 (69) • 2019Environmental policy and management44
ples of sustainable development. The presented article is, therefore, an attempt to supplement knowledge and opinions in this area. Due to the restrictions on the volume of the article, the analysis concerns selected aspects of EU policy on renewable energy in three dimensions of sustainable development:1. In the economic dimension – the analysis deals with the basic quantita-
tive data regarding the share of RES in the energy balance. These activi-ties were considered to improve the energy security of the economy. The wider use of renewable energy sources may also contribute to the econ-omies of scale and thus the reduction of costs associated with the use of renewable energy.
2. In the environmental dimension, the analysis appertains to the structure of the sources of energy obtained from RES.
3. In the social dimension – the analysis covered the use of policy instru-ments aimed at broad social participation and at shaping pro-environ-mental consumer attitudes.
Research methods
The presented paper is of a theoretical nature. Therefore, the basic research method is the analysis of available sources, such as literature of the subject, statistical data, reports, political guidelines and EU legal acquis in the field of renewable energy sources.
In connection with the stated goal of the article, the adopted research procedure concerned obtaining answers to three main questions:1. What have been the trends regarding the share of renewable energy in
the energy balance in EU countries and what is the state of implementa-tion of EU RES policy targets?
2. What is the structure of energy generation from renewable sources? Can all of these be assessed as sustainable?The basic sources of data used to answer the above questions were statis-
tical data available in the Eurostat, International Energy Agency (IEA), Euro-pean Environment Agency (EEA), OECD, Central Statistical Office (GUS) data-bases. The data mined is for the period 2010-2015 (latest available data at the time of completing the article).3. What is the scale of soft instruments (social impact tools) use in the EU
Member States that influence the shaping of social attitudes towards energy production and consumption?The answer to this research question was based on the analysis of source
data contained in the reports on progress in the promotion and use of energy
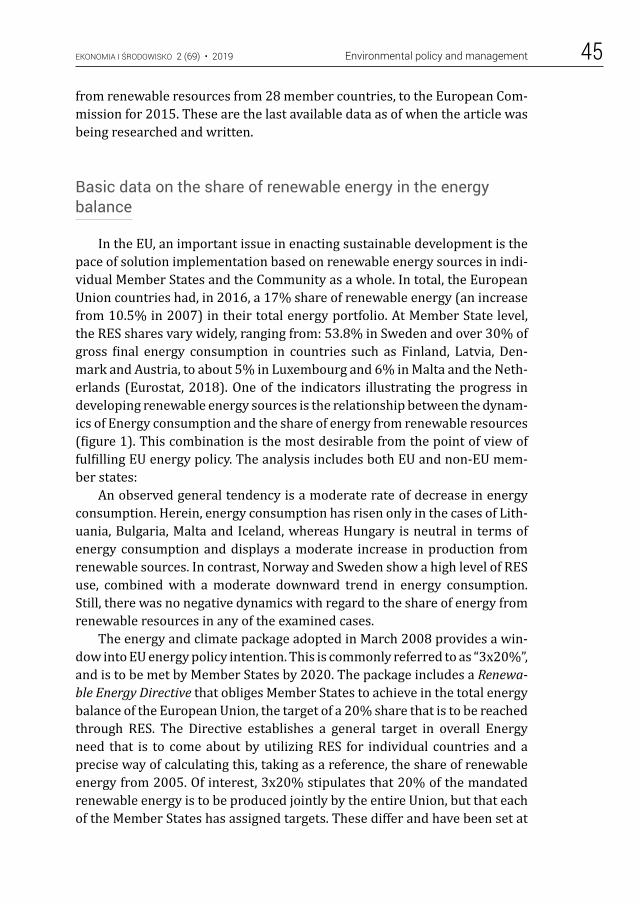
EKONOMIA I ŚRODOWISKO 2 (69) • 2019 Environmental policy and management 45
from renewable resources from 28 member countries, to the European Com-mission for 2015. These are the last available data as of when the article was being researched and written.
Basic data on the share of renewable energy in the energy balance
In the EU, an important issue in enacting sustainable development is the pace of solution implementation based on renewable energy sources in indi-vidual Member States and the Community as a whole. In total, the European Union countries had, in 2016, a 17% share of renewable energy (an increase from 10.5% in 2007) in their total energy portfolio. At Member State level, the RES shares vary widely, ranging from: 53.8% in Sweden and over 30% of gross final energy consumption in countries such as Finland, Latvia, Den-mark and Austria, to about 5% in Luxembourg and 6% in Malta and the Neth-erlands (Eurostat, 2018). One of the indicators illustrating the progress in developing renewable energy sources is the relationship between the dynam-ics of Energy consumption and the share of energy from renewable resources (figure 1). This combination is the most desirable from the point of view of fulfilling EU energy policy. The analysis includes both EU and non-EU mem-ber states:
An observed general tendency is a moderate rate of decrease in energy consumption. Herein, energy consumption has risen only in the cases of Lith-uania, Bulgaria, Malta and Iceland, whereas Hungary is neutral in terms of energy consumption and displays a moderate increase in production from renewable sources. In contrast, Norway and Sweden show a high level of RES use, combined with a moderate downward trend in energy consumption. Still, there was no negative dynamics with regard to the share of energy from renewable resources in any of the examined cases.
The energy and climate package adopted in March 2008 provides a win-dow into EU energy policy intention. This is commonly referred to as “3x20%”, and is to be met by Member States by 2020. The package includes a Renewa-ble Energy Directive that obliges Member States to achieve in the total energy balance of the European Union, the target of a 20% share that is to be reached through RES. The Directive establishes a general target in overall Energy need that is to come about by utilizing RES for individual countries and a precise way of calculating this, taking as a reference, the share of renewable energy from 2005. Of interest, 3x20% stipulates that 20% of the mandated renewable energy is to be produced jointly by the entire Union, but that each of the Member States has assigned targets. These differ and have been set at
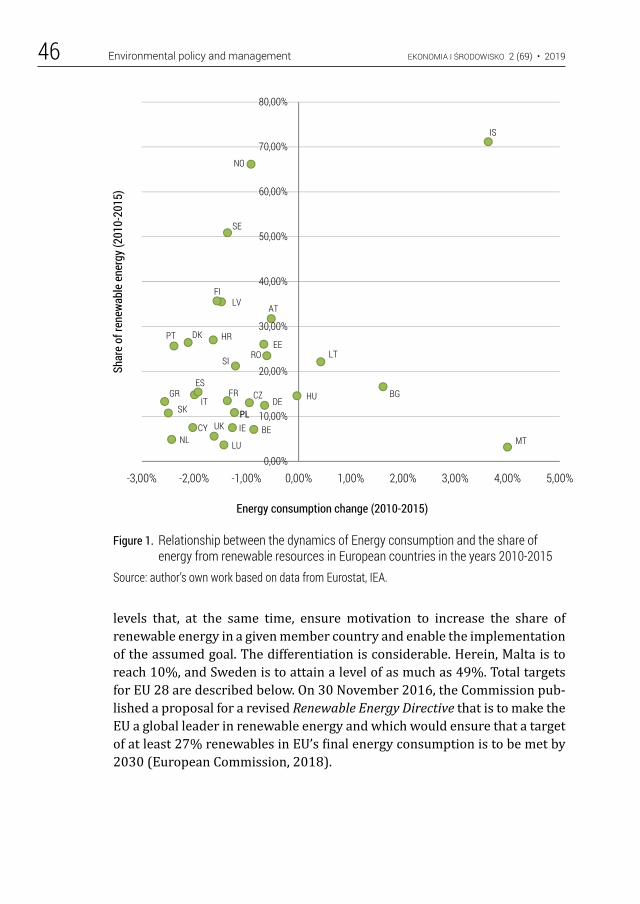
EKONOMIA I ŚRODOWISKO 2 (69) • 2019Environmental policy and management46
levels that, at the same time, ensure motivation to increase the share of renewable energy in a given member country and enable the implementation of the assumed goal. The differentiation is considerable. Herein, Malta is to reach 10%, and Sweden is to attain a level of as much as 49%. Total targets for EU 28 are described below. On 30 November 2016, the Commission pub-lished a proposal for a revised Renewable Energy Directive that is to make the EU a global leader in renewable energy and which would ensure that a target of at least 27% renewables in EU’s final energy consumption is to be met by 2030 (European Commission, 2018).
Figure 1. Relationship between the dynamics of Energy consumption and the share of energy from renewable resources in European countries in the years 2010-2015
Source: author’s own work based on data from Eurostat, IEA.
F1
BE
BGCZ
DK
DE
EE
IE
GRES
FR
HR
IT
CY
LV
LT
LU
HU
MTNL
AT
PL
PT
ROSI
SK
FI
SE
UK
IS
NO
0,00%
10,00%
20,00%
30,00%
40,00%
50,00%
60,00%
70,00%
80,00%
-3,00% -2,00% -1,00% 0,00% 1,00% 2,00% 3,00% 4,00% 5,00%
Shar
e of
rene
wabl
e en
ergy
(201
0-20
15)
Energy consumption change (2010-2015)
EKONOMIA I ŚRODOWISKO 2 (69) • 2019 Environmental policy and management 47
As previously mentioned, the EU established renewable resource share targets in the block’s total energy balance. However, the situation in the Member States regarding the fulfilment of commitments in this area is diver-sified. In eleven EU countries, renewable energy consumption in 2013 was below what was expected in their National Renewable Energy Action Plans – NREAPs (EEA, 2016), while ten have already exceeded their commitments (Bulgaria, the Czech Republic, Estonia, Croatia, Italy, Lithuania, Romania, Fin-land, Sweden and Denmark). Moreover, Slovakia, Austria and Hungary are very close to achieving the set goal at a difference of less than 2%, and a large group of countries (Slovenia, Portugal, Poland, Malta, Latvia, Cyprus, Spain, Greece and Germany) are in the range of 2.1 to 5.0%. France still has the most to do in the field of renewable energy (as much as a 7.8% increase is needed to reach the target of 23%). Yet, according to IEA data, France is one of the leading countries when it comes to a low-carbon energy mix. According to 2015 data, only 47% of total energy consumption comes from fossil fuels, because nuclear energy generation made up 46% of the energy mix and 78% of overall electricity generation (the highest share worldwide). France has also witnessed the full decoupling of its energy consumption and carbon dioxide (CO2) emissions from economic and population growth. In the coun-try, total energy supply and consumption, as well as CO2 emissions from fuel combustion have declined sharply over the past decade. Indeed, the carbon intensity of the French economy is half the IEA average and has decreased by almost 30% below its level in 2004 (versus an IEA average decline of -20% during the same period) (OECD/IEA, 2017; France, 2016 Review). In con-trast, the Netherlands, which we associate with bicycles and common sense and a sustainable approach to the world, has a lot to do in the category of green energy, because they have to catch up by 8.2% as of 2020, although the target for the entire country is only 14%. The remaining countries included in the group that are furthest from achieving the set goals are: Belgium, Lux-embourg, Ireland and the United Kingdom.
The energy mix of renewable energy sources
The energy mix of renewable energy sources also sees significant diver-sity. This is strongly conditioned by the local development potential of indi-vidual RES types (see figure 2 and table 1).
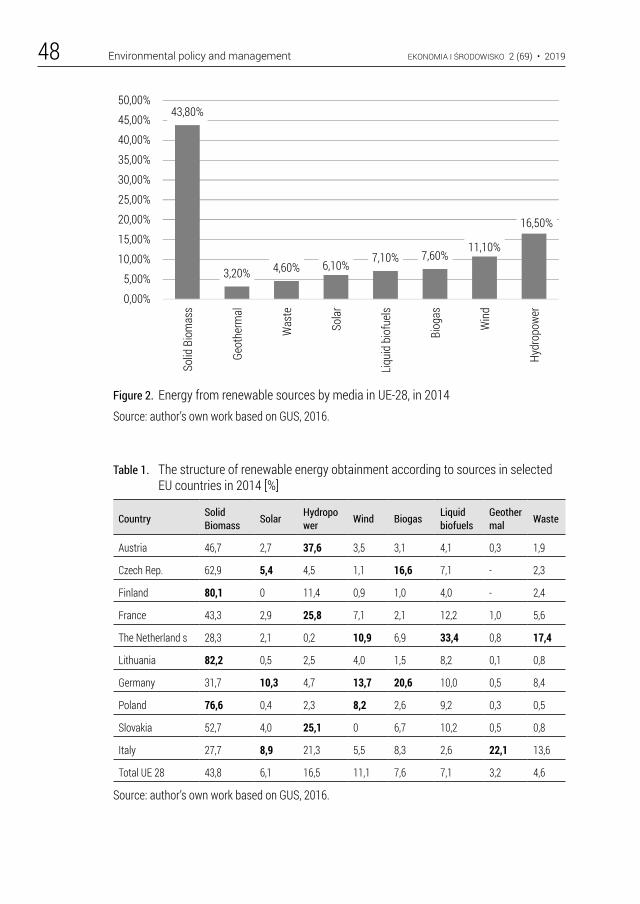
EKONOMIA I ŚRODOWISKO 2 (69) • 2019Environmental policy and management48
Figure 2. Energy from renewable sources by media in UE-28, in 2014Source: author’s own work based on GUS, 2016.
F2
43,80%
3,20% 4,60% 6,10%7,10% 7,60%
11,10%
16,50%
0,00%
5,00%
10,00%
15,00%
20,00%
25,00%
30,00%
35,00%
40,00%
45,00%
50,00%
Solid
Bio
mas
s
Geot
herm
al
Was
te
Sola
r
Liqui
d bi
ofue
ls
Biog
as
Win
d
Hydr
opow
er
Table 1. The structure of renewable energy obtainment according to sources in selected EU countries in 2014 [%]
Country SolidBiomass Solar Hydropo
wer Wind Biogas Liquid biofuels
Geother mal Waste
Austria 46,7 2,7 37,6 3,5 3,1 4,1 0,3 1,9
Czech Rep. 62,9 5,4 4,5 1,1 16,6 7,1 - 2,3
Finland 80,1 0 11,4 0,9 1,0 4,0 - 2,4
France 43,3 2,9 25,8 7,1 2,1 12,2 1,0 5,6
The Netherland s 28,3 2,1 0,2 10,9 6,9 33,4 0,8 17,4
Lithuania 82,2 0,5 2,5 4,0 1,5 8,2 0,1 0,8
Germany 31,7 10,3 4,7 13,7 20,6 10,0 0,5 8,4
Poland 76,6 0,4 2,3 8,2 2,6 9,2 0,3 0,5
Slovakia 52,7 4,0 25,1 0 6,7 10,2 0,5 0,8
Italy 27,7 8,9 21,3 5,5 8,3 2,6 22,1 13,6
Total UE 28 43,8 6,1 16,5 11,1 7,6 7,1 3,2 4,6
Source: author’s own work based on GUS, 2016.
EKONOMIA I ŚRODOWISKO 2 (69) • 2019 Environmental policy and management 49
The most important sources of renewable energy in the EU are solid bio-fuels. The basic solid biofuel is wood. A separate group consists of fuels from plantations intended for energy purposes and the organic residues from agri-culture and horticulture. Three countries with the highest share of solid bio-fuels in their renewable energy balance are Finland, Lithuania and Poland. These are the countries in which forest management and the wood industry play an important role. This solution is associated with many doubts related to the use of wood for heating purposes and threats to sustainable forest management (danger of excessive and abusive logging). Meanwhile, forest ecosystems perform a variety of services and their disporpotionate use leads to the loss of important social functions. Currently, many studies attempt to value the forest ecosystem in international, national, regional and local terms (Haefele, Kramer, Holmes, 1992; Krieger, 2001; Pearce, 2001; Slee, 2005; European Commission, 2008; Jellesmark et al., 2014; Figueroa, Pasten, 2015; Binner et al., 2017; Bösch et al., 2018). These developments address the problem of forest economic valuation from the economic appraisal of forest-sourced raw materials, through the assessment of values of individual eco-system services provided by forested areas, to more detailed analyses related to, e.g. a particular species or to the insurance value associated with the for-ests.
Thus, in the subject literature, it is possible to find analyses related to the forest value and its function for the society (e.g. research on European forest social values: Lindemann-Matthies et al., 2014; Torkar et al., 2014; Meyer, Schulz, 2017; Getzner, Meyerhoff, Schläpfer, 2018; Gomez, Olschewski, 2008). Admittedly, Directive 2009/28/EC of the European Parliament and of the Council of 23 April 2009 on the promotion of the use of energy from renew-able sources and amending and subsequently repealing Directive 2001/77/EC and 2003/30/EC as revised by Directive 2013/18 contains sustainability criteria for biofuels and bioliquids in that it excludes primary forests, pro-tected areas, and high biodiversity areas from use, but these regulations can be assessed as insufficient. In this context, objections may also be raised by possible import plans for this type of raw material from outside the EU (Rus-sian Federation, Ukraine) (Energy Roadmap, 2050).
Other sources of renewable energy in the EU are hydro and wind energy – 16.5% and 11.1%, respectively, in 2014, yet the source of energy which is worth devoting more attention to due to its high potential, is the energy com-ing from waste. This is particularly important in the context of global condi-tions related to waste management (reduction in the volume of import of waste through China from January 2018). Among the EU countries, one of the highest shares of energy from waste incineration is in the Netherlands.
EKONOMIA I ŚRODOWISKO 2 (69) • 2019Environmental policy and management50
The use of soft instruments in policy supporting RES
Increasingly, discerning the contribution of renewable energy in the structure of production and energy consumption in the EU has become a dif-ficult and very costly task. This because it requires the use of solutions sup-porting the increase of this share, which at the same time, lead to a reduction in the costs of producing renewable energy, and, as a consequence, improve its competitiveness. Hence, a review and classification of RES support instru-ments in the EU member states was carried out on the basis of an analysis of 28 reports on progress in the promotion and use of energy from renewable resources, from member countries to the European Commission for 2015. Here, soft instruments that shape the attitudes of energy consumers were particularly emphasized. In this analysis, the member countries were divided into three main groups:
1. Countries that prefer regulatory instruments – for example: the obli-gation to purchase specific amounts of energy from RES or to provide prior-ity in the provision of electricity transmission services from RES in the national power system, or the issuing of renewable energy certificates and regulation of access to transmission infrastructure.
2. Countries preferring indirect (economic and financial) instruments – for example: energy purchase support systems from RES such as guaran-teed price, green certificates and tenders, subsidies, preferential and low interest rates loans, fiscal support.
3. Countries expressing preferences for soft/ behavioural instruments – for example: campaigns raising the level of social awareness, offices, cen-tres, campaigns, portals, etc. providing information on renewable energy sources; trainings and courses; advice services; exhibitions and demonstra-tion projects; good practice guidance.
EU member states that prefer regulatory instruments include Italy, Bul-garia, Poland, Czech Republic, Romania, Spain, Luxembourg, Cyprus, Greece, Portugal, Germany and the Slovak Republic. Of note, Spain and Luxembourg are also characterized by providing a high level of support for soft instru-ments. Countries that prefer indirect instruments include the Netherlands, Slovenia, Sweden, Ireland, Denmark, Hungary, Latvia, Lithuania, Austria, Bel-gium, France, Croatia, Finland, the UK and Estonia. The Netherlands, Sweden, Ireland, Denmark, Austria, Belgium, France, Finland and Estonia also apply a high level of soft instruments. Malta is the sole member state that strongly emphasizes soft/behavioural instruments.
Pro-ecological attitudes are an indispensable element for the develop-ment and widespread use of renewable energy (GNESD, 2007; Sovacool, 2009; Devine-Wright, 2009; West et al., 2010). The failure to take soft instru-
EKONOMIA I ŚRODOWISKO 2 (69) • 2019 Environmental policy and management 51
ments into account in enhancing the acceptance of renewable energy can lead to social tensions and protests. A good example is Poland, where the use of soft instruments was neglected. According to research (Lorek, 2016; Ambi-ens, 2014; Krzemiński, 2016), currently, the most common reason for envi-ronmental protests and conflicts are investments related to renewable energy (biogas plants and wind farms are particularly controversial). In Ambiens’s report “Social conflicts in wind energy”, easily 90% of all entity-re-spondents who had invested in wind energy met with the problem of social conflict. The reason for this is that investors and local governments often start talking to the local community about construction only when the pro-test breaks out. A frequent way of proceeding during such consultations is to idealize such investments and to omit the related risks. This makes such transmission unbelievable. Residents protest because they are afraid of changes that they think will decrease public safety and negatively affect their life-style. Moreover, they lack reliable sources of information.
Conclusions
The policy of support for renewable energy sources in the EU has brought effects in the form of an increase in the level of their use, and thus the diver-sification of energy sources used in European countries. This situation is beneficial for implementing sustainable development. Nevertheless, there are many challenges to overcome. In some Member States, it is necessary to significantly accelerate efforts to increase the share of energy from renewa-ble sources in the total energy balance. Momentous challenges are also met with in developing new technologies in bringing down costs and enhancing availability to individual economies (for ex. ocean energy and concentrated solar power and secondary generation and biofuels). There is also a need to improve existing green power sources, such as by increasing the size of off-shore wind turbines and by improving photovoltaic panels. Storage technol-ogies remain a critical problem. Storage is currently often more expensive than additional transmission capacity, and Europe needs extra investment in this kind of infrastructure. In its development plan ending in the year 2050, the European Commission also attaches great importance to nuclear energy and the use of biomass – both of which may be rated as controversial (Energy roadmap to 2050).
In this regard, it is necessary to introduce an upper limit for the use of biomass to produce energy to a level that will allow its sustainable supply. The restrictions should cover both domestic and imported biomass, to ensure that the carbon footprint of the use of bioenergy in the EU is in line with the
EKONOMIA I ŚRODOWISKO 2 (69) • 2019Environmental policy and management52
principle of sustainable development. An issue worth rethinking is also the more rational use of limited wood resources and the abandonment of large-scale co-firing in conventional power plants. In order to create a coherent policy of sustainable development in the EU, a necessary action would be to enable better integration of energy policy in the field of bioenergy with other Community policies, e.g. to put in place a strategy for biodiversity protection.
In implementing the principles of sustainable development, it is of key importance to bring about the widest range of social participation and to fully engage local communities. Admittedly, on the basis of the analysis car-ried out, in recent years, the growing role of soft instruments has been noticed. In general, however, these instruments are still undervalued and should find a wider application. A lack of acceptance and low level of public involvement in the planned solutions means implementation ineffectiveness.
Literature
Ambiens (2014), Konflikty społeczne w energetyce wiatrowej, http://www.ambiens.pl/pliki/raport-konflikty-spoleczne-w-energetyce-wiatrowej-2014.pdf [12-02-2015]
Binner A. et al. (2017), Valuing the social and environmental contribution of wood-lands and trees in England, Scotland and Wales, Forestry Commission Research Report, Forestry Commission, Edinburgh
Bösch M. et al. (2018), Forest ecosystem services in rural areas of Germany: Insights from the national TEEB study, “Ecosystem Services” Vol. 31, p. 77-83
Costanza J.K. et al. (2015), Linking state-and-transition simulation and timber supply models for forest biomass production scenarios, AIMS Environmental Science, Vol. 2, p. 180-202
Costanza J.K. et al. (2017), Bioenergy production and forest landscape change in the south-eastern United States, “GCB Bioenergy” Vol. 9, p. 924-939, https://doi.org/10.1111/gcbb.12386
dena (German Energy Agency) and UNECE (2017), Status and perspectives for renew-able energy development in the UNECE region, http://www.unece.org [05-05-2019]
Devine-Wright P. (2009), Rethinking NIMBYism: The role of place attachment and place identity in explaining place-protective action, “Journal of Community & Applied Social Psychology” Vol. 19(6), p. 426-441
EEA (2016), Renewable energy in Europe 2016. Recent growth and knock-on effects, Report No. 4, Luxembourg
European Commission (2011), Energy Roadmap 2050, Communication from the Commission to the European Parliament, the Council, the European Economic and Social Committee and the Committee of the Regions, COM/2011/0885 final
European Commission (2008), Study on the Development and Marketing of Non-Mar-ket Forest Products and Services, DG AGRI, Study Contract No: 30-CE-0162979/00-21, Study report
EKONOMIA I ŚRODOWISKO 2 (69) • 2019 Environmental policy and management 53
European Union and IRENA (2018), Renewable Energy Prospects for the European Union, https://www.irena.org/ [05-05-2019]
European Commission (2018), Renewable energy directive, https://ec.europa.eu/energy/en/topics/renewable-energy/renewable-energy-directive [23-05-2018]
Eurostat, http://ec.europa.eu/eurostat [10-04-2018]Evans J.M. et al. (2013), Forestry Bioenergy in the Southeast United States: Implications
for Wildlife Habitat and Biodiversity, National Wildlife Federation, Merrifield, VAFigueroa E., Pasten, R. (2015), The economic value of forests in supplying local climate
regulation, “Australian Journal of Agricultural and Resource Economics” Vol. 59, p. 446-457
Firbank L. (2008), Assessing the ecological impacts of bioenergy projects, “BioEnergy Research” Vol. 1(1), p. 12-19
Getzner M., Meyerhoff J., Schläpfer F. (2018), Willingness to Pay for Nature Conserva-tion Policies in State-Owned Forests: An Austrian Case Study, “Forests” Vol. 9, 537, doi:10.3390/f9090537
GNESD (2007), Renewable Energy Technologies and Poverty Alleviation: Overcoming Barriers and Unlocking Potentials, Global Network on Energy for Sustainable Development (GNESD), Roskilde, Denmark
Gomez M.G., Olschewski R. (2008), Valuation of forest land uses in the coastal region of Spain and Portugal, “Allgemeine Forst und Jagdzeitung” Vol. 179, p. 219-225
GUS (2016), Energia ze źródeł odnawialnych w 2015 r., WarszawaHaefele M., Kramer R., Holmes T. (1992), Estimating the total economic value of forest
quality in high – elevation spruce-fir forests, in: C. Payne, J. Bowker, P. Reed (eds.), Economic Value of Wilderness, USDA Forest Service, Athens, Georgia, p. 91-96
IEA (International Energy Agency), https://www.iea.org/ [15-04-2018]IRENA (2019), A New World. The Geopolitics of the Energy Transformation, https://
www.irena.org/ [05-05-2019]Jellesmark Thorsen B. et al. (2014), The provision of forest ecosystem services: Quanti-
fying and valuing non-marketed ecosystem services, What Science Can Tell Us 5, Vol. 1, European Forest Institute
Jobert A., Laborgne P., Mimler S. (2007), Local acceptance of wind energy: Factors of success identified in French and German case studies, “Energy Policy” Vol. 35(5), p. 2751-2760
Krieger D.J. (2001), The economic value of forest ecosystem services: a review, The Wil-derness Society, Washington D.C.
Lindemann-Matthies P. et al. (2014), Attitudes toward forest diversity and forest eco-system services – a cross-cultural comparison between China and Switzerland, “Journal of Plant Ecology” No. 7(1), p. 1-9
Lorek A. (2016), Ocena relacji społecznych i środowiskowych między administracją samorządową a społecznością lokalną w wybranych województwach, „OPTIMUM Studia Ekonomiczne” No. 6(84), p. 111-122
Meyer M.A., Schulz C. (2017), Do ecosystem services provide an added value compared to existing forest planning approaches in Central Europe?, “Ecology and Society” Vol. 22(3), 6, https://doi.org/10.5751/ES-09372-220306
Millennium Ecosystem Assessment (2005), Ecosystems and human well-being: syn-thesis, Island Press, Washington D.C.
OECD/IEA (2017), Energy Policies of IEA Countries. France 2016 Review, International Energy Agency
EKONOMIA I ŚRODOWISKO 2 (69) • 2019Environmental policy and management54
Olesen A.S. et al. (2016), Environmental Implications of Increased Reliance of the EU on Biomass from the South East US, European Commission, Vol. 360, Brussels, Bel-gium
Pearce D.W. (2001), The economic value of forest ecosystems, “Ecosystem Health” Vol. 7, No. 4, p. 284-296
Renewable Energy Directive, Directive 2009/28/EC of the European Parliament and of the Council of 23 April 2009 on the promotion of the use of energy from renewable sources and amending and subsequently repealing Directive 2001/77/EC and 2003/30/EC as amended by Directive 2013/18
Reports on progress in the promotion and use of energy from renewable resources from member countries to European Commission for 2015:
Third Progress Report on the Promotion and Use of Energy from Renewable Sources for the United Kingdom, Article 22 of the Renewable Energy Directive, https://ec.europa.eu/energy/en/topics/renewable-energy/progress-reports [08-01-2018]
3rd Progress Report under Article 22 of directive 2009/28/ec. Two-year period: 2013-2014, Republic of Cyprus, Ministry of Energy, Commerce, Industry and Tourism, https://ec.europa.eu/energy/en/topics/renewable-energy/progress-reports [08-01-2018]
Third Progress Report on the Promotion and Use of Energy from Renewable Sources in Greece. Submitted under Article 22 of Directive 2009/28/EC, Ministry of Environ-ment and Energy, 2016, https://ec.europa.eu/energy/en/topics/renewable-en-ergy/progress-reports [08-01-2018]
Progress Report from the Republic of Estonia to the European Commission on the Pro-motion and Use of Energy from Renewable Sources, Ministry of Economic Affairs and Communications, 2016, https://ec.europa.eu/energy/en/topics/renewa-ble-energy/progress-reports [08-01-2018]
Third Progress Report (2013-2014) Submitted pursuant to Article 22 of Directive 2009/28/EC National Renewable Energy Action Plan (NREAP), Directorate-Gen-eral for Energy and Geology, Portugal, https://ec.europa.eu/energy/en/topics/renewable-energy/progress-reports [08-01-2018]
Progress report Energy from renewable sources in the Netherlands 2013–2014 Direc-tive 2009/28/EC commissioned by the Dutch Ministry of Economic Affairs, Dutch Ministry of Economic Affairs, 22/01/2016, https://ec.europa.eu/energy/en/topics/renewable-energy/progress-reports [08-01-2018]
Progress Report of the Republic of Lithuania on the promotion and use of renewable energy sources, 2015, https://ec.europa.eu/energy/en/topics/renewable-en-ergy/progress-reports [08-01-2018]
Danish report under Directive 2009/28/EC concerning progress in the use and promo-tion of energy from renewable sources, December 2015, https://ec.europa.eu/energy/en/topics/renewable-energy/progress-reports [08-01-2018]
Progress report under Article 22 of Directive 2009/28/EC on the promotion of the use of energy from renewable sources, Federal Republic of Germany, https://ec.europa.eu/energy/en/topics/renewable-energy/progress-reports [08-01-2018]
Report on progress in the promotion and use of energy from renewable sources in the Czech Republic under Art 22 of the European Parliament and Council Directive 2009/28/EC, on support for the use of energy from renewable sources (2013 and 2014), https://ec.europa.eu/energy/en/topics/renewable-energy/progress-re-ports [08-01-2018]
EKONOMIA I ŚRODOWISKO 2 (69) • 2019 Environmental policy and management 55
Report on the use of renewable energy sources in Hungary in 2013 and 2014 (Reporting by the Member States pursuant to Articles 18 and 22 of Directive 2009/28/EC), Ministry of National Development, Budapest May 2016, https://ec.europa.eu/energy/en/topics/renewable-energy/progress-reports [08-01-2018]
Third Progress Report Submitted under Article 22 of Directive 2009/28/EC December 2015, National Renewable Energy Action Plan (NREAP) Ireland, https://ec.eu-ropa.eu/energy/en/topics/renewable-energy/progress-reports [08-01-2018]
Information Report “The Third Regular Report of the Republic of Latvia pursuant to Article 22 of Directive 2009/28/EC of the European Parliament and of the Council of 23 April 2009 on the promotion of the use of energy from renewable sources and amending and subsequently repealing Directives 2001/77/EC and 2003/30/EC”, https://ec.europa.eu/energy/en/topics/renewable-energy/progress-reports [08-01-2018]
National Renewable Energy Action Plan. Austrian Progress Report 2015 within the scope of Directive 2009/28/EC, Federal Ministry of Science, Research and the Economy, Federal Ministry of Agriculture, Forestry, the Environment and Water Management, Austria 11/01/2016, https://ec.europa.eu/energy/en/topics/renewable-energy/progress-reports [08-01-2018]
The progress report of Romania with regard to promoting and using energy from renewable sources, in accordance with article 22 of directive 2009/28/EC, 05/01/2016, https://ec.europa.eu/energy/en/topics/renewable-energy/pro-gress-reports [08-01-2018]
Progress report on the promotion and use of energy from renewable sources. Third report Pursuant to Article 22 of Directive 2009/28/EC, Ministry of Ecology, Sus-tainable Development and Energy, France, December 2015, https://ec.europa.eu/energy/en/topics/renewable-energy/progress-reports [08-01-2018]
Report on progress in the promotion and use of renewable energy pursuant to article 22 of directive 2009/28/EC of the European Parliament and of the Council of 23 April 2009 on the promotion of the use of energy from renewable sources and amending and subsequently repealing directives. 2001/77/EC and 2003/30/EC (Text with EEA relevance), Republic of Croatia Ministry of the Economy, Zagreb, April 2016, https://ec.europa.eu/energy/en/topics/renewable-energy/progress-reports [08-01-2018]
Finland’s third progress report under article 22 of Directive 2009/28/EC, 5 February 2016, TEM/280/08.10.02/2016, 12 February 2016, https://ec.europa.eu/energy/en/topics/renewable-energy/progress-reports [08-01-2018]
Third Progress Report under Article 22 of Directive 2009/28/EC on the promotion of the use of energy from renewable sources, Grand Duchy of Luxembourg, https://ec.europa.eu/energy/en/topics/renewable-energy/progress-reports [08-01-2018]
Progress Report for Slovenia under Directive 2009/28/EC, Republic of Slovenia, Minis-try of Infrastructure, Energy Directorate Ljubljana, 29 December 2015, https://ec.europa.eu/energy/en/topics/renewable-energy/progress-reports [08-01-2018]
Italy’s Third Progress Report under Directive 2009/28/EC, December 2015, https://ec.europa.eu/energy/en/topics/renewable-energy/progress-reports [08-01-2018]
Sweden’s third progress report on the development of renewable energy pursuant to Article 22 of Directive 2009/28/EC, 22 December 2015, https://ec.europa.eu/energy/en/topics/renewable-energy/progress-reports [08-01-2018]
Third National Report on Bulgaria’s Progress in the Promotion and Use of Energy from Renewable Sources. Drafted in accordance with Article 22(1) of Directive 2009/28/EC on the promotion of the use of energy from renewable sources and in accordance
EKONOMIA I ŚRODOWISKO 2 (69) • 2019Environmental policy and management56
with the Template for Member State progress reports under Directive 2009/28/EC, Ministry of Energy, Republic of Bulgaria 2015, https://ec.europa.eu/energy/en/topics/renewable-energy/progress-reports [08-01-2018]
Interim Report on progress in the promotion and use of energy from renewable sources in Poland in 2013-2014 (drawn up pursuant to Article 127(2) of the Act on renew-able energy sources), Ministry of Energy, Warsaw, 2016, https://ec.europa.eu/energy/en/topics/renewable-energy/progress-reports [08-01-2018]
Report on progress in the promotion and use of energy from renewable sources as established in article 22 of the Directive. 2009/28/EC, Spain (2013 and 2014), https://ec.europa.eu/energy/en/topics/renewable-energy/progress-reports [08-01-2018]
Progress report under article 22 of Directive 2009/28/EC on the promotion of the use of energy from renewable sources, Ministry for Energy and Health, Malta, Decem-ber 2015, https://ec.europa.eu/energy/en/topics/renewable-energy/progress-reports [08-01-2018]
Progress Report Belgium 2013-2014, National compilation 17/12/2015 Report drawn up pursuant to Article 22 of Directive 2009/28/EC of the European Parliament and of the Council of 23 April 2009 on the promotion of the use of energy from renew-able sources and amending and subsequently repealing Directives 2001/77/EC and 2003/30/EC and Article 3(3) of Directive 2001/77 of the European Parliament and of the Council of 27 September 2001 on the promotion of electricity produced from renewable energy sources in the internal electricity market, National/Regional Energy Consultation Group (Energie-overleggroep Staat-Gewesten – CONCERE-ENOVER) 2015, https://ec.europa.eu/energy/en/topics/renewable-energy/progress-reports [08-01-2018]
Report on progress in the promotion and use of energy from renewable sources (in accordance with Article 22 of Directive 2009/28/EC), Ministry of the Economy Slovak Republic, Bratislava 2015, https://ec.europa.eu/energy/en/topics/renewable-energy/progress-reports [08-01-2018]
Richter B.D. et al. (2010), Lost in development’s shadow: The downstream human con-sequences of dams, “Water Alternatives” Vol. 3(2), p. 14-42
Sathaye J. et al. (2011), Renewable Energy in the Context of Sustainable Development, in: O. Edenhofer et al. (eds.), IPCC Special Report on Renewable Energy Sources and Climate Change Mitigation, Cambridge University Press, Cambridge, United Kingdom and New York
Secretariat of the Convention on Biological Diversity (2010), Global Biodiversity Out-look 3, Montreal
Slee B. (2005), Socio-economic values of natural forests, “Forest Snow and Landscape Research” Vol. 79(1), p. 157-167
Sovacool B.K. (2009), The cultural barriers to renewable energy and energy efficiency in the United States, “Technology in Society” Vol. 31(4), p. 365-373
Tarr N.M., Rubino M.J., Costanza J.K. (2016), Projected gains and losses of wildlife hab-itat from bioenergy-induced landscape change, “GCB Bioenergy” Vol. 9, p. 1-15
Torkar G., Verlič A., Vilhar U. (2014), Importance of Forest Ecosystem Services to Sec-ondary School Students:a Case from the North-West Slovenia, South-East Eur For 5 (1): (early view), DOI: http://dx.doi.org/10.15177
UNECE (2015), Renewable Energy. A Crucial Role in the Future Energy Mix, United Nations, Geneva, http://www.unece.org [05-05-2019]
EKONOMIA I ŚRODOWISKO 2 (69) • 2019 Environmental policy and management 57
Upreti B.R. (2004), Conflict over biomass energy development in the United Kingdom: some observations and lessons from England and Wales, “Energy Policy” Vol. 32(6), p. 785-800
West J., Bailey I., Winter M. (2010), Renewable energy policy and public perceptions of renewable energy: A cultural theory approach, “Energy Policy” Vol. 38(10), p. 5739-5748
Wolsink, M. (2010), Near-shore wind power – Protected seascapes, environmentalists’ attitudes, and the technocratic planning perspective, “Land Use Policy” Vol. 27(2), p. 195-203
World Commission on Dams (2000), Dams and Development – A New Framework for Decision-Making, Earthscan Publications Ltd, London, UK and Sterling
Wüstenhagen R., Wolsink M., Bürer M. (2007), Social acceptance of renewable energy innovation: An introduction to the concept, “Energy Policy” Vol. 35(5), p. 2683-2691
WWF, Global Footprint Network (2012), Living Planet Report 2012: Biodiversity, bio-capacity and better choices, Gland, Switzerland
EKONOMIA I ŚRODOWISKO • 2 (69) • 2019
ECONOMIC DEVELOPMENT OF EUROPEAN UNION COUNTRIES AND IMPLEMENTATION OF THE CLIMATE AND ENERGY PACKAGE
ABSTRACT: Economic development, being the primary objective of most nations, undoubtedly favours industrial production over environmental concerns. In an effort to balance the gains and losses result-ing from industrial growth across the EU, regulations were imposed with regard to renewable energy sources, greenhouse gas emissions (GHG) and energy efficiency. The paper seeks to determine whether, and to what extent, economic growth is accompanied by commitment towards environment and climate protection on the part of the EU countries. To answer this question basic indicators were analyzed with the use of statistical measures and trend analysis. Diagnostic variables were standard-ized by the zero unitarization method. Finally, a classification of EU member states was constructed. It revealed that in both study years Austria, Denmark, Luxemburg and Sweden were the most econom-ically and ecologically sustainable countries, joined by Ireland in 2016. Bulgaria, Estonia and Slovakia fell at the other end of the spectrum.
KEY WORDS: economic growth, climate and energy package
Grażyna Karmowska, PhD (ORCID: 0000-0002-2264-3176) – West Pomeranian University of Technology in Szczecin
Correspondence address:Janickiego Street 31, 71-270, Szczecin, Polande-mail: [email protected]
Grażyna KARMOWSKA
JEL: O11, Q2, C22No. 2(69) 2019 • pages: 58-75 https://doi.org/10.34659/2019/2/21
EKONOMIA I ŚRODOWISKO 2 (69) • 2019 Environmental policy and management 59
Introduction
European Union sets stringent targets for its member states with regard to reduction of carbon dioxide emissions. The goals set for 2020 and later, for 2050, are a chance for advancing new technologies, but at the same time they constitute a threat in the form of barriers to economic growth. These objec-tives firmly encourage the use of renewable energy and lie at the core of the energy policy of the EU (Directive 2003/87/EC).
Energy policy is closely tied to economic growth. Today’s economies con-sume increasingly larger amounts of energy coming from both renewable and non-renewable sources. Since energy consumption hugely affects the climate, European Union pursues mitigation targets pertaining to climate protection, energy efficiency and use of renewable energy sources. The EU’s fundamental document in this respect is the Climate and Energy Package adopted in 2008. It identified three main targets: reduction of GHG emis-sions, promotion of the use of energy from renewable sources and improve-ment in energy efficiency of the EU countries (so called 20-20-20 targets). This means that member states are obliged to:• reduce CO2 emissions (by 20% in 2020 in comparison to 1990),• increase the use of renewable energy (by 20% in 2020 in the EU, by 15%
in Poland),• improve energy efficiency (in 2020 by 20% in comparison to 2005)
(Directive 2009/28).The paper aims to analyze cross-country differences in environmental
concern across the EU and changes taking place in this respect. Therefore answers were sought to the following questions:• Are the targets realized to a sufficient degree?• Do integration processes promote lessening of differences with regard to
better environment protection and increased use of renewable energy across the EU?
• Does economic growth spur environmental quality and activities?To address these questions, the ongoing changes were analyzed by trend
analysis, and the forecast for the key indicators was made. Finally, a ranking of EU countries for the study years was made, based on adopted diagnostic features and with the use of zero unitarization method.
EKONOMIA I ŚRODOWISKO 2 (69) • 2019Environmental policy and management60
Overview of literature
Analysis of a country’s economic development based on GDP only is not very reliable as it overlooks the human factor and other factors affecting the kind and scale of changes. Many authors and researchers explore the contro-versial issue of measuring development. Some researchers rely only on syn-thetic measures based on GDP (Piotrowski, 2015; Makrosińska, 2011), whereas others, seeking more reliable proxy measures, apply diagnostic var-iables to describe socio-economic changes (Tendera-Właszczuk, 2016; Bąba, 2016; Majewski, 2017).
Development of indices based on taxonomic methods initiated Becker-man and Bacon. They proposed the Net Economic Prosperity Index and they accepted the United States as a model (Beckerman, Bacon, 1966).
An important synthetic development indicator is the Social Development Index (HDI). It combines the economic sphere with the qualitative aspects of development.
Governments of all countries try to ensure that economic growth acts as a driving force for further economic development, the imperative of which prioritizes production over environment protection. Efforts to balance losses and gains resulting from economic activities and create ecologically sustain-able societies took shape in the form of green politics and such theories as Green Political Theory or environmentalism (Piotrowska, 2008).
The Environment Endangerment Index (EEI) was proposed, which was based on the degree of afforestation of the country, the percentage of plants and animals threatened with extinction and the emission of greenhouse gases. Ramanathan, by adjusting the standard HDI by the EEI value, received Environment Sensitive HDI (Neumayer, 2004).
A country’s economic development should translate into welfare of its citizens. To achieve this goal it is necessary that the country uses its natural resources. In today’s world the natural environment is exploited, sometimes excessively, and therefore another key target is set by each country – to min-imize resource consumption in order to preserve resources for future gener-ations. The theory of sustainable development is one of such attempts seek-ing to harmonize these two goals (Dobrzański, 2011).
The main goal of sustainable development is to improve the quality of life through increasing welfare for the sake of present and future generations. This goal can be achieved by creating sustainable societies that know how to use natural resources efficiently and wisely, and how to benefit from social-ecological innovation. A sustainable society can ensure welfare of the people, environment protection and social cohesion. Environmental wellness is a prerequisite for people’s general welfare and wellbeing. And again, to
EKONOMIA I ŚRODOWISKO 2 (69) • 2019 Environmental policy and management 61
fulfill the mission of societal and environmental welfare, economic wellbeing is necessary, which, however, is not a goal in itself (Gechey, 2005; Kerk, 2016; Karmowska, 2017).
The system approach to sustainable development is illustrated by the Venn diagram, which presents sustainable development as the point of inter-section of the goals assigned to the three connected systems: environmental (or ecological), economic and social. It shows that an attempt to maximize the goals of only one system does not ensure balance because it does not take into account the impact of other systems. Sustainable development can only be achieved by balancing the tradeoffs among the various goals of the three systems (Barbier, Burgess, 2017).
Sustainable economic development of the EU countries is a subject of many academic studies. For the purposes of such analyses various indicators are constructed that take into account, inter alia, Environmental Wellbeing (Sustainable Society Index, SSI), environmental performance (Environmen-tal Performance Index, EPI) or eco-innovation performance (Eco-Innovation Scoreboard) (Karmowska, Czaja, Jach-Chrzaszcz, 2018). Overview of Indices of Sustainability or Societal Progress shown in technical report by Saisana and Philippas. This report addresses the need to go beyond GDP to assess social progress. Key results on the world landscape of societies’ achievements confirmed the inverted shaped relationship between Economic and Environ-mental Wellbeing. The Environmental Wellbeing had a strong and negative correlation to the Human Wellbeing and to the Economic Wellbeing. Only in a few countries, Human and Economic well-being go hand in hand, but often at the expense of environmental well-being (Saisana, Philippas, 2012).
Rational use of renewable energy harvested from wind, sunlight, geo-thermal sources, river gradients, biomass and landfill biogas is one of the crucial elements of sustainable development which bring about quantifiable ecological and energy effects. Increased share of renewable energy in the overall global fuel-energy balance contributes to improved efficiency in the use and management of natural resources, and plays an important role in improving the condition of the environment through reduced air and water pollution and reduced waste production.
To determine energy intensity of individual countries and regions the GDP indicator is used (energy intensity of GDP as index of energy conserva-tion). Yet, one should bear in mind that energy intensity of GDP is not an ideal measure even when the Purchasing Power Parity (PPP) is taken into account. However, energy intensity of GDP is not the only available measure of energy intensity in inter-country comparisons (Efektywność…, 2017). Energy inten-sity of GDP can be to contain the two concepts of Energy efficiency on the production system and efficiency on lifestyle. However, their directional
EKONOMIA I ŚRODOWISKO 2 (69) • 2019Environmental policy and management62
characters are not necessarily the same. Manufacturing productivity in eco-nomically developing counties is generally inefficient while their living standard is lower and energy consumption is smaller. It is impossible to accu-rately evaluate how advanced a country’s energy conservation is and meas-ure it against that of other countries, which are different not only in terms of their economies and welfare level but also in natural social conditions. How-ever, numerical evaluation or energy conservation levels or potential energy conservation levels for any country is of interest for international politics surrounding environmental problems and energy conservation policies (Suehiro, 2007).
Research methods
The paper seeks to determine whether, and to what extent, economic growth is accompanied by commitment towards environment and climate protection on the part of the EU countries. To answer this question basic indi-cators were analyzed with the use of statistical measures and trend analysis. Diagnostic variables were standardized by the zero unitarization method. Finally, a classification of EU member states was constructed.
The paper made use of statistical data from the World Bank, Eurostat and the Sustainable Society Foundation. The research covered 28 EU member states (as of 2017) over the 2008-2017 period. Research questions were ana-lyzed from the static and dynamic perspective.
To find answers to the research questions posed, the following indicators were used:• Gross Domestic Product (GDP),• Human Development Index (HDI),• Environmental Wellbeing (EnvW),• Renewable Energy (RES) in overall gross energy consumption,• Energy Intensity of GDP (MJ/GDP) Greenhouse Gas Emission (GHG).
The indicators served as basis for analysis, evaluation of trends, develop-ment of forecasts and ranking of countries.
GDP was adopted as a basic measure of economic development. Although GDP is not a perfect measure of economic changes, it still remains the pri-mary measure of development, in particular when GDP per capita is applied.
The HDI index contains more information about socio-economic devel-opment as along with GDP, as it also measures other dimensions of human development, such as life expectancy and education.
Another indicator, that is Environmental Wellbeing, is concerned with two dimensions: Natural resources and Climate and energy. The latter takes into account energy consumption, energy conservation, greenhouse gases
EKONOMIA I ŚRODOWISKO 2 (69) • 2019 Environmental policy and management 63
and renewable energy. Each wellbeing dimension is evaluated separately on a 10 point numeric scale (from 0 to 10), where 10 stands for highest level of sustainability. To each variable the same weights were attributed. Geometric mean of all variables within one category and one wellbeing dimension allows for an overall evaluation of wellbeing sustainability and ranking of countries.
The share of renewable energy in final gross energy consumption is yet another variable, and one that is important in the light of the targets set in the Climate and Energy Package.
To determine energy efficiency the indicator of energy intensity of GDP was applied. Energy intensity level of primary energy is the ratio between energy supply and gross domestic product measured at purchasing power parity (PPP). It is an indication of how much energy is used to produce one unit of economic output. Lower ratio indicates that less energy is consumed to produce one unit of output.
Waste generation, including non-renewable waste, continues to increase in line with economic growth. This means that the better we manage waste, the better it is for the environment. Unfortunately, due to incomplete data, the variable measuring non-renewable waste use could not be included in the analysis.
Finally, the last variable considered was the Greenhouse Gases Emission (GHG). Although they are present in small concentrations, they are potent gases that trap heat effectively, making them high “global warming potential” gases. Varied inventory of greenhouse gases worldwide and their increasing concentration can lead to rapid temperature rise. Therefore firm action was taken to commit state parties to reduce greenhouse gas emissions (United Nations Framework Convention on Climate Change – Rio de Janeiro, 1992; Kyoto Protocol, 1997; Wysokińska, 2016).
Basic statistical values were calculated for the aforementioned variables, as well as trend function for extreme (minimum and maximum) and average value parameters. Evaluated functions were pursued only if the value of determination coefficient was high and the structural parameters were sig-nificant. In case a linear trend was observed, a regression coefficient was interpreted as a measure of dynamics of medium-term increases/declines. Moreover, forecasts were made for individual EU countries to check to what extent the Climate and Exchange Package targets will be achieved in 2020 (Nowak, 2002; Kukuła, 2003).
Artificial variables were computed for selected indicators, which helped in the grouping of countries and making a ranking. Variables were standard-ized using the method of zero unitarization (Nowak, 1990; Kukuła, 2000). The method is a transformation of diagnostic variables of different weights
EKONOMIA I ŚRODOWISKO 2 (69) • 2019Environmental policy and management64
that brings their values to the state of comparability since after the method is applied, variables have no weights. Hence, the method allows for multicrite-ria evaluation of objects and their comparison with regard to a selected com-plex phenomenon.
Standardized variables zij were computed according to the formula for stimulants (formula 1):
(1)
and for destimulants (formula 2):
(2)
Subsequently, synthetic variables qi,, their mean values and deviations were calculated (formulas 3):
(3)
Countries were clustered with the use of synthetic aggregate measure (qi):
Group Class interval Development level
I )(qSqqi +≥ high
II ))(, qSqqqi +∈ above average
III )qqSqqi ),(−∈ below average
IV )(qSqqi −< low
The higher the group, the higher is the level of development of a given country in comparison to EU mean.
Application of synthetic measures that capture many developmental aspects is an alternative source of information for partial measures. The use of partial measures only can limit the overall evaluation of development,
,minmax;
minmax
minijiiji
ijiiji
ijiij
ij xxxx
xxz ≠
−
−=
(1)
'minmax;minmax
maxijiiji
ijiiji
ijijiij xx
xx
xxz ≠
−
−=
(2)
5,0
2
11)(1)(;1;1
−===
==
qqr
qSqr
qzs
q i
r
ii
s
jiji
(3)
,minmax;
minmax
minijiiji
ijiiji
ijiij
ij xxxx
xxz ≠
−
−=
(1)
'minmax;minmax
maxijiiji
ijiiji
ijijiij xx
xx
xxz ≠
−
−=
(2)
5,0
2
11)(1)(;1;1
−===
==
qqr
qSqr
qzs
q i
r
ii
s
jiji
(3)
,minmax;
minmax
minijiiji
ijiiji
ijiij
ij xxxx
xxz ≠
−
−=
(1)
'minmax;minmax
maxijiiji
ijiiji
ijijiij xx
xx
xxz ≠
−
−=
(2)
5,0
2
11)(1)(;1;1
−===
==
qqr
qSqr
qzs
q i
r
ii
s
jiji
(3)
.
.
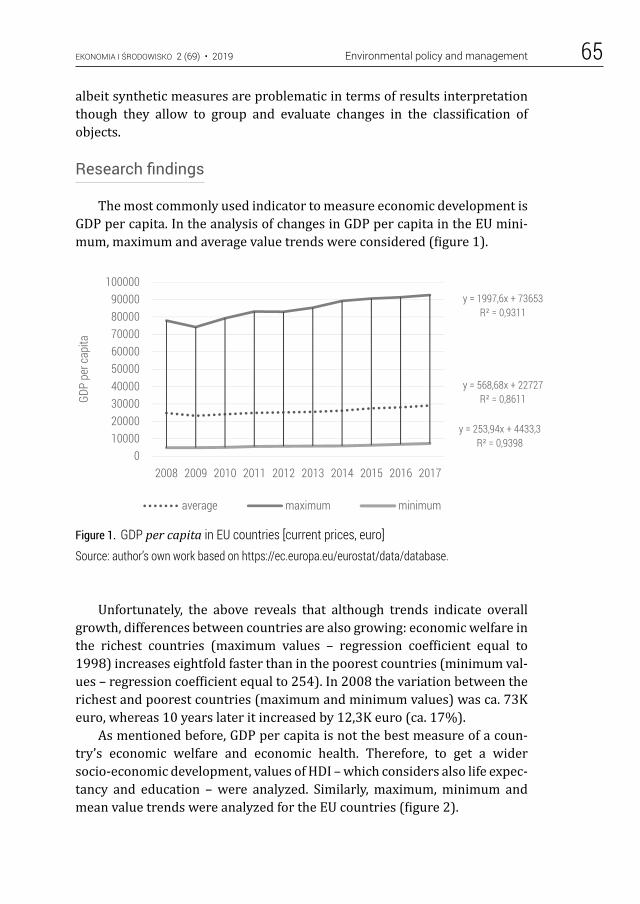
EKONOMIA I ŚRODOWISKO 2 (69) • 2019 Environmental policy and management 65
albeit synthetic measures are problematic in terms of results interpretation though they allow to group and evaluate changes in the classification of objects.
Research findings
The most commonly used indicator to measure economic development is GDP per capita. In the analysis of changes in GDP per capita in the EU mini-mum, maximum and average value trends were considered (figure 1).
Figure 1. GDP per capita in EU countries [current prices, euro]Source: author’s own work based on https://ec.europa.eu/eurostat/data/database.
Unfortunately, the above reveals that although trends indicate overall growth, differences between countries are also growing: economic welfare in the richest countries (maximum values – regression coefficient equal to 1998) increases eightfold faster than in the poorest countries (minimum val-ues – regression coefficient equal to 254). In 2008 the variation between the richest and poorest countries (maximum and minimum values) was ca. 73K euro, whereas 10 years later it increased by 12,3K euro (ca. 17%).
As mentioned before, GDP per capita is not the best measure of a coun-try’s economic welfare and economic health. Therefore, to get a wider socio-economic development, values of HDI – which considers also life expec-tancy and education – were analyzed. Similarly, maximum, minimum and mean value trends were analyzed for the EU countries (figure 2).
F1
010 00020 00030 00040 00050 00060 00070 00080 00090 000
100 000
2008 2009 2010 2011 2012 2013 2014 2015 2016 2017
GDP
per c
apita
year
average maximum minimum
y = 568,68x + 22727R² = 0,8611
y = 1997,6x + 73653R² = 0,9311
y = 253,94x + 4433,3R² = 0,9398
0100002000030000400005000060000700008000090000
100000
2008 2009 2010 2011 2012 2013 2014 2015 2016 2017
GDP
per c
apita
average maximum minimum
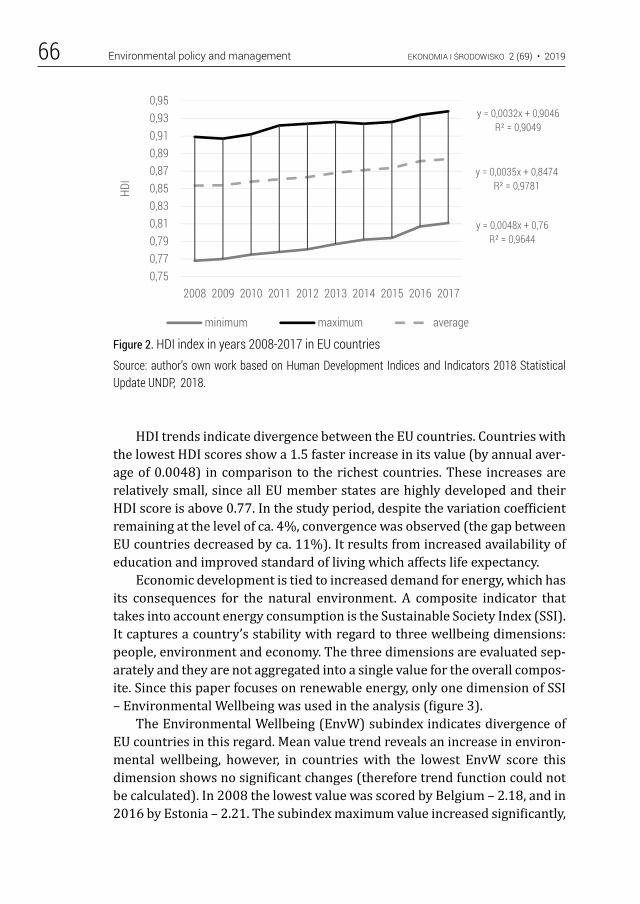
EKONOMIA I ŚRODOWISKO 2 (69) • 2019Environmental policy and management66
Figure 2. HDI index in years 2008-2017 in EU countriesSource: author’s own work based on Human Development Indices and Indicators 2018 Statistical Update UNDP, 2018.
HDI trends indicate divergence between the EU countries. Countries with the lowest HDI scores show a 1.5 faster increase in its value (by annual aver-age of 0.0048) in comparison to the richest countries. These increases are relatively small, since all EU member states are highly developed and their HDI score is above 0.77. In the study period, despite the variation coefficient remaining at the level of ca. 4%, convergence was observed (the gap between EU countries decreased by ca. 11%). It results from increased availability of education and improved standard of living which affects life expectancy.
Economic development is tied to increased demand for energy, which has its consequences for the natural environment. A composite indicator that takes into account energy consumption is the Sustainable Society Index (SSI). It captures a country’s stability with regard to three wellbeing dimensions: people, environment and economy. The three dimensions are evaluated sep-arately and they are not aggregated into a single value for the overall compos-ite. Since this paper focuses on renewable energy, only one dimension of SSI – Environmental Wellbeing was used in the analysis (figure 3).
The Environmental Wellbeing (EnvW) subindex indicates divergence of EU countries in this regard. Mean value trend reveals an increase in environ-mental wellbeing, however, in countries with the lowest EnvW score this dimension shows no significant changes (therefore trend function could not be calculated). In 2008 the lowest value was scored by Belgium – 2.18, and in 2016 by Estonia – 2.21. The subindex maximum value increased significantly,
F2
0,75000,77000,79000,81000,83000,85000,87000,89000,91000,93000,9500
2008 2009 2010 2011 2012 2013 2014 2015 2016 2017
HDI
minimum maximum average
y = 0,0048x + 0,76R² = 0,9644
y = 0,0032x + 0,9046R² = 0,9049
y = 0,0035x + 0,8474R² = 0,9781
0,750,770,790,810,830,850,870,890,910,930,95
2008 2009 2010 2011 2012 2013 2014 2015 2016 2017
HDI
minimum maximum average
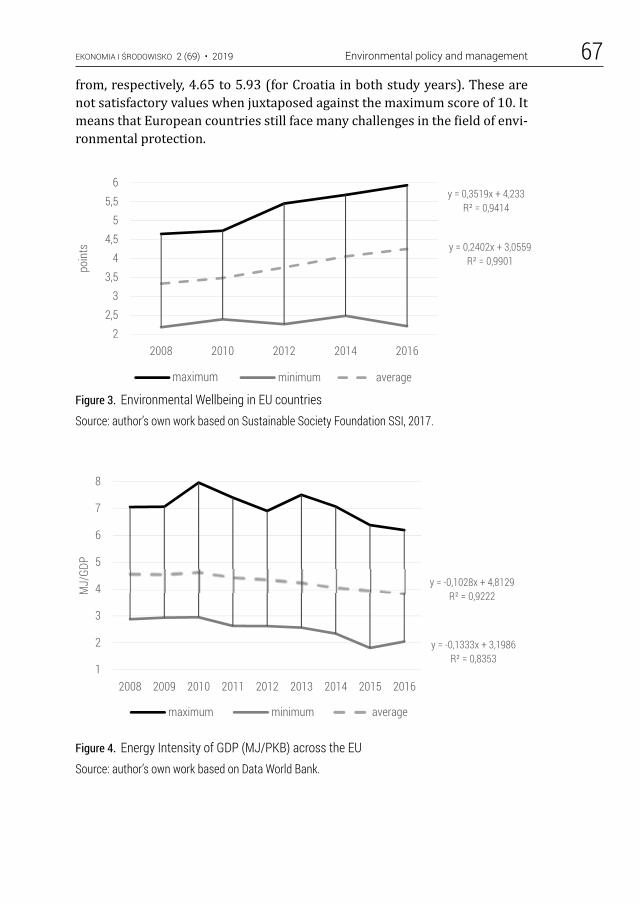
EKONOMIA I ŚRODOWISKO 2 (69) • 2019 Environmental policy and management 67from, respectively, 4.65 to 5.93 (for Croatia in both study years). These are not satisfactory values when juxtaposed against the maximum score of 10. It means that European countries still face many challenges in the field of envi-ronmental protection.
Figure 3. Environmental Wellbeing in EU countriesSource: author’s own work based on Sustainable Society Foundation SSI, 2017.
Figure 4. Energy Intensity of GDP (MJ/PKB) across the EUSource: author’s own work based on Data World Bank.
F3
2,002,503,003,504,004,505,005,506,00
2008 2010 2012 2014 2016
poin
tsmaksimum minimum average
y = 0,3519x + 4,233R² = 0,9414
y = 0,2402x + 3,0559R² = 0,9901
22,5
33,5
44,5
55,5
6
2008 2010 2012 2014 2016
poin
ts
maksimum minimum average
F4
1,00
2,00
3,00
4,00
5,00
6,00
7,00
8,00
2008 2009 2010 2011 2012 2013 2014 2015 2016
MJ/
GDP
maximum minimum average
y = -0,1333x + 3,1986R² = 0,8353
y = -0,1028x + 4,8129R² = 0,9222
1
2
3
4
5
6
7
8
2008 2009 2010 2011 2012 2013 2014 2015 2016
MJ/
GDP
maximum minimum average
maximum
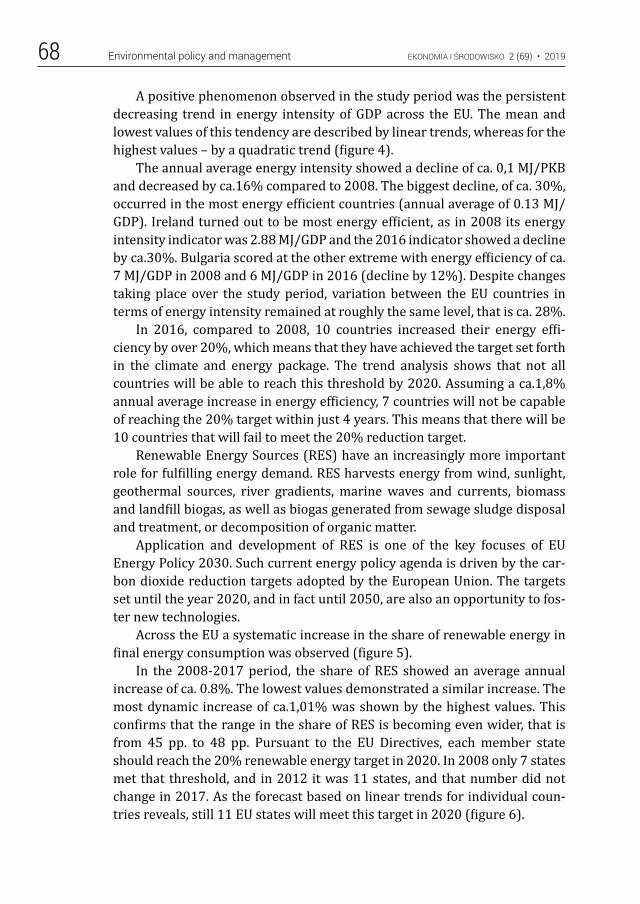
EKONOMIA I ŚRODOWISKO 2 (69) • 2019Environmental policy and management68
A positive phenomenon observed in the study period was the persistent decreasing trend in energy intensity of GDP across the EU. The mean and lowest values of this tendency are described by linear trends, whereas for the highest values – by a quadratic trend (figure 4).
The annual average energy intensity showed a decline of ca. 0,1 MJ/PKB and decreased by ca.16% compared to 2008. The biggest decline, of ca. 30%, occurred in the most energy efficient countries (annual average of 0.13 MJ/GDP). Ireland turned out to be most energy efficient, as in 2008 its energy intensity indicator was 2.88 MJ/GDP and the 2016 indicator showed a decline by ca.30%. Bulgaria scored at the other extreme with energy efficiency of ca. 7 MJ/GDP in 2008 and 6 MJ/GDP in 2016 (decline by 12%). Despite changes taking place over the study period, variation between the EU countries in terms of energy intensity remained at roughly the same level, that is ca. 28%.
In 2016, compared to 2008, 10 countries increased their energy effi-ciency by over 20%, which means that they have achieved the target set forth in the climate and energy package. The trend analysis shows that not all countries will be able to reach this threshold by 2020. Assuming a ca.1,8% annual average increase in energy efficiency, 7 countries will not be capable of reaching the 20% target within just 4 years. This means that there will be 10 countries that will fail to meet the 20% reduction target.
Renewable Energy Sources (RES) have an increasingly more important role for fulfilling energy demand. RES harvests energy from wind, sunlight, geothermal sources, river gradients, marine waves and currents, biomass and landfill biogas, as well as biogas generated from sewage sludge disposal and treatment, or decomposition of organic matter.
Application and development of RES is one of the key focuses of EU Energy Policy 2030. Such current energy policy agenda is driven by the car-bon dioxide reduction targets adopted by the European Union. The targets set until the year 2020, and in fact until 2050, are also an opportunity to fos-ter new technologies.
Across the EU a systematic increase in the share of renewable energy in final energy consumption was observed (figure 5).
In the 2008-2017 period, the share of RES showed an average annual increase of ca. 0.8%. The lowest values demonstrated a similar increase. The most dynamic increase of ca.1,01% was shown by the highest values. This confirms that the range in the share of RES is becoming even wider, that is from 45 pp. to 48 pp. Pursuant to the EU Directives, each member state should reach the 20% renewable energy target in 2020. In 2008 only 7 states met that threshold, and in 2012 it was 11 states, and that number did not change in 2017. As the forecast based on linear trends for individual coun-tries reveals, still 11 EU states will meet this target in 2020 (figure 6).
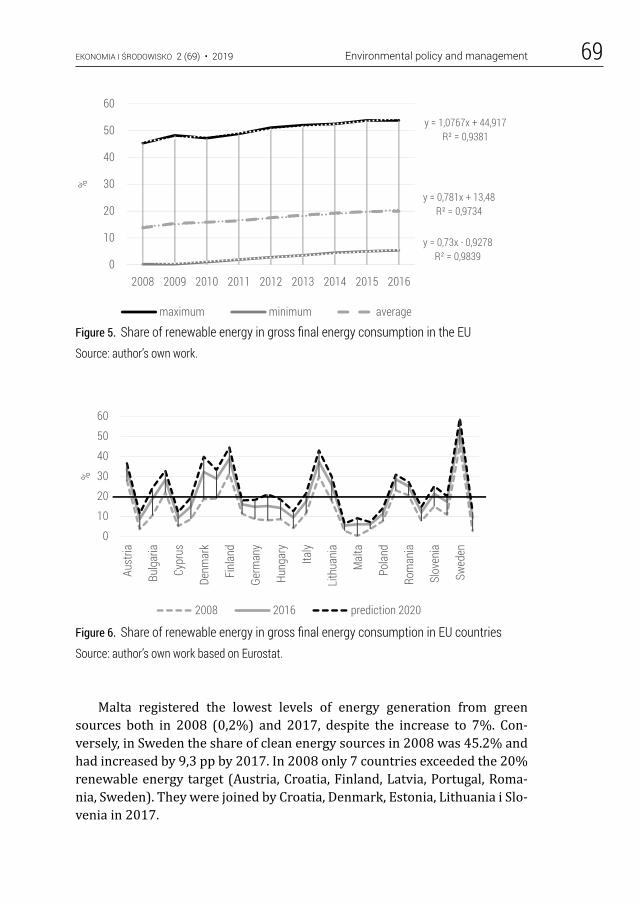
EKONOMIA I ŚRODOWISKO 2 (69) • 2019 Environmental policy and management 69
Figure 5. Share of renewable energy in gross final energy consumption in the EUSource: author’s own work.
Figure 6. Share of renewable energy in gross final energy consumption in EU countriesSource: author’s own work based on Eurostat.
Malta registered the lowest levels of energy generation from green sources both in 2008 (0,2%) and 2017, despite the increase to 7%. Con-versely, in Sweden the share of clean energy sources in 2008 was 45.2% and had increased by 9,3 pp by 2017. In 2008 only 7 countries exceeded the 20% renewable energy target (Austria, Croatia, Finland, Latvia, Portugal, Roma-nia, Sweden). They were joined by Croatia, Denmark, Estonia, Lithuania i Slo-venia in 2017.
F6
0102030405060
Aust
ria
Bulg
aria
Cypr
us
Denm
ark
Finl
and
Germ
any
Hung
ary
Italy
Lithu
ania
Mal
ta
Pola
nd
Rom
ania
Slov
enia
Swed
en
%
2008 2017 2020
0
10
20
30
40
50
60
Aust
ria
Bulg
aria
Cypr
us
Denm
ark
Finl
and
Germ
any
Hung
ary
Italy
Lithu
ania
Malt
a
Pola
nd
Rom
ania
Slov
enia
Swed
en
%
2008 2016 prediction 2020
F5
0,00
10,00
20,00
30,00
40,00
50,00
60,00
2008 2009 2010 2011 2012 2013 2014 2015 2016 2017
%
minimum maximum average
y = 1,0767x + 44,917R² = 0,9381
y = 0,73x - 0,9278R² = 0,9839
y = 0,781x + 13,48R² = 0,9734
0
10
20
30
40
50
60
2008 2009 2010 2011 2012 2013 2014 2015 2016
%
maximum minimum average
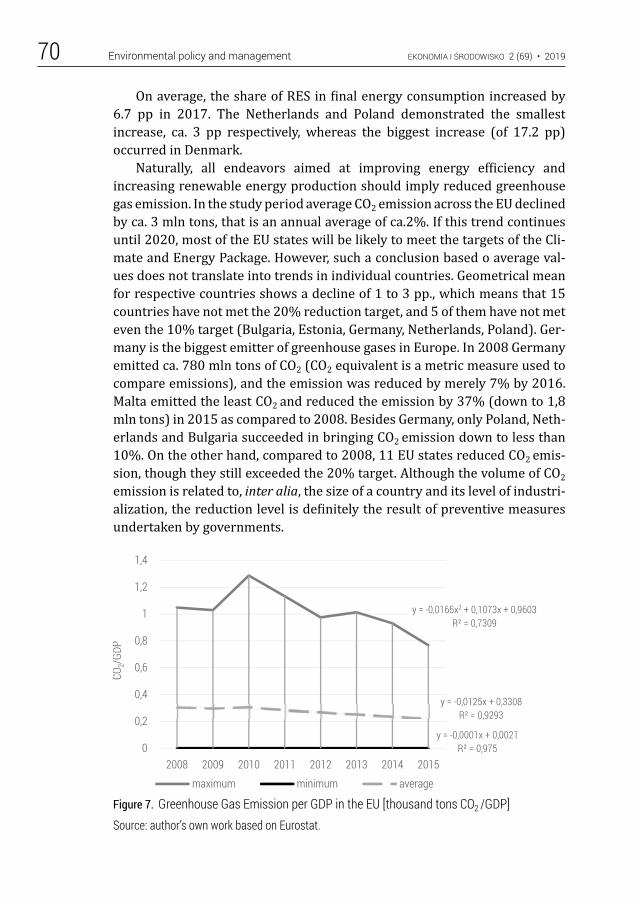
EKONOMIA I ŚRODOWISKO 2 (69) • 2019Environmental policy and management70
On average, the share of RES in final energy consumption increased by 6.7 pp in 2017. The Netherlands and Poland demonstrated the smallest increase, ca. 3 pp respectively, whereas the biggest increase (of 17.2 pp) occurred in Denmark.
Naturally, all endeavors aimed at improving energy efficiency and increasing renewable energy production should imply reduced greenhouse gas emission. In the study period average CO2 emission across the EU declined by ca. 3 mln tons, that is an annual average of ca.2%. If this trend continues until 2020, most of the EU states will be likely to meet the targets of the Cli-mate and Energy Package. However, such a conclusion based o average val-ues does not translate into trends in individual countries. Geometrical mean for respective countries shows a decline of 1 to 3 pp., which means that 15 countries have not met the 20% reduction target, and 5 of them have not met even the 10% target (Bulgaria, Estonia, Germany, Netherlands, Poland). Ger-many is the biggest emitter of greenhouse gases in Europe. In 2008 Germany emitted ca. 780 mln tons of CO2 (CO2 equivalent is a metric measure used to compare emissions), and the emission was reduced by merely 7% by 2016. Malta emitted the least CO2 and reduced the emission by 37% (down to 1,8 mln tons) in 2015 as compared to 2008. Besides Germany, only Poland, Neth-erlands and Bulgaria succeeded in bringing CO2 emission down to less than 10%. On the other hand, compared to 2008, 11 EU states reduced CO2 emis-sion, though they still exceeded the 20% target. Although the volume of CO2
emission is related to, inter alia, the size of a country and its level of industri-alization, the reduction level is definitely the result of preventive measures undertaken by governments.
Figure 7. Greenhouse Gas Emission per GDP in the EU [thousand tons CO2 /GDP]Source: author’s own work based on Eurostat.
F7
0,0000
0,2000
0,4000
0,6000
0,8000
1,0000
1,2000
1,4000
2008 2009 2010 2011 2012 2013 2014 2015 2016
CO2/G
DP
maximum minimum average
y = -0,0165x2 + 0,1073x + 0,9603R² = 0,7309
y = -0,0001x + 0,0021R² = 0,975
y = -0,0125x + 0,3308R² = 0,9293
0
0,2
0,4
0,6
0,8
1
1,2
1,4
2008 2009 2010 2011 2012 2013 2014 2015
CO2/G
DP
maximum minimum average
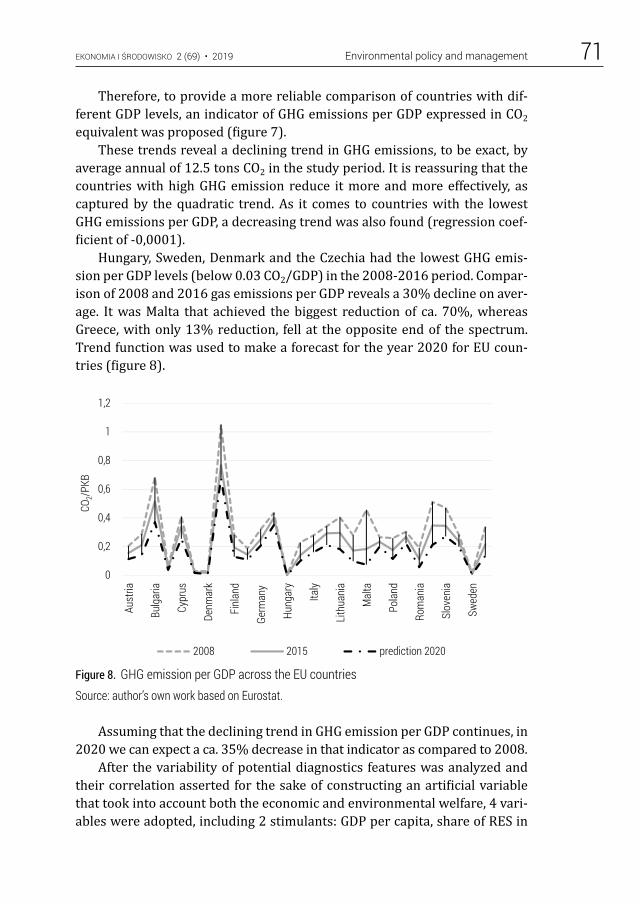
EKONOMIA I ŚRODOWISKO 2 (69) • 2019 Environmental policy and management 71
Therefore, to provide a more reliable comparison of countries with dif-ferent GDP levels, an indicator of GHG emissions per GDP expressed in CO2
equivalent was proposed (figure 7).These trends reveal a declining trend in GHG emissions, to be exact, by
average annual of 12.5 tons CO2 in the study period. It is reassuring that the countries with high GHG emission reduce it more and more effectively, as captured by the quadratic trend. As it comes to countries with the lowest GHG emissions per GDP, a decreasing trend was also found (regression coef-ficient of -0,0001).
Hungary, Sweden, Denmark and the Czechia had the lowest GHG emis-sion per GDP levels (below 0.03 CO2/GDP) in the 2008-2016 period. Compar-ison of 2008 and 2016 gas emissions per GDP reveals a 30% decline on aver-age. It was Malta that achieved the biggest reduction of ca. 70%, whereas Greece, with only 13% reduction, fell at the opposite end of the spectrum. Trend function was used to make a forecast for the year 2020 for EU coun-tries (figure 8).
Figure 8. GHG emission per GDP across the EU countriesSource: author’s own work based on Eurostat.
Assuming that the declining trend in GHG emission per GDP continues, in 2020 we can expect a ca. 35% decrease in that indicator as compared to 2008.
After the variability of potential diagnostics features was analyzed and their correlation asserted for the sake of constructing an artificial variable that took into account both the economic and environmental welfare, 4 vari-ables were adopted, including 2 stimulants: GDP per capita, share of RES in
F8
0,000
0,200
0,400
0,600
0,800
1,000
1,200
Aust
ria
Bulg
aria
Cypr
us
Denm
ark
Finl
and
Germ
any
Hung
ary
Italy
Lithu
ania
Malt
a
Pola
nd
Rom
ania
Slov
enia
Swed
en
CO2/P
KB
2008 2016 2020
0
0,2
0,4
0,6
0,8
1
1,2
Aust
ria
Bulg
aria
Cypr
us
Denm
ark
Finl
and
Germ
any
Hung
ary
Italy
Lithu
ania
Malt
a
Pola
nd
Rom
ania
Slov
enia
Swed
en
CO2/P
KB
2008 2015 prediction 2020
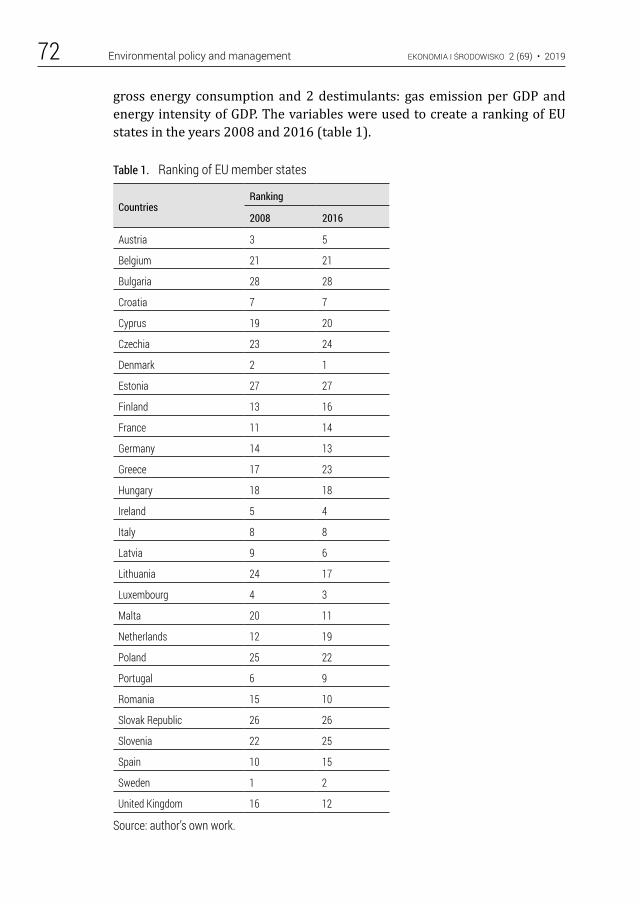
EKONOMIA I ŚRODOWISKO 2 (69) • 2019Environmental policy and management72
gross energy consumption and 2 destimulants: gas emission per GDP and energy intensity of GDP. The variables were used to create a ranking of EU states in the years 2008 and 2016 (table 1).
Table 1. Ranking of EU member states
CountriesRanking
2008 2016
Austria 3 5
Belgium 21 21
Bulgaria 28 28
Croatia 7 7
Cyprus 19 20
Czechia 23 24
Denmark 2 1
Estonia 27 27
Finland 13 16
France 11 14
Germany 14 13
Greece 17 23
Hungary 18 18
Ireland 5 4
Italy 8 8
Latvia 9 6
Lithuania 24 17
Luxembourg 4 3
Malta 20 11
Netherlands 12 19
Poland 25 22
Portugal 6 9
Romania 15 10
Slovak Republic 26 26
Slovenia 22 25
Spain 10 15
Sweden 1 2
United Kingdom 16 12
Source: author’s own work.
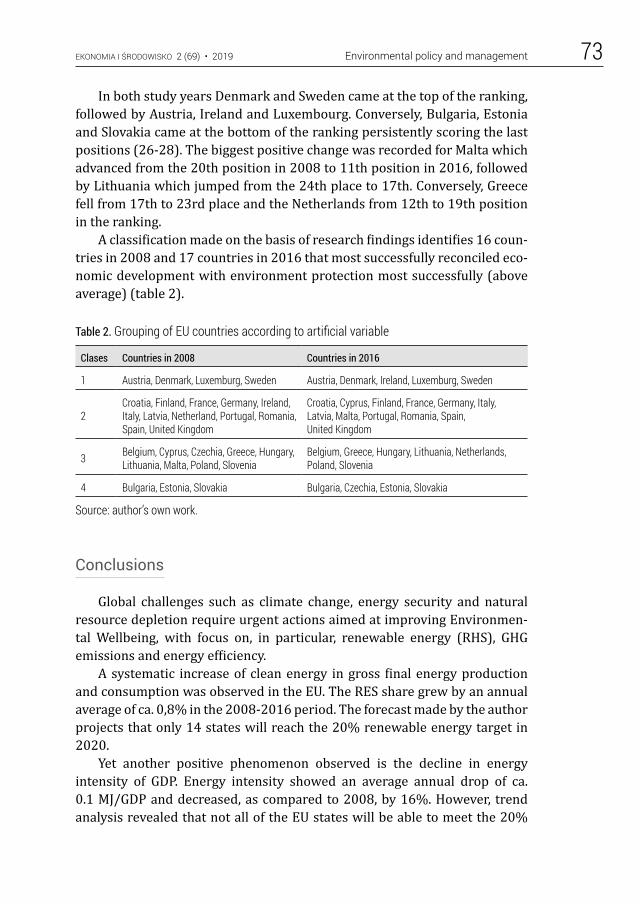
EKONOMIA I ŚRODOWISKO 2 (69) • 2019 Environmental policy and management 73
In both study years Denmark and Sweden came at the top of the ranking, followed by Austria, Ireland and Luxembourg. Conversely, Bulgaria, Estonia and Slovakia came at the bottom of the ranking persistently scoring the last positions (26-28). The biggest positive change was recorded for Malta which advanced from the 20th position in 2008 to 11th position in 2016, followed by Lithuania which jumped from the 24th place to 17th. Conversely, Greece fell from 17th to 23rd place and the Netherlands from 12th to 19th position in the ranking.
A classification made on the basis of research findings identifies 16 coun-tries in 2008 and 17 countries in 2016 that most successfully reconciled eco-nomic development with environment protection most successfully (above average) (table 2).
Table 2. Grouping of EU countries according to artificial variable
Clases Countries in 2008 Countries in 2016
1 Austria, Denmark, Luxemburg, Sweden Austria, Denmark, Ireland, Luxemburg, Sweden
2Croatia, Finland, France, Germany, Ireland, Italy, Latvia, Netherland, Portugal, Romania, Spain, United Kingdom
Croatia, Cyprus, Finland, France, Germany, Italy, Latvia, Malta, Portugal, Romania, Spain, United Kingdom
3 Belgium, Cyprus, Czechia, Greece, Hungary, Lithuania, Malta, Poland, Slovenia
Belgium, Greece, Hungary, Lithuania, Netherlands, Poland, Slovenia
4 Bulgaria, Estonia, Slovakia Bulgaria, Czechia, Estonia, Slovakia
Source: author’s own work.
Conclusions
Global challenges such as climate change, energy security and natural resource depletion require urgent actions aimed at improving Environmen-tal Wellbeing, with focus on, in particular, renewable energy (RHS), GHG emissions and energy efficiency.
A systematic increase of clean energy in gross final energy production and consumption was observed in the EU. The RES share grew by an annual average of ca. 0,8% in the 2008-2016 period. The forecast made by the author projects that only 14 states will reach the 20% renewable energy target in 2020.
Yet another positive phenomenon observed is the decline in energy intensity of GDP. Energy intensity showed an average annual drop of ca. 0.1 MJ/GDP and decreased, as compared to 2008, by 16%. However, trend analysis revealed that not all of the EU states will be able to meet the 20%
EKONOMIA I ŚRODOWISKO 2 (69) • 2019Environmental policy and management74
reduction target by 2020. It is highly likely that this target will not be reached by 10 EU states.
Actions aimed at improved energy efficiency and increased green energy consumption should translate into reduced greenhouse gas emission. The average annual decline in CO2 emission across the EU was ca. 3 mln tons which comes up to ca. 2%.
To measure GHG emission intensity an indicator of CO2 emission per unit of GDP was introduced. In the author’s opinion when comparing countries this indicator is more reliable, which is also true for energy intensity of GDP. Comparison of GHG emission to GDP in 2008 and 2015 shows that the indi-cator declined by 30%.
Ranking of EU states by economic development and implementation of the Climate and Energy Package targets allowed the author to identify lead-ers (class 1) and outsiders (class 4). Comparison of 2008 and 2016 demon-strates that in both years Austria, Denmark, Luxembourg and Sweden were the most efficient in reconciling economic development with environmental welfare, and the group was joined by Ireland in 2016. Conversely, Bulgaria, Estonia and Slovakia fell at the other end of the spectrum as least sustainable economically and ecologically.
Literature
Barbier E.B., Burgess J.C. (2017), The Sustainable Development Goals and the systems approach to sustainability, “Economics” Vol. 11, http://dx.doi.org/10.5018/eco-nomics-ejournal.ja.2017-28 [05-05-2019]
Bąba W. (2016), Poziom rozwoju społeczno-gospodarczego nowych państw członkows-kich Unii Europejskiej – analiza taksonomiczna, in: H. Tendera-Właszczuk, W. Bąba, M. Zajączkowska (eds.), Nowe wyzwania integracji europejskiej, Difin, Warszawa
Beckerman W., Bacon R. (1966), International Comparison of Income Levels: A Sug-gested New Measure, “Economic Journal”, p. 521-525
Directive 2009/28/ of the European Parliament and of the Council of 23 April 2009 on the promotion of the use of energy from renewable sources and amending and subsequently repealing Directives 2001/77/EC and 2003/30/EC, http://data.europa.eu/eli/dir/2009/28/oj [23-01-2019]
Dobrzański P., Wzrost zrównoważony a ochrona środowiska. Podstawowe aspekty poli-tyki gospodarczej, http://www.bibliotekacyfrowa.pl/Content/37110/02_Pawel_Dobrzanski.pdf [11-02-2019]
Dyrektywa 2003/87/WE Parlamentu Europejskiego i Rady z dnia 13 października 2003, http://www.kobize.pl/uploads/materialy/wspolnotowe/dyrektywa_ 2003_87_we_pl.pdf [03-02-2019]
Eurostat, http://ec.europa.eu/eurostat/data/database [24-04-2019]Gechev R. (2005), The Essence of Sustainable Development, in: Sustainable Develop-
ment, Economic Aspects, University of Indianapolis Press, Indianapolis
EKONOMIA I ŚRODOWISKO 2 (69) • 2019 Environmental policy and management 75
GUS (2017), Efektywność wykorzystania energii w latach 2005-2015, Warszawahttps://data.worldbank.org/indicator/EG.EGY.PRIM.PP.KD, [01-02-2019]https://ec.europa.eu/eurostat/data/database [11-01-2019]Human Development Indices and Indicators 2018, Statistical Update UNDP (2018),
http://hdr.undp.org/en/content/human-development-indices-indicators-2018 -statistical-update [22-01-2019]
Karmowska G. (2017), Development of the EU societies and social progress, “Econom-ics and Environment” No. 4(63), p. 178-190
Karmowska G., Czaja J., Jach-Chrzaszcz A. (2018), Rozwój społeczno-ekonomiczny kra-jów Unii Europejskiej. Konwergencja czy dywergencja?, Wydawnictwo Naukowe SOFIA, Katowice
Kerk, G, Manuel A. (2017), Sustainable Society Index – your compass to sustainability, http://www.ssfindex.com [11-02-2019]
Kukuła K. (2000), Metoda unitaryzacji zerowanej, PWN, WarszawaKukuła K. (2003), Elementy statystyki, PWN, WarszawaMaciejewski M. (2017), Zróżnicowanie kondycji gospodarczej krajów Unii Europej-
skiej, „Studia Ekonomiczne. Zeszyty Naukowe Uniwersytetu Ekonomicznego w Katowicach” No. 319, p. 117-126
Ministerstwo Rozwoju Regionalnego (2012), Strategia Rozwoju Kraju Polska 2020, www.mrr.gov.pl [15-10-2018]
Mokrosińska D. (2011), Analiza porównawcza PKB, PKB per capita oraz konwergencja typu BETA w regionach Polski i wybranych krajach Unii Europejskiej, in: S.I. Bukowski (ed.) Polityka kohezji i konwergencja gospodarcza regionów Polski oraz krajów Unii Europejskiej. Wybrane zagadnienia, Difin, Warszawa
Neumayer E. (2004), Sustainability and Well-being Indicators, WIDER, Research Paper 20/2004, p. 6-7
Nowak E. (1990), Metody taksonomiczne w klasyfikacji obiektów społeczno-gosp-odarczych, PWE, Warszawa
Nowak E. (2002), Zarys metod ekonometrii, PWN, WarszawaPiotrowska P. (2008), Ochrona środowiska kontra rozwój gospodarczy. Teorie środow-
iskowe i ich wykorzystanie w polityce gospodarczej, „Studia Regionalne i Lokalne” No. 1(31)
Piotrowski J. (2015), Gospodarka Polski w procesie konwergencji do poziomu rozwin-iętych państw członkowskich UE, Unia Europejska, No. 1
Saisana M., Philippas D. (2012), Sustainable Society Index (SSI): Taking societies’ pulse along social, environmental and economic issues, https://www.researchgate.net/publication/284405662 [07-05-2019]
Suehiro S. (2007), Energy Intensity of GDP as an Index of Energy Conservation, IEEJ August 2007, https://eneken.ieej.or.jp/en/data/pdf/400.pdf [07-05-2019]
Tendera-Właszczuk H. (2016), Różnice w poziomach rozwoju społeczno-gospo-darczego nowych państw członkowskich na tle UE-15, in: E. Molendowski, J. Garlińska-Bielawska (eds.) Globalizacja i regionalizacja we współczesnym świe-cie, „Miscellanea Oeconomicae. Studia i Materiały” No. 3
Wysokińska Z. (2016), Polityka klimatyczno-energetyczna Unii Europejskiej w kon-tekście strategii zrównoważonego rozwoju i dążenia do budowy gospodarki „cyrkularnej” in: Z. Wysokińska., J. Witkowska (eds.), Zrównoważony rozwój. Wybrane aspekty makro- i mikroekonomiczne, Wydawnictwo Uniwersytetu Łódzkiego, Łódź
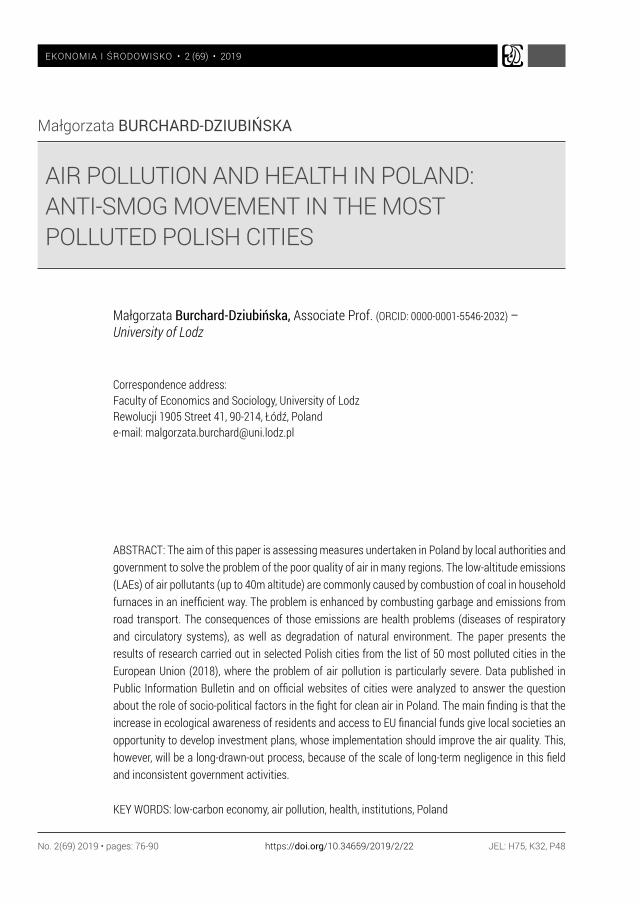
EKONOMIA I ŚRODOWISKO • 2 (69) • 2019
AIR POLLUTION AND HEALTH IN POLAND: ANTI-SMOG MOVEMENT IN THE MOST POLLUTED POLISH CITIES
ABSTRACT: The aim of this paper is assessing measures undertaken in Poland by local authorities and government to solve the problem of the poor quality of air in many regions. The low-altitude emissions (LAEs) of air pollutants (up to 40m altitude) are commonly caused by combustion of coal in household furnaces in an inefficient way. The problem is enhanced by combusting garbage and emissions from road transport. The consequences of those emissions are health problems (diseases of respiratory and circulatory systems), as well as degradation of natural environment. The paper presents the results of research carried out in selected Polish cities from the list of 50 most polluted cities in the European Union (2018), where the problem of air pollution is particularly severe. Data published in Public Information Bulletin and on official websites of cities were analyzed to answer the question about the role of socio-political factors in the fight for clean air in Poland. The main finding is that the increase in ecological awareness of residents and access to EU financial funds give local societies an opportunity to develop investment plans, whose implementation should improve the air quality. This, however, will be a long-drawn-out process, because of the scale of long-term negligence in this field and inconsistent government activities.
KEY WORDS: low-carbon economy, air pollution, health, institutions, Poland
Małgorzata Burchard-Dziubińska, Associate Prof. (ORCID: 0000-0001-5546-2032) – University of Lodz
Correspondence address:Faculty of Economics and Sociology, University of LodzRewolucji 1905 Street 41, 90-214, Łódź, Polande-mail: [email protected]
Małgorzata BURCHARD-DZIUBIŃSKA
JEL: H75, K32, P48No. 2(69) 2019 • pages: 76-90 https://doi.org/10.34659/2019/2/22
EKONOMIA I ŚRODOWISKO 2 (69) • 2019 Environmental policy and management 77
Introduction
One of the most important factors determining the quality and length of human life is the condition of the natural environment in which a human lives. The air we breathe is especially important. In Poland, it has been known for several decades that air quality is low, which is mainly due to the promo-tion of electricity and heat production based on coal. Although, of course, there is a connection between coal combustion and emissions of harmful substances into the air, in Poland the particularly negative impact on air qual-ity is not related to the functioning of the professional power sector, equipped with various installations filtering out pollutants, but to households and transport. The emission of pollutants to the altitude of 40 m is a serious prob-lem particularly in cities and small towns, where it generates significant threats to the health and life of citizens. The main aim of research was to find an answer to the research question: What is the role of socio-political factors in the fight for clean air in Poland? In order to answer this question, in the article information available on the official websites of 35 Polish cities belonging to 50 European Union (EU) cities with the highest level of air pol-lution with PM 2.5 and in Public Information Bulletin were analyzed. The following information was taken into account: Adoption of the Low-Emission Economy Plans (LEEPs) and their timeliness, implementation of the Low-Al-titude Emission Reduction Programs (LAERPs), linking these documents with air protection plans/programs for voivodships and the country. The article presents the literature, law, standards of air quality, and statistical data on the impact of air pollution on health in Poland, with particular emphasis on places with the highest violation of emission standards.
An overview of the literature
For many years, the influence of air quality on health has been mainly the subject of research carried out by specialists of medicine and environmental health (Hajat et al., 2016; Grimm et al., 2008, p. 756-760). Due to the rising costs of treatment and high mortality for diseases directly or indirectly related to breathing contaminated air, it is now also interesting for econo-mists. World Health Organization estimates that around 1 in 8 deaths were attributed to exposure to air pollution, making it the largest environmental risk factor for ill health. In 2016, the percentage of outdoor air pollution-re-lated premature deaths was as follows (https://www.who.int/news-room/fact-sheets/detail/ambient-(outdoor)-air-quality-and-health):
EKONOMIA I ŚRODOWISKO 2 (69) • 2019Environmental policy and management78
• ischemic heart disease and strokes – 58%,• chronic obstructive pulmonary disease and acute lower respiratory
infections – 18%,• lung cancer – 6%.
In accordance with the published in 2005 WHO Air quality guidelines by reducing particulate matter (PM10) pollution from 70 to 20 μg/m3, air pollu-tion-related deaths can be cut by around 15% (WHO, 2005). The main air pollutants that pose a risk to human health are nitrogen oxides (NOx), par-ticulate matter PM2.5 and PM10, tropospheric (ground-level) ozone (O3) and Sulphur dioxide (SO2). PM affects more people than any other pollutant. The major components of PM are sulfates, nitrates, ammonia, sodium chloride, black carbon, mineral dust, and water. It consists of a complex mixture of solid and liquid particles of organic and inorganic substances suspended in the air. Exposure to PM2.5 and PM10 is associated with mortality from car-diovascular and respiratory diseases and from lung cancer, as well as respira-tory and cardiovascular morbidity, such as aggravation of asthma, and respi-ratory symptoms (WHO, 2005). In the EU countries, commercial, institutional and household fuel-burning is the main source of primary (i.e. directly released) PM10 (43%) and PM2.5 (58%). This is followed by industry and then transport, which both emit less than half the total PM of fuel-burning (EEA, 2015). However, secondary particles (i.e., those that are formed in the air through chemical reactions of gaseous pollutants), originating from agri-culture, energy, transport or industry sectors, make up a significant propor-tion of total PM. Secondary particles are the largest relative contribution to PM in Europe, even in urban areas (Science for Environment Policy, 2016; Lelieveld et al., 2015).
Much attention is devoted to research of the economic costs of air pollu-tion. The market costs of air pollution include reduced labor productivity, additional health expenditure, and crop and forest yield losses. The Organ-isation for Economic Co-operation and Development (OECD) projects that these costs will increase to about 2% of European gross domestic product (GDP) in 2060 (OECD, 2016), leading to a reduction in capital accumulation and a slowdown in economic growth. Non-market costs are those associated with increased mortality and morbidity (illness causing, for example, pain and suffering), degradation of air, soil and water quality and consequently the health of ecosystems, as well as climate change. The economic cost of premature deaths from ambient particulate matter pollution and household air pollution was estimated to amount to US$ 1.5 trillion in the European Union in 2010 (WHO Regional Office for Europe&OECD, 2015). In 2015, more than 80% of the total costs (market and non-market) of outdoor air pollution in Europe were related to mortality, while market costs were less than 10%
EKONOMIA I ŚRODOWISKO 2 (69) • 2019 Environmental policy and management 79
(OECD, 2016). It was estimated that the total costs for the OECD region amount to USD 1 280 (around EUR 1 100) per capita for 2015 and USD 2 880 to USD 2 950 (around EUR 2 480 to 2 540) per capita for 2060, correspond-ing to about 5% of income in both 2015 and 2060. The non-market costs of outdoor air pollution amount to USD 1 200 (around EUR 1 030) per capita in 2015 and are projected to increase to USD 2610-2680 (around EUR 2 250 – 2310) in 2060 in the OECD region (EEA, 2018). Air pollution continues to be the number one environmental cause of early death in the EU, with estimates of more than 400,000 premature deaths per year (EEA, 2017). This all comes at a high price to society with high external health – related costs estimated in the range of EUR 330-940 billion per year (Impact Assessment, 2013) Air quality has improved in the EU over the last decades, thanks to joint efforts undertaken by the EU and the national, regional and local authorities. As a result, since 2000, the EU’s GDP grew by 32%, while emissions of the main air pollutants decreased by 10% to 70% depending on the pollutant (EEA, 2017).
For example, an estimate for Denmark shows that, the potential health-care system savings from reducing ambient air pollution (PM2.5) and the resulting cost reductions for coronary heart disease, stroke, chronic obstruc-tive pulmonary disease and lung cancer can reach up 0.1-2.6 million EUR per 100 000 people (Sætterstrøm et al., 2012). The productivity costs from no longer being in the labor market due to these four diseases from exposure to PM2.5 was estimated at 1.8 million EUR per 100 000 people aged 50-70 (Kruse et al., 2012).
For Poland estimations were published by Health and Environment Alli-ance (HEAL). Pollution from the coal energy sector causes about 3,500 pre-mature deaths and almost 800,000 lost work days. In the case of Poland, these costs amount to PLN 34.32 billion (EUR 8.2 billion) per year (HEAL, 2013).
In its official report the Polish National Health Fund published that in 2017, the number of deaths amounted to 405.6 thousand (based on data from the Central List of Insured) and increased by 3.77% compared to 2016. The results of the analysis indicate that the increase in 2017 mainly con-cerned the months of January and February. In January, the number of deaths increased by as much as 23.5% compared to January of the previous year. Analysis of the average PM10 dust in the air for Poland in January 2017 was at a record level. In January 2017 the lowest average air temperature was recorded compared to the corresponding periods of last years. In addition, in January there was the peak of influenza (Analiza…, 2018).
EKONOMIA I ŚRODOWISKO 2 (69) • 2019Environmental policy and management80
Research methods
The research was conducted in the second half of 2018 with the aim of determining what actions had been taken during the previous five years in 35 Polish cities from the list of the 50 most polluted EU cities to improve the quality of ambient air. Air quality was reported in terms of annual mean con-centrations of PM2.5 in micrograms per cubic meter (https://www.who.int/phe/health_topics/outdoorair/databases/). To answer the research ques-tion the following information was analyzed: EU and Polish law, international and Polish standards of air quality, and statistical data on the impact of air pollution on health in Poland, with particular emphasis on places with the highest violation of emission standards, information available on the official websites of the 35 Polish cities with the highest level of air pollution with PM 2.5 and in Public Information Bulletin. Particularly was taken into account: Adoption of low-emission economy plans (LEEPs) and their timeliness, implementation of the Low-Altitude Emission Reduction Programs (LAERPs), linking these documents with air protection plans/ programs for voivodships and the country.
Legal context of air protection in EU and in Poland
The EU’s clean air policy has been developed for many years. Now it based on many documents, the most important of which are:1. Directive CAFE (Clean Air For Europe) 2008/50/EC on ambient air qual-
ity and cleaner air for Europe including the merging of most of existing legislation into a single directive (except for the Fourth Daughter Direc-tive) with no change to existing air quality objectives.
2. Directive 2004/107/EC relating to arsenic, cadmium, mercury, nickel and polycyclic aromatic hydrocarbons in ambient air (Fourth Daughter Directive).
3. Directive 2015/1480/EC amending several annexes to Directives 2004/107/EC and 2008/50/EC laying down the rules concerning refer-ence methods, data validation and location of sampling points for the assessment of ambient air quality.
4. National Emissions Ceilings (NEC) Directive (2016/2284/EU) on the reduction of national emissions of certain atmospheric pollutants. National emission reduction targets established in the NEC Directive requiring Member States to develop National Air Pollution Control Pro-grammes by 2019 in order to comply with their emission reduction com-mitments.
EKONOMIA I ŚRODOWISKO 2 (69) • 2019 Environmental policy and management 81
5. The Seventh Environment Action Programme, Living well, within the lim-its of our planet with the long-term goal within the EU to achieve “levels of air quality that do not give rise to significant negative impacts on, and risks to, human health and the environment”. In line with the principle of subsidiarity, policies must be developed at national, regional and local levels, implementing measures tailored to specific needs and circum-stances.
6. The Clean Air Programme for Europe (CAPE), published by the European Commission in 2013, aims to ensure full compliance with existing legisla-tion by 2020 at the latest, and to further improve Europe’s air quality, so that by 2030 the number of premature deaths is reduced by half when compared with 2005.In Poland among the most important documents related to air pollution
reduction are:1. The Principles of the National Program for the Development of Low-
Emission Economy, adopted by the Council of Ministers (Ministry of Economy, 2011).
2. Low-Emission Economy Plans, adopted as an independent decision of local government units, being a key factor of applying for EU funds in financial perspective 2014-2020.
3. National Air Protection Program (Ministry of Environment, 2015).The amendment of the Environmental Protection Law specifies the cur-
rent regulations so that voivodship parliaments with resolutions can deter-mine the type and quality of solid fuels authorized for use and technical parameters or emission parameters of combustion devices.
The most recent decision of the Polish government was to adopt the Pri-ority Program Clean Air financed by the National Fund for Environmental Protection and Water Management. It is addressed to owners or co-owners of single-family houses. It will be implemented over a period of 10 years, i.e., in the years 2018 to 2029. The total funds provided for co-financing projects covered by the program are PLN 103 billion, of which PLN 63.3 billion in grant financing and PLN 39.7 billion in the form of repayable loans. The pro-gram will be financed from national resources and EU funds. The overall goal of the program is to improve energy efficiency and reduce the emission of dust and other pollutants from single-family residential buildings through thorough thermal modernization of buildings with the simultaneous replace-ment of heat sources (https://www.nfosigw.gov.pl/czyste-powietrze/).
But not all decisions of the Polish government are conducive to the fight for clean air. For example, the Renewable Energy Sources Act implementing the Directive 2009/28/EC on the promotion of the use of energy from renew-able sources was adopted in 2015 with a five-year delay and then quickly
EKONOMIA I ŚRODOWISKO 2 (69) • 2019Environmental policy and management82
revised. In 2016 the government introduced unfavorable changes to regula-tions particularly hampering the development of wind energy (The Act…, 2016.) The “Wind Farm Act” introduced location restrictions for wind power plants in Poland by imposing a requirement for minimum distance (setback) from settlements and other facilities, significantly changing the previous legal framework and conditions for implementation of investment projects. The act introduced a legally binding provision setting the minimum distance for wind turbines from specific types of facilities, equal to ten times the total turbine height (including the rotor blade in top position – tip height) – the so-called 10H rule. Research into the location possibilities of wind turbines in Poland shows that with the existing restrictions and the principle of a minimum one km distance from buildings, 93.9% of the country’s area is excluded from investments in wind energy, while with a limit of a two km distance up to 99.1% (The State of Wind Energy, 2017). The development of the best non-emission energy source in Poland has been stopped.
In many EU cities air quality standards are still not being met. The situa-tion is especially severe in Polish cities, which constitute the overwhelming majority of 50 EU cities with the highest of PM 2.5 μg/m3 index.
Air pollution in Polish cities – selected facts and statistic data
According to estimates and analysis carried out by the Silesian Center for Heart Diseases in Zabrze on days, when there is a significantly high level of particulate matter PM10 contamination, the total number of deaths increases by 6%, and the number of brain strokes by as much as 9%. Mortality rates rise within a dozen or so days of the smog episode.
According to HEAL Poland (2013), smog accounts for approximately: 25% of lung cancer cases in Krakow, 22% in Nowy Sącz, 21% in Katowice, 20% in Bielsko-Biała, and 17% in Wrocław.
In Poland, the main problem involves emission of products of combustion of solid, liquid and gaseous fuels into the atmosphere from emission sources (emitters) located at a height of no more than 40 m. A characteristic feature of these emissions is that it is caused by numerous sources introducing small amounts of pollutants into the air. Emission comes from: heat production for central heating and hot water, transport, and industry (small and medium size enterprises). Main causes of emission near the ground are:• heating houses with poor quality fuels (coal and damp wood),• no standards for fuels used in households,• burning garbage, including plastic, old furniture, clothes and shoes, tires,
and old railway wooden sleepers etc.,
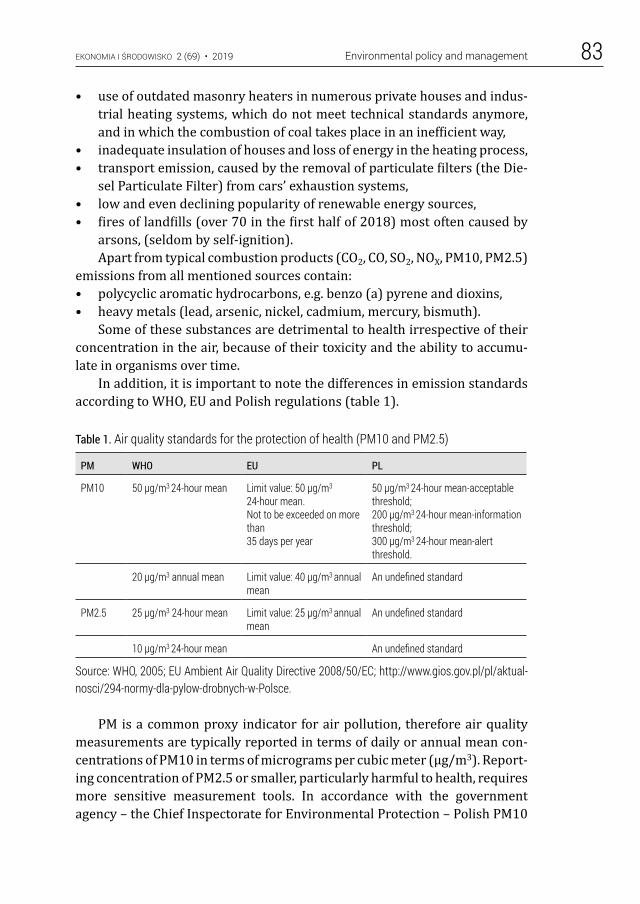
EKONOMIA I ŚRODOWISKO 2 (69) • 2019 Environmental policy and management 83
• use of outdated masonry heaters in numerous private houses and indus-trial heating systems, which do not meet technical standards anymore, and in which the combustion of coal takes place in an inefficient way,
• inadequate insulation of houses and loss of energy in the heating process,• transport emission, caused by the removal of particulate filters (the Die-
sel Particulate Filter) from cars’ exhaustion systems,• low and even declining popularity of renewable energy sources,• fires of landfills (over 70 in the first half of 2018) most often caused by
arsons, (seldom by self-ignition).Apart from typical combustion products (CO2, CO, SO2, NOX, PM10, PM2.5)
emissions from all mentioned sources contain:• polycyclic aromatic hydrocarbons, e.g. benzo (a) pyrene and dioxins,• heavy metals (lead, arsenic, nickel, cadmium, mercury, bismuth).
Some of these substances are detrimental to health irrespective of their concentration in the air, because of their toxicity and the ability to accumu-late in organisms over time.
In addition, it is important to note the differences in emission standards according to WHO, EU and Polish regulations (table 1).
Table 1. Air quality standards for the protection of health (PM10 and PM2.5)
PM WHO EU PL
PM10 50 μg/m3 24-hour mean Limit value: 50 μg/m3
24-hour mean.Not to be exceeded on more than35 days per year
50 μg/m3 24-hour mean-acceptable threshold;200 μg/m3 24-hour mean-information threshold;300 μg/m3 24-hour mean-alert threshold.
20 μg/m3 annual mean Limit value: 40 μg/m3 annual mean
An undefined standard
PM2.5 25 μg/m3 24-hour mean Limit value: 25 μg/m3 annual mean
An undefined standard
10 μg/m3 24-hour mean An undefined standard
Source: WHO, 2005; EU Ambient Air Quality Directive 2008/50/EC; http://www.gios.gov.pl/pl/aktual-nosci/294-normy-dla-pylow-drobnych-w-Polsce.
PM is a common proxy indicator for air pollution, therefore air quality measurements are typically reported in terms of daily or annual mean con-centrations of PM10 in terms of micrograms per cubic meter (μg/m3). Report-ing concentration of PM2.5 or smaller, particularly harmful to health, requires more sensitive measurement tools. In accordance with the government agency – the Chief Inspectorate for Environmental Protection – Polish PM10
EKONOMIA I ŚRODOWISKO 2 (69) • 2019Environmental policy and management84
and PM2.5 standards still differ from EU and WHO standards, as if Poles were different from other nations.
Results of the research
The data from official websites of city offices and from Public Informa-tion Bulletin (online) are presented in table 2. The cities are located in 8 voivodeships: Silesian Voivodeship (12 cites), Lesser Poland (7), Łódź (7), Greater Poland (3), Masovian (2), Lower Silesian (1), Kuyavian-Pomeranian (1), and Podkarpackie (1). A total of over 2,860,000 people live in the cities included in the study. The situation in particular cities is diverse due to their size and location. In all cases exceeding the permissible pollution limits is an everyday occurrence in the heating season but in some cases, incidentally black spots were noticed (e.g., in Rybnik on January 10, 2017, the limit was exceeded by 3170%). In all cities in 2014-2016 were adopted Low-Emission Economy Plans (LEEPs) for period up to 2020. The development of plans was financed from the EU funds available under the Infrastructure and Environ-ment Program. The scope of involvement in activities to improve air quality is very diverse among the cities studied. Krakow is definitely the leader, the largest city with population over 765 thousands, which has been pursuing a comprehensive anti-smog program for several years. Krakow was also the first Polish city where in response to air pollution a social movement Polish smog alert was founded. The slogan: “We decided to take matters into our own hands and start awareness-raising activities among the residents.” describes the main field of activity of this group. Replacing old coal stoves with environmentally friendly heaters is a one of the most important and the most difficult to implement and expensive tasks. In Krakow, in the first year of the local anti-smog program, financial subsidies accounted for 100% of the cost of replacing old heaters, in the second year – 80%, now – 60%, but the poorest households can still receive 100% reimbursement. The interest in replacing the heaters in 2014 exceeded the financial limits of the program (https://smoglab.pl/sukcesy-porazki-krakowskiej-walki-ze-smogiem/). The poorest households can obtain other heating subsidies. In 2017, the income threshold for a single-person household was PLN 1268 per month and PLN 1068 for a multi-person household. Two thousands households benefited from such aid. The total support amounted to PLN 2 million (EUR 454,500) which gives an average PLN 1000 per household. The influence of the educa-tional campaign is clear. The problem of burning rubbish in heaters, and leaves and other waste from gardens in open fires has also been reduced. The latter are picked up from households in special bags free of charge. In the
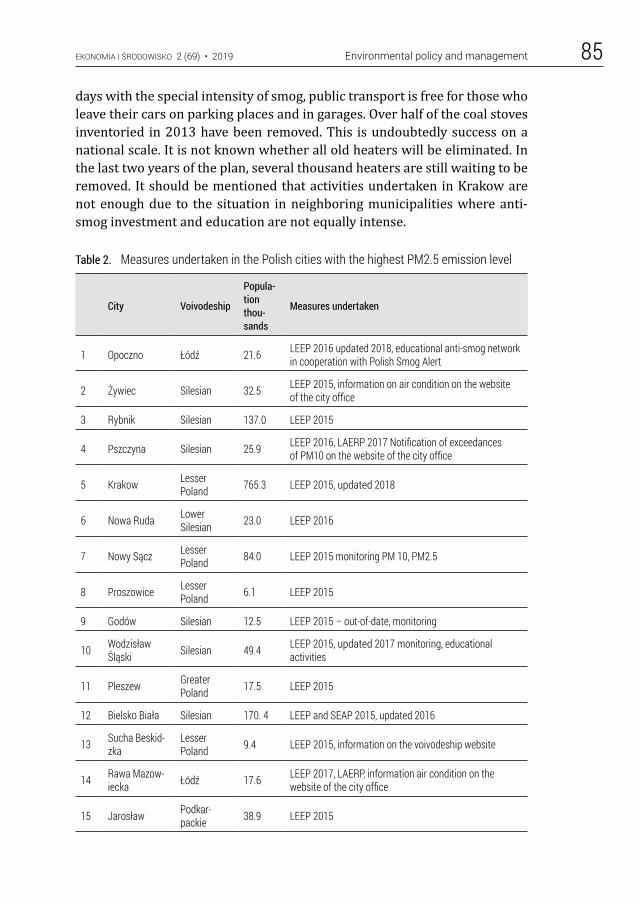
EKONOMIA I ŚRODOWISKO 2 (69) • 2019 Environmental policy and management 85
days with the special intensity of smog, public transport is free for those who leave their cars on parking places and in garages. Over half of the coal stoves inventoried in 2013 have been removed. This is undoubtedly success on a national scale. It is not known whether all old heaters will be eliminated. In the last two years of the plan, several thousand heaters are still waiting to be removed. It should be mentioned that activities undertaken in Krakow are not enough due to the situation in neighboring municipalities where anti-smog investment and education are not equally intense.
Table 2. Measures undertaken in the Polish cities with the highest PM2.5 emission level
City Voivodeship
Popula-tion thou-sands
Measures undertaken
1 Opoczno Łódź 21.6 LEEP 2016 updated 2018, educational anti-smog network in cooperation with Polish Smog Alert
2 Żywiec Silesian 32.5 LEEP 2015, information on air condition on the website of the city office
3 Rybnik Silesian 137.0 LEEP 2015
4 Pszczyna Silesian 25.9 LEEP 2016, LAERP 2017 Notification of exceedances of PM10 on the website of the city office
5 Krakow Lesser Poland 765.3 LEEP 2015, updated 2018
6 Nowa Ruda Lower Silesian 23.0 LEEP 2016
7 Nowy Sącz Lesser Poland 84.0 LEEP 2015 monitoring PM 10, PM2.5
8 Proszowice Lesser Poland 6.1 LEEP 2015
9 Godów Silesian 12.5 LEEP 2015 – out-of-date, monitoring
10 Wodzisław Śląski Silesian 49.4 LEEP 2015, updated 2017 monitoring, educational
activities
11 Pleszew Greater Poland 17.5 LEEP 2015
12 Bielsko Biała Silesian 170. 4 LEEP and SEAP 2015, updated 2016
13 Sucha Beskid-zka
Lesser Poland 9.4 LEEP 2015, information on the voivodeship website
14 Rawa Mazow-iecka Łódź 17.6 LEEP 2017, LAERP, information air condition on the
website of the city office
15 Jarosław Podkar-packie 38.9 LEEP 2015
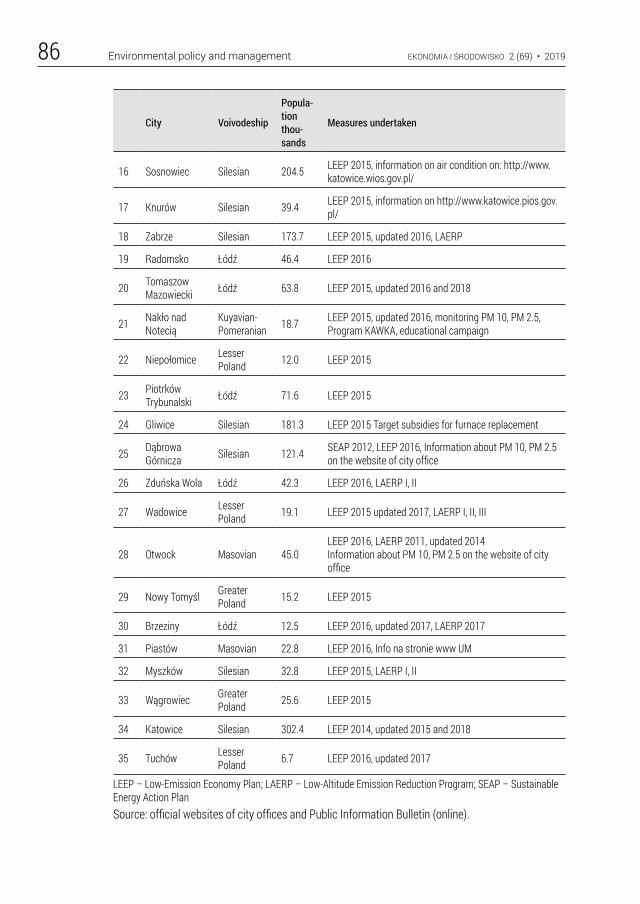
EKONOMIA I ŚRODOWISKO 2 (69) • 2019Environmental policy and management86
City Voivodeship
Popula-tion thou-sands
Measures undertaken
16 Sosnowiec Silesian 204.5 LEEP 2015, information on air condition on: http://www.katowice.wios.gov.pl/
17 Knurów Silesian 39.4 LEEP 2015, information on http://www.katowice.pios.gov.pl/
18 Zabrze Silesian 173.7 LEEP 2015, updated 2016, LAERP
19 Radomsko Łódź 46.4 LEEP 2016
20 Tomaszow Mazowiecki Łódź 63.8 LEEP 2015, updated 2016 and 2018
21 Nakło nad Notecią
Kuyavian- Pomeranian 18.7 LEEP 2015, updated 2016, monitoring PM 10, PM 2.5,
Program KAWKA, educational campaign
22 Niepołomice Lesser Poland 12.0 LEEP 2015
23 Piotrków Trybunalski Łódź 71.6 LEEP 2015
24 Gliwice Silesian 181.3 LEEP 2015 Target subsidies for furnace replacement
25 Dąbrowa Górnicza Silesian 121.4 SEAP 2012, LEEP 2016, Information about PM 10, PM 2.5
on the website of city office
26 Zduńska Wola Łódź 42.3 LEEP 2016, LAERP I, II
27 Wadowice Lesser Poland 19.1 LEEP 2015 updated 2017, LAERP I, II, III
28 Otwock Masovian 45.0LEEP 2016, LAERP 2011, updated 2014Information about PM 10, PM 2.5 on the website of city office
29 Nowy Tomyśl Greater Poland 15.2 LEEP 2015
30 Brzeziny Łódź 12.5 LEEP 2016, updated 2017, LAERP 2017
31 Piastów Masovian 22.8 LEEP 2016, Info na stronie www UM
32 Myszków Silesian 32.8 LEEP 2015, LAERP I, II
33 Wągrowiec Greater Poland 25.6 LEEP 2015
34 Katowice Silesian 302.4 LEEP 2014, updated 2015 and 2018
35 Tuchów Lesser Poland 6.7 LEEP 2016, updated 2017
LEEP – Low-Emission Economy Plan; LAERP – Low-Altitude Emission Reduction Program; SEAP – Sustainable Energy Action PlanSource: official websites of city offices and Public Information Bulletin (online).
EKONOMIA I ŚRODOWISKO 2 (69) • 2019 Environmental policy and management 87
The analysis of Low-Emission Economy Plans of all cities identified the most frequently chosen goals:• increased efficiency of energy use and generation in facilities and infra-
structure,• increased use of renewable energy,• effective management of the city with its orientation towards the use of
low-emission solutions,• education and building ecological awareness of citizens leading to respect
for energy by society,• development of financial support for residents exchanging old heaters
for more effective,• development of air monitoring in cites,• introduction of household heater control and penalties for burning gar-
bage,• the development of low-carbon public, and private transport (develop-
ment of infrastructure, management, and change of transport patterns).It is worth emphasizing, that local self-governments are supported by
voivodship self-governments (voivodship parliaments), which have adopted Air Protection Programs. The voivodship environmental protection inspec-torates should also be applauded for making up-to-date measurements of pollutant emissions available on their websites.
The Low-Altitude Emission Reduction Programs (LAERPs) are executive programs of Environmental Protection Programs, whose adoption is the responsibility of communes and poviats. Investments under LAERP are financed in the form of a subsidy paid by the commune office. An investor (i.e., a resident of a municipality) eligible for the Program, bears only a part of the costs related to the replacement of old heaters and /or the installation of devices using renewable energy sources. The amount of co-financing depends on the conditions imposed by the Voivodship Funds of Environmental Pro-tection and Water Management. Some cities are also involved in the Covenant of Mayors activities for Sustainable Energy Action Plan (SEAP), which is ori-ented on climate protection. Access to information about anti-smog actions on the official websites of cities is very diverse, which may make it difficult for residents to obtain subsidies.
Conclusions
Air pollution in Poland is a serious economic and health problem. In recent years an increase in public awareness of health threats resulting from breathing poor quality air has been observed. This is especially true for large
EKONOMIA I ŚRODOWISKO 2 (69) • 2019Environmental policy and management88
cities. However, terrible air quality especially in the heating season is also a problem in many small and medium-sized cities, 35 of which are among the 50 most polluted EU cities. Air quality became an important topic of discus-sion at local level during the elections of local authorities. It results in the development of local social movements for better quality air and adoption of Low Emission Plans by local authorities. Some local self-governments are very successful in gaining financial resources for improvement of energy effi-ciency, replacement of old heaters, development of low-emission transport etc. Despite the growing awareness of the impact of poor air quality on health, Poles are not determined to demand from the central government to take more advanced decisive action for the development of a low-emission econ-omy. Actions at the national level are rather enforced by external regulations: EU law, and international agreements like the United Nations Framework Convention on Climate Change (UNFCCC).
Subjective perception of air pollution can have important implications in terms of health-protective behaviors and citizen and stakeholder engage-ment in cleaner-air policies. Coming with and answer to the research ques-tion: What is the role of socio-political factors in the fight for clean air in Poland? one can state that there is a gap between what is happening at the local and at the central levels. The steps taken by the Polish government to develop a low-carbon economy have not been sufficient. The government continues to support coal energy and introduced regulations hampering the development of renewables, especially restrictive in relation to wind energy. The Clean Air priority program adopted in 2018 is a promising exception but EU will not support any coal-based heating system, what was planned by the Polish government. Meanwhile, local authorities in many cities are very well coping with the implementation of multi-faceted activities aimed at combat-ing smog. This is a response to the expectations of local residents. So far, the issue of the impact of environmental pollution on health has been absent from the electoral programs of the main political parties in the parliamentary elections in Poland.
Literature
Air quality in Europe – 2014 report (2014), European Environment Agency, Report 5/2014, Luxembourg, Publications Office of the European Union, http://www.eea.europa.eu/ publications/air-quality-in-europe-2014 [15-12-2018]
Air quality in Europe – 2015 report (2015), European Environment Agency, Report 5/2015, Luxembourg, Publications Office of the European Union, http://www.eea.europa.eu/ publications/air-quality-in-europe-2015 [12-10-2018]
Air Quality in Europe – 2017 report (2017), European Environment Agency, Report 5/2017, Luxembourg, Publications Office of the European Union, http://www.eea.europa.eu/ publications/air-quality-in-europe-2017 [12-10-2018]
EKONOMIA I ŚRODOWISKO 2 (69) • 2019 Environmental policy and management 89
Analiza przyczyn wzrostu liczby zgonów w Polsce w 2017 roku (2018), Departament Analiz i Strategii, Narodowy Fundusz Zdrowia, http://www.nfz.gov.pl/o-nfz/publikacje [13-12-2018]
Commission Directive (EU) 2015/1480 of 28 August 2015 Amending several annexes to Directives 2004/107/EC and 2008/50/EC of the European Parliament and of the Council laying down the rules concerning reference methods, data validation and location of sampling points for the assessment of ambient air quality
Communication from the Commission to the European Parliament, the Council, the European Economic and Social Committee and the Committee of the Regions, A Europe that protects: Clean air for all, Brussels, 17.5.2018 COM(2018) 330 final, https://eur-lex.europa.eu/legal-content/EN [03-10-2018]
Directive 2004/107/EC of the European Parliament and of the Council relating to arsenic, cadmium, mercury, nickel and polycyclic aromatic hydrocarbons in ambient air
Directive 2008/50/EC of the European Parliament and of the Council of 21 May 2008 on ambient air quality and cleaner air for Europe
Directive 2009/28/EC of the European Parliament and of the Council of 23 April 2009 on the promotion of the use of energy from renewable sources and amend-ing and subsequently repealing Directives 2001/77/EC and 2003/30/EC
Directive 2015/1480/EC of the European Parliament and of the Council of 28 August 2015
Directive 2016/2284/EU of the European Parliament and of the Council of 14 Decem-ber 2016 on the reduction of national emissions of certain atmospheric pollut-ants, amending Directive 2003/35/EC and repealing Directive 2001/81/EC
Grimm N.B. et al. (2008), Global change and the ecology of cities, “Science” No. 319 (5864), p. 756-760
Hajat A., Hsia C., O’Neill M.S. (2016), Socioeconomic Disparities and Air Pollution Expo-sure: A Global Review, https://www.ncbi.nlm.nih.gov/pmc/articles/PMC462 6327 [10-10-2018]
HEAL (2013), Unpaid Health Bill – how coal power plants make us sick, https://www.env-health.org/wp-content/uploads/2018/06/unpaid_health_bill_EN.pdf [15-10-2018]
https://smoglab.pl/sukcesy-porazki-krakowskiej-walki-ze-smogiem/ [15-10-2018]https://www.nfosigw.gov.pl/czyste-powietrze/ [15-10-2018]https://www.who.int/news-room/fact-sheets/detail/ambient-(outdoor)-air-quali-
ty-and-healthImpact Assessment (2013), European Commission, Brussels, SWD(2013)532 finalKruse M. et al. (2012), Particulate emissions: health effects and labour market conse-
quences, “Journal of Environmental and Public Health”, Bind, p. 130-502Lelieveld J. et al. (2015), The contribution of outdoor air pollution sources to prema-
ture mortality on a global scale, “Nature” No. 525(7569), p. 367-371OECD (2016), The Economic Consequences of Outdoor Air Pollution, OECD Publishing,
Paris, https://doi.org/10.1787/9789264257474-en [03-10-2018]Sætterstrøm B. et al. (2012), A method to assess the potential effects of air pollution
mitigation on healthcare costs, “Journal of Environmental and Public Health” Vol. 2012, Article ID 935825
Science for Environment Policy, Links between noise and air pollution and socioeco-nomic status (2016), European Commission
EKONOMIA I ŚRODOWISKO 2 (69) • 2019Environmental policy and management90
The 7th Environment Action Programme, Living well, within the limits of our planet (2013), European Commission, ec.europa.eu/environment/pubs/pdf/fact-sheets/7eap/en.pdf [05-10-2019]
The Act of 20 February 2015 on Renewable Energy Sources, Journal of Laws of 3 April 2015 item 478
The Act of 20 May 2016 on the investments in wind power plants, Journal of Laws 2016 item 961
The Act of 24 April 2015 amending certain acts in connection with the strengthening of landscape protection, Journal of Laws 2015 item 774
The Clean Air Programme for Europe (2013), Communication from the Commission to the Council, the European Parliament, the European Economic and Social Com-mittee and the Committee of the Regions – “A Clean Air Programme for Europe”, COM(2013) 918 final
The State of Wind Energy in Poland in 2016 (2017), The Polish Wind Energy Associa-tion
WHO (2005), Air quality guidelinesWHO Europe, OECD (2015), Economic cost of the health impact of air pollution in
Europe: Clean air, health and wealth, Copenhagen, WHO Regional Office for Europe, http://www.euro.who.int/__ data/assets/pdf_file/0004/276772/Econom-ic-cost-health-impact-air-pollution-en.pdf [03-10-2018]
EKONOMIA I ŚRODOWISKO • 2 (69) • 2019
TOWARDS BETTER RISK ESTIMATION FOR THE INTEGRATED WATER RESOURCES
MANAGEMENT
ABSTRACT: The aim of the paper is analysis of risk and uncertainty in water management in order to include them in a rigorous way in the decision making in water management according to the Inte-grated Water Resources Management (IWRM) principles. Review of scientific literature as well as case studies analysis of the European Union research on risk with regard to IWRM served for the assess-ment of challenges related to the risk and uncertainty estimation in water management. A novelty in the paper is a comprehensive presentation of risk analysis methods related to IWRM based on the analysis of case studies. The conclusions indicate the gaps in the current practice of risk estimation, presentation and visualization. Thus, in turn could enhance decision making in water management.
KEY WORDS: risk, uncertainty, water management
Tomasz Walczykiewicz, Prof. (ORCID 0000-0001-5326-9132) – Institute of Meteorology and Water Management, National Research InstituteAnna Dubel, PhD (ORCID 0000-0001-5474-2147) – AGH University of Science and Technology
Correspondence address:Piotra Borowego Street 23, 30-067, Kraków, Polande-mail: [email protected]
Tomasz WALCZYKIEWICZ • Anna DUBEL
JEL: D81, Q25, Q54No. 2(69) 2019 • pages: 91-102 https://doi.org/10.34659/2019/2/23
EKONOMIA I ŚRODOWISKO 2 (69) • 2019Environmental policy and management92
Introduction
Risk can be considered when determining the danger or uncertainty of some phenomena. The description of uncertain consequences can be divided into two groups (IMGW, 2005): using the language of probability distribu-tions and referring to other rules that treat these distributions as comple-mentary.
Generally speaking, risk means a measure, an assessment of the hazard or danger resulting either from probable events that are independent of us or the possible consequences of a decision. According to Hubbard (2007) risk is a state of uncertainty, where various possible outcomes are associated with undesirable effects or significant losses. Risk can be also defined as the set of measured uncertainties, where possible results are specific losses. In the mathematical theory of decision, the risk relates to situations in which a par-ticular decision entails certain consequences of the known probability of occurrence of each variant.
The purpose of risk analysis is to determine the likelihood of an adverse event. Risk analysis makes it possible to take appropriate measures to reduce it. There are several types of approach to risk analysis, such as a basic level approach, when standard risk mitigation measures are used, informal approach based on knowledge and experience of experts, detailed risk anal-ysis using risk analysis techniques or mixed approach incorporating ele-ments of the above.
The aim of the paper is to analyze risk and uncertainty in water manage-ment in order to include them in a rigorous way in the decision making in water management according to the Integrated Water Resources Manage-ment (IWRM) principles.
Risk analysis is used in the preparation of appropriate policies and man-agement systems, including preparation of security policy and safety man-agement systems, project management, business management, different types of business and economic analyses.
Risk management consists of planning, control and monitoring. The con-cept of risk is used in the analysis of decision situations, for which it is impor-tant to determine the results of the actions taken. Evaluation and graphical presentation of risk distribution allow for appropriate allocation of resources for the risk minimization.
In the paper the review of scientific literature as well as case studies anal-ysis of the European Union research on risk with regard to IWRM served for the assessment of challenges related to the risk and uncertainty estimation in water management.
EKONOMIA I ŚRODOWISKO 2 (69) • 2019 Environmental policy and management 93
An overview of EU research on risk in water management
Uncertainty and risk are reflected in water management. Uncertainty in water management should be classified as objective uncertainty. Risks in water management are associated with hazard, exposure and vulnerability (European Commission, 2008). The risk is also usually defined through the hazard and the failure. Where the hazard is the probability of occurrence of a particular phenomenon and the failure is the resistance of a particular struc-ture to the analyzed hazard at the assumed level. Particular emphasis has been placed on the need to conduct research on both physical processes in water management, their impact on the ecological functioning of water resources and uncertainty management approaches (European Commission, 2008) as they impact the hazard.
The risk in water management according to Judith Rees (2002) can be classified into two main categories: water supply risk and economic risk. The first category takes into account security of provision of needed quantity and quality of water, what is related with environment pollution and extreme weather and climatic events. The category of economic risk encompasses market related risk, linked to political and legal risk, imperfections in opera-tion, financing losses, etc. Despite the apparent separation of these catego-ries, they are closely related. For example, misrepresenting the law may pose a risk to water supply. In this case, risk management must be based on knowl-edge of technical conditions and technologies, and both should be taken into account in the decision-making process.
A different classification distinguishes: physical risk associated with water quality and extreme phenomena, such as floods or droughts as well as management risk that takes into account the broader social and economic context.
Particularly, flood risk is understood as a combination of probability of flooding and potential negative consequences for human health, the environ-ment, cultural heritage and economic activity (Directive 2007/60/EC). The Water Framework Directive (Directive 2000/60/EC) introduces the notion of the risk of failing to meet its environmental objectives.
In the NeWater project (New Approaches to Adaptive Water Management under Uncertainty (New Approaches…, 2009)) a concept of water manage-ment that also takes into account local conditions and climate change was developed. The project looked for common factors determining the level of preparation for Integrated Water Resources Management in the selected pilot catchments. It was observed that sectoral segmentation with regard to risk management does not adequately inform the analysis in other areas of the economy, leading to ineffectiveness and inadequacy of measures taken to
EKONOMIA I ŚRODOWISKO 2 (69) • 2019Environmental policy and management94
reduce the occurrence of unfavourable events. Therefore the need for imple-mentation of a comprehensive approach in the risk reduction process and in planning in water management was highlighted. The important project con-tribution was the conceptualization of the Adaptive Integrated Water Resources Management that found its application in the next generation studies on risk (e.g. IIASA and Zurich Insurance, 2015) and led to the devel-opment of the risk assessment and mapping guidelines (European Commis-sion, 2010) and the risk assessment framework (IPCC, 2014).
Risk and its allocation are affected by a wide range of operational deci-sions and practices, which are not always closely and directly related to the threats posed by direct water management (New Approaches…, 2009). These include, inter alia, local environmental, social and economic conditions, legal aspects, fees and funding, and the structure and condition of organizations responsible for water management. So, risk management in water manage-ment is a problem that cannot be analyzed and solved in a mere technical way. Planning and management in water management, despite improve-ments in techniques and tools, is still subject to a high level of uncertainty and risk (Walczykiewicz, 2006). This is primarily due to the complexity of these processes and the need to take into account not only the environmental aspects, but also social and economic issues.
Research methods
The paper presents review of scientific papers on risk and risk manage-ment as well as it presents the results of the various studies analysis on the risk estimation approaches in the scope of the European Union research. Based on that the risk and uncertainty in water management are analysed and the results show the risk estimation approach that allows to include them in a rigorous way in the decision making in water management accord-ing to the Integrated Water Resources Management (IWRM) principles.
Results of risk studies review
Water resources are in close relation with global change factors, which include climate, spatial development and population with its growing needs. By analyzing the research conducted in this field, studies on risk can be clas-sified into two main groups corresponding to one of the risk classifications:• studies on physical risks associated with extreme occurrences, such as:
floods and droughts, water scarcity and water quality hazards,
EKONOMIA I ŚRODOWISKO 2 (69) • 2019 Environmental policy and management 95
• research on the risk of management taking into account the social and economic context.In the first group of physical risk studies aspects of potential climate
change (Wilby et al., 2009) and the need to include them in risk analysis are particularly highlighted. In this case, threats to the water management objec-tives and variants of climate scenarios are assessed. Particular importance in such studies has the definition of good hydromorphological status of waters, where quantitative aspects are closely related to climate change. Many Mem-ber States of the European Union, while implementing the provisions of the Water Framework Directive, simultaneously consider the possibility of revis-ing the previously established reference conditions for surface water. This is primarily due to the deterioration of their quantitative status as a result of climate change and as a consequence of the increased risk of failing to meet the objectives of the Directive. Research is being conducted examining the uncertainties surrounding the relationship between hydromorphological status and the quality of water-dependent ecosystems. The challenges for this kind of analysis include the availability and use of appropriate quality forecasts from different sectors and levels of development as well as integra-tion of the available forecast results due to the different methods of develop-ment, different time horizons, various spatial scales of studies and transfer of forecasts for specific catchment areas. An important aspect is the search for solutions that allow for the broadest range of factors to be taken into account in the conducted analyzes. Hence there is a need to build databases that take them into account.
The second group of research studies on management risk in the context of this paper is of particular importance, because now water management goes far beyond technical considerations and includes social and economic development and forecasting in these areas. Studies in this group concern, among others, factors affecting good management, such as: water resources and water-dependent ecosystems, the legal responsibility for allocating resources, technical infrastructure related to existing water infrastructure and effective hazard management (Pegram et al., 2009). Moreover, also good governance is in focus of the social studies, which highlight: predictable, open and transparent water policy, professional and adequate to the public inter-est activities of the water management services as well as strong social sup-port and participation in the management process.
An example of research on uncertainties and risks in water management provides the Texas Water Development Board. The Texas Plan includes 4,500 local water management strategies to meet water needs in the next 50 years (TWDB, 2008). In connection with the plan, a decision has also been made by the Board to carry out risk research, which should take into account the
EKONOMIA I ŚRODOWISKO 2 (69) • 2019Environmental policy and management96
uncertainties associated with climate change, the financing of tasks, the dynamics of population change and the variability of water needs.
The NeWater project (New Approaches…, 2009) also discussed the issue of uncertainty and risk and it made classification of three types of uncer-tainty in water management: the unpredictability of certain phenomena, incomplete knowledge and different interpretations of phenomena. In the concept of Adaptive Water Management for each type of uncertainty, specific impact strategies should be proposed. For example, the uncertainty associ-ated with incomplete knowledge should be limited by: establishing confi-dence thresholds and uncertainty intervals, conducting research that broad-ens the knowledge of specific problems, using models designed for this pur-pose, consulting experts, improving communication and cooperation between researchers and decision-makers.
In case of unpredictability of certain phenomena, an important strategy according to the authors of the NeWater project is acceptance of the state of “lack of knowledge and certainty”. Consequently, Adaptive Water Manage-ment should be defined as a systematic process of improving management by analyzing the effects of implemented water strategies. The IWRM will not be realised without flexible verification conducted on their basis.
Key factors influencing adaptation to climate change should also be taken into account in the risk analysis. They include proper water management, which should be based on, inter alia, broad, well-established knowledge, active public participation, political will and the cooperation of all parties involved in the process.
To sum up, in order to take into account in the risk analysis a broad range of factors, which is necessary to properly inform the IWRM, there is a need to build extensive databases and analyse relevant future scenarios. Risk manage-ment in water management in the contemporary world is an issue that can not be analyzed and solved solely in a technical way, in isolation from other factors, including social and economic ones. Therefore, the decision-making approaches and frameworks are being developed to account for that.
Results of risk estimation approaches comparison
The analysis of spatial and temporal risk distributions is important for IWRM. The spatial and temporal cohesion are two basic components that determine risk variability (Simonovic, 2009). Depending on the nature of the analysis, the risk may be expressed by probability, membership function determined according to fuzzy set theory, or other mathematical formulas. The risk determined by the probability is used, inter alia, to assess the func-tioning of water supply systems. Whereas, the fuzzy sets theory can be uti-
EKONOMIA I ŚRODOWISKO 2 (69) • 2019 Environmental policy and management 97
lised for the analysis of a flood wave control with the use of a retention reser-voir, when the overlap of main river and tributary flows is considered (Żelaziński, 2000).
In the study of IMGW (IMGW, 2012) the water-economic balance models are used to quantify risk in the IWRM. Mathematical models of water balanc-ing are an attempt to describe in detail the processes associated with the cycle of water circulation in the environment, determine the interrelation-ships and relationships between them, as well as determine forms of quanti-fication of quantities characteristic for the assessment of the quantitative and qualitative status of water resources. They are tools useful in analyzes related to the assessment of water status, both in real time and in the future perspective, for instance informing the planned activities. For this reason, they can be useful in making decisions regarding the directions of develop-ment and activities in water management in a particular catchment. At pres-ent, a very large number of mathematical models related to water balancing, with varying degrees of detail (depending on the purpose) are used in the world. They are used both by entities responsible for water resources man-agement and administration in the current statutory work, as well as by sci-entific units for research purposes.
Following the water-economic balance models the risk can be calculated with the use of the following formula:
R = RH × RE × RV, (1)where:R – risk,RH – measure of hazard,RE – measure of exposure,RV – measure of vulnerability, including the coping capacity.
The collection of physical, economic, social and environmental factors increase the vulnerability of certain areas and communities to the threat. The coping capacity, represents the existing resources that can be used in the event of a threat. Such approach to risk quantification is recommended by the European Commission (2010) and has been applied in several studies in Poland such as: MPA44 project, Dumieński et al. (2018).
In the case of floods, the simplified formula for calculating risk can be used as follows:
R = P × S, (2)where:R – risk expressed in losses per unit time,P – probability of adverse events,S – losses.
EKONOMIA I ŚRODOWISKO 2 (69) • 2019Environmental policy and management98
In the study of IMGW (IMGW, 2012) the following pilot catchments were selected with the adequate, case study related, models assigned.• In the Orla and Sanna drainage basins that are intensively used for farm-
ing the SWAT model was used. It is a catchment model for predicting the impact of changes in the management of the basin on: water balance, degree of erosion, pollution of nitrogen and phosphorus compounds, pesticides, bacteria, and heavy metals. The model is intended mainly for typical agricultural catchments, as it has well-developed elements related to: the growth cycle of the crop and the resulting uptake of water and biogenic compounds, agricultural practices and water management (irri-gation and drainage).
• In the Biała Tarnowska basin the co-existence of Natura 2000 areas with areas used for agriculture and industry located in the city of Tarnów was studied. In this case the MIKE BASIN model with the Water Quality and Load Calculator extension was used to simulate water quality. The MIKE BASIN model provides a mathematical representation of the catchment, including the configuration of main rivers and their tributaries, hydrol-ogy of the catchment in time and space, and all forms of water use exist-ing in the basin (i.e. water abstraction, sewage discharges, water reser-voirs, etc.). The model makes it possible to conduct quantitative and qualitative balance analyzes in the river basin for a period of many years. After defining the required structures and data sets, it simulates system operation based on mass balance.
• In the Wełna catchment with a lot of lakes and ponds the MIKE BASIN and MODSIM models were used. The MODSIM is a comprehensive decision support system for integrated surface and groundwater management, including water quality. Its extension GEO-MODSIM use of the GIS envi-ronment to facilitate the construction of a river network and the spatial location of objects included in the balance calculations.
• In the Supraśl case impacts related to the proximity of the city of Białystok and the water transfer from the Siemianówka reservoir were studied with the use of the MIKE BASIN and MODSIM models.
• The Koprzywianka catchment was used for comparative purposes and to test mutual data supply models MIKE SHE, MIKE BASIN–NAM and SWAT. The MIKE SHE is an integrated system modeling of the water cycle in nature, including all soil phases of the hydrological cycle. This model is widely used, among others for analysis, planning and management of water and environmental resources and for supporting solving ecological problems related to surface and underground waters. It is a three-dimen-sional model that allows simulation of all major processes of the hydro-logical cycle, including: rainfall, evapotranspiration, processes taking
EKONOMIA I ŚRODOWISKO 2 (69) • 2019 Environmental policy and management 99
place on the surface (such as retention and runoff), processes occurring in surface and underground waters as well as spatial processes of ground-water flow. Imposing anthropogenic interactions on the natural cycle (e.g. water intakes, land development, drainage, drainage, pollution sources, etc.) allows for a comprehensive analysis of the water cycle in the environment.Calculation of risk in the mentioned studies included factors stimulating
risk (average rainfall and average landfall in standardized values, share of lakes and reservoirs in the SCWP area [%], share of forests in the SCWP area [%], long-term average flow in the main stream closing the SCWP section [m3/s]) and factors de-stimulating risk (water use in industry, in agriculture, by households [dam3/year], share of Natura 2000 sites in the total SCWP area [%], share of arable area in the total SCWP area [%], density of water network [m/ha] under the assumption that the more dense the water net-work the quicker the outflow from the basin and lower accumulation of underground waters).
Different needs related to risk assessment, different levels of detail and approaches to calculate and visualize risk depend on the available and needed information about risk, e.g. what information is needed, for what pur-poses, how fast and how frequent it is necessary, etc. For different purposes, e.g. strategic, tactic, operational planning, the different kinds of risk analyses are needed. For example tools, such as MeteoGIS, help to monitor the follow-ing meteorological values: precipitation intensity, precipitation sum, precipi-tation type, temperature, wind speed and direction, and atmospheric dis-charges, with one kilometer spatial resolution of data and temporal resolu-tion of ten minutes. The users of the system are, for example, government administration employees (Security and Crisis Management Departments). For the development of strategies climate and weather related risks are pre-sented on the maps, e.g. spatial distribution of flood hazard and flood risk is depicted on the maps. Graphs presenting the probability distributions are often used. Also, Average Annual Damage functions are promoted to be calcu-lated and analyzed (KZGW, 2013).
All the mentioned approaches to the risk estimation and the modelling efforts are used to better communicate risk and support the risk manage-ment process.
EKONOMIA I ŚRODOWISKO 2 (69) • 2019Environmental policy and management100
Conclusions
The conducted review of scientific literature as well as case studies anal-ysis of the European Union research on risk with regard to IWRM serves for the assessment of challenges related to the risk and uncertainty estimation in water management. The analysis that have been carried out shows that:1) Depending on the available data and the purpose of the risk analysis dif-
ferent approaches to risk estimation and presentation are most adequate, so the variety of methods and approaches reflects the complexity of the matter. However, in order to take into account in the risk analysis a broad range of factors, which is necessary to properly inform the IWRM, there is a need to build extensive databases and analyse relevant future scenar-ios.
2) Risk management in water management in the contemporary world is an issue that can not be analyzed and solved solely in a technical way, in isolation from the socio-economic environment. Therefore, the deci-sion-making approaches and frameworks that will be developed in the future should account for this even more precisely and rigorously then the contemporary ones.
3) The research material on risk in water management is rich, but does not contain specific proposals for risk quantification in water management, including the risk in the IWRM. Decision-makers have the right to expect specific algorithms and methods to take decisions that account for risk and its distribution over time and space.
4) From the point of view of decision makers, it is particularly important to be able to graphically present risks in the form of appropriate maps or graphs. More and more widely used Geographical Information Systems allow for the spatial classification and hierarchy of objects at risk depend-ing on its size.
5) The visualization of risk can be improved through the application of more precise tools fed by the better quality data obtained from established wide monitoring networks and unified system of damage and loss report-ing on a country-wide scale.
6) The identified knowledge gaps in risk estimation are related to the uncer-tainties of modelling, future climate change and socio-economic develop-ment.The future studies need to focus on improved integration of physical and
socio-economic factors to better inform decision-making processes in vari-ous scales.
EKONOMIA I ŚRODOWISKO 2 (69) • 2019 Environmental policy and management 101
The contribution of the authors
Both Authors participated equally in conception, development, literature review, acquisition of data, analysis and interpretation of data.
Literature
Directive 2000/60/EC of the European Parliament and of the Council of the European Communities of 23 October 2000 establishing a framework for Community action in the field of water policy, Official Journal of the European Union, Brussels
Directive 2007/60/EC of the European Parliament and of the Council of 23 October 2007 on flood risk assessment and management, Official Journal of the European Union, Brussels
Dumieński G. et al. (2018), Preliminary research on adaptability of municipalities in the subbasin of Nysa Kłodzka using multidimensional comparative analysis, ITM Web of Conferences 23, 00008 (2018), XLVIII Seminar of Applied Mathematics
European Commission (2008), Discussion Paper for the Water Directors Meeting in Slovenia on Climate Change and Water, European Commission, Brussels
European Commission (2010), Risk Assessment and Mapping Guidelines for Disaster Management, Brussels, SEC(2010) 1626 final
Hubbard D. (2007), How to Measure Anything: Finding the Value of Intangibles in Busi-ness, John Wiley & Sons
IIASA and Zurich Insurance (2015), Turning knowledge into action: processes and tools for increasing flood resilience, Zurich, Switzerland
IMGW (2005), Analysis of planning conditions in water management in the light of the current and planned legal system for the implementation of the WFD in Poland, IMGW, Kraków
IMGW (2012), Wpływ zmian klimatu na środowisko, gospodarkę i społeczeństwo (zmi-any, skutki i sposoby ich ograniczania, wnioski dla nauki, praktyki inżynierskiej i planowania gospodarczego), projekt realizowany na podstawie umowy o dofi-nansowanie nr POIG.01.03.01-14-011/08-00 z dnia 1 grudnia 2008 r. w ramach Programu Operacyjnego Innowacyjna Gospodarka, Projekt 1, Działanie 1.3, Pod-działanie 1.3.1.
IPCC (2014), AR5 Climate Change: Impacts, Adaptation and Vulnerability, Cambridge University Press
KZGW (2013), Metodyka opracowania planów zarządzania ryzykiem powodziowym dla obszarów dorzeczy i regionów wodnych, KZGW, Warszawa
New Approaches to Adaptive Water Management under Uncertainty (2009), NeWater Results Brochure Pelzverlag, Freiburg
Pegram G., Orr S., Williams Ch. (2009), Investigating Shared Risk in Water: Corporate Engagement with Public Policy Process, WWF-UK
Rees A.J. (2002), Risk and Integrated Water Management, Global Water Partnership, Technical Committee, Stockholm
Simonovic S. (2009), A new method for spatial and temporal analysis of risk in water resources management, “Journal of Hydroinformatics” Vol. 11, No. 3-4, IWA Pub-lishing, London, pp. 320-329

EKONOMIA I ŚRODOWISKO 2 (69) • 2019Environmental policy and management102
TWDB (2008), Strategic Plan for Fiscal Year 2009-2013, Texas Water Development Board
Walczykiewicz T. (ed.) (2006), Selected planning problems in water management in the light of the Water Framework Directive 2000/60/EC, IMGW, Warsaw
Wilby L.R. et al. (2009), Risks posed by Climate Change to the delivery of the Water Framework Directive in the UK, “Environment International” Vol. 32 Issue 8, pp. 1043-1055
Żelaziński J. (2000), Uncertainty in Water Management in Risk in Water Management, Group work under the direction of Maciejewski M., Publishing House of the War-saw University of Technology, Warsaw, pp. 17-44
Ekonomia i Środowisko 2 (69) • 2019
Economics and Environment 2 (69) • 2019
STUDIES AND MATERIALS
STUDIA I MATERIAŁY
EKONOMIA I ŚRODOWISKO • 2 (69) • 2019
ABSTRACT: Manor-house parks are an important part of natural and cultural landscape of Polish coun-tryside. While sites designated as historical do enjoy an elevated “social” status, this does not always translate into its monetary market value. Own research shows large price discrepancies in property appraisal reports for the same real estate. The discrepancies were related to valuation of vegetation (Rosłon-Szeryńska, 2018). Even though there are many methods and techniques of appraisal (includ-ing: profit-, market-, cost-oriented or mixed) available in specific legal acts and standards, apprising vegetation is still problematic. The goal of this research is to evaluate reasons behind these glaring discrepancies in appraisal of manor-house and park complexes in rural communes. Research included an analysis of current market prices of 100 historical real estates comprised of a manor-house and a park from all over the country. Regression analysis proves that the share of park’s value in the overall historical real estate price is too low. This particularly applies to parks with an area of less than 5 ha.
KEY WORDS: manor-house parks, historical parks, valuation of parks, valuation of plants
Edyta Rosłon-Szeryńska, PhD (ORCID: 0000-0003-0191-7999) – Warsaw University of Life SciencesJan Łukaszkiewicz, PhD (ORCID: 0000-0001-9574-7120) – Warsaw University of Life SciencesBeata Fortuna-Antoszkiewicz, PhD (ORCID: 0000-0002-5004-2124) – Warsaw University of Life Sciences
Correspondence address:Nowoursynowska Street 159, 02-776, Warsaw, Polande-mail: [email protected]
Edyta ROSŁON-SZERYŃSKA • Jan ŁUKASZKIEWICZ • Beata FORTUNA-ANTOSZKIEWICZ
THE PROBLEM WITH THE VALUATION OF PARKS IN HISTORICAL MANOR-HOUSES IN RURAL AREAS IN POLAND
JEL: Q57, R33No. 2(69) 2019 • pages: 104-116 https://doi.org/10.34659/2019/2/24
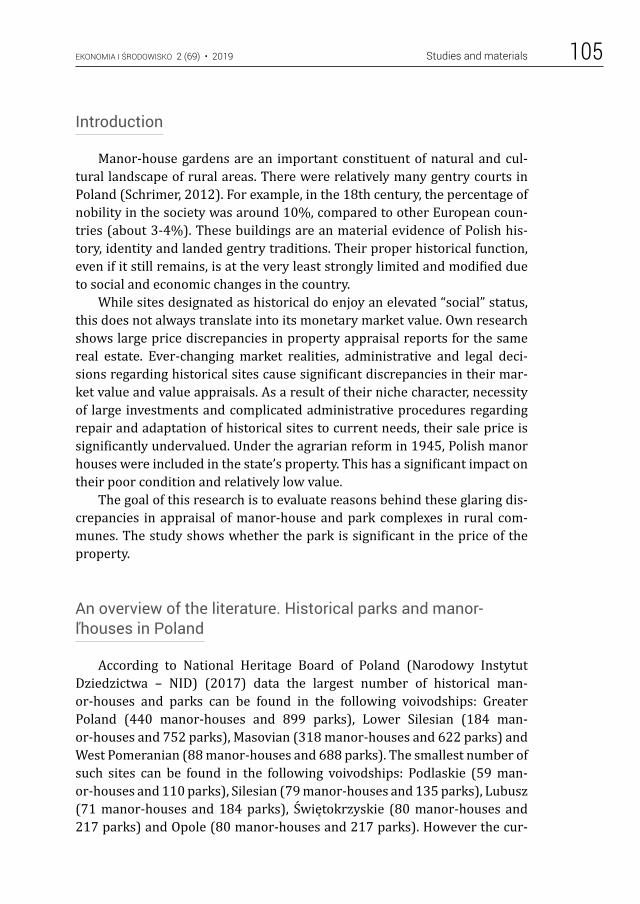
EKONOMIA I ŚRODOWISKO 2 (69) • 2019 Studies and materials 105
Introduction
Manor-house gardens are an important constituent of natural and cul-tural landscape of rural areas. There were relatively many gentry courts in Poland (Schrimer, 2012). For example, in the 18th century, the percentage of nobility in the society was around 10%, compared to other European coun-tries (about 3-4%). These buildings are an material evidence of Polish his-tory, identity and landed gentry traditions. Their proper historical function, even if it still remains, is at the very least strongly limited and modified due to social and economic changes in the country.
While sites designated as historical do enjoy an elevated “social” status, this does not always translate into its monetary market value. Own research shows large price discrepancies in property appraisal reports for the same real estate. Ever-changing market realities, administrative and legal deci-sions regarding historical sites cause significant discrepancies in their mar-ket value and value appraisals. As a result of their niche character, necessity of large investments and complicated administrative procedures regarding repair and adaptation of historical sites to current needs, their sale price is significantly undervalued. Under the agrarian reform in 1945, Polish manor houses were included in the state’s property. This has a significant impact on their poor condition and relatively low value.
The goal of this research is to evaluate reasons behind these glaring dis-crepancies in appraisal of manor-house and park complexes in rural com-munes. The study shows whether the park is significant in the price of the property.
An overview of the literature. Historical parks and manor-ľhouses in Poland
According to National Heritage Board of Poland (Narodowy Instytut Dziedzictwa – NID) (2017) data the largest number of historical man-or-houses and parks can be found in the following voivodships: Greater Poland (440 manor-houses and 899 parks), Lower Silesian (184 man-or-houses and 752 parks), Masovian (318 manor-houses and 622 parks) and West Pomeranian (88 manor-houses and 688 parks). The smallest number of such sites can be found in the following voivodships: Podlaskie (59 man-or-houses and 110 parks), Silesian (79 manor-houses and 135 parks), Lubusz (71 manor-houses and 184 parks), Świętokrzyskie (80 manor-houses and 217 parks) and Opole (80 manor-houses and 217 parks). However the cur-
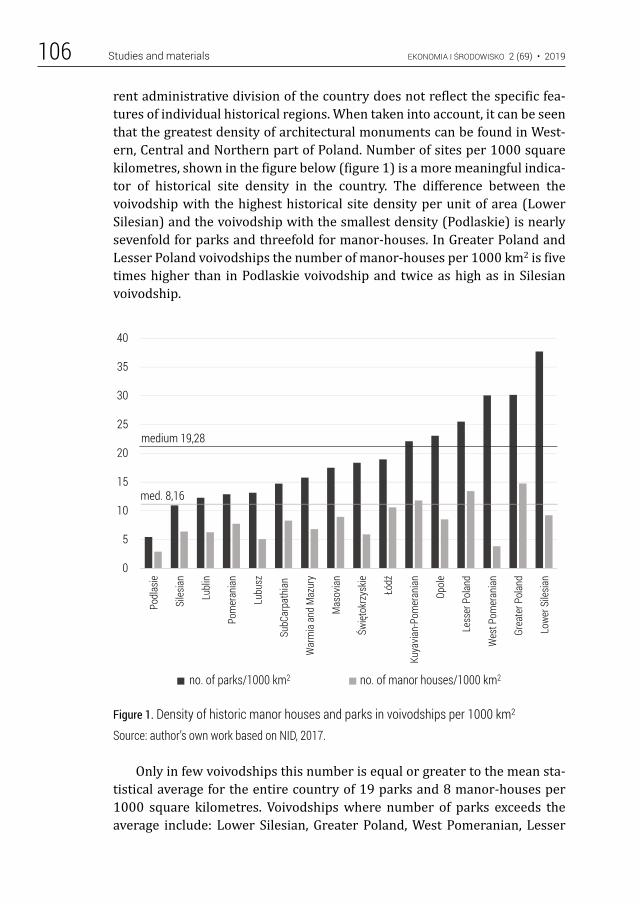
EKONOMIA I ŚRODOWISKO 2 (69) • 2019Studies and materials106
rent administrative division of the country does not reflect the specific fea-tures of individual historical regions. When taken into account, it can be seen that the greatest density of architectural monuments can be found in West-ern, Central and Northern part of Poland. Number of sites per 1000 square kilometres, shown in the figure below (figure 1) is a more meaningful indica-tor of historical site density in the country. The difference between the voivodship with the highest historical site density per unit of area (Lower Silesian) and the voivodship with the smallest density (Podlaskie) is nearly sevenfold for parks and threefold for manor-houses. In Greater Poland and Lesser Poland voivodships the number of manor-houses per 1000 km2 is five times higher than in Podlaskie voivodship and twice as high as in Silesian voivodship.
Figure 1. Density of historic manor houses and parks in voivodships per 1000 km2
Source: author’s own work based on NID, 2017.
Only in few voivodships this number is equal or greater to the mean sta-tistical average for the entire country of 19 parks and 8 manor-houses per 1000 square kilometres. Voivodships where number of parks exceeds the average include: Lower Silesian, Greater Poland, West Pomeranian, Lesser
F1
0
5
10
15
20
25
30
35
40
Podl
asie
Siles
ian
Lubl
in
Pom
eran
ian
Lubu
sz
SubC
arpa
thia
n
War
mia
and
Maz
ury
Mas
ovia
n
Święt
okrz
yskie
Łódź
Kuya
vian-
Pom
eran
ian
Opol
e
Less
er P
olan
d
Wes
t Pom
eran
ian
Grea
ter P
olan
d
Lowe
r Sile
sian
no.of parks/1000km2 no. of manor houses/1000km2
med. 8,16
medium 19,28
no. of parks/1000 km2 no. of manor houses/1000 km2
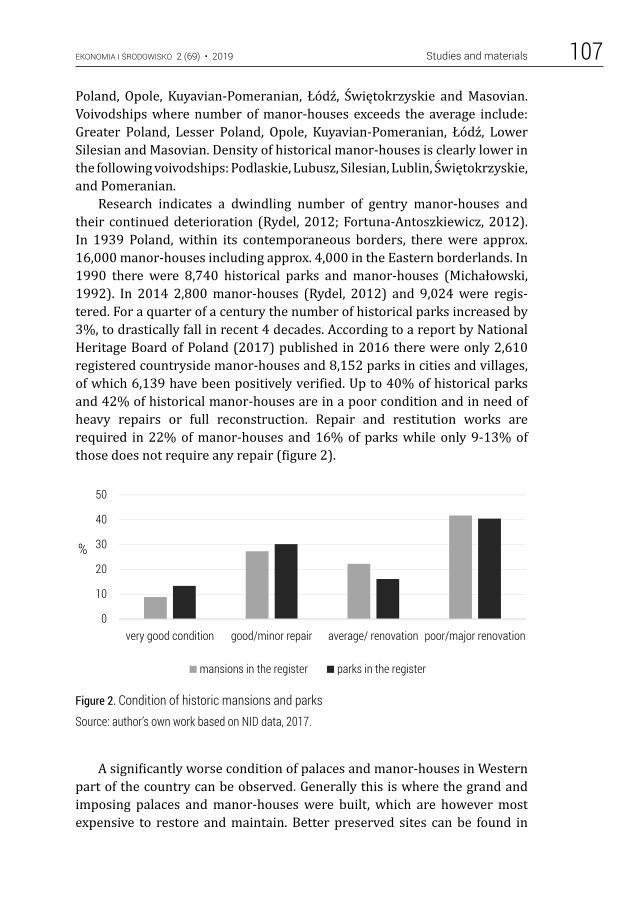
EKONOMIA I ŚRODOWISKO 2 (69) • 2019 Studies and materials 107
Poland, Opole, Kuyavian-Pomeranian, Łódź, Świętokrzyskie and Masovian. Voivodships where number of manor-houses exceeds the average include: Greater Poland, Lesser Poland, Opole, Kuyavian-Pomeranian, Łódź, Lower Silesian and Masovian. Density of historical manor-houses is clearly lower in the following voivodships: Podlaskie, Lubusz, Silesian, Lublin, Świętokrzyskie, and Pomeranian.
Research indicates a dwindling number of gentry manor-houses and their continued deterioration (Rydel, 2012; Fortuna-Antoszkiewicz, 2012). In 1939 Poland, within its contemporaneous borders, there were approx. 16,000 manor-houses including approx. 4,000 in the Eastern borderlands. In 1990 there were 8,740 historical parks and manor-houses (Michałowski, 1992). In 2014 2,800 manor-houses (Rydel, 2012) and 9,024 were regis-tered. For a quarter of a century the number of historical parks increased by 3%, to drastically fall in recent 4 decades. According to a report by National Heritage Board of Poland (2017) published in 2016 there were only 2,610 registered countryside manor-houses and 8,152 parks in cities and villages, of which 6,139 have been positively verified. Up to 40% of historical parks and 42% of historical manor-houses are in a poor condition and in need of heavy repairs or full reconstruction. Repair and restitution works are required in 22% of manor-houses and 16% of parks while only 9-13% of those does not require any repair (figure 2).
Figure 2. Condition of historic mansions and parksSource: author’s own work based on NID data, 2017.
A significantly worse condition of palaces and manor-houses in Western part of the country can be observed. Generally this is where the grand and imposing palaces and manor-houses were built, which are however most expensive to restore and maintain. Better preserved sites can be found in
F2
0
10
20
30
40
50
very good condition good/minor repair average/ renovation poor/major renovation
%
mansions in the register parks in the register
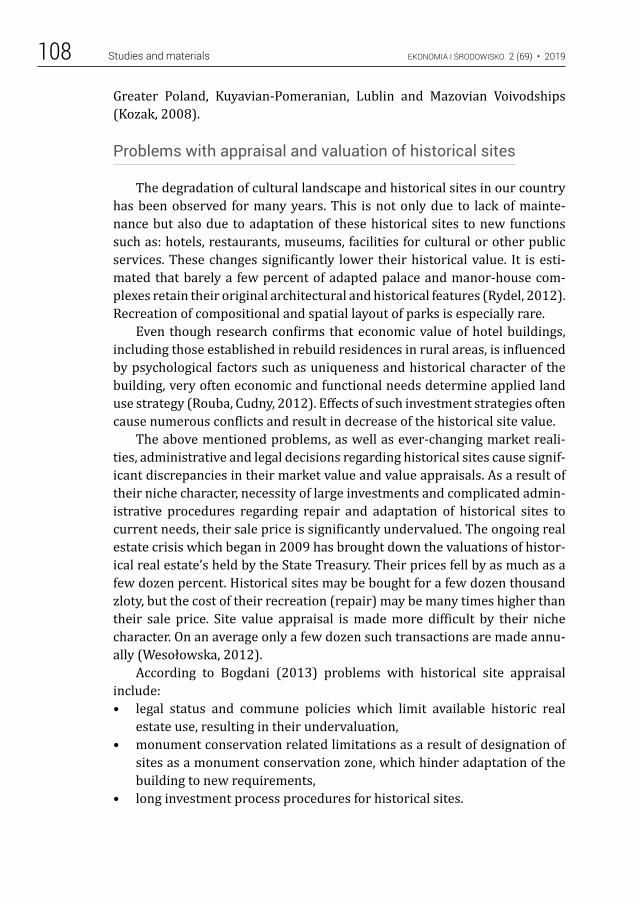
EKONOMIA I ŚRODOWISKO 2 (69) • 2019Studies and materials108
Greater Poland, Kuyavian-Pomeranian, Lublin and Mazovian Voivodships (Kozak, 2008).
Problems with appraisal and valuation of historical sites
The degradation of cultural landscape and historical sites in our country has been observed for many years. This is not only due to lack of mainte-nance but also due to adaptation of these historical sites to new functions such as: hotels, restaurants, museums, facilities for cultural or other public services. These changes significantly lower their historical value. It is esti-mated that barely a few percent of adapted palace and manor-house com-plexes retain their original architectural and historical features (Rydel, 2012). Recreation of compositional and spatial layout of parks is especially rare.
Even though research confirms that economic value of hotel buildings, including those established in rebuild residences in rural areas, is influenced by psychological factors such as uniqueness and historical character of the building, very often economic and functional needs determine applied land use strategy (Rouba, Cudny, 2012). Effects of such investment strategies often cause numerous conflicts and result in decrease of the historical site value.
The above mentioned problems, as well as ever-changing market reali-ties, administrative and legal decisions regarding historical sites cause signif-icant discrepancies in their market value and value appraisals. As a result of their niche character, necessity of large investments and complicated admin-istrative procedures regarding repair and adaptation of historical sites to current needs, their sale price is significantly undervalued. The ongoing real estate crisis which began in 2009 has brought down the valuations of histor-ical real estate’s held by the State Treasury. Their prices fell by as much as a few dozen percent. Historical sites may be bought for a few dozen thousand zloty, but the cost of their recreation (repair) may be many times higher than their sale price. Site value appraisal is made more difficult by their niche character. On an average only a few dozen such transactions are made annu-ally (Wesołowska, 2012).
According to Bogdani (2013) problems with historical site appraisal include:• legal status and commune policies which limit available historic real
estate use, resulting in their undervaluation,• monument conservation related limitations as a result of designation of
sites as a monument conservation zone, which hinder adaptation of the building to new requirements,
• long investment process procedures for historical sites.
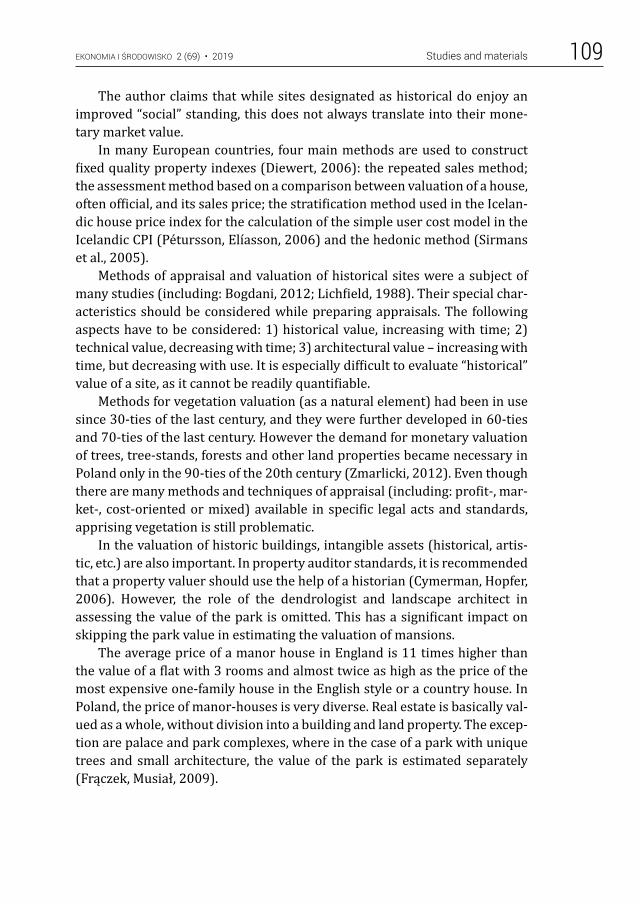
EKONOMIA I ŚRODOWISKO 2 (69) • 2019 Studies and materials 109
The author claims that while sites designated as historical do enjoy an improved “social” standing, this does not always translate into their mone-tary market value.
In many European countries, four main methods are used to construct fixed quality property indexes (Diewert, 2006): the repeated sales method; the assessment method based on a comparison between valuation of a house, often official, and its sales price; the stratification method used in the Icelan-dic house price index for the calculation of the simple user cost model in the Icelandic CPI (Pétursson, Elíasson, 2006) and the hedonic method (Sirmans et al., 2005).
Methods of appraisal and valuation of historical sites were a subject of many studies (including: Bogdani, 2012; Lichfield, 1988). Their special char-acteristics should be considered while preparing appraisals. The following aspects have to be considered: 1) historical value, increasing with time; 2) technical value, decreasing with time; 3) architectural value – increasing with time, but decreasing with use. It is especially difficult to evaluate “historical” value of a site, as it cannot be readily quantifiable.
Methods for vegetation valuation (as a natural element) had been in use since 30-ties of the last century, and they were further developed in 60-ties and 70-ties of the last century. However the demand for monetary valuation of trees, tree-stands, forests and other land properties became necessary in Poland only in the 90-ties of the 20th century (Zmarlicki, 2012). Even though there are many methods and techniques of appraisal (including: profit-, mar-ket-, cost-oriented or mixed) available in specific legal acts and standards, apprising vegetation is still problematic.
In the valuation of historic buildings, intangible assets (historical, artis-tic, etc.) are also important. In property auditor standards, it is recommended that a property valuer should use the help of a historian (Cymerman, Hopfer, 2006). However, the role of the dendrologist and landscape architect in assessing the value of the park is omitted. This has a significant impact on skipping the park value in estimating the valuation of mansions.
The average price of a manor house in England is 11 times higher than the value of a flat with 3 rooms and almost twice as high as the price of the most expensive one-family house in the English style or a country house. In Poland, the price of manor-houses is very diverse. Real estate is basically val-ued as a whole, without division into a building and land property. The excep-tion are palace and park complexes, where in the case of a park with unique trees and small architecture, the value of the park is estimated separately (Frączek, Musiał, 2009).
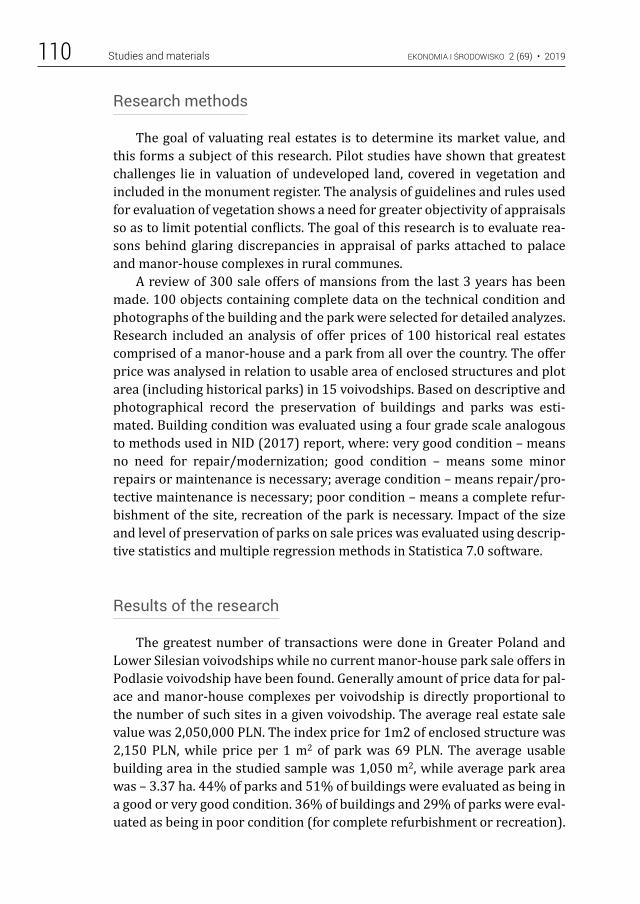
EKONOMIA I ŚRODOWISKO 2 (69) • 2019Studies and materials110
Research methods
The goal of valuating real estates is to determine its market value, and this forms a subject of this research. Pilot studies have shown that greatest challenges lie in valuation of undeveloped land, covered in vegetation and included in the monument register. The analysis of guidelines and rules used for evaluation of vegetation shows a need for greater objectivity of appraisals so as to limit potential conflicts. The goal of this research is to evaluate rea-sons behind glaring discrepancies in appraisal of parks attached to palace and manor-house complexes in rural communes.
A review of 300 sale offers of mansions from the last 3 years has been made. 100 objects containing complete data on the technical condition and photographs of the building and the park were selected for detailed analyzes. Research included an analysis of offer prices of 100 historical real estates comprised of a manor-house and a park from all over the country. The offer price was analysed in relation to usable area of enclosed structures and plot area (including historical parks) in 15 voivodships. Based on descriptive and photographical record the preservation of buildings and parks was esti-mated. Building condition was evaluated using a four grade scale analogous to methods used in NID (2017) report, where: very good condition – means no need for repair/modernization; good condition – means some minor repairs or maintenance is necessary; average condition – means repair/pro-tective maintenance is necessary; poor condition – means a complete refur-bishment of the site, recreation of the park is necessary. Impact of the size and level of preservation of parks on sale prices was evaluated using descrip-tive statistics and multiple regression methods in Statistica 7.0 software.
Results of the research
The greatest number of transactions were done in Greater Poland and Lower Silesian voivodships while no current manor-house park sale offers in Podlasie voivodship have been found. Generally amount of price data for pal-ace and manor-house complexes per voivodship is directly proportional to the number of such sites in a given voivodship. The average real estate sale value was 2,050,000 PLN. The index price for 1m2 of enclosed structure was 2,150 PLN, while price per 1 m2 of park was 69 PLN. The average usable building area in the studied sample was 1,050 m2, while average park area was – 3.37 ha. 44% of parks and 51% of buildings were evaluated as being in a good or very good condition. 36% of buildings and 29% of parks were eval-uated as being in poor condition (for complete refurbishment or recreation).
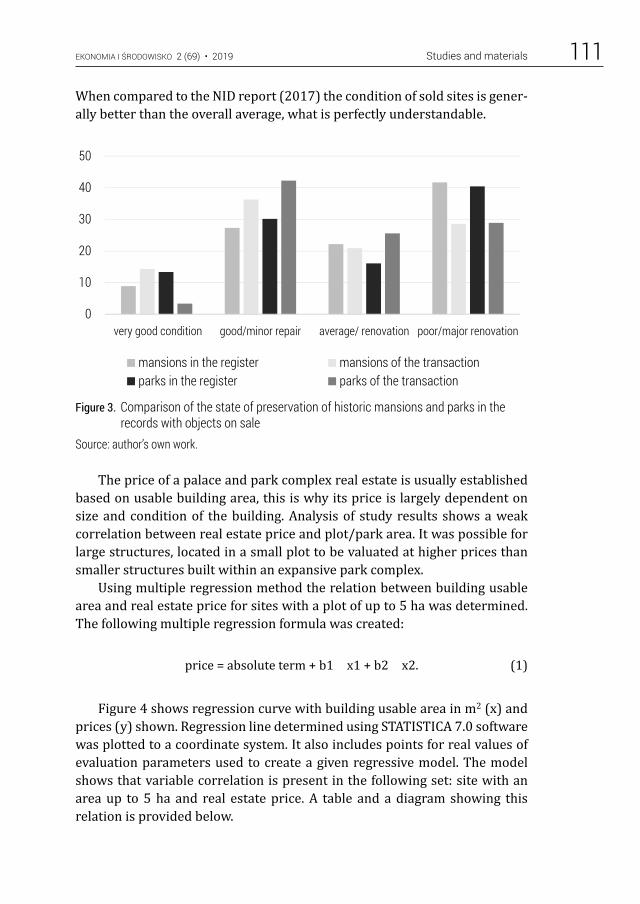
EKONOMIA I ŚRODOWISKO 2 (69) • 2019 Studies and materials 111
When compared to the NID report (2017) the condition of sold sites is gener-ally better than the overall average, what is perfectly understandable.
Figure 3. Comparison of the state of preservation of historic mansions and parks in the records with objects on sale
Source: author’s own work.
The price of a palace and park complex real estate is usually established based on usable building area, this is why its price is largely dependent on size and condition of the building. Analysis of study results shows a weak correlation between real estate price and plot/park area. It was possible for large structures, located in a small plot to be valuated at higher prices than smaller structures built within an expansive park complex.
Using multiple regression method the relation between building usable area and real estate price for sites with a plot of up to 5 ha was determined. The following multiple regression formula was created:
price = absolute term + b1 × x1 + b2 × x2. (1)
Figure 4 shows regression curve with building usable area in m2 (x) and prices (y) shown. Regression line determined using STATISTICA 7.0 software was plotted to a coordinate system. It also includes points for real values of evaluation parameters used to create a given regressive model. The model shows that variable correlation is present in the following set: site with an area up to 5 ha and real estate price. A table and a diagram showing this relation is provided below.
F3
0
10
20
30
40
50
very good condition good/minor repair average/ renovation poor/major renovation
mansions in the register mansions of the transactionparks in the register parks of the transaction
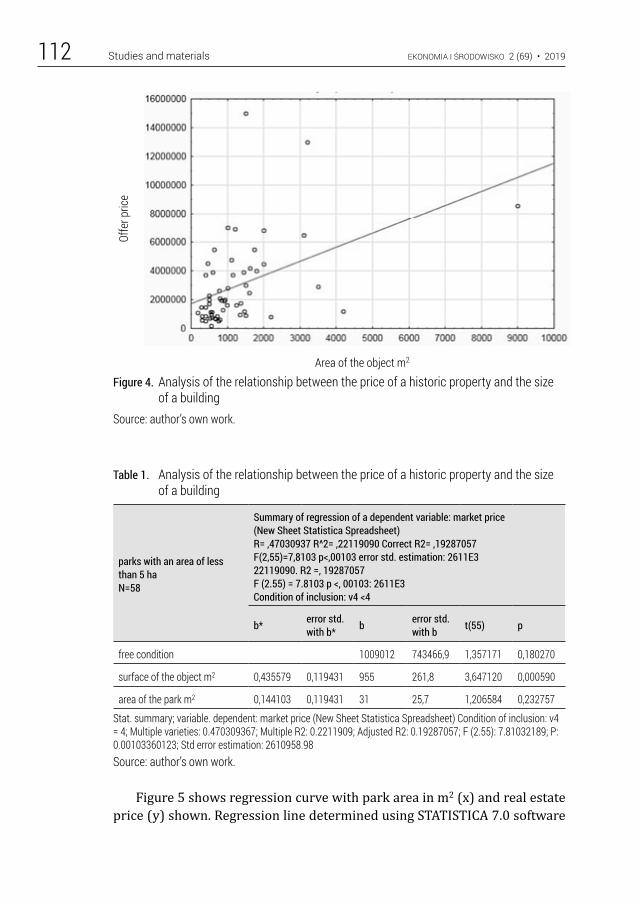
EKONOMIA I ŚRODOWISKO 2 (69) • 2019Studies and materials112
Figure 4. Analysis of the relationship between the price of a historic property and the size of a building
Source: author’s own work.
Table 1. Analysis of the relationship between the price of a historic property and the size of a building
parks with an area of less than 5 haN=58
Summary of regression of a dependent variable: market price (New Sheet Statistica Spreadsheet)R= ,47030937 R^2= ,22119090 Correct R2= ,19287057F(2,55)=7,8103 p<,00103 error std. estimation: 2611E322119090. R2 =, 19287057F (2.55) = 7.8103 p <, 00103: 2611E3Condition of inclusion: v4 <4
b* error std.with b* b error std.
with b t(55) p
free condition 1009012 743466,9 1,357171 0,180270
surface of the object m2 0,435579 0,119431 955 261,8 3,647120 0,000590
area of the park m2 0,144103 0,119431 31 25,7 1,206584 0,232757
Stat. summary; variable. dependent: market price (New Sheet Statistica Spreadsheet) Condition of inclusion: v4 = 4; Multiple varieties: 0.470309367; Multiple R2: 0.2211909; Adjusted R2: 0.19287057; F (2.55): 7.81032189; P: 0.00103360123; Std error estimation: 2610958.98Source: author’s own work.
Figure 5 shows regression curve with park area in m2 (x) and real estate price (y) shown. Regression line determined using STATISTICA 7.0 software
Offe
r pric
e
Area of the object m2
F4
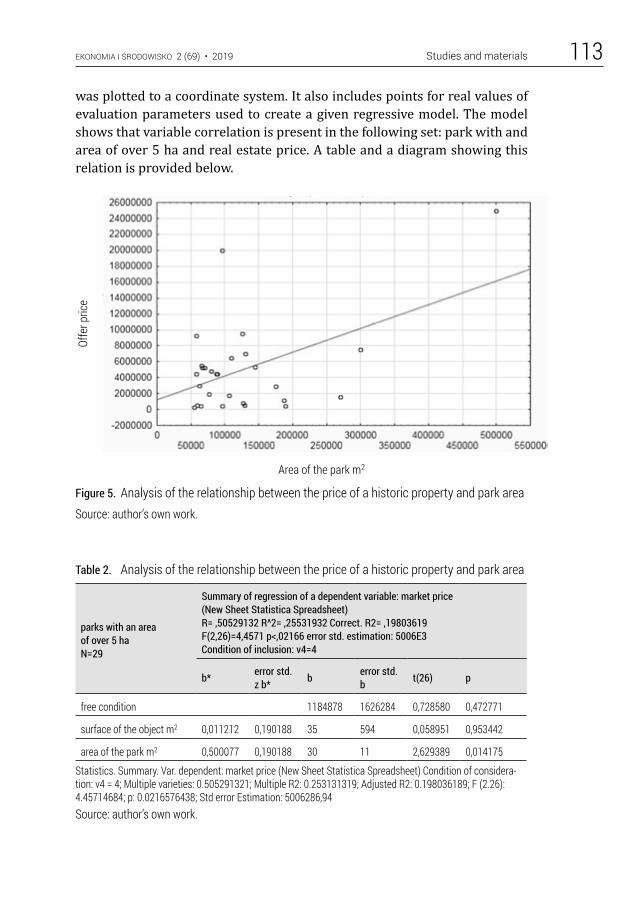
EKONOMIA I ŚRODOWISKO 2 (69) • 2019 Studies and materials 113
was plotted to a coordinate system. It also includes points for real values of evaluation parameters used to create a given regressive model. The model shows that variable correlation is present in the following set: park with and area of over 5 ha and real estate price. A table and a diagram showing this relation is provided below.
Figure 5. Analysis of the relationship between the price of a historic property and park area Source: author’s own work.
Table 2. Analysis of the relationship between the price of a historic property and park area
parks with an area of over 5 haN=29
Summary of regression of a dependent variable: market price (New Sheet Statistica Spreadsheet)R= ,50529132 R^2= ,25531932 Correct. R2= ,19803619F(2,26)=4,4571 p<,02166 error std. estimation: 5006E3Condition of inclusion: v4=4
b* error std.z b* b error std.
b t(26) p
free condition 1184878 1626284 0,728580 0,472771
surface of the object m2 0,011212 0,190188 35 594 0,058951 0,953442
area of the park m2 0,500077 0,190188 30 11 2,629389 0,014175
Statistics. Summary. Var. dependent: market price (New Sheet Statistica Spreadsheet) Condition of considera-tion: v4 = 4; Multiple varieties: 0.505291321; Multiple R2: 0.253131319; Adjusted R2: 0.198036189; F (2.26): 4.45714684; p: 0.0216576438; Std error Estimation: 5006286,94Source: author’s own work.
Offe
r pric
e
Area of the park m2
F5
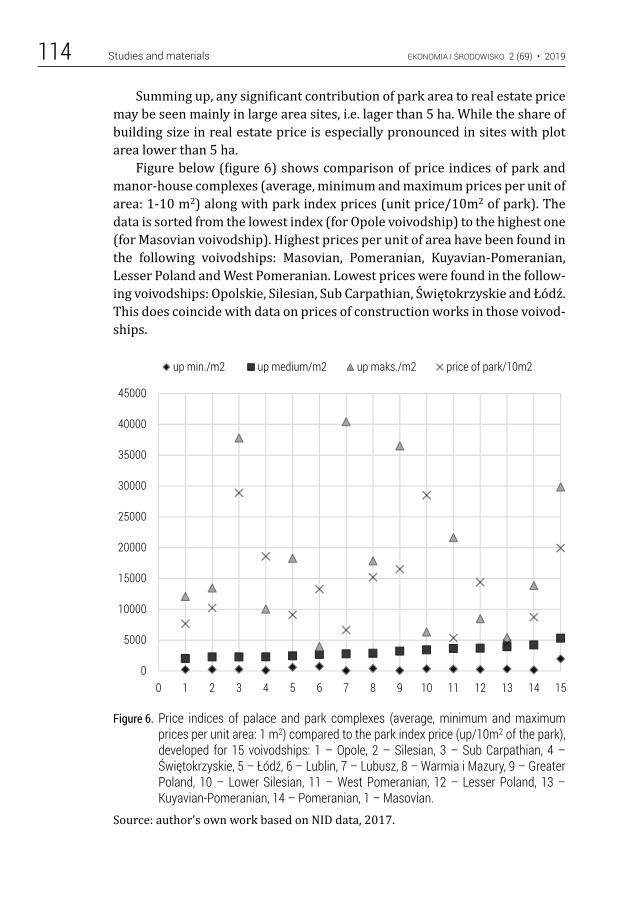
EKONOMIA I ŚRODOWISKO 2 (69) • 2019Studies and materials114
Summing up, any significant contribution of park area to real estate price may be seen mainly in large area sites, i.e. lager than 5 ha. While the share of building size in real estate price is especially pronounced in sites with plot area lower than 5 ha.
Figure below (figure 6) shows comparison of price indices of park and manor-house complexes (average, minimum and maximum prices per unit of area: 1-10 m2) along with park index prices (unit price/10m2 of park). The data is sorted from the lowest index (for Opole voivodship) to the highest one (for Masovian voivodship). Highest prices per unit of area have been found in the following voivodships: Masovian, Pomeranian, Kuyavian-Pomeranian, Lesser Poland and West Pomeranian. Lowest prices were found in the follow-ing voivodships: Opolskie, Silesian, Sub Carpathian, Świętokrzyskie and Łódź. This does coincide with data on prices of construction works in those voivod-ships.
Figure 6. Price indices of palace and park complexes (average, minimum and maximum prices per unit area: 1 m2) compared to the park index price (up/10m2 of the park), developed for 15 voivodships: 1 – Opole, 2 – Silesian, 3 – Sub Carpathian, 4 – Świętokrzyskie, 5 – Łódź, 6 – Lublin, 7 – Lubusz, 8 – Warmia i Mazury, 9 – Greater Poland, 10 – Lower Silesian, 11 – West Pomeranian, 12 – Lesser Poland, 13 – Kuyavian-Pomeranian, 14 – Pomeranian, 1 – Masovian.
Source: author’s own work based on NID data, 2017.
F6
0
5000
10000
15000
20000
25000
30000
35000
40000
45000
0 1 2 3 4 5 6 7 8 9 10 11 12 13 14 15
up min./m2 up medium/m2 up maks./m2 price of park/10m2
EKONOMIA I ŚRODOWISKO 2 (69) • 2019 Studies and materials 115
Conclusions
Landed gentry manor-houses with parks are an important spatial ele-ment of countryside landscapes. Research shows a dwindling number of landed gentry manor-houses and their deteriorating state. Nearly half of the sites require complete refurbishment. Today those sites have already lost their original function, which can result in lost of their historical qualities as well. Adaptation is one of the forms of conservation of palace and man-or-house complexes. However, valuation of such sites, both for selling pur-poses as well as for establishing value of compensation to expropriated own-ers is problematic. The study shows discrepancies in valuation of historic real estates accompanied by park complexes. Price is influenced by, among other, location, building size, plot area, level of building preservation. Valua-tion of vegetation in such sites is also problematic.
In Poland, the price of mansions is very diverse. The real estate is gener-ally valued as a whole without distinction between construction and land. Therefore, the value of the park (especially with a small area) is often under-estimated or neglected in the real estate valuation.
Summing up, any significant contribution of park area to real estate price may be seen mainly in large area sites, i.e. lager than 5 ha. While the share of building size in real estate price is especially pronounced in sites with plot area lower than 5 ha.
Highest prices per unit of area have been found in the following voivod-ships: Masovian, Pomeranian, Kuyavian-Pomeranian, Lesser Poland and West Pomeranian. Lowest prices were found in the following voivodships: Opolskie, Silesian, Subcarpathian, Świętokrzyskie and Łódź. This does coin-cide with data on prices of construction works in those voivodships.
The contribution of the authors
Edyta Rosłon-Szeryńska – 45% (conception, literature review, data acquisition, anal-ysis and interpretation parts of data).
Jan Łukaszkiewicz – 30% (analysis and interpretation parts of data).Beata Fortuna-Antoszkiewicz – 25% (partial review of literature).
Literature
Bogdani M. (2013), Czy zabytek to jest zbytek? Zabytkowa kamienica na rynku nieruch-omości – splendor czy ograniczenie?, in: B. Szmygina (ed.), Wartościowanie zabyt-ków architektury Polski, Komitet Narodowy ICOMOS, Muzeum Pałac w Wilanowie, Warszawa, p. 41-50
EKONOMIA I ŚRODOWISKO 2 (69) • 2019Studies and materials116
Cymerman R., Hopfer A. (2006), Wycena nieruchomości. Zasady i procedury, PFSRM, Warszawa
Fortuna-Antoszkiewicz B., Łukaszkiewicz J. (2012), Wybrane aspekty oddziaływania prac technicznych i zabiegów pielęgnacyjnych na kondycję drzew w parkach zabyt-kowych, in: J. Dolatowski (ed.), LX Rocznik Polskiego Towarzystwa Dendrologicz-nego, Warszawa, p. 77-83
Frączek R., Musiał P. (2009), Problemy inwestowania w nieruchomości zabytkowe, „Świat Nieruchomości”, p. 40-45
Kozak M.W. (2008), Dwory, pałace i zamki – kosztowne pamiątki czy zasób w rozwoju?, „Studia Regionalne i Lokalne” No. 2(32), p. 92-111
Lichfield N. (1988), Economics in urban conservation, Cambridge, p. 167-191Michałowski A. (1992), Parki i ogrody zabytkowe w Polsce. Stan na 1991 rok. in:
A. Michałowski (ed.), Studia i Materiały. Ogrody, Wyd. Zarząd Ochrony i Konser-wacji Zespołów Pałacowo-Ogrodowych, Warszawa
Pétursson T.G., Elíasson L. (2006), The residental housing market in Iceland: Analysing the effects of recent mortage market restructuring, Central Bank of Iceland Work-ing Paper, No. 29, Central Bank of Iceland, Economic Department
Rosłon-Szeryńska E. (2018), Opinia denrologiczna dotycząca zasad przygotowania danych i sposobu wyceny roślinności w operatach szacunkowych wartości nieruch-omości oznaczonej jako działka nr 89/3 o powierzchni 0,0346 ha, położonej w gmi-nie Chlewiska, Typescript for Manor House Sp. z o.o. in Radomsk
Rouba R., Cudny W. (2012), Monitorowanie zabytkowych rezydencji funkcjonujących na rynku usług hotelarskich w Polsce w latach 2002-2011, Ekonomika Dzied-zictwa, p. 183-198
Rydel M. (2012), Dwór-polska tożsamość, Zysk i S-ka, PoznańRozbicka M. (2017), Raport o stanie zachowania zabytków nieruchomych w Polsce.
Zabytki wpisane do rejestru zabytków (księgi rejestru A i C), Narodowy Instytut Dziedzictwa, Warszawa
Schrimer M.K. (2012), Dwory i dworki w II Rzeczpospolitej, Wyd. SBM, WarszawaSirmans G.S., Macpherson D.A., Ziets E.N. (2005), The Composition of Hedonic Pricing
Models, “Journal of Real Estate Literature” No. 1(13), p. 3-43Zmarlicki K. (2012), Określenie wartości plantacji kultur wieloletnich, Polska Feder-
acja Stowarzyszeń Rzeczoznawców Majątkowych, Warszawa
EKONOMIA I ŚRODOWISKO • 2 (69) • 2019
GREEN CITIES IN ASIA – CASE STUDIES
ABSTRACT: The idea of the green city is gaining importance across the world due to the image of cities as well as some economical, social, and especially ecological reasons. The term and praxis of the green city is a material for research and analysis of various science disciplines. We can point out to different specificity of green cities due to their genesis, role of the government and local authorities in development programming, the role of private-public partnership etc.The purpose of the article is to highlight specific elements of development of green cities in Asia on the basis of three case studies and to precise the possible categorization in terms of the mentioned term. The methodology is based on literature review and a study visit. The limitations of the research are related to the current construction of two out of three green cities being analysed. Practical implica-tion of the paper is the issue of the level of activities undertaken to create green cities from scratch or with the use of a smart technology. The problem of green cities is not enough developed in Poland, neither in theoretical nor in practical aspects. More attention is put on the issue of sustainability or eco-cities.
KEY WORDS: green city, investment, sustainable development, Asia
Paulina Szyja, PhD (ORCID 0000-0002-9672-1341) – Pedagogical University of Cracow
Correspondence address:Podchorążych Street 2, 30-084, Kraków, Polande-mail: [email protected]
Paulina SZYJA
JEL: O19, Q56, Q58No. 2(69) 2019 • pages: 117-131 https://doi.org/10.34659/2019/2/25
EKONOMIA I ŚRODOWISKO 2 (69) • 2019Studies and materials118
Introduction
The concept of sustainable development gained importance thanks to “Our Common Future” report (1987) and then, the Earth Summit in Rio de Janeiro in 1992. Its operationalization, through a low-carbon economy, started from 2008 – the real economy crisis (Szyja, 2016).
The idea of the green city is based on sustainable development concept, which H. K. El Ghorab and H. A. Shalaby describe as “a process by which we reason and a way we choose to live, a process that uses common sense and intuition as a baseline. Sustainability should be viewed as a philosophy, or ethic, affording people the ability to consider long-term consequences of actions and to think broadly across issues, disciplines, and boundaries” (El Ghorab, Shalaby, 2016, p. 497), and on the idea of sustainable cities.
New approach to the issue of sustainable cities is defined as one of the goals in Sustainable Development Goals of the United Nation, also called Agenda 2030: Make cities inclusive, safe, resilient and sustainable (UN, About Sustainable Development Goals). This target aims at ten detailed areas (UN, Sustainable Development Goal 11):• by 2030, ensure access for all to adequate, safe and affordable housing
and basic services and upgrade slums,• by 2030, provide access to safe, affordable, accessible and sustainable
transport systems for all, improving road safety, notably by expanding public transport, with special attention to the needs of those in vulnera-ble situations, women, children, persons with disabilities and older per-sons,
• by 2030, enhance inclusive and sustainable urbanization and capacity for participatory, integrated and sustainable human settlement planning and management in all countries,
• strengthen efforts to protect and safeguard the world’s cultural and nat-ural heritage,
• by 2030, significantly reduce the number of deaths and the number of people affected and substantially decrease the direct economic losses rel-ative to global gross domestic product caused by disasters, including water-related disasters, with a focus on protecting the poor and people in vulnerable situations,
• by 2030, reduce the adverse per capita environmental impact of cities, including by paying special attention to air quality and municipal and other waste management,
• by 2030, provide universal access to safe, inclusive and accessible, green and public spaces, in particular for women and children, older persons and persons with disabilities,
EKONOMIA I ŚRODOWISKO 2 (69) • 2019 Studies and materials 119
• support positive economic, social and environmental links between urban, per-urban and rural areas by strengthening national and regional development planning,
• by 2020, substantially increase the number of cities and human settle-ments adopting and implementing integrated policies and plans towards inclusion, resource efficiency, mitigation and adaptation to climate change, resilience to disasters, and develop and implement, in line with the Sendai Framework for Disaster Risk Reduction 2015-2030, holistic disaster risk management at all levels,
• support least developed countries, including through financial and tech-nical assistance, in building sustainable and resilient buildings utilizing local materials.The literature contains wide selection of terms, which may, but should
not, be considered synonyms: “green city”, “eco-city”, “sustainable city”, and “smart city”. The term “smart” is used next to “green”, Jedliński highlights an example of a “smart green city” (Jedliński, 2014). Polzonetti and Sagratella describe the differences in the meaning of the mentioned terms as follows (Polzonetti, Sagratella, 2018):• The green city is a city that aims at developing infrastructures, spaces,
facilities and urban activities with a low or even with no environmental impact.
• The sustainable city is a city that aims at developing a socio-economical urban context able to balance economic development with respect for the environment and social equity.
• The smart city is a city focusing on the use of technologies to improve life quality in urban areas.They do not present explanation of “eco-city”.We can also point out to other definition. According to “The Environmen-
tal Magazine”, “green cities movement” includes activities whose aim is to “lessen their environmental impacts by reducing waste, expanding recycling, lowering emissions, increasing housing density while expanding open space, and encouraging the development of sustainable local businesses” (What are ‘green cities’?). In turn, eco-city was defined as “a human settlement modeled on the self sustaining resilient structure and function of natural ecosystems. The ecocity provides healthy abundance to its inhabitants without consuming more (renewable) resources than it produces, without producing more waste than it can assimilate, and without being toxic to itself or neighboring ecosys-tems. Its inhabitants’ ecological impact reflect planetary supportive lifestyles; its social order reflects fundamental principles of fairness, justice and reasona-ble equity” (What Is An Ecocity?). The same elements may be found in expla-nation of the term of “sustainable city”: “as one that is able to retain the supply
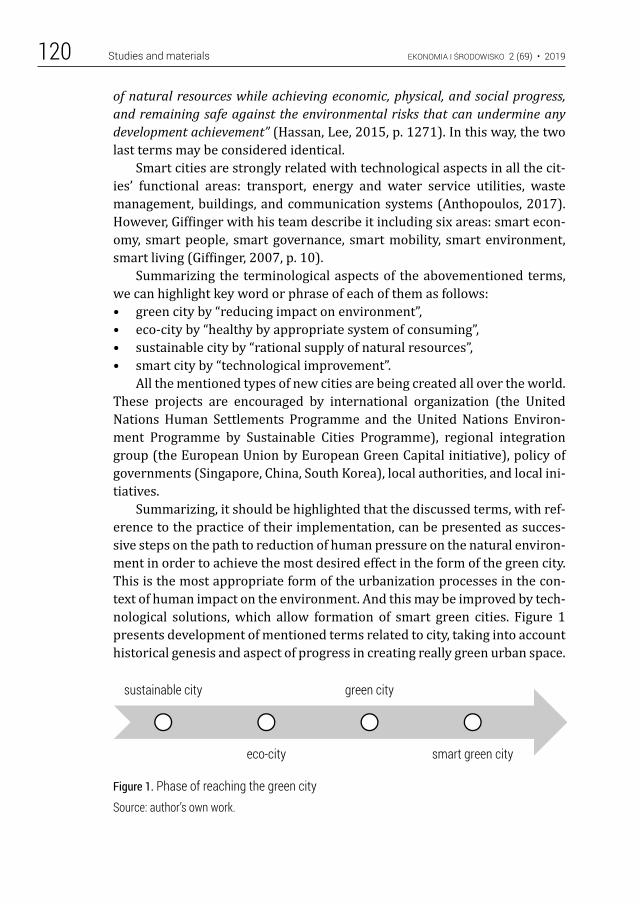
EKONOMIA I ŚRODOWISKO 2 (69) • 2019Studies and materials120
of natural resources while achieving economic, physical, and social progress, and remaining safe against the environmental risks that can undermine any development achievement” (Hassan, Lee, 2015, p. 1271). In this way, the two last terms may be considered identical.
Smart cities are strongly related with technological aspects in all the cit-ies’ functional areas: transport, energy and water service utilities, waste management, buildings, and communication systems (Anthopoulos, 2017). However, Giffinger with his team describe it including six areas: smart econ-omy, smart people, smart governance, smart mobility, smart environment, smart living (Giffinger, 2007, p. 10).
Summarizing the terminological aspects of the abovementioned terms, we can highlight key word or phrase of each of them as follows:• green city by “reducing impact on environment”,• eco-city by “healthy by appropriate system of consuming”,• sustainable city by “rational supply of natural resources”,• smart city by “technological improvement”.
All the mentioned types of new cities are being created all over the world. These projects are encouraged by international organization (the United Nations Human Settlements Programme and the United Nations Environ-ment Programme by Sustainable Cities Programme), regional integration group (the European Union by European Green Capital initiative), policy of governments (Singapore, China, South Korea), local authorities, and local ini-tiatives.
Summarizing, it should be highlighted that the discussed terms, with ref-erence to the practice of their implementation, can be presented as succes-sive steps on the path to reduction of human pressure on the natural environ-ment in order to achieve the most desired effect in the form of the green city. This is the most appropriate form of the urbanization processes in the con-text of human impact on the environment. And this may be improved by tech-nological solutions, which allow formation of smart green cities. Figure 1 presents development of mentioned terms related to city, taking into account historical genesis and aspect of progress in creating really green urban space.
Figure 1. Phase of reaching the green citySource: author’s own work.
sustainable city
eco-city
green city
smart green city
EKONOMIA I ŚRODOWISKO 2 (69) • 2019 Studies and materials 121
An overview of the literature
The literature on the mentioned issue includes a wide selection of detailed thematic scope. Primarily, authors take into consideration the term of the green city and its relation to other ones, such as: sustainable, eco-, low-carbon, and smart city (Kankaala et al., 2018). These considerations are strongly related to the concept of sustainable development (Leźnicki, Lewandowska, 2016). And that is why there are terms such as sustainable urbanization.
Some green cities are old ones, which were or are subjected to the pro-cess of green modernization called “transformation towards eco-city” (Hu et al., 2016). Some of them are new ones, which are currently under construc-tion or are to be constructed. Literature presents a wide selection of case studies, mainly in Asia – such those in Pearl River Delta in China (Wang et al., 2018), Europe – Freiburg in Germany (Freytag et al., 2014), or North America – New York City in the USA (Sánchez et al., 2018), but also in South America – Curitiba in Brasil (What are ‘green cities’?) or Africa – Sub-Saharian Cities (Lindley et al., 2018).
Another issue in the area of the green city is related to socio-economic aspects. Articles take into consideration the role of such cities for various stakeholder groups and for shaping city branding (Fok, Yi, 2018). The role of governmental projects and policies, the relationship between eco-city building and local economic development, is also important (Lin, 2018).
Next area of researchers’ interest is related to attributes of the green city. They point out to aspects of planning and organizing space. Particularly important elements affect organization of spatial order through creation of urban green spaces (Ye et al., 2018), green spaces (Anguluri, Narayanan, 2017), or green zones and city forests (Fan et al., 2019). In the last case, the author undertakes the problem of forestation in relation to natural condi-tions of cities’ location, which determine high temperature and specific microclimate. This is a reason to create conditions aimed at improving living quality (Fan et al., 2019) i.e. by cooling effect of urban green spaces. Not only do the authors take into consideration the role of trees, but they also make research in line with methodology which allows to diagnose results of forest-ation in different urban form of cities (Masoudi, 2019). Then they describe multifunctionality of green infrastructure (Hansen et al., 2019) through its ecosystem services (urban ecosystem services, Lindley et al., 2018, p. 328-329), or creation of green open spaces. The problem of adaptation to the cli-mate change by promoting urban green spaces is also important (Sánchez et al., 2018).
EKONOMIA I ŚRODOWISKO 2 (69) • 2019Studies and materials122
Next element refers to development of sustainable transport: organiza-tion of public transport, which should be more environmentally friendly, as well as creating a model to enable route planning for green vehicles (Pamučar et al., 2016).
Transport issue is related with the “green logistic”, which is defined as “an integrated management of all activities required to move the product along the supply chain to meet the expectations of customers at minimum global cost including also the external costs related to, among others, climate change, air pollution, noise, vibration and accidents” (Jedliński, 2014). Another important problem for the green city is appropriate energy system, e.g. one based on solar energy (Freytag et al., 2014), and its construction and implementation.
No less important is the question of water for the inhabitants of the green city. There are papers which describe the role of quality of ground water and appropriate system of its management. Scientists make research to elaborate instruments for measurement of groundwater sustainability (Tirupathi et al., 2019). Authors also describe the problem of flood risk and adequate adapta-tion policies to address plausible impacts of climate change (Chan et al., 2018).
There is a need for innovation in creation of appropriate building con-struction, water and energy systems, waste management systems, green spaces, and green infrastructure (Murzyn, Szyja, 2015). For example, Fei et al. point out to the role of innovation and classify it into three types: green tech-nological innovation, green institutional innovation and green busi-ness-model innovation (Fei et al., 2016).
In polish literature there are no publications which would describe the specificity of development of the green city in Asia, distinguishing between those that are created from scratch and those that are subject to green trans-formations (with socio-economic aspects of them taken into account). The aim of this paper is to present three cities in three different countries of Asia: Tianjin (China), Singapore, and Songdo (South Korea), to analyse the idea of the green city of varying genesis, government policy and praxis, as well as to analyse and categorize the term of the green city.
Research methods
The research method applied to solve the abovementioned gap in research, which is related to presentation and explanation features of green cities in Asia in terms of their genesis. Therefore author has carried out the analysis on the basis of literature review, considering the problem of termi-nology, the issue of green cities development progress in Asia, conditions of
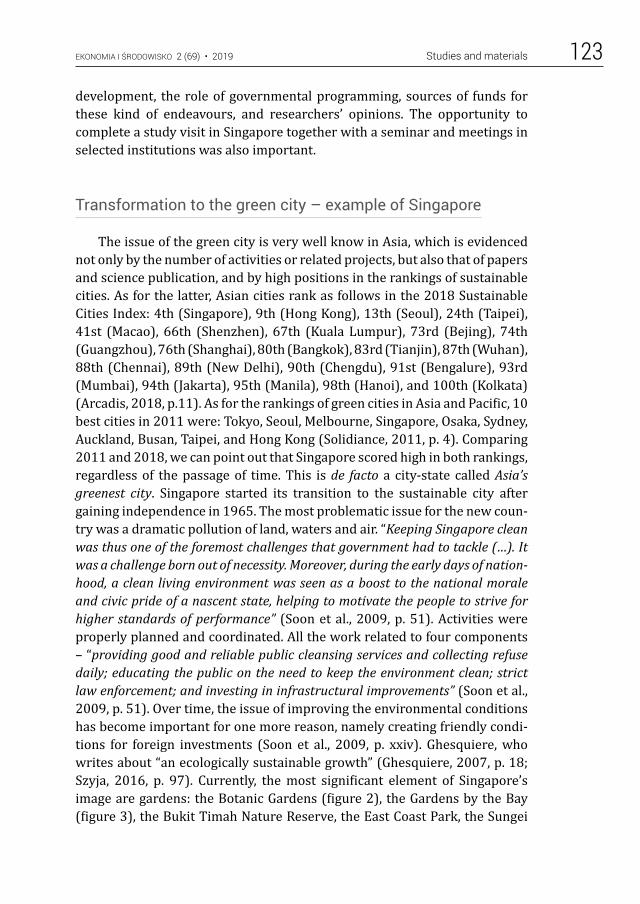
EKONOMIA I ŚRODOWISKO 2 (69) • 2019 Studies and materials 123
development, the role of governmental programming, sources of funds for these kind of endeavours, and researchers’ opinions. The opportunity to complete a study visit in Singapore together with a seminar and meetings in selected institutions was also important.
Transformation to the green city – example of Singapore
The issue of the green city is very well know in Asia, which is evidenced not only by the number of activities or related projects, but also that of papers and science publication, and by high positions in the rankings of sustainable cities. As for the latter, Asian cities rank as follows in the 2018 Sustainable Cities Index: 4th (Singapore), 9th (Hong Kong), 13th (Seoul), 24th (Taipei), 41st (Macao), 66th (Shenzhen), 67th (Kuala Lumpur), 73rd (Bejing), 74th (Guangzhou), 76th (Shanghai), 80th (Bangkok), 83rd (Tianjin), 87th (Wuhan), 88th (Chennai), 89th (New Delhi), 90th (Chengdu), 91st (Bengalure), 93rd (Mumbai), 94th (Jakarta), 95th (Manila), 98th (Hanoi), and 100th (Kolkata) (Arcadis, 2018, p.11). As for the rankings of green cities in Asia and Pacific, 10 best cities in 2011 were: Tokyo, Seoul, Melbourne, Singapore, Osaka, Sydney, Auckland, Busan, Taipei, and Hong Kong (Solidiance, 2011, p. 4). Comparing 2011 and 2018, we can point out that Singapore scored high in both rankings, regardless of the passage of time. This is de facto a city-state called Asia’s greenest city. Singapore started its transition to the sustainable city after gaining independence in 1965. The most problematic issue for the new coun-try was a dramatic pollution of land, waters and air. “Keeping Singapore clean was thus one of the foremost challenges that government had to tackle (…). It was a challenge born out of necessity. Moreover, during the early days of nation-hood, a clean living environment was seen as a boost to the national morale and civic pride of a nascent state, helping to motivate the people to strive for higher standards of performance” (Soon et al., 2009, p. 51). Activities were properly planned and coordinated. All the work related to four components – “providing good and reliable public cleansing services and collecting refuse daily; educating the public on the need to keep the environment clean; strict law enforcement; and investing in infrastructural improvements” (Soon et al., 2009, p. 51). Over time, the issue of improving the environmental conditions has become important for one more reason, namely creating friendly condi-tions for foreign investments (Soon et al., 2009, p. xxiv). Ghesquiere, who writes about “an ecologically sustainable growth” (Ghesquiere, 2007, p. 18; Szyja, 2016, p. 97). Currently, the most significant element of Singapore’s image are gardens: the Botanic Gardens (figure 2), the Gardens by the Bay (figure 3), the Bukit Timah Nature Reserve, the East Coast Park, the Sungei
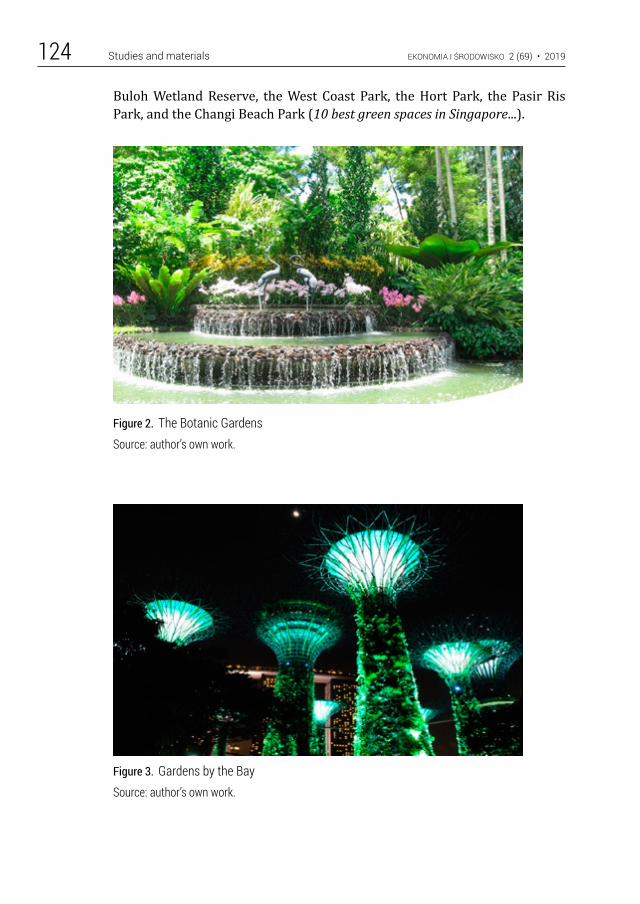
EKONOMIA I ŚRODOWISKO 2 (69) • 2019Studies and materials124
Buloh Wetland Reserve, the West Coast Park, the Hort Park, the Pasir Ris Park, and the Changi Beach Park (10 best green spaces in Singapore...).
Figure 2. The Botanic GardensSource: author’s own work.
Figure 3. Gardens by the BaySource: author’s own work.
EKONOMIA I ŚRODOWISKO 2 (69) • 2019 Studies and materials 125
What is really remarkable, Singapore’s surface is only 720 km2 and we can still find there so many green spaces. What is more, it should be high-lighted that the idea of urban farming is strongly developed in this city, espe-cially in housing estates, schools, or offices (Zachariah, 2017). At the begin-ning, the idea was aimed at integrating the society, especially elderly people, but also to yield crops, due to no agriculture in Singapore and the need to import food. Over time, it began to stimulate cultivation of balconies and roofs of residential buildings. Such activities have one more result: green space which is building’s natural isolation. It is possible due to natural condi-tions. Nowadays, we can observe progress in farming space in Singapore, due to high-tech solutions, i.e. those based on aquaponics methods.
Singapore has also achieved a great progress in the process of “water production”, which is based on four facilities in which water is being cleaned (by using membrane technique and UV) and then supplied for the industry. 2% of processed water is enriched to be fit for consumption. In the area of water supply in Singapore, a huge progress has been made since 1965 as for infrastructure development: there are 17 water reservoirs; sanitary condi-tions have been improved; a dam aimed at recreation and flood protection, as well as being a reservoir of water, has been constructed; the seawater desali-nation plant has been opened (Szyja, 2016, p. 106-108).
Energy production from renewable energy sources in next element of transition to sustainability. The Building and Construction Authority is engaged in modernization of a building to make it a “zero energy building”, and Singapore is the current regional leader as for technical solutions (BCA).
Knowledge and experience gained by scientist and engineers from gov-ernmental agencies, research institutes and also the National University of Singapore have impact on sustainable transition in other countries of Asia, particularly in China with its Tianjin City being constructed.
Contemporary Singapore may be called a green city due to two reasons. First is related to the development of green spaces, and second to the devel-opment of rational management of water, land and space, as well as using renewable sources in energy system and lowering emissions (through a spe-cial regulation system, well-developed public transport system, and high costs of buying a car for private purposes). A problem for Singapore is grow-ing waste production. The Semakau Landfill is an island near the main part of Singapore, which should allow trash storage until 2045. “But with the use of disposable products growing at a rapid rate, the ministry’s most recent esti-mates show that Semakau could be full a decade earlier” (Geddie, 2018).
At the beginning of Singapore’s way to sustainable development, all activ-ities were concentrated on improving living conditions. Then, further goals and increasing level of living conditions set the new directions of activities, as
EKONOMIA I ŚRODOWISKO 2 (69) • 2019Studies and materials126
a result of which improvements were achieved. Nowadays, emphasis should be put on the role of technology (e.g. in water production or zero-energy building construction) and export of knowledge and experience in the men-tioned area. In this way Singapore may be called a smart green city.
Eco-city Tianjin – building a green city from scratch
The project of Eco-city Tianjin is being constructed next to (40 km dis-tance) industrial and port centre of Tianjin (115 km to the southeast of Bei-jing). It is an example of cooperation of two governments: the Chinese and the Singapore (Sino-Singapore Tianjin Eco-City, https). Such type of endeav-our in this part of China is dictated by the fact that the region has been chosen as a test area for many economic experiments. It is also related to the fact that the eastern coast of this country has always been more developed than other regions. It was here where the first special economic zones were created. The contribution of Singapore is related with the state authorities’ experience in creating special sustainable policy (commented above) and knowledge of experts, i.e. those of the Building and Construction Authority. The choice of location was dictated by the need to meet two key conditions: land not suita-ble for agricultural cultivation and water shortages. The first criterion is to prevent takeover of land suitable for cultivation, and the second – to create a special infrastructure from scratch.
The Sino-Singapore Tianjin Eco-City is based on appropriate sustainable spatial planning, with the following principles:• areas separated by their functions (housing estates, service centres, light
industry),• each district should have specific service and institutional facilities,• the distance between housing estates and workplaces should not be too
large for walking or cycling,• creation of an extensive network of pavements, bicycle paths, and public
transport infrastructure,• designing a large amount of green space,• connection to main water reservoirs to increase water circulation,• construction of 75-acre park [to restore] stormwater retention in order
to clean the river, cool the Central Business District and provide refuge for residents and visitors among native plants, trees and walking paths (Karlenzig, 2015),
• introduction of specific waste management rules,
EKONOMIA I ŚRODOWISKO 2 (69) • 2019 Studies and materials 127
• modern energy system based on environmental friendly solutions: solar power, wind power and EV charging centers and a national smart grid pilot (Karlenzig, 2015),
• development of ecological construction,• locating in the city only plants which are related mainly to the IT sector,• the obligation for the residents to comply with certain standards in the
scope of limiting the negative impact on the natural environment.Eco-city Tianjin is a politically initiated project, realized in cooperation of
two governments. Furthermore, it is ecologically justified, also due to ecolog-ical problem of the city of Tianjin (chemical industry).
Songdo – The South Korean „smart green city”
The Songdo International Business District is, according to M. L. Clifford, “a smart city built from scratch (…). More than 40 percent of its area is reserved for green space, and all of its major buildings meet or exceed LEED expecta-tions” (Clifford, 2015, p. 81). The city is located 64 km from Seoul and is con-nected to Incheon International Airport with a 12 km long bridge. The pro-ject is intended for implementation in the period of 2003-2020 and the assumed costs of the endeavour are estimated at USD 40 billion. The project is a joint venture of the City of Incheon, Gale International (61%), POSCO E&C (30%), and Morgan Stanley Real Estate (9%) (South Korea Conceptualizes…).
Investments in the city include those aimed at creating technologically modern and sustainable solution, including appropriate construction of building (certification in the U.S. Green Building Council’s Leadership in Energy Efficiency and Design system), a central pneumatic waste disposal system to eliminate the need of garbage collection (South Korea Conceptual-izes…), cycling routes, digitally advanced apartments, and remote solutions (White, 2018). However, despite the mentioned solutions, Songdo has only 70,000 residents while the planned number is 300,000. The problem is related to high costs of apartments and living. There are attempts to find buy-ers for both apartments and commercial spaces. In the first case, the target group are the Koreans living in the USA (White, 2018).
To sum up, Songdo is an example of the green city built from scratch, with smart solutions included. However, a currently highlighted problem is the cost of living there, which is a major obstacle for potential residents. In author’s opinion, this results from too much pressure on technological solu-tions which are expensive. In addition, one can ask whether such technologi-cal advancement really serves the environment.
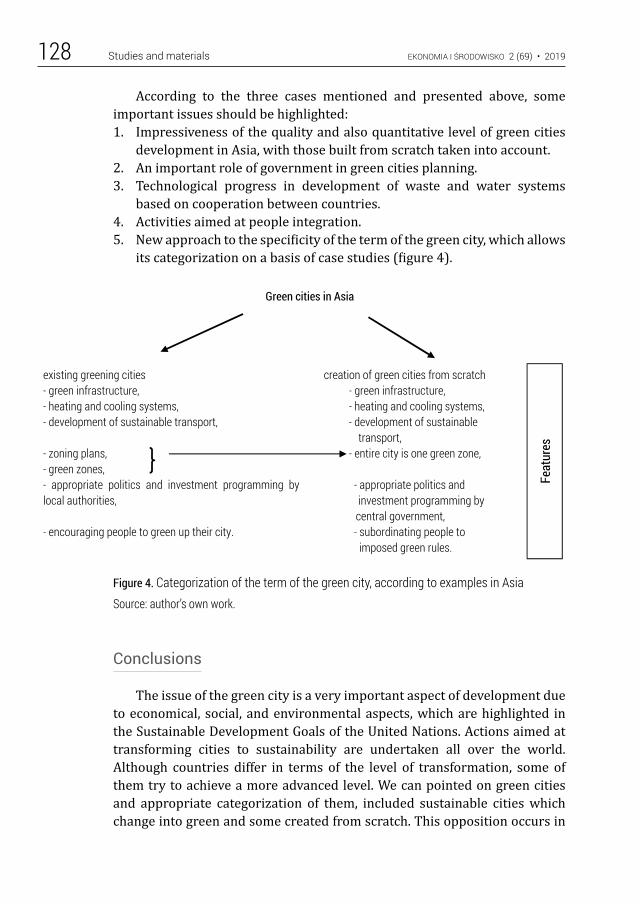
EKONOMIA I ŚRODOWISKO 2 (69) • 2019Studies and materials128
According to the three cases mentioned and presented above, some important issues should be highlighted:1. Impressiveness of the quality and also quantitative level of green cities
development in Asia, with those built from scratch taken into account.2. An important role of government in green cities planning.3. Technological progress in development of waste and water systems
based on cooperation between countries.4. Activities aimed at people integration.5. New approach to the specificity of the term of the green city, which allows
its categorization on a basis of case studies (figure 4).
Figure 4. Categorization of the term of the green city, according to examples in AsiaSource: author’s own work.
Conclusions
The issue of the green city is a very important aspect of development due to economical, social, and environmental aspects, which are highlighted in the Sustainable Development Goals of the United Nations. Actions aimed at transforming cities to sustainability are undertaken all over the world. Although countries differ in terms of the level of transformation, some of them try to achieve a more advanced level. We can pointed on green cities and appropriate categorization of them, included sustainable cities which change into green and some created from scratch. This opposition occurs in
Green cities in Asia
existing greening cities creation of green cities from scratch - green infrastructure, - green infrastructure, - heating and cooling systems, - heating and cooling systems, - development of sustainable transport, - development of sustainable
transport, - zoning plans, - entire city is one green zone, - green zones, - appropriate politics and investment programming by local authorities,
- appropriate politics and investment programming by central government,
- encouraging people to green up their city. - subordinating people to imposed green rules.
Feat
ures
EKONOMIA I ŚRODOWISKO 2 (69) • 2019 Studies and materials 129
presentation and analysis of the case studies from Asia: Singapore, Tianjin, and Songdo. Singapore began its transformation, stimulated by governmen-tal policy, in 1965. Nowadays, it is called the greenest city in Asia; progress has been achieved in improvement of living quality, including ecological aspects and greening up the space, and technological aspects of water man-agement system. In turn, Tianjin is a green city building from scratch, on the basis of cooperation between two governments, one with knowledge and experience (Singapore), and the other with willingness to introduce new urban solution due to ecological problems of an industrial city. Songdo is an example of a smart green city, also constructed from scratch. However, its distinctive feature is the use of technology in every functional aspect of living in the green city.
This approach may help to understand progress in transition to the green city. This is very important in relation to Polish cities, where emphasis is put on more environmental friendly solutions in a process aimed at formation of sustainable cities.
Literature
Arcadis (2018), Citizen Centrics Cities, The Sustainable Cities Index 2018, https://www.arcadis.com/media/1/D/5/%7B1D5AE7E2-A348-4B6E-B1D7- 6D94FA7D7567%7DSustainable_Cities_Index_2018_Arcadis.pdf [27-03-2019]
Anguluri R., Narayanan P. (2017), Role of green space in urban planning: Outlook toward smart cities, “Urban Forestry & Urban Greening” No. 25, p. 58-65, https://doi.org/10.1016/j.ufug.2017.04.007
Anthopoulos L.G. (2017), The Smart City in Practice. In: Understanding Smart Cities: A Tool for Smart Government or an Industrial Trick? “Public Administration and Information Technology” Vol 22, Springer, Cham, p. 47-185, 10.1007/978-3-319-57015-0
BCA, https://www.bca.gov.sg/zeb/Chan F.K.S. et al. (2018), Towards resilient flood risk management for Asian coastal
cities: Lessons learned from Hong Kong and Singapore, “Journal of Cleaner Produc-tion” No. 187, p. 576-589, https://doi.org/10.1016/j.jclepro.2018.03.217
Clifford M.L. (2015), The Greening of Asia. The Business Case for Solving Asia’s Environ-mental Emergency, Columbia Business School, New York
Fan H. et al. (2019), How to cool hot-humid (Asian) cities with urban trees? An optimal landscape size perspective, “Agricultural and Forest Meteorology” No. 265, p. 338-348, https://doi.org/10.1016/j.agrformet.2018.11.027
Fei J. et al. (2016), Towards eco-city: the role of green innovation, CUE2016-Applied Energy Symposium and Forum 2016: Low carbon cities & urban energy systems, “Energy Procedia” No. 104, p. 165-170, https://doi.org/10.1016/j.egypro 2016.12.029
EKONOMIA I ŚRODOWISKO 2 (69) • 2019Studies and materials130
Fok K., Yi W. (2018), City re-imagined: Multi-stakeholder study on branding Hong Kong as a city of greenery, “Journal of Environmental Management” No. 2016, p. 1039-1051, https://doi.org/10.1016/j.jenvman.2017.11.045
Freytag T., Gössling S., Mössner S. (2014), Living the green city: Freiburg’s Solarsied-lung between narratives and practices of sustainable urban development, “Local Environment” Vol. 19, No. 6, p. 644–659, https://doi.org/10.1080/13549839.2013.868872
El Ghorab H.K., Shalaby H.A. (2016), Eco and Green cities as new approaches for plan-ning and developing cities in Egypt, “Alexandria Engineering Journal” No. 55, p. 495-503, https://doi.org/10.1016/j.aej.2015.12.018
Geddie J. (2018), In Singapore, where trash becomes ash, plastics are still a problem, https://www.reuters.com/article/us-singapore-waste/in-singapore-where-trash-becomes-ash-plastics-are-still-a-problem-idUSKCN1J20HX [29-03-2019]
Giffinger R. et al. (2007), Smart cities – Ranking of European medium-sized cities, Vienna, http://www.smart-cities.eu/download/smart_cities_final_report.pdf [19-04-2019]
Hansen R. et al. (2019), Planning multifunctional green infrastructure for compact cit-ies: What is the state of practice?, “Ecological Indicators” No. 96, pp. 99-110, https://doi.org/10.1016/j.ecolind.2017.09.042
Hassan A.M., Lee H. (2015), The paradox of the sustainable city: definitions and exam-ples, “Environment, Development and Sustainability” Vol. 17, Issue 6, p. 1267-1285, https://doi.org/10.1007/s10668-014-9604-z
Hu M-H. et al. (2016), Transformation toward an eco-city: lessons from three Asian cities, “Journal of Cleaner Production” No. 123, p. 77-87, https://doi.org/10.1016/j.jclepro.2015.09.033
Jedliński M. (2014), The position of green logistics in sustainable development of a smart green city, 1st International Conference Green Cities 2014 – Green Logis-tics for Greener Cities, “Procedia – Social and Behavioral Sciences” No. 151, p. 102-111, https://doi.org/10.1016/j.sbspro.2014.10.011
Kankaala K.I. et al. (2018), Smart city actions to support sustainable city development, “Techno-Special Issue” No. 01, p. 108-114
Karlenzig W. (2015), Five Cities with Game-Changing Sustainability and Resilience Plans, http://commoncurrent.com/flow/tag/tianjin-eco-city/ [30-03-2019]
Leźnicki M., Lewandowska A. (2016), Contemporary Concepts of a City in the Context of Sustainable Development: Perspective of Humanities and Natural Sciences, „Problemy Ekorozwoju – Problems of Sustainable Development” Vol. 11 No. 2, p. 45-54
Lin Z. (2018), Ecological urbanism in East Asia: A comparative assessment of two eco-cities in Japan and China, “Landscape and Urban Planning” No. 179, p. 90-102, https://doi.org/10.1016/j.landurbplan.2018.07.008
Lindley S. et al. (2018), Rethinking urban green infrastructure and ecosystem services from the perspective of sub-Saharan African cities, “Landscape and Urban Plan-ning” No. 180, p. 328-338, https://doi.org/10.1016/j.landurbplan.2018.08.016
Masoudi M., Tan P.Y., Liew S.C. (2019), Multi-city comparison of the relationships between spatial pattern and cooling effect of urban green spaces in four major Asian cities, “Ecological Indicators” No. 98, p. 200-213, https://doi.org/10.1016/j.ecolind.2018.09.058
EKONOMIA I ŚRODOWISKO 2 (69) • 2019 Studies and materials 131
Pamučar D. et al. (2016), Transport spatial model for the definition of green routes for city logistics center, “Environmental Impact Assesment Review” No. 56, p. 72-87, https://doi.org/10.1016/j.eiar.2015.09.002
Polzonetti A., Sagratella M. (2018), Smart City and Green Development, in: S. Al-Shar-han et al. (eds.) Challenges and Opportunities in the Digital Era, I3E 2018. Lecture Notes in Computer Science Vol. 11195, Springer, Cham, p. 191-204, DOI https://doi.org/10.1007/978-3-030-02131-3_18
Sánchez F.G, Solecki W.D., Batalla C.R. (2018), Climate change adaptation in Europe and the United States: A comparative approach to urban green spaces in Bilbao and New York City, “Land Use Policy” No. 79, p. 164-173, https://doi.org/10.1016/j.landusepol.2018.08.010
Solidiance (2011), Asia Pacific’s top 10 green cities, https://www.slideshare.net/ddu-hamel/top-10-asia-green-cities-asian-green-cities-wwwsolidiance-com-2011[27-03-2019]
Soon T.Y., Jean L.T., Tan K. (2009), Clean, Green and Blue. Singapore’s Journey Towards Environmental and Water Sustainability, Institute of Southeast Asian Studies, Sin-gapore
South Korea Conceptualizes the Ultimate Smart City, https://newcities.org/cityquest-songdo-south-korea-conceptualized-ultimate-smart-sustainable-city/[31-03-2019]
Szyja P. (2016a), Kształtowanie gospodarki niskoemisyjnej na poziomie samorządu terytorialnego, „Prace Naukowe Uniwersytetu Ekonomicznego we Wrocławiu” No. 437, p. 447-463
Szyja P. (2016b), Gospodarka wodna w Singapurze, „Gospodarka w Praktyce i Teorii” No. 3(44), p. 93-100
Tirupathi C. et al. (2019), Fuzzy-based approach for evaluating groundwater sustain-ability of Asian cities, “Sustainable Cities and Society” No. 44, p. 321-331, https://doi.org/10.1016/j.scs.2018.09.027
UN, About Sustainable Development Goals, https://www.un.org/sustainabledevelop-ment/sustainable-development-goals/ [23-03-2019]
UN, Sustainable Development Goal 11. Make cities and human settlements inclusive, safe, resilient and sustainable, https://sustainabledevelopment.un.org/sdg11 [23-03-2019]
Wang M.-X. et al. (2018), Evaluating green development level of nine cities within the Pearl River Delta, China, “Journal of Cleaner Prodcution” No. 174, p. 315-323, https://doi.org/10.1016/j.jclepro.2017.10.328
What Is An Ecocity?, https://ecocitybuilders.org/what-is-an-ecocity/ [25-03-2019]White C. (2018), South Korea’s ‘Smart City’ Songdo: not quite smart enough?, https://
www.scmp.com/week-asia/business/article/2137838/south-koreas-smart-city-songdo-not-quite-smart-enough [31-03-2019]
Ye C., Hu L., Li M. (2018), Urban green space accessibility changes in a high-density city: A case study of Macau from 2010 to 2015, “Journal of Transport Geography” No. 66, p. 106-115
Zachariah N.A. (2017), Urban farming in Singapore has moved into a new, high-tech phase, https://www.straitstimes.com/lifestyle/home-design/fresh-ideas-for-city-farms [28-03-2019]
10 best green spaces in Singapore, from parks and gardens to lakes and reserves, https://expatliving.sg/10-best-green-spaces-in-singapore-from-parks-and-gar-dens-to-lakes-and-reserves/[28-03-2019]
EKONOMIA I ŚRODOWISKO • 2 (69) • 2019
EVALUATION OF SUSTAINABLE DEVELOPMENT OF DAIRY INDUSTRY IN POLAND
ABSTRACT: Dairy plants development should be based on the principle of sustainable development, which is present both in National Environmental Policy and European Union environmental protection policy. It is in compliance with Best Available Technology (BAT). Technology connected with recovering energy from sewage, sewage sludge and production waste is gaining more and more interest. The authors of this article have been cooperating with several production plants in podlaskie province for many years through conducting scientific research and preparing environmental reports or integrated permissions (IPPC). The article discusses the most crucial aspects of sustainable development of the dairy industry. Also, the results of environmental aspects (water consumption, sewage production and treatment, wastes, gas and noise emissions, energy consumption) connected with dairy plants man-agement are presented.
KEY WORDS: sustainable development, dairy, water and sewage management, energy consumption
Józefa Wiater, Prof. (ORCID 0000-0002-6140-9614) – Bialystok University of Technology, Faculty of Building and Environmental EngineeringDariusz Boruszko, Associate Prof. (ORCID 0000-0001-5160-8938) – Bialystok University of Technology, Faculty of Building and Environmental EngineeringWojciech Dąbrowski, Associate Prof. (ORCID 0000-0001-5663-4270) – Bialystok University of Technology, Faculty of Building and Environmental EngineeringRadosław Żyłka, MSc (ORCID 0000-0002-5119-6862) – Bialystok University of Technology, Faculty of Building and Environmental EngineeringSylwia Antonowicz, MSc – Bielmlek Dairy Cooperative, Bielsk Podlaski, Poland
Correspondence address:Wiejska Street 45E, 15-351, Białystok, Polande-mail: [email protected]
Józefa WIATER • Dariusz BORUSZKO • Wojciech DĄBROWSKI • Radosław ŻYŁKA • Sylwia ANTONOWICZ
JEL: L25, Q25, Q49No. 2(69) 2019 • pages: 132-144 https://doi.org/10.34659/2019/2/26
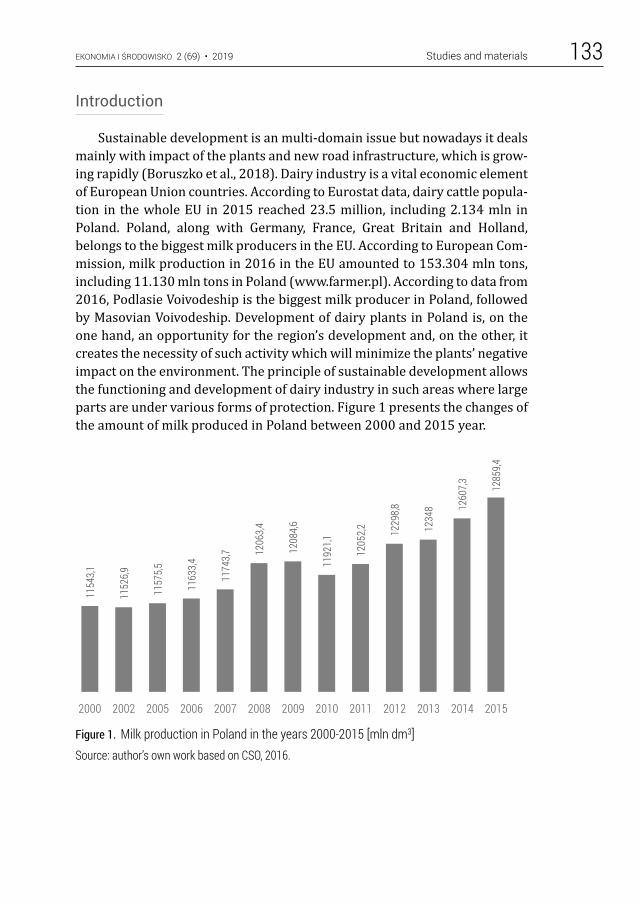
EKONOMIA I ŚRODOWISKO 2 (69) • 2019 Studies and materials 133
Introduction
Sustainable development is an multi-domain issue but nowadays it deals mainly with impact of the plants and new road infrastructure, which is grow-ing rapidly (Boruszko et al., 2018). Dairy industry is a vital economic element of European Union countries. According to Eurostat data, dairy cattle popula-tion in the whole EU in 2015 reached 23.5 million, including 2.134 mln in Poland. Poland, along with Germany, France, Great Britain and Holland, belongs to the biggest milk producers in the EU. According to European Com-mission, milk production in 2016 in the EU amounted to 153.304 mln tons, including 11.130 mln tons in Poland (www.farmer.pl). According to data from 2016, Podlasie Voivodeship is the biggest milk producer in Poland, followed by Masovian Voivodeship. Development of dairy plants in Poland is, on the one hand, an opportunity for the region’s development and, on the other, it creates the necessity of such activity which will minimize the plants’ negative impact on the environment. The principle of sustainable development allows the functioning and development of dairy industry in such areas where large parts are under various forms of protection. Figure 1 presents the changes of the amount of milk produced in Poland between 2000 and 2015 year.
Figure 1. Milk production in Poland in the years 2000-2015 [mln dm3]Source: author’s own work based on CSO, 2016.
F1
1154
3,1
1152
6,9
1157
5,5
1163
3,4
1174
3,7 1206
3,4
1208
4,6
1192
1,1
1205
2,2 1229
8,8
1234
8 1260
7,3 1285
9,4
2000 2002 2005 2006 2007 2008 2009 2010 2011 2012 2013 2014 2015
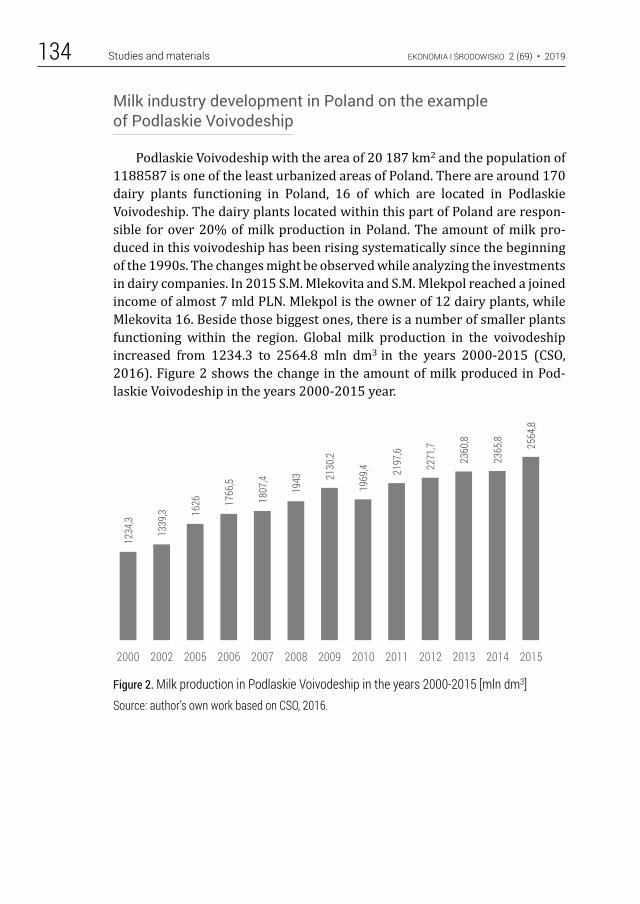
EKONOMIA I ŚRODOWISKO 2 (69) • 2019Studies and materials134
Milk industry development in Poland on the example of Podlaskie Voivodeship
Podlaskie Voivodeship with the area of 20 187 km2 and the population of 1188587 is one of the least urbanized areas of Poland. There are around 170 dairy plants functioning in Poland, 16 of which are located in Podlaskie Voivodeship. The dairy plants located within this part of Poland are respon-sible for over 20% of milk production in Poland. The amount of milk pro-duced in this voivodeship has been rising systematically since the beginning of the 1990s. The changes might be observed while analyzing the investments in dairy companies. In 2015 S.M. Mlekovita and S.M. Mlekpol reached a joined income of almost 7 mld PLN. Mlekpol is the owner of 12 dairy plants, while Mlekovita 16. Beside those biggest ones, there is a number of smaller plants functioning within the region. Global milk production in the voivodeship increased from 1234.3 to 2564.8 mln dm3 in the years 2000-2015 (CSO, 2016). Figure 2 shows the change in the amount of milk produced in Pod-laskie Voivodeship in the years 2000-2015 year.
Figure 2. Milk production in Podlaskie Voivodeship in the years 2000-2015 [mln dm3]Source: author’s own work based on CSO, 2016.
F2
1234
,3
1339
,3 1626 17
66,5
1807
,4
1943 21
30,2
1969
,4 2197
,6
2271
,7
2360
,8
2365
,8 2564
,8
2000 2002 2005 2006 2007 2008 2009 2010 2011 2012 2013 2014 2015
EKONOMIA I ŚRODOWISKO 2 (69) • 2019 Studies and materials 135
Environmental aspects connected with the functioning of dairy plants
Dairy processing plants belong to agricultural and food production branch. Their impact on the environment is not limited to the production phase only, but extends much further to milk producers themselves. Among the main environmental aspects of dairy plants, the following can be given:• water intake and consumption during the production processes,• sewage and sewage sludge emission,• generating waste during production,• emission of gas pollution from fuel combustion,• noise emission,• electric energy consumption.
Water utilized in dairy plants is used directly in the production process as well as in supporting processes. Depending on its purpose, the water under-goes treatment (iron and manganese removal, water softening etc.). Among the most water-consuming places within a dairy plant are water treatment stations, milk pasteurizer cooling systems and stations for cleaning devices and pipelines (Budny, Turowski, 2005a). Almost 100% of the consumed water comes from own abyssal intakes exploited by the dairy plants for many years. Only to a little extend do the dairy plants use water from municipal supply systems. Water resources are limited so the lack of a sufficient amount of water might constraint the production growth. While analyzing individual water consumption rates in dairy plants, a substantial drop of this indicator might be observed in the 1990s. Its consumption depends on the type of the final product and might vary within a very wide range (BAT, 2005; FAPA, 1998). Water consumption indicators in S.M. Mlekovita in Wysokie Mazowieckie in the previous decade amounted to 3.2 m3 per 1 m3 of pro-cessed milk (Boruszko et al., 2004; Boruszko, Dabrowski, 2016). For the dairy plant Bielmlek in Bielsk Podlaski the indicator was about 3.6 m3 per 1 m3 of treated milk according to the own research in 2015, while in 2018 the indicator decreased to 2.46 m3 per 1 m3 of treated milk. The lowest indicators are observed in the case of consumable milk and powdered milk production, whereas the highest are for butter and hard cheese production. An important aspect connected with water in food industry is the fact that, in view of the product safety, its consumption cannot be minimized in order to achieve, for example, reduction of production costs. Due to this, water recycling for pro-duction purposes is not applied. This type of water might be used in support-ing processes, e.g. in a boiler house. The widespread use of automatic clean-ing in place (CIP) stations has had a very positive effect on the water manage-ment process. The stations are installed at many production stages from milk
EKONOMIA I ŚRODOWISKO 2 (69) • 2019Studies and materials136
collection to washing pipeline installations. They are fully automatized and their application allows saving water and chemical cleaning products. The use of CIP stations has improved production safety and has shortened the time needed for washing processes within a plant. The plants are subjects to strict water quality control due to the safety of their final product. The stand-ards describing water in dairy industry implemented in Poland after joining the European Union allow safe functioning of dairy plants.
Wastewater discharged from dairy WWTPs has significant influence for environment. Dairy sewage has similar content to municipal, with the differ-ence of observing significantly higher values of organic compounds meas-ured with indicators such as BOD5, COD or TOC (Danalewich, 1998; Gugała et al., 2015; Janczukowicz et al., 2008; Struk-Sokołowska, Ignatowicz, 2013). That is why a high load of pollutants discharged from a plant is the main problem, even though the amount of pollution is small (Struk-Sokołowska, 2016). Similar to water, the individual indicators in reference to e.g. 1m3 of processed milk have a very wide range connected with the type of the final product. Similar and comparable in Poland and around the world, milk pro-cessing technology has a smaller influence on the amount of sewage. Accord-ing to own research conducted in Podlaskie dairy plants, since the end of the 1990s the indicator of sewage amount was on average 3.2 m3 per 1 m3 of treated milk and varied in the range between 1.8 m3 and 4.1 m3 (Dąbrowski, 2009). Own research in Bielmlek Bielsk Podlaski showed the indicator on the level of 2.6 m3 in 2018. The drop in the amount of water used for one produc-tion unit caused a substantial increase of pollution concentration in sewage, which makes its treatment much more difficult (Danalewich, 1998; Boruszko et al., 2004; Boruszko, Dabrowski, 2016). A great part of dairy plants in Poland use their own WWTPs, while only a few smaller plants discharge their sewage to municipal treatment plants after its pre-treatment. Every treat-ment plant applies sludge activated system with high efficiency nitrogen and phosphorus removal, while the flotation process is a widespread method used in pre-treatment. Phosphorus is additionally removed by chemical pre-cipitation. The biggest plant (Mlekovita company in Wysokie Mazowieckie), applies anaerobic process of sewage sludge treatment with heat and electric energy production from biogas. The rest of the plants apply aerobic stabiliza-tion, where sludge is finally used as fertilizer. Sewage sludge is a type of solid waste but its composition allows to use it as a material recycled to the envi-ronment. In a few objects in Poland the process of anaerobic dairy sewage treatment is implemented with Upflow Anaerobic Sludge Blanket (UASB) reactors (Umiejewska, 2017). Anaerobic systems have a range of advantages are commonly used in e.g. fruit and vegetable processing plants or breweries. They allow obtaining biogas during sewage treatment and reducing the
EKONOMIA I ŚRODOWISKO 2 (69) • 2019 Studies and materials 137
amount of sludge. The necessity of applying secondary aerobic treatment is a disadvantage (Rodriguez, 2015; Tiwary, 2015).
The waste in dairy industry might be closely connected with production, processing as well as with side processes, such as heat energy production in a boiler house, or water and sewage treatment. A catalogue of waste in a large dairy plant might contain several dozen entries, from container waste (paper and plastic) to industrial waste, such as slag, batteries, or lamps. Dairy plants have agreements with companies that utilize waste, recycle dangerous materials and materials other than dangerous, which are determined by a suitable regulation for waste management.
Another factor connected with environmental impact is emission of gas pollution. In dairy plants it is connected almost in 100% with the production of heat energy for the production purposes. Dairy plants produce steam in own boiler houses. The majority of them are supplied with coal and come from the 1970s. Only a few plants use gas supplies. Heat energy consumption for steam production in a dairy plant reaches 76.4% of the total energy con-sumption. That is why the plants use their own sources to become independ-ent from external suppliers. The sources of gas emission, other than boiler houses, are gas heaters used in production of powdered milk, and milk pow-der plants, which emit dust. Among the emission indicators in dairy plants are nitrogen dioxide, sulfur dioxide, carbon monoxide and PM10 dust.
Noise emission is also a crucial element. Within the area of a dairy plant location there are several noise sources with various levels of emission and frequency characteristics (noise spectral density). These are both point sources located on an open area, on various heights above the ground level, and cubic (secondary) noise sources. The second group includes all cubic (building) production units, inside which there are technological lines, pro-duction lines, energy devices and technological safety devices, as well as other devices and machines which emit noise.
In the recent period, more attention is given to the issue of electric energy consumption in dairy plants. The problem is crucial due to the share of elec-tric energy in the plant’s functioning cost, but also due to the emission from coal power plants. In the recent years, only few dairy plants have begun elec-tric energy production, for example from biogas obtained during anaerobic sewage and sewage sludge treatment. An example might come from S.M. Mle-kovita dairy plant in Wysokie Mazowieckie, which has been producing heat energy and electric energy within its WWTP plant since 2014. Electric energy is used during the production process; however, its greatest share goes to sewage treatment (Budny, Twarowski, 2005b; Dąbrowski et al., 2017). Figure 3 presents results of energy consumption analysis conducted in Bielmlek Bielsk Podlaski in 2018. The wastewater treatment plant is responsible for
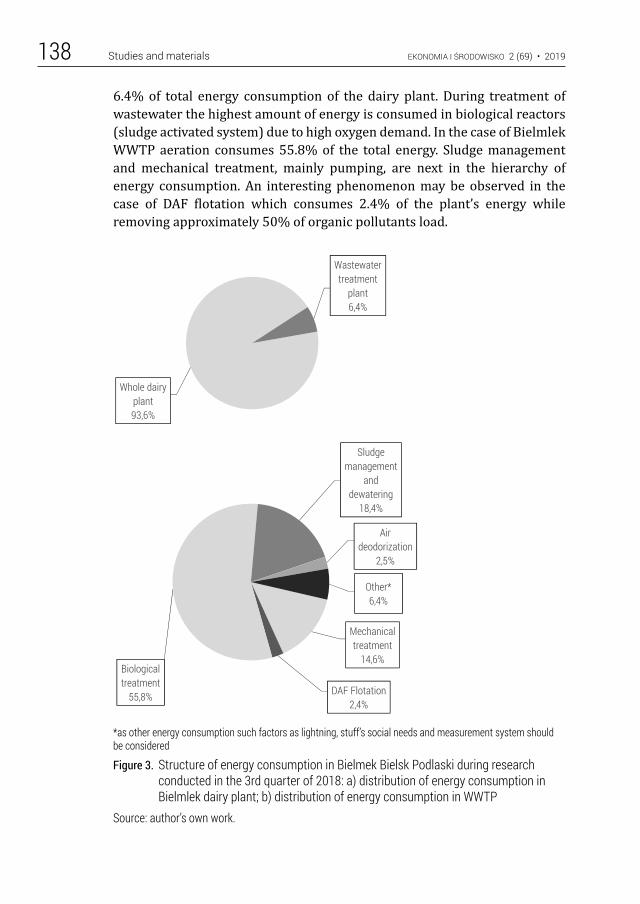
EKONOMIA I ŚRODOWISKO 2 (69) • 2019Studies and materials138
6.4% of total energy consumption of the dairy plant. During treatment of wastewater the highest amount of energy is consumed in biological reactors (sludge activated system) due to high oxygen demand. In the case of Bielmlek WWTP aeration consumes 55.8% of the total energy. Sludge management and mechanical treatment, mainly pumping, are next in the hierarchy of energy consumption. An interesting phenomenon may be observed in the case of DAF flotation which consumes 2.4% of the plant’s energy while removing approximately 50% of organic pollutants load.
*as other energy consumption such factors as lightning, stuff’s social needs and measurement system should be considered
Figure 3. Structure of energy consumption in Bielmek Bielsk Podlaski during research conducted in the 3rd quarter of 2018: a) distribution of energy consumption in Bielmlek dairy plant; b) distribution of energy consumption in WWTP
Source: author’s own work.
Whole dairy plant93,6%
Wastewater treatment
plant6,4%
Mechanical treatment
14,6%
DAF Flotation2,4%
Biological treatment
55,8%
Sludge management
and dewatering
18,4%
Air deodorization
2,5%
Other*6,4%
Whole dairy plant93,6%
Wastewater treatment
plant6,4%
Mechanical treatment
14,6%
DAF Flotation2,4%
Biological treatment
55,8%
Sludge management
and dewatering
18,4%
Air deodorization
2,5%
Other*6,4%
EKONOMIA I ŚRODOWISKO 2 (69) • 2019 Studies and materials 139
Development directions and main challenges connected with sustainable development of dairy plants
Industrial plants development should be based on the principle of sus-tainable development, which is present both in National Environmental Pol-icy and European Union environmental protection policy. On the one hand, industrial plants must function on the basis of economic calculation and mar-ket rules, on the other, their functioning and development must not cause excessive environment exploitation (Piasecki et al., 2016; Augusewicz et al., 2012). The rules and methods of sustainable development for agriculture and food industry plants include (Hadryjańska, 2008):• implementing the rule of eliminating pollution at its source through the
change of energy media, popularizing cleaner technology, minimizing energy and resources consumption, widespread normalization and limi-tation of emissions in industry,
• combining environmental costs into economical calculation, develop-ment and implementation of new economical tools for environment management,
• creating a coherent and stable legal and financial system compliant with the rule “the one who pollutes is the one who pays”, ensuring effective funding of environment protection,
• implementing solutions aimed to ensure ecological safety,• diversifying energy sources in the ecologically required direction, includ-
ing increased energy production from renewable sources,• conducting research programs aimed to increase the effectiveness of
using environmental resources in production processes, especially devel-opment of alternative fuels technology allowing to replace petrochemical fuels and other based on carbohydrates,
• developing a mechanism for collecting data, controlling environment condition and obeying emission norms, as well as subjecting those pro-cesses and phenomena to monitoring and statistical analysis which have not been subjected to data collecting systems.The abovementioned goals might be achieved, among others, through
analysis and changes in environmental aspects typical for dairy plants. The technical network should allow separation of industrial sewage, meteoric and cooling water. The actions connected with water management in a dairy plant should lead to the optimization of water consumption by minimizing its usage, recycling and water cycling closing. The problem of wastewater emis-sion is strictly connected with water consumption. Its amount and content depend directly on the amount of water used for production purposes. Pro-duction increase within a dairy plant is connected with increased water con-
EKONOMIA I ŚRODOWISKO 2 (69) • 2019Studies and materials140
sumption and wastewater generation. The amount of waste might be limited, but as a consequence there might be an increase of pollutants concentration in sewage disposed to WWTP. Such a situation was found out in dairy plants from province. In the case of dairy WWTPs, the actions must be focused on reducing the amount of biogenic substances present in sewage after treat-ment. According to BAT Reference Document, reduction in water consump-tion and the amount of wastewater in diary industry might be achieved through, among others, widespread usage of CIP, applying a closed network in cooling systems, collective heating and cooling systems, limiting raw mate-rial waste and making use of whey (BAT, 2005; IPPC, 2006). Leakages and the possibility of raw material and production waste accessing wastewater must be reduced to minimum. An even more common application of dissolved air flotation (DAF) has been observed in installations with primary treatment of sewage sludge. The DAF process allows to significantly reduce the pollution load subjected to biological treatment. In the research carried out in Bielm-lek in 2017 (Żyłka et al., 2018) the average efficiency of DAF treatment was 59.3% for BOD, 49.0% for COD and 80.0% for total phosphorus while in Mle-kovita in Wysokie Mazowieckie it was 62%, 65% and 51% respectively. Moreover, the waste generated in this process may undergo anaerobic stabi-lization, which as a consequence allows energy production. Another advan-tage of applying DAF process is the possibility of avoiding the extension of the biological part of WWTP in the case of raw sewage load increase. Accord-ing to sustainable development rules, applying anaerobic sewage sludge digestion is advisable. Energy production and its disposal to the external net-work lower the costs connected with functioning of a WWTP and decrease the need for energy produced from coal. Sewage sludge typical for dairy WWTPs is characterized by low content of heavy metals and might be sub-jected to recycling after anaerobic or aerobic treatment. There is also no san-itary hazard due to the fact that wastewater from food industry does not contain microbiological pollutants. Sewage sludge from Podlaskie WWTPs is used in agriculture as valuable fertilizer (Dąbrowski, 2009). Sustainable development is recently also recovery of raw materials, mainly phosphorus and nitrogen, from wastewater and sewage. Main measures taken in order to reduce the amount of hazardous waste and waste other than hazardous within a dairy plant are, among others: production optimization aimed at minimizing raw material waste, reducing the amount of waste whey, using fully automatized production lines for product packaging, modernization of light and its automatized control and creating heat energy necessary for pro-duction in a gas boiler house. Because of technical issues, dairy plants must rely on coal boiler houses to a large degree; reducing the amount of waste such as slag might be achieved through boiler houses modernization and the
EKONOMIA I ŚRODOWISKO 2 (69) • 2019 Studies and materials 141
use of high quality fuel. It would have influence on reducing emission of air pollution. A large part of waste in a dairy plant is recycled, which is provided by specialized companies. Sewage sludge as a byproduct of sewage treatment is successfully recycled and returns to the environment as fertilizer. Reducing the emission of air pollution is one of the main problems of plants using coal boiler houses. If there is no possibility to change such fuel to gas, it is neces-sary to modernize boiler houses in order to reduce pollution, especially dust, sulfur, carbon dioxide and nitric oxides. Using high quality coal and effective filters is vital. Reducing emission of particular matter (PM 10 and PM 2,5) is crucial when taking into consideration the problem of air pollution in Poland. Reducing energy consumption in a dairy plant will result in reducing the emission of air pollution into the atmosphere (Dąbrowski, Żyłka, 2015). Reducing the emission of noise and odor is a separate issue. At present, as means of protection against noise in a dairy plant, the following methods, technology and techniques which minimize the impact are used: applying modern devices which emit little noise, constructing acoustic screens, limit-ing to the necessary minimum the movement of vehicles within a plant through appropriate planning of delivery routes, building a warehouse for completed products, and such functioning of devices in automatic cycle which reduces the possibility of simultaneous work. In the course of dairy processing, the problem of noise emission is mainly connected with the pro-duction of powdered milk. Suitable location of dairy plants and limiting the possibility of creating housing areas nearby causes only rare cases when dairy plants must apply special means to reduce noise emission. Odor emis-sion is a similar problem which concerns only dairy WWTPs. Their location is the most important. Deodorization facilities, which reduce odor emission from primary treatment and sewage sludge stabilization, are commonly used.
Reducing electric energy consumption in dairy plants has a major influ-ence not only on decreasing the plants’ negative impact on the environment, but definitely connects sustainable development with economic industry plants effect (Graczyk, 2009; Makarewicz-Marcinkiewicz, 2015). A compa-ny’s actions must result in assumed financial profit, but on the other hand it is necessary to invest in pro-ecological solutions, which increase a company’s operating cost (Karolinczak, Miłaszewski, 2016). The application of cogen-eration, that is connecting heat and electric energy production, is one of the development aims. In order to reduce and optimize electric energy consump-tion, it is necessary to apply modern monitoring systems in relation to pro-duction processes effectiveness. The research conducted by the authors at a wastewater treatment plant in Bielmlek in Bielsk Podlaski has shown a pos-sibility of reducing energy consumption in the processes of dairy sewage and
EKONOMIA I ŚRODOWISKO 2 (69) • 2019Studies and materials142
sewage sludge treatment (Dąbrowski et al., 2017). Reducing energy con-sumption consequently means decreasing emissions from coal power plants and thus reducing carbon footprint. It also means lowering production cost, which will have a positive effect on the economic situation of the dairy indus-try.
Conclusions
In 1997 a notation on sustainable development was introduced to the Constitution of the Republic of Poland, the date being symbolic and crucial for the development of our country and society. Based on the analysis of dairy plants, it can be concluded that their sustainable development might contrib-ute to the development of north-eastern Poland. Those regions must be pro-tected because of their environmental value, but on the other hand it does not exclude development of specific industry branches, especially food indus-try. The industrial plants underwent transformation in the 1990s and their current technical condition does not differ from that of other European coun-tries. Production growth does not have to cause an increased impact on the environment. Appropriate financial mechanisms and ecological awareness led to a compromise between development and environmental standards. The current direction for development is to reduce energy consumption and lower emissions from production processes, especially from heat energy pro-duction. Plants have transformed from energy consumers to its producers, whereas waste generated during production process might become a valua-ble product. Future tendency is to develop anaerobic systems for dairy sew-age and sludge treatment. It will allow to produce electric and heat energy from biogas. By the moment in podlaskie province only WWTP belonging to Mlekovita is successfully utilizing anaerobic digestion of sewage and flota-tion sludge with energy production.
Acknowledgements
The research was funded by Research Project conducted in the Depart-ment of Technology in Engineering and Environmental Protection BUT-No.S/WBiIŚ/3/2014, founded by Ministry of Science and Higher Education.
The contribution of the authors
Józefa Wiater – 30% (contributed in analysis and interpretation of data and over-viewing the whole text, supervised the progress of the work and coordinated tasks of each author).
Wojciech Dąbrowski – 20% (contributed in creating the conception of article and analysis and interpretation of data).
EKONOMIA I ŚRODOWISKO 2 (69) • 2019 Studies and materials 143
Dariusz Boruszko – 20% (involved in literature review and text correction).Radosław Żyłka – 20% (responsible for acquisition and edition of data and artwork).Sylwia Antonowicz – 10% (helped in data acquisition, provided valuable informa-
tion about the Bielmlek plant and also overviewed the text).
Literature
Augusewicz et. al (2012), Economic aspects of environmental protection, “Civil and Environmental Engineering. Budownictwo i Inżynieria Środowiska” No. 3, p. 17-23 (in Polish)
Best Available Techniques, Guidelines for the dairy industry (2005), the Ministry of Environment, Warsaw, http://www.ekoportal.gov.pl
Boruszko D., Dąbrowski W., Wiater J. (2018), Development of Road Infrastructure in Environmentally Valuable Areas – Sustainable Designing, Problemy Ekorozwoju – Problems of Sustainable Development” Vol. 13, No. 1, p. 209-216
Boruszko D., Dąbrowski W. (2016), Reference of application for IPPC for dairy coop-erative Mlekovita in Wysokie Mazowieckie, Ekom, Białystok
Boruszko D., Dąbrowski W., Magrel L. (2004), Reference of application for IPPC for dairy cooperative Bielmlek, Ekom, Białystok
Budny J., Turowski J. (2005a), Reference of application – water, „Przegląd Mleczarski” No. 2, p. 28-31 (in Polish)
Budny J., Turowski J. (2005b), Reference of application – electric energy, „Przegląd Mleczarski” No. 6, p. 18-21 (in Polish)
CSO, Central Statistic Office (2016), Statistical Yearbook of Agriculture, Statistical Publishing Establishment, Warsaw
Dąbrowski W. (2009), Treatment and final utilization of sewage sludge from dairy waste water treatment plants located in Podlaskie province. Contemporary Prob-lems of Management and Environmenal Protection, “Sewages and Waste Materials in Environment” No. 10, p. 141-151
Dąbrowski W. et al. (2017), Evaluation of energy consumption during aerobic sewage sludge treatment in dairy wastewater treatment plant, “Environmental Research” No. 153, p. 135-139, https://doi.org/10.1016/j.envres.2016.12.001
Dabrowski W., Żyłka R. (2015), Evaluation of energy consumption in dairy WWTP Bielmlek Bielsk Podlaski, “Ecological Engineering” No. 43, p. 68-74, DOI: https://doi.org/10.12912/23920629/58905
Danalewich J.R. et al. (1998), Characterization of dairy waste streams, current treat-ment practices, and potential for biological nutrient removal, “Water Research” No. 32(12), p. 3555-3568 https://doi.org/10.1016/S0043-1354(98)00160-2
Graczyk A. (2009), Market mechanisms in environment protection as sustainable development factor, “Problems of Sustainable Development” No. 4(1), p. 99-108
Gugała M. et al. (2015), Wastewater management in food processing enterprises – a case study of the Ciechanów dairy cooperative, “Journal of Ecological Engineer-ing” No. 16(1), p. 178-183, DOI: 10.12911/22998993/605
Hadryjańska B. (2008), The ecologisation process in dairy companies in Wielkopolska voivodeship in the light of the ecological policy of the European Union. Problems of
EKONOMIA I ŚRODOWISKO 2 (69) • 2019Studies and materials144
world agriculture, “Science Notebooks of Warsaw University of Life Sciences” No. 4, p. 174-184
Integrated Pollution Prevention and Control (IPPC) (2006), Reference Document on Best Available Techniques in the Food, Drink and Milk Industries, European Com-mission
Janczukowicz W. et al. (2008), Biodegradability evaluation of dairy effluents origi-nated in selected sections of dairy production, “Bioresource Technology” No. 99, p. 4199-4205, DOI: 10.1016/j.biortech.2007.08.077
Karolinczak B., Miłaszewski R. (2016), Application of assessment methods of the eco-nomic effectiveness of water supply and sewerage facilities, “Annual Set The Envi-ronment Protection” Vol.18, p. 770-782 (in Polish)
Makarewicz-Marcinkiewicz A. (2015), The Holistic Concept of Sustainable Develop-ment in Strategies of Polish Voivodeships to the Year 2020, “Problems Of Sustain-able Development” No. 10(2), p. 103-113
Piasecki A. et al. (2016), Development of water and wastewater management in the eastern provinces of poland, “Economics and Environment” No. 2(57), p. 50-63
Rodriguez A. et al. (2015), An adaptive observer for operating monitoring of anaerobic digestion wastewater treatment, “Chemical Engineering Journal” No. 286, p. 186-193, https://doi.org/10.1016/j.cej.2015.01.038
Struk-Sokołowska J. (2016), Research of daily and seasonal variability of dairy waste-water composition, “Ecological Engineering” No. 47, p. 74-81, DOI: https://doi.org/10.12912/23920629/62850
Struk-Sokołowska J., Ignatowicz K. (2013), Municipal and Dairy Wastewater Co-treat-ment Using SBR Technology, “Annual Set of Environment Protection” No. 15, p. 1881-1898
The Foundation of Assistance Programs for Agriculture FAPA (1998), Environmental protection in the dairy industry, Warsaw
Tiwary A. et al. (2015), Emerging perspectives on environmental burden minimization initiatives from anaerobic digestion technologies for community scale biomass valorization, “Renewable Sustainable Energy Reviews” No. 42, p. 883-901, https://doi.org/10.1016/j.rser.2014.10.052
Umiejewska K. (2017), Biological Anaerobic – Aerobic Treatment Of Dairy Wastewater In Poland, 15th International Conference on Environmental Science and Technol-ogy 2017, Rhodes, Greece, 31 August to 2 September 2017
www.farmer.plŻyłka R. et al. (2018), Trickling filter for high efficiency treatment of dairy sewage,
“Journal of Ecological Engineering” No. 19(4), p. 269-275, DOI: https://doi.org/ 10.12911/22998993/89657

Ekonomia i Środowisko 2 (69) • 2019
Economics and Environment 2 (69) • 2019
GENERAL ENVIRONMENTAL
AND SOCIAL PROBLEMS
PROBLEMATYKA OGÓLNOEKOLOGICZNA I SPOŁECZNA
EKONOMIA I ŚRODOWISKO • 2 (69) • 2019
SUSTAINABLE ENTERPRISE BY SUSTAINABLE PRODUCT? A CASE OF SMART HOME SYSTEMS
ABSTRACT: The notion of sustainable development becomes an increasingly important element in economic and social development planning. Therefore, in this context, such notions have appeared as: sustainable consumption, sustainable product or sustainable enterprise. The first part of the article contains identification of the notion of a sustainable enterprise and the determinants characterizing such an entity. In the second part an attempt has been made to assess whether the product in the form of an electric energy consumption management system can be considered a sustainable product. This evaluation has been conducted using the analysis of potential economic, social and environmental effects accompanying the use of electric energy consumption management systems in households. This assessment is to estimate the chances for obtaining the sustainability status by IT enterprises.
KEY WORDS: sustainable development, sustainable enterprise, sustainable product, smart home
Sylwia Słupik, PhD (ORCID 0000-0001-5141-6178) – University of Economics in KatowicePaweł Lorek, PhD (ORCID 0000-0003-3252-5234) – University of Economics in Katowice
Correspondence address:1 Maja Street 50, 40-287, Katowice, Polande-mail: [email protected]
Sylwia SŁUPIK • Paweł LOREK
JEL: O13, O33, Q40No. 2(69) 2019 • pages: 146-159 https://doi.org/10.34659/2019/2/27
EKONOMIA I ŚRODOWISKO 2 (69) • 2019 General environmental and social problems 147
Introduction
The conversion of the economy into a sustainable economy is becoming a challenge for an increasing number of countries, not only among the EU member states. One of the considered responses to these challenges is the circular economy concept. It is based on the necessity of transforming the production and consumption models towards a decrease in the scale of use of the environment (Korhonen et al., 2018). The transformation process devel-opment features formation of postulation concerning the stakeholders par-ticipating in the market. Thus, sustainable consumption (Scholl et al., 2010; Lim, 2017) and sustainable enterprise (Sharma, Ruud, 2003; Schaltegger, Wagner, 2010) models are emerging. The models assume, among others, decreasing the negative impact on the environment by reducing the quantity of consumed non-renewable resources (Milligan, O’Keeffe, 2019), decreasing energy consumption (Brown, 2015), promoting increased share of renew-able energy sources (del Rio, Gual, 2014). These activities are intended to establish a model of economy with substantially lower natural environment interference, but with maintenance of the economic and competitive poten-tial. In case of many enterprises, the following question arises: how to intro-duce the postulation of sustainable economy into the conducted activity pro-file?
This question also concerns the IT branch. IT enterprises are viewed by the society as having minor negative impact on the environment. This view probably has its roots in the subconscious comparison to the sector of heavy industry or mining enterprises. When examining this issue in relative terms, it is possible to conclude that IT enterprises deserve the label of sustainable enterprises. However, public perception is not a determinant which indisput-ably resolves the issue of classifying an economic entity into a specific cate-gory. Therefore, two fundamental research questions are outlined:1. What are the features of a sustainable enterprise?2. Can an IT enterprise achieve the status of a sustainable enterprise by
offering energy consumption management system solutions?Providing answers to the above questions is the main purpose of this
paper.
Sustainable enterprise characterisation
The interest of enterprises in the concept of sustainable development as well as decision-making in terms of social and environmental issues is related, among others, with the existence of such factors as (Brzozowski, 2015, p. 139):
EKONOMIA I ŚRODOWISKO 2 (69) • 2019General environmental and social problems148
• changes in the expectation of communities, including consumers and organisation employees, related to increasing awareness and creation of new, sustainable values concerning the model of consumption, safety of products, working conditions, etc.,
• changes in the technological environment and substantial increase in knowledge, thus enabling broad opportunities for creating changes in the methods of organisation functioning, offered products and services,
• institutional and legal conditions which determine the desired directions and framework of development of the economy and particular entities (Przychodzeń, 2013).The term of sustainable development in relation to enterprises (Sustain-
able Enterprise Development) was firstly used during the World Sustainable Development Summit in Johannesburg in 2002, where attention was paid to the substantial role that enterprises can play in favour of sustainable devel-opment (Business Action for Sustainable Development). The summit proposed a public-private partnership and the necessity of socially-responsible man-agement, which in consequence contributed to the attempt of adapting the concept of sustainable enterprise development globally. However, the con-cept of sustainable enterprise development causes a lot of discussion and conflicts, because as of yet the definition of a sustainable enterprise or the possible benefits of incorporating new principles of operation have not been precisely established (Raftowicz-Filipkiewicz, 2013).
When analysing the subject literature, it is possible to assume that the sustainable enterprise development category is presented in many aspects. The Triple Bottom Line concept proposed by J. Elkington (2004) assumes that an enterprise’s success depends on its economic, ecological and social dimen-sions. It especially concerns the individual behaviour of entrepreneurs in relation to social and ecological problems, which translates into the ethical dimension of conducting economic activity (Business Ethics). Simultaneously, the issue also related to the important role played by an enterprise in a soci-ety (Business and Society), which is linked to the concept of enterprise citi-zenship (Corporate Citizenship) or enterprise social responsibility (Corporate Social Responsibility – CRS) (Paszkiewicz, Szadziewska, 2011).
In their decision-making process, which includes the estimation of prof-its and losses, enterprises should take into consideration the so-called social costs of the decisions, responsibility for the natural environment and local community, inclusion of social objectives in the company’s strategic objec-tives, monitoring and measuring the costs of social programs as well as the degree of execution of the assumed achievements, reliable creation and shar-ing of reports on the degree of execution of social and ecological objectives as
EKONOMIA I ŚRODOWISKO 2 (69) • 2019 General environmental and social problems 149
well as reports on the status and expenditure of resources intended for the company’s sustainable development system (Adamczyk, 2009).
Enterprises should feature mutual interactions between the achievement of particular groups of objectives. The achievement of economic objectives in the form of, among others, profit is a necessary condition for taking on eco-logical and social actions. The functioning of an entity also depends on the level of acceptance of its products and activity by the surroundings, which translates into the improvement of economic results. It is therefore impor-tant to skilfully coordinate a company’s activity in three areas by achieving its main objective of maintenance and development on the market (Sza-dziewska, 2010). The inclusion of the sustainable development concept in the achievement of an enterprise’s objectives is presented in figure 1.
When taking into consideration figure 1, it is also necessary to emphasise that an enterprise’s sustainable development is possible only when it includes an integration of economic, ecological and social objectives both in short- and long-term. This translates into the designing of activities that are socially responsible, ecologically friendly and economically valuable (Kryk, 2005, p. 200). These activities include, among others, the following (Szadziewska, 2010):• rational use of natural resources,• preventing negative impact on the environment by, among others, using
new eco-friendly technologies and devices reducing the quantities of released pollutants,
• taking on initiatives aimed at supporting local communities, e.g. by exe-cuting sponsorship and charitable activities,
• taking care for the quality of manufactured products,• investing in natural environment protection undertakings,• compliance with the principles of ethics in the relations with employees,
partners and consumers.According to Laville (2004 p. 26), enterprises are sustainable when they
aim at achieving long-term sustainable growth and development ideas by, among others, strong engagement in promoting social and ecological values, dialogue with stakeholders (especially in crisis situations), committing to the transparency of actions and diffusion of information about the enterprise or responding to direct (or indirect) effects of conducting economic activity (Raftowicz-Filipkiewicz, 2013). This means that an enterprise which claims to be sustainable should change the current functioning paradigms – from traditional to sustainable development – which is presented in table 1.
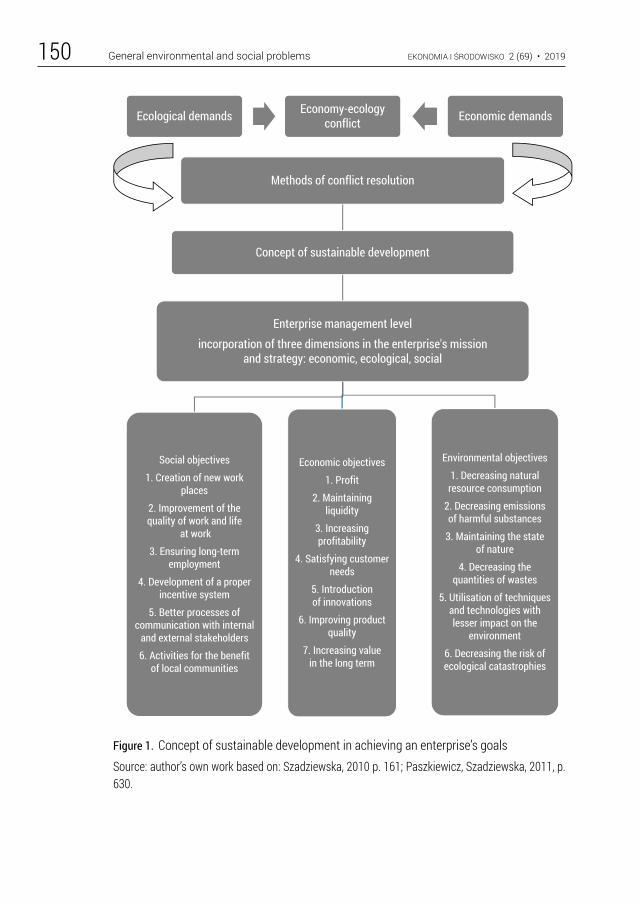
EKONOMIA I ŚRODOWISKO 2 (69) • 2019General environmental and social problems150
Figure 1. Concept of sustainable development in achieving an enterprise’s goalsSource: author’s own work based on: Szadziewska, 2010 p. 161; Paszkiewicz, Szadziewska, 2011, p. 630.
Ecological demands Economy-ecology conflict Economic demands
Methods of conflict resolution
Concept of sustainable development
Enterprise management levelincorporation of three dimensions in the enterprise's mission
and strategy: economic, ecological, social
Social objectives1. Creation of new work
places2. Improvement of the quality of work and life
at work3. Ensuring long-term
employment4. Development of a proper
incentive system5. Better processes of
communication with internal and external stakeholders6. Activities for the benefit
of local communities
Economic objectives1. Profit
2. Maintaining liquidity
3. Increasing profitability
4. Satisfying customer needs
5. Introduction of innovations
6. Improving product quality
7. Increasing value in the long term
Environmental objectives1. Decreasing natural resource consumption
2. Decreasing emissions of harmful substances
3. Maintaining the state of nature
4. Decreasing the quantities of wastes
5. Utilisation of techniques and technologies with lesser impact on the
environment6. Decreasing the risk of ecological catastrophies
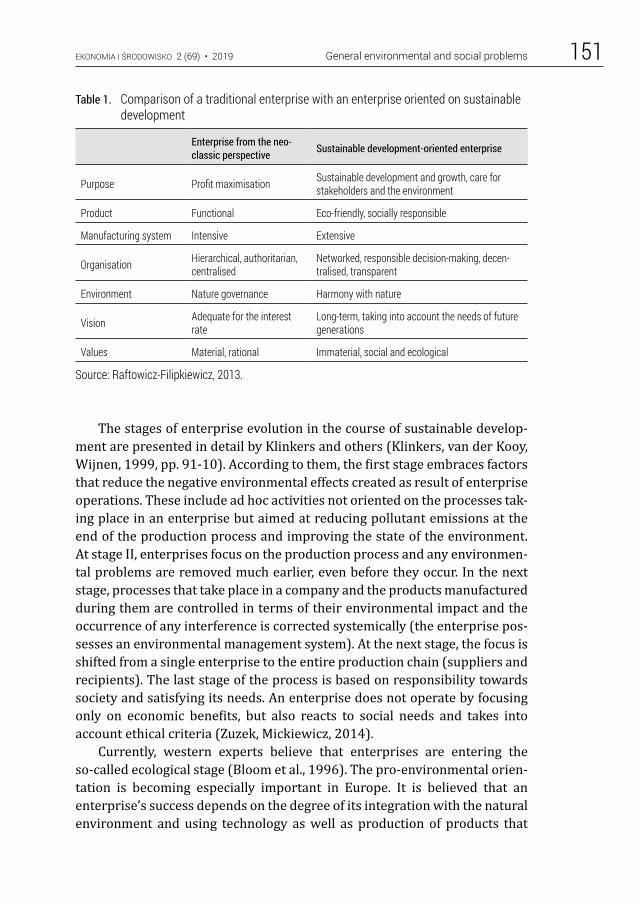
EKONOMIA I ŚRODOWISKO 2 (69) • 2019 General environmental and social problems 151
Table 1. Comparison of a traditional enterprise with an enterprise oriented on sustainable development
Enterprise from the neo-classic perspective Sustainable development-oriented enterprise
Purpose Profit maximisation Sustainable development and growth, care for stakeholders and the environment
Product Functional Eco-friendly, socially responsible
Manufacturing system Intensive Extensive
Organisation Hierarchical, authoritarian, centralised
Networked, responsible decision-making, decen-tralised, transparent
Environment Nature governance Harmony with nature
Vision Adequate for the interest rate
Long-term, taking into account the needs of future generations
Values Material, rational Immaterial, social and ecological
Source: Raftowicz-Filipkiewicz, 2013.
The stages of enterprise evolution in the course of sustainable develop-ment are presented in detail by Klinkers and others (Klinkers, van der Kooy, Wijnen, 1999, pp. 91-10). According to them, the first stage embraces factors that reduce the negative environmental effects created as result of enterprise operations. These include ad hoc activities not oriented on the processes tak-ing place in an enterprise but aimed at reducing pollutant emissions at the end of the production process and improving the state of the environment. At stage II, enterprises focus on the production process and any environmen-tal problems are removed much earlier, even before they occur. In the next stage, processes that take place in a company and the products manufactured during them are controlled in terms of their environmental impact and the occurrence of any interference is corrected systemically (the enterprise pos-sesses an environmental management system). At the next stage, the focus is shifted from a single enterprise to the entire production chain (suppliers and recipients). The last stage of the process is based on responsibility towards society and satisfying its needs. An enterprise does not operate by focusing only on economic benefits, but also reacts to social needs and takes into account ethical criteria (Zuzek, Mickiewicz, 2014).
Currently, western experts believe that enterprises are entering the so-called ecological stage (Bloom et al., 1996). The pro-environmental orien-tation is becoming especially important in Europe. It is believed that an enterprise’s success depends on the degree of its integration with the natural environment and using technology as well as production of products that
EKONOMIA I ŚRODOWISKO 2 (69) • 2019General environmental and social problems152
meet ecological criteria. The predominant position in subject literature is that the pro-ecological attitude of enterprises, related to their ecological responsibility, positively affects their competitive position. When building an enterprise’s competitive position, it is possible to use various environmental management models. Special attention is paid to systems related to the pos-sibility of evaluating achievements utilising the experience of various compa-nies with the use of benchmarking, for instance. The practical possibilities of such a solution are greater than when using natural environment manage-ment set mainly on creating strategies and policies. Such models feature the use of particular groups of indicators related to (Chodyński, 2007):• the natural environment management in relation to the vision, strategy,
policy, organisational structure and management system with considera-tion of the foreseeable effects on the natural environment and communi-cation with internal and external stakeholders,
• the achieved operating results via measurements on processes and tech-nical aspects of products, using these products and servicing activities as well as cooperation with suppliers. The impact on the natural environ-ment, related to the consumption of energy, water, materials, emission of greenhouse gases and total waste quantity should also be subjected to analysis.
• indicators related to the impact on local, national, international condi-tions and on the ozone layer, increase in global temperature, oceanic fish population, pollution on local and regional level, impact on population density. The noise around enterprises should also be taken into consider-ation.Any activities taken on by an enterprise, which minimise the negative
impact on the natural environment can be deemed as a manifestation of the sustainable development concept. Companies thus contribute to the mainte-nance of the proper quantity and quality of natural capital, which is essential for the satisfaction of the needs of current and future generations as well as adapting the scale of the economy to the ecosystems in which it operates (Zuzek, Mickiewicz, 2014). In the case of sustainable development, enter-prises can also determine specific, unique, ecological competing instruments. These instruments include the following (Jabłoński, 2010):• ecological quality of products and technologies,• ecological innovation meaning the organisation’s ability to introduce
innovation in relation to the market in terms of external ecological ten-dencies and internal company conditions,
• flexibility in adapting ecological products to customer needs in relation to marketing mix activities,
EKONOMIA I ŚRODOWISKO 2 (69) • 2019 General environmental and social problems 153
• creating a pro-ecological company image in relation to the positive per-ception of an ecological product brand,
• lowering the costs of activity through pro-ecological management.The best-known way of implementing the sustainable development con-
cept at the level of enterprises is the cleaner production programme. This idea dates back to 1980s (USA), and makes the need to protect the health of people and the environment considered in the organisation and the technol-ogy used. This applies to the production phase as well as other product life stages (Rybak, 2004). Suitability and effectiveness of the clean production concept can be examined using the European programme for management and environmental audits (EMAS). EMAS is a concept of environmentally-ori-ented management of a business entity, incorporating continuous monitor-ing of the condition of the environment, associated with or exposed to the effects of the entity. EMAS encourages reduction in harmful actions, obligates to comply with the requirements formulated by the law as well as enforces accountability for preserving environmental standards. It makes it possible to implement corrective programmes, providing subsequent stages of improvements, determining the schedule of activities and appointing the persons responsible for their implementation. EMAS implements environ-mental management systems, orders notifications for the society concerning the effects of activities (reporting), imposes obligations on the employees, subcontractors, business partners with regard to eco-management (Rybak, 2004; Brzozowski, 2010).
However, this is not the only instrument for verifying performance in implementing the sustainable development concept. Other, equally universal ones should also be remembered, as, for example, the Global Reporting Initi-ative (a popular framework reporting model for economic, social and envi-ronmental performance), UN Global Compact (human rights, labour stand-ards), Sullivan Principles (global social responsibility), OECD Guidelines for multinational corporations, INNOVAST (investment analysis in the scope of sustainable value, or standards of the Caux Round Table: CA8000, ISO14000 ISO14063, ISO26000, AA1000) (Brzozowski, 2010).
Energy consumption management systems as a sustainable product
Energy consumption is of key importance for the introduction of sustain-able development. A general tendency associated with sustainable develop-ment is the decrease in energy consumption. This decrease should concern both the sector of enterprises and individual recipients. In the case of indi-
EKONOMIA I ŚRODOWISKO 2 (69) • 2019General environmental and social problems154
vidual recipients, the reduction in energy consumption is related to many factors. These factors can include: presence of individual sources of energy, type of used equipment and technical parameters of buildings. Therefore, making the choices resulting in actual reduction of energy consumption requires relatively vast knowledge in various disciplines. An equally impor-tant and complex issue in this case is the monitoring, management and fore-casting of energy consumption including the related costs. Presence of energy sources, the performance of which is related to weather conditions, existence of habits unnoticed by the recipient, which cause excessive energy consump-tion, use of household appliances in an unskilful, ineffective manner are the factors that have substantial impact on the final level of energy consumption. High hopes were related in this aspect to the dissemination of smart meters as tools supporting better energy consumption management. Unfortunately, in general, the devices provide access to collective energy consumption sta-tistics in the scale of a household and do not allow identifying the critical areas of its use (Kugler et al., 2013). Therefore, this solution had to be evalu-ated as insufficient. In the view of this fact, the concept of integrated energy consumption management systems was becoming formulated as an element associated with the idea of the so-called smart home. The concept of house-hold energy consumption management support systems was mainly described from a technical point of view (Barbato et al., 2014; Fernandez et al., 2016; Martellotta et al., 2017; Anandalakshmi et al., 2014; Bouhafs et al., 2014; Beaudin et al., 2017). The primary functionalities of an energy con-sumption management system are as follows (Bouhafs et al., 2014):• improvement of the effectiveness of electricity consumption,• ensuring exchange of information for the purpose of better management
of the household infrastructure operation,• designation of an optimal scheme of resident functioning and their activ-
ities with the purpose of achieving the highest possible level of savings,• changing the functioning of a household without violating the users’
comfort of life.The system user can therefore use such information as detailed reports
on energy consumption (Ford et al., 2017) or forecasts on the future energy demand and the related costs (Shakeri et al., 2018). This information is aimed at providing recommendations concerning possible activities resulting in a reduced energy demand. The energy consumption management system ele-ments can also include modules ensuring the optimal use of renewable energy source systems (Hemmati, 2017). One of the newest trends concern-ing this topic is the use of the so-called Internet of Things (IoT) idea (Sha et al., 2018), which is deemed as one of the most important contemporary tech-nological trends (Lopez et al., 2017). This term is understood as a collection
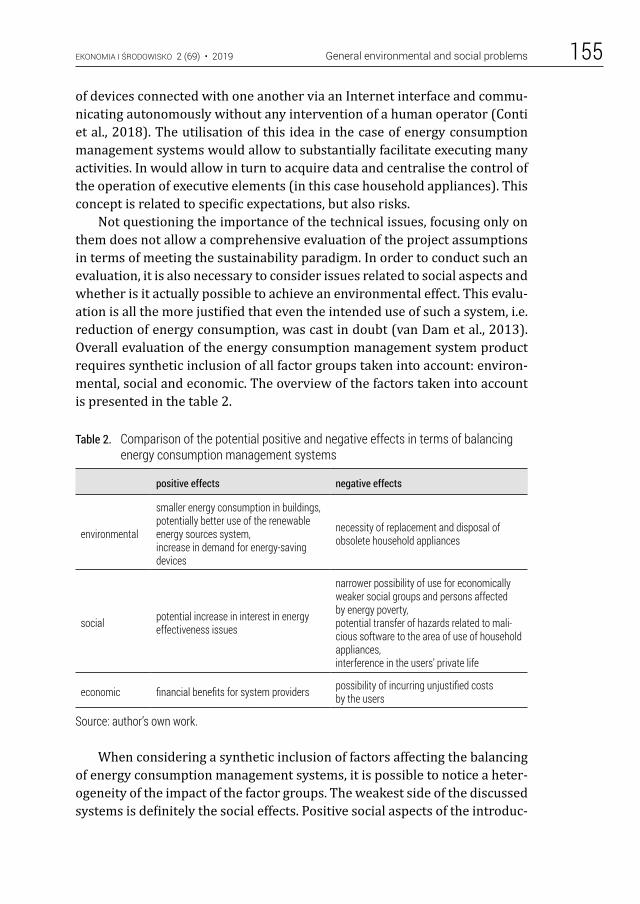
EKONOMIA I ŚRODOWISKO 2 (69) • 2019 General environmental and social problems 155
of devices connected with one another via an Internet interface and commu-nicating autonomously without any intervention of a human operator (Conti et al., 2018). The utilisation of this idea in the case of energy consumption management systems would allow to substantially facilitate executing many activities. In would allow in turn to acquire data and centralise the control of the operation of executive elements (in this case household appliances). This concept is related to specific expectations, but also risks.
Not questioning the importance of the technical issues, focusing only on them does not allow a comprehensive evaluation of the project assumptions in terms of meeting the sustainability paradigm. In order to conduct such an evaluation, it is also necessary to consider issues related to social aspects and whether is it actually possible to achieve an environmental effect. This evalu-ation is all the more justified that even the intended use of such a system, i.e. reduction of energy consumption, was cast in doubt (van Dam et al., 2013). Overall evaluation of the energy consumption management system product requires synthetic inclusion of all factor groups taken into account: environ-mental, social and economic. The overview of the factors taken into account is presented in the table 2.
Table 2. Comparison of the potential positive and negative effects in terms of balancing energy consumption management systems
positive effects negative effects
environmental
smaller energy consumption in buildings,potentially better use of the renewableenergy sources system,increase in demand for energy-saving devices
necessity of replacement and disposal of obsolete household appliances
social potential increase in interest in energy effectiveness issues
narrower possibility of use for economically weaker social groups and persons affected by energy poverty,potential transfer of hazards related to mali-cious software to the area of use of household appliances,interference in the users’ private life
economic financial benefits for system providers possibility of incurring unjustified costs by the users
Source: author’s own work.
When considering a synthetic inclusion of factors affecting the balancing of energy consumption management systems, it is possible to notice a heter-ogeneity of the impact of the factor groups. The weakest side of the discussed systems is definitely the social effects. Positive social aspects of the introduc-
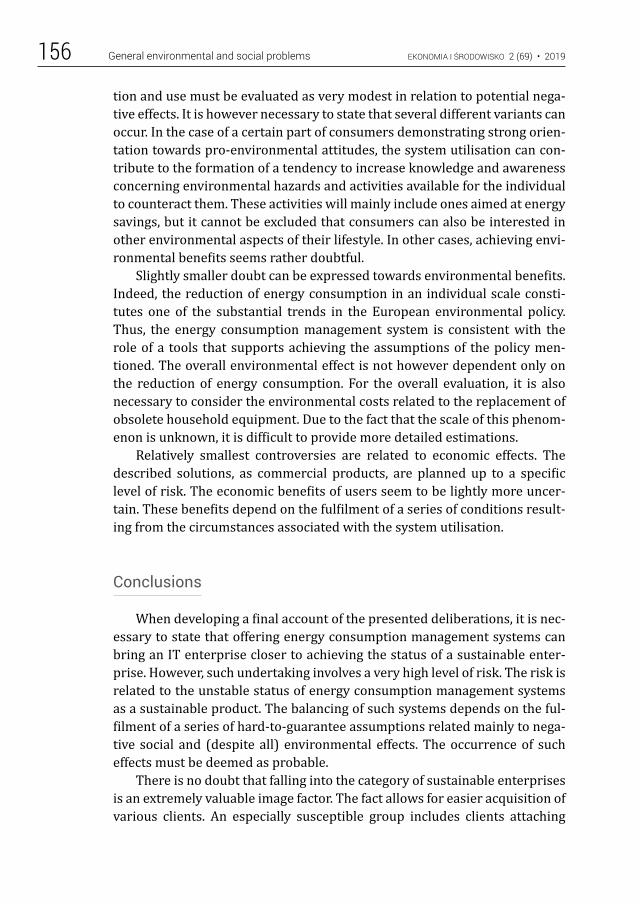
EKONOMIA I ŚRODOWISKO 2 (69) • 2019General environmental and social problems156
tion and use must be evaluated as very modest in relation to potential nega-tive effects. It is however necessary to state that several different variants can occur. In the case of a certain part of consumers demonstrating strong orien-tation towards pro-environmental attitudes, the system utilisation can con-tribute to the formation of a tendency to increase knowledge and awareness concerning environmental hazards and activities available for the individual to counteract them. These activities will mainly include ones aimed at energy savings, but it cannot be excluded that consumers can also be interested in other environmental aspects of their lifestyle. In other cases, achieving envi-ronmental benefits seems rather doubtful.
Slightly smaller doubt can be expressed towards environmental benefits. Indeed, the reduction of energy consumption in an individual scale consti-tutes one of the substantial trends in the European environmental policy. Thus, the energy consumption management system is consistent with the role of a tools that supports achieving the assumptions of the policy men-tioned. The overall environmental effect is not however dependent only on the reduction of energy consumption. For the overall evaluation, it is also necessary to consider the environmental costs related to the replacement of obsolete household equipment. Due to the fact that the scale of this phenom-enon is unknown, it is difficult to provide more detailed estimations.
Relatively smallest controversies are related to economic effects. The described solutions, as commercial products, are planned up to a specific level of risk. The economic benefits of users seem to be lightly more uncer-tain. These benefits depend on the fulfilment of a series of conditions result-ing from the circumstances associated with the system utilisation.
Conclusions
When developing a final account of the presented deliberations, it is nec-essary to state that offering energy consumption management systems can bring an IT enterprise closer to achieving the status of a sustainable enter-prise. However, such undertaking involves a very high level of risk. The risk is related to the unstable status of energy consumption management systems as a sustainable product. The balancing of such systems depends on the ful-filment of a series of hard-to-guarantee assumptions related mainly to nega-tive social and (despite all) environmental effects. The occurrence of such effects must be deemed as probable.
There is no doubt that falling into the category of sustainable enterprises is an extremely valuable image factor. The fact allows for easier acquisition of various clients. An especially susceptible group includes clients attaching
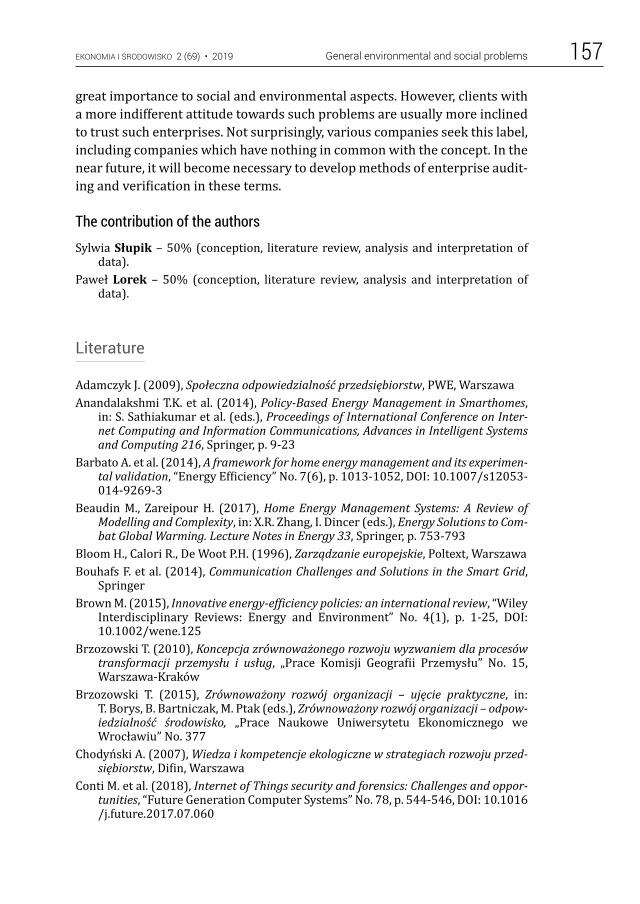
EKONOMIA I ŚRODOWISKO 2 (69) • 2019 General environmental and social problems 157
great importance to social and environmental aspects. However, clients with a more indifferent attitude towards such problems are usually more inclined to trust such enterprises. Not surprisingly, various companies seek this label, including companies which have nothing in common with the concept. In the near future, it will become necessary to develop methods of enterprise audit-ing and verification in these terms.
The contribution of the authors
Sylwia Słupik – 50% (conception, literature review, analysis and interpretation of data).
Paweł Lorek – 50% (conception, literature review, analysis and interpretation of data).
Literature
Adamczyk J. (2009), Społeczna odpowiedzialność przedsiębiorstw, PWE, WarszawaAnandalakshmi T.K. et al. (2014), Policy-Based Energy Management in Smarthomes,
in: S. Sathiakumar et al. (eds.), Proceedings of International Conference on Inter-net Computing and Information Communications, Advances in Intelligent Systems and Computing 216, Springer, p. 9-23
Barbato A. et al. (2014), A framework for home energy management and its experimen-tal validation, “Energy Efficiency” No. 7(6), p. 1013-1052, DOI: 10.1007/s12053-014-9269-3
Beaudin M., Zareipour H. (2017), Home Energy Management Systems: A Review of Modelling and Complexity, in: X.R. Zhang, I. Dincer (eds.), Energy Solutions to Com-bat Global Warming. Lecture Notes in Energy 33, Springer, p. 753-793
Bloom H., Calori R., De Woot P.H. (1996), Zarządzanie europejskie, Poltext, WarszawaBouhafs F. et al. (2014), Communication Challenges and Solutions in the Smart Grid,
SpringerBrown M. (2015), Innovative energy-efficiency policies: an international review, “Wiley
Interdisciplinary Reviews: Energy and Environment” No. 4(1), p. 1-25, DOI: 10.1002/wene.125
Brzozowski T. (2010), Koncepcja zrównoważonego rozwoju wyzwaniem dla procesów transformacji przemysłu i usług, „Prace Komisji Geografii Przemysłu” No. 15, Warszawa-Kraków
Brzozowski T. (2015), Zrównoważony rozwój organizacji – ujęcie praktyczne, in: T. Borys, B. Bartniczak, M. Ptak (eds.), Zrównoważony rozwój organizacji – odpow-iedzialność środowisko, „Prace Naukowe Uniwersytetu Ekonomicznego we Wrocławiu” No. 377
Chodyński A. (2007), Wiedza i kompetencje ekologiczne w strategiach rozwoju przed-siębiorstw, Difin, Warszawa
Conti M. et al. (2018), Internet of Things security and forensics: Challenges and oppor-tunities, “Future Generation Computer Systems” No. 78, p. 544-546, DOI: 10.1016 /j.future.2017.07.060
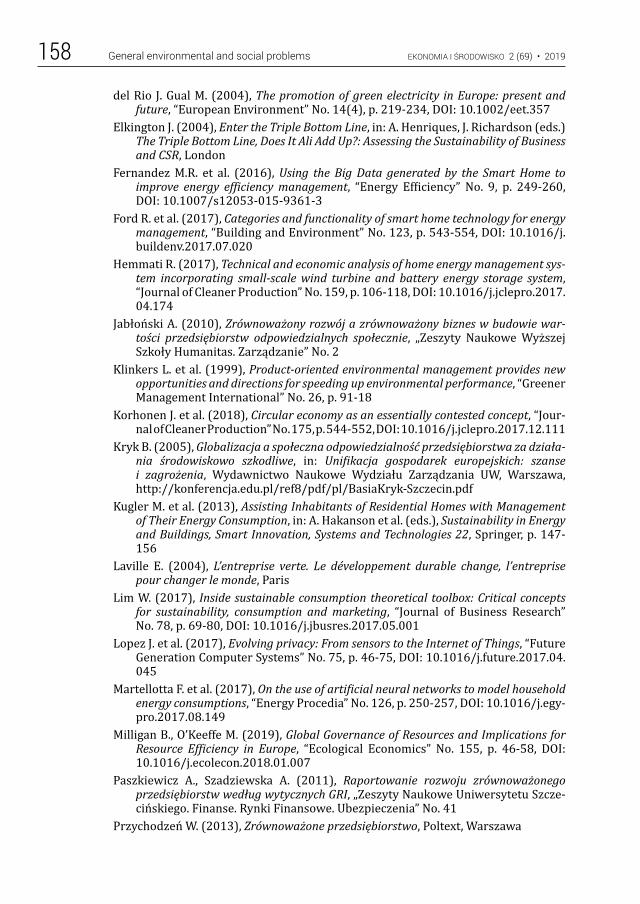
EKONOMIA I ŚRODOWISKO 2 (69) • 2019General environmental and social problems158
del Rio J. Gual M. (2004), The promotion of green electricity in Europe: present and future, “European Environment” No. 14(4), p. 219-234, DOI: 10.1002/eet.357
Elkington J. (2004), Enter the Triple Bottom Line, in: A. Henriques, J. Richardson (eds.) The Triple Bottom Line, Does It Ali Add Up?: Assessing the Sustainability of Business and CSR, London
Fernandez M.R. et al. (2016), Using the Big Data generated by the Smart Home to improve energy efficiency management, “Energy Efficiency” No. 9, p. 249-260, DOI: 10.1007/s12053-015-9361-3
Ford R. et al. (2017), Categories and functionality of smart home technology for energy management, “Building and Environment” No. 123, p. 543-554, DOI: 10.1016/j.buildenv.2017.07.020
Hemmati R. (2017), Technical and economic analysis of home energy management sys-tem incorporating small-scale wind turbine and battery energy storage system, “Journal of Cleaner Production” No. 159, p. 106-118, DOI: 10.1016/j.jclepro.2017. 04.174
Jabłoński A. (2010), Zrównoważony rozwój a zrównoważony biznes w budowie war-tości przedsiębiorstw odpowiedzialnych społecznie, „Zeszyty Naukowe Wyższej Szkoły Humanitas. Zarządzanie” No. 2
Klinkers L. et al. (1999), Product-oriented environmental management provides new opportunities and directions for speeding up environmental performance, “Greener Management International” No. 26, p. 91-18
Korhonen J. et al. (2018), Circular economy as an essentially contested concept, “Jour-nal of Cleaner Production” No. 175, p. 544-552, DOI: 10.1016/j.jclepro.2017.12.111
Kryk B. (2005), Globalizacja a społeczna odpowiedzialność przedsiębiorstwa za działa-nia środowiskowo szkodliwe, in: Unifikacja gospodarek europejskich: szanse i zagrożenia, Wydawnictwo Naukowe Wydziału Zarządzania UW, Warszawa, http://konferencja.edu.pl/ref8/pdf/pl/BasiaKryk-Szczecin.pdf
Kugler M. et al. (2013), Assisting Inhabitants of Residential Homes with Management of Their Energy Consumption, in: A. Hakanson et al. (eds.), Sustainability in Energy and Buildings, Smart Innovation, Systems and Technologies 22, Springer, p. 147-156
Laville E. (2004), L’entreprise verte. Le développement durable change, l’entreprise pour changer le monde, Paris
Lim W. (2017), Inside sustainable consumption theoretical toolbox: Critical concepts for sustainability, consumption and marketing, “Journal of Business Research” No. 78, p. 69-80, DOI: 10.1016/j.jbusres.2017.05.001
Lopez J. et al. (2017), Evolving privacy: From sensors to the Internet of Things, “Future Generation Computer Systems” No. 75, p. 46-75, DOI: 10.1016/j.future.2017.04. 045
Martellotta F. et al. (2017), On the use of artificial neural networks to model household energy consumptions, “Energy Procedia” No. 126, p. 250-257, DOI: 10.1016/j.egy-pro.2017.08.149
Milligan B., O’Keeffe M. (2019), Global Governance of Resources and Implications for Resource Efficiency in Europe, “Ecological Economics” No. 155, p. 46-58, DOI: 10.1016/j.ecolecon.2018.01.007
Paszkiewicz A., Szadziewska A. (2011), Raportowanie rozwoju zrównoważonego przedsiębiorstw według wytycznych GRI, „Zeszyty Naukowe Uniwersytetu Szcze-cińskiego. Finanse. Rynki Finansowe. Ubezpieczenia” No. 41
Przychodzeń W. (2013), Zrównoważone przedsiębiorstwo, Poltext, Warszawa
EKONOMIA I ŚRODOWISKO 2 (69) • 2019 General environmental and social problems 159
Raftowicz-Filipkiewicz M. (2013), Konkurencyjność przedsiębiorstw ukierunkowanych na zrównoważony rozwój w warunkach kryzysu gospodarczego, „Ekonomia – Wroclaw Economic Review” No. 19(1)
Rybak M. (2004), Etyka menedżera – społeczna odpowiedzialność przedsiębiorstwa, PWN, Warszawa
Schakeri M. et al. (2018), Implementation of a novel home energy management systems (HEMS) architecture with solar photovoltaic system as supplementary source, “Renewable Energy” No. 125, p. 108-120, DOI: 10.1016/j.renene.2018.01.114
Schaltegger S., Wagner M. (2010), Sustainable Entrepreneurship and Sustainability Innovation: Categories and Interactions, “Business Strategy and the Environment” No. 20, p. 222-237, DOI: 10.1002/bse.682
Scholl G. et al. (2010), Policies to promote sustainable consumption: Innovative approaches in Europe, “Natural Resources Forum” No. 34, p. 39-50, DOI: 10.1111/ j.1477-8947.2010.01294.x
Sha K. et al. (2018), On security challenges and open issues in Internet of Things, “Future Generation Computer Systems” No. 83, p. 326-327, DOI: 10.1016/ j.future.2018.01.059
Sharma S., Ruud A. (2003), On the path to sustainability: integrating social dimensions into the research and practice of environmental management, “Business Strategy and the Environment” No. 12(4), p. 205-214, DOI: 10.1002/bse.366
Szadziewska A. (2010), Przejawy realizacji koncepcji rozwoju zrównowa żonego w działalności przedsiębiorstw, „Prace i Materiały Wydziału Zarządzania Uniwer-sytetu Gdańskiego” No. 4(4)
van Dam S. et al. (2013), Do home energy management systems make sense? Assessing their overall lifecycle impact, “Energy Policy” No. 63, p. 398-407, DOI: 10.1016/ j.enpol.2013.09.041
Zuzek D.K., Mickiewicz B. (2014), Aktywność przedsiębiorstw w kontekście wdrażania zasad zrównoważonego rozwoju w województwie małopolskim, „Optimum. Studia Ekonomiczne” No. 1(67)
EKONOMIA I ŚRODOWISKO • 2 (69) • 2019
ABSTRACT: Purpose: Many policies aimed at developing sustainable transport are based on a (partial) exclusion of car drivers and on a decrease in rivalry between different transport users. In this context, the primary purpose of this study is to assess the impact of changes in levels of rivalry and excludabil-ity resulting from infrastructural changes in the transport system providing enhanced sustainable transport choices. Methodology/approach: Rivalry and excludability determine patterns of consump-tion and are the basis of many aspects of sustainable transport policies. Therefore, the key issue for policy making is to determine the extent to which changes in these features support sustainable trans-port choices. To attempt to understand these features, preliminary survey research was conducted among users of the Wrocław (Poland) transport system to investigate; (i) which changes in the trans-port system are the most important for respondents, (ii) how these changes influence the intensity of rivalry and excludability, and (iii) whether these changes lead to a shift in transport mode choice. Findings: Changes in the transport system led to decreased or unchanged intensity of rivalry. There were few examples of exclusion, which affected primarily car users. Modifications in the levels of the two analysed features were not accompanied by a permanent shift towards more sustainable trans-port choices. Originality/value: While many studies investigate changes in transport behaviour result-ing from particular solutions that promote sustainable transport, this study focuses on how transport users react when faced with many different changes in the transport system. The novelty of this approach sheds light on transport choices resulting from changes in rivalry and excludability and the results obtained may assist evidence-based policy recommendations.
KEY WORDS: transport behaviour, transport choices, rivalry, excludability, sustainable transport
Monika Paradowska, PhD (ORCID 0000-0002-0861-1274) – University of Wroclaw
Correspondence address:Koszarowa Street 3, 51-149, Wrocław, Polande-mail: [email protected]
THE IMPACT OF RIVALRY AND EXCLUDABILITY ON TRANSPORT CHOICES: A PRELIMINARY RESEARCH
Monika PARADOWSKA
JEL: Q01, R41, R48No. 2(69) 2019 • pages: 160-178 https://doi.org/10.34659/2019/2/28
EKONOMIA I ŚRODOWISKO 2 (69) • 2019 General environmental and social problems 161
Introduction
Rivalry and excludability are key features of goods which influence con-sumption patterns (Maunder et al., 1996, p. 125). Rivalry occurs when one consumer makes it impossible or harder for other consumers to use a good (Farley, 2012, p. 47). Exclusion means that it is possible to prevent someone from the consumption of a good (Farley, 2012, p. 49-50) or simply, that it is impossible for someone to consume a good. Important incentives to study these features emerged due to deliberations about taxation, imposing pay-ments for consumption, and the dilemma of whether governments or mar-kets should manage the provision and maintenance of certain types of goods (Samuelson, 1954; Musgrave, 1959; Buchanan, 1965). Another premise for research in this domain was the overuse of common-pool resources and the “Tragedy of the commons” (Hardin, 1968; Ostrom, 1990). In transport sys-tems, rivalry and excludability can be analysed both in terms of accessibility and the interactions between transport users and selected aspects of sustain-able transport (e.g. transport externalities). Transport studies refer mostly to the relations between different types of goods and the external effects of transport (Blum, 1998, pp. 83-86; OECD, 2002a, pp. 62-66), the complexity and management of urban transport systems (UN-Habitat, 2013, pp. 159-161; Platje, 2012, pp. 45-47) or, the development of successful financial mod-els that would support sustainable urban mobility (UN-Habitat, 2013, pp. 159-161). These studies present little discussion of the relationship between the intensity of rivalry, the degree of excludability and transport behaviour. On the other hand, factors shaping transport choices are widely discussed in the literature (e.g. Grison et al., 2016, p. 288; Ramezani et al., 2018, pp. 1354-1356; Tyrinopoulos, Antoniou, 2013, p. 28-30; Paradowska, 2014, pp. 264-268). Similarly, there are many studies on instruments expected to promote sustainable transport mode choices (e.g. Verhoef et al., 2009; Yan et al., 2019; dell’Olio et al., 2018; Pucher et al., 2010, 2016; Cattaneo et al., 2018). Even though most of these instruments lead to changes in the levels of rivalry and excludability in transport systems, there are very few studies on the effects of these changes on behaviour. This paper aims to fill this gap by investigating the impact of changes in the levels of rivalry and excludability in transport systems on transport mode choices. The analysis is based on the results of empirical research conducted among transport users in the city of Wrocław (Poland). It is based on three research questions:• What important changes took place in the transport system?• What was the impact of these changes on the intensity of rivalry and the
degree of excludability in transport system access for different transport users?
EKONOMIA I ŚRODOWISKO 2 (69) • 2019General environmental and social problems162
• Were there changes in transport choices as a result of modifications of the intensity of rivalry and excludability?
Literature overview
The discussion about classification of goods can be traced back to Samu-elson (1954), Musgrave (1959, p. 162), Hardin (1968) and Ostrom (1990) where, depending on the intensity of rivalry and excludability, several basic types of goods can be distinguished. Ostrom (2010, p. 4) indicated that rivalry and excludability cannot be considered “present or absent”, as they funda-mentally indicate different levels (from low to high). This debate about rivalry and excludability has vital consequences for analysis of transport systems. Applying a complex approach, a transport system can be considered a club good, a congestion good (Platje, 2012, p. 46), or a public good (UN-Habitat, 2013, p. 162). In fact, different elements of transport systems have features of different types of goods and are characterised by different levels of rivalry and excludability (Blum, 1998; Platje, 2012). The degree of intensity of rivalry is moreover, strictly related to the capacity of transport systems and their number of users. Usually, the higher the number of transport users, the higher the intensity of rivalry and the greater probability of congestion (Platje, 2012; Blum, 1998, p. 83). Rivalry can take place between the same or different types of transport users and can lead to their (partial) exclusion. Moreover, exclusion can take place due to insufficient infrastructure or trans-port offers as the intensity of exclusion is strictly related to the accessibility of different transport modes, and as a consequence, available transport choices (e.g. Wulfhorst et al., 2017; Rode and Floater, 2014; Geurs et al., 2010). Levels of rivalry and excludability in transport systems are significant, among others in terms of the socio-economic role of transport (e.g. Blum, 1998; Platje, 2014; Platje. et al., 2017; Wang et al., 2018), the discussion about various tasks of private and public sectors in the provision and main-tenance of elements of transport systems (e.g. Amos, 2004; Roumboutsos, 2015), and successful management of transport systems that would support sustainable development (e.g. Platje, 2014; Platje. et al., 2017; Paradowska, 2011; Richardson, 2005; OECD, 2002b). In this context, the overall demand for transport and transport mode choices play a fundamental role, because, due to negative transport externalities, the popularity and attractiveness of road transportation contributes to a large extent to unsustainable develop-ment (e.g. Geels et al., 2011; Trela, 2017, p. 157; Paradowska, 2017, p. 22). For this reason, factors influencing transport mode choices, especially a shift from cars towards sustainable means of transport, are widely discussed in
EKONOMIA I ŚRODOWISKO 2 (69) • 2019 General environmental and social problems 163
literature. Results of previous studies reveal that there are several groups of factors which are decisive for transport choices (Grison et al., 2016, p. 288; Ramezani et al., 2018, pp. 1354-1356; Paradowska, 2014, pp. 264-268; Schwanen, Lucas, 2011; Schneider, 2011):• attributes of transport modes and personal criteria (e.g. Litman, 2008;
Hess et al., 2005; Chee, Fernandez, 2013),• the built environment and spatial planning (e.g. Ramezani et al., 2018;
Scheepers et al., 2016; Ye, Titheridge, 2017; Christiansen et al., 2016),• the situation-specific context (e.g. De Jong and Van de Riet, 2008; De Vos
et al., 2016),• psychological factors such as attitudes and habits (e.g. Setiawan et al.,
2015; Outwater et al., 2003; Kuppam et al., 1999; Popuri et al., 2011; De Vos et al., 2013),
• demographic characteristics (e.g. De Vos J. et al., 2016; Chee, Fernandez, 2013).Another direction of research focus on the examination of policy instru-
ments and their impact on sustainable transport choices. These include road pricing (Cornagoi et al., 2019; Verhoef et al., 2009; Anas, Lindsey, 2011), or the use of parking policy (Yan et al., 2019; dell’Olio et al., 2018; Barata et al., 2011; Bos et al., 2004; Delmelle, Delmelle, 2012). Tools supporting cycling in cities were discussed by Winters et al. (2011), Pucher et al. (2010) and Pucher, Buehler (2016). Extensive research exists on the impact of many other sustainable transport instruments (e.g. Mayes et al., 1996; Bachand-Mar-leau et al., 2011; Standing, 2019; Meijer et al., 2017; Kopp et al., 2015; Catta-neo et al., 2018, pp. 960-962; Hiselius, Rosqvist, 2016; Stead, 2013; Ajanovic, Haas, 2016; Trela, 2017).
Instruments of transport policy are usually aimed at the reduction of rivalry between drivers and other transport users, with the ultimate goal of the purposeful exclusion of cars. Some tools are aimed at reducing exclusion as perceived by potential public transport passengers, cyclists and pedestri-ans. However, there are no direct studies on how changes in rivalry and excludability resulting from such instruments shape transport choices. More-over, researchers mostly focus on the effects of particular solutions, whereas many transport systems, especially in urban areas, are constantly changing organisms. Thus, transport users face many transformations at the same time where reactions to some changes can be stronger than to others. In addition, different investments can have different effects on levels of rivalry and excludability which can then be analysed from the perspective of system dynamics in transportation (Sterman, 2000; Armah et al., 2010).
This paper aims therefore at filling this gap. The study presented has some limitations. Firstly, the focus is on improvements in different types of
EKONOMIA I ŚRODOWISKO 2 (69) • 2019General environmental and social problems164
transport infrastructure and in traffic organisation, because for most users these changes are easy to observe and to experience. Secondly, as the devel-opment of walking, cycling and public infrastructure is important for sustain-able urban mobility (e.g. European Commission, 2017), the research does not take into consideration (“so called”) soft measures or sophisticated techno-logical changes. Thirdly, this is a case study based on just one city in Poland. Finally, due to sample size and respondents’ characteristics, the findings can-not be generalised to the whole population and further research should be developed and conducted to study the reactions of transport users in differ-ent cities and under different circumstances.
Research methods
Preliminary survey research was conducted in May-July 2018 among transport users in Wrocław to ascertain changes in the transport systems that were considered most important for respondents, to investigate per-ceived intensity of rivalry and degree excludability and their transport behav-iour resulting from these changes. The survey questionnaire consisted of three parts linked to the research questions presented above:• changes in the transport system significant for transport users,• impact of these changes on levels of rivalry and excludability,• transport behaviour of respondents.
The transport system in Wrocław was selected for several reasons. Wrocław is a dynamically developing city (Książek, Suszczewicz, 2017) that is the fourth largest city in Poland. Moreover, despite a well organised public transport system and investments in solutions supporting sustainable trans-portation (Topolska, Topolski, 2015; Molecki, 2017; City Council of Wroclaw, 2015, 2016; Official website of Wrocław), the city is challenged by a high motorisation rate and high levels of congestion (Kamińska, Chalfen, 2017; Deloitte, Targeo, 2015). In Wrocław, there were 877 motorised vehicles reg-istered per 1000 inhabitants and 551 738 registered vehicles in total. Based on these two indicators, Wrocław has the second largest vehicle usage in Poland, just after Warsaw, the capital of the country (Zespół Doradców Gosp-odarczych Tor, Polska Organizacja Branży Parkingowej, 2017, p. 11). High intensity of car usage is accompanied by negative transport externalities (Hołtra, Zamorska-Wojdyła, 2018; Koźlak, 2015).
The survey questionnaire was made available in printed and in online versions. and the participants were requested to forward the questionnaire to other respondents. The survey was distributed among groups with differ-ent characteristics in terms of gender and age. Despite the snowball-sam-
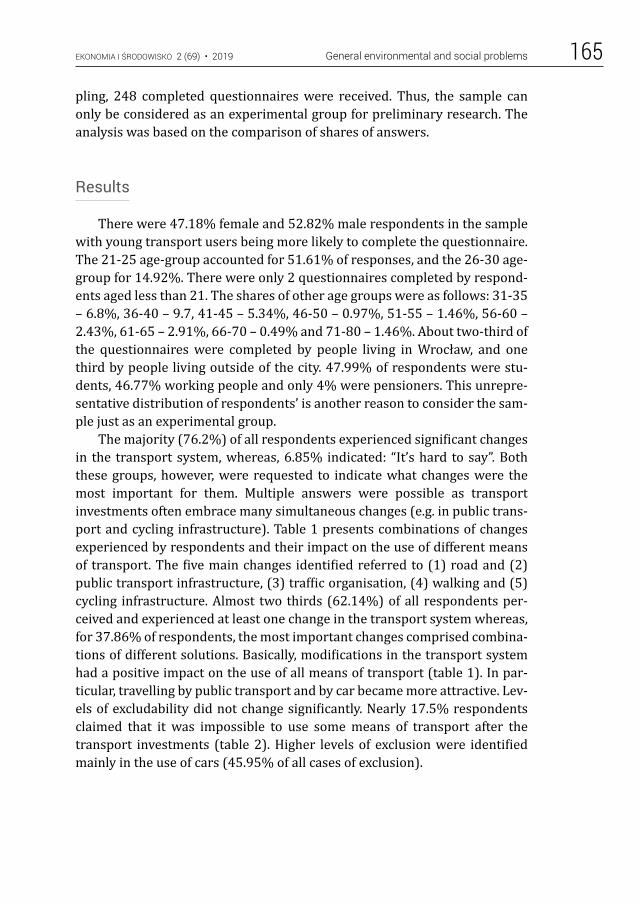
EKONOMIA I ŚRODOWISKO 2 (69) • 2019 General environmental and social problems 165
pling, 248 completed questionnaires were received. Thus, the sample can only be considered as an experimental group for preliminary research. The analysis was based on the comparison of shares of answers.
Results
There were 47.18% female and 52.82% male respondents in the sample with young transport users being more likely to complete the questionnaire. The 21-25 age-group accounted for 51.61% of responses, and the 26-30 age-group for 14.92%. There were only 2 questionnaires completed by respond-ents aged less than 21. The shares of other age groups were as follows: 31-35 – 6.8%, 36-40 – 9.7, 41-45 – 5.34%, 46-50 – 0.97%, 51-55 – 1.46%, 56-60 – 2.43%, 61-65 – 2.91%, 66-70 – 0.49% and 71-80 – 1.46%. About two-third of the questionnaires were completed by people living in Wrocław, and one third by people living outside of the city. 47.99% of respondents were stu-dents, 46.77% working people and only 4% were pensioners. This unrepre-sentative distribution of respondents’ is another reason to consider the sam-ple just as an experimental group.
The majority (76.2%) of all respondents experienced significant changes in the transport system, whereas, 6.85% indicated: “It’s hard to say”. Both these groups, however, were requested to indicate what changes were the most important for them. Multiple answers were possible as transport investments often embrace many simultaneous changes (e.g. in public trans-port and cycling infrastructure). Table 1 presents combinations of changes experienced by respondents and their impact on the use of different means of transport. The five main changes identified referred to (1) road and (2) public transport infrastructure, (3) traffic organisation, (4) walking and (5) cycling infrastructure. Almost two thirds (62.14%) of all respondents per-ceived and experienced at least one change in the transport system whereas, for 37.86% of respondents, the most important changes comprised combina-tions of different solutions. Basically, modifications in the transport system had a positive impact on the use of all means of transport (table 1). In par-ticular, travelling by public transport and by car became more attractive. Lev-els of excludability did not change significantly. Nearly 17.5% respondents claimed that it was impossible to use some means of transport after the transport investments (table 2). Higher levels of exclusion were identified mainly in the use of cars (45.95% of all cases of exclusion).
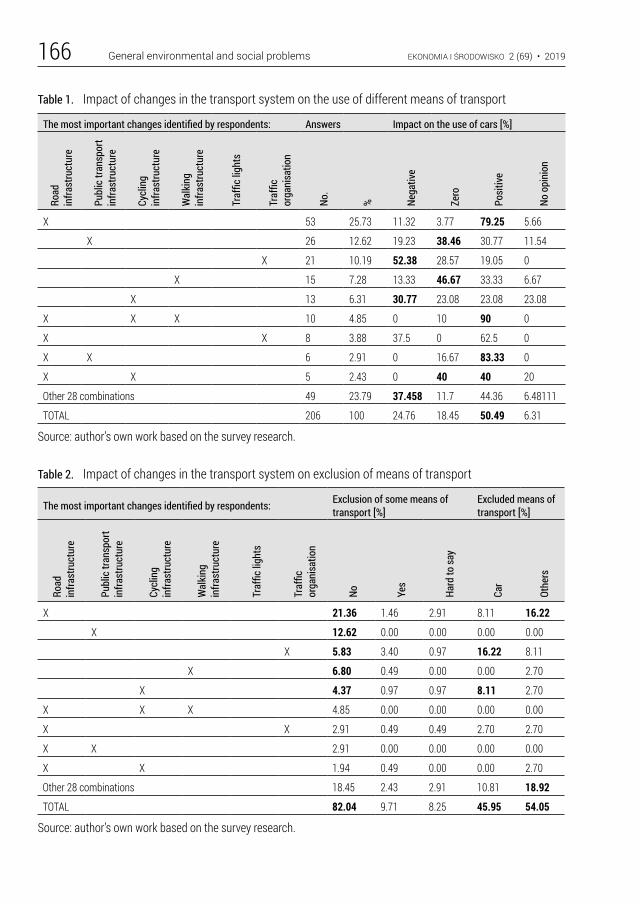
EKONOMIA I ŚRODOWISKO 2 (69) • 2019General environmental and social problems166
Table 1. Impact of changes in the transport system on the use of different means of transport
The most important changes identified by respondents: Answers Impact on the use of cars [%]
Road
in
frast
ruct
ure
Publ
ic tr
ansp
ort
infra
stru
ctur
e
Cycl
ing
in
frast
ruct
ure
Wal
king
in
frast
ruct
ure
Traf
fic li
ghts
Traf
fic
orga
nisa
tion
No.
% Nega
tive
Zero
Posi
tive
No o
pini
on
X 53 25.73 11.32 3.77 79.25 5.66
X 26 12.62 19.23 38.46 30.77 11.54
X 21 10.19 52.38 28.57 19.05 0
X 15 7.28 13.33 46.67 33.33 6.67
X 13 6.31 30.77 23.08 23.08 23.08
X X X 10 4.85 0 10 90 0
X X 8 3.88 37.5 0 62.5 0
X X 6 2.91 0 16.67 83.33 0
X X 5 2.43 0 40 40 20
Other 28 combinations 49 23.79 37.458 11.7 44.36 6.48111
TOTAL 206 100 24.76 18.45 50.49 6.31
Source: author’s own work based on the survey research.
Table 2. Impact of changes in the transport system on exclusion of means of transport
The most important changes identified by respondents: Exclusion of some means of transport [%]
Excluded means of transport [%]
Road
in
frast
ruct
ure
Publ
ic tr
ansp
ort
infra
stru
ctur
e
Cycl
ing
in
frast
ruct
ure
Wal
king
in
frast
ruct
ure
Traf
fic li
ghts
Traf
fic
orga
nisa
tion
No Yes
Hard
to sa
y
Car
Othe
rs
X 21.36 1.46 2.91 8.11 16.22
X 12.62 0.00 0.00 0.00 0.00
X 5.83 3.40 0.97 16.22 8.11
X 6.80 0.49 0.00 0.00 2.70
X 4.37 0.97 0.97 8.11 2.70
X X X 4.85 0.00 0.00 0.00 0.00
X X 2.91 0.49 0.49 2.70 2.70
X X 2.91 0.00 0.00 0.00 0.00
X X 1.94 0.49 0.00 0.00 2.70
Other 28 combinations 18.45 2.43 2.91 10.81 18.92
TOTAL 82.04 9.71 8.25 45.95 54.05
Source: author’s own work based on the survey research.
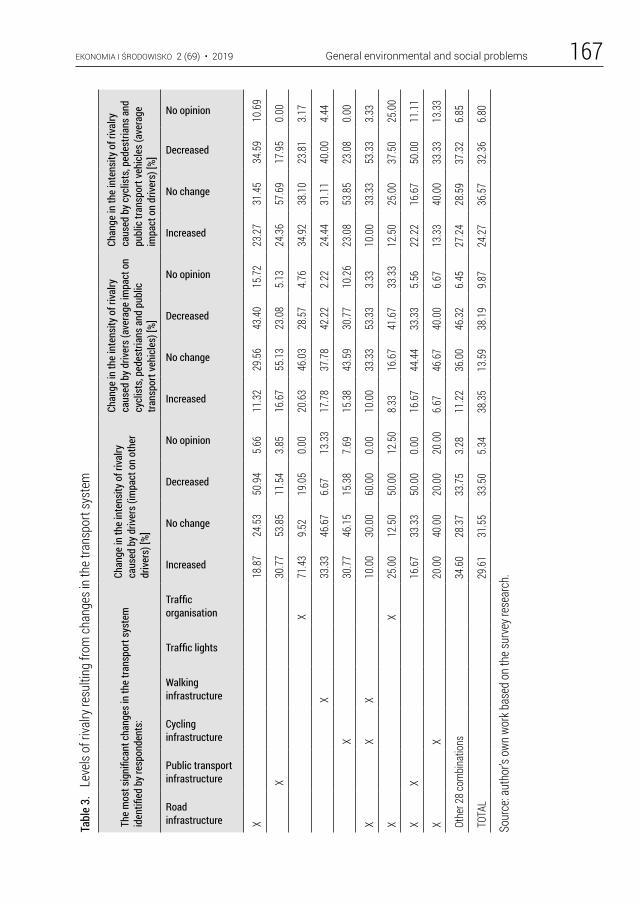
EKONOMIA I ŚRODOWISKO 2 (69) • 2019 General environmental and social problems 167Ta
ble
3.
Leve
ls of
riva
lry re
sulti
ng fr
om ch
ange
s in
the t
rans
port
syst
em
The
mos
t sig
nific
ant c
hang
es in
the
trans
port
syst
em
iden
tified
by r
espo
nden
ts:
Chan
ge in
the
inte
nsity
of r
ivalry
ca
used
by d
river
s (im
pact
on
othe
r dr
ivers
) [%]
Chan
ge in
the
inte
nsity
of r
ivalry
ca
used
by d
river
s (av
erag
e im
pact
on
cycl
ists
, ped
estri
ans a
nd p
ublic
tra
nspo
rt ve
hicl
es) [
%]
Chan
ge in
the
inte
nsity
of r
ivalry
ca
used
by c
yclis
ts, p
edes
trian
s and
pu
blic
tran
spor
t veh
icle
s (av
erag
e im
pact
on
drive
rs) [
%]
Road infrastructure
Public transport infrastructure
Cycling infrastructure
Walking infrastructure
Traffic lights
Traffic organisation
Increased
No change
Decreased
No opinion
Increased
No change
Decreased
No opinion
Increased
No change
Decreased
No opinion
X
18.87
24.53
50.94
5.66
11.32
29.56
43.40
15.72
23.27
31.45
34.59
10.69
X
30.77
53.85
11.54
3.85
16.67
55.13
23.08
5.13
24.36
57.69
17.95
0.00
X
71.43
9.52
19.05
0.00
20.63
46.03
28.57
4.76
34.92
38.10
23.81
3.17
X
33.33
46.67
6.67
13.33
17.78
37.78
42.22
2.22
24.44
31.11
40.00
4.44
X
30.77
46.15
15.38
7.69
15.38
43.59
30.77
10.26
23.08
53.85
23.08
0.00
X
XX
10.00
30.00
60.00
0.00
10.00
33.33
53.33
3.33
10.00
33.33
53.33
3.33
X
X
25.00
12.50
50.00
12.50
8.33
16.67
41.67
33.33
12.50
25.00
37.50
25.00
XX
16.67
33.33
50.00
0.00
16.67
44.44
33.33
5.56
22.22
16.67
50.00
11.11
X
X
20.00
40.00
20.00
20.00
6.67
46.67
40.00
6.67
13.33
40.00
33.33
13.33
Othe
r 28 c
ombin
ation
s34
.6028
.3733
.753.2
811
.2236
.0046
.326.4
527
.2428
.5937
.326.8
5
TOTA
L29
.6131
.5533
.505.3
438
.3513
.5938
.199.8
724
.2736
.5732
.366.8
0
Sour
ce: a
utho
r’s ow
n wor
k bas
ed on
the s
urve
y res
earc
h.
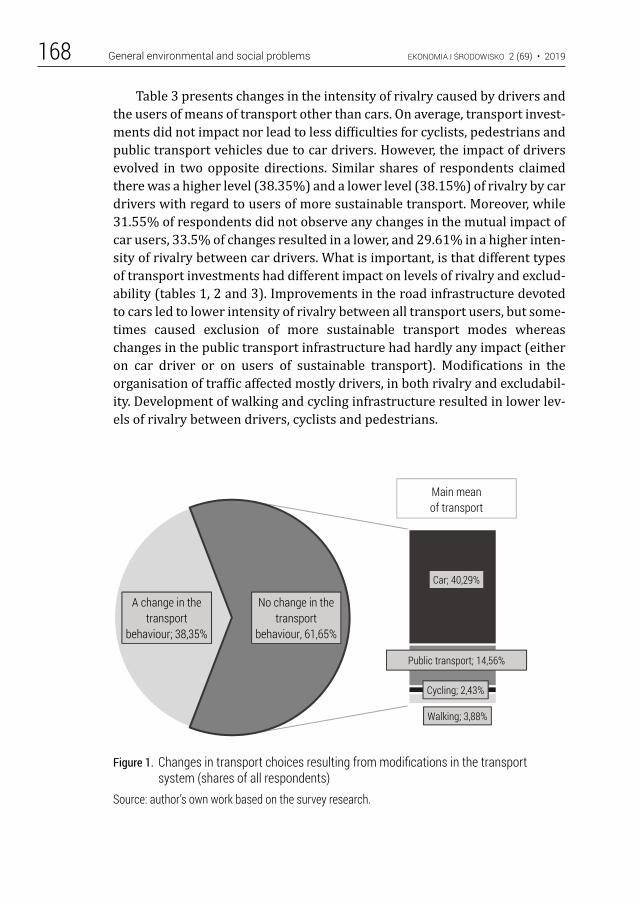
EKONOMIA I ŚRODOWISKO 2 (69) • 2019General environmental and social problems168
Table 3 presents changes in the intensity of rivalry caused by drivers and the users of means of transport other than cars. On average, transport invest-ments did not impact nor lead to less difficulties for cyclists, pedestrians and public transport vehicles due to car drivers. However, the impact of drivers evolved in two opposite directions. Similar shares of respondents claimed there was a higher level (38.35%) and a lower level (38.15%) of rivalry by car drivers with regard to users of more sustainable transport. Moreover, while 31.55% of respondents did not observe any changes in the mutual impact of car users, 33.5% of changes resulted in a lower, and 29.61% in a higher inten-sity of rivalry between car drivers. What is important, is that different types of transport investments had different impact on levels of rivalry and exclud-ability (tables 1, 2 and 3). Improvements in the road infrastructure devoted to cars led to lower intensity of rivalry between all transport users, but some-times caused exclusion of more sustainable transport modes whereas changes in the public transport infrastructure had hardly any impact (either on car driver or on users of sustainable transport). Modifications in the organisation of traffic affected mostly drivers, in both rivalry and excludabil-ity. Development of walking and cycling infrastructure resulted in lower lev-els of rivalry between drivers, cyclists and pedestrians.
Figure 1. Changes in transport choices resulting from modifications in the transport system (shares of all respondents)
Source: author’s own work based on the survey research.
A change in the transport
behaviour; 38,35%
Car; 40,29%
Public transport; 14,56%
Cycling; 2,43%
Walking; 3,88%
No change in the transport
behaviour, 61,65%
Main meanof transport
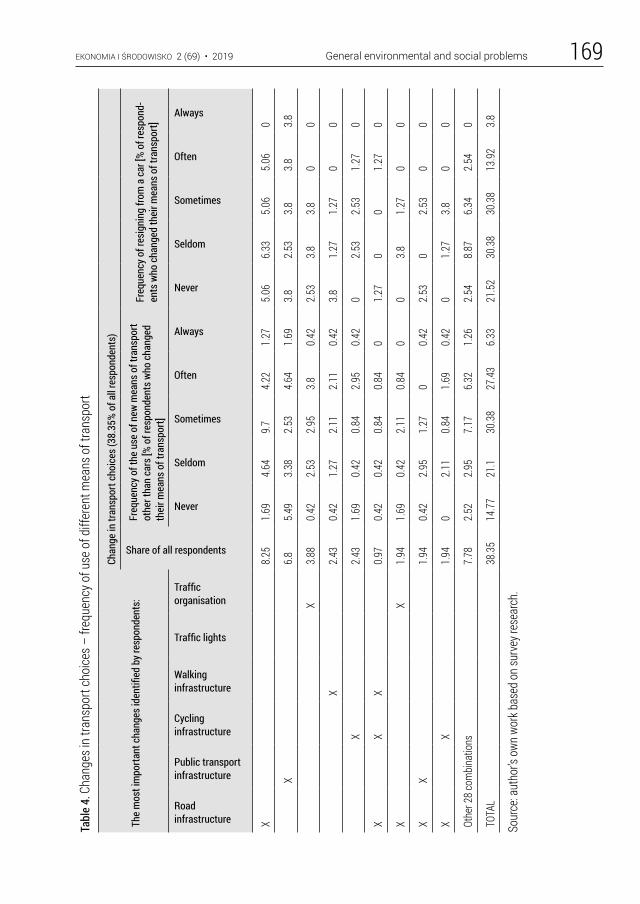
EKONOMIA I ŚRODOWISKO 2 (69) • 2019 General environmental and social problems 169Ta
ble
4. C
hang
es in
tran
spor
t cho
ices –
freq
uenc
y of u
se o
f diff
eren
t mea
ns o
f tra
nspo
rt
The
mos
t im
porta
nt c
hang
es id
entifi
ed b
y res
pond
ents
:
Chan
ge in
tran
spor
t cho
ices
(38.
35%
of a
ll re
spon
dent
s)
Share of all respondents
Freq
uenc
y of t
he u
se o
f new
mea
ns o
f tra
nspo
rt ot
her t
han
cars
[% o
f res
pond
ents
who
cha
nged
th
eir m
eans
of t
rans
port]
Freq
uenc
y of r
esig
ning
from
a c
ar [%
of r
espo
nd-
ents
who
cha
nged
thei
r mea
ns o
f tra
nspo
rt]
Road infrastructure
Public transport infrastructure
Cycling infrastructure
Walking infrastructure
Traffic lights
Traffic organisation
Never
Seldom
Sometimes
Often
Always
Never
Seldom
Sometimes
Often
Always
X
8.25
1.69
4.64
9.74.2
21.2
75.0
66.3
35.0
65.0
60
X
6.85.4
93.3
82.5
34.6
41.6
93.8
2.53
3.83.8
3.8
X
3.88
0.42
2.53
2.95
3.80.4
22.5
33.8
3.80
0
X
2.43
0.42
1.27
2.11
2.11
0.42
3.81.2
71.2
70
0
X
2.43
1.69
0.42
0.84
2.95
0.42
02.5
32.5
31.2
70
X
XX
0.97
0.42
0.42
0.84
0.84
01.2
70
01.2
70
X
X
1.94
1.69
0.42
2.11
0.84
00
3.81.2
70
0
XX
1.94
0.42
2.95
1.27
00.4
22.5
30
2.53
00
X
X
1.94
02.1
10.8
41.6
90.4
20
1.27
3.80
0
Othe
r 28 c
ombin
ation
s7.7
82.5
22.9
57.1
76.3
21.2
62.5
48.8
76.3
42.5
40
TOTA
L38
.3514
.7721
.130
.3827
.436.3
321
.5230
.3830
.3813
.923.8
Sour
ce: a
utho
r’s ow
n wor
k bas
ed on
surv
ey re
sear
ch.
EKONOMIA I ŚRODOWISKO 2 (69) • 2019General environmental and social problems170
In effect, changes in the levels of rivalry and excludability had a fairly weak impact on transport behaviour (figure 1) and the majority (61.65%) of respondents did not change their main means of transport. Among this group, more than 65.35% of respondents travelled mostly by car and 23.62% by public transport (40.9% and 14.56% of all respondents respectively).
Of all respondents, 26.21% claimed they had chosen new means of trans-port after a change in the transport system, whilst 12.14% were “not sure”. Both these groups were asked to answer questions about the frequency of use of new means of transport (table 4). The results showed that among these group of respondents changes in the transport system turned out to provide incentives to use “sometimes” (30.38%), “often” (27.43%) or “always” (6.33%) a means of transport other than cars (11.6%, 10.6% and 2.4% of all respondents respectively). Only 3.8% of respondents who changed their transport behaviour definitively resigned from car use, 30.38% resigned “sometimes” and 30.38% “often” (1%, 12% and 12% of all respondents respectively). Lower intensity of rivalry caused by drivers did not cause a significant switch to sustainable means of transport. Similarly, increased exclusion of cars did not affect the overall use of cars. What is interesting is that women were more likely to switch transport mode than men. Compared to 35.45% of male respondents, 41.67% of female respondents agreed they chose a new transport mode due to the modification in the transport system. Similarly, respondents in the age groups 21-25 and 26-30, as well as respond-ents aged more than 50 were more prone to change their transport behav-iour (36.63% and 40% of respondents in these age groups respectively decided to travel by a new mode of transport). This research did not focus on the impact of earnings on mode choices.
Discussion
It can be argued that respondents associated changes in the transport system based predominantly on their own experience. As most people sur-veyed travelled by car and public transport, almost half of respondents indi-cated that the most significant changes were related to road and public trans-port infrastructure, and to traffic organisation. In addition, less than 40% of respondents considered combined solutions as “important”.
These results give an insight into two basic problems. First, respondents could neglect or be even unaware of changes significant for sustainable transport development. This could be for many reasons, e.g. due to attitudes and habits (such as car use habits), unwillingness to change transport behav-iour (e.g. Setiawan et al., 2015; Thøgersen, Møller, 2008; Verplanken, Wood,
EKONOMIA I ŚRODOWISKO 2 (69) • 2019 General environmental and social problems 171
2006) or insufficient information about transformations in the transport sys-tem (de Abreu e Silva et al., 2018; Meng et al., 2017). Second, transport policy in Wrocław aims at many improvements in road transportation (City Council of Wroclaw, 2015, 2016). Thus, changes in public transport, walking and cycling infrastructure that led to less intense rivalry with car drivers turned out to be unsuccessful in terms of attracting new transport users. The reason is that changes in road infrastructure result in lower rivalry between drivers and increased attractiveness of travelling by car (e.g. Pfaffenbichler, 2011; Shepherd, 2014). On one hand, investments in road infrastructure can sup-port many goals of sustainable transport, e.g. reduced congestion (e.g. Bör-jesson et al., 2015), improved safety (e.g. Paradowska, 2016) and accessibil-ity (e.g. Ford et al., 2015) leading to an increase in positive transport exter-nalities (e.g. Platje et al., 2017). On the other, improved road capacity and lower intensity of rivalry stimulate attractiveness of individual motorisation compared to more sustainable means of transport. Thus, in the longer run, cycling, walking and public transport may become less popular, and a higher number of car drivers can again result in an intensification of external costs and a reduction in external transport benefits (e.g. Sterman, 2000; Armah et al., 2010). For these reasons, decreased rivalry experienced by some respond-ents can be a reason for unsustainable transport choices and unsustainable transport development. Changes in the transport system should thus include both, restrictions and impediments for car users and improvements and facilitations for more sustainable transport users. These two directions of sustainable transport policy would be in accordance to what Tolley (1996, p. 213) calls the “simultaneous promotion of ‘green’ modes and the restraint of ‘red’ modes”, due to the fact that people often prefer cars (e.g. Ellaway et al., 2003). What seems vital is to enhance the capacity of sustainable transport/ infrastructure, while discouraging people from individual motorisation. Oth-erwise, the intensity of rivalry in using public transport or cycling can lead to congestion in these transport modes, making them less attractive.
Relatively weak reactions of respondents to changes in the levels of rivalry and excludability can be explained by the strong impact of other fac-tors influencing transport behaviour, especially habits and preferences regarding use of cars (e.g. Setiawan et al., 2015; Schwanen et al., 2012; Bous-casse et al., 2018), and the accessibility offered by different transport modes (e.g. Ford et al., 2015; Wulfhorst et al., 2017; Rode, Floater, 2014). Therefore, complex and coherent solutions within a sustainable transport policy should be developed and introduced to cope with the problem of car domination in cities (e.g. Cirianni et al., 2018; Hickman et al., 2013; European Commission, 2017).
EKONOMIA I ŚRODOWISKO 2 (69) • 2019General environmental and social problems172
Conclusions
This study examines the impact on sustainable transport choices of changes in the levels of rivalry and excludability resulting from infrastruc-tural changes in transport systems. The findings led to the following answers to the research questions:• The most important changes in the transport system in Wrocław involved
improvements in road infrastructure, public transport infrastructure and traffic organisation.
• In general, modifications in the transport system led to decreased or unchanged intensity of rivalry between transport users. However, the perceived rivalry between car drivers was considered to change in two contrary directions. There were few examples of exclusion, which affected mostly car drivers.
• Lower intensity of rivalry did not have a large impact on transport behav-iour. Although 38.35% of respondents changed their transport choices, only 6.33% among this group always travelled by a sustainable mean of transport and 3.8% always resigned from cars. In addition, car drivers seemed to be more resistant to changes than other transport users.The results have some implications for policy making that could lead to
changes in transport choices supporting the development of sustainable urban transport. First, a complex assessment of all transport investments should be conducted on a regular basis to estimate the direct and indirect impact on levels of rivalry and excludability of various means of transport and to avoid an increase in the attractiveness of individual motorisation. Sec-ond, a de-intensification of rivalry and excludability experienced by users of sustainable transport modes should be accompanied by higher intensity of rivalry between car drivers with a (partial) exclusion of car users. Exclusion of inappropriate driving behaviour (e.g. speeding or disobeying traffic rules) should be better enforced to ensure improved road safety. Dissemination of information about improvements in public transport and improvements in walking and cycling infrastructure could assist public acceptance of car ban/restriction policies, support sustainable transport choices and help to miti-gate a decrease in positive transport externalities. A systems approach should be developed and consequently applied to influence the multiple factors which determine transport choices.
EKONOMIA I ŚRODOWISKO 2 (69) • 2019 General environmental and social problems 173
Literature
Ajanovic A., Haas R. (2016), Dissemination of electric vehicles in urban areas: Major factors for success, “Energy” Vol. 115 Part 2, pp. 1451-1458, DOI: 10.1016/j.energy.2016.05.040
Amos P. (2004), Public and Private Sector Roles in the Supply of Transport Infrastruc-ture and Services. Operational Guidance for World Bank Staff, “Transport Papers” No. 1, The World Bank Group, Washington D.C.
Anas A., Lindsey R. (2011), Reducing Urban Road Transportation Externalities: Road Pricing in Theory and in Practice, “Review of Environmental Economics and Pol-icy” Vol. 5(1), pp. 66–88, DOI: 10.1093/reep/req019
Armah F.A. et al. (2010), A Systems Dynamics Approach to Explore Traffic Congestion and Air Pollution Link in the City of Accra, Ghana, “Sustainability” Vol. 2, pp. 252-265, DOI: 10.3390/su2010252
Bachand-Marleau J. et al. (2011), The much appreciated marriage of cycling and tran-sit: But how will it work?, Proceedings of the 90th Annual Meeting of the Trans-portation Research Board, Washington D.C.
Barata E. et al. (2011), Parking at the UC campus: Problems and solutions, “Cities” Vol. 28, pp. 406-413
Blum U. (1998), Positive externalities and the public provision of transportation infra-structure: an evolutionary perspective, “Journal of Transportation and Statistics” No. 3(1), p. 81-88
Börjesson M. et al. (2015), Factors driving public support for road congestion reduc-tion policies: Congestion charging, free public transport and more roads in Stock-holm, Helsinki and Lyon, “Transportation Research Part A: Policy and Practice” Vol. 78, pp. 452-462, DOI: 10.1016/j.tra.2015.06.008
Bos I. et al. (2004), The choice of park & ride facilities: An analysis using a context-dependent hierarchical choice experiment, Proceedings of the 83rd Annual Meet-ing of the Transportation Research Board, Washington D.C., DOI: 10.1068/a36138
Bouscasse H. et al. (2018), How does environmental concern influence mode choice habits? A mediation analysis, “Transportation Research Part D: Transport and Environment” Vol. 59, pp. 205-222, DOI: 10.1016/j.trd.2018.01.007
Buchanan J. (1965), An Economic Theory of Clubs, “Economica” No. 125(32), p. 1-14Cattaneo M. et al. (2018), Students’ mobility attitudes and sustainable transport mode
choice, “International Journal of Sustainability in Higher Education” Vol. 19(3), pp. 942-962, DOI: 10.1108/IJSHE-08-2017-0134
Chee W.L., Fernandez J.L. (2013), Factors that Influence the Choice of Mode of Trans-port in Penang: A Preliminary Analysis, “Procedia – Social and Behavioral Sci-ences” Vol. 91, pp. 120-127, DOI: 10.1016/j.sbspro.2013.08.409
Christiansen L.B. et al. (2016), International comparisons of the associations between objective measures of the built environment and transport-related walking and cycling: IPEN adult study, “Journal of Transport & Health” Vol. 3(4), pp. 467-478, DOI: 10.1016/j.jth.2016.02.010
Cirianni F. et al. (2018), A Review Methodology of Sustainable Urban Mobility Plans: Objectives and Actions to Promote Cycling and Pedestrian Mobility, in: A. Bisello et al. (eds.), Smart and Sustainable Planning for Cities and Regions, Green Energy and Technology, pp. 685-697, DOI: 10.1007/978-3-319-75774-2_46
EKONOMIA I ŚRODOWISKO 2 (69) • 2019General environmental and social problems174
Cornagoi E. et al. (2019), Evaluating the Impact of Urban Road Pricing on the Use of Green Transport Modes: The Case of Milan, “OECD Environment Working Papers” No. 143, DOI: 10.1787/ddaa6b25-en
Davis S.L., Rives L.M., de Maya S.R. (2017), Introducing Personal Social Responsibility as a key element to upgrade CSR, “Spanish Journal of Marketing – ESIC” No. 21, p. 146-163
de Abreu e Silva J. et al. (2018), The influence of information-based Transport Demand Management measures on commuting mode choice. Comparing web vs. face-to face surveys, “Transportation Research Procedia” Vol. 32, pp. 363-373, DOI: 10.1016/j.trpro.2018.10.066
De Jong G., Van de Riet O. (2008), The driving factors of passenger transport, “Euro-pean Journal of Transport and Infrastructure Research” Vol. 8(3), pp. 227-250
De Vos J. et al. (2013), Travel and Subjective Well-Being: A Focus on Findings, Methods and Future Research Needs, “Transport Reviews” Vol. 33(4), pp. 421-442, DOI: 10.1080/01441647.2013.815665
De Vos J. et al. (2016), Travel mode choice and travel satisfaction: bridging the gap between decision utility and experienced utility, “Transportation” Vol. 43(5), pp.771-796, DOI: 10.1007/s11116-015-9619-9
dell’Olio, L. et al. (2018), A methodology based on parking policy to promote sustain-able mobility in college campuses, “Transport Policy” In Press, Corrected Proof, DOI: 10.1016/j.tranpol.2018.03.012
Delmell, E.M., Delmelle E.C. (2012), Exploring spatiotemporal commuting patterns in a university environment, “Transport Policy” Vol. 21, pp. 1-9, DOI: 10.1016/j.tran-pol.2011.12.007
Ellaway A. et al. (2003), In the driving seat: psychosocial benefits from private motor vehicle transport compared to public transport, “Transportation Research Part F: Traffic Psychology and Behaviour” Vol. 6(3), pp. 217-231, DOI: 10.1016/S1369-8478(03)00027-5
European Commission (2017), Sustainable Urban Mobility: European Policy, Practice and Solutions, Luxemburg
European Commission (2017), Sustainable Urban Mobility: European Policy, Practice and Solutions, Brussels, https://ec.europa.eu/transport/sites/transport/files/2017-sustainable-urban-mobility-european-policy-practice-and-solutions.pdf [15-01-2019]
Farley J.C. (2012), The Economics of Sustainability, in: H. Cabezas, U. Diwekar (eds.), Sustainability: Multi-Disciplinary Perspectives, Bentham Science Publishers, p. 40-64
Ford A.C. et al. (2015), Transport Accessibility Analysis Using GIS: Assessing Sustain-able Transport in London, “ISPRS International Journal of Geo-Information” Vol. 4(1), pp. 124-149, DOI: 10.3390/ijgi4010124
Fujii S., Taniguchi A. (2006), Determinants of the effectiveness of travel feedback pro-grams – a review of communicative mobility management measures for changing travel behaviour in Japan, “Transport Policy” Vol. 13(5), pp. 339-348, DOI: 10.1016/j.tranpol.2005.12.007
Geels F. et al. (2011), Automobility in transition?: A socio-technical analysis of sustain-able transport, Routledge
Geurs K.T. et al. (2010), Accessibility appraisal of land-use/transport policy strategies: More than just adding up travel-time savings, “Transportation Research Part D: Transport and Environment” Vol. 15, pp. 382-393, DOI: 10.1016/j.trd.2010.04.006
EKONOMIA I ŚRODOWISKO 2 (69) • 2019 General environmental and social problems 175
Grison E. et al. (2016), Exploring factors related to users’ experience of public transport route choice: influence of context and users profiles, “Cognition, Technology & Work” Vol. 18(2), pp. 287-301, DOI 10.1007/s10111-015-0359-6
Hardin G. (1968), The tragedy of the commons, “Science” No. 162, pp. 1243-1248Hess S. et al. (2005), Estimation of value of travel-time savings using mixed logit mod-
els, “Transportation Research Part A: Policy and Practice” Vol. 39(2-3), pp. 221-236, DOI: 10.1016/j.tra.2004.09.007
Hickman R. et al. (2013), Planning more for sustainable mobility, “Journal of Trans-port Geography” Vol. 33, pp. 210-219, DOI: 10.1016/j.jtrangeo.2013.07.004
Hiselius L.W., Rosqvist L.S. (2016), Mobility Management campaigns as part of the transition towards changing social norms on sustainable travel behaviour, “Jour-nal of Cleaner Production” Vol. 123(1), pp. 34-41, DOI: 10.1016/j.jclepro.2015. 08.055
Kopp J. et al. (2015), Do sharing people behave differently? An empirical evaluation of the distinctive mobility patterns of free-floating car-sharing members, “Transpor-tation” Vol. 42(3), pp. 449-469, DOI: 10.1007/s11116-015-9606-1
Kuppam A. et al. (1999), Analysis of the role of traveller attitudes and perceptions in explaining mode-choice behaviour, “Transportation Research Record: Journal of the Transportation Research Board” Vol. 1676, pp. 68-76
Litman T. (2008), Valuing Transit Service Quality Improvements, “Journal of Public Transportation” Vol. 11(2), pp. 43-63, DOI: 10.5038/2375-0901.11.2.3
Maunder P. et al. (2000), Economics Explained, Third edition, LondonMayes M. et al. (1996), A qualitative assessment of attitudes to cycling. Transport policy
and its implementation, LondonMeijer L.L.J. et al. (2017), The roles of business models in sustainability transitions: Car
sharing in Sydney, in R. Rauter et al. (eds.), Exploring a changing view on organiz-ing value creation: developing new business models: contributions to the 2nd inter-national conference on new business models, Institute of Systems Science, Innova-tion and Sustainability Reports, Vol. 8, Graz, pp. 72-76
Meng M. et al. (2017), Impact of traveller information on mode choice behaviour, “Pro-ceedings of the Institution of Civil Engineers – Transport” Vol. 171 (TR1), pp. 11-19, 10.1680/jtran.16.00058)
Meurs H., Haaijers R. (2001), Spatial structure and mobility, “Transportation Research Part D: Transport and Environment” Vol. 6, pp. 429-446, DOI: 10.1016/S1361-9209(01)00007-4
Musgrave R.A. (1959), The Theory of Public Finance: A Study in Public Economy, New York
Musgrave R.A. (1962), Provision for Social Goods, in J. Margolis, H. Guitton (eds.) Pub-lic Economics: An Analysis of Public Production and Consumption and Their Rela-tions to the Private Sectors, London, pp. 124-44
Musgrave R.A. (1962), The Public Interest: Efficiency in the Creation and Maintenance of Material Welfare, in: C.J. Friedrich (ed.) In NOMOS V The Public Interest, New York, pp. 107-14
OECD (2002a), ECMT Round Tables No. 119: Transport and Economic Development, DOI: 10.1787/19900228
OECD (2002b), OECD Guidelines towards Environmentally Sustainable Transport, http://www.oecd.org/env/greening-transport/oecdguidelinestowardsenviron-mentallysustainabletransport.htm [13-09-2018]
EKONOMIA I ŚRODOWISKO 2 (69) • 2019General environmental and social problems176
Ostrom E. (1990), Governing The Commons. The evolution of institutions for collective action, Cambridge University Press, Cambridge
Ostrom E. (2010), Beyond Markets and States: Polycentric Governance of Complex Eco-nomic Systems, “American Economic Review” No. 100(3), p. 1-33
Outwater M. et al. (2003), Attitudinal market segmentation approach to mode choice and ridership forecasting: Structural equation modelling, “Transportation Research Record: Journal of the Transportation Research Board” Vol. 1854(1), pp. 32-42, DOI: 10.3141/1854-04
Paradowska M. (2014), Problems Involved in the Development of Instruments Support-ing the Creation of Sustainable Behaviour in Transport, „Zeszyty Naukowe Wyższej Szkoły Bankowej we Wrocławiu” No. 1(39), pp. 255-275
Paradowska M. (2016), Comparison of road safety policy objectives in Poland and in the European Union, in: M. Bąk (ed.), Transport Development Challenges in the Twenty-First Century, Proceedings of the 2015 TranSopot Conference, pp. 103-123, DOI: 10.1007/978-3-319-26848-4_11
Paradowska M. (2017), Measuring socio-economic welfare and sustainable transport – selected dilemmas, „Ekonomia i Środowisko” No. 60(1), pp. 18-27
Paradowska M. (2017), Wpływ rywalizacji i wykluczenia na rozwój zrównoważonej mobilności miejskiej (The role of rivalry and exclusion in the creation of (more) sustainable passenger transport modes in cities), „Studia i Prace WNEIZ US” No. 47(2), p. 109-118
Paradowska, M. (2011), Rozwój zrównoważonych systemów transportowych polskich miast i aglomeracji w procesie integracji z Unią Europejską – przykład aglomeracji wrocławskiej (The Development of Sustainable Transport Systems in Polish Cities and Agglomerations in the Context of European Integration – the Case of the Wro-claw Agglomeration), Opole
Pfaffenbichler P. (2011), Modelling with Systems Dynamics as a Method to Bridge the Gap between Politics, Planning and Science? Lessons Learnt from the Development of the Land Use and Transport Mode MARS, “Transport Reviews: A Transnational Trans-disciplinary Journal” Vol. 31(2), pp. 267-289
Platje J. (2011), Institutional capital – creating capacity and capabilities for sustain-able development, Opole
Platje J. (2012), Current challenges in the economics of transport systems – a stake-holder and club good approach, “Logistics and Transport” No. 2(15), pp. 37-49
Platje J. (2014), Zrównoważone systemy transportowe w kontekście efektów zewnętrznych (Sustainable Transport Systems in the Context of External Effects), „Biuletyn Komitetu Przestrzennego Zagospodarowania Kraju PAN” No. 254, pp. 151-166
Platje J. et al. (2017), Limits to positive externalities of transport and infrastructure, in Economy and social development in the open society, Proceedings of the Interna-tional Scientific Conference ECOTREND 2017 in Târgu Jiu, Gorj County, Romania 2017, pp. 455-461
Popuri Y. et al. (2011), Importance of traveller attitudes in the choice of public trans-portation to work: findings from the Regional Transportation Authority Attitudinal Survey, “Transportation” Vol. 38(4), pp. 643-661, DOI: 10.1007/s11116-011-9336-y
Pucher J., Buehler R. (2016), Safer Cycling Through Improved Infrastructure, “Ameri-can Journal of Public Health” Vol. 106(12), pp. 2089-2091, DOI: 10.2105/AJPH.2016.303507
EKONOMIA I ŚRODOWISKO 2 (69) • 2019 General environmental and social problems 177
Pucher, J. et al. (2010), Infrastructure, Programs and Policies to Increase Cycling: An International Review, “Preventive Medicine” Vol. 50(S1), pp. S106-S125, DOI: 10.1016/j.ypmed.2009.07.028
Ramezani S. et al. (2018), An integrated assessment of factors affecting modal choice: towards a better understanding of the causal effects of built environment, “Trans-portation” Vol. 45, pp. 1351-1387, DOI: 10.1007/s11116-017-9767-1
Richardson B.C. (2005), Sustainable transport: analysis frameworks, “Journal of Transport Geography” Vol. 13(1), pp. 29-39
Rode P., Floater, G. (2014), Accessibility in cities transport and urban form, “NCE Cities” Paper 03, https://lsecities.net/wp-content/uploads/2014/11/LSE-Cities-2014-Transport-and-Urban-Form-NCE-Cities-Paper-03.pdf [31-12-2018]
Roumboutsos A. (2015), Public Private Partnerships in Transport Infrastructure: An International Review, “Transport Reviews” No. 35(2), pp. 111-117, DOI: 10.1080/01441647.2015.1017025
Samuelson P. (1954), The Pure Theory of Public Expenditure, “Review of Economics and Statistics” No. 4(36), p. 387-389
Scheepers C.E. et al. (2016), Perceived accessibility is an important factor in transport choice — Results from the AVENUE project, “Journal of Transport & Health” No. 3, pp. 96-106, DOI: 10.1016/j.jth.2016.01.003
Schneider R. J. (2011), Understanding sustainable transportation choices: shifting rou-tine automobile travel to walking and bicycling, Ph.D. dissertation, University of California, Berkeley
Schwanen T. et al. (2012), Rethinking habits and their role in behaviour change: the case of low-carbon mobility, “Journal of Transport Geography” Vol. 24, pp. 522-532, DOI: 10.1016/j.jtrangeo.2012.06.003
Schwanen T., Lucas K. (2011), Understanding auto motives, in: K. Lucas, E. Blumen-berg, R. Weinberger (eds.), Auto Motives: Understanding Car Use Behaviours, Bradford, pp. 3-38
Setiawan R. et al. (2015), Effect of habit and car access on student behavior using cars for travelling to campus, “Procedia Engineering” Vol. 125, pp. 571-578, DOI: 10.1016/j.proeng.2015.11.063
Shepherd S.P. (2014), A review of system dynamics models applied in transportation, “Transportmetrica B: Transport Dynamics” Vol. 2(2), pp. 83-105, DOI: 10.1080/21680566.2014.916236
Standing C. (2019), The implications of the sharing economy for transport, “Transport Reviews” Vol. 39(2), pp. 226-242
Stead D. (2013), Key research themes on governance and sustainable urban mobility, “International Journal of Sustainable Transportation” Vol. 10(1), pp. 40-48, DOI: 10.1080/15568318.2013.821008
Sterman J. (2000), Business Dynamics. Systems Thinking and Modelling for a Complex World, Boston
Thøgersen J., Møller B. (2008), Breaking car use habits: The effectiveness of a free one-month travelcard, “Transportation” Vol. 35 Issue 3, pp. 329-34, DOI: 10.1007/s11116-008-9160-1
Tolley R. (1996), Green campuses: Cutting the environmental cost of commuting, “Jour-nal of Transport Geography” Vol. 4 Issue 3, pp. 213-217
Trela M. (2017), Electric road transport in Poland – an analysis of external costs, „Ekonomia i Środowisko” No. 63(4), pp. 156-165
EKONOMIA I ŚRODOWISKO 2 (69) • 2019General environmental and social problems178
Tyrinopoulos Y., Antoniou C. (2013), Factors affecting modal choice in urban mobility, “European Transport Research Review” No. 5(1), pp. 27-39, DOI: 10.1007/s12544-012-0088-3
UN-Habitat (2013), Planning and design for sustainable urban mobility. Global report on human settlements 2013, Routledge, Oxon, New York
Verhoef et al. (2009), Pricing in Road Transport: A Multi-Disciplinary Perspective, Cheltenham-Northampton
Verplanken B., Wood W. (2006), Interventions to Break and Create Consumer Habits, “Journal of Public Policy & Marketing” Vol. 25 No. 1, pp. 90-103, DOI: 10.1509/jppm.25.1.90
Wang L. et al. (2018), The Impacts of Transportation Infrastructure on Sustainable Development: Emerging Trends and Challenges, “International Journal of Environ-mental Research and Public Health” Vol. 15(1172), pp. 1-24, DOI: 10.3390/ijerph15061172
Winters, M. et al. (2011), Motivators and deter-rents of bicycling: comparing influences on decisions to ride, “Transportation” Vol. 38(1), pp. 153-168, DOI: 10.1007/s11116-010-9284-y
Wulfhorst G. et al. (2017), The TUM Accessibility Atlas as a tool for supporting policies of sustainable mobility in metropolitan regions, “Transportation Research Part A: Policy and Practice” Vol. 104, pp. 121-136, DOI: 10.1016/j.tra.2017.04.012
Ye R., Titheridge H. (2017), Satisfaction with the commute: The role of travel mode choice, built environment and attitudes, “Transportation Research Part D: Trans-port and Environment” Vol. 52, Part B, pp. 535-547, DOI: 10.1016/j.trd.2016. 06.011
Zespół Doradców Gospodarczych Tor, Polska Organizacja Branży Parkingowej (2017), Parkingi a transport zbiorowy w miastach (Parking space and collective transport in cities), http://www.pobp.org.pl/images/demo/docs/Raport_parkingowy.pdf [16-01-2019]
EKONOMIA I ŚRODOWISKO • 2 (69) • 2019
IMPLEMENTATION OF THE INTERGENERATIONAL JUSTICE POSTULATE IN THE CONTEXT
OF STATUTORY TASKS AND FUNCTIONS OF NATIONAL PARKS
ABSTRACT: The postulate of intergenerational justice is the core concept of sustainable development. National parks as protected areas with the highest status of protection bring together individual ele-ments contained in the Brundtland definition and the tasks they perform are intended to satisfy the needs of the present generation, without prejudice to subsequent generations. The article presents the implementation of this postulate through a review of sustainable development concepts and their reference to the statutory tasks and functions performed by national parks.
KEY WORDS: sustainable development, national park
Beata Pater, PhD (ORCID: 0000-0003-4209-241X) – The Jerzy Kukuczka Academy of Physical Education in Katowice
Correspondence address:Mikołowska Street 72a, 40-065, Katowice, Polande-mail: [email protected]
Beata PATER
JEL: Q01, Q26, Q56No. 2(69) 2019 • pages: 179-189 https://doi.org/10.34659/2019/2/29
EKONOMIA I ŚRODOWISKO 2 (69) • 2019General environmental and social problems180
Introduction
The process that involved changes taking place in the public conscious-ness and science has made it impossible to precisely determine the emer-gence of the concept of sustainable development. Even in the mid-twentieth century, pollution of the environment was not seen as a serious problem for the economy and society. However, progressive environmental pressure on the environments resulted in the launching of activities to rationalize such interference. Civilizational crisis in its social and economic aspect, as well as changes in the perception of the surrounding world and moral considera-tions became the genesis of the coming changes. First, environmental sustain-ability was mentioned as economic development compatible with environ-mental protection requirements, highlighting the ecological aspects thereof. Then came the concept of sustainable development.
The best known definition of sustainable development was formulated by the World Commission on Environment and Development established in 1992 and chaired by Gro Brundtland, then Prime Minister of Norway. In light of this definition, development that meets the needs of the present without depriving future generations of the possibility of such can be called sustaina-ble (Report, 1991). Thus, the durability and sustainability of growth are determined not only by short-term, but also intergenerational justice. The definition comes down to meeting needs, or the area of the research interest in economics. However, this concept primarily affects the development of environmental policy, as its fundamental premise is such an economic activ-ity that ensures resources and values of the environment remain in a condi-tion that will make it possible for the next generations to use them in a sus-tainable manner. This requires preserving the viability of the natural pro-cesses and biodiversity at every level: species composition, ecosystem and landscape. Therefore, if the concept of environmental sustainability under-lines the environmental aspects of development, it is the concept of sustain-able development that adds economic, social and spatial order to environ-mental governance. Its essence is thus an equal treatment of the economic, social and environmental factors (Górka et al., 2001; Żylicz, 2008a). National parks as protected areas with the highest status of protection bring together individual elements contained in the Brundtland definition and the tasks they perform are intended to satisfy the needs of the present generation, without prejudice to subsequent generations. The article presents the imple-mentation of the intergenerational justice postulate through a review of sus-tainable development concepts and referring them to the statutory tasks and functions performed by national parks.
EKONOMIA I ŚRODOWISKO 2 (69) • 2019 General environmental and social problems 181
Statutory tasks and functions of national parks
Among all natural objects protected under the law, national parks enjoy the highest rank of protection. The Act of April 16, 2004 on Nature Conserva-tion (art. 8, paragraph. 1 and 2) defines a national park as a region distin-guishing particular natural, scientific, social, cultural and educational area, not smaller than 1,000 ha, protecting all nature and landscape values therein. It is created to preserve biodiversity, resources, formations and elements of inanimate nature and landscape values. Its purpose is maintaining the condi-tion of natural resources and the restoration of distorted natural habitats, plants, animals or fungi.
Originally, the most important tasks of national parks were nature con-servation and conducting scientific studies of nature. Now, however, the parks are acquiring new tasks that cause certain effects of economic and social nature. Therefore, the main tasks of national parks in Poland include (The Act of Nature Conservation, art. 8b paragraph. 1):• maintaining protective action within the ecosystems of the national park,
aiming to achieve the purpose for which national parks were established, and thus the preservation of biodiversity, resources, formations and ele-ments of inanimate nature and landscape values, restoration of a proper state of natural resources and the reconstruction of distorted natural habitats, animals, plants, and fungi,
• provision of the national park’s area to other parties on terms specified in the plan of protection or conservation tasks and ordinances of the director of the national park,
• conducting activities related to the education about nature.Each park has several functions, resulting both from the general needs of
nature conservation, but also from the natural phenomena characterizing that specific entity. There are 6 functions specific to each national park:
The protective function, which consists in securing and documenting the biodiversity of the country. The most important issue is the protection of the largest possible collection of fauna and flora-containing the largest possible pool of genes of animated nature-and the preservation of the remains of pri-mary and natural biocenoses, on top of semi-natural ecological communities existing at present. The protection also includes a variety of natural struc-tures and their spatial layouts, not only natural, but also those that emerged as a result of long-term management and showing the culture of the nation. The parks are also gene banks, which serve as a source of genetic material for growing valuable plants and breeding rare animals or their local breeds and varieties.
EKONOMIA I ŚRODOWISKO 2 (69) • 2019General environmental and social problems182
The educational function, i.e., keeping a library and a natural museum, a scientific and popular publishing entity, but also the creation and mainte-nance of educational nature trails. The park, in order to be able to perform this function properly, must be adapted to it in terms of organization, staffing and facilities.
The scientific function, which involves carrying out research activities. It ensured the protection of animate and inanimate nature, which is or will be the subject of research. The protected object become an indispensable work-shop for scientific work, allowing one to conduct research without interfer-ence caused by exposure to exploitation, and their number is constantly increasing.
The economic function permitting the use of objects created for nature conservation for economic purposes, for example. the acquisition of wood raw material from ongoing conservation measures or paid entry to national parks.
The tourist function is implemented by sharing specific sites and hiking trails for exploration and recreation in the form of hiking, biking, water sports or skiing. Due to the unique landscape and natural value, these areas are extremely attractive for tourists.
The cultural and historical function supports the local architectural style, regional clothing, the care of national memorial sites and other historically important places (Lubczyński, 1999).
Intergenerational justice vs. the tasks and functions of national parks
The concept of sustainable development includes three groups of opin-ions: ecocentric, focused on the primacy of the principles of nature protection and its survival in every field of human activity, moderately anthropocentric, and therefore also ones assuming such a economic activity that would main-tain the integrity of economic and non-economic environmental resources, and radically anthropocentric, continuing the neoclassical growth theory model adjusted for ecological conditions. The Brundtland definition corre-sponds with the balanced, moderately anthropocentric approach. According to it, development is sustainable when there is a balance between the objec-tives of protecting the environment, preserving natural resources for future generations, and social objectives, while maintaining the socio-economic development and quality of life.
Socio-economic development, however, involves the depletion of non-re-newable resources, so it seems that there is a contradiction here with the postulate of sustainability of the natural capital in the name of intergenera-
EKONOMIA I ŚRODOWISKO 2 (69) • 2019 General environmental and social problems 183
tional justice. In theory, therefore, the criterion of substitution between nat-ural and anthropogenic capital is taken into consideration and definitions connected with a strengthening of the principle of the durability of the capi-tal are distinguished. Thus, weak, sensitive, strong and restrictive principles of the sustainability of natural capital are listed. The weak principle of capital sustainability approves of the full possibility of substituting natural capital by another type of capital: human, social or anthropogenic. According to the sensitive principle of sustainability, maintaining the total capital, as well as the stability of its structure is equally important. It is thus possible to substi-tute capital only within its scope. The strong principle of sustainability is based on the preservation of all kinds of capital, both qualitatively and quan-titatively, excluding substitution, even within the particular type of capital. The restrictive concept of natural capital sustainability, which is the most radical example of the strong sustainability principle, excludes any compen-sation of natural capital for any other type of anthropogenic capital, which in relation to the economy as a whole is not only impossible, but rather point-less (and probably mentioned only for educational purposes).
Currently, the first principle, that is, the weak durability of sustainable development, according to which the current generations compensate for the losses in capital due to the reduction of natural resources by increasing investment in anthropogenic capital is of particular importance in economic and environmental policies (Fiedor, 2002). However, with regard to the activ-ities of national parks, which are enclaves of biodiversity, at least a strong principle of sustainability is the most justified. The aim of the national parks in Poland, by far, is not an optimal use thereof, but the preservation of natural resources. For national parks, the most important natural resources and the most effective ways to protect them are a priority. A large part of the resources of the national parks can be classified as non-renewable resources, but it does not mean having to completely abandon their exploitation. They should be used in such a way that does not lead to irreversible changes in ecosys-tems, which changes could affect their quality for future generations.
Simply put, within certain limits, one type of capital loss can be compen-sated by an increase in the other. However, the different types of resources are not substitutes for each other in an unlimited manner, and above all, the scarcity of natural capital is felt acutely, though, of course, for the proper functioning of the economy, each type of capital (including man-made) is needed. This restriction in substitution is an argument against the weak sus-tainability principle. The next generation can and will inherit the whole pot of the capital, but if its structure will be depleted of its most desirable compo-nent which will be replaced with one of less value, the entire value will decrease too. Who and how might be able to assess biodiversity and land-
EKONOMIA I ŚRODOWISKO 2 (69) • 2019General environmental and social problems184
scape according to the preferences of the future? It is therefore difficult to use weak sustainability to justify the demand for equal opportunities for the next generations, which is the foundation for the concept of sustainable development.
Similarly problematic is the demand for strong sustainability when one type of capital cannot be replaced by another. The natural capital itself is composed of renewable resources, which can be exploited at the rate of their renewal without prejudice to future generations and non-renewable resources (Żylicz, 2008b). The use of the latter excludes the strong sustaina-bility principle, and at the present level of civilization, resigning from their exploitation is at least an unlikely scenario. Of course, strong sustainability can be implemented in protected areas, especially where the protection is strict, but not in the whole economy.
In the context of intergenerational justice, one refers to the concept of John Rawls, first used by Talbot Page, whereby representatives of different generations meet to decide on the distribution of wealth between them (Rawls, 1971). However, they have no knowledge about which generation they belong to, and no one is favored. They act from behind the veil of igno-rance. The only division that gives everyone an equal opportunity is one where no generation lives at the expense of the other. Rawls’ concept is some-thing of a philosophical groundwork for the concept of sustainable develop-ment. David Pearce, who is the author of the most famous philosophical stance on sustainable development, interpreted the principle even deeper. He distinguished three elements: intragenerational justice, intergenerational justice, and justice for non-human species.
Intragenerational justice is associated with a reduction in disparities between the rich North and the poor South, poverty eradication, provision of health care for all people, providing opportunities for intellectual growth and cessation of war, hatred, terrorism and domination of some nations over oth-ers, as well as the protection of cultural diversity. Intergenerational equity is the need to preserve the natural capital for future generations through effi-cient management of natural resources, using the potential of nature only partially, maintaining a dynamic balance of ecosystems and resource recircu-lation. This issue justifies the Polish translation of Sustainable Development as enduring development.
Justice to nonhuman species is to provide and maintain an ecological bal-ance so that other species could survive in decent conditions (Pearce, 1988). Intergenerational equity and justice to nonhuman beings are basically the reason for the existence of nature conservation areas and national parks. They are appointed, after all, so that the next generations could also see the unique sceneries and specimens of animate and inanimate nature. Without
EKONOMIA I ŚRODOWISKO 2 (69) • 2019 General environmental and social problems 185
nature conservation, many species of flora and fauna would have been already considered extinct, and the maintenance of biodiversity would be extremely difficult. Meanwhile, thanks to appropriate treatment, species and populations are being restored, eg. the European bison or the increasing number of the Tatra chamois.
On the basis of the theory by John Rawls (which is difficult to include as an economic theory, since it uses the term usability and discounts), equity can be achieved as a hypothetical contract between generations, but without faith in a practical chance of its implementation. In economics, intergenera-tional justice or equality of opportunity for all generations can be included in the economic analysis, but this cannot be achieved except through the adop-tion of arbitrary assumptions (Żylicz, 2013).
The contradiction between the traditional analysis based on the recogni-tion of constant discounting due to the passage of time and the need to ensure sustainable development, drew the economists’ interest in the models of overlapping generations. In these models, intergenerational optimization is achieved by considering three periods of life of the consumer: pre-decision – if decisions on are taken by the previous generation on their behalf, deci-sion-making: when the consumer takes decisions for themselves and the pre-decision generations, and post-decision – where the consumer adjusts to the decisions of the next generation, and bears the consequences of decisions taken in previous periods. It is assumed that the consumer adopts an altruis-tic attitude towards their children, so values are not discounted in the next generation. Then, durable development is the result of rational decisions (Żylicz, 2004). Thus, intergenerational justice is the resignation, by the cur-rent generation, from the best meeting of their needs in favor of the next generation’s needs. The establishment of the UN Sustainable Development Goals (SDGs) in 2015 only shows the need to implement this concept to achieve better standards for people, institutions, and the environment. But the basic question remains − will it ensure wellbeing not only for near future people but also for more distant generations (Oliveira, 2018). Economics, which is the science of verifying theses by means of empirical research, at the present state of scientific knowledge, cannot provide a clear and objective estimate of the preferences of future generations. Although theories of inter-generational justice conceptualise the obligations of current generation may have to future generations it is still based mostly on ethics (Sanklecha, 2017). Nevertheless, the concept of sustainable development is accepted and begins to be reflected in the environmental policy, and political goals in general.
In the case of national parks, the matter is much simpler, as these areas protect biodiversity and landscape values for the sake of now living and future generations and from their intervention. Each of the functions per-
EKONOMIA I ŚRODOWISKO 2 (69) • 2019General environmental and social problems186
formed by national parks can be looked at through the prism of sustainable development. The protective, scientific, educational, cultural and historical functions do not raise doubts as to the realization of the postulate of justice between generations. Meanwhile, one can look at the other two functions: tourist/leisure and economic from a different perspective, in particular on the forest management.
National parks in Poland are forest areas, so they also achieve revenues from timber sales. The wood for sale does not come from forestry as under-stood by the State Forests. It is wood harvested e.g. after the occurrence of hurricane winds and during active protection. Forests can be protected in two ways, either by the abandonment of any action, or actively, by aiming to restore the original form of the areas previously changed by the human spe-cies. After the annexations and wars in Poland, forests was in poor condition. The forests were plundered by the occupiers, destroyed, ravaged during the world wars and overexploited. To restore the Polish forest resources, spruce trees were mass-planted in mountainous areas and pines in the rest of the country. The result are monoculture forests, forest stands comprising of trees in the same age, vulnerable to the winds and pests. In the mountain areas, stands with an admixture of fir, beech, and sycamore, which are deeper-rooted trees, should prevail. In the commercial forests, the economic goal is a healthy forest, which will provide a lot of good quality wood. In national parks, forest management is a more complicated. Deciding on the reconstruc-tion of a stand in the national park, the naturally occurring processes are used, but also one should examine whether it will not be in opposition to other protective purposes. In some national parks, on nearly half of the active area of conservation, it is planned to carry out reconstruction of the tree stands to restore proper habitats. This means reducing the share of spruce in the stands in favor of fir and beech, which means returning to the species composition which is appropriate for the particular area. However, voices are raised saying that the reconstruction of the forest stands is a way to rescue the budget (Loch, 2013). These actions will be evaluated only by the next generations.
The statutory duty of the national park is making its area available for exploration. For this purpose, they maintain hiking trails and the necessary infrastructure (hostels, shelters, campsites), and sanitary facilities. Tourism is not only a source of income for national parks and the local population, but also a serious threat to the health of the nature sites. In 2017, the national parks were visited by nearly 13.3 million people, which means nearly 1.7 thousand people per ha (GUS, 2018). That is a lot. Tourists leave their money in the park, which works to the benefit of its business activities and finances the fulfillment of the tasks laid down by law, but also the large number of
EKONOMIA I ŚRODOWISKO 2 (69) • 2019 General environmental and social problems 187
visitors in a protected area exposes it damage, and even devastation of the natural resources of such areas. It is very difficult to manage tourist traffic in national parks, especially in the most crowded ones. Despite channeling tourist traffic by creating a network of hiking trails, too much traffic still threatens nature. Tourists have often quite low ecological culture, not know-ing how to behave in national parks. Picking plants, destroying the bark of trees, breaking branches, straying from the designated trails, which e.g. launches erosion processes, littering, relieving their physiological needs out-side places designated for this purpose, making excessive noise, feeding ani-mals, air pollution, violations of prohibitions related to the strict protection, and leaving inscriptions on natural objects are only some examples of the misconduct of tourists in national parks. It happens that the tourist impact on nature does not directly affect its degradation and is not observable with-out conducting specialized studies, but it may, for example, reduce the pos-sibility of nesting for certain species of birds.
National parks are extremely attractive for tourists. If, however, they remain overburdened by excessive tourist traffic in relation to their capacity, it can lead to environmental degradation of the areas and as a result to the need to close the trails, and ultimately to reduce the share of revenues from tourism. Following the development of the idea of sustainable development, the notion of sustainable tourism, or responsible tourism arose (it applies to tourist traffic, as in the case of tourism as a sector of the economy, we can talk about sustainable tourism). This is quite a general concept, and the only cri-terion for qualifying a particular form of tourism as sustainable is the com-patibility of its development with the principles of sustainability, and there-fore a compromise between the needs and expectations of tourists, adapta-tion of infrastructure to different forms of tourism and the economic interests of the local communities, on top of the protection of wildlife and the general environment while preserving natural resources for future generations. Sim-ilarly as in the theory of sustainable development, integration of social, eco-nomic, environmental and spatial planning orders is necessary.
One of the most frequently quoted definitions of sustainable tourism is the definition developed in 1995 by the World Travel and Tourism Council (WTTC) with the World Tourism Organization (WTO) together with the Council of the Earth, contained in Agenda 21 for Travel and Tourism Industry, based on the decisions of the Rio summit. Sustainable tourism combines the needs of tourists and the reception regions, while maintaining the ability to satisfy those needs in the future. It manages the resources in such a way as to maintain cultural distinctiveness, ecological processes, biodiversity and vital processes and to meet aesthetic, economic and social needs (Agenda 21, 1997). In turn, the Federation of National Parks and Nature Reserves in
EKONOMIA I ŚRODOWISKO 2 (69) • 2019General environmental and social problems188
Europe (EUROPARC) produced a definition, according to which sustainability is any form of tourism development, area management and tourist activity supporting ecological, economic and social integrity of the area and preserv-ing cultural resources and natural resources of these areas unchanged for the next generations (Kurek, 2003).
Conclusions
It follows from the definitions that using the principles of sustainable development in relation to tourism in national parks, the most important item is that tourism do not contribute to the destruction of nature, and that it promotes and protects the cultural values of the region. Tourism as part of the regional economy should not also be troublesome for residents. That is why the local community is engaged in the development and support of tour-ism. Tourism in protected areas requires constant monitoring to prevent damage to nature. In addition, tourist traffic must be supported by educa-tional activities conducted among residents and tourists alike. National parks fulfill the requirements of this last task perfectly, engaging in educational activities focused on both the population living in municipalities adjacent to the national park, various interest groups operating in the area of the park, and the tourists. Educational activities, as of today, are the only weapon of national parks in the struggle for educated, non-harmful tourist. In fact, limit-ing access to the park admittedly could be implemented, but it would be extremely difficult, not only due to the fact that the national parks are a pub-lic good, and therefore excluding anyone would be difficult or even impossi-ble, but also because of the technical and staffing limitations. All that remains is the question of who and how would ensure that these limitations are observed. Therefore, education is by far the best and basically the only tool that allows the operation of national parks in the spirit of sustainable devel-opment for the benefit of nature and leaving it in excellent condition for future generations.
Literature
Agenda 21 for the Travel and Tourism Industry (1997), Towards Environmentally Sus-tainable Development, WTO, WTTC, Earth Council, London
Dobrzańska B., Dobrzański G., Kiełczewski D. (2012), Ochrona środowiska przyrodni-czego, PWN, Warszawa, p. 252-254
Fiedor B. (ed.) (2002), Podstawy ekonomii środowiska i zasobów naturalnych, C.H. Beck, Warszawa, p. 248-249
EKONOMIA I ŚRODOWISKO 2 (69) • 2019 General environmental and social problems 189
Górka K., Poskrobko B., Radecki W. (2001), Ochrona środowiska, PWE, Warszawa, p. 99GUS (2018), Ochrona Środowiska, Warszawa, Appendix „Tables”Kurek W. (2003), Turystyka zrównoważona – turystyka przyszłości, in: J. Biliński, D.
Sawaryn (eds.), Turystyka czynnikiem integracji międzynarodowej, WSIiZ w Rze-szowie, Rzeszów
Loch J. (2013), Ostrożnie z tą przebudową, „Tatry” No. 2(44), p. 62Lubczyński L. (1999), Aktualna sytuacja parków narodowych w Polsce, in: B.W. Woło-
szyn, T. Postawa (eds.), Parki narodowe – ich funkcja w czasie i przestrzeni. Forum dyskusyjne, Komitet Ochrony Przyrody PAN, Trzebinia, p. 54
Oliveira Vasconcellos R. (2018), Back to the Future: The Potential of Intergenerational Justice for the Achievement of the Sustainable Development Goals, “Sustainability” No. 10(2), p. 427
Pearce D. (1988), Economics, equity and sustainable development, “Futures” Vol. 20 No. 6, p. 598-604
Raport Światowej Komisji do Spraw Środowiska i Rozwoju (1991), Nasza wspólna przyszłość, PWE, Warszawa, p. 21
Rawls J. (1971), A theory of justice, Harvard University Press, Cambridge, p. 118Sanklecha P. (2017), Our obligations to future generations: the limits of intergenera-
tional justice and the necessity of the ethics of metaphysics, “Canadian Journal of Philosophy” Vol. 47 Issue 2-3: Ethics and Future Generations, p. 229-245
The Act of April 16, 2004 on Nature Conservation, Dz.U. 2004 nr 92 poz. 880Żylicz T. (2004), Ekonomia środowiska i zasobów naturalnych, PWE, Warszawa,
p. 203-204Żylicz T. (2008a), Trwały rozwój, „Aura Ochrona Środowiska” No. 5Żylicz T. (2008b), Silna trwałość rozwoju, „Aura Ochrona Środowiska” No. 6Żylicz T. (2013), Sprawiedliwość międzypokoleniowa „Aura Ochrona Środowiska” No. 9
EKONOMIA I ŚRODOWISKO • 2 (69) • 2019
SUSTAINABLE DEVELOPMENT EDUCATION AT POLISH UNIVERSITIES
ABSTRACT: Purpose: An analysis of education programmes at selected universities in Poland in terms of coverage of subjects related to sustainable development. Methodology: An analysis of information published on the Internet, on the official website of each examined Polish university.Results: The scope of education on the subject matter related to sustainable development at the nine best Polish universities was presented. The number and names of faculties and majors were indicated (where the main purpose was education on that subject matter and where that subject was taught, but it was not their basic teaching subject). The number of courses and ECTS points allocated to those courses was determined, for each major. Originality: The research results fill in the gaps in available statistics on teaching of courses related to sustainable development at Polish universities. The data can be the basis for comparisons between other periods and drawing of conclusions about the trends of changes in education.
KEY WORDS: sustainable development, education, Polish universities
Mariusz Trela, PhD Eng. (ORCID: 0000-0001-8376-7554) – AGH University of Science and Technology
Correspondence address:Faculty of ManagementGramatyka Street 10, 30-067, Kraków, Polande-mail: [email protected]
Mariusz TRELA
JEL: A22, I25, Q01No. 2(69) 2019 • pages: 190-203 https://doi.org/10.34659/2019/2/30
EKONOMIA I ŚRODOWISKO 2 (69) • 2019 General environmental and social problems 191
Introduction
Environmental economics is a relatively young science, still in its devel-opment phase. It is a response to the need to expand knowledge and aware-ness of societies both with respect to the negative environmental impact of human activity aimed at achieving growth and economic development as well as to the possibility of limiting that negative impact. Higher education institutions, as institutions whose one of the main functions, beside conduct-ing research, is teaching activity, should actively support this task by intro-ducing into their education programmes courses directly related to sustaina-ble development.
An individual well-educated in the area of sustainable development should master the art of understanding mutual interrelations and relation-ships: “environment-society”, “environment-economy”, “economy-society” (Kiełczewski, Poskrobko, 2009, p. 239). Thus, it is not just a narrow scope of knowledge whose mastering will allow one to become a specialist in this field, but an extensive discipline of science that is based in economics, taking into account not only environmental issues, but also economic and social ones.
That is why, despite that enterprises implementing the basic rules of sus-tainable development can (and even should) educate their customers with regard to pro-environmental behaviour (Michalik, 2016, p. 21-32), there can be no doubt that the main educational burden falls on universities. They have to educate people who will build those enterprise development strategies which are sustainable from the environmental viewpoint. Similarly, no other institutions but the universities have to form a conviction in a portion of soci-ety about the legitimacy of the sustainable development paradigm so that more and more entrepreneurs, even without restrictions resulting from administrative regulations, operate in line with those rules.
There is, therefore, no doubt as to the need that universities have to teach in the field of environmental protection and sustainable development. What is even more, the Decade of Sustainable Development Education was announced in 2005. Its aim was to make fundamental changes in the educa-tion system that involved consistent inclusion of the new paradigm of devel-opment in educational materials and forms (Borys, 2010, p. 60) – sustainable development. Nevertheless, there are still doubts as to when it is necessary to decide in what way, to what extent and as part of what majors this educa-tion is to be pursued. It follows from the above that, even though progress in sustainable development education in Poland is visible, there is no compre-
EKONOMIA I ŚRODOWISKO 2 (69) • 2019General environmental and social problems192
hensive vision of such education as part of the higher education system (Lorek, 2013, p. 25).
Such an unclear situation, combined with the obvious need to teach in the field of sustainable development, made the author carry out an analysis of the teaching offer of the best Polish universities with respect to this subject matter.
Description of the method of conducting research and assumptions adopted in its performance
Curricula of the nine best Polish universities were analysed. They were selected on the basis of the Times Higher Education 2018 ranking and were as follows:1) University of Warsaw (UW),2) AGH University of Science and Technology in Cracow (AGH),3) Jagiellonian University (UJ),4) Warsaw University of Technology (PW),5) Adam Mickiewicz University in Poznan (UAM),6) Gdansk University of Technology (PG),7) Nicolaus Copernicus University in Torun (UMK),8) University of Silesia (UŚ),9) University of Wroclaw (UWr).
The teaching offer of each university was analysed from the viewpoint of a studies applicant who makes a decision on the choice of their field of educa-tion on the basis of generally available information. That is why curricula published on the websites of the universities and/or faculties of a given uni-versity underwent analysis. In the case of each university, an analysis was conducted on whether it had a faculty focused on environmental protection. It was assumed that “focus on environmental protection” of a given faculty was expressed by a university by giving the faculty a name that suggested it. If the analysis showed that it had been the case, then the number of such faculties at a given university was determined. In the next step, it was anal-ysed whether there were majors at a given university (at any faculty) where the education programme concerned mainly environmental protection. It was assumed that the programme of given studies concerned mainly envi-ronmental protection if a given major had a name that suggested it. If the analysis showed that it had been the case, then their number was determined, counting undergraduate and graduate studies as part of the same major sep-arately. The next step was an analysis of all other majors in terms of occur-rence of courses related to environmental protection or sustainable develop-
EKONOMIA I ŚRODOWISKO 2 (69) • 2019 General environmental and social problems 193
ment in their programmes. Whether or not a given course included material related to environmental protection or sustainable development was deter-mined on the basis of its syllabus. If the analysis showed that there were such courses, then the number of majors at a given university was determined, as part of which courses related to environmental protection and/or sustain-able development (including separately undergraduate and postgraduate studies as part of the same major) were taught. For each major, for which the analysis showed that there were such courses (separately for undergraduate and graduate studies if it was the case for both cycles), the number of such courses and the total number of ECTS points allocated to them were deter-mined.
In a situation when there were inter-faculty studies at a given university, focused mainly on environmental protection, or studies that had majors where courses related to environmental protection were taught, such studies were included in the number of faculties focused on environmental protec-tion, the majors having been included in the appropriate category: majors where the programme concerned mainly environmental protection or majors where the programme had courses related to environmental protection and/or sustainable development.
Results of the conducted research
Among the nine analysed universities, there are seven with faculties focused on environmental protection, which has been shown in table 1.
The AGH University of Science and Technology in Cracow, the University of Wroclaw and the University of Silesia have the most faculties focused on environmental protection (2 each). In the case of the University of Silesia and the University of Wroclaw, one of the faculties at each of them is one offering inter-faculty studies in environmental protection, which results from the methodology adopted in this study. The situation is similar at the University of Warsaw, although inter-faculty studies constitute in this case the only unit focused on environmental protection.
The Jagiellonian University or Adam Mickiewicz University in Poznan do not have any faculties focused on environmental protection which does not mean, however, that those universities do not provide education in this field. Those universities, similarly to the other analysed ones, offer majors where the programme concerns primarily environmental protection, which has been shown in table 2.
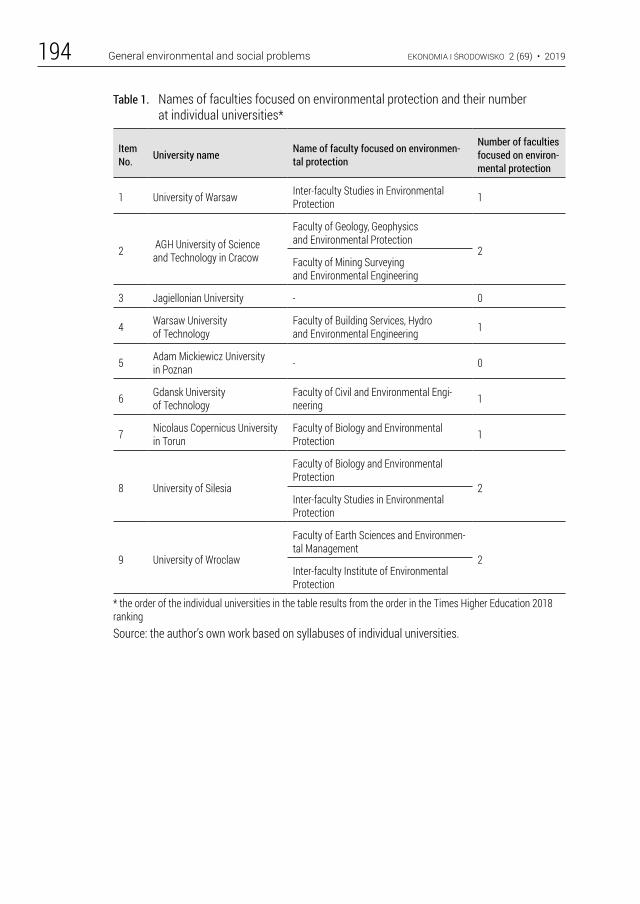
EKONOMIA I ŚRODOWISKO 2 (69) • 2019General environmental and social problems194
Table 1. Names of faculties focused on environmental protection and their number at individual universities*
Item No. University name Name of faculty focused on environmen-
tal protection
Number of faculties focused on environ-mental protection
1 University of Warsaw Inter-faculty Studies in Environmental Protection 1
2 AGH University of Science and Technology in Cracow
Faculty of Geology, Geophysics and Environmental Protection
2Faculty of Mining Surveying and Environmental Engineering
3 Jagiellonian University - 0
4 Warsaw University of Technology
Faculty of Building Services, Hydro and Environmental Engineering 1
5 Adam Mickiewicz University in Poznan - 0
6 Gdansk University of Technology
Faculty of Civil and Environmental Engi-neering 1
7 Nicolaus Copernicus University in Torun
Faculty of Biology and Environmental Protection 1
8 University of Silesia
Faculty of Biology and Environmental Protection
2Inter-faculty Studies in Environmental Protection
9 University of Wroclaw
Faculty of Earth Sciences and Environmen-tal Management
2Inter-faculty Institute of Environmental Protection
* the order of the individual universities in the table results from the order in the Times Higher Education 2018 rankingSource: the author’s own work based on syllabuses of individual universities.
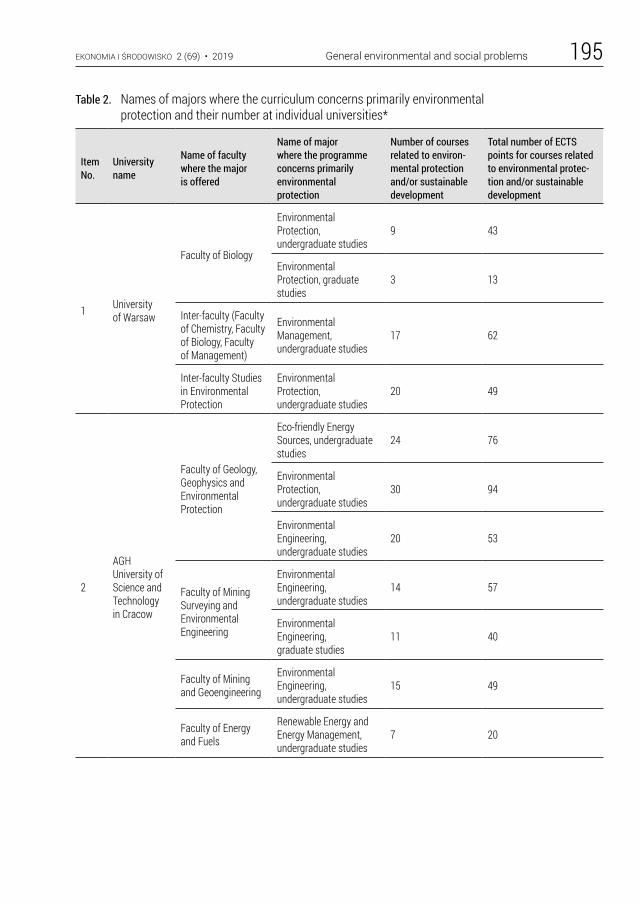
EKONOMIA I ŚRODOWISKO 2 (69) • 2019 General environmental and social problems 195
Table 2. Names of majors where the curriculum concerns primarily environmental protection and their number at individual universities*
Item No.
University name
Name of faculty where the major is offered
Name of major where the programme concerns primarily environmental protection
Number of courses related to environ-mental protection and/or sustainable development
Total number of ECTS points for courses related to environmental protec-tion and/or sustainable development
1 University of Warsaw
Faculty of Biology
Environmental Protection, undergraduate studies
9 43
Environmental Protection, graduate studies
3 13
Inter-faculty (Faculty of Chemistry, Faculty of Biology, Faculty of Management)
Environmental Management, undergraduate studies
17 62
Inter-faculty Studies in Environmental Protection
Environmental Protection, undergraduate studies
20 49
2
AGH University of Science and Technology in Cracow
Faculty of Geology, Geophysics and Environmental Protection
Eco-friendly Energy Sources, undergraduate studies
24 76
Environmental Protection, undergraduate studies
30 94
Environmental Engineering, undergraduate studies
20 53
Faculty of Mining Surveying and Environmental Engineering
Environmental Engineering, undergraduate studies
14 57
Environmental Engineering, graduate studies
11 40
Faculty of Mining and Geoengineering
Environmental Engineering, undergraduate studies
15 49
Faculty of Energy and Fuels
Renewable Energy and Energy Management, undergraduate studies
7 20
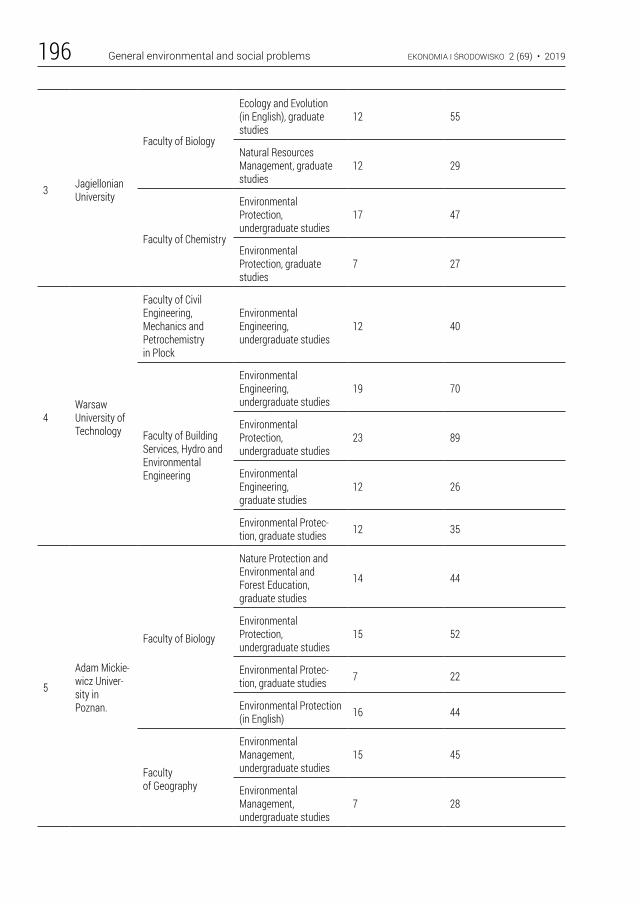
EKONOMIA I ŚRODOWISKO 2 (69) • 2019General environmental and social problems196
3 Jagiellonian University
Faculty of Biology
Ecology and Evolution (in English), graduate studies
12 55
Natural Resources Management, graduate studies
12 29
Faculty of Chemistry
Environmental Protection, undergraduate studies
17 47
Environmental Protection, graduate studies
7 27
4Warsaw University of Technology
Faculty of Civil Engineering, Mechanics and Petrochemistry in Plock
Environmental Engineering, undergraduate studies
12 40
Faculty of Building Services, Hydro and Environmental Engineering
Environmental Engineering, undergraduate studies
19 70
Environmental Protection, undergraduate studies
23 89
Environmental Engineering, graduate studies
12 26
Environmental Protec-tion, graduate studies 12 35
5
Adam Mickie-wicz Univer-sity in Poznan.
Faculty of Biology
Nature Protection and Environmental and Forest Education, graduate studies
14 44
Environmental Protection, undergraduate studies
15 52
Environmental Protec-tion, graduate studies 7 22
Environmental Protection (in English) 16 44
Faculty of Geography
Environmental Management, undergraduate studies
15 45
Environmental Management, undergraduate studies
7 28
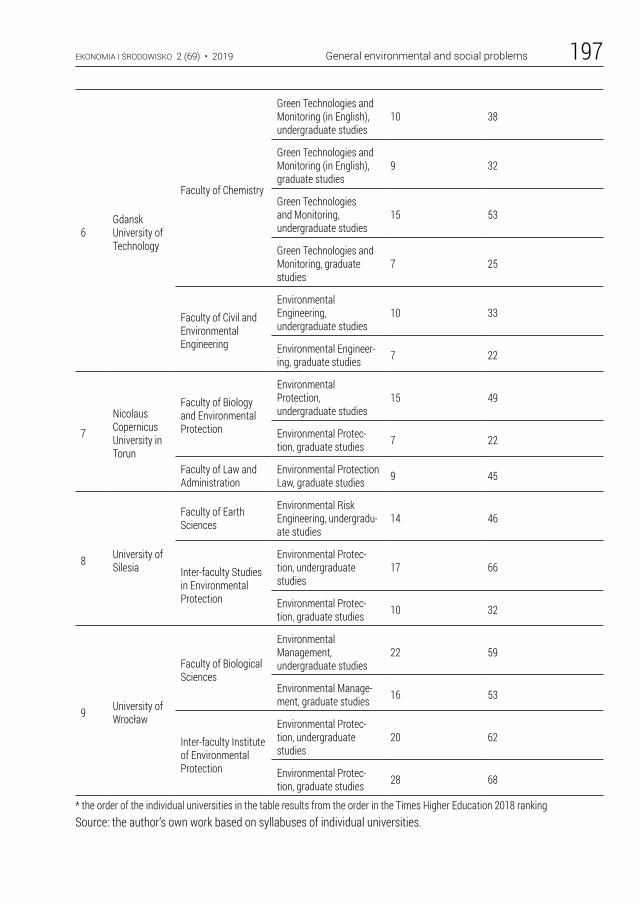
EKONOMIA I ŚRODOWISKO 2 (69) • 2019 General environmental and social problems 197
6Gdansk University of Technology
Faculty of Chemistry
Green Technologies and Monitoring (in English), undergraduate studies
10 38
Green Technologies and Monitoring (in English), graduate studies
9 32
Green Technologies and Monitoring, undergraduate studies
15 53
Green Technologies and Monitoring, graduate studies
7 25
Faculty of Civil and Environmental Engineering
Environmental Engineering, undergraduate studies
10 33
Environmental Engineer-ing, graduate studies 7 22
7
Nicolaus Copernicus University in Torun
Faculty of Biology and Environmental Protection
Environmental Protection, undergraduate studies
15 49
Environmental Protec-tion, graduate studies 7 22
Faculty of Law and Administration
Environmental Protection Law, graduate studies 9 45
8 University of Silesia
Faculty of Earth Sciences
Environmental Risk Engineering, undergradu-ate studies
14 46
Inter-faculty Studies in Environmental Protection
Environmental Protec-tion, undergraduate studies
17 66
Environmental Protec-tion, graduate studies 10 32
9 University of Wrocław
Faculty of Biological Sciences
Environmental Management, undergraduate studies
22 59
Environmental Manage-ment, graduate studies 16 53
Inter-faculty Institute of Environmental Protection
Environmental Protec-tion, undergraduate studies
20 62
Environmental Protec-tion, graduate studies 28 68
* the order of the individual universities in the table results from the order in the Times Higher Education 2018 rankingSource: the author’s own work based on syllabuses of individual universities.
EKONOMIA I ŚRODOWISKO 2 (69) • 2019General environmental and social problems198
The number of majors, where the programme concerns primarily envi-ronmental protection, does not have to translate into a teaching offer that enables one to acquire the most extensive knowledge in this area. It may only indicate that there is an extensive offer addressed to students regarding those subjects, but not necessarily indicating that specialist knowledge gets passed on during those courses. That is why it is advisable to subject individ-ual universities to closer scrutiny. For analysis purposes, it was calculated that the average number and the median of the number of courses for majors shown in table 2 were 13.95 and 14.00 respectively, whereas the average number and the median of the number of ECTS points were 45.57 and 45.00 respectively.
UW offers one major which offers only three courses related to environ-mental protection and/or sustainable development and merely 13 points have been allocated to them, these being the lowest values in this ranking. At other universities, many majors can be found whose names do not indi-cate a close connection with environmental protection while offering more environmental courses and more ECTS points allocated to them. At the same time, UW offers its students a major with 17 courses that are connected with a relatively large number of ECTS points, significantly above the average and the median – as many as 62.
In the case of AGH, among the indicated majors, both those that have 7 environmental courses and 20 ECTS points (which is one of the lowest scores in the ranking) and those that offer 30 or 24 courses and 94 and 76 ECTS points respectively are offered, which puts them at the top of the ranking. Five out of seven majors are characterised by a number of courses and ECTS points no smaller than the average and the median for all analysed majors.
UJ offers majors with a relatively small number of environmental courses. Only one major out of four is above the average and the median, offering 17 courses. Two majors offer a higher than average and median number of ECTS points – a major, where this value is relatively high (55), offers just 12 courses related to environmental protection.
In the case of PW, two majors out of five are clearly leading with regard to sustainable development, and the number of courses/points assigned/allo-cated to them is significantly above the average and the median, being equal to 23/89 and 19/70 for the first and second major respectively. The other three majors have their number of courses and ECTS points below the aver-age and the median.
In the case of UAM, two majors offer a small number of courses and ECTS points compared with other universities (significantly below the average and the median). Two majors, both in the number of courses and ECTS points allocated to them, show scores close to the average, although one major is
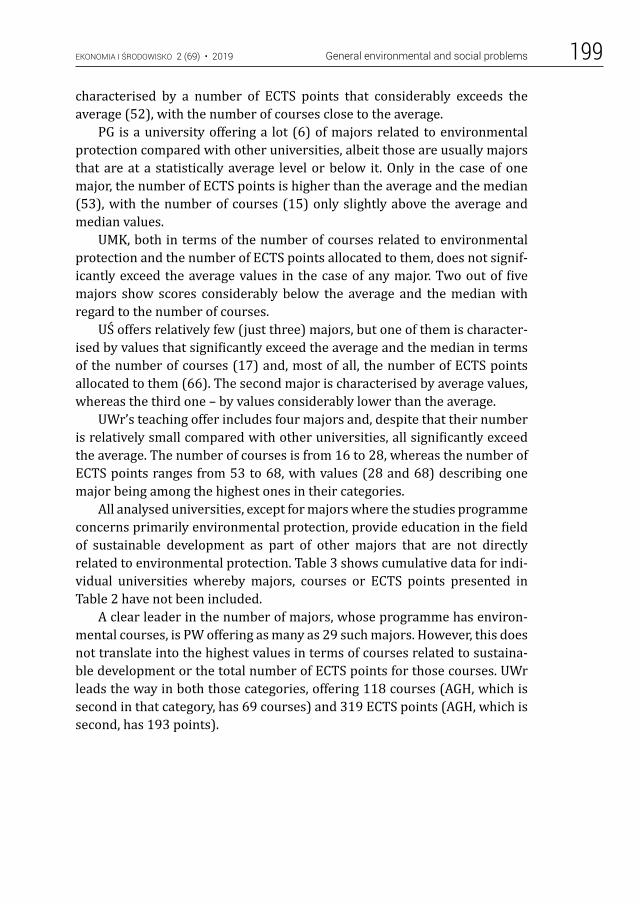
EKONOMIA I ŚRODOWISKO 2 (69) • 2019 General environmental and social problems 199
characterised by a number of ECTS points that considerably exceeds the average (52), with the number of courses close to the average.
PG is a university offering a lot (6) of majors related to environmental protection compared with other universities, albeit those are usually majors that are at a statistically average level or below it. Only in the case of one major, the number of ECTS points is higher than the average and the median (53), with the number of courses (15) only slightly above the average and median values.
UMK, both in terms of the number of courses related to environmental protection and the number of ECTS points allocated to them, does not signif-icantly exceed the average values in the case of any major. Two out of five majors show scores considerably below the average and the median with regard to the number of courses.
UŚ offers relatively few (just three) majors, but one of them is character-ised by values that significantly exceed the average and the median in terms of the number of courses (17) and, most of all, the number of ECTS points allocated to them (66). The second major is characterised by average values, whereas the third one – by values considerably lower than the average.
UWr’s teaching offer includes four majors and, despite that their number is relatively small compared with other universities, all significantly exceed the average. The number of courses is from 16 to 28, whereas the number of ECTS points ranges from 53 to 68, with values (28 and 68) describing one major being among the highest ones in their categories.
All analysed universities, except for majors where the studies programme concerns primarily environmental protection, provide education in the field of sustainable development as part of other majors that are not directly related to environmental protection. Table 3 shows cumulative data for indi-vidual universities whereby majors, courses or ECTS points presented in Table 2 have not been included.
A clear leader in the number of majors, whose programme has environ-mental courses, is PW offering as many as 29 such majors. However, this does not translate into the highest values in terms of courses related to sustaina-ble development or the total number of ECTS points for those courses. UWr leads the way in both those categories, offering 118 courses (AGH, which is second in that category, has 69 courses) and 319 ECTS points (AGH, which is second, has 193 points).
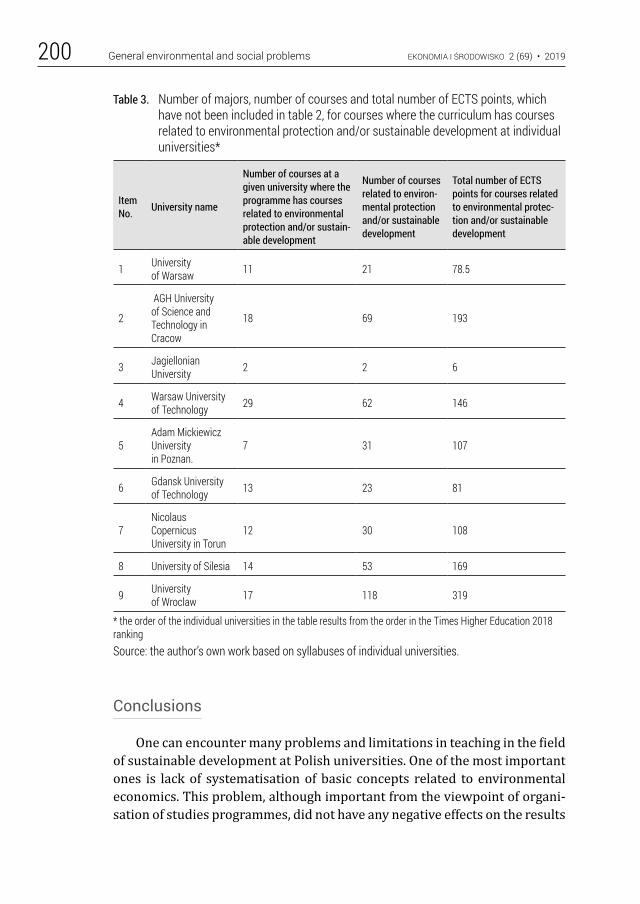
EKONOMIA I ŚRODOWISKO 2 (69) • 2019General environmental and social problems200
Table 3. Number of majors, number of courses and total number of ECTS points, which have not been included in table 2, for courses where the curriculum has courses related to environmental protection and/or sustainable development at individual universities*
Item No. University name
Number of courses at a given university where the programme has courses related to environmental protection and/or sustain-able development
Number of courses related to environ-mental protection and/or sustainable development
Total number of ECTS points for courses related to environmental protec-tion and/or sustainable development
1 University of Warsaw 11 21 78.5
2
AGH University of Science and Technology in Cracow
18 69 193
3 Jagiellonian University 2 2 6
4 Warsaw University of Technology 29 62 146
5Adam Mickiewicz University in Poznan.
7 31 107
6 Gdansk University of Technology 13 23 81
7Nicolaus Copernicus University in Torun
12 30 108
8 University of Silesia 14 53 169
9 University of Wroclaw 17 118 319
* the order of the individual universities in the table results from the order in the Times Higher Education 2018 rankingSource: the author’s own work based on syllabuses of individual universities.
Conclusions
One can encounter many problems and limitations in teaching in the field of sustainable development at Polish universities. One of the most important ones is lack of systematisation of basic concepts related to environmental economics. This problem, although important from the viewpoint of organi-sation of studies programmes, did not have any negative effects on the results
EKONOMIA I ŚRODOWISKO 2 (69) • 2019 General environmental and social problems 201
of conducted analysis, since the study did not systematise courses, but just counted them and the points allocated to them if the content of a syllabus indicated the presence of environmental problems as part of a given course. Thus, there are situations that courses having the same or very similar pro-grammes have completely different names as well as that courses given the same names have significantly different programmes.
The situation with majors is similar. Majors given the same names have considerably different studies programmes at different universities. Addi-tionally, there are cases that one university offers at different faculties majors that have the exact same name, and also in this case, the study programmes are different. On the one hand, it can be assumed that this results in extended teaching offer of a university, which gives students the opportunity to focus their environmental knowledge in a specialised way, this being important in the case of students who have clearly defined study goals. On the other hand, however, it can be interpreted as duplicating the didactic offer in the case of those students who do not analyse in depth the study programme of a given major when choosing it. An important argument in favour of keeping such a division may be the fact that individual faculties at the same university can have different reputation on the labour market and thus be considered more elite, and their graduates can count on better employment conditions.
Some students choosing their major and/or university will expect the programme offer to be prepared in such a way that environmental material only supplements the basic majors assumed by the student. However, other students will expect as much environmental knowledge passed on in a given course of studies as possible. That is why, when evaluating universities and majors in terms of diversity of their teaching offer, the number of majors and courses is important, and from the viewpoint of consolidation of knowledge and the amount of knowledge that can be acquired – the number of ECTS points. At the same time, it should be noted that the same number of ECTS points is often allocated to very different numbers of courses as part of one major. Thus, a student ought to additionally take into account the fact that, as part of the same number of ECTS points, they have a choice between majors offering various courses with an extensive context of the subject of sustaina-ble development (a large number of curses) or very specialised courses that offer detailed knowledge, but present a narrow scope of this field (a small number of courses).
There is also a group of students who do not look for environmental courses in studies programmes at all. For such students, the offer of all uni-versities is very extensive, of course, but what can be a positive thing is the fact that universities often introduce courses related to sustainable develop-ment to programmes of studies specialising in completely different fields.
EKONOMIA I ŚRODOWISKO 2 (69) • 2019General environmental and social problems202
The number of hours of and points for such courses is often very small and undoubtedly does not make it possible to discuss in depth all subjects related to sustainable development. Nevertheless and at the same time, the number of hours is usually sufficient to signal to students the basic issues faced by today’s economy focused on growth. This can raise possible doubts in stu-dents as to some majors and the ways economic growth is taught, which in turn can be an impulse to take up broader studies in the field of environmen-tal protection and sustainable development.
At the same time, it should be noted, that all nine analysed universities give students the opportunity of education in the field of environmental pro-tection and sustainable development. Each university has majors specialis-ing in those problems and each of them provides education in the area of sustainable development as part of majors not directly related to environ-mental protection as well. Therefore, a conclusion can be drawn that the best universities in Poland perform a mission consisting in educating in the field of sustainable development both through specialist education in this subject matter (in the case of majors dedicated to this subject) as well as through building of ecological awareness among students pursuing other majors.
Literature
Albareda-Tiana S. et. al. (2018), Implementing the sustainable development goals at University level, “International Journal of Sustainability in Higher Education” Vol. 19 No. 3, p. 473-497, DOI: 10.1108/IJSHE-05-2017-0069
Borys T. (2010), Dekada edukacji dla zrównoważonego rozwoju – polskie wyzwania, „Problemy Ekorozwoju” Vol. 5 No. 1, pp. 59-70
Dumitru D.E. (2017), Reorienting higher education pedagogical and professional development curricula toward sustainability–a Romanian perspective, “Interna-tional Journal of Sustainability in Higher Education” Vol. 18 No. 6, p. 894-907, DOI: 10.1108/IJSHE-03-2016-0046
Farinha C.S. et. al. (2018), Education for sustainable development in Portuguese uni-versities: The key actors’ opinions, “International Journal of Sustainability in Higher Education” Vol. 19 No. 5, p. 912-941, DOI: 10.1108/IJSHE-09-2017-0168
Kiełczewski D, Poskrobko T. (2009), Dydaktyka ekonomii zrównoważonego rozwoju, „Problemy Ekologii” Vol. 13 No. 5, pp. 238-239
Kościelniak C. (2014), A consideration of the changing focus on the sustainable devel-opment in higher education in Poland, “Journal of Cleaner Production” Vol. 62, p. 114-119, DOI: 10.1016/j.jclepro.2013.06.006
Kostrzewa K., Piasecki R. (2009), Approaches to Sustainable Development in Poland, “L’Europe en Formation” Vol. 2, pp. 181-196
Leal Filho W. (2017), Implementing Sustainability in the Curriculum of Universities, Springer
EKONOMIA I ŚRODOWISKO 2 (69) • 2019 General environmental and social problems 203
Leal Filho W. et. al. (2015), The future we want: Key issues on sustainable development in higher education after Rio and the UN decade of education for sustainable devel-opment, “International Journal of Sustainability in Higher Education” Vol. 16 No. 1, p. 112-129, DOI: 10.1108/IJSHE-03-2014-0036
Lorek A. (2013), Edukacja dla zrównoważonego rozwoju na przykładzie Uniwersytetu Ekonomicznego w Katowicach, „Studia Ekonomiczne” Vol. 131, pp. 23-31
Lozano R. et. al. (2015), A review of commitment and implementation of sustainable development in higher education: results from a worldwide survey, “Journal of Cleaner Production” Vol. 108, p. 1-18, DOI: 10.1108/IJSHE-07-2017-0114
Michalik A. (2016), Dydaktyka ekonomii zrównoważonego rozwoju jako jeden z aspek-tów strategii przedsiębiorstwa, „Acta Scientifica Academiae Ostroviensis” Vol. 8 No. 2, pp. 21-32
Scoullos M. et. al. (2017), Learning for and about sustainability in higher education – a regional perspective based on experiences from the Baltic and the Mediterra-nean, “International Journal of Sustainability in Higher Education” Vol. 18 No. 6, p. 877-893, DOI: 10.1108/IJSHE-03-2016-0056
Wals A. E. (2014), Sustainability in higher education in the context of the UN DESD: a review of learning and institutionalization processes, “Journal of Cleaner Production” Vol. 62, p. 8-15, DOI: 10.1108/IJSHE-07-2016-0142
Information for Authors – Submission Guidelines
Authors are invited to submit Academic Papers on theoretical and empirical aspects of Sustain-able Deve¬lopment and Environmental Management as well as on Environmental Economics and Natural Resources. Papers submitted for review should be in the form of Articles, Research Reports, Discussions or Reviews of Books, information on Academic Conferences, Symposia or Seminars.
Submissions should have up to 20.000 characters excluding abstract, footnotes, and reference list, with a clearly defined structure (Introduction, Chapters, Sub-chapters, Ending/Conclusions). Please strictly observe the number of characters. Each additional 1.000 characters of the text is charged (25 PLN or 6 EUR net).
Articles should be sent by e-mail to: [email protected], in compliance with the official form published on the website of the journal (www.ekonomiaisrodowisko.pl). A model form can be found in TEMPLATE. The references cited have to be in alphabetical order, unnumbered. Plans, drawings and schemas (black & white only) should be prepared using Microsoft Word with all elements grouped in a single element group. Graphic elements (e.g. JPG) and schemas (e.g. in Excel) should be submitted additionally as separate files.
Papers will be submitted to Peer Review and only original (previously unpublished) papers will be accepted. Papers not complying with Editorial Recommendations will be returned to the Author for correction.
The article, after taking into account the comments of our reviewers, is treated as final text. Pos-sible corrections resulting from the editorial composition can only be made on pdf files sent for our approval. Any corrections should concern only the errors resulting from the work on the text during the composition (e.g. changes in subscript/upload indices, drawing errors and other technical errors).
Please proofread your texts before sending them to us, as only the papers without any grammati-cal and spelling errors will be accepted. The Author have to sign the STATEMENT, that the article has been checked by the native speaker or professional translator. Please use correct scientific English. The Editorial Office may publish abridged versions of papers or change titles.
Authors of a submitted manuscript must sign a CONTRACT, confirm that the paper has not been published previously and transfer the propriety copyrights concerning the work to the Publisher.
Author’s Fees: PLN 1200 plus VAT (PLN 1476) or 350 EUR.
The fee is charged after accepting the paper for publication.
Editorial Office Contact Details:
FUNDACJA EKONOMISTÓW ŚRODOWISKA I ZASOBÓW NATURALNYCHJournal „Ekonomia i Środowisko”
Correspondence address: FUNDACJA EKONOMISTOW SRODOWISKA I ZASOBOW NATURALNYCHskr. poczt. 37, 15-436 Białystok 9, POLANDe-mail: [email protected]


![WALCZYKIEWICZ,zmian klimatu. Raport IPCC [2], raport Ameryka ńskiej Narodowej Akademii Nauk [3] oraz ... klimatu dla środowiska naturalnego b ędą nieuniknione. Niezb ędne jest](https://img.pdfslide.net/doc/110x75/5ec94c234f85e213165ce22c/walczykiewicz-zmian-klimatu-raport-ipcc-2-raport-ameryka-skiej-narodowej.jpg)

![FiabilitéS fonctionnelle et structurelle des convertisseursce2i.pole-medee.com/wp-content/uploads/2017/12/VTS2-1.pdf · 2019. 7. 2. · [R1] D. Richard and Y. Dubel, "Valeo StARS](https://img.pdfslide.net/doc/110x75/60de7f72f538d44ed23c7615/fiabilits-fonctionnelle-et-structurelle-des-2019-7-2-r1-d-richard-and.jpg)