Embed Size (px)
Citation preview
COLLEGE AND COMMUNITY PROFILES
nmEl Camino College
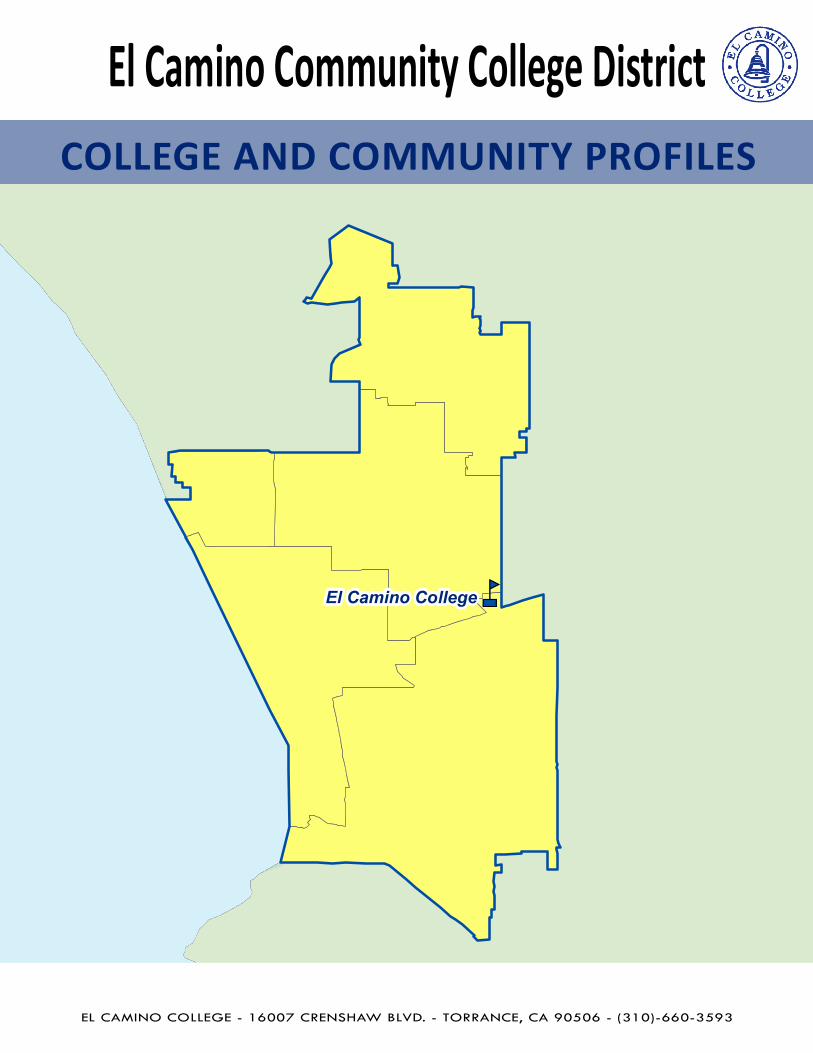
El Camino Community College District
EL CAMINO COLLEGE - 16007 CRENSHAW BLVD. - TORRANCE, CA 90506 - (310)-660-3593
Table of Contents
Maps ............................................................................................................................................... 2
Trustee Boundary Map ................................................................................................................ 2
El Camino Community College District Map............................................................................ 3
Profile .............................................................................................................................................. 4
Fall 2009 Facts and Figures ......................................................................................................... 4
Resident Credits FTES.......................................................................................................... 5
2009 Annual Fact Book ........................................................................................... 6
High Schools ................................................................................................................................. 43
2008‐09 College‐going Rates and Higher Education Destinations ................................... 43
High School Report Cards ..................................................................................... 49
Community ................................................................................................................................... 69
District Demographic Profile (Pending) ........................................................................... 69
Other Reports ....................................................................................................................................
Acknowledgements
We would like to acknowledge the following individuals who contributed to this college and community profile.
Lovell Alford – Academic Affairs Analyst, Vice President of Academic Affairs
Elizabeth Campos ‐ Senior Clerical Assistant, Vice President of Student & Community Advancement
Theresa Clifford ‐ First Year Experience Secretary
Irene Graff – Director, Office of Institutional Research
Marci Myers – Research Assistant, Office of Institutional Research
Carolyn Pineda – Research Analyst, Office of Institutional Research
Mike Wilson – Research Analyst, Office of Institutional Research
1
nm
TRUSTEE AREA 5Miss Maureen O'Donnell
TRUSTEE AREA 4Dr. Ray Gen
TRUSTEE AREA 3Mr. William J. Beverly
TRUSTEE AREA 1Dr. Nathaniel Jackson
TRUSTEE AREA 2Mrs. Mary E. Combs
Compton Community Educational Center
TRUSTEE AREA 2
TRUSTEE AREA 2Dr. John P. Hamilton
Dr. John P. Hamilton
CentennialHigh
TRUSTEE AREA 1Ms. Lorraine Cervantes & Mr. Charles Davis
TRUSTEE AREA 3Mr. Andres Ramos
ComptonHigh
InglewoodHigh
HawthorneHigh
LawndaleHigh
LeuzingerHigh
El SegundoHigh
Mira CostaHigh
RedondoHigh
NorthHigh
WestHigh
Bishop Montgomery
High
SouthHigh
TorranceHigh
El Camino College
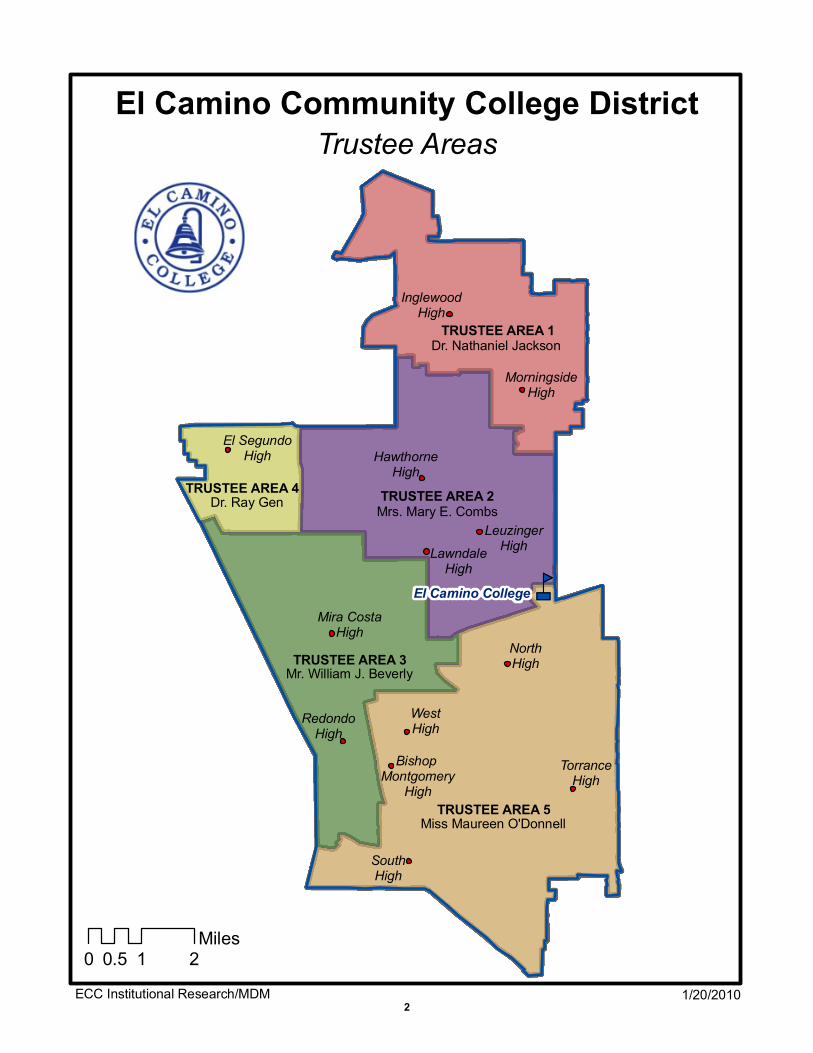
ECC Institutional Research/MDM
0 1 20.5Miles
El Camino Community College District
1/20/2010
Trustee Areas
MorningsideHigh
2
405
405
110
110
105
110
105
405
91
110
105
Willowbrook
Westmont
WestCompton
WestCarson
WestAthens
View Park-Windsor
Hills
Torrance
SantaMonica
RollingHills
Estates
RollingHills
RedondoBeach
RanchoPalos
Verdes
PalosVerdesEstates
Marinadel Rey
ManhattanBeach
LosAngeles
Lomita
Lennox
Lawndale
LaderaHeights
Inglewood
HermosaBeach
Hawthorne
Gardena
El Segundo
DelAire
CulverCity
Carson
AlondraPark
El CaminoCollege
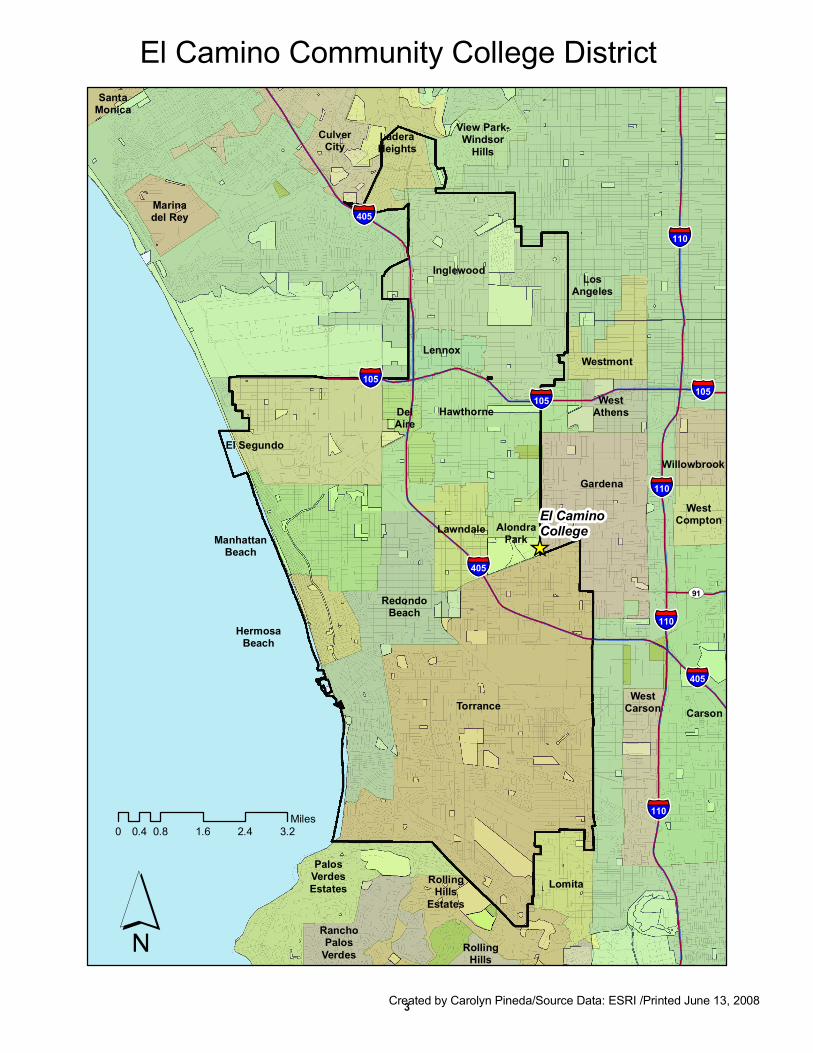
El Camino Community College District
0 0.8 1.6 2.4 3.20.4Miles
Created by Carolyn Pineda/Source Data: ESRI /Printed June 13, 20083
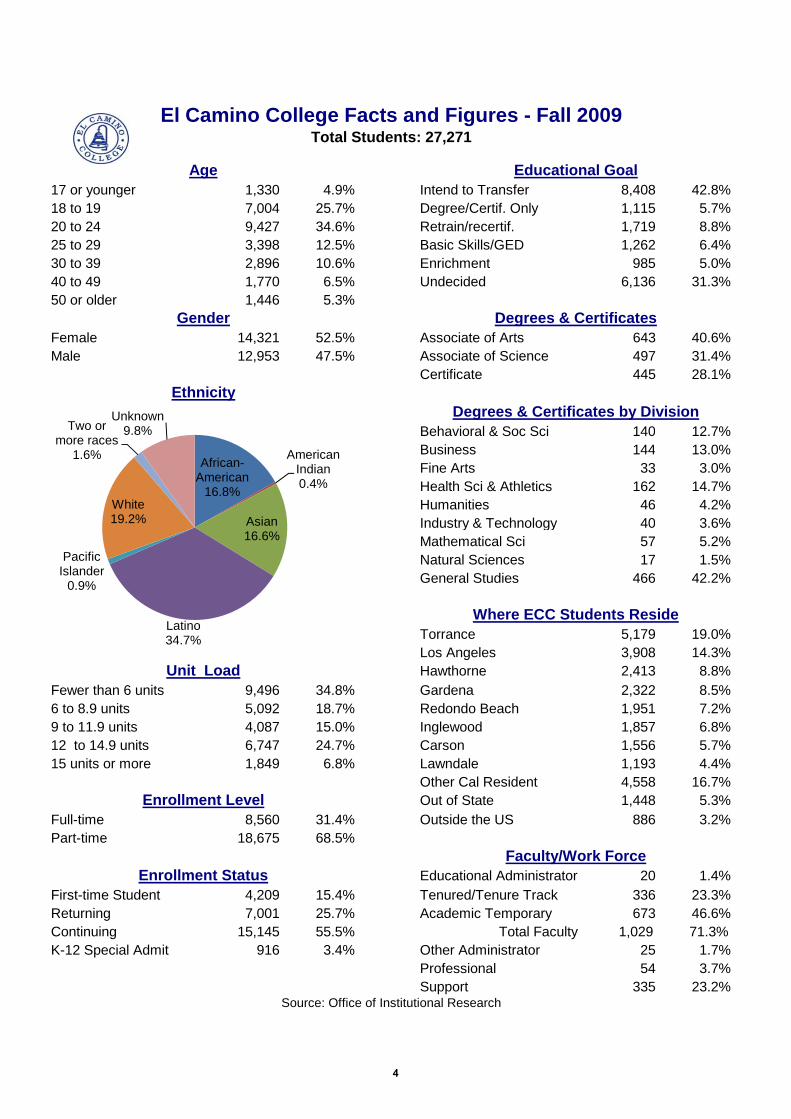
17 or younger 1,330 4.9% Intend to Transfer 8,408 42.8%18 to 19 7,004 25.7% Degree/Certif. Only 1,115 5.7%20 to 24 9,427 34.6% Retrain/recertif. 1,719 8.8%25 to 29 3,398 12.5% Basic Skills/GED 1,262 6.4%30 to 39 2,896 10.6% Enrichment 985 5.0%40 to 49 1,770 6.5% Undecided 6,136 31.3%50 or older 1,446 5.3%
Female 14,321 52.5% Associate of Arts 643 40.6%Male 12,953 47.5% Associate of Science 497 31.4%
Certificate 445 28.1%
Behavioral & Soc Sci 140 12.7%Business 144 13.0%Fine Arts 33 3.0%Health Sci & Athletics 162 14.7%Humanities 46 4.2%Industry & Technology 40 3.6%Mathematical Sci 57 5.2%Natural Sciences 17 1.5%General Studies 466 42.2%
El Camino College Facts and Figures - Fall 2009Total Students: 27,271
Degrees & Certificates by DivisionEthnicity
Degrees & Certificates
Where ECC Students Reside
Educational GoalAge
Gender
African-American
16.8%
American Indian0.4%
Asian16.6%
Latino
Pacific Islander
0.9%
White19.2%
Two or more races
1.6%
Unknown9.8%
Torrance 5,179 19.0%Los Angeles 3,908 14.3%Hawthorne 2,413 8.8%
Fewer than 6 units 9,496 34.8% Gardena 2,322 8.5%6 to 8.9 units 5,092 18.7% Redondo Beach 1,951 7.2%9 to 11.9 units 4,087 15.0% Inglewood 1,857 6.8%12 to 14.9 units 6,747 24.7% Carson 1,556 5.7%15 units or more 1,849 6.8% Lawndale 1,193 4.4%
Other Cal Resident 4,558 16.7%Out of State 1,448 5.3%
Full-time 8,560 31.4% Outside the US 886 3.2%Part-time 18,675 68.5%
Educational Administrator 20 1.4%First-time Student 4,209 15.4% Tenured/Tenure Track 336 23.3%Returning 7,001 25.7% Academic Temporary 673 46.6%Continuing 15,145 55.5% Total Faculty 1,029 71.3%K-12 Special Admit 916 3.4% Other Administrator 25 1.7%
Professional 54 3.7%Support 335 23.2%
Source: Office of Institutional Research
Enrollment Level
Enrollment Status
Where ECC Students Reside
Unit Load
Faculty/Work Force
African-American
16.8%
American Indian0.4%
Asian16.6%
Latino34.7%
Pacific Islander
0.9%
White19.2%
Two or more races
1.6%
Unknown9.8%
4
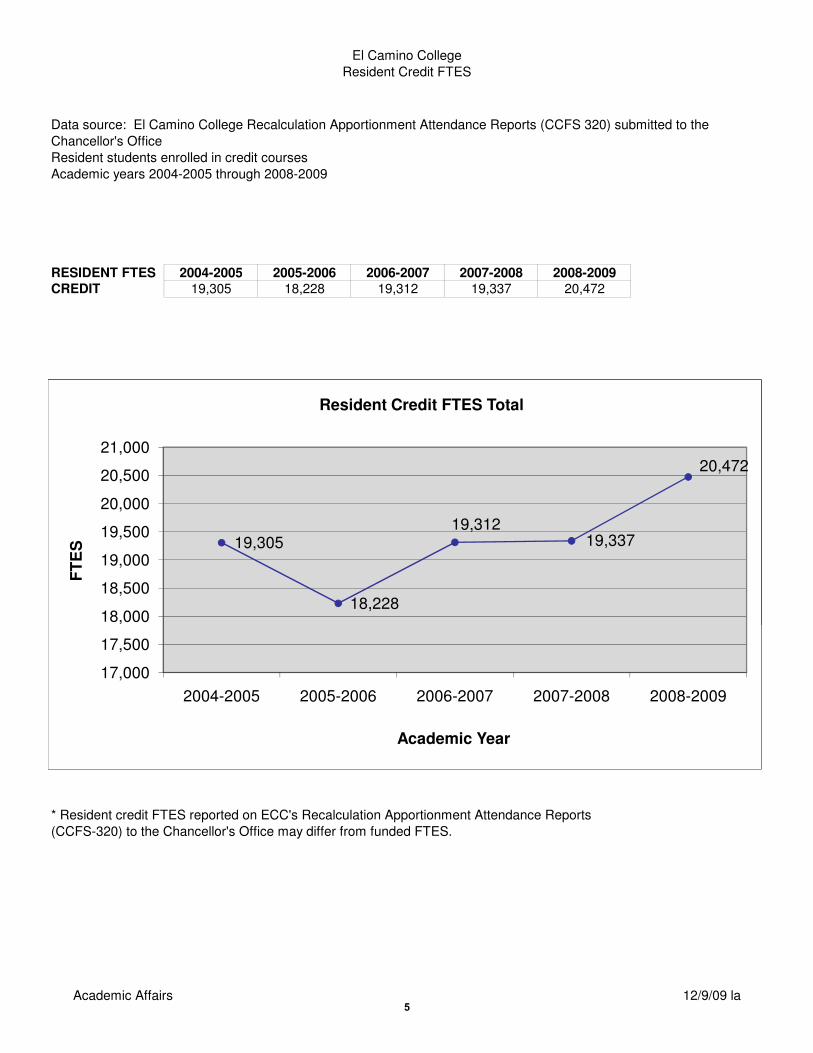
El Camino College
Resident Credit FTES
Data source: El Camino College Recalculation Apportionment Attendance Reports (CCFS 320) submitted to the
Chancellor's Office
Resident students enrolled in credit courses
Academic years 2004-2005 through 2008-2009
RESIDENT FTES 2004-2005 2005-2006 2006-2007 2007-2008 2008-2009
CREDIT 19,305 18,228 19,312 19,337 20,472
19,305
18,228
19,31219,337
20,472
18,000
18,500
19,000
19,500
20,000
20,500
21,000
FT
ES
Resident Credit FTES Total
* Resident credit FTES reported on ECC's Recalculation Apportionment Attendance Reports
(CCFS-320) to the Chancellor's Office may differ from funded FTES.
19,305
18,228
19,31219,337
20,472
17,000
17,500
18,000
18,500
19,000
19,500
20,000
20,500
21,000
2004-2005 2005-2006 2006-2007 2007-2008 2008-2009
FT
ES
Academic Year
Resident Credit FTES Total
Academic Affairs 12/9/09 la5
2009 Annual Fact Book
Office of Institutional Research
6
2009 Annual Fact Book
2
Table of Contents
Introduction .................................................................................................................................... 3
Section 1 – El Camino College Service Area .................................................................................... 4
Section 2 – Student and Enrollment Trends ................................................................................... 6
Section 3 – Special Programs ........................................................................................................ 14
Section 4 – Success and Retention ............................................................................................... 25
Section 5 – Student Outcomes ..................................................................................................... 30
Appendix ....................................................................................................................................... 36
7
2009 Annual Fact Book
3
Introduction
The ECC Annual Fact Book is a reference source containing trend data about students, student outcomes, and instructional programs and services. The data and analysis in the fact book provide background information to facilitate policy analysis and decision making. It should be a useful tool in college and departmental planning, grant preparation, and in the accreditation process. It is our hope that the information provided is used to objectively evaluate programs and practices as well as visualize the trends that affect El Camino College’s current and future operations.
Demographic and enrollment data on ECC students was provided by the Chancellor’s Office. Some of the data in the Special Programs section was extracted from the college’s student database. In addition, data from the National Student Clearinghouse was used to provide transfer destination information.
The Fact Book was composed and assembled by Carolyn Pineda. Special acknowledgement goes to Dwight Ueda, El Camino College Photographer, for providing the photographs used in this publication.
P
lease send any comments or feedback to the Office of Institutional Research.
Irene Graff, Director
Carolyn Pineda, Research Analyst
Mike Wilson, Research Analyst
8
2009 Annual Fact Book
4
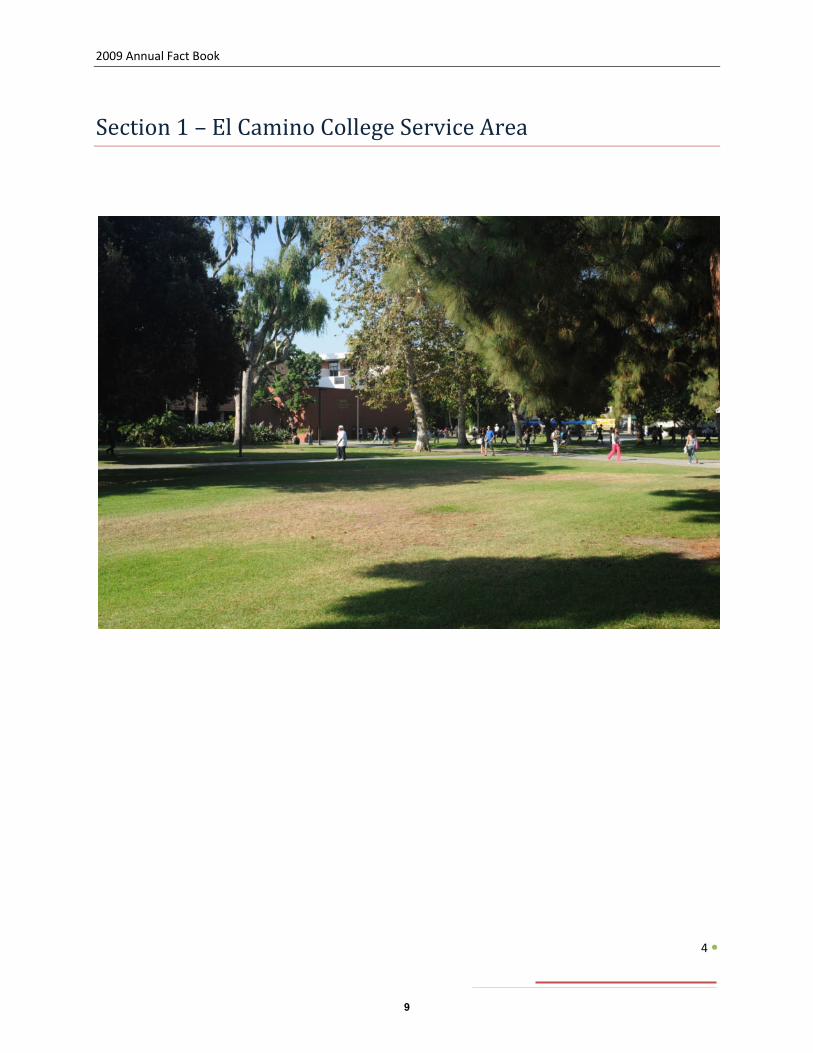
Section 1 – El Camino College Service Area
9
2009 Annual Fact Book
5
10
2009 Annual Fact Book
6
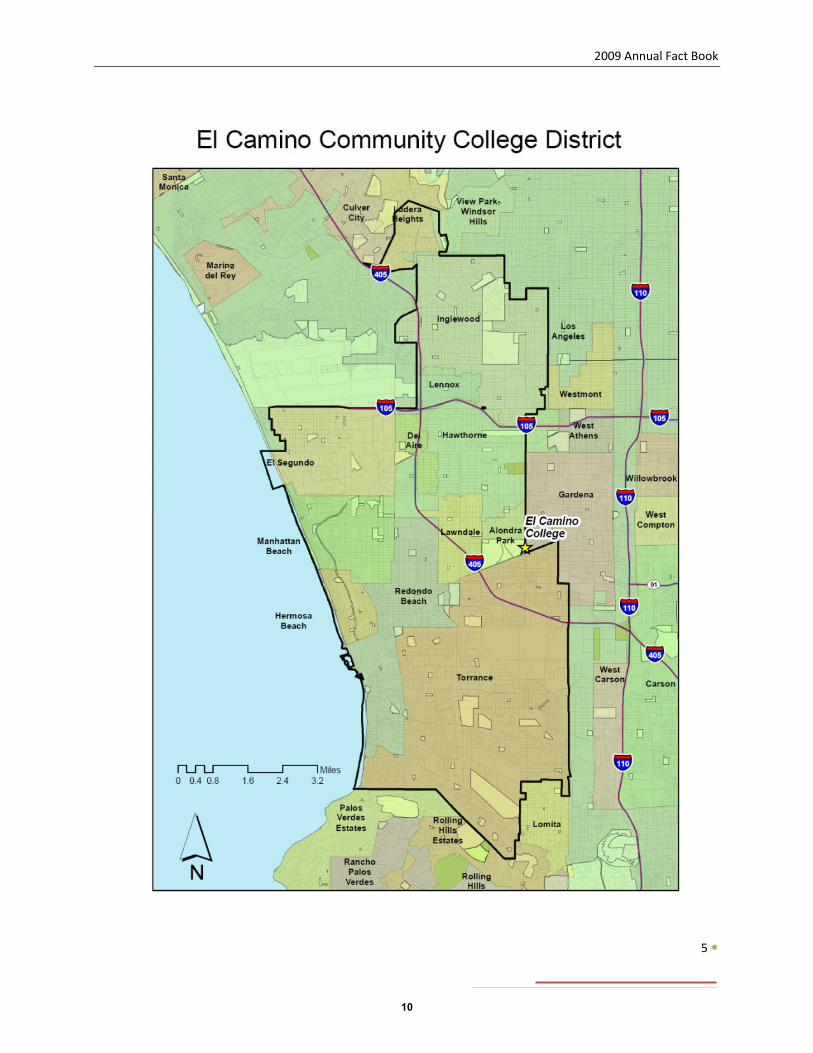
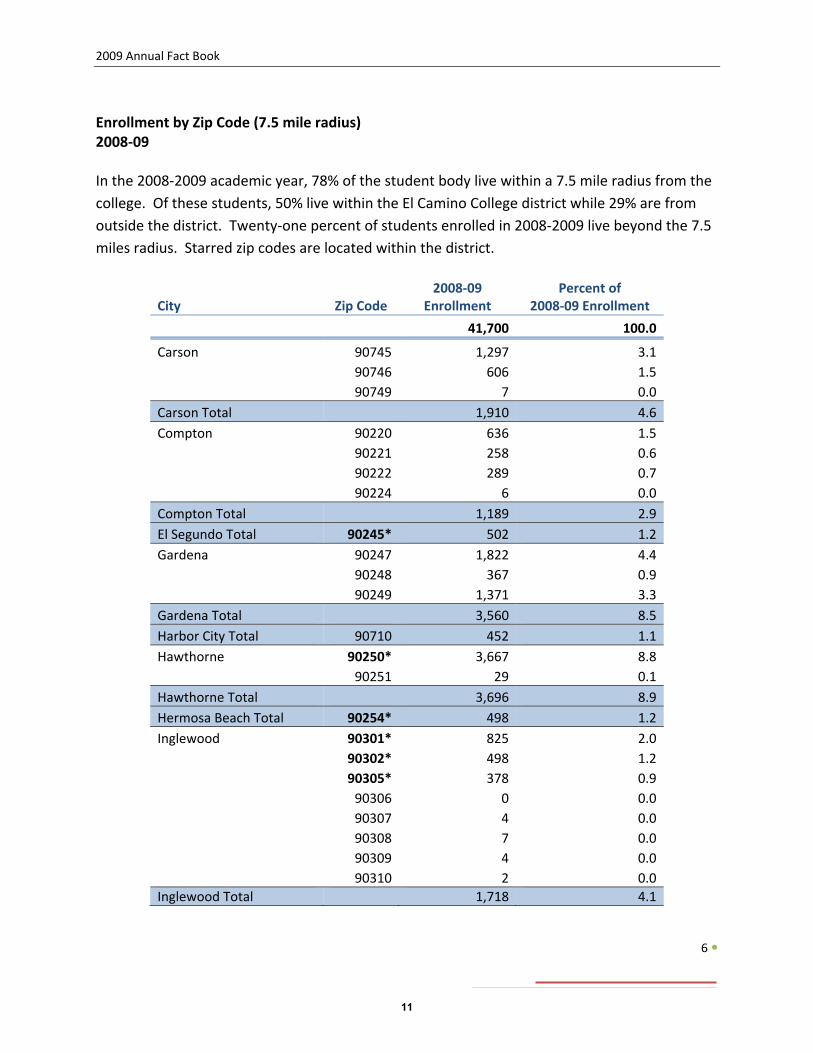
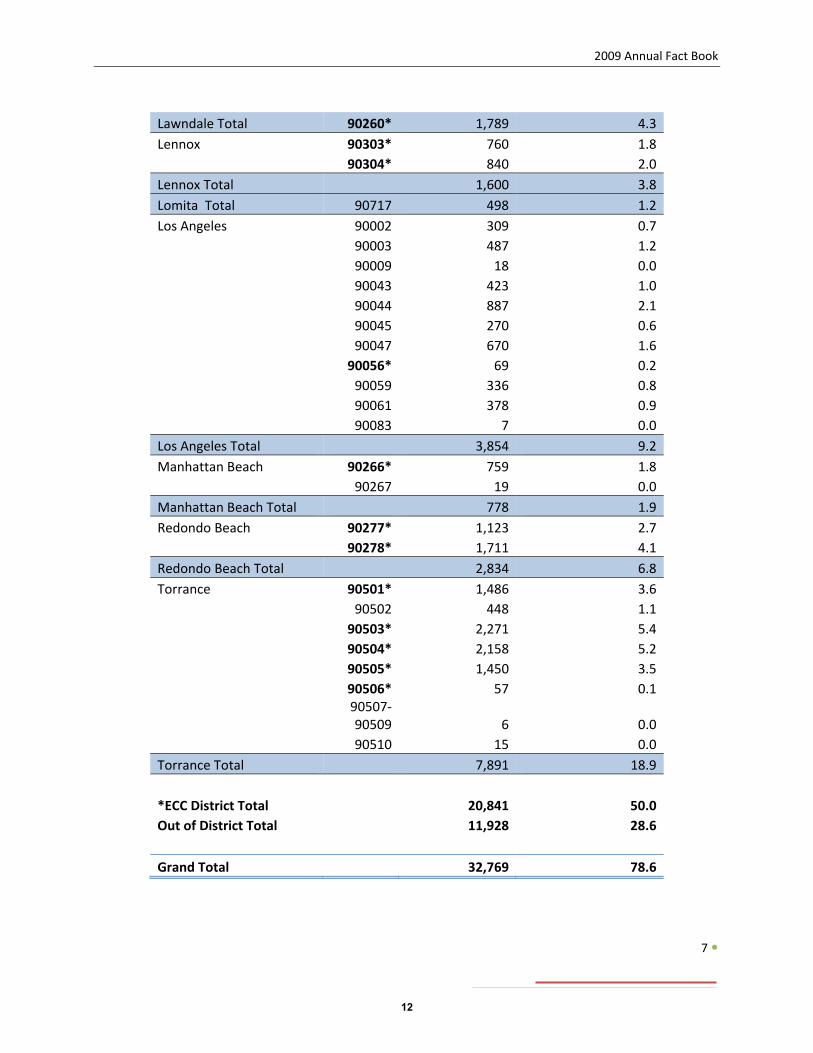
Enrollment by Zip Code (7.5 mile radius) 2008‐09 In the 2008‐2009 academic year, 78% of the student body live within a 7.5 mile radius from the college. Of these students, 50% live within the El Camino College district while 29% are from outside the district. Twenty‐one percent of students enrolled in 2008‐2009 live beyond the 7.5 miles radius. Starred zip codes are located within the district.
City Zip Code 2008‐09
Enrollment Percent of
2008‐09 Enrollment
41,700 100.0
Carson 90745 1,297 3.190746 606 1.5
90749 7 0.0Carson Total 1,910 4.6Compton 90220 636 1.5
90221 258 0.690222 289 0.7
90224 6 0.0Compton Total 1,189 2.9El Segundo Total 90245* 502 1.2Gardena 90247 1,822 4.4
90248 367 0.9 90249 1,371 3.3Gardena Total 3,560 8.5Harbor City Total 90710 452 1.1Hawthorne 90250* 3,667 8.8 90251 29 0.1Hawthorne Total 3,696 8.9Hermosa Beach Total 90254* 498 1.2Inglewood 90301* 825 2.0
90302* 498 1.290305* 378 0.990306 0 0.090307 4 0.090308 7 0.090309 4 0.0
90310 2 0.0Inglewood Total 1,718 4.1
11
2009 Annual Fact Book
7
Lawndale Total 90260* 1,789 4.3Lennox 90303* 760 1.8 90304* 840 2.0Lennox Total 1,600 3.8Lomita Total 90717 498 1.2Los Angeles 90002 309 0.7
90003 487 1.290009 18 0.090043 423 1.090044 887 2.190045 270 0.690047 670 1.690056* 69 0.290059 336 0.890061 378 0.9
90083 7 0.0Los Angeles Total 3,854 9.2Manhattan Beach 90266* 759 1.8
90267 19 0.0Manhattan Beach Total 778 1.9Redondo Beach 90277* 1,123 2.7
90278* 1,711 4.1Redondo Beach Total 2,834 6.8Torrance 90501* 1,486 3.6
90502 448 1.190503* 2,271 5.490504* 2,158 5.290505* 1,450 3.590506* 57 0.190507‐90509 6 0.0
90510 15 0.0Torrance Total 7,891 18.9
*ECC District Total 20,841 50.0Out of District Total 11,928 28.6
Grand Total 32,769 78.6
12
2009 Annual Fact Book
8
Section 2 – Student and Enrollment Trends
13
2009 Annual Fact Book
9
Total College Enrollment
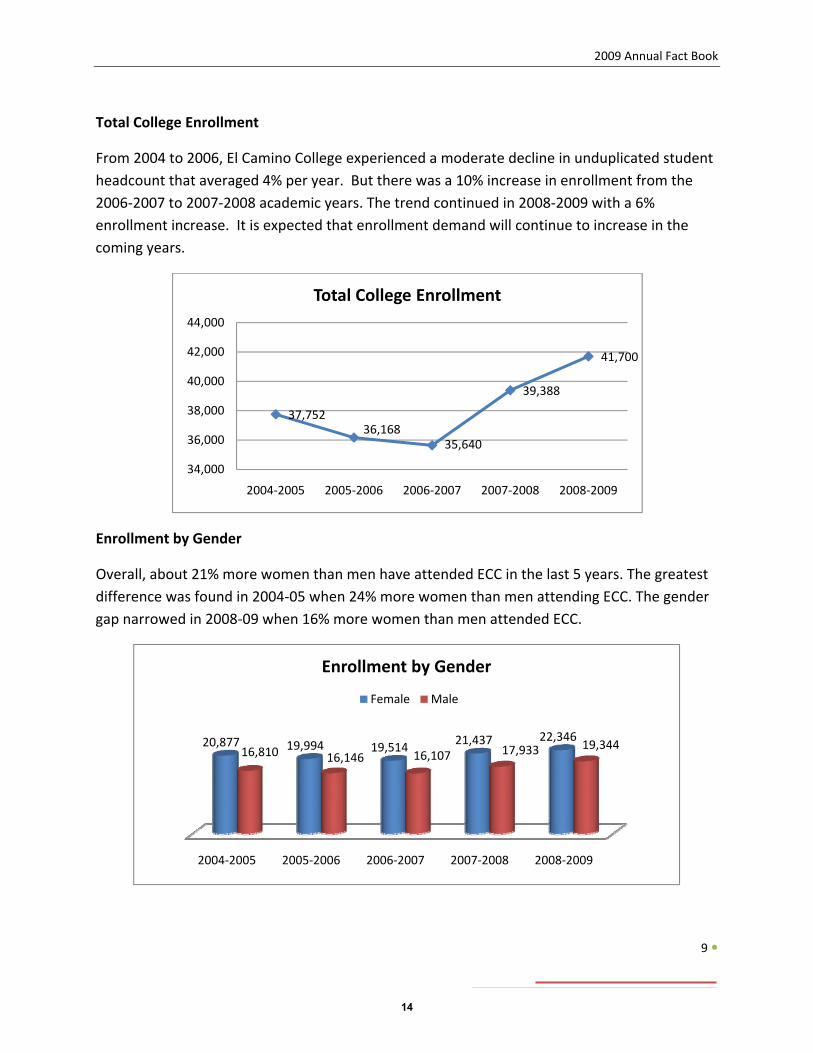
From 2004 to 2006, El Camino College experienced a moderate decline in unduplicated student headcount that averaged 4% per year. But there was a 10% increase in enrollment from the 2006‐2007 to 2007‐2008 academic years. The trend continued in 2008‐2009 with a 6% enrollment increase. It is expected that enrollment demand will continue to increase in the coming years.
Enrollment by Gender
Overall, about 21% more women than men have attended ECC in the last 5 years. The greatest difference was found in 2004‐05 when 24% more women than men attending ECC. The gender gap narrowed in 2008‐09 when 16% more women than men attended ECC.
37,75236,168
35,640
39,388
41,700
34,000
36,000
38,000
40,000
42,000
44,000
2004‐2005 2005‐2006 2006‐2007 2007‐2008 2008‐2009
Total College Enrollment
2004‐2005 2005‐2006 2006‐2007 2007‐2008 2008‐2009
20,877 19,994 19,514 21,437 22,34616,810 16,146 16,107 17,933 19,344
Enrollment by Gender
Female Male
14
2009 Annual Fact Book
10
Enrollment by Age
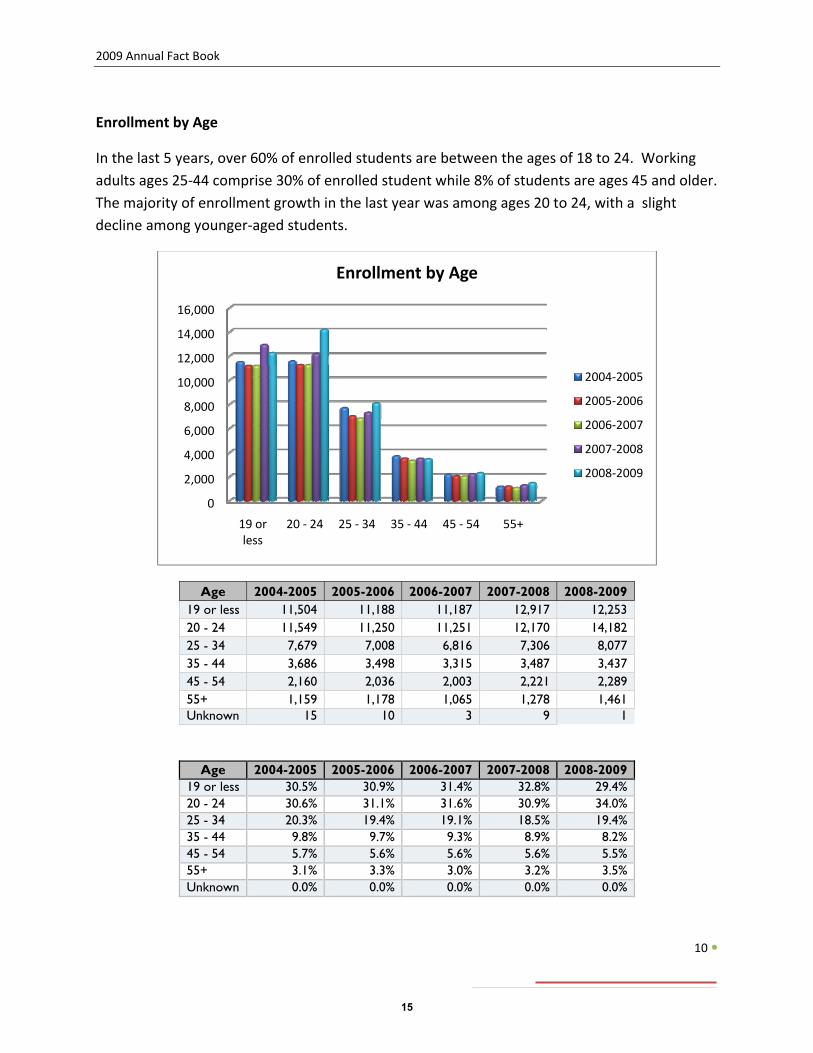
In the last 5 years, over 60% of enrolled students are between the ages of 18 to 24. Working adults ages 25‐44 comprise 30% of enrolled student while 8% of students are ages 45 and older. The majority of enrollment growth in the last year was among ages 20 to 24, with a slight decline among younger‐aged students.
Age 2004-2005 2005-2006 2006-2007 2007-2008 2008-2009 19 or less 11,504 11,188 11,187 12,917 12,253 20 - 24 11,549 11,250 11,251 12,170 14,182 25 - 34 7,679 7,008 6,816 7,306 8,077 35 - 44 3,686 3,498 3,315 3,487 3,437 45 - 54 2,160 2,036 2,003 2,221 2,289 55+ 1,159 1,178 1,065 1,278 1,461 Unknown 15 10 3 9 1
Age 2004-2005 2005-2006 2006-2007 2007-2008 2008-2009 19 or less 30.5% 30.9% 31.4% 32.8% 29.4% 20 - 24 30.6% 31.1% 31.6% 30.9% 34.0% 25 - 34 20.3% 19.4% 19.1% 18.5% 19.4% 35 - 44 9.8% 9.7% 9.3% 8.9% 8.2% 45 - 54 5.7% 5.6% 5.6% 5.6% 5.5% 55+ 3.1% 3.3% 3.0% 3.2% 3.5% Unknown 0.0% 0.0% 0.0% 0.0% 0.0%
0
2,000
4,000
6,000
8,000
10,000
12,000
14,000
16,000
19 or less
20 ‐ 24 25 ‐ 34 35 ‐ 44 45 ‐ 54 55+
Enrollment by Age
2004‐2005
2005‐2006
2006‐2007
2007‐2008
2008‐2009
15
2009 Annual Fact Book
11
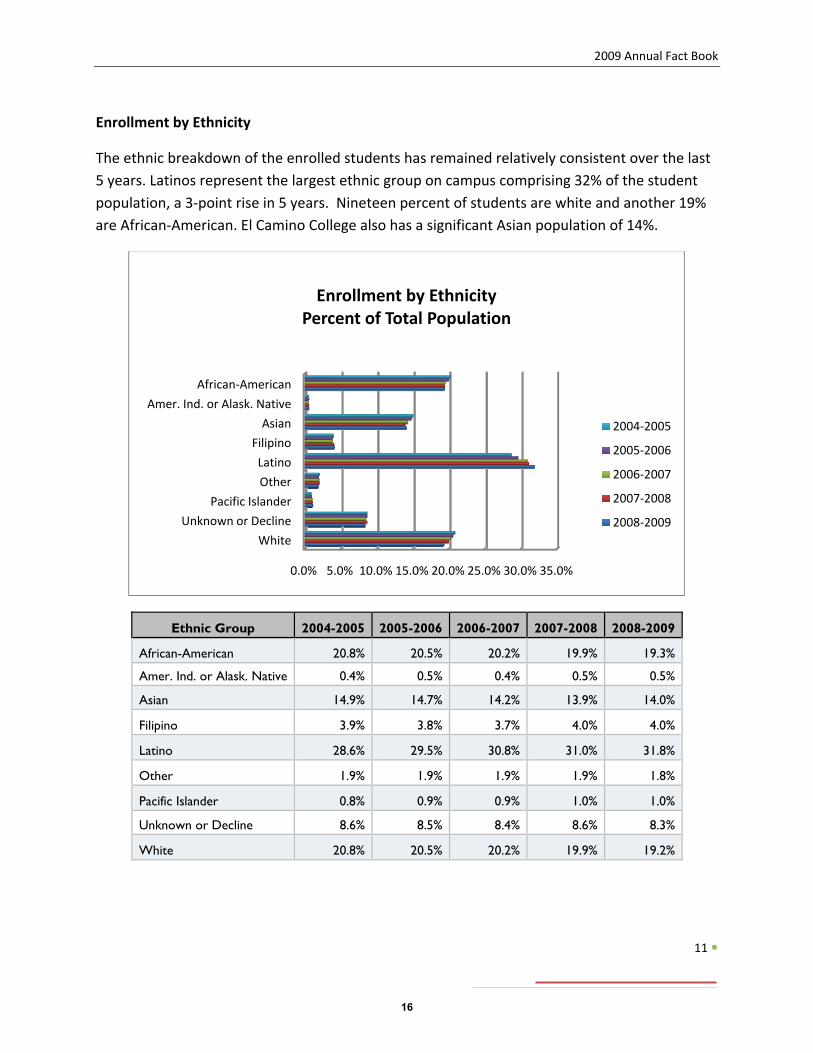
Enrollment by Ethnicity
The ethnic breakdown of the enrolled students has remained relatively consistent over the last 5 years. Latinos represent the largest ethnic group on campus comprising 32% of the student population, a 3‐point rise in 5 years. Nineteen percent of students are white and another 19% are African‐American. El Camino College also has a significant Asian population of 14%.
Ethnic Group 2004-2005 2005-2006 2006-2007 2007-2008 2008-2009
African-American 20.8% 20.5% 20.2% 19.9% 19.3%
Amer. Ind. or Alask. Native 0.4% 0.5% 0.4% 0.5% 0.5%
Asian 14.9% 14.7% 14.2% 13.9% 14.0%
Filipino 3.9% 3.8% 3.7% 4.0% 4.0%
Latino 28.6% 29.5% 30.8% 31.0% 31.8%
Other 1.9% 1.9% 1.9% 1.9% 1.8%
Pacific Islander 0.8% 0.9% 0.9% 1.0% 1.0%
Unknown or Decline 8.6% 8.5% 8.4% 8.6% 8.3%
White 20.8% 20.5% 20.2% 19.9% 19.2%
0.0% 5.0% 10.0% 15.0% 20.0% 25.0% 30.0% 35.0%
White
Unknown or Decline
Pacific Islander
Other
Latino
Filipino
Asian
Amer. Ind. or Alask. Native
African‐American
Enrollment by EthnicityPercent of Total Population
2004‐2005
2005‐2006
2006‐2007
2007‐2008
2008‐2009
16
2009 Annual Fact Book
12
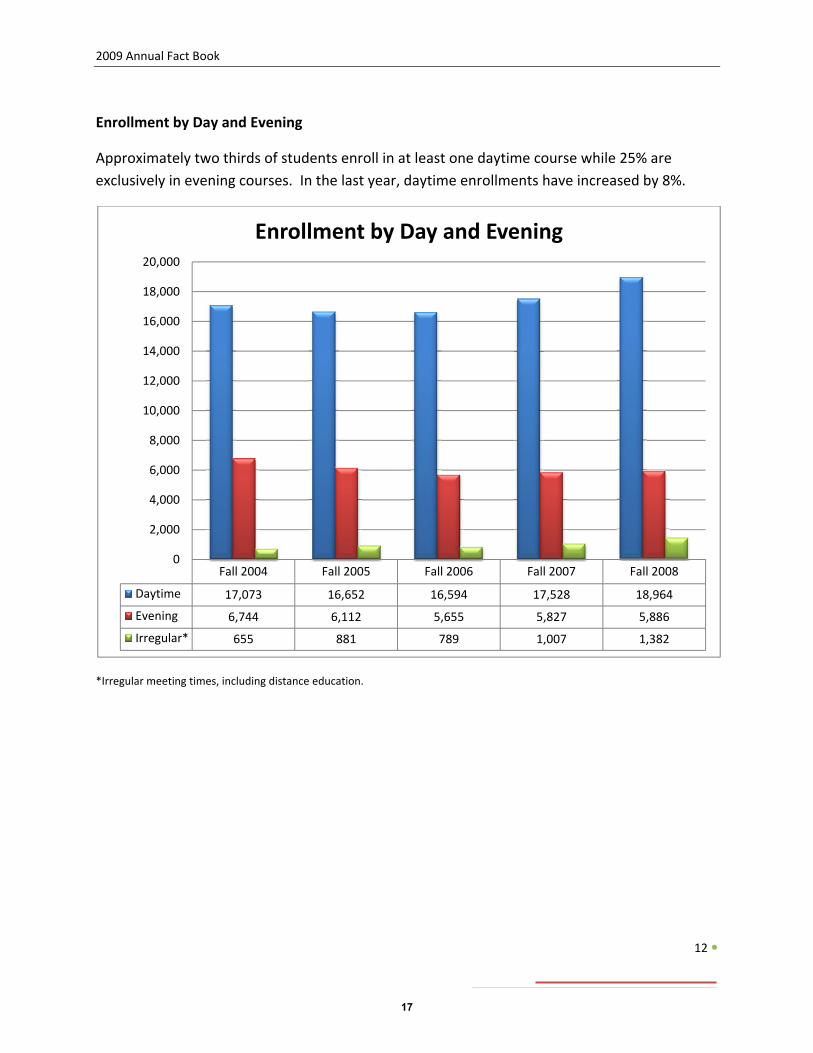
Enrollment by Day and Evening
Approximately two thirds of students enroll in at least one daytime course while 25% are exclusively in evening courses. In the last year, daytime enrollments have increased by 8%.
*Irregular meeting times, including distance education.
Fall 2004 Fall 2005 Fall 2006 Fall 2007 Fall 2008
Daytime 17,073 16,652 16,594 17,528 18,964
Evening 6,744 6,112 5,655 5,827 5,886
Irregular* 655 881 789 1,007 1,382
0
2,000
4,000
6,000
8,000
10,000
12,000
14,000
16,000
18,000
20,000
Enrollment by Day and Evening
17
2009 Annual Fact Book
13
Enrollment by High Schools
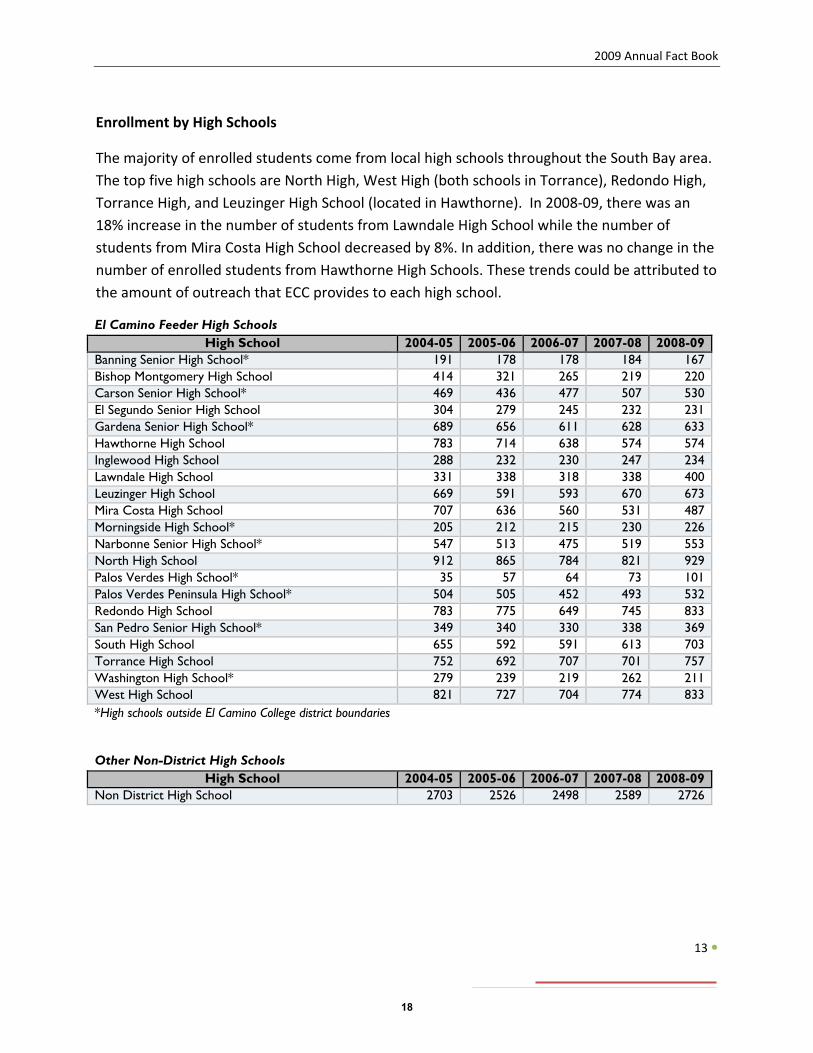
The majority of enrolled students come from local high schools throughout the South Bay area. The top five high schools are North High, West High (both schools in Torrance), Redondo High, Torrance High, and Leuzinger High School (located in Hawthorne). In 2008‐09, there was an 18% increase in the number of students from Lawndale High School while the number of students from Mira Costa High School decreased by 8%. In addition, there was no change in the number of enrolled students from Hawthorne High Schools. These trends could be attributed to the amount of outreach that ECC provides to each high school.
El Camino Feeder High Schools High School 2004-05 2005-06 2006-07 2007-08 2008-09
Banning Senior High School* 191 178 178 184 167 Bishop Montgomery High School 414 321 265 219 220 Carson Senior High School* 469 436 477 507 530 El Segundo Senior High School 304 279 245 232 231 Gardena Senior High School* 689 656 611 628 633 Hawthorne High School 783 714 638 574 574 Inglewood High School 288 232 230 247 234 Lawndale High School 331 338 318 338 400 Leuzinger High School 669 591 593 670 673 Mira Costa High School 707 636 560 531 487 Morningside High School* 205 212 215 230 226 Narbonne Senior High School* 547 513 475 519 553 North High School 912 865 784 821 929 Palos Verdes High School* 35 57 64 73 101 Palos Verdes Peninsula High School* 504 505 452 493 532 Redondo High School 783 775 649 745 833 San Pedro Senior High School* 349 340 330 338 369 South High School 655 592 591 613 703 Torrance High School 752 692 707 701 757 Washington High School* 279 239 219 262 211 West High School 821 727 704 774 833 *High schools outside El Camino College district boundaries Other Non-District High Schools
High School 2004-05 2005-06 2006-07 2007-08 2008-09 Non District High School 2703 2526 2498 2589 2726
18
2009 Annual Fact Book
14
Section 3 – Special Programs
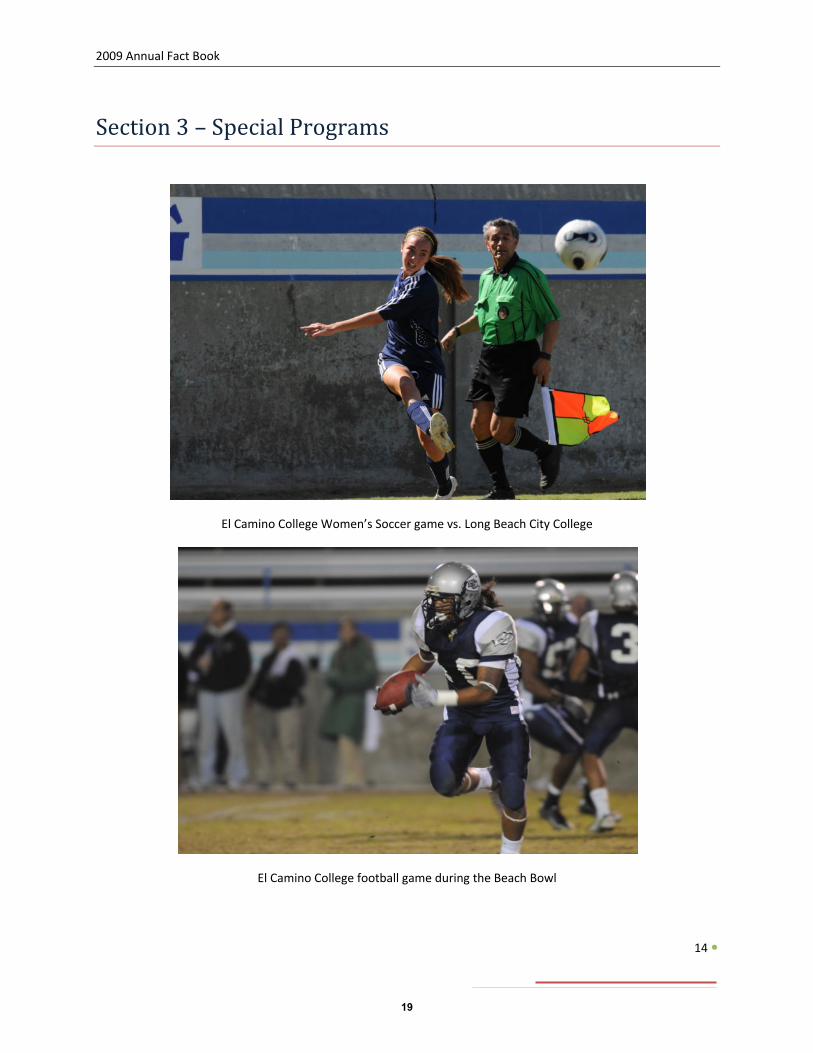
El Camino College Women’s Soccer game vs. Long Beach City College
El Camino College football game during the Beach Bowl
19
2009 Annual Fact Book
15
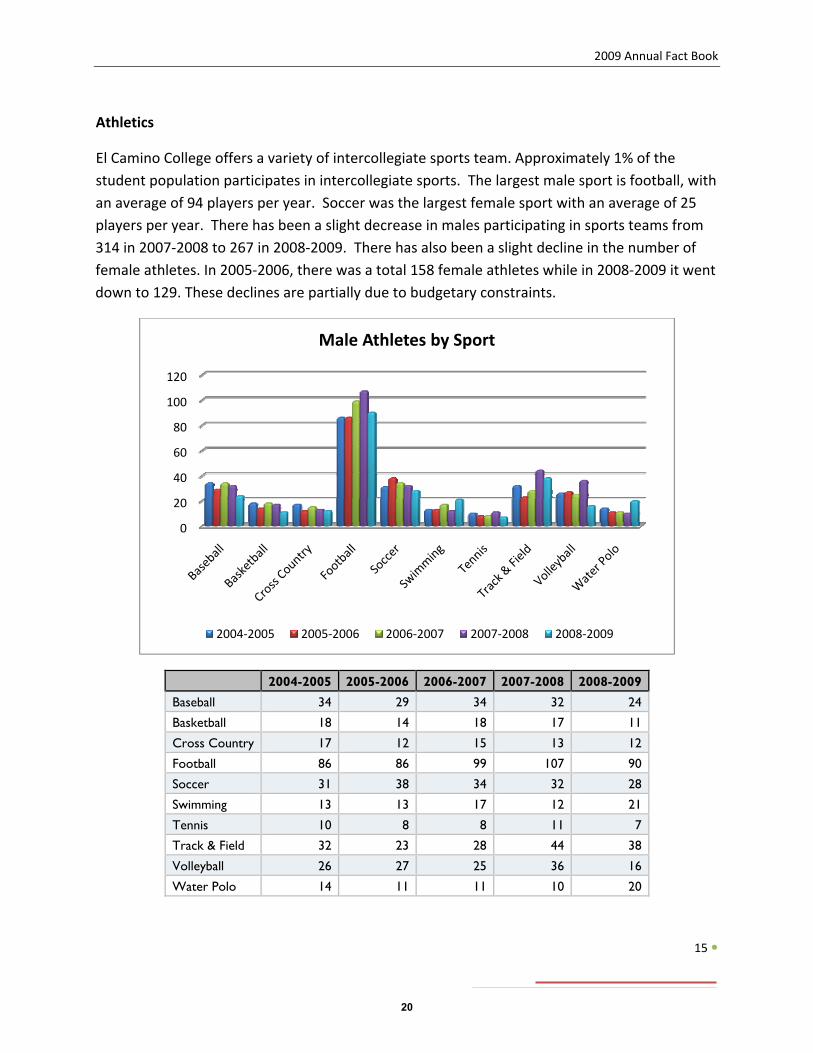
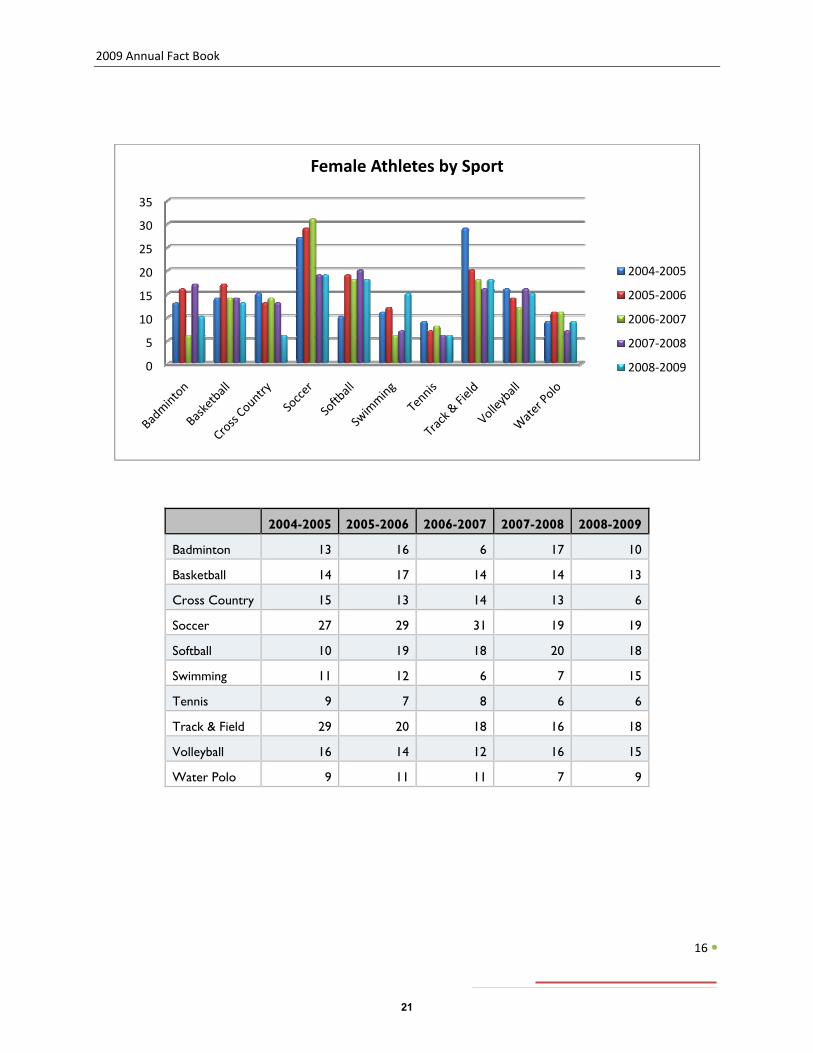
Athletics
El Camino College offers a variety of intercollegiate sports team. Approximately 1% of the student population participates in intercollegiate sports. The largest male sport is football, with an average of 94 players per year. Soccer was the largest female sport with an average of 25 players per year. There has been a slight decrease in males participating in sports teams from 314 in 2007‐2008 to 267 in 2008‐2009. There has also been a slight decline in the number of female athletes. In 2005‐2006, there was a total 158 female athletes while in 2008‐2009 it went down to 129. These declines are partially due to budgetary constraints.
2004-2005 2005-2006 2006-2007 2007-2008 2008-2009 Baseball 34 29 34 32 24
Basketball 18 14 18 17 11
Cross Country 17 12 15 13 12
Football 86 86 99 107 90
Soccer 31 38 34 32 28
Swimming 13 13 17 12 21
Tennis 10 8 8 11 7
Track & Field 32 23 28 44 38
Volleyball 26 27 25 36 16
Water Polo 14 11 11 10 20
0
20
40
60
80
100
120
Male Athletes by Sport
2004‐2005 2005‐2006 2006‐2007 2007‐2008 2008‐2009
20
2009 Annual Fact Book
16
2004-2005 2005-2006 2006-2007 2007-2008 2008-2009
Badminton 13 16 6 17 10
Basketball 14 17 14 14 13
Cross Country 15 13 14 13 6
Soccer 27 29 31 19 19
Softball 10 19 18 20 18
Swimming 11 12 6 7 15
Tennis 9 7 8 6 6
Track & Field 29 20 18 16 18
Volleyball 16 14 12 16 15
Water Polo 9 11 11 7 9
0
5
10
15
20
25
30
35
Female Athletes by Sport
2004‐2005
2005‐2006
2006‐2007
2007‐2008
2008‐2009
21
2009 Annual Fact Book
17
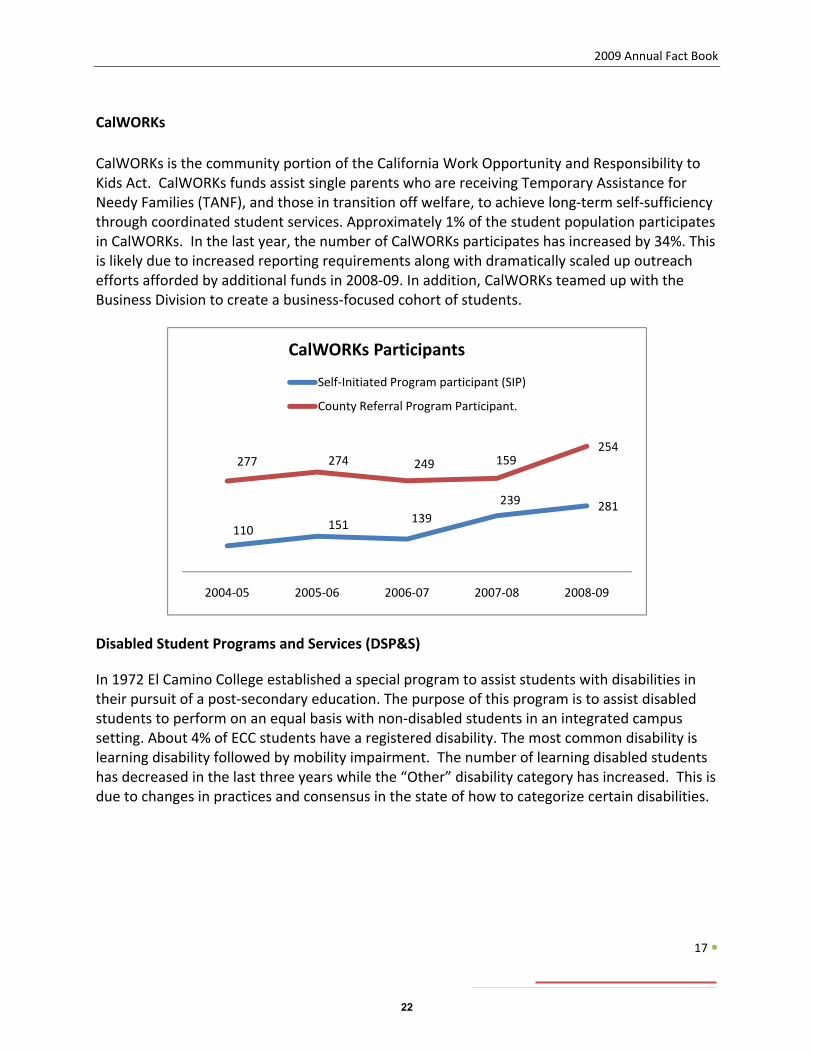
CalWORKs
CalWORKs is the community portion of the California Work Opportunity and Responsibility to Kids Act. CalWORKs funds assist single parents who are receiving Temporary Assistance for Needy Families (TANF), and those in transition off welfare, to achieve long‐term self‐sufficiency through coordinated student services. Approximately 1% of the student population participates in CalWORKs. In the last year, the number of CalWORKs participates has increased by 34%. This is likely due to increased reporting requirements along with dramatically scaled up outreach efforts afforded by additional funds in 2008‐09. In addition, CalWORKs teamed up with the Business Division to create a business‐focused cohort of students.
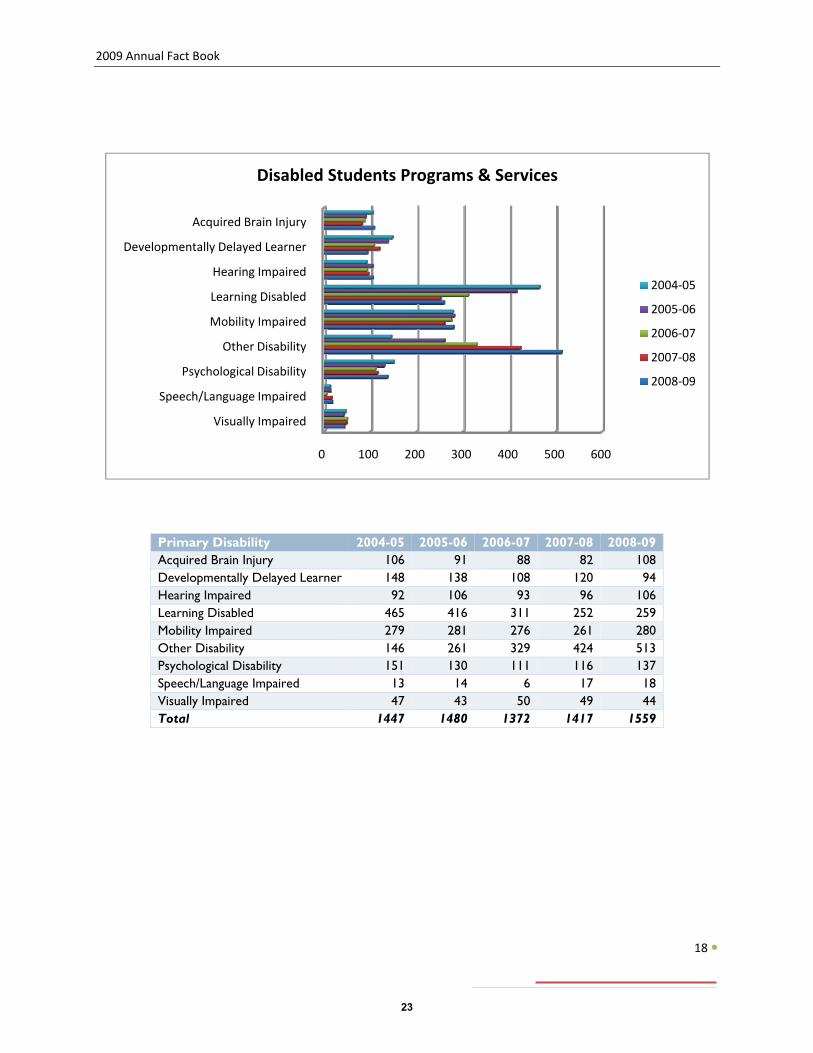
Disabled Student Programs and Services (DSP&S)
In 1972 El Camino College established a special program to assist students with disabilities in their pursuit of a post‐secondary education. The purpose of this program is to assist disabled students to perform on an equal basis with non‐disabled students in an integrated campus setting. About 4% of ECC students have a registered disability. The most common disability is learning disability followed by mobility impairment. The number of learning disabled students has decreased in the last three years while the “Other” disability category has increased. This is due to changes in practices and consensus in the state of how to categorize certain disabilities.
110 151 139239 281
277 274 249 159254
2004‐05 2005‐06 2006‐07 2007‐08 2008‐09
CalWORKs Participants
Self‐Initiated Program participant (SIP)
County Referral Program Participant.
22
2009 Annual Fact Book
18
Primary Disability 2004-05 2005-06 2006-07 2007-08 2008-09 Acquired Brain Injury 106 91 88 82 108 Developmentally Delayed Learner 148 138 108 120 94 Hearing Impaired 92 106 93 96 106 Learning Disabled 465 416 311 252 259 Mobility Impaired 279 281 276 261 280 Other Disability 146 261 329 424 513 Psychological Disability 151 130 111 116 137 Speech/Language Impaired 13 14 6 17 18 Visually Impaired 47 43 50 49 44 Total 1447 1480 1372 1417 1559
0 100 200 300 400 500 600
Visually Impaired
Speech/Language Impaired
Psychological Disability
Other Disability
Mobility Impaired
Learning Disabled
Hearing Impaired
Developmentally Delayed Learner
Acquired Brain Injury
Disabled Students Programs & Services
2004‐05
2005‐06
2006‐07
2007‐08
2008‐09
23
2009 Annual Fact Book
19
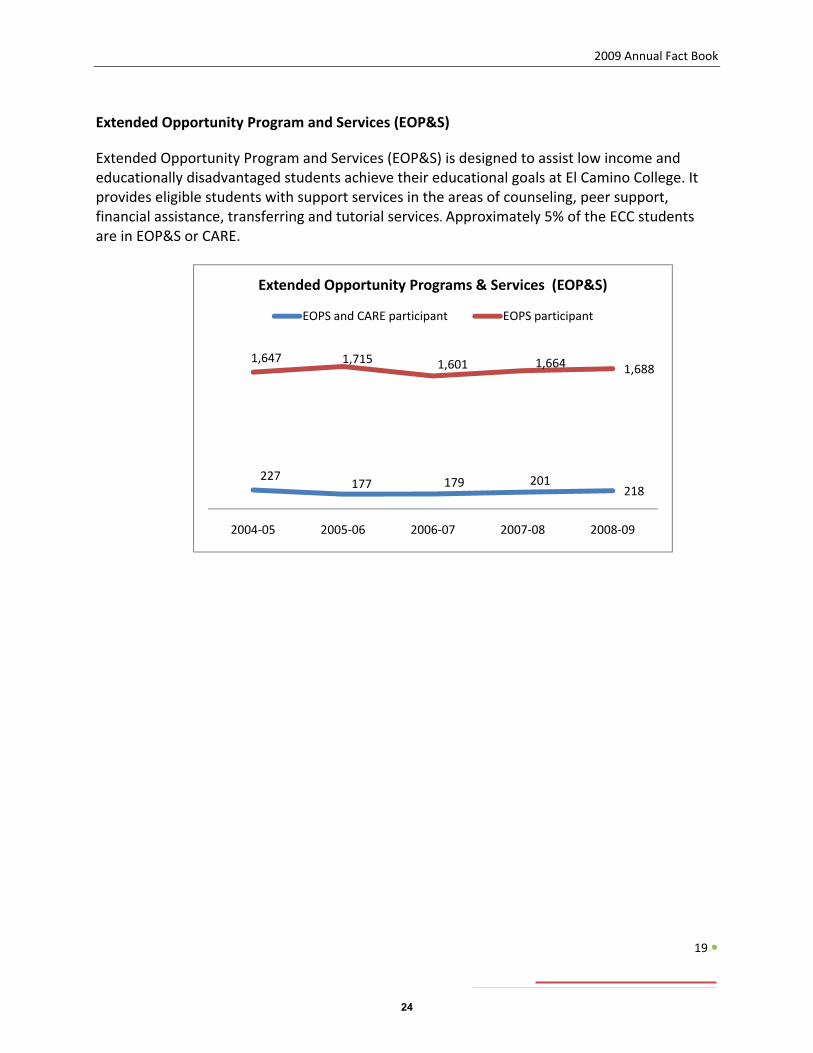
Extended Opportunity Program and Services (EOP&S)
Extended Opportunity Program and Services (EOP&S) is designed to assist low income and educationally disadvantaged students achieve their educational goals at El Camino College. It provides eligible students with support services in the areas of counseling, peer support, financial assistance, transferring and tutorial services. Approximately 5% of the ECC students are in EOP&S or CARE.
227177 179 201
218
1,647 1,715 1,601 1,664 1,688
2004‐05 2005‐06 2006‐07 2007‐08 2008‐09
Extended Opportunity Programs & Services (EOP&S)
EOPS and CARE participant EOPS participant
24
2009 Annual Fact Book
20
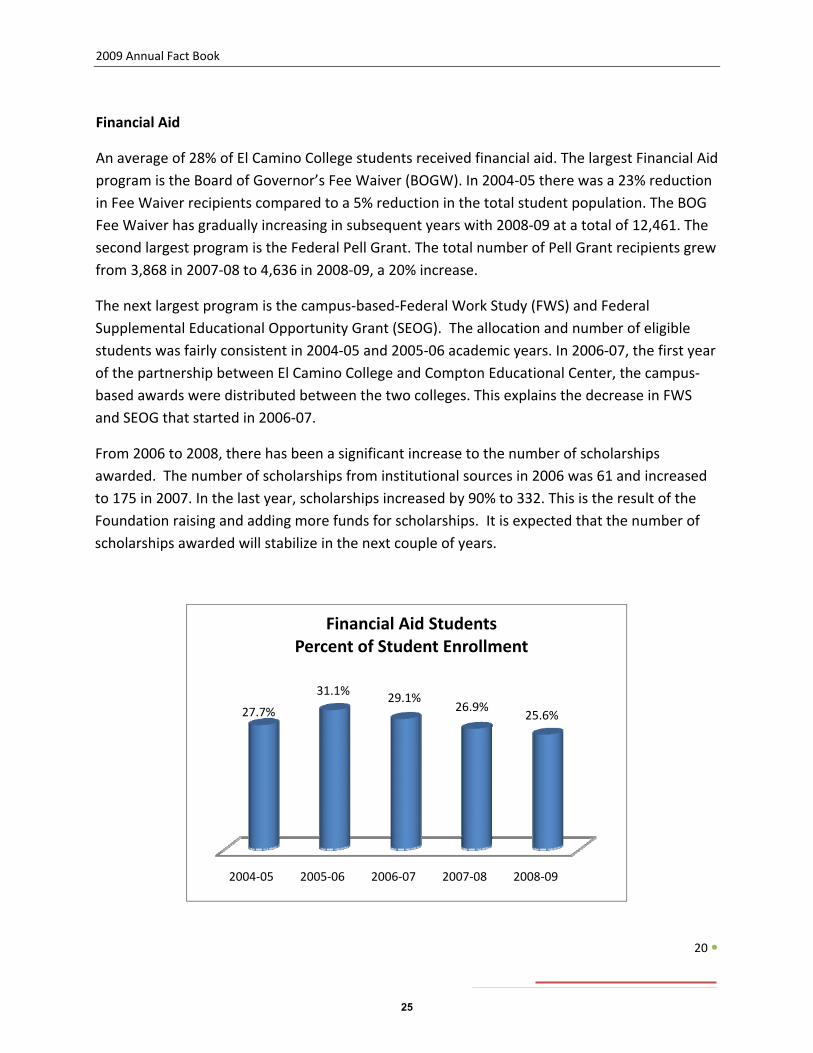
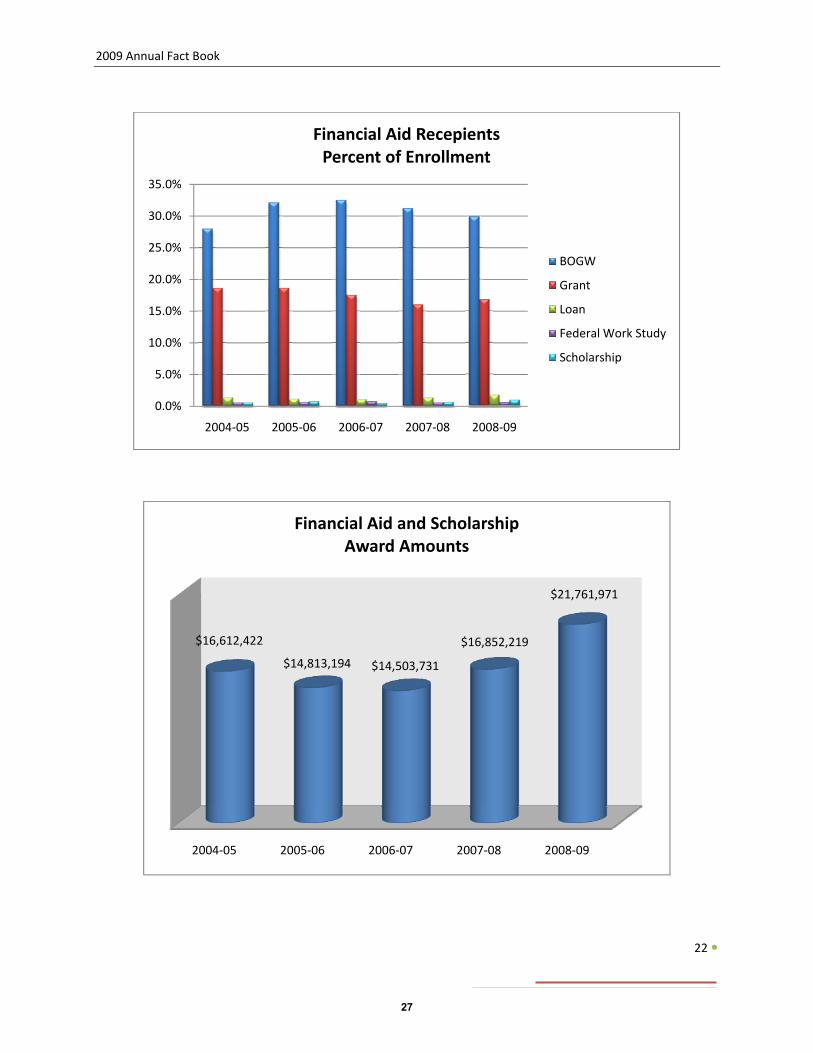
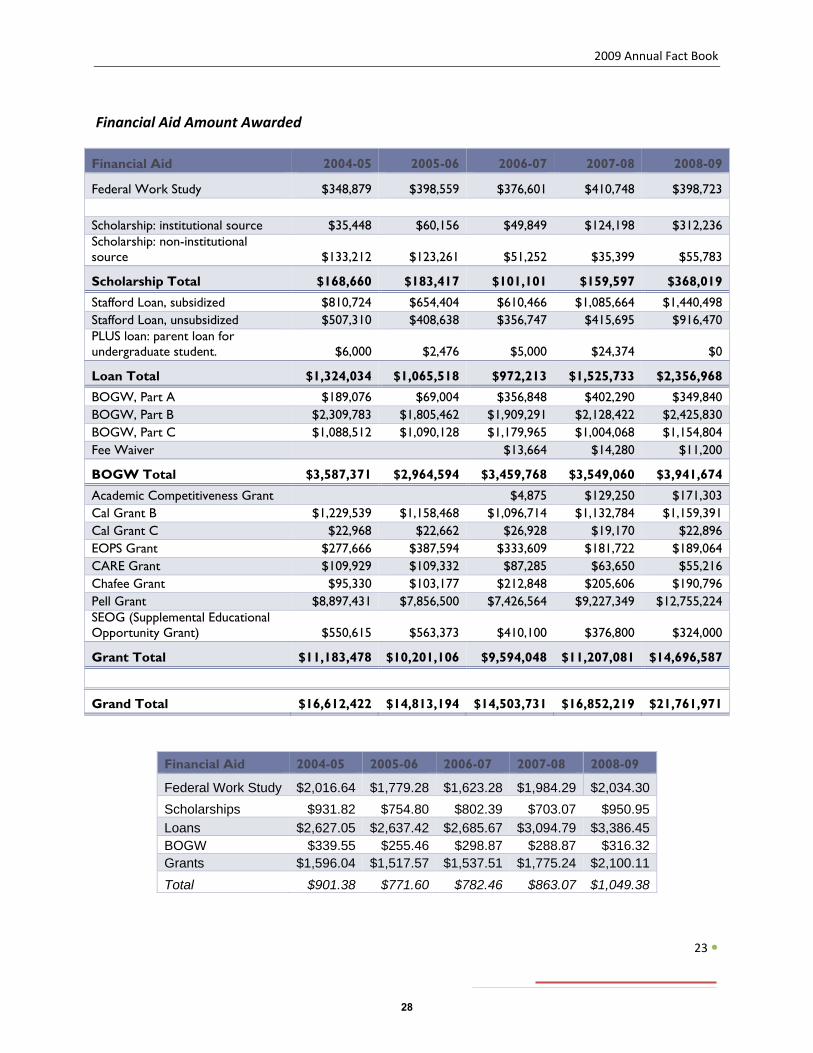
Financial Aid
An average of 28% of El Camino College students received financial aid. The largest Financial Aid program is the Board of Governor’s Fee Waiver (BOGW). In 2004‐05 there was a 23% reduction in Fee Waiver recipients compared to a 5% reduction in the total student population. The BOG Fee Waiver has gradually increasing in subsequent years with 2008‐09 at a total of 12,461. The second largest program is the Federal Pell Grant. The total number of Pell Grant recipients grew from 3,868 in 2007‐08 to 4,636 in 2008‐09, a 20% increase.
The next largest program is the campus‐based‐Federal Work Study (FWS) and Federal Supplemental Educational Opportunity Grant (SEOG). The allocation and number of eligible students was fairly consistent in 2004‐05 and 2005‐06 academic years. In 2006‐07, the first year of the partnership between El Camino College and Compton Educational Center, the campus‐based awards were distributed between the two colleges. This explains the decrease in FWS and SEOG that started in 2006‐07.
From 2006 to 2008, there has been a significant increase to the number of scholarships awarded. The number of scholarships from institutional sources in 2006 was 61 and increased to 175 in 2007. In the last year, scholarships increased by 90% to 332. This is the result of the Foundation raising and adding more funds for scholarships. It is expected that the number of scholarships awarded will stabilize in the next couple of years.
2004‐05 2005‐06 2006‐07 2007‐08 2008‐09
27.7%
31.1% 29.1%26.9%
25.6%
Financial Aid Students Percent of Student Enrollment
25
2009 Annual Fact Book
21
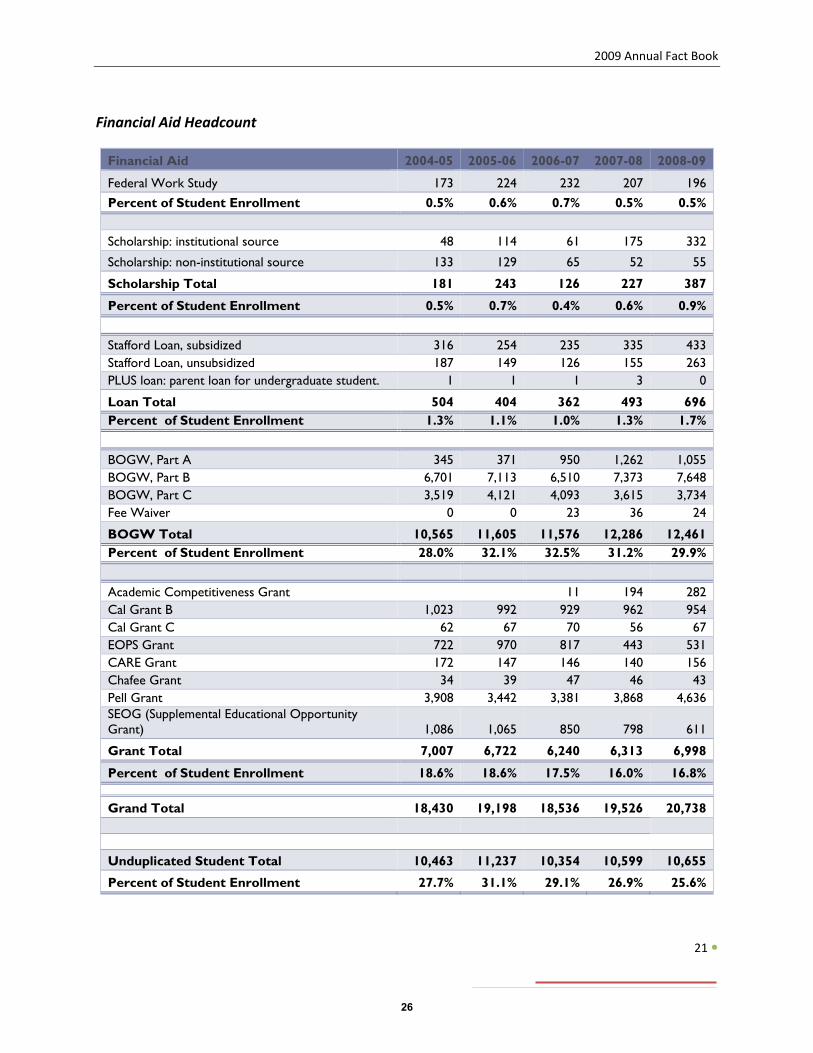
Financial Aid Headcount
Financial Aid 2004-05 2005-06 2006-07 2007-08 2008-09
Federal Work Study 173 224 232 207 196 Percent of Student Enrollment 0.5% 0.6% 0.7% 0.5% 0.5%
Scholarship: institutional source 48 114 61 175 332
Scholarship: non-institutional source 133 129 65 52 55
Scholarship Total 181 243 126 227 387
Percent of Student Enrollment 0.5% 0.7% 0.4% 0.6% 0.9% Stafford Loan, subsidized 316 254 235 335 433 Stafford Loan, unsubsidized 187 149 126 155 263 PLUS loan: parent loan for undergraduate student. 1 1 1 3 0
Loan Total 504 404 362 493 696 Percent of Student Enrollment 1.3% 1.1% 1.0% 1.3% 1.7%
BOGW, Part A 345 371 950 1,262 1,055 BOGW, Part B 6,701 7,113 6,510 7,373 7,648 BOGW, Part C 3,519 4,121 4,093 3,615 3,734 Fee Waiver 0 0 23 36 24
BOGW Total 10,565 11,605 11,576 12,286 12,461 Percent of Student Enrollment 28.0% 32.1% 32.5% 31.2% 29.9% Academic Competitiveness Grant 11 194 282 Cal Grant B 1,023 992 929 962 954 Cal Grant C 62 67 70 56 67 EOPS Grant 722 970 817 443 531 CARE Grant 172 147 146 140 156 Chafee Grant 34 39 47 46 43 Pell Grant 3,908 3,442 3,381 3,868 4,636 SEOG (Supplemental Educational Opportunity Grant) 1,086 1,065 850 798 611
Grant Total 7,007 6,722 6,240 6,313 6,998
Percent of Student Enrollment 18.6% 18.6% 17.5% 16.0% 16.8%
Grand Total 18,430 19,198 18,536 19,526 20,738 Unduplicated Student Total 10,463 11,237 10,354 10,599 10,655
Percent of Student Enrollment 27.7% 31.1% 29.1% 26.9% 25.6%
26
2009 Annual Fact Book
22
0.0%
5.0%
10.0%
15.0%
20.0%
25.0%
30.0%
35.0%
2004‐05 2005‐06 2006‐07 2007‐08 2008‐09
Financial Aid RecepientsPercent of Enrollment
BOGW
Grant
Loan
Federal Work Study
Scholarship
2004‐05 2005‐06 2006‐07 2007‐08 2008‐09
$16,612,422
$14,813,194 $14,503,731
$16,852,219
$21,761,971
Financial Aid and Scholarship Award Amounts
27
2009 Annual Fact Book
23
Financial Aid Amount Awarded
Financial Aid 2004-05 2005-06 2006-07 2007-08 2008-09
Federal Work Study $348,879 $398,559 $376,601 $410,748 $398,723
Scholarship: institutional source $35,448 $60,156 $49,849 $124,198 $312,236 Scholarship: non-institutional source $133,212 $123,261 $51,252 $35,399 $55,783
Scholarship Total $168,660 $183,417 $101,101 $159,597 $368,019
Stafford Loan, subsidized $810,724 $654,404 $610,466 $1,085,664 $1,440,498 Stafford Loan, unsubsidized $507,310 $408,638 $356,747 $415,695 $916,470 PLUS loan: parent loan for undergraduate student. $6,000 $2,476 $5,000 $24,374 $0
Loan Total $1,324,034 $1,065,518 $972,213 $1,525,733 $2,356,968 BOGW, Part A $189,076 $69,004 $356,848 $402,290 $349,840 BOGW, Part B $2,309,783 $1,805,462 $1,909,291 $2,128,422 $2,425,830 BOGW, Part C $1,088,512 $1,090,128 $1,179,965 $1,004,068 $1,154,804 Fee Waiver $13,664 $14,280 $11,200
BOGW Total $3,587,371 $2,964,594 $3,459,768 $3,549,060 $3,941,674
Academic Competitiveness Grant $4,875 $129,250 $171,303 Cal Grant B $1,229,539 $1,158,468 $1,096,714 $1,132,784 $1,159,391 Cal Grant C $22,968 $22,662 $26,928 $19,170 $22,896 EOPS Grant $277,666 $387,594 $333,609 $181,722 $189,064 CARE Grant $109,929 $109,332 $87,285 $63,650 $55,216 Chafee Grant $95,330 $103,177 $212,848 $205,606 $190,796 Pell Grant $8,897,431 $7,856,500 $7,426,564 $9,227,349 $12,755,224 SEOG (Supplemental Educational Opportunity Grant) $550,615 $563,373 $410,100 $376,800 $324,000
Grant Total $11,183,478 $10,201,106 $9,594,048 $11,207,081 $14,696,587
Grand Total $16,612,422 $14,813,194 $14,503,731 $16,852,219 $21,761,971
Financial Aid 2004-05 2005-06 2006-07 2007-08 2008-09
Federal Work Study $2,016.64 $1,779.28 $1,623.28 $1,984.29 $2,034.30 Scholarships $931.82 $754.80 $802.39 $703.07 $950.95 Loans $2,627.05 $2,637.42 $2,685.67 $3,094.79 $3,386.45 BOGW $339.55 $255.46 $298.87 $288.87 $316.32 Grants $1,596.04 $1,517.57 $1,537.51 $1,775.24 $2,100.11 Total $901.38 $771.60 $782.46 $863.07 $1,049.38
28
2009 Annual Fact Book
24
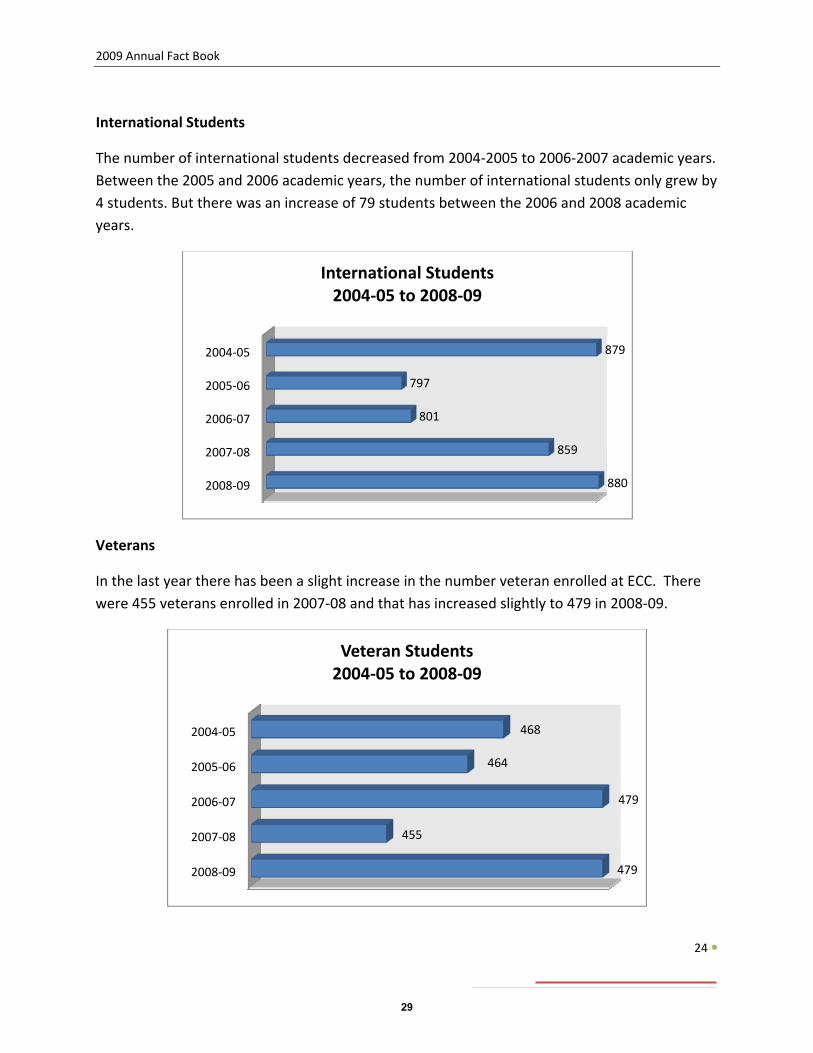
International Students
The number of international students decreased from 2004‐2005 to 2006‐2007 academic years. Between the 2005 and 2006 academic years, the number of international students only grew by 4 students. But there was an increase of 79 students between the 2006 and 2008 academic years.
Veterans
In the last year there has been a slight increase in the number veteran enrolled at ECC. There were 455 veterans enrolled in 2007‐08 and that has increased slightly to 479 in 2008‐09.
2008‐09
2007‐08
2006‐07
2005‐06
2004‐05
880
859
801
797
879
International Students2004‐05 to 2008‐09
2008‐09
2007‐08
2006‐07
2005‐06
2004‐05
479
455
479
464
468
Veteran Students2004‐05 to 2008‐09
29
2009 Annual Fact Book
25
Section 4 – Success and Retention
30
2009 Annual Fact Book
26
Overall Success and Retention
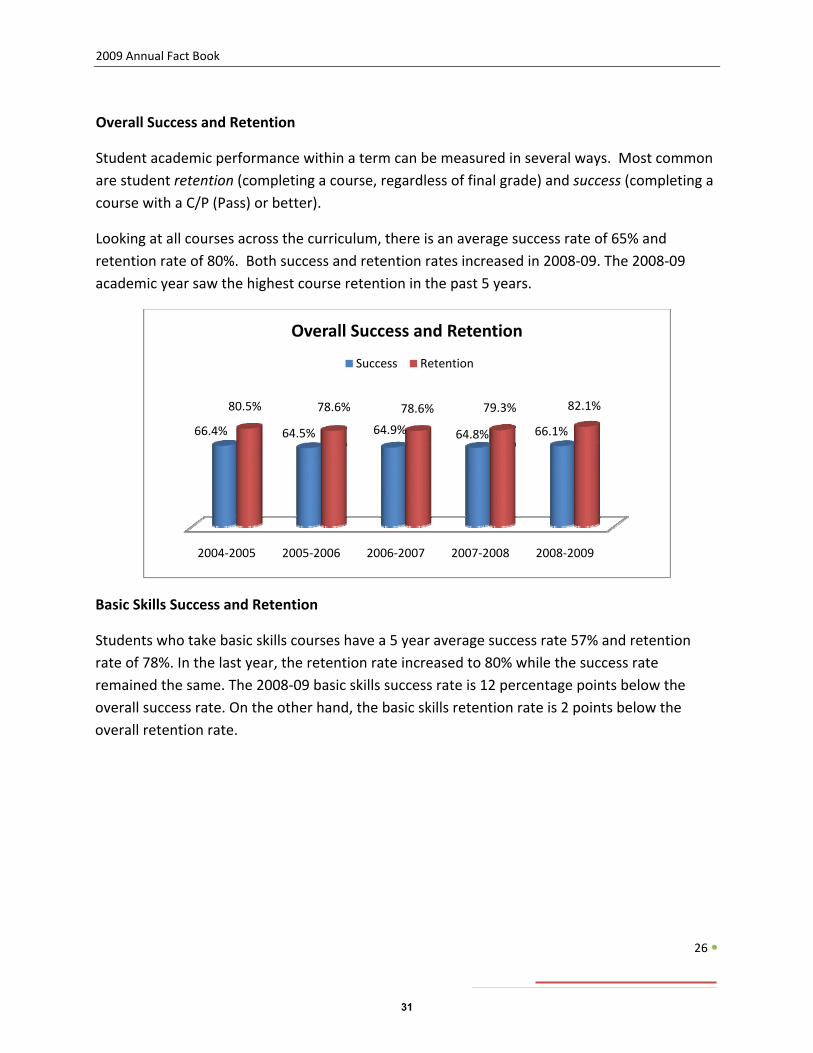
Student academic performance within a term can be measured in several ways. Most common are student retention (completing a course, regardless of final grade) and success (completing a course with a C/P (Pass) or better).
Looking at all courses across the curriculum, there is an average success rate of 65% and retention rate of 80%. Both success and retention rates increased in 2008‐09. The 2008‐09 academic year saw the highest course retention in the past 5 years.
Basic Skills Success and Retention
Students who take basic skills courses have a 5 year average success rate 57% and retention rate of 78%. In the last year, the retention rate increased to 80% while the success rate remained the same. The 2008‐09 basic skills success rate is 12 percentage points below the overall success rate. On the other hand, the basic skills retention rate is 2 points below the overall retention rate.
2004‐2005 2005‐2006 2006‐2007 2007‐2008 2008‐2009
66.4% 64.5% 64.9% 64.8% 66.1%
80.5% 78.6% 78.6% 79.3% 82.1%
Overall Success and Retention
Success Retention
31
2009 Annual Fact Book
27
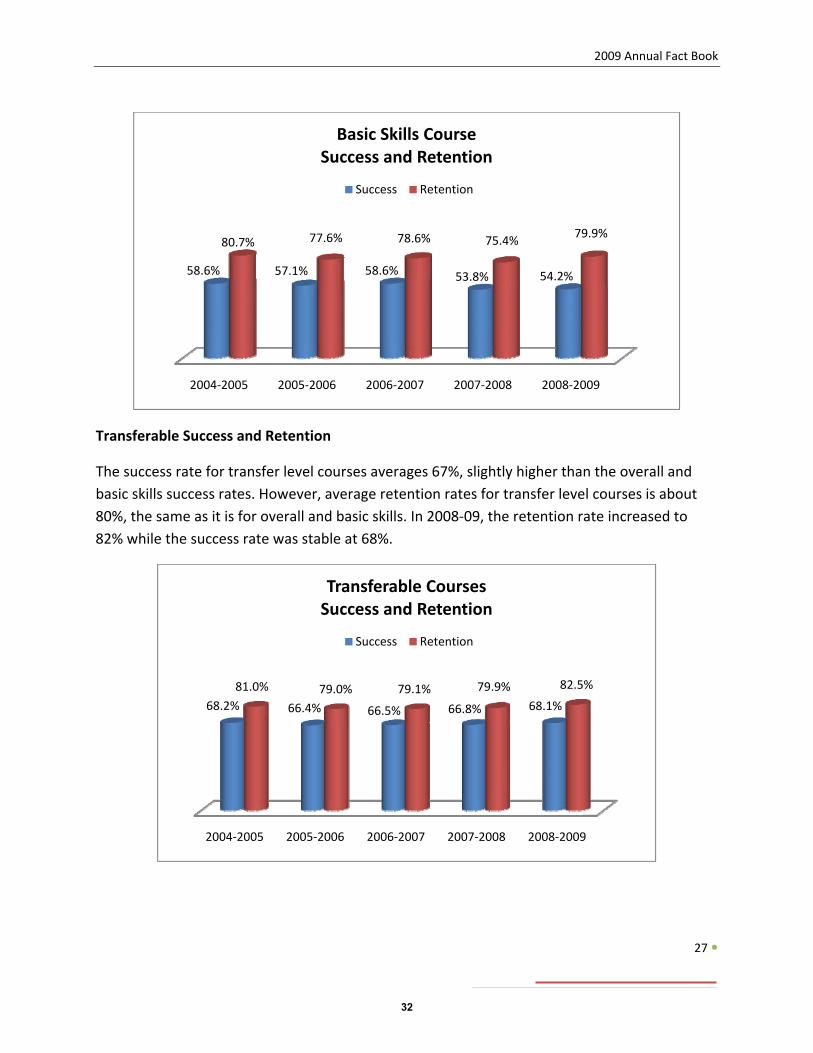
Transferable Success and Retention
The success rate for transfer level courses averages 67%, slightly higher than the overall and basic skills success rates. However, average retention rates for transfer level courses is about 80%, the same as it is for overall and basic skills. In 2008‐09, the retention rate increased to 82% while the success rate was stable at 68%.
2004‐2005 2005‐2006 2006‐2007 2007‐2008 2008‐2009
58.6% 57.1% 58.6% 53.8% 54.2%
80.7% 77.6% 78.6% 75.4% 79.9%
Basic Skills CourseSuccess and Retention
Success Retention
2004‐2005 2005‐2006 2006‐2007 2007‐2008 2008‐2009
68.2% 66.4% 66.5% 66.8% 68.1%
81.0% 79.0% 79.1% 79.9% 82.5%
Transferable CoursesSuccess and Retention
Success Retention
32
2009 Annual Fact Book
28
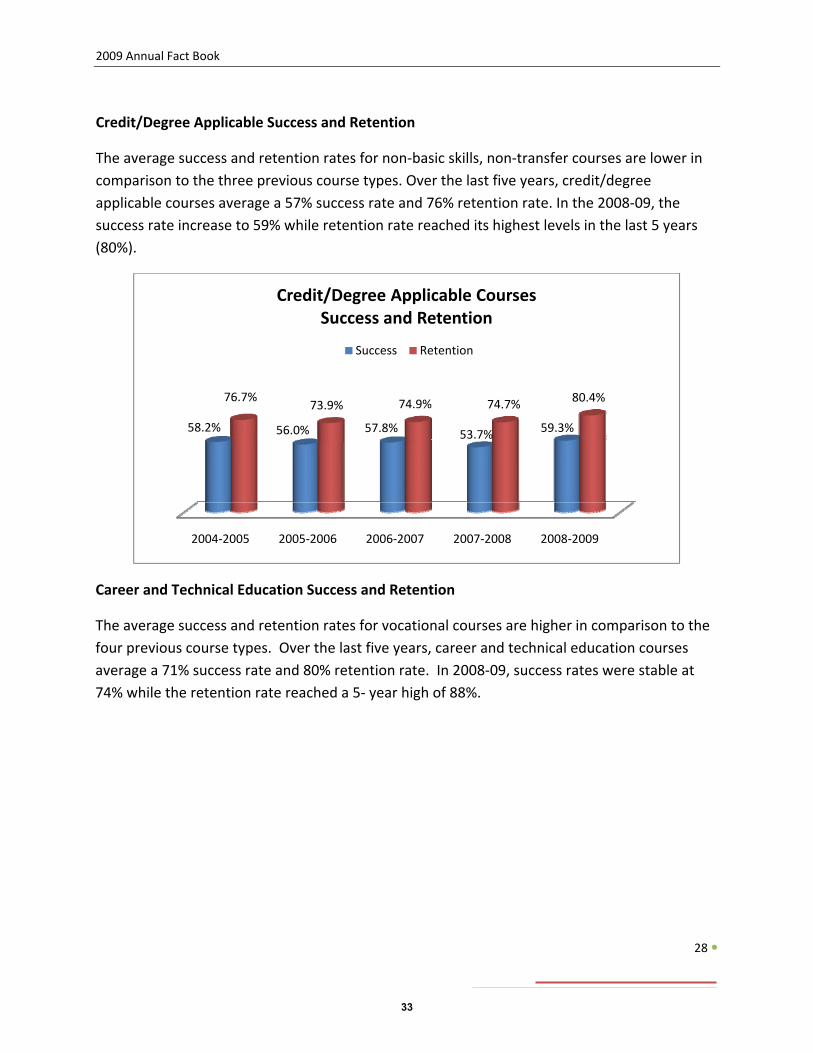
Credit/Degree Applicable Success and Retention
The average success and retention rates for non‐basic skills, non‐transfer courses are lower in comparison to the three previous course types. Over the last five years, credit/degree applicable courses average a 57% success rate and 76% retention rate. In the 2008‐09, the success rate increase to 59% while retention rate reached its highest levels in the last 5 years (80%).
Career and Technical Education Success and Retention
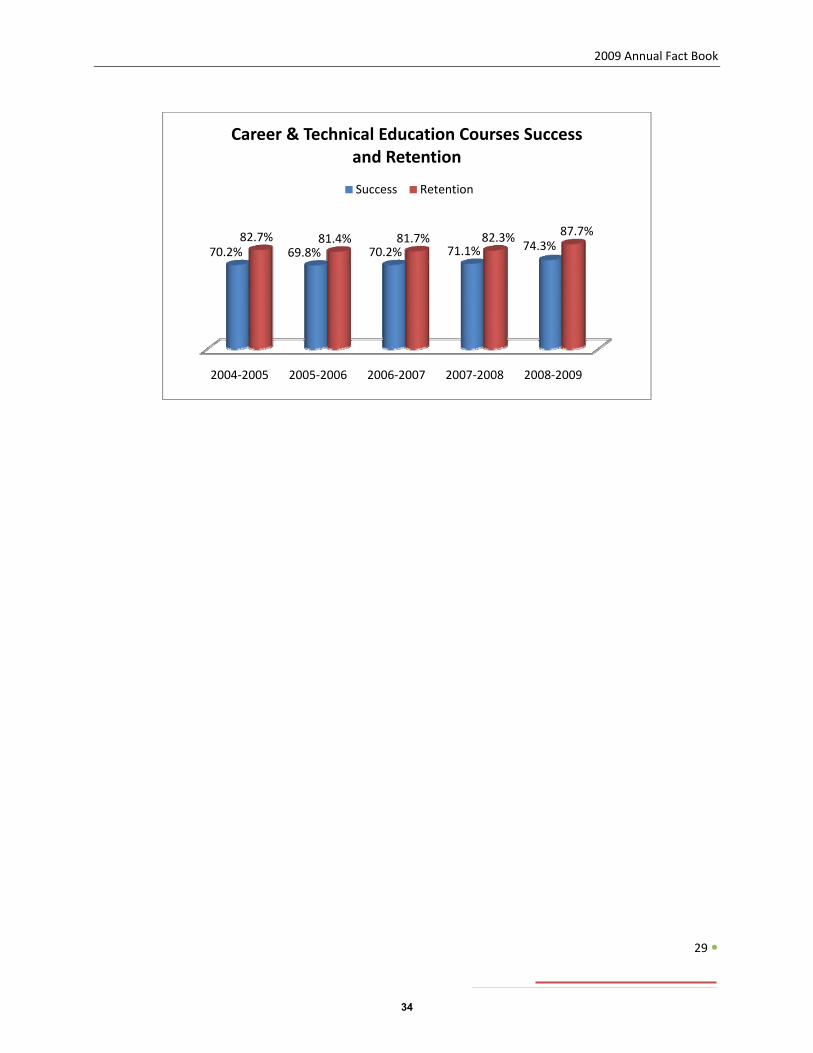
The average success and retention rates for vocational courses are higher in comparison to the four previous course types. Over the last five years, career and technical education courses average a 71% success rate and 80% retention rate. In 2008‐09, success rates were stable at 74% while the retention rate reached a 5‐ year high of 88%.
2004‐2005 2005‐2006 2006‐2007 2007‐2008 2008‐2009
58.2% 56.0% 57.8% 53.7% 59.3%
76.7%73.9% 74.9% 74.7% 80.4%
Credit/Degree Applicable CoursesSuccess and Retention
Success Retention
33
2009 Annual Fact Book
29
2004‐2005 2005‐2006 2006‐2007 2007‐2008 2008‐2009
70.2% 69.8% 70.2% 71.1% 74.3%82.7% 81.4% 81.7% 82.3% 87.7%
Career & Technical Education Courses Success and Retention
Success Retention
34
2009 Annual Fact Book
30
Section 5 – Student Outcomes
35
2009 Annual Fact Book
31
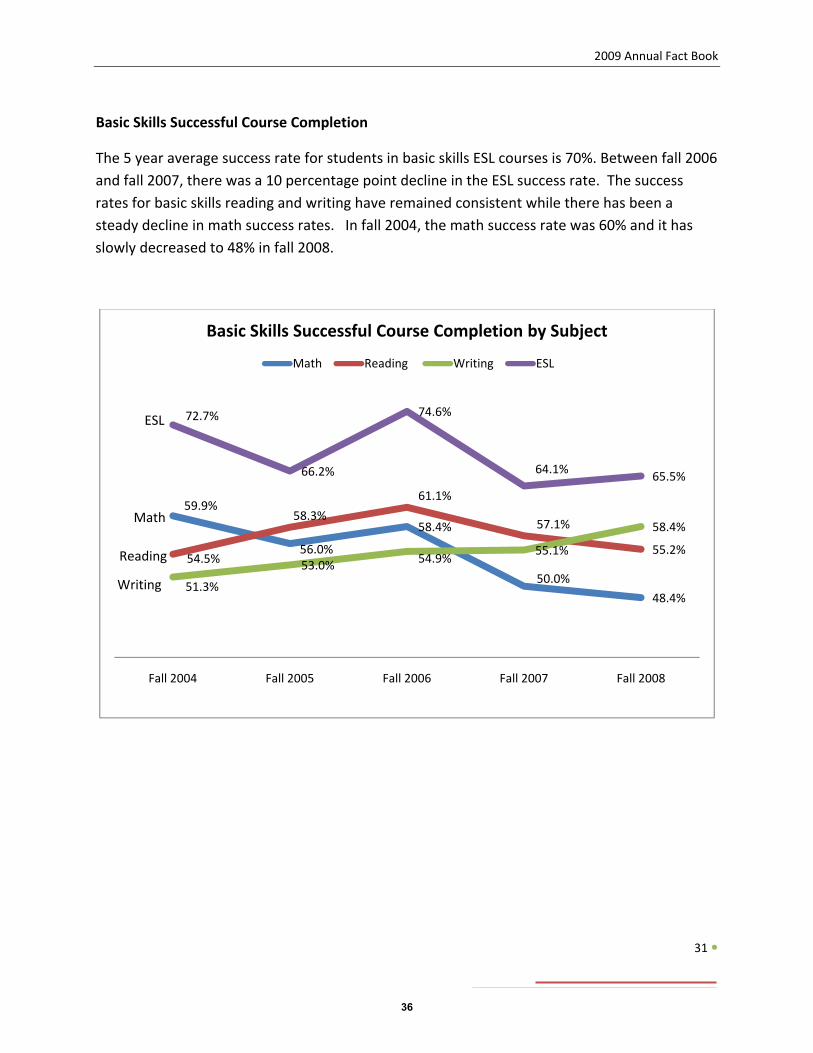
Basic Skills Successful Course Completion
The 5 year average success rate for students in basic skills ESL courses is 70%. Between fall 2006 and fall 2007, there was a 10 percentage point decline in the ESL success rate. The success rates for basic skills reading and writing have remained consistent while there has been a steady decline in math success rates. In fall 2004, the math success rate was 60% and it has slowly decreased to 48% in fall 2008.
59.9%
56.0%
58.4%
50.0%
48.4%
54.5%
58.3%
61.1%
57.1%
55.2%
51.3%
53.0% 54.9%55.1%
58.4%
72.7%
66.2%
74.6%
64.1% 65.5%
Fall 2004 Fall 2005 Fall 2006 Fall 2007 Fall 2008
Basic Skills Successful Course Completion by Subject
Math Reading Writing ESL
ESL
Math
Reading
Writing
36
2009 Annual Fact Book
32
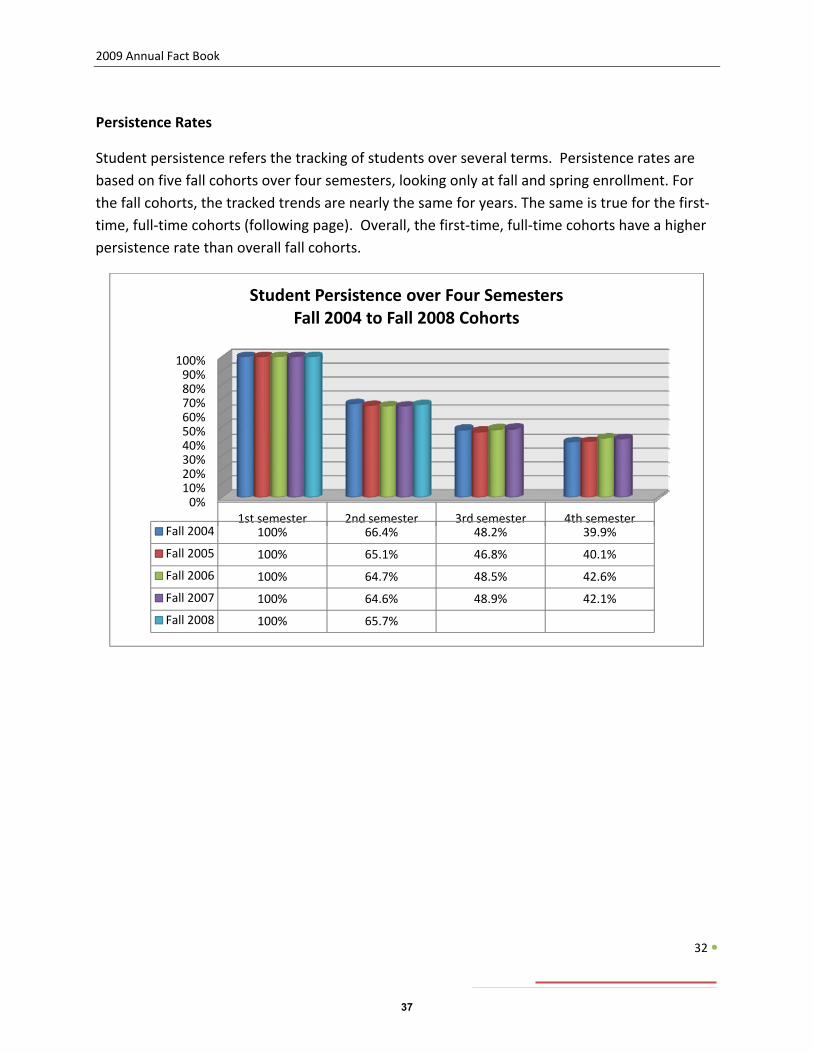
Persistence Rates
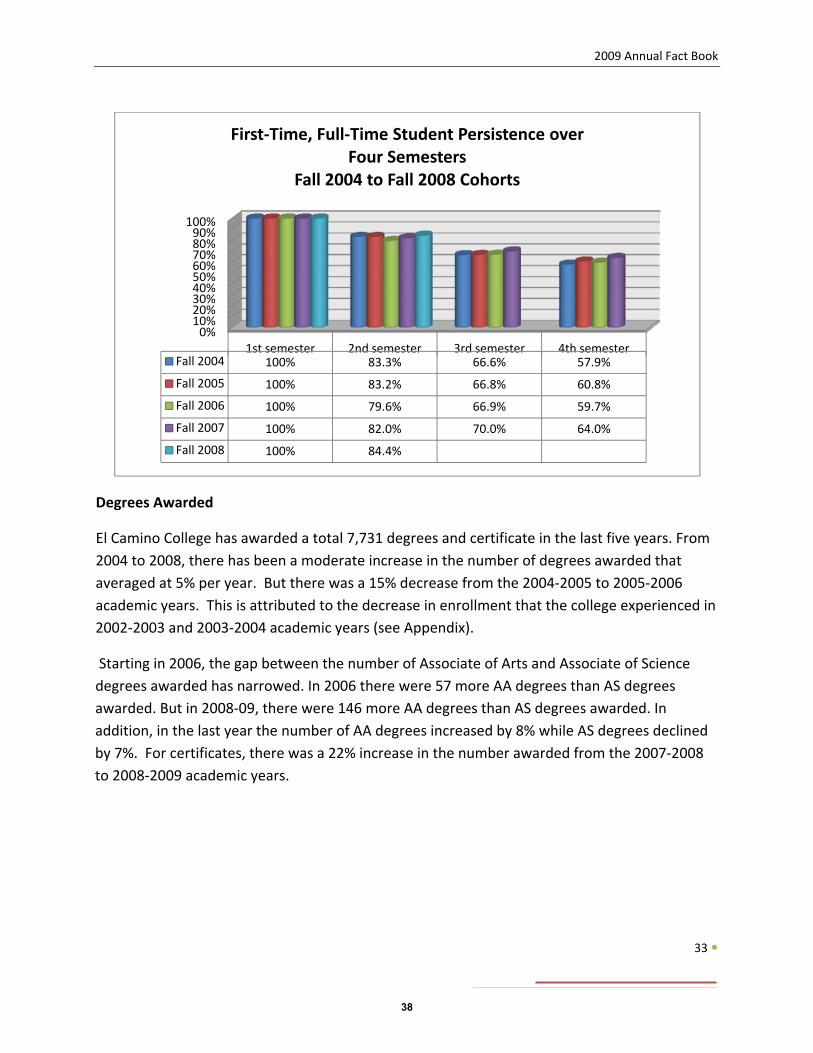
Student persistence refers the tracking of students over several terms. Persistence rates are based on five fall cohorts over four semesters, looking only at fall and spring enrollment. For the fall cohorts, the tracked trends are nearly the same for years. The same is true for the first‐ time, full‐time cohorts (following page). Overall, the first‐time, full‐time cohorts have a higher persistence rate than overall fall cohorts.
0%10%20%30%40%50%60%70%80%90%100%
1st semester 2nd semester 3rd semester 4th semesterFall 2004 100% 66.4% 48.2% 39.9%
Fall 2005 100% 65.1% 46.8% 40.1%
Fall 2006 100% 64.7% 48.5% 42.6%
Fall 2007 100% 64.6% 48.9% 42.1%
Fall 2008 100% 65.7%
Student Persistence over Four Semesters Fall 2004 to Fall 2008 Cohorts
37
2009 Annual Fact Book
33
Degrees Awarded
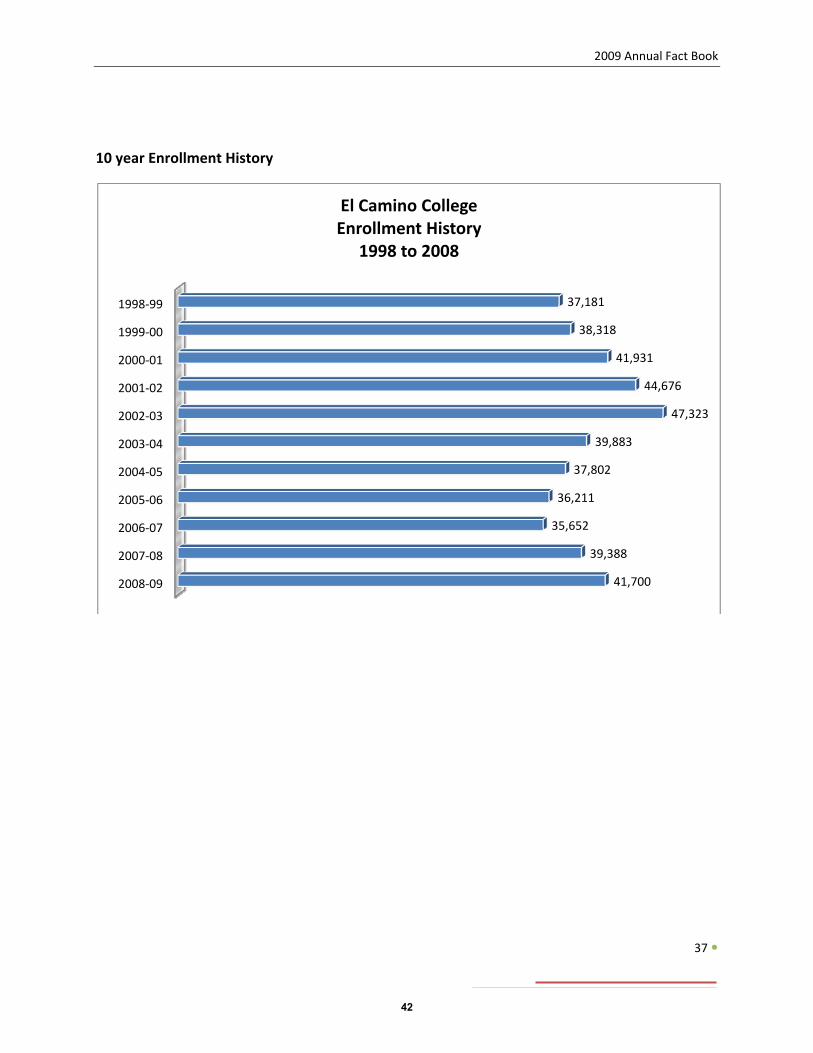
El Camino College has awarded a total 7,731 degrees and certificate in the last five years. From 2004 to 2008, there has been a moderate increase in the number of degrees awarded that averaged at 5% per year. But there was a 15% decrease from the 2004‐2005 to 2005‐2006 academic years. This is attributed to the decrease in enrollment that the college experienced in 2002‐2003 and 2003‐2004 academic years (see Appendix).
Starting in 2006, the gap between the number of Associate of Arts and Associate of Science degrees awarded has narrowed. In 2006 there were 57 more AA degrees than AS degrees awarded. But in 2008‐09, there were 146 more AA degrees than AS degrees awarded. In addition, in the last year the number of AA degrees increased by 8% while AS degrees declined by 7%. For certificates, there was a 22% increase in the number awarded from the 2007‐2008 to 2008‐2009 academic years.
0%10%20%30%40%50%60%70%80%90%
100%
1st semester 2nd semester 3rd semester 4th semesterFall 2004 100% 83.3% 66.6% 57.9%
Fall 2005 100% 83.2% 66.8% 60.8%
Fall 2006 100% 79.6% 66.9% 59.7%
Fall 2007 100% 82.0% 70.0% 64.0%
Fall 2008 100% 84.4%
First‐Time, Full‐Time Student Persistence over Four Semesters
Fall 2004 to Fall 2008 Cohorts
38
2009 Annual Fact Book
34
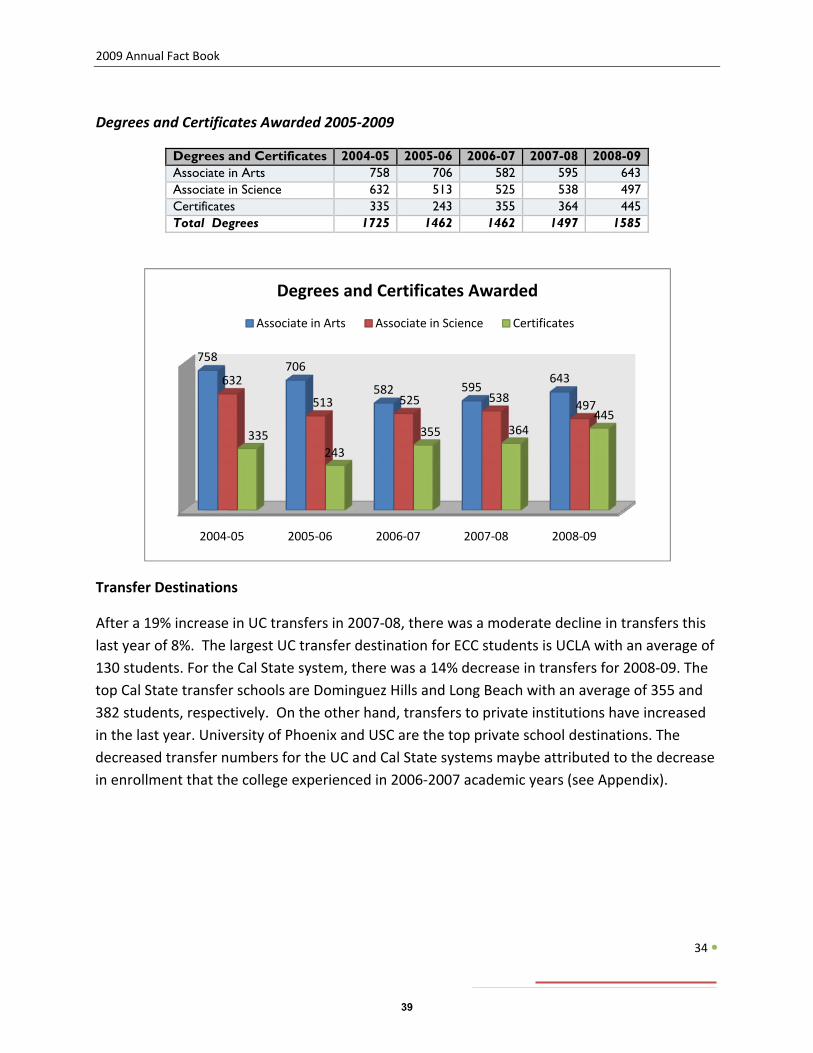
Degrees and Certificates Awarded 2005‐2009
Degrees and Certificates 2004-05 2005-06 2006-07 2007-08 2008-09 Associate in Arts 758 706 582 595 643 Associate in Science 632 513 525 538 497 Certificates 335 243 355 364 445 Total Degrees 1725 1462 1462 1497 1585
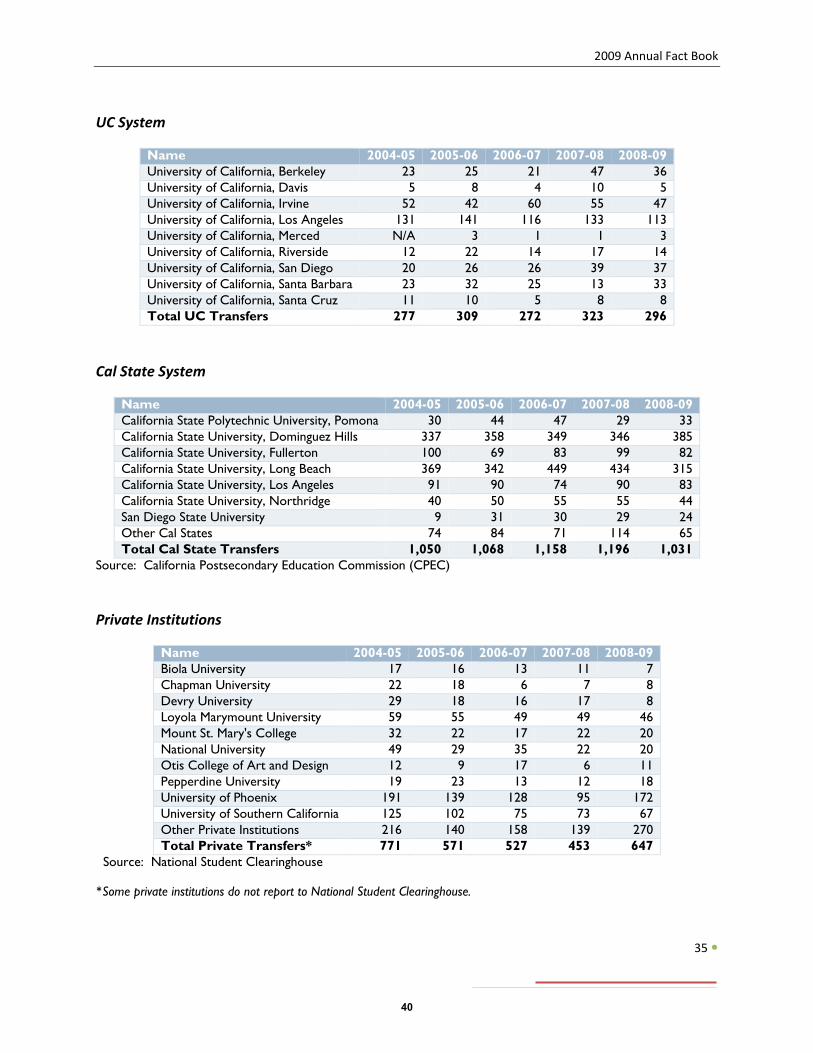
Transfer Destinations
After a 19% increase in UC transfers in 2007‐08, there was a moderate decline in transfers this last year of 8%. The largest UC transfer destination for ECC students is UCLA with an average of 130 students. For the Cal State system, there was a 14% decrease in transfers for 2008‐09. The top Cal State transfer schools are Dominguez Hills and Long Beach with an average of 355 and 382 students, respectively. On the other hand, transfers to private institutions have increased in the last year. University of Phoenix and USC are the top private school destinations. The decreased transfer numbers for the UC and Cal State systems maybe attributed to the decrease in enrollment that the college experienced in 2006‐2007 academic years (see Appendix).
2004‐05 2005‐06 2006‐07 2007‐08 2008‐09
758706
582 595643632
513 525 538 497
335243
355 364445
Degrees and Certificates Awarded
Associate in Arts Associate in Science Certificates
39
2009 Annual Fact Book
35
UC System
Name 2004-05 2005-06 2006-07 2007-08 2008-09 University of California, Berkeley 23 25 21 47 36 University of California, Davis 5 8 4 10 5 University of California, Irvine 52 42 60 55 47 University of California, Los Angeles 131 141 116 133 113 University of California, Merced N/A 3 1 1 3 University of California, Riverside 12 22 14 17 14 University of California, San Diego 20 26 26 39 37 University of California, Santa Barbara 23 32 25 13 33 University of California, Santa Cruz 11 10 5 8 8 Total UC Transfers 277 309 272 323 296
Cal State System
Name 2004-05 2005-06 2006-07 2007-08 2008-09 California State Polytechnic University, Pomona 30 44 47 29 33 California State University, Dominguez Hills 337 358 349 346 385 California State University, Fullerton 100 69 83 99 82 California State University, Long Beach 369 342 449 434 315 California State University, Los Angeles 91 90 74 90 83 California State University, Northridge 40 50 55 55 44 San Diego State University 9 31 30 29 24 Other Cal States 74 84 71 114 65 Total Cal State Transfers 1,050 1,068 1,158 1,196 1,031
Source: California Postsecondary Education Commission (CPEC)
Private Institutions
Name 2004-05 2005-06 2006-07 2007-08 2008-09 Biola University 17 16 13 11 7 Chapman University 22 18 6 7 8 Devry University 29 18 16 17 8 Loyola Marymount University 59 55 49 49 46 Mount St. Mary's College 32 22 17 22 20 National University 49 29 35 22 20 Otis College of Art and Design 12 9 17 6 11 Pepperdine University 19 23 13 12 18 University of Phoenix 191 139 128 95 172 University of Southern California 125 102 75 73 67 Other Private Institutions 216 140 158 139 270 Total Private Transfers* 771 571 527 453 647
Source: National Student Clearinghouse
*Some private institutions do not report to National Student Clearinghouse.
40
2009 Annual Fact Book
36
Appendix
41
2009 Annual Fact Book
37
10 year Enrollment History
2008‐09
2007‐08
2006‐07
2005‐06
2004‐05
2003‐04
2002‐03
2001‐02
2000‐01
1999‐00
1998‐99
41,700
39,388
35,652
36,211
37,802
39,883
47,323
44,676
41,931
38,318
37,181
El Camino CollegeEnrollment History
1998 to 2008
42
ECC Institutional Research 1 1/22/2010
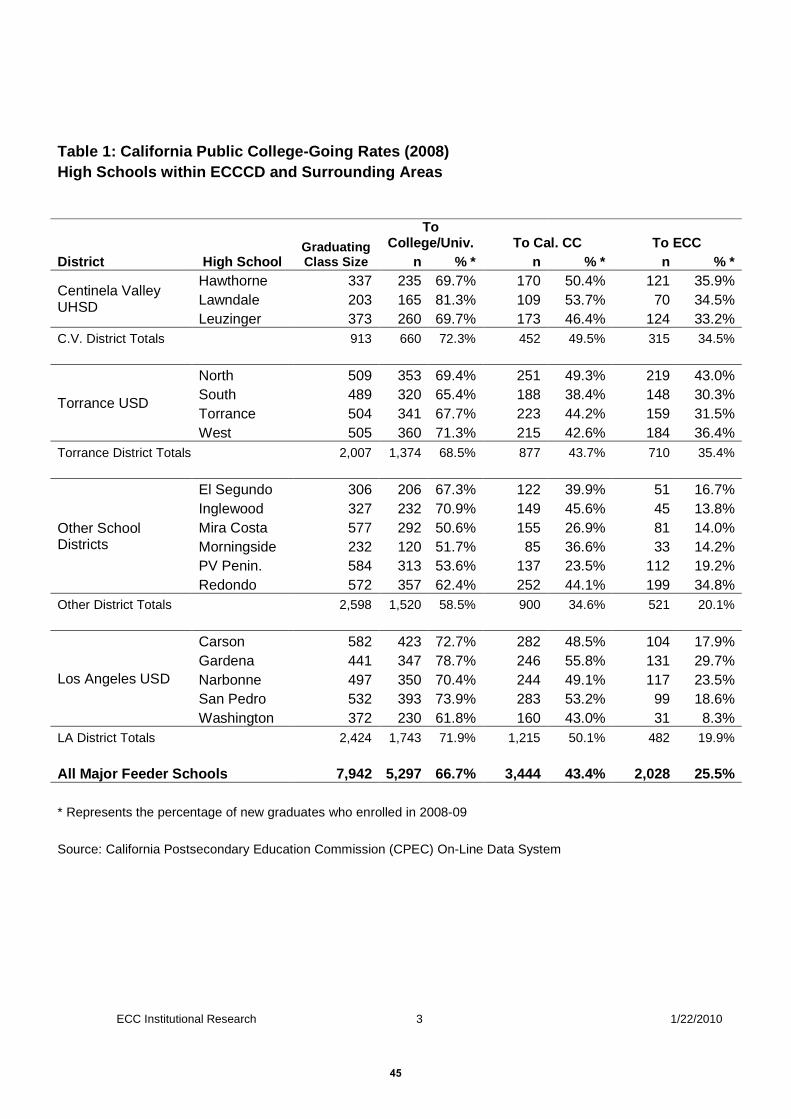
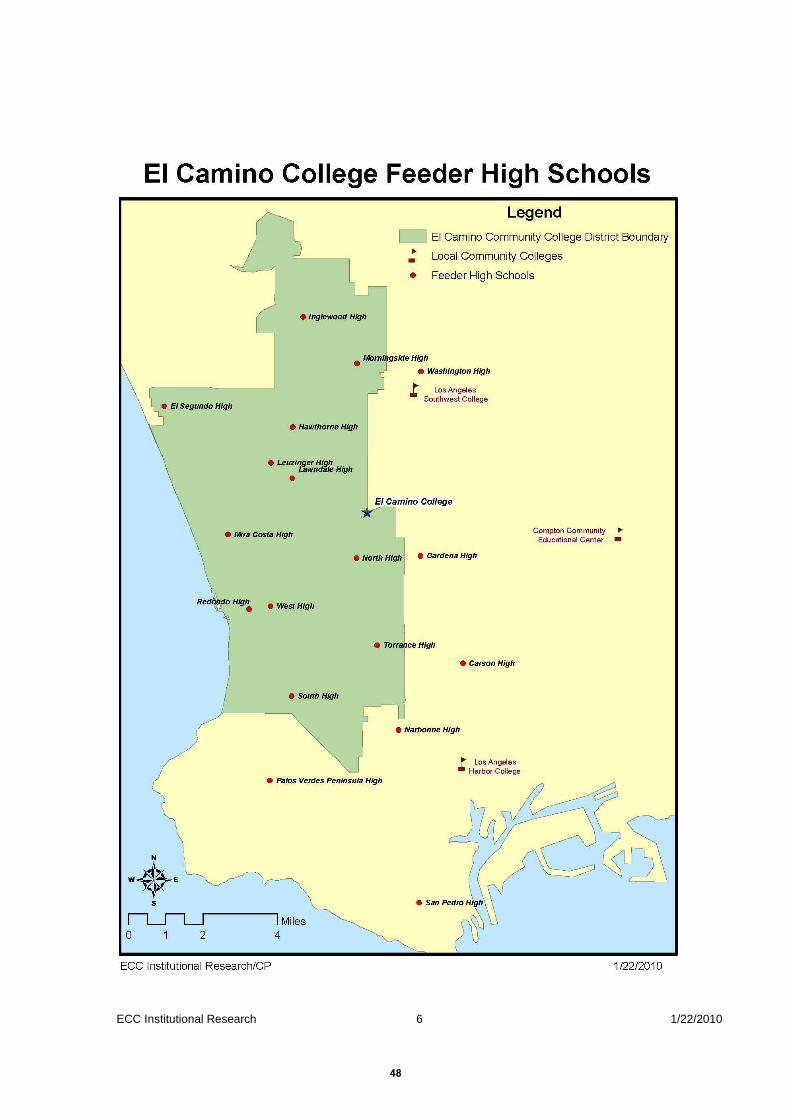
College-going Rates and Higher Education Destinations High Schools in the Vicinity of El Camino College 2008-09 Introduction The accompanying tables are produced annually to track higher education destinations for students from El Camino College’s local feeder high schools. The source of the data is the California Postsecondary Education Commission (CPEC). The tables in this report show the number of students who graduated in 2008 and enrolled at any California public college in the 2008-09 academic year. These data do not include out of state or private college or university enrollments; therefore, references to college or university attendance in this report refer only to those that are within the University of California (UC), California State University (CSU) and California Community College (CCC) systems. College-going Rates in 2008 Table 1 highlights California Public College-Going Rates and educational destinations for 18 high schools in the region, 13 of which are within the El Camino Community College District (ECCCD). Columns include spring 2008 graduating class size, and the number and percentage of each graduating class that attended a college or university, attended a community college, and attended El Camino College (ECC). Summary counts and percentages are provided for each school district or region. About 67% of students from feeder high schools attend a California public college or university. The highest enrollment rate was from Lawndale (81%), while the lowest was from Mira Costa (51%)—the latter likely due to a higher private school enrollment. Forty-three percent of graduating students attend community college. Gardena represents the highest enrollment rate (56%) while Palos Verdes Peninsula was the lowest (24%). The last column in table 1 represents the yield rate for ECC from each high school. Here, the average yield is 20%, with a high of 43% (North) and a low of 8% (Washington). High schools sending a higher than average percentage of graduating students also include Lawndale, Leuzinger, Torrance, West, Morningside, Redondo, Gardena and Narbonne. Higher Education Destinations in 2008 Table 2 provides the number of students by high school attending each college or university. Only community colleges and CSUs that consistently draw students from the region are included in the table; all UCs are included. System and grand totals are provided, with the top receiver shaded for each system. The
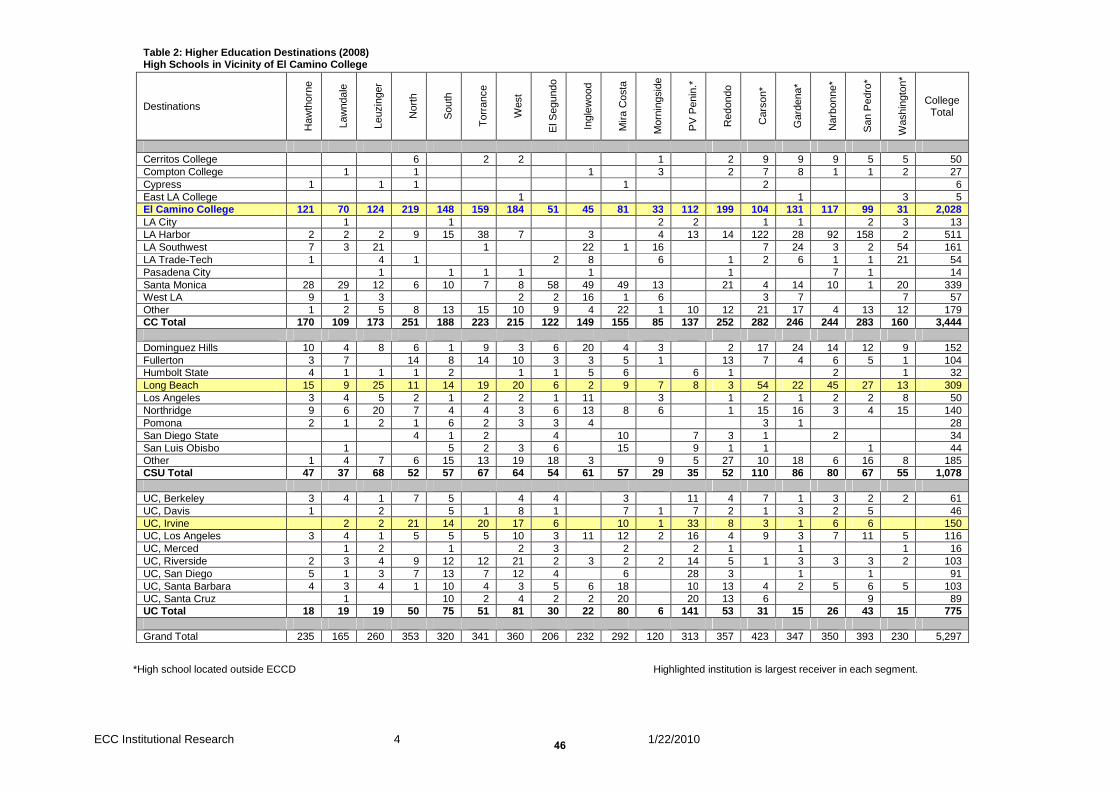
43
ECC Institutional Research 2 1/22/2010
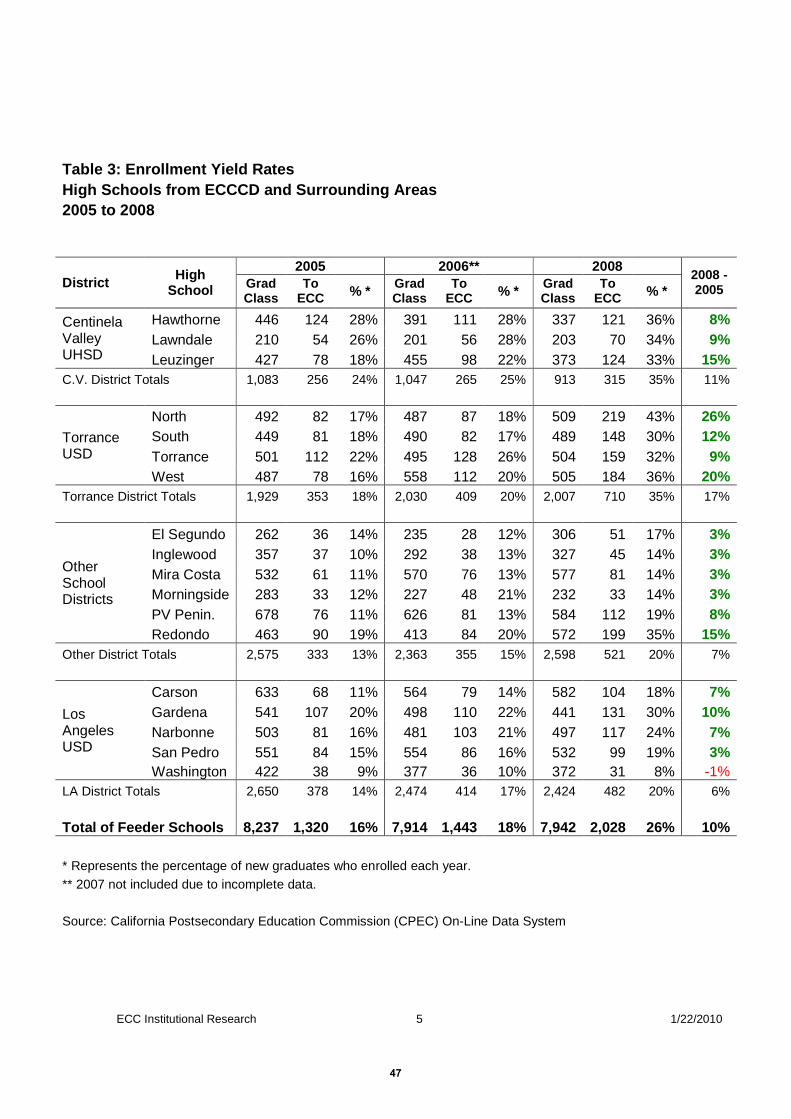
top receiver in the CSU and UC systems were Long Beach and Irvine, respectively. El Camino College was the top receiver overall for the region, as expected. Competition is more prominent, however, for a number of high schools. Students from Carson, Narbonne and San Pedro High Schools are drawn to LA Harbor College in large numbers. As shown in the map at the end of this report, these schools are closer to Harbor than to ECC. Students from Washington are more frequently attracted to LA Southwest College probably due to its very close proximity to the school. Finally, several schools are attracted to Santa Monica College (SMC) in considerable numbers despite the fact that ECC is closer in miles than SMC for most of these schools. These schools are Lawndale, El Segundo, Inglewood and Mira Costa. SMC in fact draws consistently more students annually from El Segundo, even though the school is within the district and 6 miles close to ECC. Trends in Enrollment Yield – 2005 to 2008 The final table (table 3) examines enrollment yield rates for 2005, 2006 and 2008 (2007 is not included due to incomplete data reported for that year). The last column (2008 - 2005) compares 2008 yields with 2005, a year with healthier enrollment. Overall yield from high schools in the region was 10 point higher in 2008 than 2005. Italicized figures highlight school-level declines in yield of 1 percentage point or greater, while bolded figures reflect gains in yield of 2 points or more. High schools that have experienced the largest gains since 2005 are Leuzinger, North, West, and Redondo. The only school that showed a decline in yield was Washington. Conclusion Overall, El Camino College experienced an increased high school enrollment yield in 2008, despite declines in total enrollment since 2005. Four area high schools experienced an increase in enrollment yield of 15% or more. ECC is the top draw for 13 out of the 18 area high schools.
44
ECC Institutional Research 3 1/22/2010
Table 1: California Public College-Going Rates (2008) High Schools within ECCCD and Surrounding Areas
District High School Graduating Class Size
To College/Univ. To Cal. CC To ECC
n % * n % * n % *
Centinela Valley UHSD
Hawthorne 337 235 69.7% 170 50.4% 121 35.9% Lawndale 203 165 81.3% 109 53.7% 70 34.5% Leuzinger 373 260 69.7% 173 46.4% 124 33.2%
C.V. District Totals 913 660 72.3% 452 49.5% 315 34.5%
Torrance USD
North 509 353 69.4% 251 49.3% 219 43.0% South 489 320 65.4% 188 38.4% 148 30.3% Torrance 504 341 67.7% 223 44.2% 159 31.5% West 505 360 71.3% 215 42.6% 184 36.4%
Torrance District Totals 2,007 1,374 68.5% 877 43.7% 710 35.4%
Other School Districts
El Segundo 306 206 67.3% 122 39.9% 51 16.7% Inglewood 327 232 70.9% 149 45.6% 45 13.8% Mira Costa 577 292 50.6% 155 26.9% 81 14.0% Morningside 232 120 51.7% 85 36.6% 33 14.2% PV Penin. 584 313 53.6% 137 23.5% 112 19.2% Redondo 572 357 62.4% 252 44.1% 199 34.8%
Other District Totals 2,598 1,520 58.5% 900 34.6% 521 20.1%
Los Angeles USD
Carson 582 423 72.7% 282 48.5% 104 17.9% Gardena 441 347 78.7% 246 55.8% 131 29.7% Narbonne 497 350 70.4% 244 49.1% 117 23.5% San Pedro 532 393 73.9% 283 53.2% 99 18.6% Washington 372 230 61.8% 160 43.0% 31 8.3%
LA District Totals 2,424 1,743 71.9% 1,215 50.1% 482 19.9%
All Major Feeder Schools 7,942 5,297 66.7% 3,444 43.4% 2,028 25.5%
* Represents the percentage of new graduates who enrolled in 2008-09
Source: California Postsecondary Education Commission (CPEC) On-Line Data System
45
ECC Institutional Research 4 1/22/2010
Table 2: Higher Education Destinations (2008) High Schools in Vicinity of El Camino College
Destinations
Haw
thor
ne
Law
ndal
e
Leuz
inge
r
Nor
th
Sou
th
Tor
ranc
e
Wes
t
El S
egun
do
Ingl
ewoo
d
Mira
Cos
ta
Mor
ning
side
PV
Pen
in.*
Red
ondo
Car
son*
Gar
dena
*
Nar
bonn
e*
San
Ped
ro*
Was
hing
ton*
College Total
Cerritos College 6 2 2 1 2 9 9 9 5 5 50 Compton College 1 1 1 3 2 7 8 1 1 2 27 Cypress 1 1 1 1 2 6 East LA College 1 1 3 5 El Camino College 121 70 124 219 148 159 184 51 45 81 33 112 199 104 131 117 99 31 2,028 LA City 1 1 2 2 1 1 2 3 13 LA Harbor 2 2 2 9 15 38 7 3 4 13 14 122 28 92 158 2 511 LA Southwest 7 3 21 1 22 1 16 7 24 3 2 54 161 LA Trade-Tech 1 4 1 2 8 6 1 2 6 1 1 21 54 Pasadena City 1 1 1 1 1 1 7 1 14 Santa Monica 28 29 12 6 10 7 8 58 49 49 13 21 4 14 10 1 20 339 West LA 9 1 3 2 2 16 1 6 3 7 7 57 Other 1 2 5 8 13 15 10 9 4 22 1 10 12 21 17 4 13 12 179 CC Total 170 109 173 251 188 223 215 122 149 155 85 137 252 282 246 244 283 160 3,444
Dominguez Hills 10 4 8 6 1 9 3 6 20 4 3 2 17 24 14 12 9 152 Fullerton 3 7 14 8 14 10 3 3 5 1 13 7 4 6 5 1 104 Humbolt State 4 1 1 1 2 1 1 5 6 6 1 2 1 32 Long Beach 15 9 25 11 14 19 20 6 2 9 7 8 3 54 22 45 27 13 309 Los Angeles 3 4 5 2 1 2 2 1 11 3 1 2 1 2 2 8 50 Northridge 9 6 20 7 4 4 3 6 13 8 6 1 15 16 3 4 15 140 Pomona 2 1 2 1 6 2 3 3 4 3 1 28 San Diego State 4 1 2 4 10 7 3 1 2 34 San Luis Obisbo 1 5 2 3 6 15 9 1 1 1 44 Other 1 4 7 6 15 13 19 18 3 9 5 27 10 18 6 16 8 185
CSU Total 47 37 68 52 57 67 64 54 61 57 29 35 52 110 86 80 67 55 1,078 UC, Berkeley 3 4 1 7 5 4 4 3 11 4 7 1 3 2 2 61 UC, Davis 1 2 5 1 8 1 7 1 7 2 1 3 2 5 46 UC, Irvine 2 2 21 14 20 17 6 10 1 33 8 3 1 6 6 150 UC, Los Angeles 3 4 1 5 5 5 10 3 11 12 2 16 4 9 3 7 11 5 116 UC, Merced 1 2 1 2 3 2 2 1 1 1 16 UC, Riverside 2 3 4 9 12 12 21 2 3 2 2 14 5 1 3 3 3 2 103 UC, San Diego 5 1 3 7 13 7 12 4 6 28 3 1 1 91 UC, Santa Barbara 4 3 4 1 10 4 3 5 6 18 10 13 4 2 5 6 5 103
UC, Santa Cruz 1 10 2 4 2 2 20 20 13 6 9 89 UC Total 18 19 19 50 75 51 81 30 22 80 6 141 53 31 15 26 43 15 775 Grand Total 235 165 260 353 320 341 360 206 232 292 120 313 357 423 347 350 393 230 5,297
*High school located outside ECCD Highlighted institution is largest receiver in each segment.
46
ECC Institutional Research 5 1/22/2010
Table 3: Enrollment Yield Rates High Schools from ECCCD and Surrounding Areas 2005 to 2008
District High School
2005 2006** 2008 2008 - 2005 Grad
Class To
ECC % * Grad Class
To ECC % * Grad
Class To
ECC % *
Centinela Valley UHSD
Hawthorne 446 124 28% 391 111 28% 337 121 36% 8% Lawndale 210 54 26% 201 56 28% 203 70 34% 9% Leuzinger 427 78 18% 455 98 22% 373 124 33% 15%
C.V. District Totals 1,083 256 24% 1,047 265 25% 913 315 35% 11%
Torrance USD
North 492 82 17% 487 87 18% 509 219 43% 26% South 449 81 18% 490 82 17% 489 148 30% 12% Torrance 501 112 22% 495 128 26% 504 159 32% 9% West 487 78 16% 558 112 20% 505 184 36% 20%
Torrance District Totals 1,929 353 18% 2,030 409 20% 2,007 710 35% 17%
Other School Districts
El Segundo 262 36 14% 235 28 12% 306 51 17% 3% Inglewood 357 37 10% 292 38 13% 327 45 14% 3% Mira Costa 532 61 11% 570 76 13% 577 81 14% 3% Morningside 283 33 12% 227 48 21% 232 33 14% 3% PV Penin. 678 76 11% 626 81 13% 584 112 19% 8% Redondo 463 90 19% 413 84 20% 572 199 35% 15%
Other District Totals 2,575 333 13% 2,363 355 15% 2,598 521 20% 7%
Los Angeles USD
Carson 633 68 11% 564 79 14% 582 104 18% 7% Gardena 541 107 20% 498 110 22% 441 131 30% 10% Narbonne 503 81 16% 481 103 21% 497 117 24% 7% San Pedro 551 84 15% 554 86 16% 532 99 19% 3% Washington 422 38 9% 377 36 10% 372 31 8% -1%
LA District Totals 2,650 378 14% 2,474 414 17% 2,424 482 20% 6%
Total of Feeder Schools 8,237 1,320 16% 7,914 1,443 18% 7,942 2,028 26% 10%
* Represents the percentage of new graduates who enrolled each year. ** 2007 not included due to incomplete data.
Source: California Postsecondary Education Commission (CPEC) On-Line Data System
47
ECC Institutional Research 6 1/22/2010
48
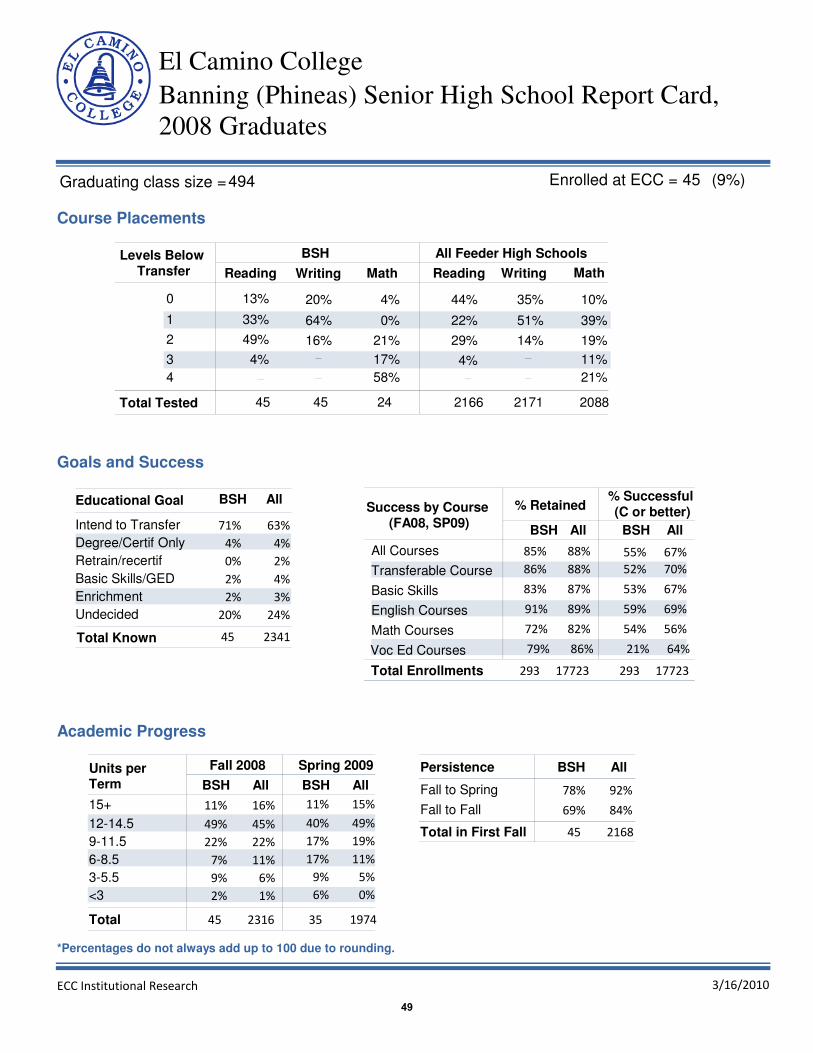
Banning (Phineas) Senior High School Report Card,
2008 Graduates
El Camino College
45Enrolled at ECC =
Course Placements
Levels Below
Transfer
0
1
2
3
4
BSH
Reading Writing Math Reading Writing Math
45 45 24
44%
22%
29%
4%
2166 2171 2088
35% 10%
51% 39%
14% 19%
11%
21%
All Feeder High Schools
Total Tested
Goals and Success
Educational Goal
Total Known 45
63%
4%
2%
4%
3%
24%
2341
Success by Course
(FA08, SP09)
% Retained% Successful
(C or better)
All All
All Courses 85% 55%
Transferable Course 52%86%
Basic Skills 83% 53%
English Courses 91% 59%
Math Courses 72% 54%
Voc Ed Courses 79% 21%
Academic Progress
Fall 2008 Spring 2009
All All
Units per
Term
Total
Persistence
Total in First Fall
Total Enrollments
88%
88%
87%
89%
82%
86%
67%
70%
67%
69%
56%
64%
293 17723 293 17723
2316 197445 35
45
BSH BSH
AllBSH
AllBSH
2168
BSH BSH
(9%)
13%
33%
49%
4%
20%
64%
16%
4%
0%
21%
17%
58%
Intend to Transfer 71%
Degree/Certif Only 4%
Retrain/recertif 0%
Basic Skills/GED 2%
Enrichment 2%
Undecided 20%
15+ 11%
12-14.5 49%
9-11.5 22%
6-8.5 7%
3-5.5 9%
<3 2%
16%
45%
22%
11%
6%
1%
11%
40%
17%
17%
9%
6%
15%
49%
19%
11%
5%
0%
Fall to Spring 78%
Fall to Fall 69%
92%
84%
494Graduating class size =
3/16/2010ECC Institutional Research
*Percentages do not always add up to 100 due to rounding.
49
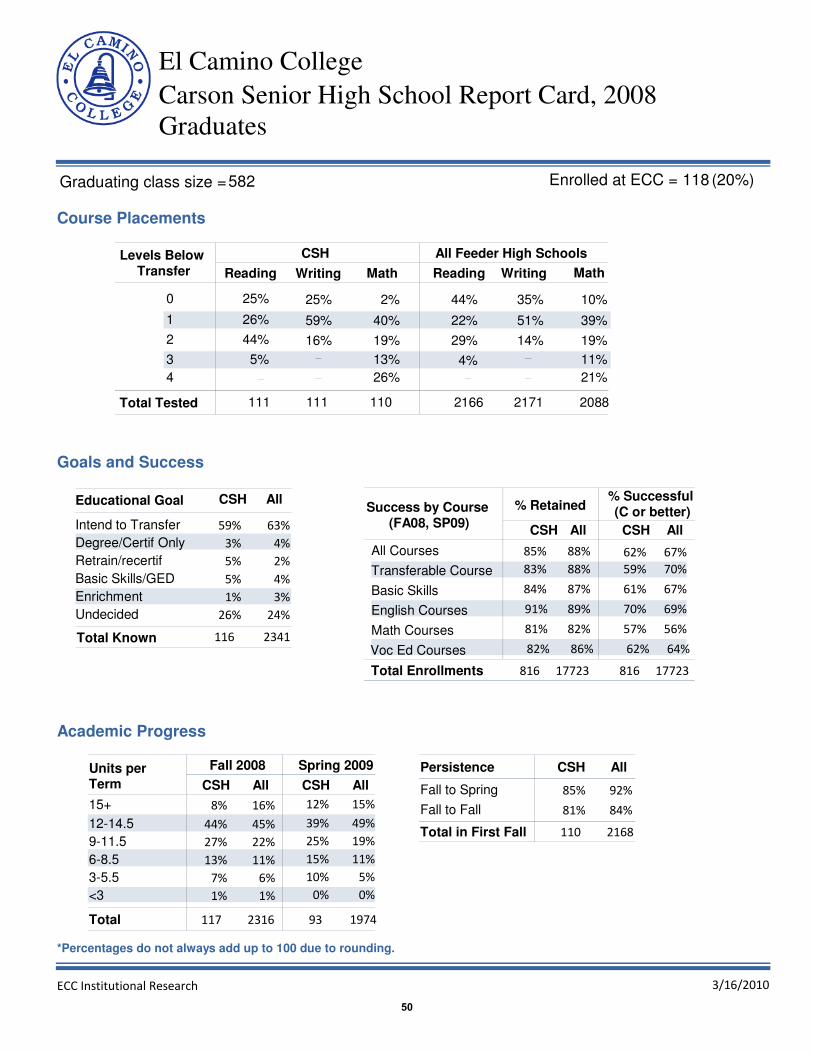
Carson Senior High School Report Card, 2008
Graduates
El Camino College
118Enrolled at ECC =
Course Placements
Levels Below
Transfer
0
1
2
3
4
CSH
Reading Writing Math Reading Writing Math
111 111 110
44%
22%
29%
4%
2166 2171 2088
35% 10%
51% 39%
14% 19%
11%
21%
All Feeder High Schools
Total Tested
Goals and Success
Educational Goal
Total Known 116
63%
4%
2%
4%
3%
24%
2341
Success by Course
(FA08, SP09)
% Retained% Successful
(C or better)
All All
All Courses 85% 62%
Transferable Course 59%83%
Basic Skills 84% 61%
English Courses 91% 70%
Math Courses 81% 57%
Voc Ed Courses 82% 62%
Academic Progress
Fall 2008 Spring 2009
All All
Units per
Term
Total
Persistence
Total in First Fall
Total Enrollments
88%
88%
87%
89%
82%
86%
67%
70%
67%
69%
56%
64%
816 17723 816 17723
2316 1974117 93
110
CSH CSH
AllCSH
AllCSH
2168
CSH CSH
(20%)
25%
26%
44%
5%
25%
59%
16%
2%
40%
19%
13%
26%
Intend to Transfer 59%
Degree/Certif Only 3%
Retrain/recertif 5%
Basic Skills/GED 5%
Enrichment 1%
Undecided 26%
15+ 8%
12-14.5 44%
9-11.5 27%
6-8.5 13%
3-5.5 7%
<3 1%
16%
45%
22%
11%
6%
1%
12%
39%
25%
15%
10%
0%
15%
49%
19%
11%
5%
0%
Fall to Spring 85%
Fall to Fall 81%
92%
84%
582Graduating class size =
3/16/2010ECC Institutional Research
*Percentages do not always add up to 100 due to rounding.
50

El Segundo High School Report Card, 2008 Graduates
El Camino College
59Enrolled at ECC =
Course Placements
Levels Below
Transfer
0
1
2
3
4
EHS
Reading Writing Math Reading Writing Math
51 51 52
44%
22%
29%
4%
2166 2171 2088
35% 10%
51% 39%
14% 19%
11%
21%
All Feeder High Schools
Total Tested
Goals and Success
Educational Goal
Total Known 59
63%
4%
2%
4%
3%
24%
2341
Success by Course
(FA08, SP09)
% Retained% Successful
(C or better)
All All
All Courses 85% 64%
Transferable Course 64%85%
Basic Skills 85% 64%
English Courses 84% 76%
Math Courses 86% 62%
Voc Ed Courses 78% 53%
Academic Progress
Fall 2008 Spring 2009
All All
Units per
Term
Total
Persistence
Total in First Fall
Total Enrollments
88%
88%
87%
89%
82%
86%
67%
70%
67%
69%
56%
64%
407 17723 407 17723
2316 197458 44
53
EHS EHS
AllEHS
AllEHS
2168
EHS EHS
(19%)
37%
35%
27%
0%
25%
67%
8%
2%
38%
27%
13%
19%
Intend to Transfer 61%
Degree/Certif Only 7%
Retrain/recertif 2%
Basic Skills/GED 3%
Enrichment 2%
Undecided 25%
15+ 12%
12-14.5 50%
9-11.5 22%
6-8.5 7%
3-5.5 7%
<3 2%
16%
45%
22%
11%
6%
1%
11%
61%
14%
7%
7%
0%
15%
49%
19%
11%
5%
0%
Fall to Spring 83%
Fall to Fall 72%
92%
84%
306Graduating class size =
3/16/2010ECC Institutional Research
*Percentages do not always add up to 100 due to rounding.
51
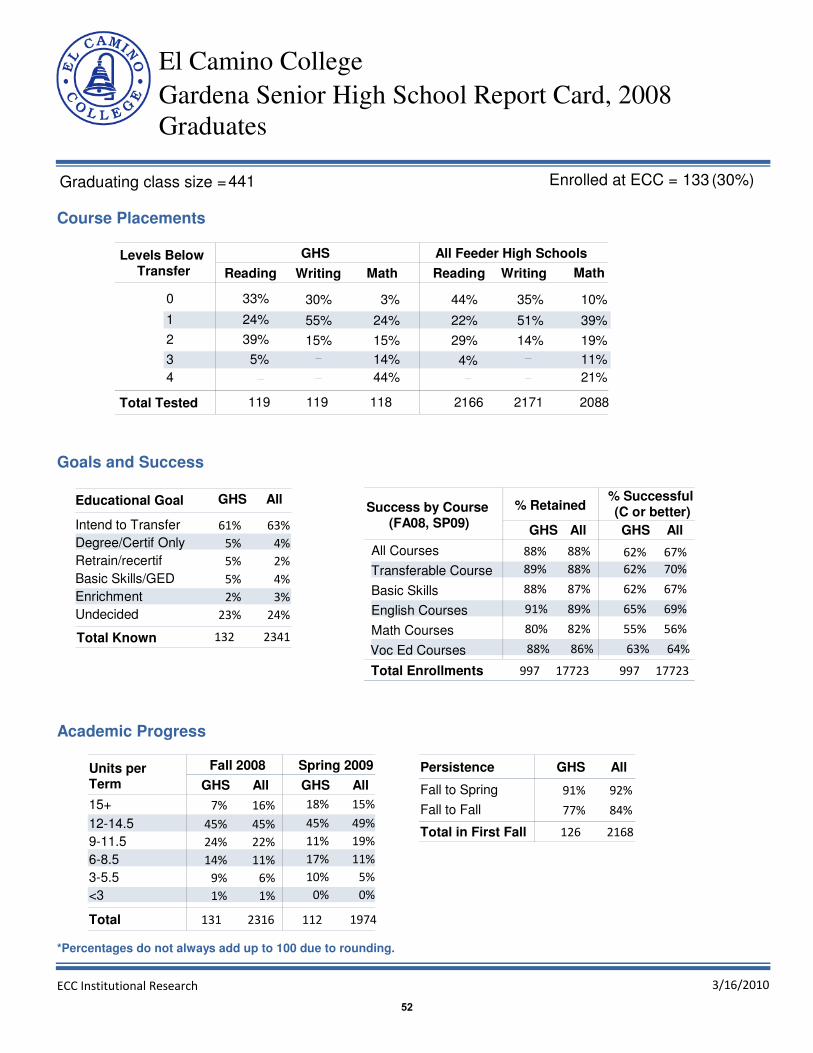
Gardena Senior High School Report Card, 2008
Graduates
El Camino College
133Enrolled at ECC =
Course Placements
Levels Below
Transfer
0
1
2
3
4
GHS
Reading Writing Math Reading Writing Math
119 119 118
44%
22%
29%
4%
2166 2171 2088
35% 10%
51% 39%
14% 19%
11%
21%
All Feeder High Schools
Total Tested
Goals and Success
Educational Goal
Total Known 132
63%
4%
2%
4%
3%
24%
2341
Success by Course
(FA08, SP09)
% Retained% Successful
(C or better)
All All
All Courses 88% 62%
Transferable Course 62%89%
Basic Skills 88% 62%
English Courses 91% 65%
Math Courses 80% 55%
Voc Ed Courses 88% 63%
Academic Progress
Fall 2008 Spring 2009
All All
Units per
Term
Total
Persistence
Total in First Fall
Total Enrollments
88%
88%
87%
89%
82%
86%
67%
70%
67%
69%
56%
64%
997 17723 997 17723
2316 1974131 112
126
GHS GHS
AllGHS
AllGHS
2168
GHS GHS
(30%)
33%
24%
39%
5%
30%
55%
15%
3%
24%
15%
14%
44%
Intend to Transfer 61%
Degree/Certif Only 5%
Retrain/recertif 5%
Basic Skills/GED 5%
Enrichment 2%
Undecided 23%
15+ 7%
12-14.5 45%
9-11.5 24%
6-8.5 14%
3-5.5 9%
<3 1%
16%
45%
22%
11%
6%
1%
18%
45%
11%
17%
10%
0%
15%
49%
19%
11%
5%
0%
Fall to Spring 91%
Fall to Fall 77%
92%
84%
441Graduating class size =
3/16/2010ECC Institutional Research
*Percentages do not always add up to 100 due to rounding.
52

Hawthorne High School Report Card, 2008 Graduates
El Camino College
117Enrolled at ECC =
Course Placements
Levels Below
Transfer
0
1
2
3
4
HHS
Reading Writing Math Reading Writing Math
109 109 109
44%
22%
29%
4%
2166 2171 2088
35% 10%
51% 39%
14% 19%
11%
21%
All Feeder High Schools
Total Tested
Goals and Success
Educational Goal
Total Known 116
63%
4%
2%
4%
3%
24%
2341
Success by Course
(FA08, SP09)
% Retained% Successful
(C or better)
All All
All Courses 90% 60%
Transferable Course 62%90%
Basic Skills 90% 60%
English Courses 90% 64%
Math Courses 90% 48%
Voc Ed Courses 94% 65%
Academic Progress
Fall 2008 Spring 2009
All All
Units per
Term
Total
Persistence
Total in First Fall
Total Enrollments
88%
88%
87%
89%
82%
86%
67%
70%
67%
69%
56%
64%
845 17723 845 17723
2316 1974116 92
111
HHS HHS
AllHHS
AllHHS
2168
HHS HHS
(35%)
28%
26%
42%
5%
19%
60%
21%
1%
34%
22%
18%
25%
Intend to Transfer 51%
Degree/Certif Only 5%
Retrain/recertif 3%
Basic Skills/GED 2%
Enrichment 5%
Undecided 34%
15+ 7%
12-14.5 45%
9-11.5 22%
6-8.5 16%
3-5.5 8%
<3 3%
16%
45%
22%
11%
6%
1%
8%
45%
24%
17%
7%
0%
15%
49%
19%
11%
5%
0%
Fall to Spring 85%
Fall to Fall 77%
92%
84%
337Graduating class size =
3/16/2010ECC Institutional Research
*Percentages do not always add up to 100 due to rounding.
53
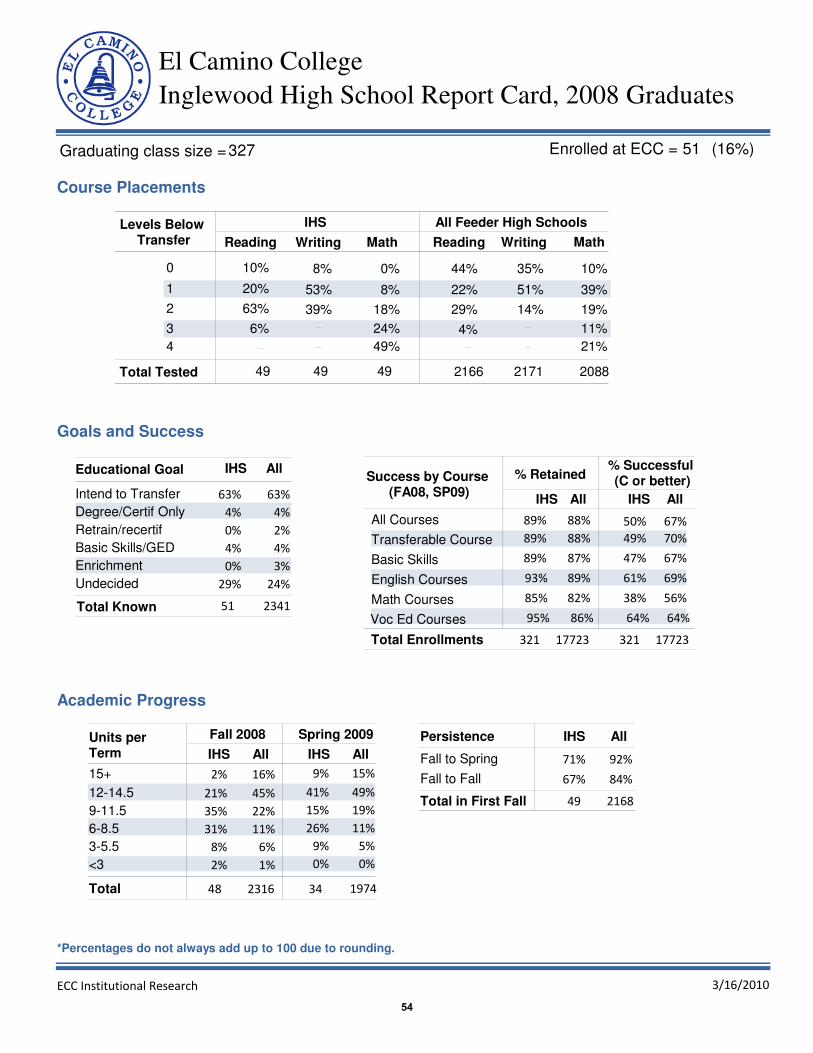
Inglewood High School Report Card, 2008 Graduates
El Camino College
51Enrolled at ECC =
Course Placements
Levels Below
Transfer
0
1
2
3
4
IHS
Reading Writing Math Reading Writing Math
49 49 49
44%
22%
29%
4%
2166 2171 2088
35% 10%
51% 39%
14% 19%
11%
21%
All Feeder High Schools
Total Tested
Goals and Success
Educational Goal
Total Known 51
63%
4%
2%
4%
3%
24%
2341
Success by Course
(FA08, SP09)
% Retained% Successful
(C or better)
All All
All Courses 89% 50%
Transferable Course 49%89%
Basic Skills 89% 47%
English Courses 93% 61%
Math Courses 85% 38%
Voc Ed Courses 95% 64%
Academic Progress
Fall 2008 Spring 2009
All All
Units per
Term
Total
Persistence
Total in First Fall
Total Enrollments
88%
88%
87%
89%
82%
86%
67%
70%
67%
69%
56%
64%
321 17723 321 17723
2316 197448 34
49
IHS IHS
AllIHS
AllIHS
2168
IHS IHS
(16%)
10%
20%
63%
6%
8%
53%
39%
0%
8%
18%
24%
49%
Intend to Transfer 63%
Degree/Certif Only 4%
Retrain/recertif 0%
Basic Skills/GED 4%
Enrichment 0%
Undecided 29%
15+ 2%
12-14.5 21%
9-11.5 35%
6-8.5 31%
3-5.5 8%
<3 2%
16%
45%
22%
11%
6%
1%
9%
41%
15%
26%
9%
0%
15%
49%
19%
11%
5%
0%
Fall to Spring 71%
Fall to Fall 67%
92%
84%
327Graduating class size =
3/16/2010ECC Institutional Research
*Percentages do not always add up to 100 due to rounding.
54
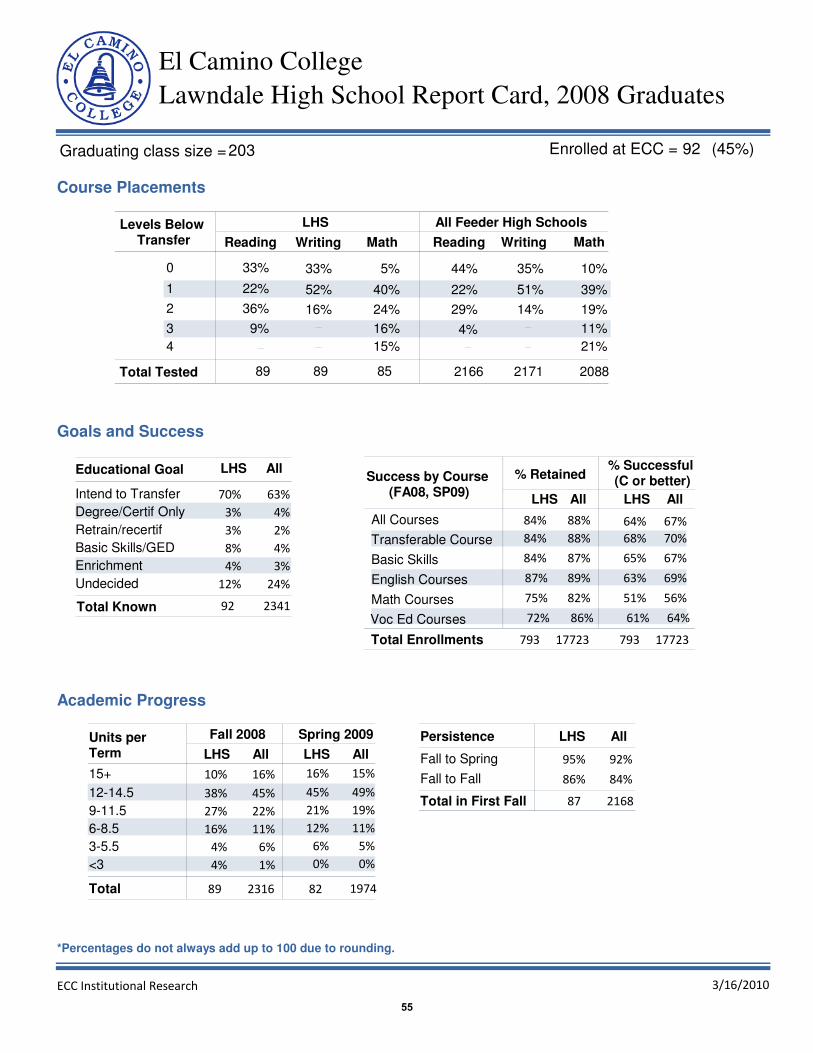
Lawndale High School Report Card, 2008 Graduates
El Camino College
92Enrolled at ECC =
Course Placements
Levels Below
Transfer
0
1
2
3
4
LHS
Reading Writing Math Reading Writing Math
89 89 85
44%
22%
29%
4%
2166 2171 2088
35% 10%
51% 39%
14% 19%
11%
21%
All Feeder High Schools
Total Tested
Goals and Success
Educational Goal
Total Known 92
63%
4%
2%
4%
3%
24%
2341
Success by Course
(FA08, SP09)
% Retained% Successful
(C or better)
All All
All Courses 84% 64%
Transferable Course 68%84%
Basic Skills 84% 65%
English Courses 87% 63%
Math Courses 75% 51%
Voc Ed Courses 72% 61%
Academic Progress
Fall 2008 Spring 2009
All All
Units per
Term
Total
Persistence
Total in First Fall
Total Enrollments
88%
88%
87%
89%
82%
86%
67%
70%
67%
69%
56%
64%
793 17723 793 17723
2316 197489 82
87
LHS LHS
AllLHS
AllLHS
2168
LHS LHS
(45%)
33%
22%
36%
9%
33%
52%
16%
5%
40%
24%
16%
15%
Intend to Transfer 70%
Degree/Certif Only 3%
Retrain/recertif 3%
Basic Skills/GED 8%
Enrichment 4%
Undecided 12%
15+ 10%
12-14.5 38%
9-11.5 27%
6-8.5 16%
3-5.5 4%
<3 4%
16%
45%
22%
11%
6%
1%
16%
45%
21%
12%
6%
0%
15%
49%
19%
11%
5%
0%
Fall to Spring 95%
Fall to Fall 86%
92%
84%
203Graduating class size =
3/16/2010ECC Institutional Research
*Percentages do not always add up to 100 due to rounding.
55

Leuzinger High School Report Card, 2008 Graduates
El Camino College
136Enrolled at ECC =
Course Placements
Levels Below
Transfer
0
1
2
3
4
LHS
Reading Writing Math Reading Writing Math
124 124 122
44%
22%
29%
4%
2166 2171 2088
35% 10%
51% 39%
14% 19%
11%
21%
All Feeder High Schools
Total Tested
Goals and Success
Educational Goal
Total Known 136
63%
4%
2%
4%
3%
24%
2341
Success by Course
(FA08, SP09)
% Retained% Successful
(C or better)
All All
All Courses 84% 54%
Transferable Course 58%84%
Basic Skills 83% 54%
English Courses 91% 52%
Math Courses 76% 47%
Voc Ed Courses 85% 63%
Academic Progress
Fall 2008 Spring 2009
All All
Units per
Term
Total
Persistence
Total in First Fall
Total Enrollments
88%
88%
87%
89%
82%
86%
67%
70%
67%
69%
56%
64%
946 17723 946 17723
2316 1974133 106
125
LHS LHS
AllLHS
AllLHS
2168
LHS LHS
(36%)
21%
27%
44%
9%
21%
51%
28%
3%
39%
22%
15%
21%
Intend to Transfer 65%
Degree/Certif Only 7%
Retrain/recertif 0%
Basic Skills/GED 5%
Enrichment 1%
Undecided 23%
15+ 10%
12-14.5 34%
9-11.5 29%
6-8.5 20%
3-5.5 7%
<3 2%
16%
45%
22%
11%
6%
1%
13%
32%
30%
15%
9%
0%
15%
49%
19%
11%
5%
0%
Fall to Spring 85%
Fall to Fall 72%
92%
84%
373Graduating class size =
3/16/2010ECC Institutional Research
*Percentages do not always add up to 100 due to rounding.
56

Mira Costa High School Report Card, 2008 Graduates
El Camino College
90Enrolled at ECC =
Course Placements
Levels Below
Transfer
0
1
2
3
4
MHS
Reading Writing Math Reading Writing Math
84 85 83
44%
22%
29%
4%
2166 2171 2088
35% 10%
51% 39%
14% 19%
11%
21%
All Feeder High Schools
Total Tested
Goals and Success
Educational Goal
Total Known 90
63%
4%
2%
4%
3%
24%
2341
Success by Course
(FA08, SP09)
% Retained% Successful
(C or better)
All All
All Courses 91% 74%
Transferable Course 76%92%
Basic Skills 91% 75%
English Courses 94% 79%
Math Courses 89% 68%
Voc Ed Courses 83% 58%
Academic Progress
Fall 2008 Spring 2009
All All
Units per
Term
Total
Persistence
Total in First Fall
Total Enrollments
88%
88%
87%
89%
82%
86%
67%
70%
67%
69%
56%
64%
684 17723 684 17723
2316 197488 78
81
MHS MHS
AllMHS
AllMHS
2168
MHS MHS
(16%)
49%
24%
23%
5%
29%
58%
13%
5%
47%
20%
8%
19%
Intend to Transfer 60%
Degree/Certif Only 6%
Retrain/recertif 1%
Basic Skills/GED 2%
Enrichment 4%
Undecided 27%
15+ 20%
12-14.5 47%
9-11.5 19%
6-8.5 10%
3-5.5 3%
<3 0%
16%
45%
22%
11%
6%
1%
12%
54%
23%
10%
1%
0%
15%
49%
19%
11%
5%
0%
Fall to Spring 96%
Fall to Fall 83%
92%
84%
577Graduating class size =
3/16/2010ECC Institutional Research
*Percentages do not always add up to 100 due to rounding.
57
Morningside High School Report Card, 2008 Graduates
El Camino College
34Enrolled at ECC =
Course Placements
Levels Below
Transfer
0
1
2
3
4
MHS
Reading Writing Math Reading Writing Math
28 28 28
44%
22%
29%
4%
2166 2171 2088
35% 10%
51% 39%
14% 19%
11%
21%
All Feeder High Schools
Total Tested
Goals and Success
Educational Goal
Total Known 34
63%
4%
2%
4%
3%
24%
2341
Success by Course
(FA08, SP09)
% Retained% Successful
(C or better)
All All
All Courses 82% 33%
Transferable Course 29%80%
Basic Skills 85% 36%
English Courses 81% 31%
Math Courses 82% 32%
Voc Ed Courses 77% 42%
Academic Progress
Fall 2008 Spring 2009
All All
Units per
Term
Total
Persistence
Total in First Fall
Total Enrollments
88%
88%
87%
89%
82%
86%
67%
70%
67%
69%
56%
64%
204 17723 204 17723
2316 197433 22
31
MHS MHS
AllMHS
AllMHS
2168
MHS MHS
(15%)
11%
14%
61%
14%
0%
54%
46%
0%
14%
21%
11%
54%
Intend to Transfer 50%
Degree/Certif Only 6%
Retrain/recertif 6%
Basic Skills/GED 0%
Enrichment 6%
Undecided 32%
15+ 9%
12-14.5 27%
9-11.5 18%
6-8.5 21%
3-5.5 18%
<3 6%
16%
45%
22%
11%
6%
1%
0%
32%
32%
23%
14%
0%
15%
49%
19%
11%
5%
0%
Fall to Spring 77%
Fall to Fall 52%
92%
84%
232Graduating class size =
3/16/2010ECC Institutional Research
*Percentages do not always add up to 100 due to rounding.
58
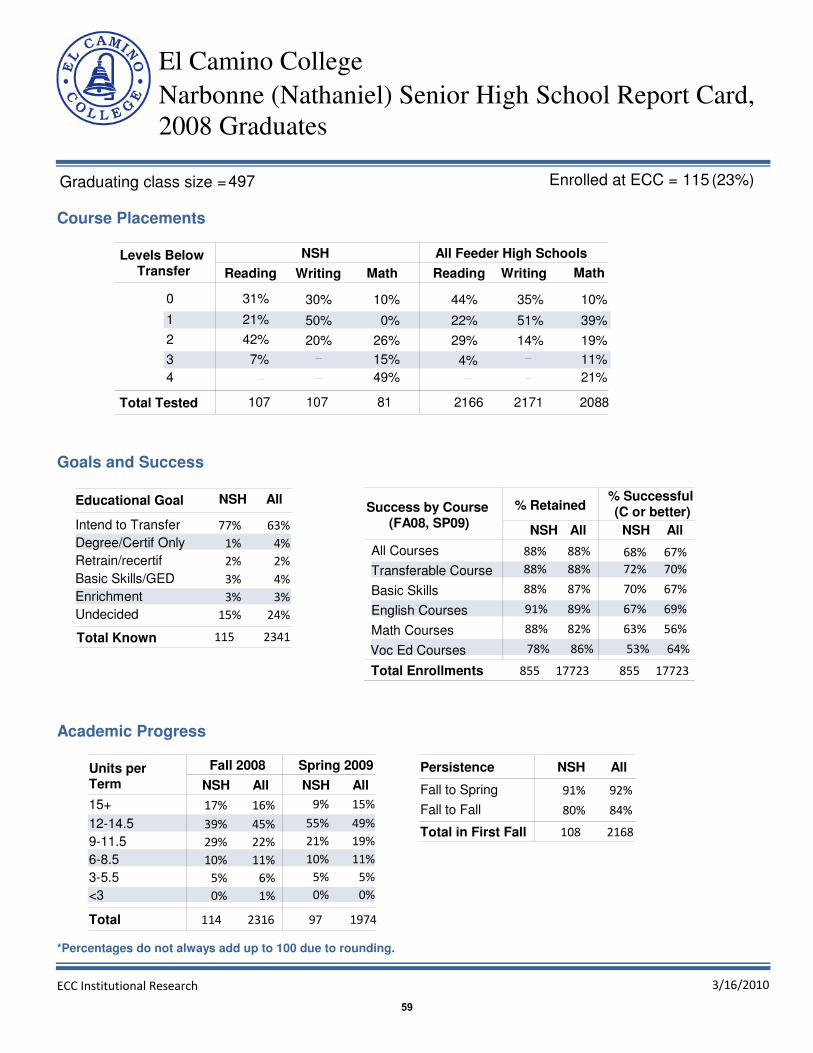
Narbonne (Nathaniel) Senior High School Report Card,
2008 Graduates
El Camino College
115Enrolled at ECC =
Course Placements
Levels Below
Transfer
0
1
2
3
4
NSH
Reading Writing Math Reading Writing Math
107 107 81
44%
22%
29%
4%
2166 2171 2088
35% 10%
51% 39%
14% 19%
11%
21%
All Feeder High Schools
Total Tested
Goals and Success
Educational Goal
Total Known 115
63%
4%
2%
4%
3%
24%
2341
Success by Course
(FA08, SP09)
% Retained% Successful
(C or better)
All All
All Courses 88% 68%
Transferable Course 72%88%
Basic Skills 88% 70%
English Courses 91% 67%
Math Courses 88% 63%
Voc Ed Courses 78% 53%
Academic Progress
Fall 2008 Spring 2009
All All
Units per
Term
Total
Persistence
Total in First Fall
Total Enrollments
88%
88%
87%
89%
82%
86%
67%
70%
67%
69%
56%
64%
855 17723 855 17723
2316 1974114 97
108
NSH NSH
AllNSH
AllNSH
2168
NSH NSH
(23%)
31%
21%
42%
7%
30%
50%
20%
10%
0%
26%
15%
49%
Intend to Transfer 77%
Degree/Certif Only 1%
Retrain/recertif 2%
Basic Skills/GED 3%
Enrichment 3%
Undecided 15%
15+ 17%
12-14.5 39%
9-11.5 29%
6-8.5 10%
3-5.5 5%
<3 0%
16%
45%
22%
11%
6%
1%
9%
55%
21%
10%
5%
0%
15%
49%
19%
11%
5%
0%
Fall to Spring 91%
Fall to Fall 80%
92%
84%
497Graduating class size =
3/16/2010ECC Institutional Research
*Percentages do not always add up to 100 due to rounding.
59

North High School Report Card, 2008 Graduates
El Camino College
250Enrolled at ECC =
Course Placements
Levels Below
Transfer
0
1
2
3
4
NHS
Reading Writing Math Reading Writing Math
231 231 235
44%
22%
29%
4%
2166 2171 2088
35% 10%
51% 39%
14% 19%
11%
21%
All Feeder High Schools
Total Tested
Goals and Success
Educational Goal
Total Known 250
63%
4%
2%
4%
3%
24%
2341
Success by Course
(FA08, SP09)
% Retained% Successful
(C or better)
All All
All Courses 89% 69%
Transferable Course 72%89%
Basic Skills 89% 70%
English Courses 90% 75%
Math Courses 85% 57%
Voc Ed Courses 87% 65%
Academic Progress
Fall 2008 Spring 2009
All All
Units per
Term
Total
Persistence
Total in First Fall
Total Enrollments
88%
88%
87%
89%
82%
86%
67%
70%
67%
69%
56%
64%
1978 17723 1978 17723
2316 1974249 229
234
NHS NHS
AllNHS
AllNHS
2168
NHS NHS
(49%)
48%
21%
30%
2%
35%
54%
11%
12%
40%
21%
11%
16%
Intend to Transfer 62%
Degree/Certif Only 3%
Retrain/recertif 2%
Basic Skills/GED 4%
Enrichment 3%
Undecided 27%
15+ 17%
12-14.5 54%
9-11.5 17%
6-8.5 9%
3-5.5 4%
<3 0%
16%
45%
22%
11%
6%
1%
17%
50%
18%
10%
4%
0%
15%
49%
19%
11%
5%
0%
Fall to Spring 99%
Fall to Fall 96%
92%
84%
509Graduating class size =
3/16/2010ECC Institutional Research
*Percentages do not always add up to 100 due to rounding.
60
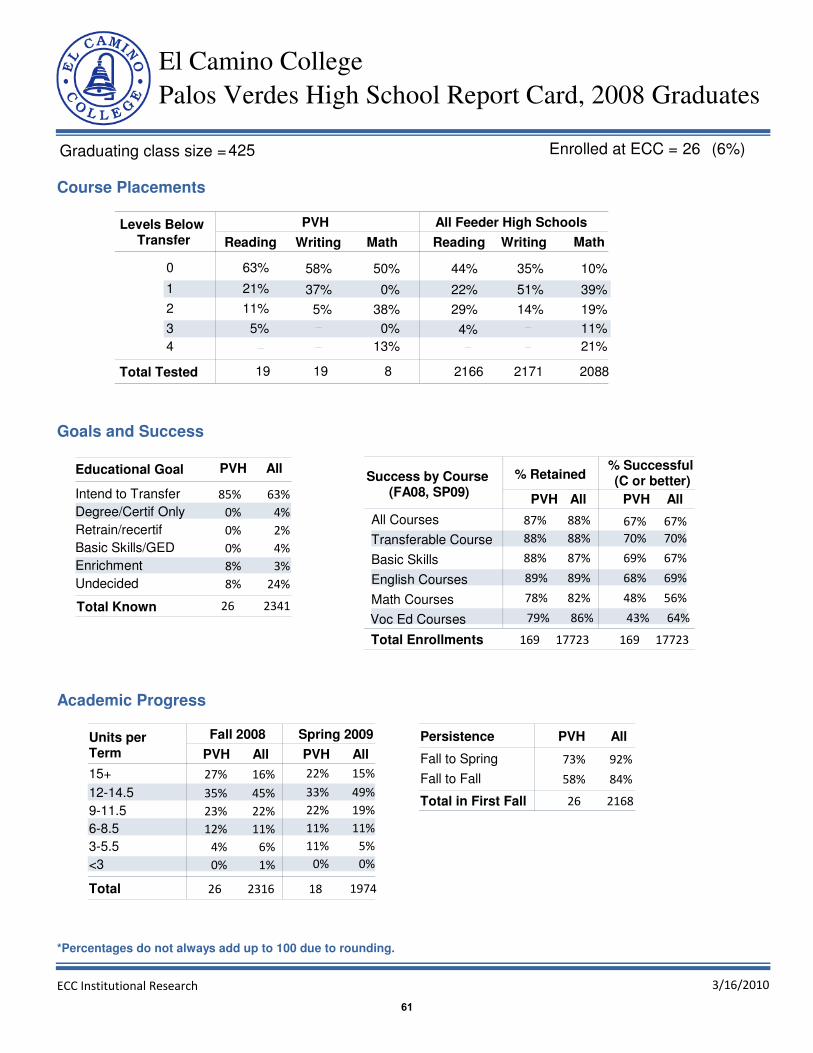
Palos Verdes High School Report Card, 2008 Graduates
El Camino College
26Enrolled at ECC =
Course Placements
Levels Below
Transfer
0
1
2
3
4
PVH
Reading Writing Math Reading Writing Math
19 19 8
44%
22%
29%
4%
2166 2171 2088
35% 10%
51% 39%
14% 19%
11%
21%
All Feeder High Schools
Total Tested
Goals and Success
Educational Goal
Total Known 26
63%
4%
2%
4%
3%
24%
2341
Success by Course
(FA08, SP09)
% Retained% Successful
(C or better)
All All
All Courses 87% 67%
Transferable Course 70%88%
Basic Skills 88% 69%
English Courses 89% 68%
Math Courses 78% 48%
Voc Ed Courses 79% 43%
Academic Progress
Fall 2008 Spring 2009
All All
Units per
Term
Total
Persistence
Total in First Fall
Total Enrollments
88%
88%
87%
89%
82%
86%
67%
70%
67%
69%
56%
64%
169 17723 169 17723
2316 197426 18
26
PVH PVH
AllPVH
AllPVH
2168
PVH PVH
(6%)
63%
21%
11%
5%
58%
37%
5%
50%
0%
38%
0%
13%
Intend to Transfer 85%
Degree/Certif Only 0%
Retrain/recertif 0%
Basic Skills/GED 0%
Enrichment 8%
Undecided 8%
15+ 27%
12-14.5 35%
9-11.5 23%
6-8.5 12%
3-5.5 4%
<3 0%
16%
45%
22%
11%
6%
1%
22%
33%
22%
11%
11%
0%
15%
49%
19%
11%
5%
0%
Fall to Spring 73%
Fall to Fall 58%
92%
84%
425Graduating class size =
3/16/2010ECC Institutional Research
*Percentages do not always add up to 100 due to rounding.
61
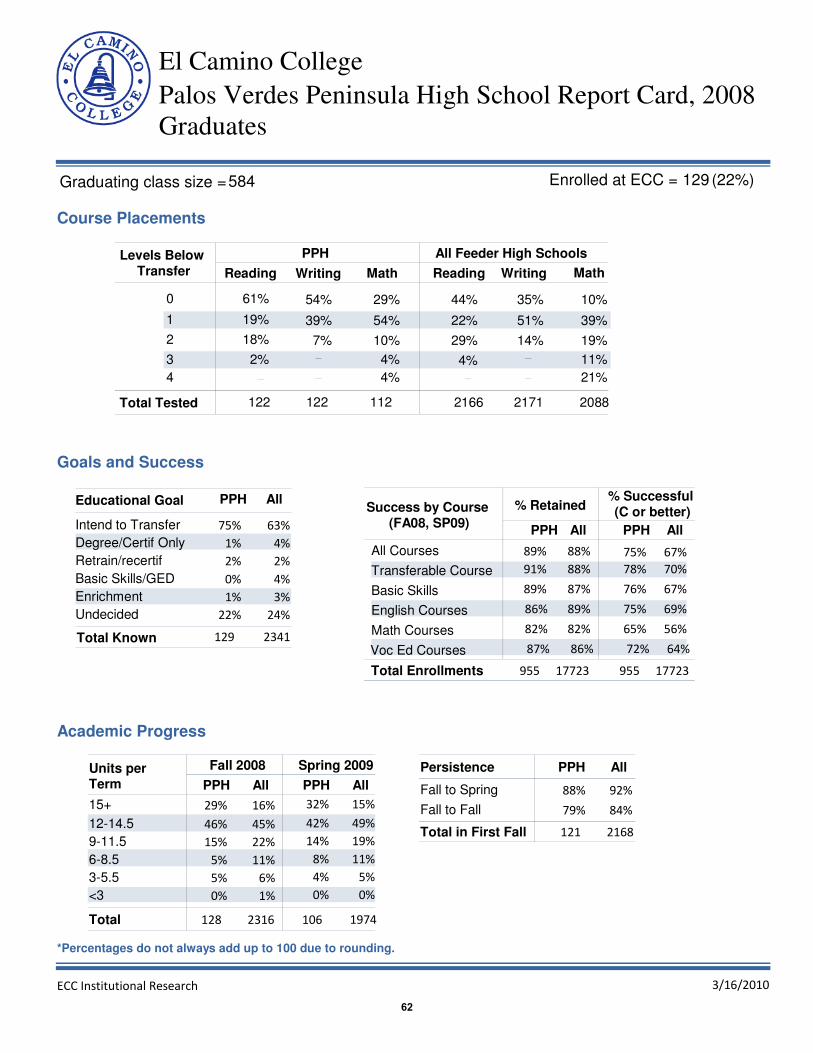
Palos Verdes Peninsula High School Report Card, 2008
Graduates
El Camino College
129Enrolled at ECC =
Course Placements
Levels Below
Transfer
0
1
2
3
4
PPH
Reading Writing Math Reading Writing Math
122 122 112
44%
22%
29%
4%
2166 2171 2088
35% 10%
51% 39%
14% 19%
11%
21%
All Feeder High Schools
Total Tested
Goals and Success
Educational Goal
Total Known 129
63%
4%
2%
4%
3%
24%
2341
Success by Course
(FA08, SP09)
% Retained% Successful
(C or better)
All All
All Courses 89% 75%
Transferable Course 78%91%
Basic Skills 89% 76%
English Courses 86% 75%
Math Courses 82% 65%
Voc Ed Courses 87% 72%
Academic Progress
Fall 2008 Spring 2009
All All
Units per
Term
Total
Persistence
Total in First Fall
Total Enrollments
88%
88%
87%
89%
82%
86%
67%
70%
67%
69%
56%
64%
955 17723 955 17723
2316 1974128 106
121
PPH PPH
AllPPH
AllPPH
2168
PPH PPH
(22%)
61%
19%
18%
2%
54%
39%
7%
29%
54%
10%
4%
4%
Intend to Transfer 75%
Degree/Certif Only 1%
Retrain/recertif 2%
Basic Skills/GED 0%
Enrichment 1%
Undecided 22%
15+ 29%
12-14.5 46%
9-11.5 15%
6-8.5 5%
3-5.5 5%
<3 0%
16%
45%
22%
11%
6%
1%
32%
42%
14%
8%
4%
0%
15%
49%
19%
11%
5%
0%
Fall to Spring 88%
Fall to Fall 79%
92%
84%
584Graduating class size =
3/16/2010ECC Institutional Research
*Percentages do not always add up to 100 due to rounding.
62

Redondo High School Report Card, 2008 Graduates
El Camino College
251Enrolled at ECC =
Course Placements
Levels Below
Transfer
0
1
2
3
4
RHS
Reading Writing Math Reading Writing Math
224 227 218
44%
22%
29%
4%
2166 2171 2088
35% 10%
51% 39%
14% 19%
11%
21%
All Feeder High Schools
Total Tested
Goals and Success
Educational Goal
Total Known 251
63%
4%
2%
4%
3%
24%
2341
Success by Course
(FA08, SP09)
% Retained% Successful
(C or better)
All All
All Courses 86% 67%
Transferable Course 71%88%
Basic Skills 86% 68%
English Courses 86% 69%
Math Courses 79% 56%
Voc Ed Courses 88% 64%
Academic Progress
Fall 2008 Spring 2009
All All
Units per
Term
Total
Persistence
Total in First Fall
Total Enrollments
88%
88%
87%
89%
82%
86%
67%
70%
67%
69%
56%
64%
2009 17723 2009 17723
2316 1974249 215
212
RHS RHS
AllRHS
AllRHS
2168
RHS RHS
(44%)
59%
22%
14%
4%
52%
38%
11%
12%
45%
18%
11%
13%
Intend to Transfer 54%
Degree/Certif Only 3%
Retrain/recertif 2%
Basic Skills/GED 9%
Enrichment 4%
Undecided 27%
15+ 21%
12-14.5 45%
9-11.5 19%
6-8.5 7%
3-5.5 7%
<3 1%
16%
45%
22%
11%
6%
1%
13%
57%
20%
7%
2%
0%
15%
49%
19%
11%
5%
0%
Fall to Spring 102%
Fall to Fall 96%
92%
84%
572Graduating class size =
3/16/2010ECC Institutional Research
*Percentages do not always add up to 100 due to rounding.
63
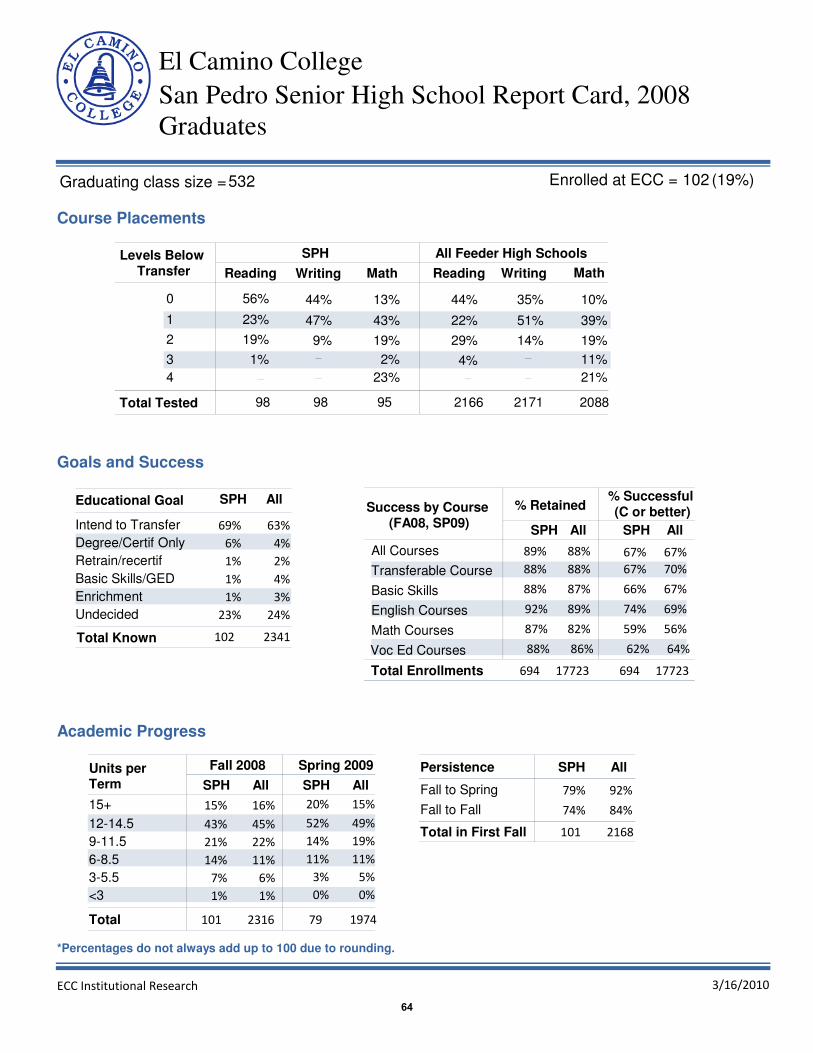
San Pedro Senior High School Report Card, 2008
Graduates
El Camino College
102Enrolled at ECC =
Course Placements
Levels Below
Transfer
0
1
2
3
4
SPH
Reading Writing Math Reading Writing Math
98 98 95
44%
22%
29%
4%
2166 2171 2088
35% 10%
51% 39%
14% 19%
11%
21%
All Feeder High Schools
Total Tested
Goals and Success
Educational Goal
Total Known 102
63%
4%
2%
4%
3%
24%
2341
Success by Course
(FA08, SP09)
% Retained% Successful
(C or better)
All All
All Courses 89% 67%
Transferable Course 67%88%
Basic Skills 88% 66%
English Courses 92% 74%
Math Courses 87% 59%
Voc Ed Courses 88% 62%
Academic Progress
Fall 2008 Spring 2009
All All
Units per
Term
Total
Persistence
Total in First Fall
Total Enrollments
88%
88%
87%
89%
82%
86%
67%
70%
67%
69%
56%
64%
694 17723 694 17723
2316 1974101 79
101
SPH SPH
AllSPH
AllSPH
2168
SPH SPH
(19%)
56%
23%
19%
1%
44%
47%
9%
13%
43%
19%
2%
23%
Intend to Transfer 69%
Degree/Certif Only 6%
Retrain/recertif 1%
Basic Skills/GED 1%
Enrichment 1%
Undecided 23%
15+ 15%
12-14.5 43%
9-11.5 21%
6-8.5 14%
3-5.5 7%
<3 1%
16%
45%
22%
11%
6%
1%
20%
52%
14%
11%
3%
0%
15%
49%
19%
11%
5%
0%
Fall to Spring 79%
Fall to Fall 74%
92%
84%
532Graduating class size =
3/16/2010ECC Institutional Research
*Percentages do not always add up to 100 due to rounding.
64

South High School Report Card, 2008 Graduates
El Camino College
176Enrolled at ECC =
Course Placements
Levels Below
Transfer
0
1
2
3
4
SHS
Reading Writing Math Reading Writing Math
162 163 163
44%
22%
29%
4%
2166 2171 2088
35% 10%
51% 39%
14% 19%
11%
21%
All Feeder High Schools
Total Tested
Goals and Success
Educational Goal
Total Known 176
63%
4%
2%
4%
3%
24%
2341
Success by Course
(FA08, SP09)
% Retained% Successful
(C or better)
All All
All Courses 87% 71%
Transferable Course 74%89%
Basic Skills 87% 71%
English Courses 88% 76%
Math Courses 78% 55%
Voc Ed Courses 89% 69%
Academic Progress
Fall 2008 Spring 2009
All All
Units per
Term
Total
Persistence
Total in First Fall
Total Enrollments
88%
88%
87%
89%
82%
86%
67%
70%
67%
69%
56%
64%
1491 17723 1491 17723
2316 1974176 160
159
SHS SHS
AllSHS
AllSHS
2168
SHS SHS
(36%)
60%
21%
19%
1%
36%
58%
6%
13%
47%
19%
10%
11%
Intend to Transfer 68%
Degree/Certif Only 1%
Retrain/recertif 2%
Basic Skills/GED 2%
Enrichment 3%
Undecided 24%
15+ 25%
12-14.5 51%
9-11.5 16%
6-8.5 5%
3-5.5 3%
<3 0%
16%
45%
22%
11%
6%
1%
32%
48%
15%
3%
3%
0%
15%
49%
19%
11%
5%
0%
Fall to Spring 101%
Fall to Fall 100%
92%
84%
489Graduating class size =
3/16/2010ECC Institutional Research
*Percentages do not always add up to 100 due to rounding.
65
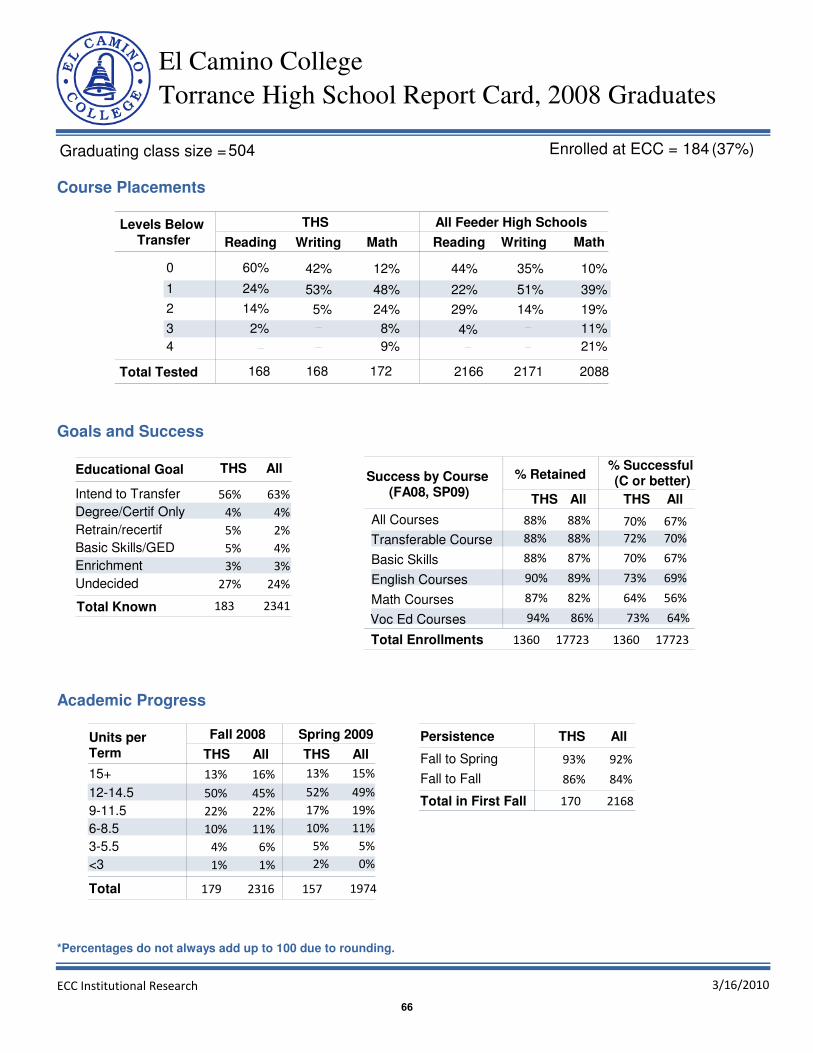
Torrance High School Report Card, 2008 Graduates
El Camino College
184Enrolled at ECC =
Course Placements
Levels Below
Transfer
0
1
2
3
4
THS
Reading Writing Math Reading Writing Math
168 168 172
44%
22%
29%
4%
2166 2171 2088
35% 10%
51% 39%
14% 19%
11%
21%
All Feeder High Schools
Total Tested
Goals and Success
Educational Goal
Total Known 183
63%
4%
2%
4%
3%
24%
2341
Success by Course
(FA08, SP09)
% Retained% Successful
(C or better)
All All
All Courses 88% 70%
Transferable Course 72%88%
Basic Skills 88% 70%
English Courses 90% 73%
Math Courses 87% 64%
Voc Ed Courses 94% 73%
Academic Progress
Fall 2008 Spring 2009
All All
Units per
Term
Total
Persistence
Total in First Fall
Total Enrollments
88%
88%
87%
89%
82%
86%
67%
70%
67%
69%
56%
64%
1360 17723 1360 17723
2316 1974179 157
170
THS THS
AllTHS
AllTHS
2168
THS THS
(37%)
60%
24%
14%
2%
42%
53%
5%
12%
48%
24%
8%
9%
Intend to Transfer 56%
Degree/Certif Only 4%
Retrain/recertif 5%
Basic Skills/GED 5%
Enrichment 3%
Undecided 27%
15+ 13%
12-14.5 50%
9-11.5 22%
6-8.5 10%
3-5.5 4%
<3 1%
16%
45%
22%
11%
6%
1%
13%
52%
17%
10%
5%
2%
15%
49%
19%
11%
5%
0%
Fall to Spring 93%
Fall to Fall 86%
92%
84%
504Graduating class size =
3/16/2010ECC Institutional Research
*Percentages do not always add up to 100 due to rounding.
66
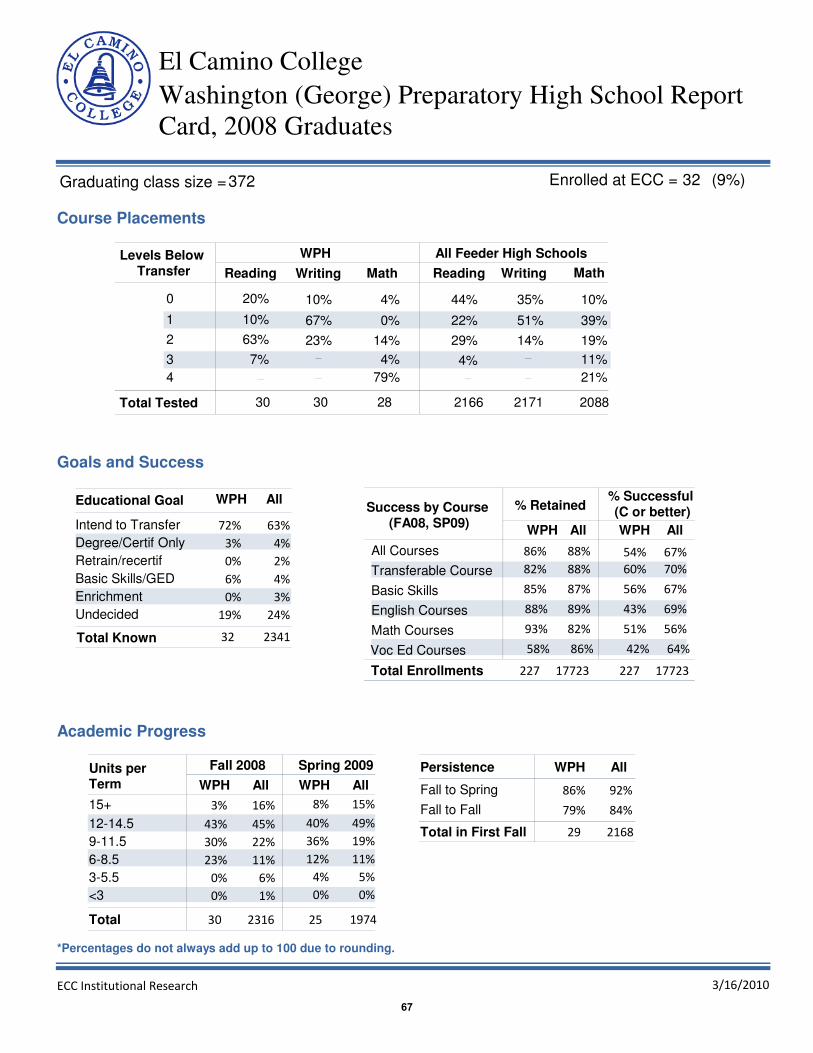
Washington (George) Preparatory High School Report
Card, 2008 Graduates
El Camino College
32Enrolled at ECC =
Course Placements
Levels Below
Transfer
0
1
2
3
4
WPH
Reading Writing Math Reading Writing Math
30 30 28
44%
22%
29%
4%
2166 2171 2088
35% 10%
51% 39%
14% 19%
11%
21%
All Feeder High Schools
Total Tested
Goals and Success
Educational Goal
Total Known 32
63%
4%
2%
4%
3%
24%
2341
Success by Course
(FA08, SP09)
% Retained% Successful
(C or better)
All All
All Courses 86% 54%
Transferable Course 60%82%
Basic Skills 85% 56%
English Courses 88% 43%
Math Courses 93% 51%
Voc Ed Courses 58% 42%
Academic Progress
Fall 2008 Spring 2009
All All
Units per
Term
Total
Persistence
Total in First Fall
Total Enrollments
88%
88%
87%
89%
82%
86%
67%
70%
67%
69%
56%
64%
227 17723 227 17723
2316 197430 25
29
WPH WPH
AllWPH
AllWPH
2168
WPH WPH
(9%)
20%
10%
63%
7%
10%
67%
23%
4%
0%
14%
4%
79%
Intend to Transfer 72%
Degree/Certif Only 3%
Retrain/recertif 0%
Basic Skills/GED 6%
Enrichment 0%
Undecided 19%
15+ 3%
12-14.5 43%
9-11.5 30%
6-8.5 23%
3-5.5 0%
<3 0%
16%
45%
22%
11%
6%
1%
8%
40%
36%
12%
4%
0%
15%
49%
19%
11%
5%
0%
Fall to Spring 86%
Fall to Fall 79%
92%
84%
372Graduating class size =
3/16/2010ECC Institutional Research
*Percentages do not always add up to 100 due to rounding.
67

West High School Report Card, 2008 Graduates
El Camino College
206Enrolled at ECC =
Course Placements
Levels Below
Transfer
0
1
2
3
4
WHS
Reading Writing Math Reading Writing Math
196 196 196
44%
22%
29%
4%
2166 2171 2088
35% 10%
51% 39%
14% 19%
11%
21%
All Feeder High Schools
Total Tested
Goals and Success
Educational Goal
Total Known 206
63%
4%
2%
4%
3%
24%
2341
Success by Course
(FA08, SP09)
% Retained% Successful
(C or better)
All All
All Courses 88% 74%
Transferable Course 77%90%
Basic Skills 88% 74%
English Courses 89% 77%
Math Courses 81% 57%
Voc Ed Courses 92% 78%
Academic Progress
Fall 2008 Spring 2009
All All
Units per
Term
Total
Persistence
Total in First Fall
Total Enrollments
88%
88%
87%
89%
82%
86%
67%
70%
67%
69%
56%
64%
1679 17723 1679 17723
2316 1974206 190
190
WHS WHS
AllWHS
AllWHS
2168
WHS WHS
(41%)
60%
17%
19%
4%
46%
40%
13%
19%
55%
10%
8%
8%
Intend to Transfer 64%
Degree/Certif Only 3%
Retrain/recertif 2%
Basic Skills/GED 5%
Enrichment 5%
Undecided 21%
15+ 18%
12-14.5 50%
9-11.5 19%
6-8.5 9%
3-5.5 2%
<3 0%
16%
45%
22%
11%
6%
1%
8%
63%
21%
6%
3%
0%
15%
49%
19%
11%
5%
0%
Fall to Spring 101%
Fall to Fall 94%
92%
84%
505Graduating class size =
3/16/2010ECC Institutional Research
*Percentages do not always add up to 100 due to rounding.
68