Embed Size (px)
Citation preview
RESEARCH
Elastic and thermodynamical properties of cubic (3C) siliconcarbide under high pressure and high temperature
Dinesh Varshney1 • S. Shriya1 • M. Varshney2 • N. Singh3 • R. Khenata4
Received: 17 April 2015 / Accepted: 15 July 2015 / Published online: 5 August 2015
� The Author(s) 2015. This article is published with open access at Springerlink.com
Abstract Pressure-dependent first-order phase transition,
mechanical, elastic, and thermodynamical properties of
cubic zinc blende to rock-salt structures in 3C silicon
carbide (SiC) are presented. An effective interatomic
interaction potential for SiC is formulated. The potential
for SiC incorporates long-range Coulomb, charge transfer
interactions, covalency effect, Hafemeister and Flygare
type short-range overlap repulsion extended up to the
second-neighbour ions, van der Waals interactions and zero
point energy effects. The developed potential including
many body non-central forces validates the Cauchy dis-
crepancy successfully to explain the high-pressure struc-
tural transition, and associated volume collapse. The
3C SiC ceramics lattice infers mechanical stiffening,
thermal softening, and ductile (brittle) nature from the
pressure (temperature) dependent elastic constants beha-
viour. To our knowledge, these are the first quantitative
theoretical predictions of the pressure and temperature
dependence of mechanical and thermodynamical properties
explicitly the mechanical stiffening, thermally softening,
and brittle/ductile nature of 3C SiC and still awaits
experimental confirmations.
Keywords Carbide � High pressure � Elastic properties �Mechanical properties � Thermal expansion
Introduction
Silicon carbide, (SiC), a high quality technical grade ce-
ramics, possesses wide energy band gap, low density, high
strength, low thermal expansion, high thermal conductiv-
ity, high hardness, high melting point, large bulk modulus,
low dielectric constant, high elastic modulus, excellent
thermal shock resistance, and superior chemical inertness.
The IV–IV SiC compound possesses tetrahedral of C and
Si atoms with strong bonds in the crystal lattice and the
availability of wide variety of its polytypes with unique
structural and electronic properties. SiC has been a subject
of immense interest as it is a very hard and strong ceramics
with its application in requiring high endurance, such as car
brakes and clutches and ceramics plates in bulletproof
vests. The high thermal conductivity coupled with low
thermal expansion and high strength gives this material
exceptional thermal shock resistant qualities. Ceramics SiC
with little or no grain boundary impurities maintain
strength at very high temperatures with no strength loss
[1, 2].
The structural transition, mechanical and elastic prop-
erties under low and high pressures of SiC have attracted
much interest in both experimental [3, 4] and theoretical
[5–15] investigations to elucidate the pressure-dependent
behaviour of polytype [cubic (3C), hexagonal (6H), and
rhombohedral (15R)] SiC. The energy-dispersive X-ray
& Dinesh Varshney
1 Materials Science Laboratory, School of Physics, Vigyan
Bhavan, Devi Ahilya University, Khandwa Road Campus,
Indore 452001, India
2 Department of Physics, M. B. Khalsa College,
Indore 452002, India
3 Department of Physics, Ranchi College, Ranchi,
Jharkhand 834008, India
4 Laboratoire de Physique Quantique et de Modelisation
Mathematique (LPQ3M), Departement de Technologie,
Universite de Mascara, 29000 Mascara, Algeria
123
J Theor Appl Phys (2015) 9:221–249
DOI 10.1007/s40094-015-0183-7
diffraction with a diamond anvil cell has identified struc-
tural transformation in 3C SiC [zinc-blende (ZB) (B3)
structure to the rock-salt (B1) structure & 100 GPa] with a
volume collapse of about 20.3 % [3]. The transition is
reversible and the zinc-blende phase is recovered below
35 GPa upon decompression. Furthermore, 6H polytype
SiC is found to be stable up to about 90.0 GPa. Later,
shock compression experiments on 6H SiC show a first-
order phase transition into a sixfold coordinated rock-salt
structure around 105 ± 4 GPa with a volume reduction of
about 15 ± 3 % [4].
Structural and thermal stability as well as high-pressure
behaviour of 3C-SiC has been described both by ab initio
[5–7, 11, 14, 16] and molecular dynamics simulations [8,
10, 15]. Based on ab initio density functional calculations
with the local-density approximation (LDA) show that the
transition pressure of 3C-SiC is around 60 GPa [ZB to rock
salt (RS)] [5–7, 11–14, 16]. Following Perdew–Wang
generalized gradient approximation (GGA) for the
exchange-correlation potential and the Troullier–Martins
pseudopotentials; the transition pressure of SiC at about
63 GPa is predicted [6, 12, 13]. Using the Troullier–Mar-
tins pseudopotentials and the LDA, the phase-transition
pressure of 100 GPa is also documented [7, 14]. It is noted
that first-principles LDA calculations underestimate critical
pressure for structural phase transition.
The constant-pressure molecular dynamics (MD) simu-
lation retraces the reversible phase transformation [3C to
RS] in SiC [8]. The first-principle calculations clearly
demonstrate the structural transformation of SiC from a
fourfold coordinated structure to sixfold coordinated
structure under pressure. The phase transition from the
zinc-blende phase to the RS phase is associated with a
cubic to only one intermediate state as monoclinic unit cell
transformation. Later on, the structural phase transition and
mechanical properties of SiC from the ZB structure to the
RS structure under pressure are investigated in detail by the
first-principles plane-wave pseudopotential density func-
tional theory method [9]. The results on the high-pressure
elastic constants illustrate that the ZB structure SiC is
found unstable when the applied pressure is larger than
126.6 GPa consistent with the experimental data and the
molecular dynamics (MD) simulation results.
The molecular dynamics with effective interatomic
interaction potential for SiC incorporating two-body and
three-body covalent interactions is also proposed. The
covalent characteristics SiC are described by the three-
body potential using modified Stillinger–Weber form. The
molecular dynamics method with the developed interaction
potential is employed to investigate the structural and
dynamical properties of crystalline 3C, amorphous, and
liquid states of SiC for several densities and temperatures
[10, 15]. The phase stability of SiC under high pressure and
behaviour of elastic constants with temperature is worth for
microscopic understanding as well as technological
applications.
The quantum computations based on density functional
theory (DFT) as the full-relativistic version of the full-
potential augmented plane-wave plus local orbitals method
(FP - APW ? lo) are powerful techniques and have the
advantage of elucidating the ground state properties not
only for small atomic systems but also for large molecules
[17]. Density functional theory with approximate local and
semilocal density functionals with nonlocal and long-range
Coulomb interactions are effective for dense molecules and
materials as well as short-range interactions for soft matter,
van der Waals complexes, and biomolecules [18].
The quantum mechanical calculations suggest a favour-
able phase transition into a RS structure with different
transition pressure for 3C SiC. However, these underesti-
mate critical pressure for structural phase transition. We
thus aimed at computing the pressure-induced phase tran-
sition of 3C SiC by formulating an effective interatomic
potential. Note that the determination of ground state
properties of IV–IV compounds with complex bonds based
on lattice dynamical models is not easy. One needs to take
care of experimental data with high accuracy and precision
that accounts for low degree of freedom. The object of the
proposed investigation is to develop a differential model as
well to integrate the observed effect enabling useful pre-
diction with reduced input experimental parameters.
The lattice dynamical models are useful in yielding both
qualitative and quantitative information also with sugges-
tive parameterization of the materials parameter. The
density functional quantum calculations need precisely
structural information as atomic positions and space
groups. It also cares the value of volume around the
experimental volume of the system. The successive itera-
tion is thus made to determine the total energy corre-
sponding to this volume. The thermal equation of state is
needed to determine the ground state structural properties.
It includes the lattice parameters within stable structure, the
bulk modulus and pressure derivatives of elastic constants.
The transition pressure is obtained by the common tangent
between the two pressure–volume curves.
While exploring the ground state and anharmonic prop-
erties of simple and complex molecules, two major meth-
ods, one based on analytical form of cohesion with effective
physical understanding and other based on expensive and
time taking computational methods, are progressive. In the
analytical models with two body interactions, the force
constant deduced does not validate the Cauchy discrepancy.
Incorporating many body interactions in the interaction
potential with different cohesive energy forms is seen as the
relevant potential which validates the Cauchy discrepancy.
It is thus the major objective to seek the importance of both
222 J Theor Appl Phys (2015) 9:221–249
123
charge transfer interactions and covalent nature apart from
zero point energy effects of group IV–IV cubic SiC in the
interaction potential.
While discussing the mechanical and thermodynamical
properties, the lattice dynamical model based on charge
transfer interactions has been found successful [19–26]. The
overlap repulsion potential (extended up to second-neigh-
bour ions) is based on Hafemeister and Flygare [27]. The
short-range interactions as the induced charge dipole–
dipole and charge dipole–quadruple (van der Waals) inter-
action are found to be successful to determine the cohesion
in several alkaline-earth solids [28]. As far as the pressure
(temperature) induced mechanical and elastic properties as
hardness, ductile nature, mechanical stiffening and thermal
softening of SiC ceramics is concerned, these are probably
the first quantitative theoretical prediction of its kind and
still awaits experimental confirmations. Deduced aggregate
Young’s modulus, compression and shear wave velocities
are in agreement with the observed values.
The opportunities offered by SiC ceramics have, there-
fore, motivated large research efforts which in turn have
addressed only structural transitions and elastic, thermal
and thermodynamical properties are still lagging. The
proposed studies are organized in the following sequence.
We first discuss the key assumptions to develop an effec-
tive interatomic potential between a pair of ions. We then
support them by physical arguments for ceramics SiC
followed by an equation of state in ‘‘Computational
methodology’’ section. The Slater–Kirkwood variational
method is employed to determine the induced charge
dipole–dipole and charge dipole–quadruple (van der
Waals) coefficients keeping in mind that both ions (Si and
C) are polarizable. In sequence, we compute phase-transi-
tion pressures, the second-order aggregate elastic constants
within the Shell model. Thus, the importance of long-range
Coulomb with charge transfer interactions, covalent nature
of bonds, charge dipole–dipole and charge dipole–
quadruple (van der Waals) interaction, and the short-range
overlap repulsive interaction up to second-neighbour ions
is validated. In ‘‘Results and discussion’’ section, we dis-
cuss the various elastic properties.
As regard the ceramics 3C SiC, a number of works have
been made on the structural stability of high-pressure
phases but the pressure and temperature-dependent prop-
erties are sparse as normalized volume, aggregate second-
order elastic constants Cij, Bulk modulus BT, Cauchy dis-
crepancy in second-order elastic constant D12, second-order
elastic constant anisotropy c12, melting temperature TM,
aggregate third-order elastic constants Cijk, Cauchy dis-
crepancy Di3 in third-order elastic constant, third-order
elastic anisotropy ci3, isotropic shear modulus GH, Voigt’s
shear modulus GV, Reuss’s shear modulus GR, Young’s
modulus E, Poisson’s ratio m and Pugh ratio / (=BT/GH)
leading to ductility (brittleness), Lame’s constant k and l,and elastic wave velocity vl and vs.
The anharmonic effects on SiC lattice are further studied
by investigating the Gruneisen parameter cG, isothermal
compressibility b, Debye temperature hD, hardness HV,
heat capacity Cv, and thermal expansion coefficient ath.exp.either in ZB or RS structures. The relevant expressions are
documented in Appendix 1 and 2. We also provide a
comparison of computed values with observed experi-
mental and other theoretical studies. The major conclusions
are presented in ‘‘Concluding remarks’’ section.
Computational methodology
To study the phase stability and the aggregate elastic con-
stants of SiC under high pressures, we formulate an inter-
atomic potential. The proposed interaction potential is based
on the following assumptions: variations in force constants
of Si and C are small, the short-range interactions between Si
and C atoms are effective up to their second-neighbour ions,
and harmonic elastic forces are viable for a pair of atoms
without any internal strains within the crystal. Application of
mechanical pressure as external variable causes an increase
in the overlap of adjacent ions in a crystal. The result is a
charge transfer takes place between the overlapping electron
shells of Si and C atoms. The transferred charges interact
with neighbouring charges around the lattice via Coulomb’s
law. Also, the chemical bonds in SiC are both ionic and
covalent in nature and the application of pressure causes
change in crystal structure (first-order structural phase
transition), volume collapse and elastic properties.
The proposed interatomic potential is thus a route to
discuss the structural transitions, mechanical properties in
particularly, about stiffness, softeness, ductile, brittle nat-
ure, elastic constants anisotropy, compression and shear
elastic wave velocity. In addition, the potential is predictive
to explain the validity of non-central forces and anhar-
monicity from thermodynamical properties namely Debye
temperature, heat capacity and thermal expansion coeffi-
cient of 3C SiC. At zero pressure and variable temperature,
the underlined effective interatomic potential also
describes some of the temperature-induced thermal and
thermodynamical properties of 3C SiC.
The effective interatomic potential at ambient pressure
invokes an isolated stable phase when the crystal free
energy is minimized for the specified thermodynamic
conditions. For this purpose, if the variables such as tem-
perature, pressure or magnetic field applied on the crystal
are altered, either the free energy changes smoothly and
continuously or discontinuously. Variations in free energy
cause structural phase transition. The SiC ceramics trans-
form from their initial B3 to B1 structure under pressure.
J Theor Appl Phys (2015) 9:221–249 223
123
The minimum Gibbs’s free energy, G, infers the stability of
a particular structure. Herein, Gibbs’s free energy,
G = U ? PV - TS. The notations are: U is internal
energy, which at 0 K is the cohesive energy, S is the
vibrational entropy at absolute temperature T, pressure
P and volume V. The thermodynamically stable phase at a
given pressure P and at zero temperature is the one with
lowest enthalpy. The thermodynamical potential is thus the
Helmholtz free energy (H).
The interatomic potential with pressure or temperature
as thermodynamical variable requires the estimation of the
Gibbs’s free energies for ZnS (B3) phase and NaCl (B1)
phase. We use Born equation: GB3(r) = UB3(r) ? 3.08Pr3
for ZnS (B3) phase and GB1(r0) = UB1(r
0) ? 2Pr03 for
NaCl (B1) phase. At phase-transition pressure P and at zero
temperature: GB1 = GB3 [29]. The notations UB3 (r) infer
the total potential energy of ZnS (B3) phase and UB1 (r0) as
total potential energy for the RS (B1) phase. The unit cell
volumes are VB3 (=3.08r3) and VB1 (=2 r03). The nearest
neighbour distance is r (r0) in ZB (RS) structure. The total
potential energy for ZnS (B3) and NaCl (B1) phases is
UB3 ¼ ð�aMZe2=rÞ Z þ 2nf ðrÞ½ � � Cr�6 � Dr�8
þ nbbij exp ri þ rj � rij� �
=q� �
þ n0b=2ð Þ bii exp 2ri � krij� �
=q� ��
þbjj exp 2rj � krij� �
=q� ��
þ f�h\x2 [ 1=2=2h i
ð1Þ
UB1¼ð�a0
MZe2=r0Þ Zþ2mf ðr0Þ½ ��Cr0�6�Dr0�8
þmbbij exp riþrj�r0
ij
� �=q
h i
þ m0b=2ð Þ biiexp 2ri�k0r0
ii
� �=q
� �h
þbjj exp 2rj�k0r0
jj
� �=q
� �iþ f�h\x2[1=2=2gh i
ð2Þ
Due to complex nature of bonds in SiC, the ionic charge
for Si and C atom cannot be determined uniquely. The
calculation of the Madelung energy is thus modified by
incorporating the covalency effects [10, 15, 30, 31]. The
charge in above equations is thus written incorporating the
polarization of a spherical shaped dielectric in displacing
the constituent positive ions. The charge transfer interac-
tions caused by the deformation of the electron shells of the
overlapping ions and the covalency effects are the major
attributes of long-range Coulomb effects. The IV–IV
semiconducting compound contains covalent bonds so that
some electrons are distributed over the region between
neighbouring atoms; in such situation the interaction ener-
gies are attributed from the contribution of charge dipole-
dipole and charge dipole-quadruple terms. The induced
charge dipole–dipole and charge dipole–quadruple (van der
Waals) interactions are the third and fourth terms which are
the short-range vdW attractive potential energies.
The fifth and sixth terms are the short-range overlap
repulsive energies. This is due to the overlap repulsion
between ij, ii and jj ions. The Madelung constants for B3
(B1) phases are represented by am (am0). bij symbolized for
Pauling coefficient and is defined as bij = 1 ? (Zi/
ni) ? (Zj/nj) with Zi(Zj) and ni(nj) as the valence and the
number of electrons in the outermost orbit. The numbers of
the nearest unlike n (=4) and like n0 (=6) neighbours are forB3 (ZnS). Similarly, numbers of the nearest unlike m (=6)
and like m0 (=6) are for B1 (NaCl) structure. The Ze is
being the ionic charge, k (k0) is the structure factor for B3
(B1) structures, and b (q) is the hardness (range) parame-
ters. We denote the nearest neighbour ion separations as
r (r0)for B3 (B1) structures.
The last term in Eqs. 1 and 2 is the lowest possible
energy of the system and is due to the zero point energy.
Here, \x2[1/2 (=kBhD/�h) is the mean square frequency
related to the Debye temperature hD. The Debye temper-
ature can be known either from Heat capacity measure-
ments or from the Bulk modulus value using hD = (�h/
kB)H(5r0BT/l). Herein, r0, B and l are the equilibrium
distance, Bulk modulus and reduced mass of the com-
pounds. Henceforth, model potential for ground state
incorporates the attractive, repulsive and zero point energy.
We use the variational approach to deduce the overall
vdW coefficients C (charge dipole–dipole) and D (charge
dipole–quadruple) [32]. The short-range vdW coefficients
due to induced charge dipole–dipole and charge dipole–
quadruple interactions caused by Si atom and C atom are
cij ¼3
2
e�hffiffiffiffiffiffime
p aiajaiNi
1=2
þ ajNj
1=2" #�1
; ð3Þ
dij ¼27
8
�h2
me
aiajaiNi
1=2
þ ajNj
1=2" #2
aiNi
þ 20
3
aiajNiNj
1=2
þ ajNj
" #�1
:
ð4Þ
cii ¼3
2
e�hffiffiffiffiffiffime
p aiaiaiNi
1=2
þ aiNi
1=2" #�1
; ð5Þ
dii ¼27
8
�h2
me
aiaiaiNi
1=2
þ aiNi
1=2" #2
aiNi
þ 20
3
aiaiNiNi
1=2
þ aiNi
" #�1
ð6Þ
cjj ¼3
2
e�hffiffiffiffiffiffime
p ajajajNj
1=2
þ ajNj
1=2" #�1
; ð7Þ
djj ¼27
8
�h2
me
ajajajNj
1=2
þ ajNj
1=2" #2
ajNj
þ 20
3
ajajNjNj
1=2
þ ajNj
" #�1
:
ð8Þ
In the above equations, the notations: me, e and Z are
mass of the electron, charge and valence of the
224 J Theor Appl Phys (2015) 9:221–249
123
constituent metallic element, respectively. The symbols
ai,and aj represent the polarizabilities of ith and jth ion,
respectively. The effective number of electrons responsi-
ble for polarization is symbolized by Ni and Nj. The lat-
tice sums Sij and Tij enable one to compute the overall
vdW coefficients C and D in terms of c and d values
determined from Eqs. 1 to 8. The lattice sums Sij, and Tijare expressed as [28]:
C ¼ cijSij þ ciiSii þ cjjSjj ð9Þ
D ¼ dijTij þ diiTii þ djjTjj ð10Þ
SiC is a tetrahedrally coordinated covalent material and
the complex chemical bonding corroborate both ionic and
covalent nature. The Coulomb interaction between ions of
Si and C atoms leads to charge transfer interactions.
Apart from this, the covalent character of bond bending
and stretching also needs to be incorporated in the
potential. Thus, the second term in Eqs. 1 and 2 is an
algebraic sum of non-central many body forces as the
charge transfer force parameter and the force parameter
arise due to covalent nature i.e. f(r) = fcti ? fcov. The
charge transfer between ions of Si and C atoms is denoted
in terms of a force parameter fcti and is expressed as [27,
33, 34]:
fcti ¼ f0 expð�r=qÞ ð11Þ
Here, ri (rj) is the ionic radii of i(j) ion.
The complex chemical bonding in IV–IV semicon-
ducting compounds infers SiC as partially ionic and par-
tially covalent in bonding. The attractive forces due to
covalent nature thus modify the charge and are now the
effective charge. The polarization effects originate from
changes in covalency due to Si–Si, Si–C, and C–C inter-
acting electric fields. The covalency term in the interaction
potential is thus expressed as [30, 31]:
fcov rð Þ ¼4e2V2
spr
r0E3g
ð12Þ
Here, Vspr represents the transfer matrix element
between the outermost p orbital and the lowest excited of
s state. The transfer energy of electron from p to the s
orbital is denoted as Eg. The effective charge eS* of SiC is
related with the number of electrons transferred to the
unoccupied orbitals from its surrounding nearest neigh-
bour. The electron density is thus nc = 1 - eS*/e. Thus, in
SiC for overlap distortion effect eS*= e. The transfer
matrix element Vspr and the transfer energy Eg are related
to electron density as nc/12 % Vspr2 /Eg
2. The effective
charge eS* is thus
V2spr
E2g
¼ 1� e�s12
ð13Þ
The transfer energy Eg is
Eg ¼ E � I þ 2a� 1ð Þ e2
rð14Þ
Here, E is the electron affinity for C and I is the ioni-
sation potential of constituent atom.
The Szigeti effective charge eS* (=Ze)* is written in terms
of the optical static dielectric constant e0 and the high
frequency dielectric constant e? as [19–26]:
e�2s ¼ 9lx2TOðe0 � e1Þ
4pNkðe1 þ 2Þ2ð15Þ
and
e�2se2
¼ 9Vlx2TOðe0 � e1Þ
4pe2ðe1 þ 2Þ2ð16Þ
The symbol l is the reduced mass, Nk is the number of
atoms present per unit cell volume i.e. Nk = 1/V, xTO is
the long wavelength transverse optical phonon frequency.
Thus, for 3C SiC eS* deviates from e and is attributed to
covalent nature of Si–Si, Si–C, and C–C bonds.
Usually materials document a transition when the ther-
modynamical potential relevant to the given ensemble of
the lower pressure phase equals that for some other struc-
ture in the absence of any barrier. The low pressure phase
becomes the stable phase above this coexistence pressure.
After determining the stable phase we also compute the
higher order elastic constants, their pressure derivatives
and anisotropy. The Appendix 1 illustrates the essential
equations for the higher order elastic constants and their
pressure derivatives. With these understanding of inter-
atomic potential in SiC, we have four material parameters,
namely, modified ionic charge, hardness, range, force
parameter [Zm, b, q, f(r)]. Values of them can be deduced
from equilibrium conditions [35–42].
Results and discussion
The application of pressure, temperature and magnetic field
probably transforms materials from one structure to another.
The relative stability of two crystal structures requires an
extremely accurate prediction. The interatomic interaction
potential with charge transfer interactions caused by ions of
Si and C atom and covalent nature of Si–Si, Si–C, and C–C
bonds are effective in studying the structural phase transi-
tions and elastic properties of tetrahedrally coordinated
ceramics 3C SiC. We evaluate the phase transition pressure
by computing the Gibbs free energyG = U ? PV - TS for
the ZB and RS phases. We note that the Gibbs free energy is
thus the enthalpy H (=U ? PV) at T = 0 K.
While doing high-pressure experiments, the huge
applied pressure causes a reduction of the material volume.
J Theor Appl Phys (2015) 9:221–249 225
123
The temperature variations during the experiments will
normally produce much smaller changes in the relative
stabilities of different phases. Thus, the Gibbs free energy
at zero temperature, which is the enthalpy H, is measured.
The thermodynamically stable phase of crystal at 0 K and
at ambient pressure P is the one with the lowest enthalpy.
Thus, the zero-temperature theoretical calculations are
valid with experiment. In a situation when temperature
variations are large during experiment for certain materials
the effects of finite temperature may be significant. With
these assumptions, we investigate structural and elastic
properties of SiC in an ordered way.
The thermodynamical potential G or H in SiC is com-
puted involving modified ionic charge, hardness, range and
charge transfer parameters [Zm, b, q, f(r)] as [35–42]:
dUðrÞdr
����
����r¼r0
¼ 0 ð17Þ
Also, the bulk modulus (BT):
d2UðrÞdr2
����
����r¼r0
¼ ð9kr0Þ�1BT ð18Þ
We first deduce vdW coefficients C and D involved in
expressions (1) and (2) from the Slater–Kirkwood variational
method [32], for 3C SiC ceramics material parameters, and
are enlisted in Table 1. The charge dipole–dipole and charge
dipole–quadruple vdW coefficients are influenced by elec-
tronic polarizabilities. The polarizability values have been
obtained from least-squares fit of experimental refraction
data using additive rule and a Lorentz factor of 4p/3 [43, 44].We consider that the SiC to be partially ionic and covalent to
discuss their structural, mechanical, elastic and thermody-
namical properties in a systematic manner.
As a next step, we use the experimental data on lattice
constant (a) [45], the bulk modulus (BT) [46], ionic (Ze),
effective charge (es*) and the second-order aggregate elastic
constant C12 (C44) [47] for determining the material
parameters. Deduced values of hardness (b), range (q)parameter, and non-central many body forces arising due to
charge transfer (fcti) and covalency (fcov) for 3C SiC ceramics
are illustrated in Table 1. The effective charge eS* depends on
the values of optical dielectric constant es and the high fre-
quency dielectric constant e?. The value of long wave length
transverse optical phonon frequency xTO is taken from [48]
to have the effective charge eS* and hence the covalency
contribution.
We then minimize the Gibbs’s free energies GB3(r) and
GB1(r0) for the equilibrium interatomic spacing (r) and (r0)
to determine structural phase transition of SiC. Table 1
shows the optimized values of equilibrium interatomic
spacing in B3 and B1 phases. The Gibbs’s free energy
GB3(r) [GB1(r0)] as functions of pressure (P) for SiC is
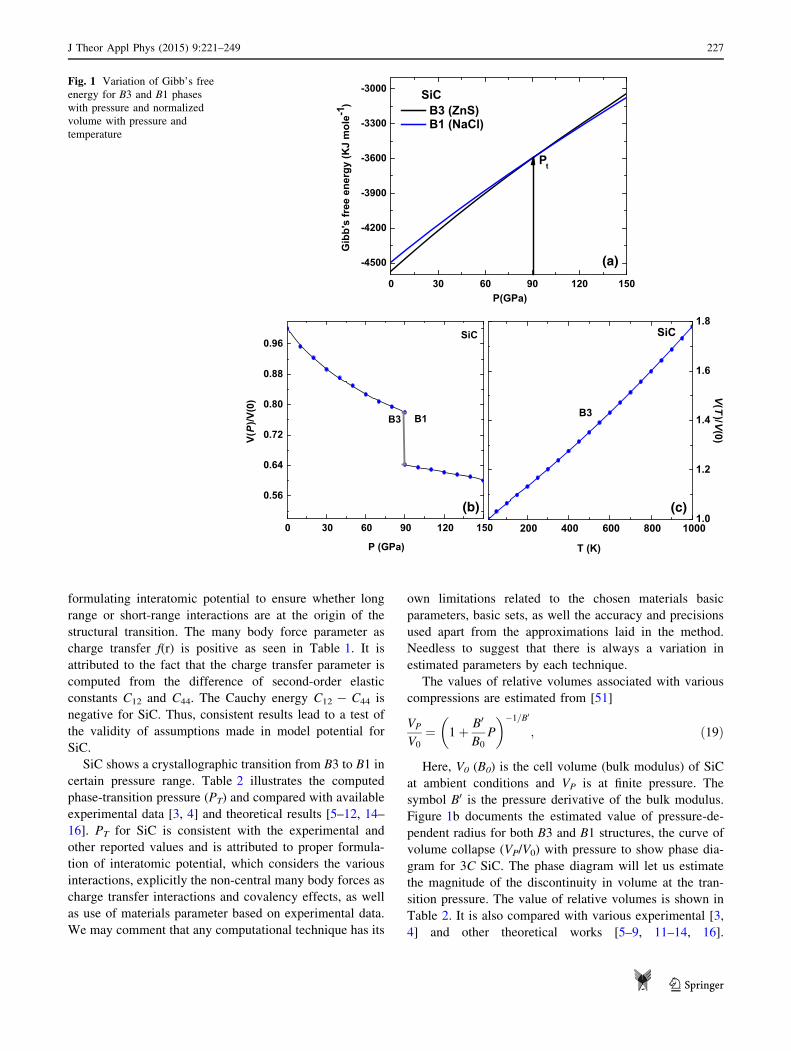
discerned in Fig. 1a. At zero pressure, the Gibb’s free
energy for SiC in B3 crystal phase is more negative. Thus,
at zero pressure SiC in B3 phase is thermodynamically and
mechanically stable, while the B1 is not. On the other hand,
above the phase transition pressure (PT = 90 GPa), the
Gibb’s free energy for B1 system becomes more negative
than B3 phase, implying B1 phase will be more stable. The
cohesive energy per particle is obtained as 6.301 eV for
3C SiC which is consistent with earlier experimental value
of 6.34 eV [49]; 7.415 eV from ab initio density functional
calculations and molecular dynamics method yields
6.3410868 eV for SiC [50].
The phase stability of cubic 3C SiC under high pressures
is essentially based on material parameters namely hard-
ness (b), range (q), non-central many body forces as charge
transfer force (fcti) and covalency parameter (fcov). These
are obtained from the experimental data. We comment that
the available data based on one kind of experiment depend
on the conditions of measurement. Henceforth, while
developing a theory, one faces certain complications and
one need to find suitable data that varies from technique to
technique. For SiC, we pay special attention while
Table 1 Estimated and input crystal data: vdW coefficients [cii, cij,
cjj, C, dii, dij, djj, D], lattice constant (a0), bulk modulus (BT), second-
order elastic constant C12 (C44), optimized value of ionic radii ri (rj),
hardness (b), range (q), charge transfer parameter f (r), equilibrium
distance: r0 (B3); r00 (B1), Gibbs’s free energy: GB3(r); GB1(r)
Input parameters SiC
cii (10-60 erg cm6) 28.76
cij (10-60 erg cm6) 0.71
cjj (10-60 erg cm6) 0.047
C (10-60 erg cm6) 14.07
dii (10-76 erg cm8) 14.284
dij (10-76 erg cm8) 0.297
djj (10-76 erg cm8) 0.002718
D (10-76 erg cm8) 3.019
a0 (A) 4.36 [45]
BT (GPa) 227.0 [46]
C12 (GPa) 142.0 [47]
C44 (GPa) 256.0 [47]
ri (A) 0.42
rj (A) 1.162
b (10-12 erg) 7.512
q (10-9 cm) 3.29
f (r) (10-3) 5.267
Equilibrium distance (A) r0 (B3) 1.89
Equilibrium distance (A) r00 (B1) 2.11
Gibb’s free energy (kJ mol-1) GB3(r) -4570
Gibb’s free energy (kJ mol-1) GB1(r) -4498
226 J Theor Appl Phys (2015) 9:221–249
123
formulating interatomic potential to ensure whether long
range or short-range interactions are at the origin of the
structural transition. The many body force parameter as
charge transfer f(r) is positive as seen in Table 1. It is
attributed to the fact that the charge transfer parameter is
computed from the difference of second-order elastic
constants C12 and C44. The Cauchy energy C12 - C44 is
negative for SiC. Thus, consistent results lead to a test of
the validity of assumptions made in model potential for
SiC.
SiC shows a crystallographic transition from B3 to B1 in
certain pressure range. Table 2 illustrates the computed
phase-transition pressure (PT) and compared with available
experimental data [3, 4] and theoretical results [5–12, 14–
16]. PT for SiC is consistent with the experimental and
other reported values and is attributed to proper formula-
tion of interatomic potential, which considers the various
interactions, explicitly the non-central many body forces as
charge transfer interactions and covalency effects, as well
as use of materials parameter based on experimental data.
We may comment that any computational technique has its
own limitations related to the chosen materials basic
parameters, basic sets, as well the accuracy and precisions
used apart from the approximations laid in the method.
Needless to suggest that there is always a variation in
estimated parameters by each technique.
The values of relative volumes associated with various
compressions are estimated from [51]
VP
V0
¼ 1þ B0
B0
P
�1=B0
; ð19Þ
Here, V0 (B0) is the cell volume (bulk modulus) of SiC
at ambient conditions and VP is at finite pressure. The
symbol B0 is the pressure derivative of the bulk modulus.
Figure 1b documents the estimated value of pressure-de-
pendent radius for both B3 and B1 structures, the curve of
volume collapse (VP/V0) with pressure to show phase dia-
gram for 3C SiC. The phase diagram will let us estimate
the magnitude of the discontinuity in volume at the tran-
sition pressure. The value of relative volumes is shown in
Table 2. It is also compared with various experimental [3,
4] and other theoretical works [5–9, 11–14, 16].
-4500
-4200
-3900
-3600
-3300
-3000
Gib
b's
free
ene
rgy
(KJ
mol
e-1)
Pt
SiC
P(GPa)
B3 (ZnS) B1 (NaCl)
(a)
0.56
0.64
0.72
0.80
0.88
0.96
(b)
SiC
B1B3
V(P
)/V(0
)
P (GPa)
0 30 60 90 120 150
0 30 60 90 120 150 200 400 600 800 10001.0
1.2
1.4
1.6
1.8
B3
(c)
V(T
)/V(0)
SiC
T (K)
Fig. 1 Variation of Gibb’s free
energy for B3 and B1 phases
with pressure and normalized
volume with pressure and
temperature
J Theor Appl Phys (2015) 9:221–249 227
123
Compressions in SiC at higher pressure indicate the
mechanical stiffening of lattice.
Figure 1c discerns the variation of VT/V0 as functions of
temperature in B3 phase. Here, VT symbolizes the volume
at various temperatures and V0 at zero temperature and zero
pressure volumes, respectively. A steep increase in the
ratio VT/V0 with increasing temperature infers expansion of
SiC lattice and is susceptible to temperature. On the other
hand, SiC is compressed at higher pressures as shown in
Fig. 1b. Henceforth, SiC lattice is thermally softened and
mechanical stiffened. The normalized volume VT/V0
dependences on temperature are not known for SiC, but the
present behaviour is consistent with available experimental
[52] and theoretical [53] data on Li2O.
The response of any material that undergoes stress,
deforms and then recovers and returns to its original shape
after stress ceases leads to the determination of elastic
properties. The elastic properties are vital in generating
information about the binding characteristic between
adjacent atomic planes, anisotropic character of binding
and structural stability. Apart from the structural stability
of SiC in ZnS (B3) and NaCl (B1) structures, we now
compute the aggregate elastic constants at normal and
under hydrostatic pressure. Deduced values are docu-
mented in Table 2.
Using the stress–strain coefficients, one determines the
second-order aggregate elastic constants Cij under hydro-
static pressure with respect to finite strain. Also, proper
parametrization of Coulomb, non-central many body for-
ces, overlap repulsion, van der Waals interactions and zero
point energy terms are essentially required.
The cubical symmetry of SiC dealt with three inde-
pendent elastic constants Cij. C11 is a response of resistance
to deformation by a stress applied on (1,0,0) plane with
polarization in the direction\100[. C11 probes elasticity in
length and a longitudinal strain produces a change in C11.
C44 refers to the measurement of resistance to deformation
with respect to a shearing stress applied across the (100)
plane with polarization in the\010[direction. C12 and C44
are related to the elasticity in shape, which is a shear
constant. A transverse strain causes a change in shape
without a change in volume and hence C12 and C44 are less
sensitive of pressure as compared to C11.
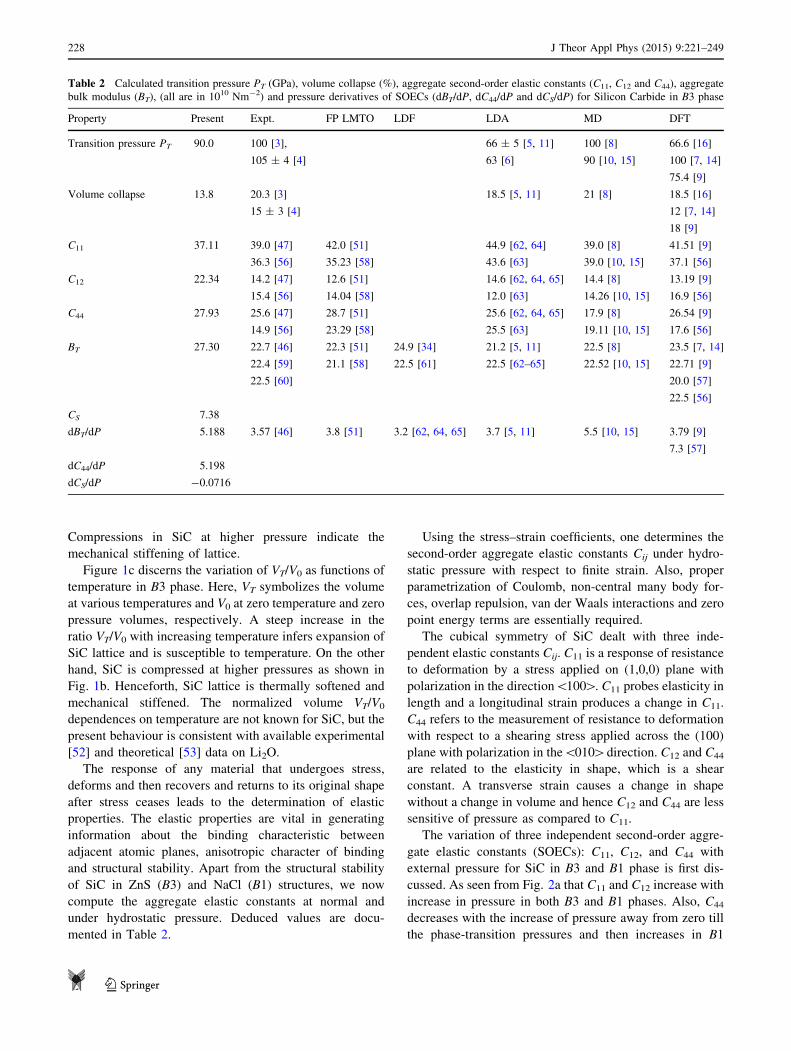
The variation of three independent second-order aggre-
gate elastic constants (SOECs): C11, C12, and C44 with
external pressure for SiC in B3 and B1 phase is first dis-
cussed. As seen from Fig. 2a that C11 and C12 increase with
increase in pressure in both B3 and B1 phases. Also, C44
decreases with the increase of pressure away from zero till
the phase-transition pressures and then increases in B1
Table 2 Calculated transition pressure PT (GPa), volume collapse (%), aggregate second-order elastic constants (C11, C12 and C44), aggregate
bulk modulus (BT), (all are in 1010 Nm-2) and pressure derivatives of SOECs (dBT/dP, dC44/dP and dCS/dP) for Silicon Carbide in B3 phase
Property Present Expt. FP LMTO LDF LDA MD DFT
Transition pressure PT 90.0 100 [3],
105 ± 4 [4]
66 ± 5 [5, 11]
63 [6]
100 [8]
90 [10, 15]
66.6 [16]
100 [7, 14]
75.4 [9]
Volume collapse 13.8 20.3 [3]
15 ± 3 [4]
18.5 [5, 11] 21 [8] 18.5 [16]
12 [7, 14]
18 [9]
C11 37.11 39.0 [47]
36.3 [56]
42.0 [51]
35.23 [58]
44.9 [62, 64]
43.6 [63]
39.0 [8]
39.0 [10, 15]
41.51 [9]
37.1 [56]
C12 22.34 14.2 [47]
15.4 [56]
12.6 [51]
14.04 [58]
14.6 [62, 64, 65]
12.0 [63]
14.4 [8]
14.26 [10, 15]
13.19 [9]
16.9 [56]
C44 27.93 25.6 [47]
14.9 [56]
28.7 [51]
23.29 [58]
25.6 [62, 64, 65]
25.5 [63]
17.9 [8]
19.11 [10, 15]
26.54 [9]
17.6 [56]
BT 27.30 22.7 [46]
22.4 [59]
22.5 [60]
22.3 [51]
21.1 [58]
24.9 [34]
22.5 [61]
21.2 [5, 11]
22.5 [62–65]
22.5 [8]
22.52 [10, 15]
23.5 [7, 14]
22.71 [9]
20.0 [57]
22.5 [56]
CS 7.38
dBT/dP 5.188 3.57 [46] 3.8 [51] 3.2 [62, 64, 65] 3.7 [5, 11] 5.5 [10, 15] 3.79 [9]
7.3 [57]
dC44/dP 5.198
dCS/dP -0.0716
228 J Theor Appl Phys (2015) 9:221–249
123
phase. Similar observations have earlier been reported in
SiC [9, 10, 15]. A crossover of C12 and C44 in CaS has also
been reported [54]. At phase transition pressures, SiC has
witnessed a discontinuity in aggregate second-order elastic
constants Cij, which identifies the first-order phase transi-
tion. Thus, the proposed interaction potential incorporating
charge transfer interactions ions of Si and C atom and
covalency effects caused by Si–Si, Si–C, and C–C bonds
consistently explains the high-pressure elastic behaviour.
The variations in Cij with temperatures (T) for 3C SiC
ceramics are plotted in Fig. 2b. It can be seen that the
aggregate elastic constants Cij (T) decrease linearly with
the temperature in ZB phase. We note that the pressure
dependence of aggregate elastic constants Cij (P) docu-
ments an increasing trend (please see Fig. 2a). The physi-
cal interpretation of temperature dependence of Cij showed
that (a) values of C11 decrease more steeply with enhancing
temperature, (b) C12, and C44, are less sensitive to tem-
perature for 3C SiC ceramics, (c) C11 is remarkably larger
than C12, and C44, and (d) values of all aggregate elastic
constants Cij are influenced by temperature dependence
indicating that anharmonicity is substantial. Deduced val-
ues of Cij with temperatures (T) are documented in Table 3
along with the available data on SiC at room temperature
[55]. From the second-order aggregate elastic constants
pressure and temperature-dependent behaviour, we com-
ment that SiC lattice is mechanical stiffened and thermally
softened.
Born criterion for a lattice to be mechanically stable
infers that the elastic energy density must be a positive
definite quadratic function of strain. The principal minors
(alternatively the eigenvalues) of the elastic constant
matrix should all be positive at ambient conditions. The
mechanical stability conditions for a crystal suggest that
elastic constants of a cubic crystal are as follows [29],
BT ¼ C11 þ 2C12ð Þ=3[ 0; ð20ÞC11;C44 [ 0; ð21Þ
and
CS ¼ ðC11 � C12Þ=2[ 0: ð22Þ
Here, Cij are conventional aggregate elastic constants
and BT is bulk modulus. We represent, C44 and CS as the
shear and tetragonal moduli of a cubic crystal.
Table 2 illustrates the computed values of bulk modulus
(BT), shear moduli (C44) and tetragonal moduli (CS) which
validates the elastic stability criteria for 3C SiC in B3
phase. The second-order elastic constants critically depend
upon pressure leading to C12 - C44 = 0. The mechani-
cally stable phases for cubic crystal satisfy the Born cri-
teria: C12 - C44[ 0. The validity of above is readily seen
by referring to Eqs. 51 and 52 for C12 and C44. The equi-
librium condition leads to B1 ? B2 = -1.261Zm2 with
emphasis on charge transfer interactions as well as cova-
lency effects. For optimized values of ri (rj) the Cauchy
discrepancy C12 - C44 is nonzero at zero pressure and at
zero temperature. It is also valid when the many body non-
central forces are not involved in long-range forces. The
short-range and long-range effects are naturally of similar
order of magnitude. This is due to the fact Cij are calculated
at optimized values of equilibrium distances rather than at
experimental values.
Table 2 illustrates the calculated values of pressure
derivatives of aggregate second-order elastic constants
(dBT/dP, dC44/dP and dCS/dP). These are compared with
available experimental [46, 47, 56] and theoretical studies
[8–10, 15, 46, 57–65]. For mechanical stability, the shear
elastic constant C44 is nonzero and is known by combining
mechanical stability with minimum energy conditions. The
high-pressure stability also suggests that the stable phase of
0
4
8
12
16
20
(a)
B1B3
Cij
(10
11N
m-2
)
C11 C12 C44
P(GPa)
SiC
0 30 60 90 120 150 200 400 600 8000.0
1.5
3.0
4.5
6.0
7.5
9.0
B3
(b)
C11C12C44
SiC
Cij (10
11 N m
-2)
T (K)
Fig. 2 Variation of aggregate
second-order elastic constants
(Cij) with pressure and
temperature
J Theor Appl Phys (2015) 9:221–249 229
123
the crystal possesses the lowest potential energy among the
mechanically stable lattices [66].
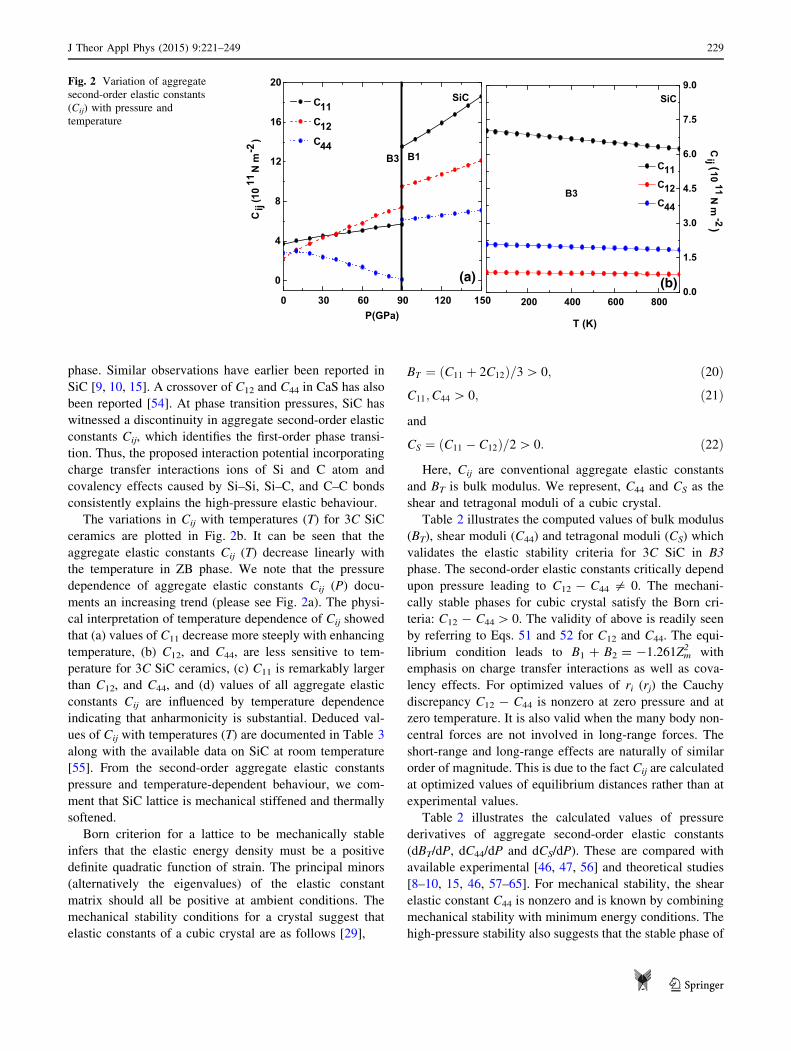
The elasticity in 3C SiC is thus probed by a non-central
many body force potential which assumes that the inter-
atomic forces have a certain shape and directionality. The
Cauchy discrepancy is defined as D12 = C12 - C44 - 2P.
Here, D12 is a measure of the contribution from the non-
central many body force. However, for pure central inter-
atomic potentials, Cauchy relation is C12 = C44 ? 2P.
At zero pressure, the Cauchy discrepancy (D12) in SiC is
about -5.588 9 1010 Nm-2. The D12 further enhances on
increasing the pressure in both phases as depicted in
Fig. 3a. In SiC, larger deviation of D12 essentially points to
the importance of the many body non-central (charge
transfer and covalency) interaction in the interatomic
potential and anharmonic effects are substantial at high
pressures. The strength of non-central many body forces
incorporating charge transfer interactions and covalency
effects is witnessed by significant deviation in D12 at dif-
ferent pressures not only in ZB but also in RS structure,
although weak. The importance of many body non-central
forces and anharmonic effects is further explored by ana-
lysing the higher order elastic constants explicitly the third-
order elastic constants. Usually, the anharmonic effects are
noticeable at high pressure as reflected from elastic con-
stants behaviour.
The anisotropy in second-order elastic constants is
reflected from geophysical activities of various materials
and alloys. The anisotropic parameter c is unity for iso-
tropic elasticity. As far as cubic crystal is concerned,
Table 3 Calculated second-order elastic constant Cauchy discrep-
ancy (D12), anisotropy parameter (ci
2), isotropic shear modulus (GH),
Voigt’s shear modulus (GV), Reuss’s shear modulus (GR), Young’s
modulus (E), Poisson ratio (m), compressibility (b) and Gruneisen
parameter (cG) of Silicon Carbide in B3 phase at zero pressure
Property Present Expt. FP LMTO LDF LDA MD DFT
c12(1010 Nm-2) -0.736
D12 (1010 Nm-2) -5.588
GH (1010 Nm-2) 16.47 19.2 [60] 21.9 [50]
16.9 [58]
12.37 [10, 15] 14.1 [56]
GV (1010 Nm-2) 19.71 23.1 [50]
18.2 [58]
14.6 [56]
GR (1010 Nm-2) 13.22 20.8 [50]
15.7 [58]
13.6 [56]
E (1010 Nm-2) 41.22 44.8 [60] 49.60 [50]
40.1 [58]
56.7 [62, 64, 65]
55.0 [62, 64, 65]
31.36 [10, 15] 35.2 [56]
m 0.249 0.267 [47]
0.168 [60]
0.146 [50]
0.201 [58]
0.268 [10, 15] 1.0 [5, 11]
0.259 [56]
b (10-11 Pa-1) 0.024 0.1518 [5, 11]
cG 1.015 1.01 [61] 1.12 [5, 11]
0 30 60 90 120 150
0
10
20
30
40
50
60
(a)Cau
chy
disc
ripan
cy Δ
2 i(1
011N
m-2
)
B1B3
SiC
P(GPa)0 30 60 90 120 150
-2
0
2
4
6
8
(b)
B1B3
Elastic Anisotropy
(γ 21
)
SiC
P(GPa)
Fig. 3 Variation of Cauchy
discrepancy (D12) and elastic
anisotropy (c12) in second-order
elastic constant (Cij) with
pressure
230 J Theor Appl Phys (2015) 9:221–249
123
although it is isotropic in structure, it has elastic anisotropy
other than unity. This is a consequence of fourth rank
tensor property of elasticity.
We define elastic anisotropic parameter c12 in terms of
aggregate Cij as [67]:
c21 ¼C11 � C12 � 2C44
2C44
ð23Þ
The pressure dependence of the elastic anisotropic
parameter c12 in SiC is shown in Fig. 3b. It is evident that c1
2
in SiC is insensitive below transition pressure and also at
low pressures. A jump has been noted at PT (=90 GPa)
inferring first-order structural phase transition. Further-
more, c12 in SiC remains unaltered for B1 phase for higher
pressures. The value of anisotropic parameter c12 for SiC is
given in Table 4 at T = 0 K and P = 0 GPa.
During mechanical processing, explicitly in fabrication
the melting ranges of materials and alloys are substantial.
The usage of an alloy in the applications as the success of
the melting and casting operations depends on the correct
selection of temperature. Once solidified and primary
processed (rolling or forging), the melting temperature has
little significance to designers, engineers and users. The
melting temperature influences elevated temperature
properties, such as creep strength, but the researchers have
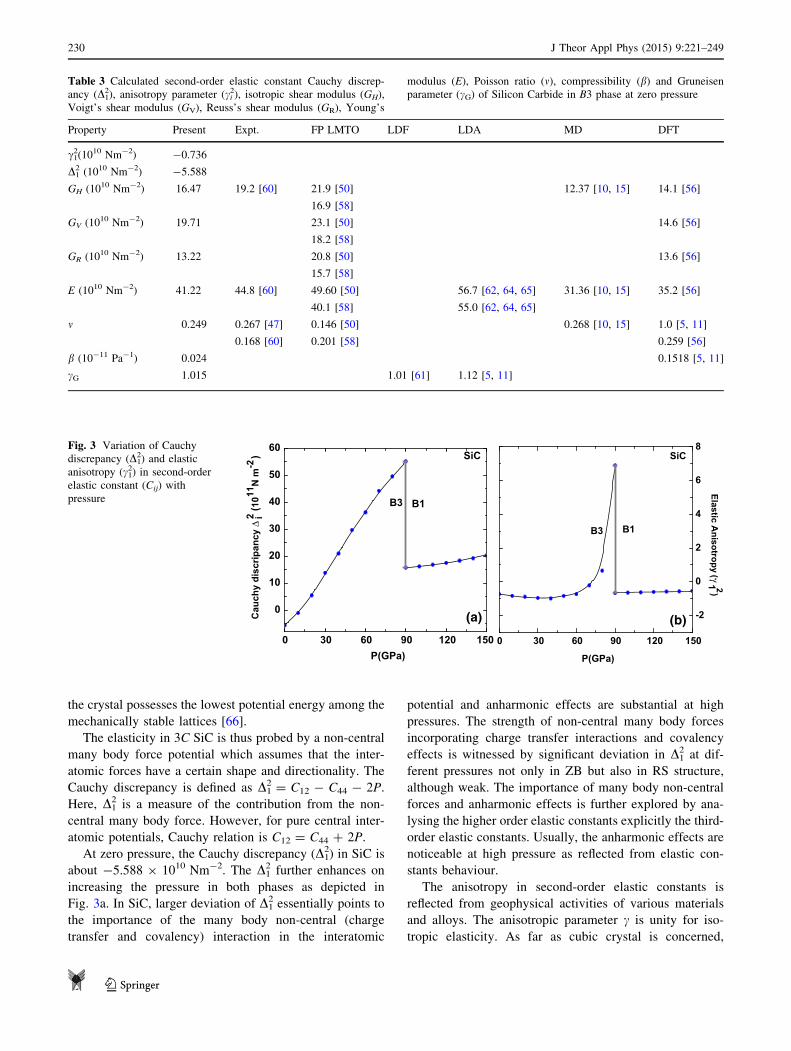
limited interest. The pressure dependence of the melting
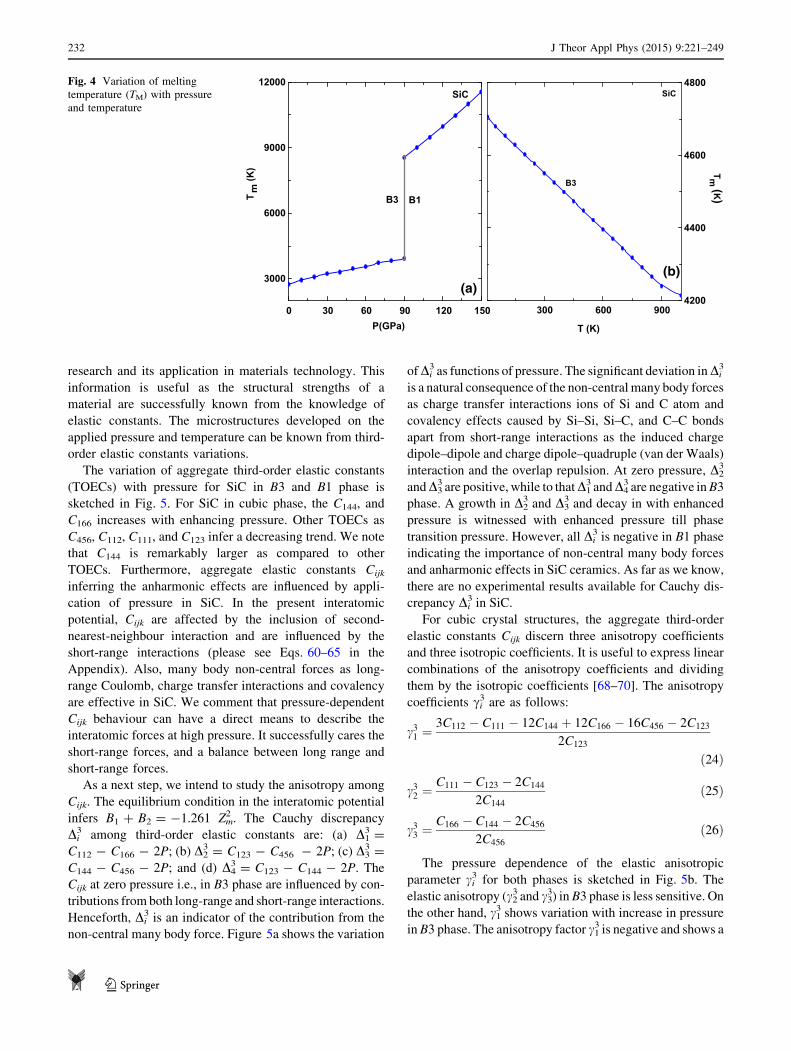
temperature: TM ¼ 553 K þ 5:91C11 K GPa�1 for SiC in
B3 and B1 phase is discerned in Fig. 4. It is noticed that TMenhances with increased pressure or in other words the
resistance to deformation by a stress increases. It is noticed
that at zero pressure, the melting temperature of SiC is
2746 K consistent with reported value of about
3100 ± 40 K [1, 2]. At PT (=90 GPa), its value is about
4000 K which enhances further in B1 phase. An increase in
TM with variations in pressure infers the hardening or
stiffening of the lattice. Higher melting temperature sym-
bolizes higher shear modulus (G), and Young’s modulus
(E) values that we shall see later on. The data on its melting
under high pressure are very limited and extremely con-
tradictory, which does not allow one to make any conclu-
sions about congruent or incongruent melting behaviour as
well as the slope of the melting curve of SiC.
SiC is the only compound in the Si(IV)–C(IV) binary
system and is obtained by electromelting high purity silica
sand with petroleum coke, also of good quality. This
melting takes place at high temperature about 2473 K and
requires a large quantity of energy to produce. It also
requires energy for it to dissociate into about 2/3 Si and 1/3
C in the induction furnace [1, 2]. The better quality raw
materials produce better quality SiC, which is lower in
nitrogen, sulphur, hydrogen and other trace elements.
Figure 4 shows the temperature dependence of the melting
temperature for SiC estimated from the C11 elastic constant
as discussed previously. At room temperature its value is
about 4550 K which drops and is 4200 K at 1000 K in B3
phase. The suppressed TM with increased temperature
indicates that there is a decrease in the resistance to
deformation by a stress induced due to temperature. The
suppressed TM infers the weakening of the lattice as a result
of thermal softening. Usually, SiC does not melt, it actually
dissolves since its melting point is about 2973 K. Its
behaviour in the molten metal is similar to sugar dissolving
in coffee. This aspect is very important for the use of SiC.
For cubic lattice, three second-order elastic constants
and the six non-vanishing third-order elastic constants are
obtained from crystal geometry. The anharmonicity of a
crystal lattice is successfully probed in terms of higher
order elastic constants. The third-order terms in the strain
variables are deduced from derivatives of elastic energy
(please see Appendix for both ZB B3 and RS B1 phases).
For SiC, the third-order aggregate elastic constants C111,
C112, C166, C144, and C456, are negative and only C123 is
positive at P = 0 GPa i.e., in B3 phase. We note that no
such efforts have been made in the past for third-order
elastic constants of SiC. Thus, deduced information on
pressure-dependent Cijk will serve as a guide line for future
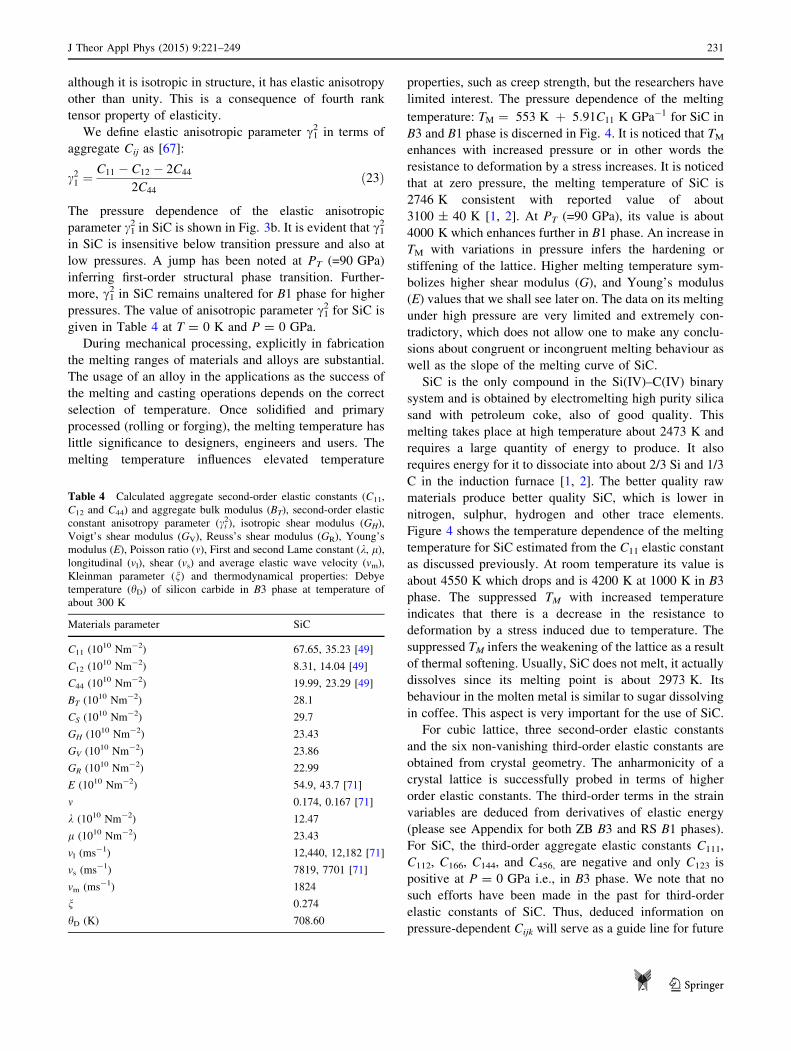
Table 4 Calculated aggregate second-order elastic constants (C11,
C12 and C44) and aggregate bulk modulus (BT), second-order elastic
constant anisotropy parameter (ci2), isotropic shear modulus (GH),
Voigt’s shear modulus (GV), Reuss’s shear modulus (GR), Young’s
modulus (E), Poisson ratio (m), First and second Lame constant (k, l),longitudinal (vl), shear (vs) and average elastic wave velocity (vm),
Kleinman parameter (n) and thermodynamical properties: Debye
temperature (hD) of silicon carbide in B3 phase at temperature of
about 300 K
Materials parameter SiC
C11 (1010 Nm-2) 67.65, 35.23 [49]
C12 (1010 Nm-2) 8.31, 14.04 [49]
C44 (1010 Nm-2) 19.99, 23.29 [49]
BT (1010 Nm-2) 28.1
CS (1010 Nm-2) 29.7
GH (1010 Nm-2) 23.43
GV (1010 Nm-2) 23.86
GR (1010 Nm-2) 22.99
E (1010 Nm-2) 54.9, 43.7 [71]
m 0.174, 0.167 [71]
k (1010 Nm-2) 12.47
l (1010 Nm-2) 23.43
vl (ms-1) 12,440, 12,182 [71]
vs (ms-1) 7819, 7701 [71]
vm (ms-1) 1824
n 0.274
hD (K) 708.60
J Theor Appl Phys (2015) 9:221–249 231
123
research and its application in materials technology. This
information is useful as the structural strengths of a
material are successfully known from the knowledge of
elastic constants. The microstructures developed on the
applied pressure and temperature can be known from third-
order elastic constants variations.
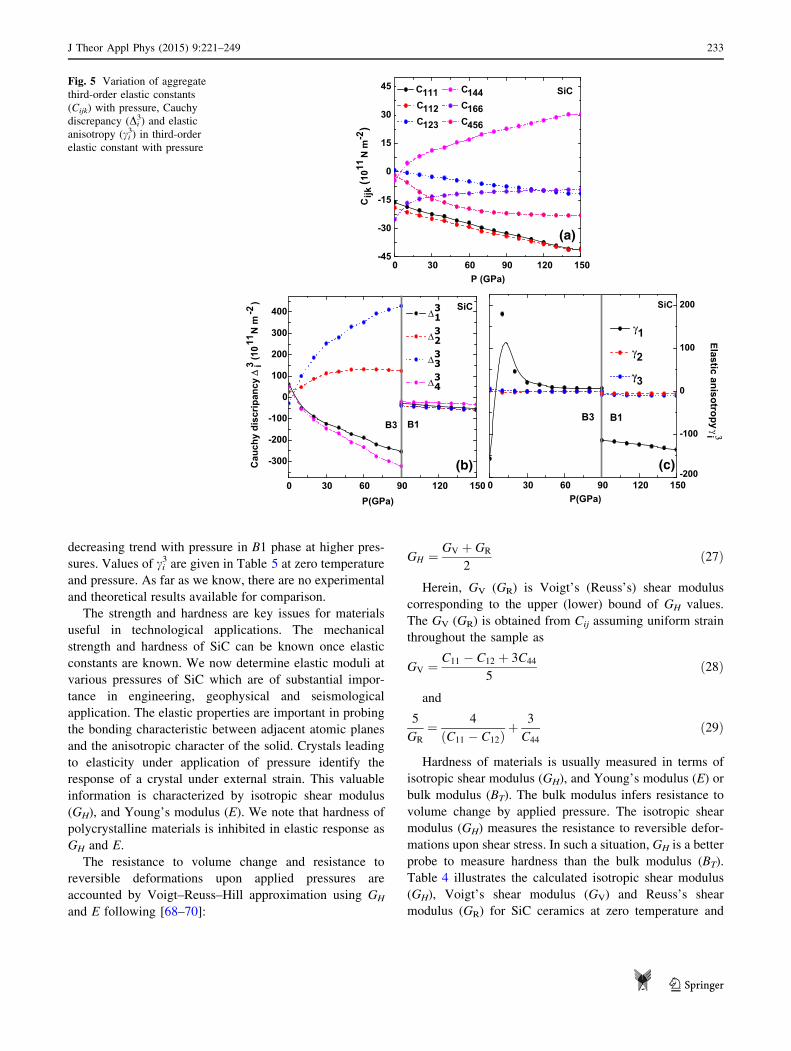
The variation of aggregate third-order elastic constants
(TOECs) with pressure for SiC in B3 and B1 phase is
sketched in Fig. 5. For SiC in cubic phase, the C144, and
C166 increases with enhancing pressure. Other TOECs as
C456, C112, C111, and C123 infer a decreasing trend. We note
that C144 is remarkably larger as compared to other
TOECs. Furthermore, aggregate elastic constants Cijk
inferring the anharmonic effects are influenced by appli-
cation of pressure in SiC. In the present interatomic
potential, Cijk are affected by the inclusion of second-
nearest-neighbour interaction and are influenced by the
short-range interactions (please see Eqs. 60–65 in the
Appendix). Also, many body non-central forces as long-
range Coulomb, charge transfer interactions and covalency
are effective in SiC. We comment that pressure-dependent
Cijk behaviour can have a direct means to describe the
interatomic forces at high pressure. It successfully cares the
short-range forces, and a balance between long range and
short-range forces.
As a next step, we intend to study the anisotropy among
Cijk. The equilibrium condition in the interatomic potential
infers B1 ? B2 = -1.261 Zm2 . The Cauchy discrepancy
Di3 among third-order elastic constants are: (a) D1
3 =
C112 - C166 - 2P; (b) D23 = C123 - C456 - 2P; (c) D3
3 =
C144 - C456 - 2P; and (d) D43 = C123 - C144 - 2P. The
Cijk at zero pressure i.e., in B3 phase are influenced by con-
tributions from both long-range and short-range interactions.
Henceforth, Di3 is an indicator of the contribution from the
non-central many body force. Figure 5a shows the variation
ofDi3 as functions of pressure. The significant deviation inDi
3
is a natural consequence of the non-centralmany body forces
as charge transfer interactions ions of Si and C atom and
covalency effects caused by Si–Si, Si–C, and C–C bonds
apart from short-range interactions as the induced charge
dipole–dipole and charge dipole–quadruple (van der Waals)
interaction and the overlap repulsion. At zero pressure, D23
andD33 are positive, while to thatD1
3 andD43 are negative inB3
phase. A growth in D23 and D3
3 and decay in with enhanced
pressure is witnessed with enhanced pressure till phase
transition pressure. However, all Di3 is negative in B1 phase
indicating the importance of non-central many body forces
and anharmonic effects in SiC ceramics. As far as we know,
there are no experimental results available for Cauchy dis-
crepancy Di3 in SiC.
For cubic crystal structures, the aggregate third-order
elastic constants Cijk discern three anisotropy coefficients
and three isotropic coefficients. It is useful to express linear
combinations of the anisotropy coefficients and dividing
them by the isotropic coefficients [68–70]. The anisotropy
coefficients ci3 are as follows:
c31 ¼3C112 � C111 � 12C144 þ 12C166 � 16C456 � 2C123
2C123
ð24Þ
c32 ¼C111 � C123 � 2C144
2C144
ð25Þ
c33 ¼C166 � C144 � 2C456
2C456
ð26Þ
The pressure dependence of the elastic anisotropic
parameter ci3 for both phases is sketched in Fig. 5b. The
elastic anisotropy (c23 and c3
3) in B3 phase is less sensitive. On
the other hand, c13 shows variation with increase in pressure
in B3 phase. The anisotropy factor c13 is negative and shows a
0 30 60 90 120 150
3000
6000
9000
12000
(a)
Tm
(K)
SiC
B1B3
P(GPa)300 600 900
4200
4400
4600
4800
B3
(b)
Tm(K)
SiC
T (K)
Fig. 4 Variation of melting
temperature (TM) with pressure
and temperature
232 J Theor Appl Phys (2015) 9:221–249
123
decreasing trend with pressure in B1 phase at higher pres-
sures. Values of ci3 are given in Table 5 at zero temperature
and pressure. As far as we know, there are no experimental
and theoretical results available for comparison.
The strength and hardness are key issues for materials
useful in technological applications. The mechanical
strength and hardness of SiC can be known once elastic
constants are known. We now determine elastic moduli at
various pressures of SiC which are of substantial impor-
tance in engineering, geophysical and seismological
application. The elastic properties are important in probing
the bonding characteristic between adjacent atomic planes
and the anisotropic character of the solid. Crystals leading
to elasticity under application of pressure identify the
response of a crystal under external strain. This valuable
information is characterized by isotropic shear modulus
(GH), and Young’s modulus (E). We note that hardness of
polycrystalline materials is inhibited in elastic response as
GH and E.
The resistance to volume change and resistance to
reversible deformations upon applied pressures are
accounted by Voigt–Reuss–Hill approximation using GH
and E following [68–70]:
GH ¼ GV þ GR
2ð27Þ
Herein, GV (GR) is Voigt’s (Reuss’s) shear modulus
corresponding to the upper (lower) bound of GH values.
The GV (GR) is obtained from Cij assuming uniform strain
throughout the sample as
GV ¼ C11 � C12 þ 3C44
5ð28Þ
and
5
GR
¼ 4
C11 � C12ð Þ þ3
C44
ð29Þ
Hardness of materials is usually measured in terms of
isotropic shear modulus (GH), and Young’s modulus (E) or
bulk modulus (BT). The bulk modulus infers resistance to
volume change by applied pressure. The isotropic shear
modulus (GH) measures the resistance to reversible defor-
mations upon shear stress. In such a situation, GH is a better
probe to measure hardness than the bulk modulus (BT).
Table 4 illustrates the calculated isotropic shear modulus
(GH), Voigt’s shear modulus (GV) and Reuss’s shear
modulus (GR) for SiC ceramics at zero temperature and
0 30 60 90 120 150-45
-30
-15
0
15
30
45
(a)
SiC
P (GPa)
Cijk
(1011
N m
-2)
C111 C112 C123
C144 C166 C456
0 30 60 90 120 150
-300
-200
-100
0
100
200
300
400
(b)
P(GPa)
SiC
B1B3
Δ31
Δ32
Δ33
Δ34
Cau
chy
disc
ripan
cy Δ
3 i(1
011N
m-2
)
0 30 60 90 120 150-200
-100
0
100
200
(c)
γ1
γ2
γ3
Elastic anisotropyγ 3i
B1B3
SiC
P(GPa)
Fig. 5 Variation of aggregate
third-order elastic constants
(Cijk) with pressure, Cauchy
discrepancy (Di3) and elastic
anisotropy (ci3) in third-order
elastic constant with pressure
J Theor Appl Phys (2015) 9:221–249 233
123
pressure along with a comparison with the available theo-
retical results [10, 15, 50, 56, 58, 60].
A decreasing and then increasing nature of the isotropic
shear modulus GH, GV and GR is witnessed in B3 phase of
SiC. On the other hand, a steep increase inGH,GV andGR is
seen with enhanced pressure in B1 phase at higher pressures
as plotted in Fig. 6a. The explanation of the above charac-
teristics lies in a fact that both GV and GR are influenced by
aggregate elastic constant C44. Thus, GV decreases as C44
decreases with enhanced pressure in ZnS phase. On the
other hand, Reuss’s shear modulus (GR) pressure-dependent
behaviour is integrated by combination of C11 - C12 pres-
sure-dependent behaviour as well as to that of C44 pressure-
dependent behaviour. GR initially decreases and then starts
increasing at about 30 GPa and is attributed to steep
decrease in C44. We end up by stating that above transition
pressure an increase in GH, GV and GR support our earlier
prediction about mechanical stiffening of lattice.
The high temperature studies of materials at ambient
pressure lead to the performance of a material in terms of
(a) the understanding of vibrational anharmonicity that is
associated with the relative interplay of long-range and
short-range potential energy function, (b) thermal response
in terms of softening or hardening and (c) the elastic
behaviour of materials as the elasticity, extensibility,
acoustic transmission velocity, Debye temperature, specific
heat, and thermal conductivity.
The high temperature investigations cause laboratory
difficulties and structural changes make the phenomenon
more amenable to interpretation. Figure 6b displays the
GH, GV and GR behaviour of 3C SiC ceramics as functions
of temperature (at zero pressure). We note that the isotropic
shear modulus of SiC is decreasing with enhanced tem-
perature. The steep decrease of GH, GV, and GR is in
accordance with aggregate second-order elastic constant Cij
behaviour with temperature. Suppressed GH, GV and GR as
functions of temperature infer the weakening of the lattice
as a result of thermal softening.
The tensile modulus as Young’s modulus (E) further
elaborates the stiffness property. E is also defined in terms
of Reuss’s shear modulus (GH), and bulk modulus (BT):
E ¼ 9GHBT
GH þ 3BT
ð30Þ
The tensile strength as Young’s modulus (E) for 3C SiC
is illustrated in Table 4 for ZnS (B3) phase along with a
comparison with the reported data [10, 15, 50, 55, 56, 60,
62, 64, 65]. The model calculations presented here lead to
E value of about 411 GPa at zero pressure. It is known that
the material is stiffer if its Young’s modulus is high [E of
steel, graphene and diamond is *200, 1000 and
1220 GPa]. As inferred SiC is less stiff as compare to
graphene and diamond. The pressure dependence of the
Young’s modulus (E), of SiC is sketched in Fig. 7a. A
decreasing trend of E in B3 phase infers the weakening of
tensile strength till 90 GPa and an increasing trend of E in
B1 phase essentially identifies more stiffening. Looking to
the wide usage of SiC in gas turbines, heat exchangers,
ceramics fans, radar, microwave, solar cell, and high-
voltage devices, these properties are worth investigating.
Figure 7b illustrates the temperature dependence of the
tensile strength as Young’s modulus (E) for 3C SiC
ceramics. A decreasing trend is inferred with increase in
temperature. Matsumoto and researchers have reported the
Young’s modulus and Poisson’s ratio of SiC ceramics at
temperatures [1400 �C using laser ultrasonics coupled
with Fabry-Perot interferometry as well ultrasonic pulse
method [71]. It is reported that E is about 438 GPa at
T = 273 K and shows a decreasing behaviour with
increasing temperature. The model calculations presented
here lead to a value of about 549 GPa at room temperature
which is comparable to reported E of 437 GPa for 3C SiC
ceramics [71]. A reduction of E with temperature is a
signature of bond weakening or thermal softening.
We now make a comparison of tensile strength
E (P) and E (T) of 3C SiC ceramics. It is noted that
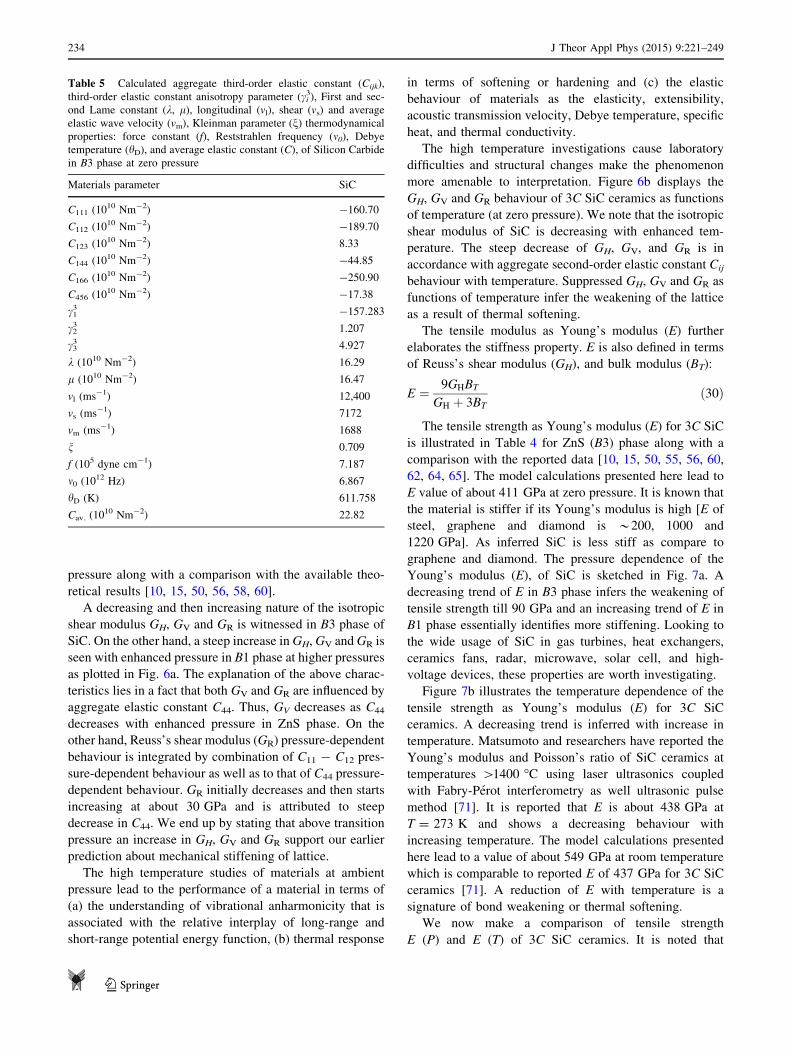
Table 5 Calculated aggregate third-order elastic constant (Cijk),
third-order elastic constant anisotropy parameter (ci3), First and sec-
ond Lame constant (k, l), longitudinal (vl), shear (vs) and average
elastic wave velocity (vm), Kleinman parameter (n) thermodynamical
properties: force constant (f), Reststrahlen frequency (m0), Debye
temperature (hD), and average elastic constant (C), of Silicon Carbide
in B3 phase at zero pressure
Materials parameter SiC
C111 (1010 Nm-2) -160.70
C112 (1010 Nm-2) -189.70
C123 (1010 Nm-2) 8.33
C144 (1010 Nm-2) -44.85
C166 (1010 Nm-2) -250.90
C456 (1010 Nm-2) -17.38
c13 -157.283
c23 1.207
c33 4.927
k (1010 Nm-2) 16.29
l (1010 Nm-2) 16.47
vl (ms-1) 12,400
vs (ms-1) 7172
vm (ms-1) 1688
n 0.709
f (105 dyne cm-1) 7.187
m0 (1012 Hz) 6.867
hD (K) 611.758
Cav. (1010 Nm-2) 22.82
234 J Theor Appl Phys (2015) 9:221–249
123
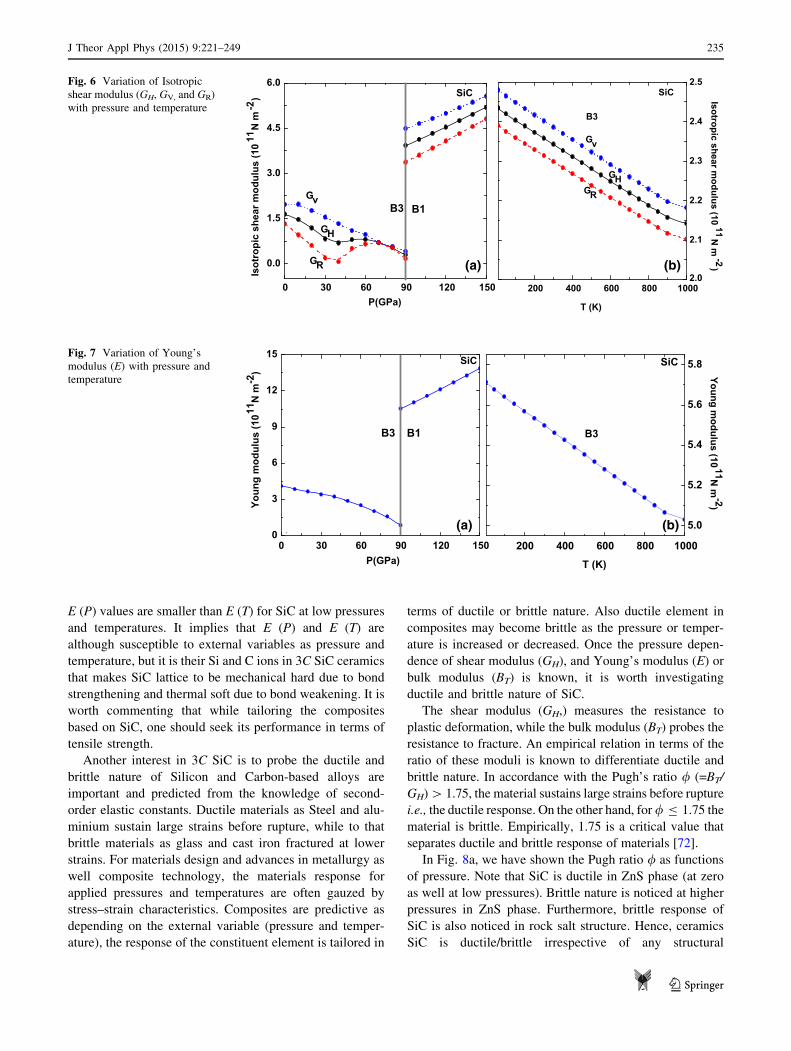
E (P) values are smaller than E (T) for SiC at low pressures
and temperatures. It implies that E (P) and E (T) are
although susceptible to external variables as pressure and
temperature, but it is their Si and C ions in 3C SiC ceramics
that makes SiC lattice to be mechanical hard due to bond
strengthening and thermal soft due to bond weakening. It is
worth commenting that while tailoring the composites
based on SiC, one should seek its performance in terms of
tensile strength.
Another interest in 3C SiC is to probe the ductile and
brittle nature of Silicon and Carbon-based alloys are
important and predicted from the knowledge of second-
order elastic constants. Ductile materials as Steel and alu-
minium sustain large strains before rupture, while to that
brittle materials as glass and cast iron fractured at lower
strains. For materials design and advances in metallurgy as
well composite technology, the materials response for
applied pressures and temperatures are often gauzed by
stress–strain characteristics. Composites are predictive as
depending on the external variable (pressure and temper-
ature), the response of the constituent element is tailored in
terms of ductile or brittle nature. Also ductile element in
composites may become brittle as the pressure or temper-
ature is increased or decreased. Once the pressure depen-
dence of shear modulus (GH), and Young’s modulus (E) or
bulk modulus (BT) is known, it is worth investigating
ductile and brittle nature of SiC.
The shear modulus (GH,) measures the resistance to
plastic deformation, while the bulk modulus (BT) probes the
resistance to fracture. An empirical relation in terms of the
ratio of these moduli is known to differentiate ductile and
brittle nature. In accordance with the Pugh’s ratio / (=BT/
GH)[ 1.75, the material sustains large strains before rupture
i.e., the ductile response. On the other hand, for/ B 1.75 the
material is brittle. Empirically, 1.75 is a critical value that
separates ductile and brittle response of materials [72].
In Fig. 8a, we have shown the Pugh ratio / as functions
of pressure. Note that SiC is ductile in ZnS phase (at zero
as well at low pressures). Brittle nature is noticed at higher
pressures in ZnS phase. Furthermore, brittle response of
SiC is also noticed in rock salt structure. Hence, ceramics
SiC is ductile/brittle irrespective of any structural
0 30 60 90 120 150
0.0
1.5
3.0
4.5
6.0
(a)
GH
SiC
GR
Gv
Isot
ropi
c sh
ear m
odul
us (1
011
N m
-2)
P(GPa)
B3 B1
200 400 600 800 10002.0
2.1
2.2
2.3
2.4
2.5
B3
Isotropic shear modulus (10
11N
m-2)(b)
GH
SiC
GR
Gv
T (K)
Fig. 6 Variation of Isotropic
shear modulus (GH, GV, and GR)
with pressure and temperature
0 30 60 90 120 1500
3
6
9
12
15
B1B3
Youn
g m
odul
us (1
011N
m-2
)
SiC
P(GPa)
(a)
200 400 600 800 1000
5.0
5.2
5.4
5.6
5.8
B3
SiC
T (K)
Young modulus (10 11N
m-2)
(b)
Fig. 7 Variation of Young’s
modulus (E) with pressure and
temperature
J Theor Appl Phys (2015) 9:221–249 235
123
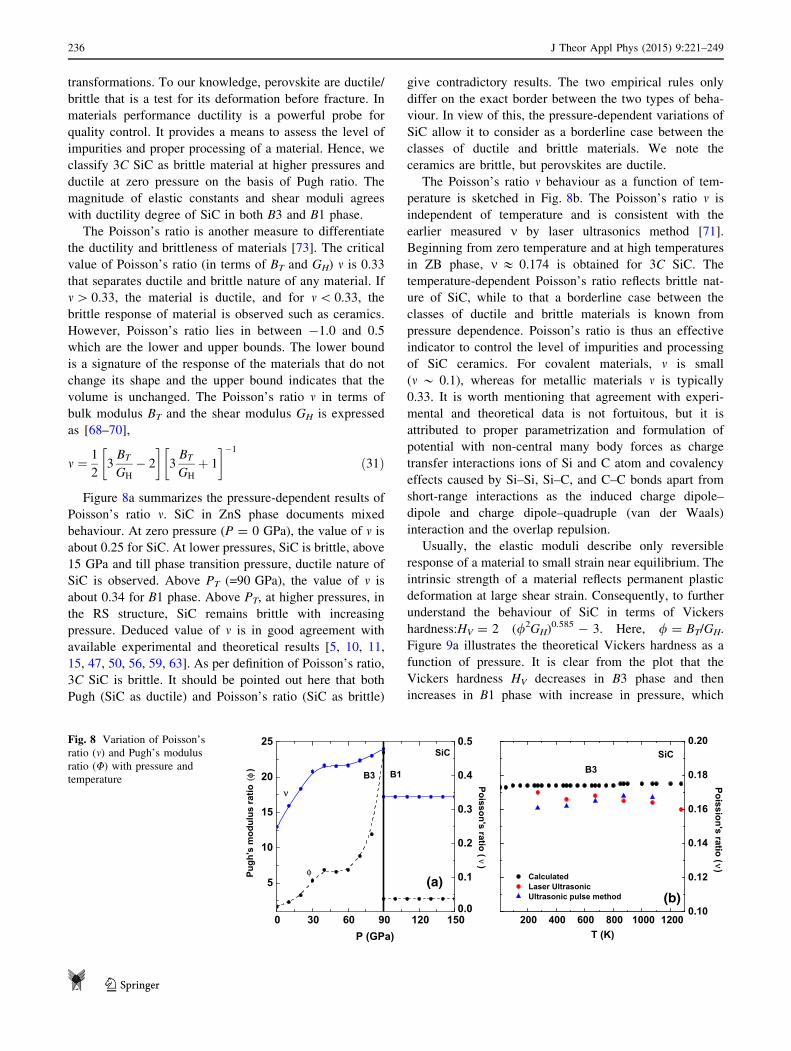
transformations. To our knowledge, perovskite are ductile/
brittle that is a test for its deformation before fracture. In
materials performance ductility is a powerful probe for
quality control. It provides a means to assess the level of
impurities and proper processing of a material. Hence, we
classify 3C SiC as brittle material at higher pressures and
ductile at zero pressure on the basis of Pugh ratio. The
magnitude of elastic constants and shear moduli agrees
with ductility degree of SiC in both B3 and B1 phase.
The Poisson’s ratio is another measure to differentiate
the ductility and brittleness of materials [73]. The critical
value of Poisson’s ratio (in terms of BT and GH) m is 0.33
that separates ductile and brittle nature of any material. If
m[ 0.33, the material is ductile, and for m\ 0.33, the
brittle response of material is observed such as ceramics.
However, Poisson’s ratio lies in between -1.0 and 0.5
which are the lower and upper bounds. The lower bound
is a signature of the response of the materials that do not
change its shape and the upper bound indicates that the
volume is unchanged. The Poisson’s ratio m in terms of
bulk modulus BT and the shear modulus GH is expressed
as [68–70],
m ¼ 1
23BT
GH
� 2
� 3BT
GH
þ 1
� �1
ð31Þ
Figure 8a summarizes the pressure-dependent results of
Poisson’s ratio m. SiC in ZnS phase documents mixed
behaviour. At zero pressure (P = 0 GPa), the value of m isabout 0.25 for SiC. At lower pressures, SiC is brittle, above
15 GPa and till phase transition pressure, ductile nature of
SiC is observed. Above PT (=90 GPa), the value of m is
about 0.34 for B1 phase. Above PT, at higher pressures, in
the RS structure, SiC remains brittle with increasing
pressure. Deduced value of m is in good agreement with
available experimental and theoretical results [5, 10, 11,
15, 47, 50, 56, 59, 63]. As per definition of Poisson’s ratio,
3C SiC is brittle. It should be pointed out here that both
Pugh (SiC as ductile) and Poisson’s ratio (SiC as brittle)
give contradictory results. The two empirical rules only
differ on the exact border between the two types of beha-
viour. In view of this, the pressure-dependent variations of
SiC allow it to consider as a borderline case between the
classes of ductile and brittle materials. We note the
ceramics are brittle, but perovskites are ductile.
The Poisson’s ratio m behaviour as a function of tem-
perature is sketched in Fig. 8b. The Poisson’s ratio m is
independent of temperature and is consistent with the
earlier measured m by laser ultrasonics method [71].
Beginning from zero temperature and at high temperatures
in ZB phase, m & 0.174 is obtained for 3C SiC. The
temperature-dependent Poisson’s ratio reflects brittle nat-
ure of SiC, while to that a borderline case between the
classes of ductile and brittle materials is known from
pressure dependence. Poisson’s ratio is thus an effective
indicator to control the level of impurities and processing
of SiC ceramics. For covalent materials, m is small
(m * 0.1), whereas for metallic materials m is typically
0.33. It is worth mentioning that agreement with experi-
mental and theoretical data is not fortuitous, but it is
attributed to proper parametrization and formulation of
potential with non-central many body forces as charge
transfer interactions ions of Si and C atom and covalency
effects caused by Si–Si, Si–C, and C–C bonds apart from
short-range interactions as the induced charge dipole–
dipole and charge dipole–quadruple (van der Waals)
interaction and the overlap repulsion.
Usually, the elastic moduli describe only reversible
response of a material to small strain near equilibrium. The
intrinsic strength of a material reflects permanent plastic
deformation at large shear strain. Consequently, to further
understand the behaviour of SiC in terms of Vickers
hardness:HV = 2 (/2GH)0.585 - 3. Here, / = BT/GH.
Figure 9a illustrates the theoretical Vickers hardness as a
function of pressure. It is clear from the plot that the
Vickers hardness HV decreases in B3 phase and then
increases in B1 phase with increase in pressure, which
0 30 60 90 120 150
5
10
15
20
25
ν
φ
B1B3
SiC
Pugh
's m
odul
us ra
tio(φ
)
(a)
0.0
0.1
0.2
0.3
0.4
0.5
P (GPa)
Poisson's ratio (ν)
200 400 600 800 1000 12000.10
0.12
0.14
0.16
0.18
0.20
B3SiC
T (K)
Poission's ratio (ν )
CalculatedLaser UltrasonicUltrasonic pulse method (b)
Fig. 8 Variation of Poisson’s
ratio (m) and Pugh’s modulus
ratio (U) with pressure and
temperature
236 J Theor Appl Phys (2015) 9:221–249
123
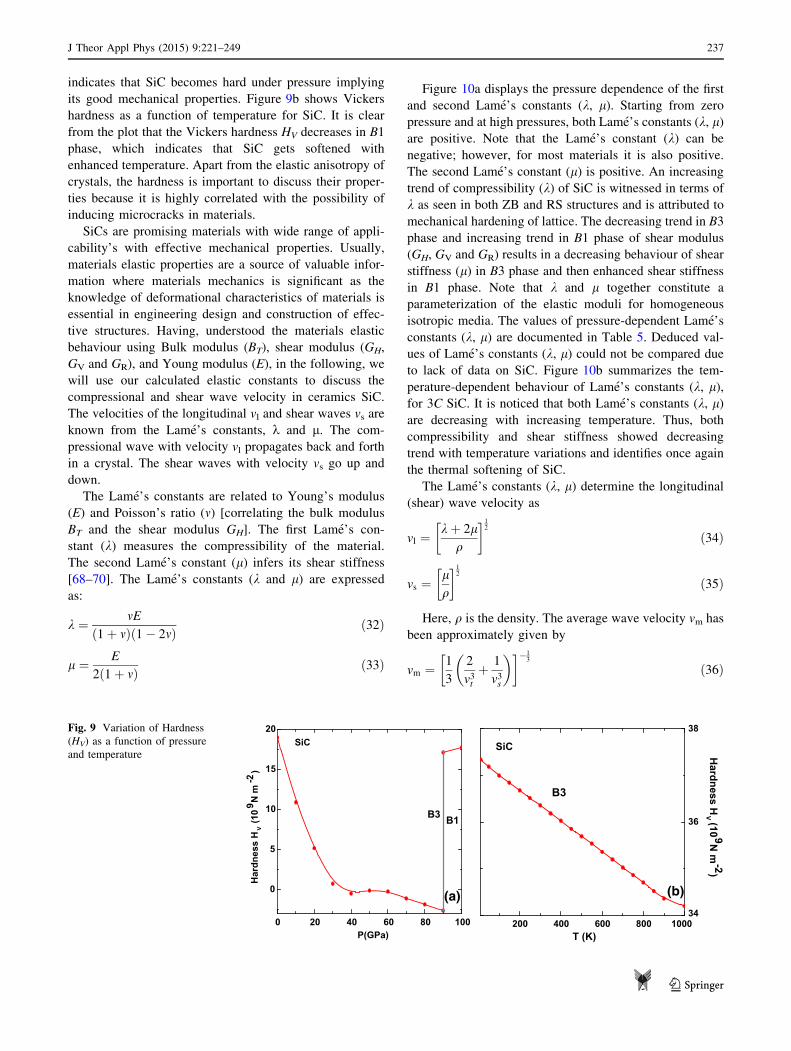
indicates that SiC becomes hard under pressure implying
its good mechanical properties. Figure 9b shows Vickers
hardness as a function of temperature for SiC. It is clear
from the plot that the Vickers hardness HV decreases in B1
phase, which indicates that SiC gets softened with
enhanced temperature. Apart from the elastic anisotropy of
crystals, the hardness is important to discuss their proper-
ties because it is highly correlated with the possibility of
inducing microcracks in materials.
SiCs are promising materials with wide range of appli-
cability’s with effective mechanical properties. Usually,
materials elastic properties are a source of valuable infor-
mation where materials mechanics is significant as the
knowledge of deformational characteristics of materials is
essential in engineering design and construction of effec-
tive structures. Having, understood the materials elastic
behaviour using Bulk modulus (BT), shear modulus (GH,
GV and GR), and Young modulus (E), in the following, we
will use our calculated elastic constants to discuss the
compressional and shear wave velocity in ceramics SiC.
The velocities of the longitudinal vl and shear waves vs are
known from the Lame’s constants, k and l. The com-
pressional wave with velocity vl propagates back and forth
in a crystal. The shear waves with velocity vs go up and
down.
The Lame’s constants are related to Young’s modulus
(E) and Poisson’s ratio (m) [correlating the bulk modulus
BT and the shear modulus GH]. The first Lame’s con-
stant (k) measures the compressibility of the material.
The second Lame’s constant (l) infers its shear stiffness
[68–70]. The Lame’s constants (k and l) are expressed
as:
k ¼ mE1þ mð Þ 1� 2mð Þ ð32Þ
l ¼ E
2 1þ mð Þ ð33Þ
Figure 10a displays the pressure dependence of the first
and second Lame’s constants (k, l). Starting from zero
pressure and at high pressures, both Lame’s constants (k, l)are positive. Note that the Lame’s constant (k) can be
negative; however, for most materials it is also positive.
The second Lame’s constant (l) is positive. An increasing
trend of compressibility (k) of SiC is witnessed in terms of
k as seen in both ZB and RS structures and is attributed to
mechanical hardening of lattice. The decreasing trend in B3
phase and increasing trend in B1 phase of shear modulus
(GH, GV and GR) results in a decreasing behaviour of shear
stiffness (l) in B3 phase and then enhanced shear stiffness
in B1 phase. Note that k and l together constitute a
parameterization of the elastic moduli for homogeneous
isotropic media. The values of pressure-dependent Lame’s
constants (k, l) are documented in Table 5. Deduced val-
ues of Lame’s constants (k, l) could not be compared due
to lack of data on SiC. Figure 10b summarizes the tem-
perature-dependent behaviour of Lame’s constants (k, l),for 3C SiC. It is noticed that both Lame’s constants (k, l)are decreasing with increasing temperature. Thus, both
compressibility and shear stiffness showed decreasing
trend with temperature variations and identifies once again
the thermal softening of SiC.
The Lame’s constants (k, l) determine the longitudinal
(shear) wave velocity as
vl ¼kþ 2l
q
� 12
ð34Þ
vs ¼lq
� 12
ð35Þ
Here, q is the density. The average wave velocity vm has
been approximately given by
vm ¼ 1
3
2
v3tþ 1
v3s
� �13
ð36Þ
0 20 40 60 80 100
0
5
10
15
20
B1B3
(a)
Har
dnes
s H
V(1
09 N
m-2
)
SiC
P(GPa)200 400 600 800 1000
34
36
38
B3
(b)
SiC
Hardness H
V (10 9N m
-2)
T (K)
Fig. 9 Variation of Hardness
(HV) as a function of pressure
and temperature
J Theor Appl Phys (2015) 9:221–249 237
123
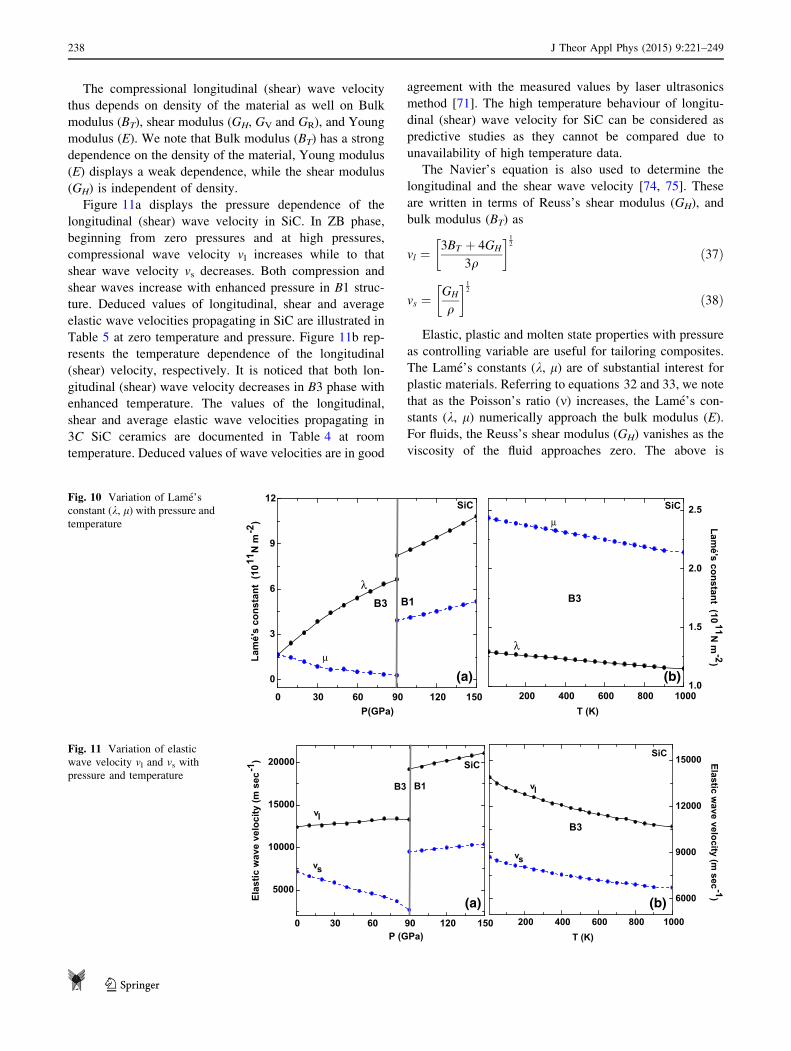
The compressional longitudinal (shear) wave velocity
thus depends on density of the material as well on Bulk
modulus (BT), shear modulus (GH, GV and GR), and Young
modulus (E). We note that Bulk modulus (BT) has a strong
dependence on the density of the material, Young modulus
(E) displays a weak dependence, while the shear modulus
(GH) is independent of density.
Figure 11a displays the pressure dependence of the
longitudinal (shear) wave velocity in SiC. In ZB phase,
beginning from zero pressures and at high pressures,
compressional wave velocity vl increases while to that
shear wave velocity vs decreases. Both compression and
shear waves increase with enhanced pressure in B1 struc-
ture. Deduced values of longitudinal, shear and average
elastic wave velocities propagating in SiC are illustrated in
Table 5 at zero temperature and pressure. Figure 11b rep-
resents the temperature dependence of the longitudinal
(shear) velocity, respectively. It is noticed that both lon-
gitudinal (shear) wave velocity decreases in B3 phase with
enhanced temperature. The values of the longitudinal,
shear and average elastic wave velocities propagating in
3C SiC ceramics are documented in Table 4 at room
temperature. Deduced values of wave velocities are in good
agreement with the measured values by laser ultrasonics
method [71]. The high temperature behaviour of longitu-
dinal (shear) wave velocity for SiC can be considered as
predictive studies as they cannot be compared due to
unavailability of high temperature data.
The Navier’s equation is also used to determine the
longitudinal and the shear wave velocity [74, 75]. These
are written in terms of Reuss’s shear modulus (GH), and
bulk modulus (BT) as
vl ¼3BT þ 4GH
3q
� 12
ð37Þ
vs ¼GH
q
� 12
ð38Þ
Elastic, plastic and molten state properties with pressure
as controlling variable are useful for tailoring composites.
The Lame’s constants (k, l) are of substantial interest for
plastic materials. Referring to equations 32 and 33, we note
that as the Poisson’s ratio (m) increases, the Lame’s con-
stants (k, l) numerically approach the bulk modulus (E).
For fluids, the Reuss’s shear modulus (GH) vanishes as the
viscosity of the fluid approaches zero. The above is
0 30 60 90 120 150
0
3
6
9
12
Lam
é's
cons
tant
(10
11N
m-2
)
SiC
P(GPa)
B3 B1λ
μ
(a)200 400 600 800 1000
1.0
1.5
2.0
2.5
B3
Lamé's constant (10 11N
m-2)
SiC
T (K)
λ
μ
(b)
Fig. 10 Variation of Lame’s
constant (k, l) with pressure andtemperature
0 30 60 90 120 150
5000
10000
15000
20000
vs
vl
P (GPa)
B3 B1
SiC
Elas
tic w
ave
velo
city
(m s
ec-1
)
(a)200 400 600 800 1000
6000
9000
12000
15000
B3
Elastic wave velocity (m
sec -1)
T (K)
vs
vl
SiC
(b)
Fig. 11 Variation of elastic
wave velocity vl and vs with
pressure and temperature
238 J Theor Appl Phys (2015) 9:221–249
123
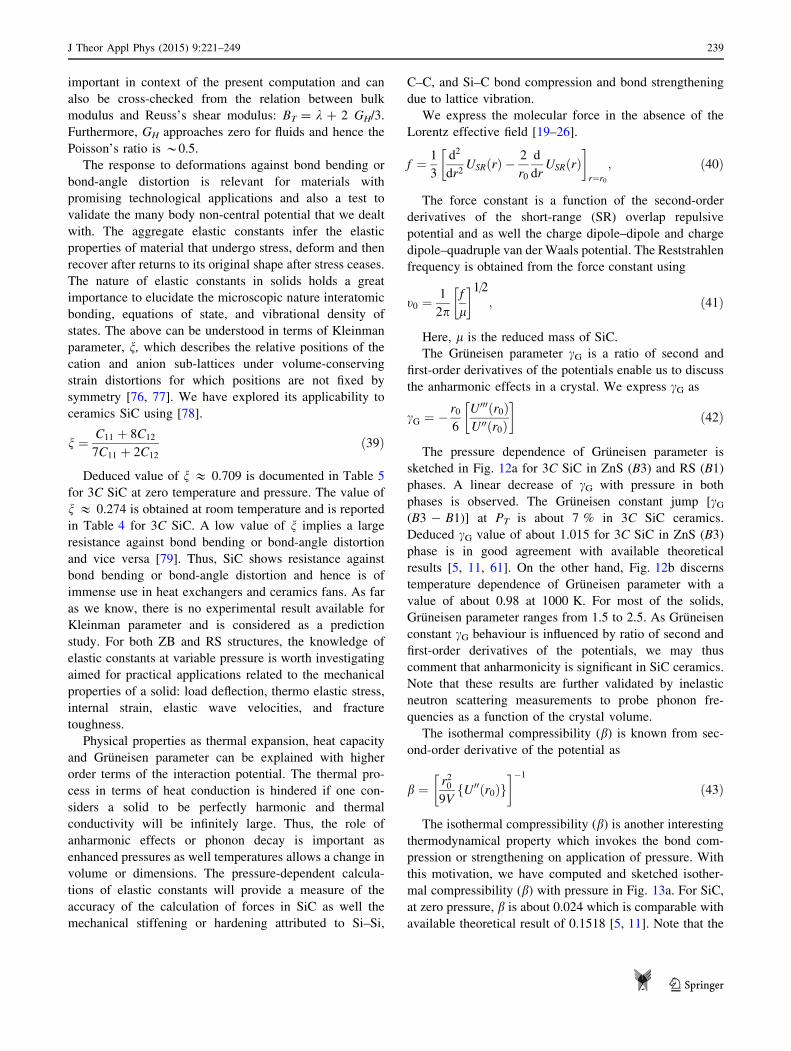
important in context of the present computation and can
also be cross-checked from the relation between bulk
modulus and Reuss’s shear modulus: BT = k ? 2 GH/3.
Furthermore, GH approaches zero for fluids and hence the
Poisson’s ratio is *0.5.
The response to deformations against bond bending or
bond-angle distortion is relevant for materials with
promising technological applications and also a test to
validate the many body non-central potential that we dealt
with. The aggregate elastic constants infer the elastic
properties of material that undergo stress, deform and then
recover after returns to its original shape after stress ceases.
The nature of elastic constants in solids holds a great
importance to elucidate the microscopic nature interatomic
bonding, equations of state, and vibrational density of
states. The above can be understood in terms of Kleinman
parameter, n, which describes the relative positions of the
cation and anion sub-lattices under volume-conserving
strain distortions for which positions are not fixed by
symmetry [76, 77]. We have explored its applicability to
ceramics SiC using [78].
n ¼ C11 þ 8C12
7C11 þ 2C12
ð39Þ
Deduced value of n & 0.709 is documented in Table 5
for 3C SiC at zero temperature and pressure. The value of
n & 0.274 is obtained at room temperature and is reported
in Table 4 for 3C SiC. A low value of n implies a large
resistance against bond bending or bond-angle distortion
and vice versa [79]. Thus, SiC shows resistance against
bond bending or bond-angle distortion and hence is of
immense use in heat exchangers and ceramics fans. As far
as we know, there is no experimental result available for
Kleinman parameter and is considered as a prediction
study. For both ZB and RS structures, the knowledge of
elastic constants at variable pressure is worth investigating
aimed for practical applications related to the mechanical
properties of a solid: load deflection, thermo elastic stress,
internal strain, elastic wave velocities, and fracture
toughness.
Physical properties as thermal expansion, heat capacity
and Gruneisen parameter can be explained with higher
order terms of the interaction potential. The thermal pro-
cess in terms of heat conduction is hindered if one con-
siders a solid to be perfectly harmonic and thermal
conductivity will be infinitely large. Thus, the role of
anharmonic effects or phonon decay is important as
enhanced pressures as well temperatures allows a change in
volume or dimensions. The pressure-dependent calcula-
tions of elastic constants will provide a measure of the
accuracy of the calculation of forces in SiC as well the
mechanical stiffening or hardening attributed to Si–Si,
C–C, and Si–C bond compression and bond strengthening
due to lattice vibration.
We express the molecular force in the absence of the
Lorentz effective field [19–26].
f ¼ 1
3
d2
dr2USRðrÞ �
2
r0
d
drUSRðrÞ
�
r¼r0
; ð40Þ
The force constant is a function of the second-order
derivatives of the short-range (SR) overlap repulsive
potential and as well the charge dipole–dipole and charge
dipole–quadruple van der Waals potential. The Reststrahlen
frequency is obtained from the force constant using
t0 ¼1
2pf
l
� 1=2; ð41Þ
Here, l is the reduced mass of SiC.
The Gruneisen parameter cG is a ratio of second and
first-order derivatives of the potentials enable us to discuss
the anharmonic effects in a crystal. We express cG as
cG ¼ � r0
6
U000ðr0ÞU00ðr0Þ
� ð42Þ
The pressure dependence of Gruneisen parameter is
sketched in Fig. 12a for 3C SiC in ZnS (B3) and RS (B1)
phases. A linear decrease of cG with pressure in both
phases is observed. The Gruneisen constant jump [cG(B3 - B1)] at PT is about 7 % in 3C SiC ceramics.
Deduced cG value of about 1.015 for 3C SiC in ZnS (B3)
phase is in good agreement with available theoretical
results [5, 11, 61]. On the other hand, Fig. 12b discerns
temperature dependence of Gruneisen parameter with a
value of about 0.98 at 1000 K. For most of the solids,
Gruneisen parameter ranges from 1.5 to 2.5. As Gruneisen
constant cG behaviour is influenced by ratio of second and
first-order derivatives of the potentials, we may thus
comment that anharmonicity is significant in SiC ceramics.
Note that these results are further validated by inelastic
neutron scattering measurements to probe phonon fre-
quencies as a function of the crystal volume.
The isothermal compressibility (b) is known from sec-
ond-order derivative of the potential as
b ¼ r209V
U00ðr0Þf g� �1
ð43Þ
The isothermal compressibility (b) is another interestingthermodynamical property which invokes the bond com-
pression or strengthening on application of pressure. With
this motivation, we have computed and sketched isother-
mal compressibility (b) with pressure in Fig. 13a. For SiC,
at zero pressure, b is about 0.024 which is comparable with
available theoretical result of 0.1518 [5, 11]. Note that the
J Theor Appl Phys (2015) 9:221–249 239
123
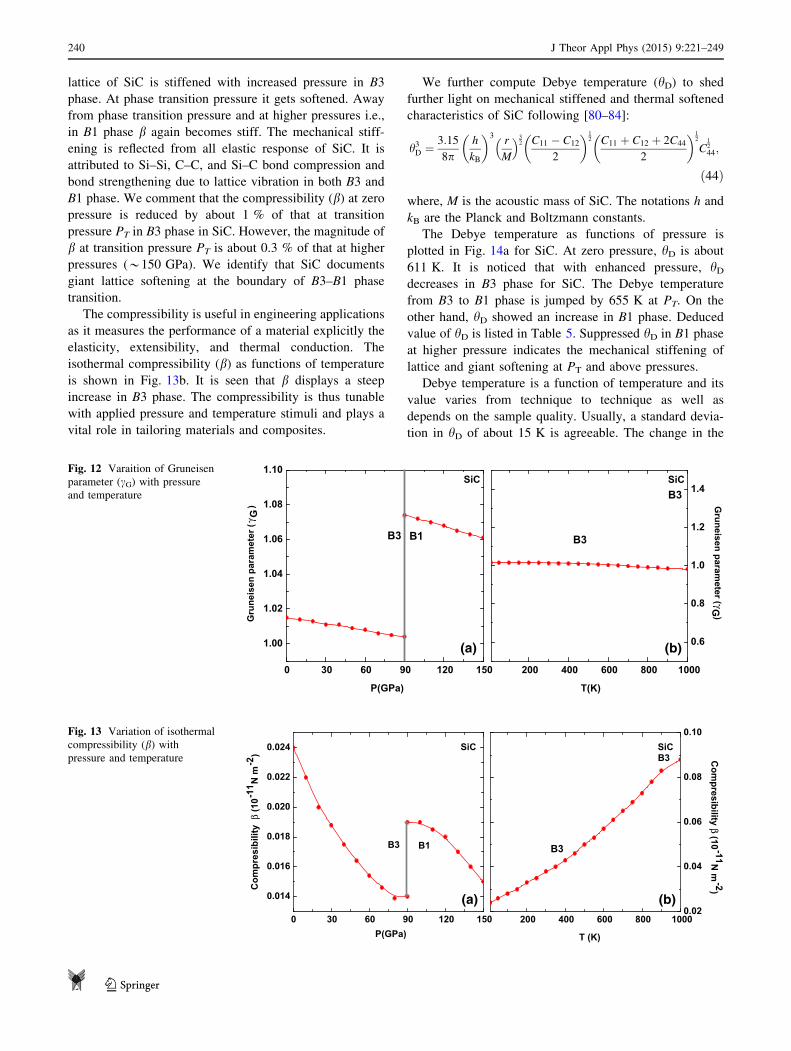
lattice of SiC is stiffened with increased pressure in B3
phase. At phase transition pressure it gets softened. Away
from phase transition pressure and at higher pressures i.e.,
in B1 phase b again becomes stiff. The mechanical stiff-
ening is reflected from all elastic response of SiC. It is
attributed to Si–Si, C–C, and Si–C bond compression and
bond strengthening due to lattice vibration in both B3 and
B1 phase. We comment that the compressibility (b) at zeropressure is reduced by about 1 % of that at transition
pressure PT in B3 phase in SiC. However, the magnitude of
b at transition pressure PT is about 0.3 % of that at higher
pressures (*150 GPa). We identify that SiC documents
giant lattice softening at the boundary of B3–B1 phase
transition.
The compressibility is useful in engineering applications
as it measures the performance of a material explicitly the
elasticity, extensibility, and thermal conduction. The
isothermal compressibility (b) as functions of temperature
is shown in Fig. 13b. It is seen that b displays a steep
increase in B3 phase. The compressibility is thus tunable
with applied pressure and temperature stimuli and plays a
vital role in tailoring materials and composites.
We further compute Debye temperature (hD) to shed
further light on mechanical stiffened and thermal softened
characteristics of SiC following [80–84]:
h3D ¼ 3:15
8ph
kB
3r
M
� �32 C11 � C12
2
12 C11 þ C12 þ 2C44
2
12
C12
44;
ð44Þ
where, M is the acoustic mass of SiC. The notations h and
kB are the Planck and Boltzmann constants.
The Debye temperature as functions of pressure is
plotted in Fig. 14a for SiC. At zero pressure, hD is about
611 K. It is noticed that with enhanced pressure, hDdecreases in B3 phase for SiC. The Debye temperature
from B3 to B1 phase is jumped by 655 K at PT. On the
other hand, hD showed an increase in B1 phase. Deduced
value of hD is listed in Table 5. Suppressed hD in B1 phase
at higher pressure indicates the mechanical stiffening of
lattice and giant softening at PT and above pressures.
Debye temperature is a function of temperature and its
value varies from technique to technique as well as
depends on the sample quality. Usually, a standard devia-
tion in hD of about 15 K is agreeable. The change in the
0 30 60 90 120 150
1.00
1.02
1.04
1.06
1.08
1.10
(a)
B1B3
Gru
neis
en p
aram
eter
(γ G
SiC
P(GPa)
200 400 600 800 1000
0.6
0.8
1.0
1.2
1.4
B3
(b)
B3
Gruneisen param
eter ( )γG
SiC
T(K)
(
Fig. 12 Varaition of Gruneisen
parameter (cG) with pressure
and temperature
0 30 60 90 120 150
0.014
0.016
0.018
0.020
0.022
0.024
(a)
B1B3
Com
pres
ibili
ty β
(10-1
1 N m
-2)
SiC
P(GPa)200 400 600 800 1000
0.02
0.04
0.06
0.08
0.10
B3
(b)
B3 Com
presibility β(10 -11N
m-2)
SiC
T (K)
Fig. 13 Variation of isothermal
compressibility (b) withpressure and temperature
240 J Theor Appl Phys (2015) 9:221–249
123
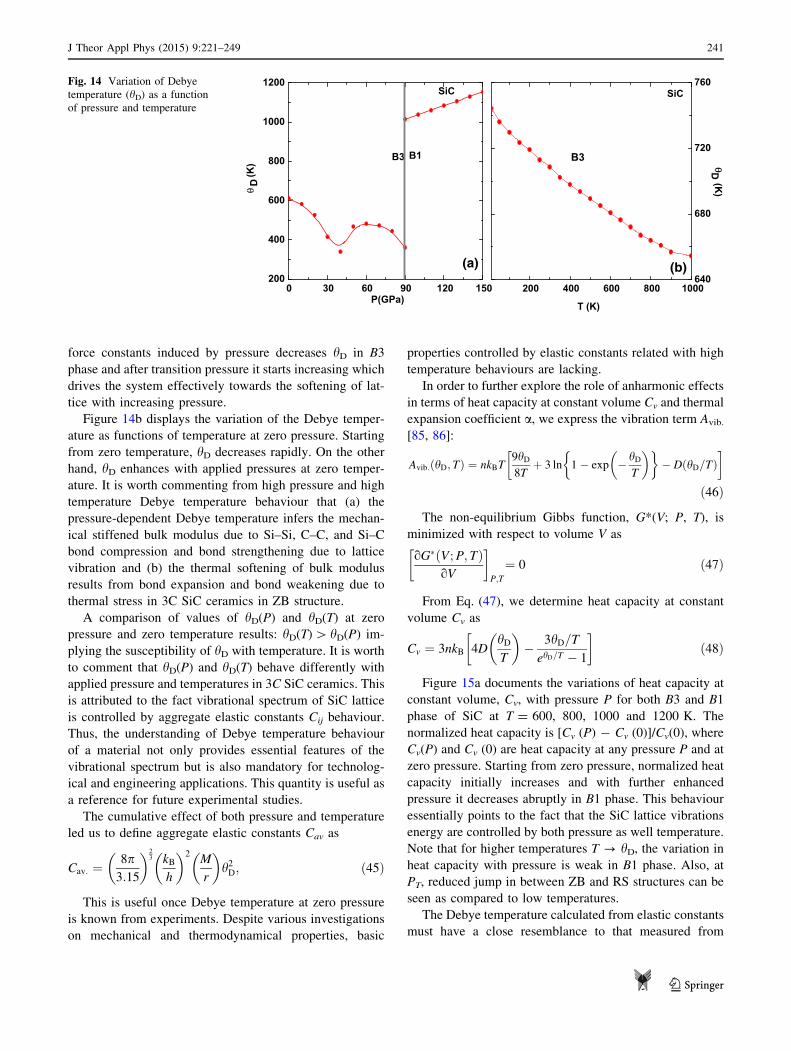
force constants induced by pressure decreases hD in B3
phase and after transition pressure it starts increasing which
drives the system effectively towards the softening of lat-
tice with increasing pressure.
Figure 14b displays the variation of the Debye temper-
ature as functions of temperature at zero pressure. Starting
from zero temperature, hD decreases rapidly. On the other
hand, hD enhances with applied pressures at zero temper-
ature. It is worth commenting from high pressure and high
temperature Debye temperature behaviour that (a) the
pressure-dependent Debye temperature infers the mechan-
ical stiffened bulk modulus due to Si–Si, C–C, and Si–C
bond compression and bond strengthening due to lattice
vibration and (b) the thermal softening of bulk modulus
results from bond expansion and bond weakening due to
thermal stress in 3C SiC ceramics in ZB structure.
A comparison of values of hD(P) and hD(T) at zero
pressure and zero temperature results: hD(T)[ hD(P) im-
plying the susceptibility of hD with temperature. It is worth
to comment that hD(P) and hD(T) behave differently with
applied pressure and temperatures in 3C SiC ceramics. This
is attributed to the fact vibrational spectrum of SiC lattice
is controlled by aggregate elastic constants Cij behaviour.
Thus, the understanding of Debye temperature behaviour
of a material not only provides essential features of the
vibrational spectrum but is also mandatory for technolog-
ical and engineering applications. This quantity is useful as
a reference for future experimental studies.
The cumulative effect of both pressure and temperature
led us to define aggregate elastic constants Cav as
Cav: ¼8p3:15
23 kB
h
2M
r
h2D; ð45Þ
This is useful once Debye temperature at zero pressure
is known from experiments. Despite various investigations
on mechanical and thermodynamical properties, basic
properties controlled by elastic constants related with high
temperature behaviours are lacking.
In order to further explore the role of anharmonic effects
in terms of heat capacity at constant volume Cv and thermal
expansion coefficient a, we express the vibration term Avib.
[85, 86]:
Avib:ðhD; TÞ ¼ nkBT9hD8T
þ 3 ln 1� exp � hDT
� �� DðhD=TÞ
�
ð46Þ
The non-equilibrium Gibbs function, G*(V; P, T), is
minimized with respect to volume V as
oG�ðV;P; TÞoV
�
P;T
¼ 0 ð47Þ
From Eq. (47), we determine heat capacity at constant
volume Cv as
Cv ¼ 3nkB 4DhDT
� 3hD=T
ehD=T � 1
� ð48Þ
Figure 15a documents the variations of heat capacity at
constant volume, Cv, with pressure P for both B3 and B1
phase of SiC at T = 600, 800, 1000 and 1200 K. The
normalized heat capacity is [Cv (P) - Cv (0)]/Cv(0), where
Cv(P) and Cv (0) are heat capacity at any pressure P and at
zero pressure. Starting from zero pressure, normalized heat
capacity initially increases and with further enhanced
pressure it decreases abruptly in B1 phase. This behaviour
essentially points to the fact that the SiC lattice vibrations
energy are controlled by both pressure as well temperature.
Note that for higher temperatures T ? hD, the variation in
heat capacity with pressure is weak in B1 phase. Also, at
PT, reduced jump in between ZB and RS structures can be
seen as compared to low temperatures.
The Debye temperature calculated from elastic constants
must have a close resemblance to that measured from
0 30 60 90 120 150200
400
600
800
1000
1200
(a)
B1B3
P(GPa)
θD
(K)
SiC
200 400 600 800 1000640
680
720
760
B3
(b)
T (K)
θD (K
)
SiCFig. 14 Variation of Debye
temperature (hD) as a function
of pressure and temperature
J Theor Appl Phys (2015) 9:221–249 241
123
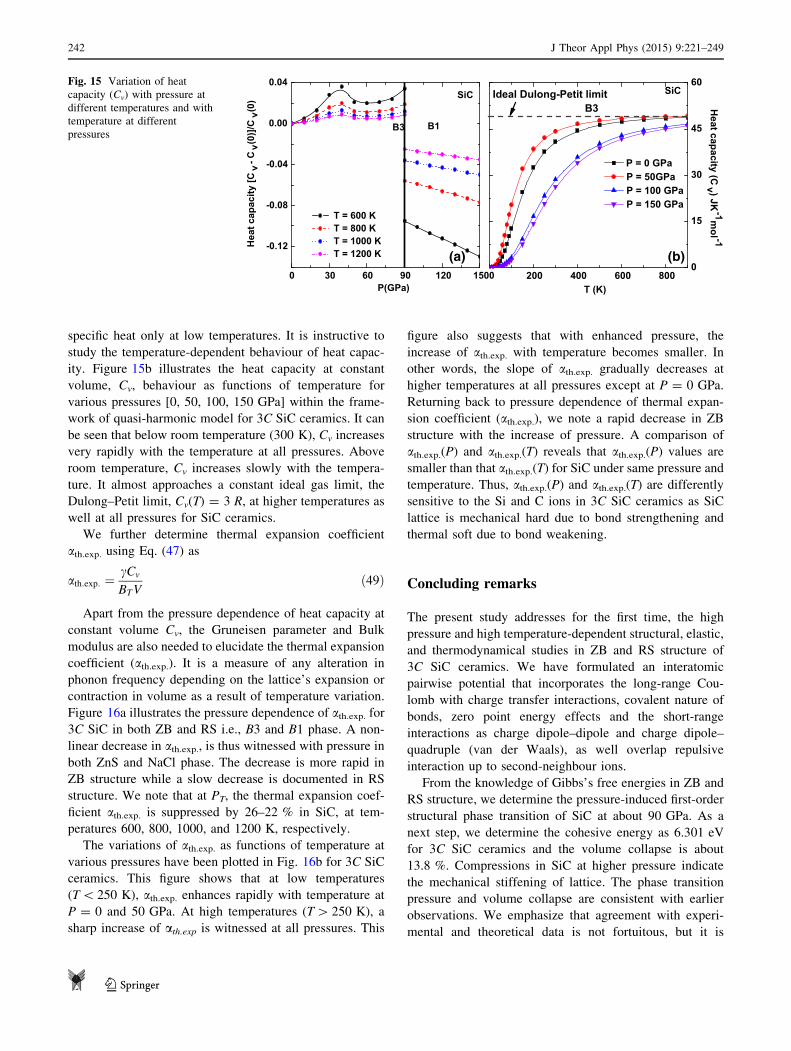
specific heat only at low temperatures. It is instructive to
study the temperature-dependent behaviour of heat capac-
ity. Figure 15b illustrates the heat capacity at constant
volume, Cv, behaviour as functions of temperature for
various pressures [0, 50, 100, 150 GPa] within the frame-
work of quasi-harmonic model for 3C SiC ceramics. It can
be seen that below room temperature (300 K), Cv increases
very rapidly with the temperature at all pressures. Above
room temperature, Cv increases slowly with the tempera-
ture. It almost approaches a constant ideal gas limit, the
Dulong–Petit limit, Cv(T) = 3 R, at higher temperatures as
well at all pressures for SiC ceramics.
We further determine thermal expansion coefficient
ath.exp. using Eq. (47) as
ath:exp: ¼cCv
BTVð49Þ
Apart from the pressure dependence of heat capacity at
constant volume Cv, the Gruneisen parameter and Bulk
modulus are also needed to elucidate the thermal expansion
coefficient (ath.exp.). It is a measure of any alteration in
phonon frequency depending on the lattice’s expansion or
contraction in volume as a result of temperature variation.
Figure 16a illustrates the pressure dependence of ath.exp. for3C SiC in both ZB and RS i.e., B3 and B1 phase. A non-
linear decrease in ath.exp., is thus witnessed with pressure in
both ZnS and NaCl phase. The decrease is more rapid in
ZB structure while a slow decrease is documented in RS
structure. We note that at PT, the thermal expansion coef-
ficient ath.exp. is suppressed by 26–22 % in SiC, at tem-
peratures 600, 800, 1000, and 1200 K, respectively.
The variations of ath.exp. as functions of temperature at
various pressures have been plotted in Fig. 16b for 3C SiC
ceramics. This figure shows that at low temperatures
(T\ 250 K), ath.exp. enhances rapidly with temperature at
P = 0 and 50 GPa. At high temperatures (T[ 250 K), a
sharp increase of ath.exp is witnessed at all pressures. This
figure also suggests that with enhanced pressure, the
increase of ath.exp. with temperature becomes smaller. In
other words, the slope of ath.exp. gradually decreases at
higher temperatures at all pressures except at P = 0 GPa.
Returning back to pressure dependence of thermal expan-
sion coefficient (ath.exp.), we note a rapid decrease in ZB
structure with the increase of pressure. A comparison of
ath.exp.(P) and ath.exp.(T) reveals that ath.exp.(P) values are
smaller than that ath.exp.(T) for SiC under same pressure and
temperature. Thus, ath.exp.(P) and ath.exp.(T) are differently
sensitive to the Si and C ions in 3C SiC ceramics as SiC
lattice is mechanical hard due to bond strengthening and
thermal soft due to bond weakening.
Concluding remarks
The present study addresses for the first time, the high
pressure and high temperature-dependent structural, elastic,
and thermodynamical studies in ZB and RS structure of
3C SiC ceramics. We have formulated an interatomic
pairwise potential that incorporates the long-range Cou-
lomb with charge transfer interactions, covalent nature of
bonds, zero point energy effects and the short-range
interactions as charge dipole–dipole and charge dipole–
quadruple (van der Waals), as well overlap repulsive
interaction up to second-neighbour ions.
From the knowledge of Gibbs’s free energies in ZB and
RS structure, we determine the pressure-induced first-order
structural phase transition of SiC at about 90 GPa. As a
next step, we determine the cohesive energy as 6.301 eV
for 3C SiC ceramics and the volume collapse is about
13.8 %. Compressions in SiC at higher pressure indicate
the mechanical stiffening of lattice. The phase transition
pressure and volume collapse are consistent with earlier
observations. We emphasize that agreement with experi-
mental and theoretical data is not fortuitous, but it is
0 30 60 90 120 1500
-0.12
-0.08
-0.04
0.00
0.04
Hea
t cap
acity
[Cv
- Cv(
0)]/C
v(0)
T = 600 K T = 800 K T = 1000 K T = 1200 K
SiC
B1B3
P(GPa)
(a)200 400 600 800
0
15
30
45
60
B3
(b)
Ideal Dulong-Petit limit
P = 0 GPa P = 50GPa P = 100 GPa P = 150 GPa
Heat capacity (C
v ) JK-1m
ol -1
T (K)
SiCFig. 15 Variation of heat
capacity (Cv) with pressure at
different temperatures and with
temperature at different
pressures
242 J Theor Appl Phys (2015) 9:221–249
123
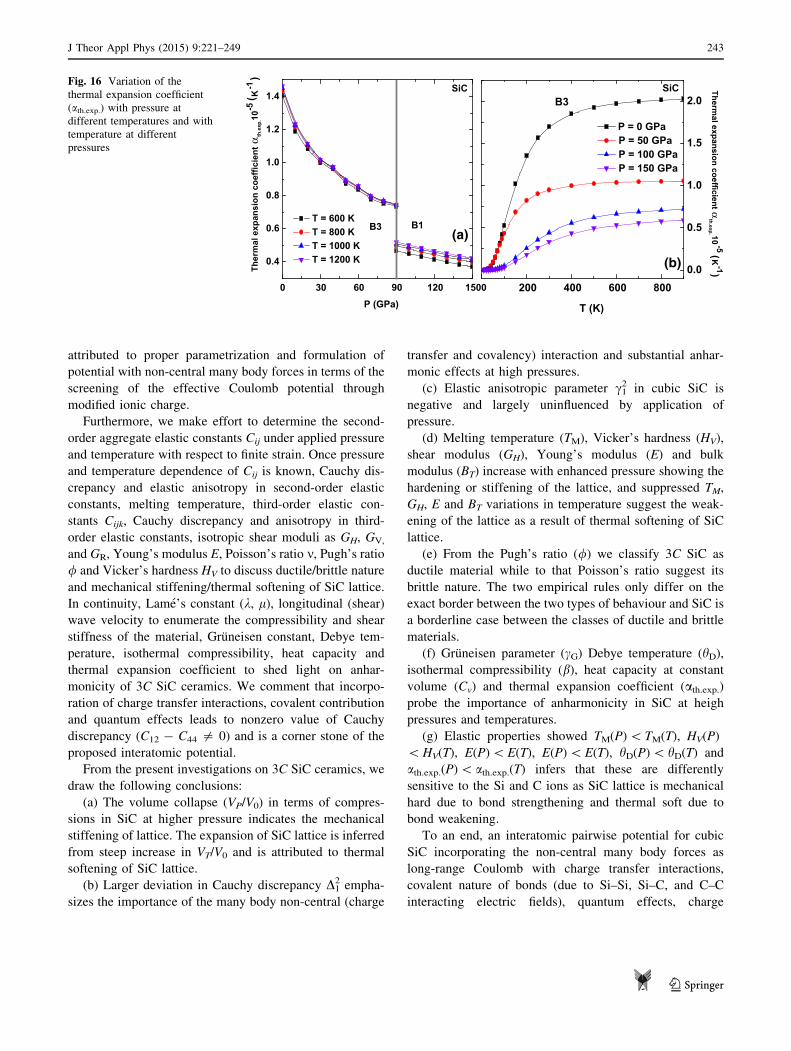
attributed to proper parametrization and formulation of
potential with non-central many body forces in terms of the
screening of the effective Coulomb potential through
modified ionic charge.
Furthermore, we make effort to determine the second-
order aggregate elastic constants Cij under applied pressure
and temperature with respect to finite strain. Once pressure
and temperature dependence of Cij is known, Cauchy dis-
crepancy and elastic anisotropy in second-order elastic
constants, melting temperature, third-order elastic con-
stants Cijk, Cauchy discrepancy and anisotropy in third-
order elastic constants, isotropic shear moduli as GH, GV,
and GR, Young’s modulus E, Poisson’s ratio m, Pugh’s ratio/ and Vicker’s hardness HV to discuss ductile/brittle nature
and mechanical stiffening/thermal softening of SiC lattice.
In continuity, Lame’s constant (k, l), longitudinal (shear)wave velocity to enumerate the compressibility and shear
stiffness of the material, Gruneisen constant, Debye tem-
perature, isothermal compressibility, heat capacity and
thermal expansion coefficient to shed light on anhar-
monicity of 3C SiC ceramics. We comment that incorpo-
ration of charge transfer interactions, covalent contribution
and quantum effects leads to nonzero value of Cauchy
discrepancy (C12 - C44 = 0) and is a corner stone of the
proposed interatomic potential.
From the present investigations on 3C SiC ceramics, we
draw the following conclusions:
(a) The volume collapse (VP/V0) in terms of compres-
sions in SiC at higher pressure indicates the mechanical
stiffening of lattice. The expansion of SiC lattice is inferred
from steep increase in VT/V0 and is attributed to thermal
softening of SiC lattice.
(b) Larger deviation in Cauchy discrepancy D12 empha-
sizes the importance of the many body non-central (charge
transfer and covalency) interaction and substantial anhar-
monic effects at high pressures.
(c) Elastic anisotropic parameter c12 in cubic SiC is
negative and largely uninfluenced by application of
pressure.
(d) Melting temperature (TM), Vicker’s hardness (HV),
shear modulus (GH), Young’s modulus (E) and bulk
modulus (BT) increase with enhanced pressure showing the
hardening or stiffening of the lattice, and suppressed TM,
GH, E and BT variations in temperature suggest the weak-
ening of the lattice as a result of thermal softening of SiC
lattice.
(e) From the Pugh’s ratio (/) we classify 3C SiC as
ductile material while to that Poisson’s ratio suggest its
brittle nature. The two empirical rules only differ on the
exact border between the two types of behaviour and SiC is
a borderline case between the classes of ductile and brittle
materials.
(f) Gruneisen parameter (cG) Debye temperature (hD),isothermal compressibility (b), heat capacity at constant
volume (Cv) and thermal expansion coefficient (ath.exp.)probe the importance of anharmonicity in SiC at heigh
pressures and temperatures.
(g) Elastic properties showed TM(P)\TM(T), HV(P)
\HV(T), E(P)\E(T), E(P)\E(T), hD(P)\ hD(T) and
ath.exp.(P)\ ath.exp.(T) infers that these are differently
sensitive to the Si and C ions as SiC lattice is mechanical
hard due to bond strengthening and thermal soft due to
bond weakening.
To an end, an interatomic pairwise potential for cubic
SiC incorporating the non-central many body forces as
long-range Coulomb with charge transfer interactions,
covalent nature of bonds (due to Si–Si, Si–C, and C–C
interacting electric fields), quantum effects, charge
0 30 60 90 120 1500
0.4
0.6
0.8
1.0
1.2
1.4
B1B3 T = 600 K T = 800 K T = 1000 K T = 1200 K
Ther
mal
exp
ansi
on c
oeffi
cien
t αth
.exp
.10-5
( K-1
)
SiC
P (GPa)
(a)
200 400 600 8000.0
0.5
1.0
1.5
2.0
Thermal expansion coefficient α
th.exp. 10 -5(K
-1)
B3
(b)
SiC
T (K)
P = 0 GPa P = 50 GPa P = 100 GPa P = 150 GPa
Fig. 16 Variation of the
thermal expansion coefficient
(ath.exp.) with pressure at
different temperatures and with
temperature at different
pressures
J Theor Appl Phys (2015) 9:221–249 243
123
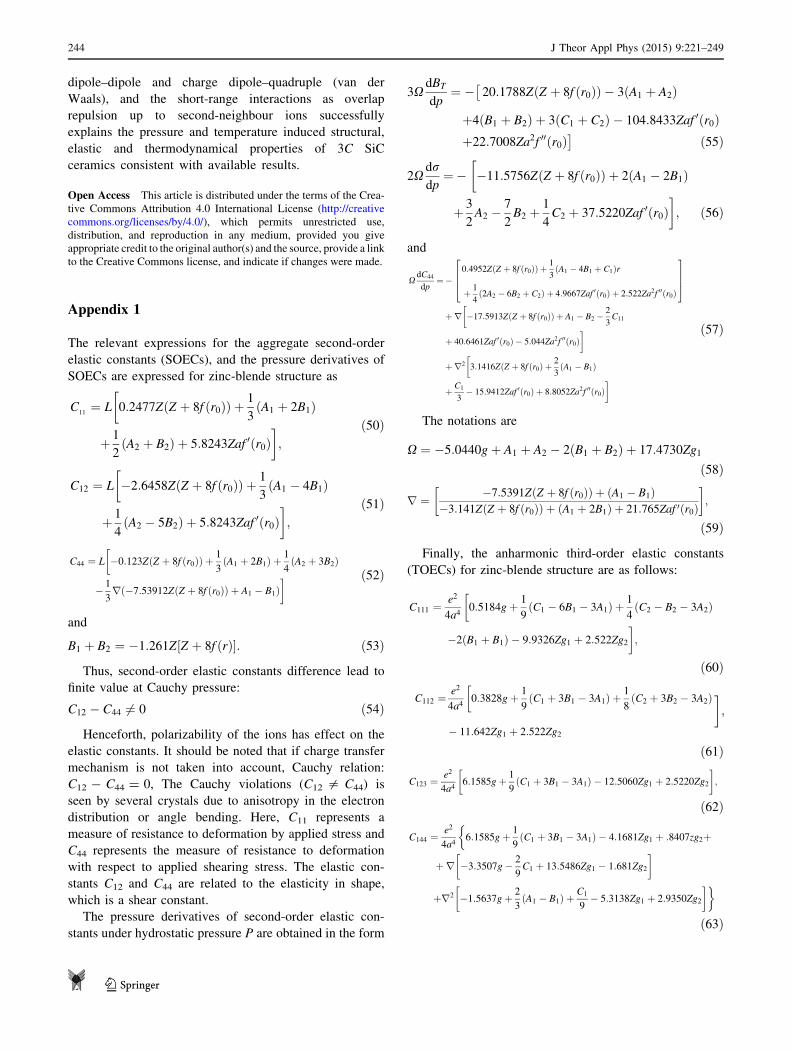
dipole–dipole and charge dipole–quadruple (van der
Waals), and the short-range interactions as overlap
repulsion up to second-neighbour ions successfully
explains the pressure and temperature induced structural,
elastic and thermodynamical properties of 3C SiC
ceramics consistent with available results.
Open Access This article is distributed under the terms of the Crea-
tive Commons Attribution 4.0 International License (http://creative
commons.org/licenses/by/4.0/), which permits unrestricted use,
distribution, and reproduction in any medium, provided you give
appropriate credit to the original author(s) and the source, provide a link
to the Creative Commons license, and indicate if changes were made.
Appendix 1
The relevant expressions for the aggregate second-order
elastic constants (SOECs), and the pressure derivatives of
SOECs are expressed for zinc-blende structure as
C11¼ L 0:2477ZðZ þ 8f ðr0ÞÞ þ
1
3A1 þ 2B1ð Þ
�
þ 1
2A2 þ B2ð Þ þ 5:8243Zaf 0ðr0Þ
;
ð50Þ
C12 ¼ L �2:6458ZðZ þ 8f ðr0ÞÞ þ1
3A1 � 4B1ð Þ
�
þ 1
4A2 � 5B2ð Þ þ 5:8243Zaf 0ðr0Þ
;
ð51Þ
C44 ¼ L �0:123ZðZ þ 8f ðr0ÞÞ þ1
3A1 þ 2B1ð Þ þ 1
4A2 þ 3B2ð Þ
�
� 1
3r �7:53912ZðZ þ 8f ðr0ÞÞ þ A1 � B1ð Þ
ð52Þ
and
B1 þ B2 ¼ �1:261Z Z þ 8f ðrÞ½ �: ð53Þ
Thus, second-order elastic constants difference lead to
finite value at Cauchy pressure:
C12 � C44 6¼ 0 ð54Þ
Henceforth, polarizability of the ions has effect on the
elastic constants. It should be noted that if charge transfer
mechanism is not taken into account, Cauchy relation:
C12 - C44 = 0, The Cauchy violations (C12 = C44) is
seen by several crystals due to anisotropy in the electron
distribution or angle bending. Here, C11 represents a
measure of resistance to deformation by applied stress and
C44 represents the measure of resistance to deformation
with respect to applied shearing stress. The elastic con-
stants C12 and C44 are related to the elasticity in shape,
which is a shear constant.
The pressure derivatives of second-order elastic con-
stants under hydrostatic pressure P are obtained in the form
3XdBT
dp¼ � 20:1788ZðZ þ 8f ðr0ÞÞ � 3 A1 þ A2ð Þ
�
þ4 B1 þ B2ð Þ þ 3 C1 þ C2ð Þ � 104:8433Zaf 0ðr0Þþ22:7008Za2f 00ðr0Þ
�ð55Þ
2Xdrdp
¼���11:5756ZðZ þ 8f ðr0ÞÞ þ 2 A1 � 2B1ð Þ
þ 3
2A2 �
7
2B2 þ
1
4C2 þ 37:5220Zaf 0ðr0Þ
; ð56Þ
and
XdC44
dp¼�
0:4952ZðZ þ 8f ðr0ÞÞ þ1
3A1 � 4B1 þ C1ð Þr
þ 1
42A2 � 6B2 þ C2ð Þ þ 4:9667Zaf 0ðr0Þ þ 2:522Za2f 00ðr0Þ
2
664
3
775
þr �17:5913ZðZ þ 8f ðr0ÞÞ þ A1 � B2 �2
3C11
�
þ 40:6461Zaf 0ðr0Þ � 5:044Za2f 00ðr0Þ
þr2 3:1416ZðZ þ 8f ðr0Þ þ2
3A1 � B1ð Þ
�
þ C1
3� 15:9412Zaf 0ðr0Þ þ 8:8052Za2f 00ðr0Þ
ð57Þ
The notations are
X ¼ �5:0440gþ A1 þ A2 � 2ðB1 þ B2Þ þ 17:4730Zg1
ð58Þ
r ¼ �7:5391ZðZ þ 8f ðr0ÞÞ þ A1 � B1ð Þ�3:141ZðZ þ 8f ðr0ÞÞ þ A1 þ 2B1ð Þ þ 21:765Zaf 0ðr0Þ
� ;
ð59Þ
Finally, the anharmonic third-order elastic constants
(TOECs) for zinc-blende structure are as follows:
C111 ¼e2
4a40:5184gþ 1
9ðC1 � 6B1 � 3A1Þ þ
1
4ðC2 � B2 � 3A2Þ
�
�2 B1 þ B1ð Þ � 9:9326Zg1 þ 2:522Zg2
;
ð60Þ
C112 ¼e2
4a40:3828gþ 1
9ðC1 þ 3B1 � 3A1Þ þ
1
8ðC2 þ 3B2 � 3A2Þ
�
� 11:642Zg1 þ 2:522Zg2
;
ð61Þ
C123 ¼e2
4a46:1585gþ 1
9ðC1 þ 3B1 � 3A1Þ � 12:5060Zg1 þ 2:5220Zg2
� ;
ð62Þ
C144 ¼e2
4a46:1585gþ 1
9ðC1 þ 3B1 � 3A1Þ � 4:1681Zg1 þ :8407zg2þ
�
þr �3:3507g� 2
9C1 þ 13:5486Zg1 � 1:681Zg2
�
þr2 �1:5637gþ 2
3A1 � B1ð Þ þ C1
9� 5:3138Zg1 þ 2:9350Zg2
� �
ð63Þ
244 J Theor Appl Phys (2015) 9:221–249
123
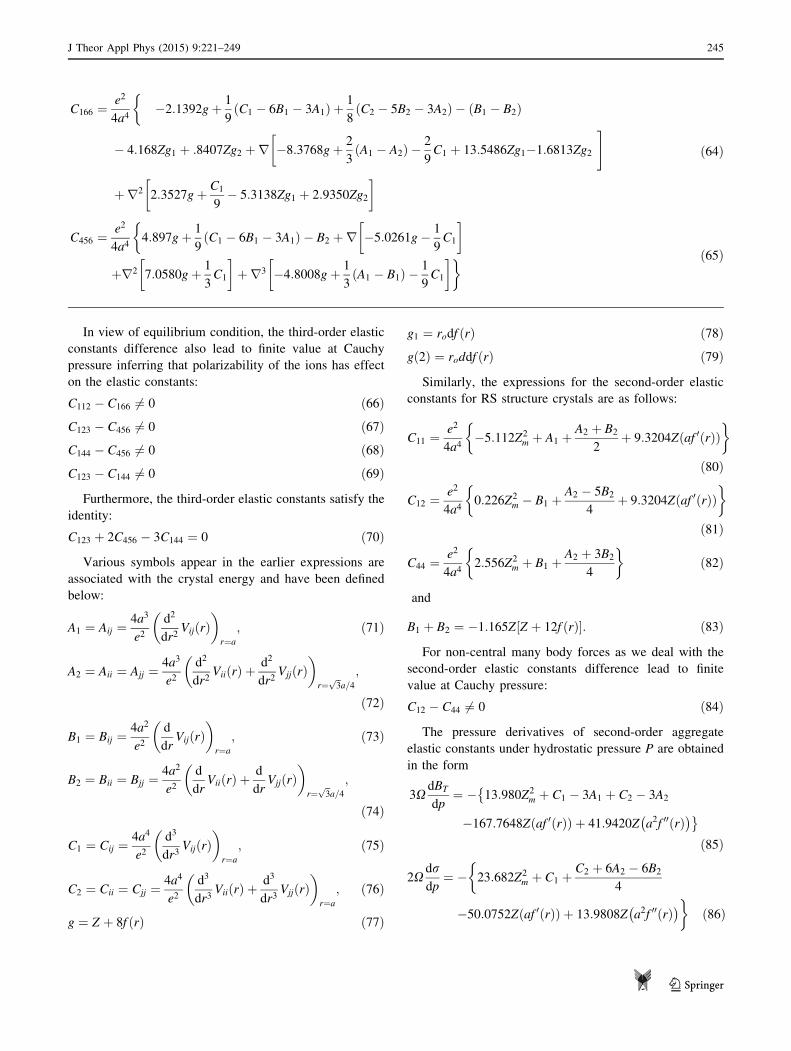
In view of equilibrium condition, the third-order elastic
constants difference also lead to finite value at Cauchy
pressure inferring that polarizability of the ions has effect
on the elastic constants:
C112 � C166 6¼ 0 ð66ÞC123 � C456 6¼ 0 ð67ÞC144 � C456 6¼ 0 ð68ÞC123 � C144 6¼ 0 ð69Þ
Furthermore, the third-order elastic constants satisfy the
identity:
C123 þ 2C456 � 3C144 ¼ 0 ð70Þ
Various symbols appear in the earlier expressions are
associated with the crystal energy and have been defined
below:
A1 ¼ Aij ¼4a3
e2d2
dr2VijðrÞ
r¼a
; ð71Þ
A2 ¼ Aii ¼ Ajj ¼4a3
e2d2
dr2ViiðrÞ þ
d2
dr2VjjðrÞ
r¼ffiffi3
pa=4
;
ð72Þ
B1 ¼ Bij ¼4a2
e2d
drVijðrÞ
r¼a
; ð73Þ
B2 ¼ Bii ¼ Bjj ¼4a2
e2d
drViiðrÞ þ
d
drVjjðrÞ
r¼ffiffi3
pa=4
;
ð74Þ
C1 ¼ Cij ¼4a4
e2d3
dr3VijðrÞ
r¼a
; ð75Þ
C2 ¼ Cii ¼ Cjj ¼4a4
e2d3
dr3ViiðrÞ þ
d3
dr3VjjðrÞ
r¼a
; ð76Þ
g ¼ Z þ 8f rð Þ ð77Þ
g1 ¼ rodf rð Þ ð78Þg 2ð Þ ¼ roddf rð Þ ð79Þ
Similarly, the expressions for the second-order elastic
constants for RS structure crystals are as follows:
C11 ¼e2
4a4�5:112Z2
m þ A1 þA2 þ B2
2þ 9:3204Z af 0ðrÞð Þ
� �
ð80Þ
C12 ¼e2
4a40:226Z2
m � B1 þA2 � 5B2
4þ 9:3204Z af 0ðrÞð Þ
� �
ð81Þ
C44 ¼e2
4a42:556Z2
m þ B1 þA2 þ 3B2
4
� �ð82Þ
and
B1 þ B2 ¼ �1:165Z Z þ 12f rð Þ½ �: ð83Þ
For non-central many body forces as we deal with the
second-order elastic constants difference lead to finite
value at Cauchy pressure:
C12 � C44 6¼ 0 ð84Þ
The pressure derivatives of second-order aggregate
elastic constants under hydrostatic pressure P are obtained
in the form
3XdBT
dp¼ � 13:980Z2
m þ C1 � 3A1 þ C2 � 3A2
�
�167:7648Z af 0ðrÞð Þ þ 41:9420Z a2f 00ðrÞ� ��
ð85Þ
2Xdrdp
¼ � 23:682Z2m þ C1 þ
C2 þ 6A2 � 6B2
4
�
�50:0752Z af 0ðrÞð Þ þ 13:9808Z a2f 00ðrÞ� �
�ð86Þ
C166 ¼e2
4a4�2:1392gþ 1
9ðC1 � 6B1 � 3A1Þ þ
1
8C2 � 5B2 � 3A2ð Þ
�� B1 � B2ð Þ
� 4:168Zg1 þ :8407Zg2 þr �8:3768gþ 2
3A1 � A2ð Þ � 2
9C1 þ 13:5486Zg1
��1:6813Zg2
#
þr2 2:3527gþ C1
9� 5:3138Zg1 þ 2:9350Zg2
�
ð64Þ
C456 ¼e2
4a44:897gþ 1
9ðC1 � 6B1 � 3A1Þ � B2 þr �5:0261g� 1
9C1
� �
þr2 7:0580gþ 1
3C1
� þr3 �4:8008gþ 1
3A1 � B1ð Þ � 1
9C1
� � ð65Þ
J Theor Appl Phys (2015) 9:221–249 245
123
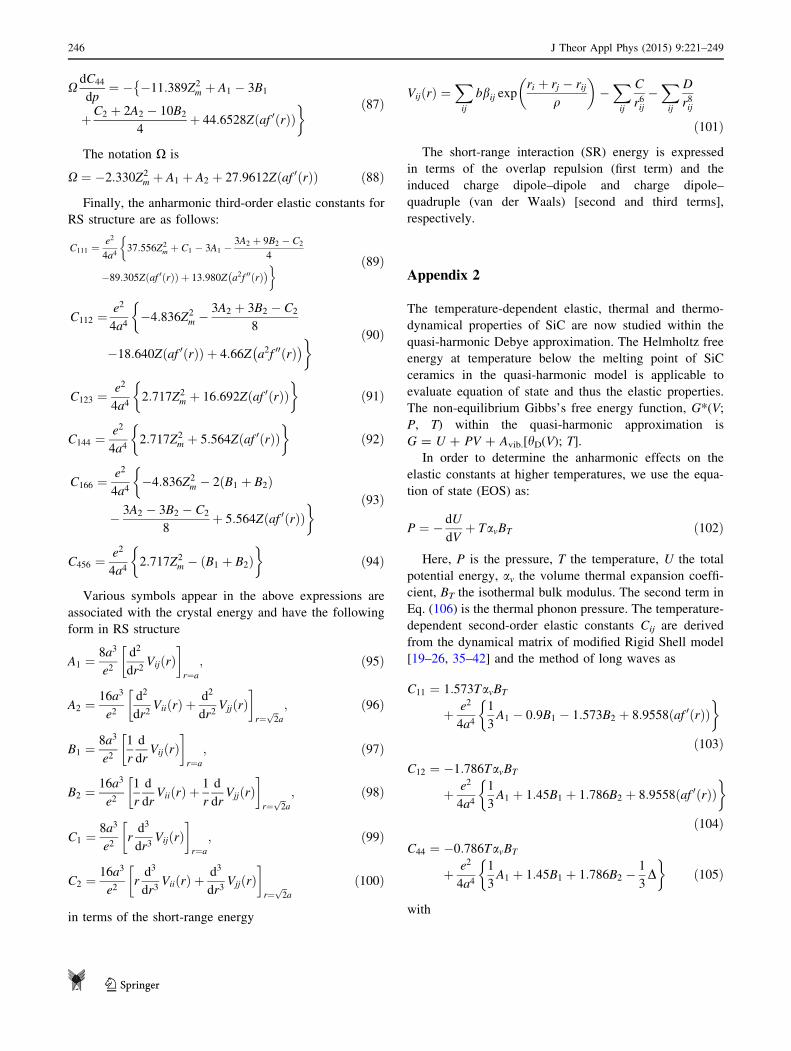
XdC44
dp¼ � �11:389Z2
m þ A1 � 3B1
�
þC2 þ 2A2 � 10B2
4þ 44:6528Z af 0ðrÞð Þ
� ð87Þ
The notation X is
X ¼ �2:330Z2m þ A1 þ A2 þ 27:9612Z af 0ðrÞð Þ ð88Þ
Finally, the anharmonic third-order elastic constants for
RS structure are as follows:
C111 ¼e2
4a437:556Z2
m þ C1 � 3A1 �3A2 þ 9B2 � C2
4
�
�89:305Z af 0ðrÞð Þ þ 13:980Z a2f 00ðrÞ� �
� ð89Þ
C112 ¼e2
4a4�4:836Z2
m � 3A2 þ 3B2 � C2
8
�
�18:640Z af 0ðrÞð Þ þ 4:66Z a2f 00ðrÞ� �
� ð90Þ
C123 ¼e2
4a4
�2:717Z2
m þ 16:692Z af 0ðrÞð Þ�
ð91Þ
C144 ¼e2
4a4
�2:717Z2
m þ 5:564Z af 0ðrÞð Þ�
ð92Þ
C166 ¼e2
4a4
��4:836Z2
m � 2ðB1 þ B2Þ
� 3A2 � 3B2 � C2
8þ 5:564Z af 0ðrÞð Þ
� ð93Þ
C456 ¼e2
4a4
�2:717Z2
m � ðB1 þ B2Þ�
ð94Þ
Various symbols appear in the above expressions are
associated with the crystal energy and have the following
form in RS structure
A1 ¼8a3
e2d2
dr2VijðrÞ
�
r¼a
; ð95Þ
A2 ¼16a3
e2d2
dr2ViiðrÞ þ
d2
dr2VjjðrÞ
�
r¼ffiffi2
pa
; ð96Þ
B1 ¼8a3
e21
r
d
drVijðrÞ
�
r¼a
; ð97Þ
B2 ¼16a3
e21
r
d
drViiðrÞ þ
1
r
d
drVjjðrÞ
�
r¼ffiffi2
pa
; ð98Þ
C1 ¼8a3
e2rd3
dr3VijðrÞ
�
r¼a
; ð99Þ
C2 ¼16a3
e2rd3
dr3ViiðrÞ þ
d3
dr3VjjðrÞ
�
r¼ffiffi2
pa
ð100Þ
in terms of the short-range energy
VijðrÞ ¼X
ij
bbij expri þ rj � rij
q
�X
ij
C
r6ij�X
ij
D
r8ij
ð101Þ
The short-range interaction (SR) energy is expressed
in terms of the overlap repulsion (first term) and the
induced charge dipole–dipole and charge dipole–
quadruple (van der Waals) [second and third terms],
respectively.
Appendix 2
The temperature-dependent elastic, thermal and thermo-
dynamical properties of SiC are now studied within the
quasi-harmonic Debye approximation. The Helmholtz free
energy at temperature below the melting point of SiC
ceramics in the quasi-harmonic model is applicable to
evaluate equation of state and thus the elastic properties.
The non-equilibrium Gibbs’s free energy function, G*(V;
P, T) within the quasi-harmonic approximation is
G = U ? PV ? Avib.[hD(V); T].In order to determine the anharmonic effects on the
elastic constants at higher temperatures, we use the equa-
tion of state (EOS) as:
P ¼ � dU
dVþ TavBT ð102Þ
Here, P is the pressure, T the temperature, U the total
potential energy, av the volume thermal expansion coeffi-
cient, BT the isothermal bulk modulus. The second term in
Eq. (106) is the thermal phonon pressure. The temperature-
dependent second-order elastic constants Cij are derived
from the dynamical matrix of modified Rigid Shell model
[19–26, 35–42] and the method of long waves as
C11 ¼ 1:573TavBT
þ e2
4a41
3A1 � 0:9B1 � 1:573B2 þ 8:9558 af 0ðrÞð Þ
� �
ð103Þ
C12 ¼ �1:786TavBT
þ e2
4a41
3A1 þ 1:45B1 þ 1:786B2 þ 8:9558 af 0ðrÞð Þ
� �
ð104Þ
C44 ¼ �0:786TavBT
þ e2
4a41
3A1 þ 1:45B1 þ 1:786B2 �
1
3D
� �ð105Þ
with
246 J Theor Appl Phys (2015) 9:221–249
123
D ¼ A1 þ 6:77B1 þ 7:78B2 � 7:77 TavBT
4a4
e2
� �ðA1 þ 2B1Þf
�
þ 3ðA2 þ 2B2Þg�1i
ð106Þ
and
TavBT ¼ e2
4a41:9395Z½Z þ 8f ðr0Þ� þ ðB1 þ B2Þ½ � ð107Þ
Herein, the potential energy incorporates the long-range
Coulomb with charge transfer interactions, covalent nature
of bonds, and short-range overlap repulsive interaction up
to second-neighbour as well charge dipole–dipole and
charge dipole–quadruple (van der Waals) interaction.
We use equilibrium condition to obtain temperature
dependence of hardness and range parameters as
rdUðrÞdr
����
����r¼r0
¼ 3TavVBT ð108Þ
Here, V is the unit cell volume of SiC.
References
1. Levinshteæin, M.E., Rumyantsev, S.L., Shur, M.: Properties of
advanced semiconductor materials: GaN, AlN, InN, BN, SiC,
SiGe. Wiley, New York (2001)
2. Parfenova, I.I.: Substitutional 3d impurities in cubic silicon car-
bide. Semiconductors 38, 189 (2004)
3. Yoshida, M., Onodera, A., Ueno Takemura, M.K., Shimomura,
O.: Pressure-induced phase transition in SiC. Phys. Rev. B 48,10587 (1993)
4. Sekine, T., Kobayashi, T.: Shock compression of 6H polytype
SiC to 160 GPa. Phys. Rev. B 55, 803 (1997)
5. Chang, K.J., Cohen, M.L.: Ab initio pseudopotential study of
structural and high-pressure properties of SiC. Phys. Rev. B 35,8196 (1987)
6. Miao, M.S., Lambrecht, W.R.L.: Unified path for high-pressure
transitions of SiC polytypes to the rocksalt structure. Phys. Rev.
B 68, 92103 (2003)
7. Durandurdu, M., Drabold, D.A.: Ab initio simulations of the
structural phase transformation of 2H-SiC at high pressure. Phys.
Rev. B 75, 235204 (2007)
8. Shimojo, F., Ebbsj, O.I., Lalia, R., Nakano, A., Rino, J.P.,
Vashista, P.: Molecular dynamics simulation of structural trans-
formation in silicon carbide under pressure. Phys. Rev. Lett. 84,3338 (2000)
9. Yu-Ping, L., Duan-Wei, H., Jun, Z., Xiang Dong, Y.: First-
principles study of pressure-induced phase transition in silicon
carbide. Phys. B 403, 3543 (2008)
10. Vashishta, P., Kalia, R.K., Nakano, A.: Interaction potential for
silicon carbide: A molecular dynamics study of elastic constants
and vibrational density of states for crystalline and amorphous
silicon carbide. J. Appl. Phys. 101, 103515 (2007)
11. Cheong, B.H.K., Chang, J., Cohen, M.L.: Pressure dependences
of band gaps and optical-phonon frequency in cubic SiC. Phys.
Rev. B 44, 1053 (1991)
12. Miao, M.S., Prikhodko, M., Lambrecht, W.R.L.: Changes of the
geometry and band structure of SiC along the orthorhombic high-
pressure transition path between the zinc-blende and rocksalt
structures. Phys. Rev. B 66, 64107 (2002)
13. Miao, M.S., Prikhodko, M., Lambrecht, W.R.L.: Orthorhombic
intermediate state in the zinc blende to rocksalt transformation
path of SiC at high pressure. Phys. Rev. Lett. 88, 18960 (2002)
14. Durandurdu, M.: Pressure-induced phase transition of SiC.
J. Phys. Condens. Matter 16, 4411–4417 (2004)
15. Stillinger, F.H., Weber, T.A.: Computer-simulation of local order
in condensed phases of silicon. Phys. Rev. B 31, 5262 (1985)
16. Karch, K., Bechstedt, F., Pavone, P., Strauch, D.: Pressure-de-
pendent properties of SiC polytypes. Phys. Rev. B 53, 13400 (1996)17. Oganov, A.R. (ed.): Modern methods of crystal structure pre-
diction (2011) Wiley VCH Verlag GmbH and Co. KGaA,
Weinheim
18. Dion, M., Rydberg, H., Schroder, E., Langreth, D.C., Lundqvist,
B.I.: Van der Waals density functional for general geometries.
Phys. Rev. Lett. 92, 246401 (2004)
19. Varshney, D., Kaurav, N., Sharma, P., Shah, S., Singh, R.K.:
Structural phase transition and elastic properties of ZnSe at high
pressure. Phase Transit 77, 1075 (2004)
20. Varshney, D., Sharma, P., Kaurav, N., Shah, S., Singh, R.K.:
Study of elastic properties and their pressure dependence of semi
magnetic semiconductors. J. Phys. Soc. 74, 382 (2005)
21. Varshney, D., Kaurav, N., Kinge, R., Singh, R.K.: B1-B2 struc-
tural phase transition and elastic properties of UX (X = S, Se and
Te) compounds at high pressure. J. Phys. Condens. Matter 19,236204 (2007)
22. Varshney, D., Sharma, U., Kaurav, N.: Structural phase trans-
formation and mechanical properties of semimagnetic semicon-
ductors Zn1-xMxSe (M = Mn, Fe and Cd). J. Phys. Condens.
Matter 20, 075204 (2008)
23. Varshney, D., Joshi, G., Kaurav, N., Singh, R.K.: Structural phase
transition (zincblende–rocksalt) and elastic properties in AlY
(Y = N, P and As) compounds: pressure-induced effects. J. Phys.
Chem. Solids 70, 451 (2009)
24. Varshney, D., Joshi, G.: High-pressure structural phase transition
and elastic properties of Ga1-x InxAs semiconducting compounds.
Eur. Phys. J. B 70, 523 (2009)
25. Varshney, D., Joshi, G., Varshney, M., Shriya, S.: Pressure
induced structural phase transition and elastic properties in BSb,
AlSb, GaSb and InSb compounds. Phys. B 405, 1663 (2010)
26. Varshney, D., Joshi, G., Varshney, M., Shriya, S.: Pressure
dependent elastic and structural (B 3–B1) properties of Ga based
monopnictides. J. Alloys Compd. 495, 23 (2010)
27. Hafemeister, D.W., Flygare, W.H.: Outer-shell overlap integral
as a function of distance for halogen–halogen, halogen–alkali,
and alkali–alkali ions in the alkali halide lattices. J. Chem. Phys.
Soc 43, 795 (1965)
28. Tosi, M.P.: Cohesion of ionic solids in the born model. Solid
State Phys. 16, 1 (1964)
29. Born, M., Huang, K.: Dynamical Theory of Crystal Lattices.
Clarendon, Oxford (1956)
30. Motida, K.: Szigeti charge and its correlation with hyperine
coupling constant of doped Mn2? ion in divalent metal com-
pounds. J. Phys. Soc. Jpn. 49, 213 (1980)
31. Motida, K.: Effect of covalency on phonon dispersion relations in
NaCl type alkali halide crystal. J. Phys. Soc. Jpn. 55, 1636 (1986)
32. Slater, J.C., Kirkwood, J.G.: The vander Waals forces in gases.
Phys. Rev. 37, 682 (1931)
33. Lowdin, P.O.: Quantum theory of cohesive properties of solids.
Adv. Phys. 5, 1 (1956)
34. Lundqvist, S.O.: Three body potential for alkali halides. Ark. Fys.
12, 263 (1957)
35. Varshney, D., Joshi, G., Varshney, M., Shriya, S.: Pressure
induced mechanical properties of boron-based pnictides. Solid
State Sci. 12, 864 (2010)
J Theor Appl Phys (2015) 9:221–249 247
123
36. Varshney, D., Dodiya, N., Shaikh, M.W.: Structural properties
and electrical resistivity of Na-substituted lanthanum manganites:
La1-xNaxMnO3?y (x = 0.1, 0.125 and 0.15). J. Alloys Compd.
509, 7447 (2011)
37. Varshney, D., Choudhary, D., Shaikh, M.W., Khan, E.: Electrical
resistivity behaviour of sodium substituted manganites: electron–
phonon, electron–electron and electron–magnon interactions.
Eur. Phys. J. B 76, 327 (2010)
38. Varshney, D., Kaurav, N., Kinge, R., Singh, R.K.: High-pressure
induced structural phase transition in alkaline earth CaX (X = S,
Se and Te) semiconductors: NaCl-type (B1) to CsCl-type (B2).
J. Alloys Compd. 484, 239 (2009)
39. Varshney, D., Kaurav, N., Kinge, R., Singh, R.K.: Pressure
induced phase transition (B1–B2) and elastic properties in alka-
line earth BaX (X = S, Se and Te) chalcogenides. Phase Transit.
81, 1 (2008)
40. Varshney, D., Kaurav, N., Kinge, R., Singh, R.K.: High pressure
structural (B1–B2) phase transition and elastic properties of II–VI
semiconducting Sr chalcogens. Comput. Mater. Sci. 41, 529
(2008)
41. Varshney, D., Kaurav, N., Sharma, U., Singh, R.K.: Pressure
induced phase transition and elastic properties of Y and Sc
antimonides. J. Alloys Compd. 448, 250 (2008)
42. Varshney, D., Kaurav, N., Kinge, R., Shah, S., Singh, R.K.: Study
of elastic properties and their pressure dependence of lanthanum
monochalcogenides. High Press. Res. 25, 145 (2005)
43. Tessman, J.R., Kahn, A.H., Shockley, W.: Electronic polariz-
abilities of ion in crystals. Phys. Rev. 92, 890 (1953)
44. Shannon, R.D.: Dielectric polarizabilities of ions in oxides and
fluorides. J. Appl. Phys. 73, 348 (1993)
45. Weast, R.C. (ed.): Handbook of Chemistry and Physics, 63rd edn.
CRC, BocaRaton (1982)
46. Aleksandrov, I.V., Goncharov, A.F., Stishov, S.M., Yakovenko.:
Equation of state and Raman scattering in cubic BN and SiC at
high pressure. EV, Pis’ma h.Eksp. Teor. Fiz. 50, 116 (1989)
(JETP Lett. 50, 127 (1989))
47. Feldman, D.W., Parker, H., Choyke, W., Patric, L.: Phonon dis-
persion curves by Raman scattering in SiC polytypes 3C, 4H, 6H,
15R, and 21 R. Phys. Rev. 173, 787 (1968)
48. Jun, L., Vohra, Y.K.: Raman modes of 6H polytype of silicon
carbide to ultrahigh pressures: a comparison with silicon and
diamond. Phys. Rev. Lett 72, 4105 (1994)
49. Wagman, D.D., Evans, W.H., Parker, V.B., Halow, E., Baily,
S.M., Shumm, R.H.: Selected values of chemical thermody-
namics properties, tables for the first thirty four elements in the
standard order of arrangement, Natl. Bur. Std. (U.S.) Tech. Note
No. 270-3 (U.S. GPO, Washington, DC, 1968)
50. Lambrecht, W.R.L., Segall, B., Methfessel, M., van Schilfgaarde,
M.: Calculated elastic constants and deformation potentials of
cubic SiC. Phys. Rev. B 44, 3685 (1991)
51. Murnaghan, F.D.: The compressibility of media under extreme,
pressures. Proc. Natl. Acad. Sci. U. S. A. 3, 244 (1944)
52. Goel, P., Choudhury, N., Chaplot, S.L.: Superionic behavior of
lithium oxide Li2O: a lattice dynamics and molecular dynamics
study. Phys. Rev. B 70, 174307 (2004)
53. Xiao-Feng, Li, Xiang-Rong, Chen, Chuan-Min, Meng, Guang-Fu,
Ji: Ab initio calculations of elastic constants and thermodynamic
properties of Li2O for high temperatures and pressures. Solid
State Commun. 139, 197–200 (2006)
54. Yun-Dong, G., Ze-Jin, Y., Qing-He, G., Zi-Jiang, L., Wei, D.:
The phase transition, and elastic and thermodynamic properties of
CaS derived from first-principles calculations. J. Phys. Condens.
Matter 20, 115203 (2008)
55. Kunc, K., Balkanski, M.: Nusimovici MA Lattice dynamics of
several A NB8–N compounds having the zincblende structure II.
Numerical calculations. Phys. Status Solidi (b) 72, 229 (1975)
56. Lee, D.H., Joannopoulos, J.D.: Simple scheme for deriving
atomic force constants. Application to SiC. Phys. Rev. Lett. 48,1846 (1982)
57. Denteneer, P.J.H., van Haeringen, W.: Ground-state properties of
polytypes of silicon carbide. Phys. Rev. B 33, 2831 (1986)
58. Tolpygo, K. B. Optical, elastic and piezoelectric properties of
ionic and covalent with the ZnS type lattice. F. Tverd. Tela
(Leningrad) 1960; 2:2655 Sov. Phys. Solid State 1961; 2:236759. Yean Jr, D.H., Riter, J.R.: Estimates of isothermal bulk moduli
for group iva crystals with the zinc blende structure. J. Phys.
Chem. Solids 32, 653 (1971)
60. Carnahan, R.D.J.: Elastic properties of silicon carbide. Am.
Ceram. Soc. 51, 223 (1968)
61. Churcher, N., Kunc, K., Heine, V.: Calculated ground-state
properties of silicon carbide. J. Phys. C 19, 4413 (1986)
62. Weber, W.J., Yu, N., Wang, L.M., Hess, N.J.: Temperature and
dose dependence of ion-beam-induced amorphization in a-SiC.J. Nucl. Mater. 244, 258 (1997)
63. Tang, M., Yip, S.: Lattice instability in b-SiC and simulation of
brittle fracture. J. Appl. Phys. 76, 2719 (1994)
64. Weber, W.J., Yu, N., Wang, L.M., Hess, N.: Structure and
properties of ion-beam-modified (6H) silicon carbide. J. Mater.
Sci. Eng. A 253, 62 (1998)
65. Gao, F., Weber, W.J.: Mechanical properties and elastic constants
due to damage accumulation and amorphization in SiC. Phys.
Rev. B 69, 224108 (2004)
66. Vukcevich, M.R.: The elastic constants of cubic crystals with
covalent and partially covalent bonds. Phys. Stat. Solidi (b) 54,435 (1972)
67. Barsch, G.R.: Relation between third-order elastic constants of
single crystals and polycrystals. J. Appl. Phys. 39, 3780 (1968)
68. Hill, R.: The elastic behavior of a crystalline aggregate. Proc.
Phys. Soc. (Lond.) 65A, 349 (1952)
69. Voigt, W.: Lehrbuch der Kristallphysik. Teubner, Leipzig (1928)
70. Reuss, A.: Calculation of the flow limits of mixed crystals on the
basis of the plasticity of monocrystals. Angew Z. Math. Mech. 9,49 (1929)
71. Takahiro, M., Tetsuro, N., Yasuaki, N., Katsuhiro, K., Tastuya,
Y., Hidetoshi, N., Satoshi, N.: Measurement of high-temperature
elastic properties of ceramics using a laser ultrasonic method.
J. Am. Ceram. Soc. 84, 1521–1525 (2001)
72. Pugh, S.F.: Relations between the elastic moduli and the plastic
properties of polycrystalline pure metals. Philos. Mag. 45, 823(1954)
73. Frantsevich, N., Voronov, F.F., Bokuta, S.A.: In: Frantsevich, I.
N. (ed.) Elastic Constants and Elastic Moduli of Metals and
Insulators Handbook, vol. 60. Naukova Dumka, Kiev (1983)
74. Schreiber, E., Anderson, O.L., Soga, N.: Elastic constants and
Their Measurements. McGraw-Hill, New York (1973)
75. Harrison, W.A.: Electronic Structure and Properties of Solids.
Dover, New York (1989)
76. Bouhemadou, A., Khenata, R., Kharoubi, M., Seddik, T., Reshak,
A.H., Al-Douri, Y.: FP-APW? lo calculations of the elastic
properties in zinc-blende III-P compounds under pressure effects.
Comput. Mater. Sci 45, 474 (2009)
77. Maachou, A., Aboura, H., Amrani, B., Khenata, R., Bin Omran,
S., Varshney, D.: Structural stabilities, elastic and thermody-
namic properties of scandium chalcogenides via first-principles
calculations. Comput. Mater. Sci. 50, 3123 (2011)
78. Kleinman, L.: Deformation potentials in silicon. I. Uniaxial
strain. Phys. Rev. 128, 2614 (1962)
79. Kim, K., Lambrecht,W.R.L., Segal, B.: Electronic structure of GaN
with strain and phonon distortions. Phys. Rev. B 50, 1502 (1994)80. Blackman, M. The specific heat of solids. Proc. R. Soc. Lond. A
1942; 181:58; ibid 1937; 159: 416; 1935; 149:126; 1935;
148:384; 1935; 148:365
248 J Theor Appl Phys (2015) 9:221–249
123

81. Blackman, M.: The specific heat of solids. Proc. R. Soc. Lond. A
159, 416 (1937)
82. Blackman, M.: The specific heat of solids. Proc. R. Soc. Lond. A
149, 126 (1935)
83. Blackman, M.: The specific heat of solids. Proc. R. Soc. Lond. A
148, 384 (1935)
84. Blackman, M.: The specific heat of solids. Proc. R. Soc. Lond. A
148, 365 (1935)
85. Gopal, E.S.R.: Specific heats at low temperatures. Plenum Press,
New York (1966)
86. Tari, A.: The Specific Heat of Matter at Low Temperatures.
Imperial College Press, London (2003)
J Theor Appl Phys (2015) 9:221–249 249
123