Embed Size (px)
Citation preview
F
Wa
b
c
a
ARAA
KMNPTT
1
fwi
tritw[ts
ceic
bs
AT
(
0d
Electric Power Systems Research 79 (2009) 539–549
Contents lists available at ScienceDirect
Electric Power Systems Research
journa l homepage: www.e lsev ier .com/ locate /epsr
uzzy risk index for power transformer failures due to external short-circuits
ilfredo C. Floresa,∗, Enrique Mombellob, José A. Jardini c, Giuseppe Rattáa
Instituto de Energía Eléctrica, National University of San Juan, Av. Libertador San Martín, 1109 (oeste), J5400ARL, San Juan, ArgentinaCONICET, at Instituto de Energía Eléctrica, National University of San Juan, Av. Libertador San Martín, 1109 (oeste), J5400ARL, San Juan, ArgentinaUniversity of São Paulo, Department of Engineering of Energy and Electric Automation, Brazil
r t i c l e i n f o
rticle history:eceived 21 December 2007ccepted 26 June 2008
a b s t r a c t
A novel methodology to assess the risk of power transformer failures caused by external faults, such asshort-circuit, taking the paper insulation condition into account, is presented. The risk index is obtainedby contrasting the insulation paper condition with the probability that the transformer withstands the
vailable online 8 November 2008
eywords:onte Carlo methodseural network applications
short-circuit current flowing along the winding during an external fault. In order to assess the risk, thisprobability and the value of the degree of polymerization of the insulating paper are regarded as inputs ofa type-2 fuzzy logic system (T2-FLS), which computes the fuzzy risk level. A Monte Carlo simulation hasbeen used to find the survival function of the currents flowing through the transformer winding during asingle-phase or a three-phase short-circuit. The Roy Billinton Test System and a real power system have
lts.
tc1Tthbeoro
roblaut
ower transformersransformersype-2 fuzzy logic systems
been used to test the resu
. Introduction
During an external short-circuit the windings of power trans-ormers are subjected to electromagnetic forces. These forces causeindings displacements and deformations. Such a phenomenon
nfluences the reliable operation of power transformers [1].If a short-circuit occurs at the secondary side of the transformer,
he short-circuit current can flow through the windings. This cur-ent is several times the rated current of the transformer. Due to thisncreased short-circuit current the transformer winding is proneo undergo mechanical fatigue due to the electromagnetic forces,hich are proportional to the square of the short-circuit current
2].In case of a winding damage, long transformer downtimes areo be expected since the repairing time can be very long and inome cases the fault disables completely the equipment [3].
On the other hand, when the transformer’s insulating paperondition reaches a questionable aging level, the ability of thequipment to withstand an external short-circuit decrease signif-cantly. This is due to the fact that cellulose in poor condition can
ause an internal fault due to transient stresses [4].The mechanical strength of the insulating paper can be assessedy measuring the degree of polymerization (DP). The DP repre-ents the number of monomers � of glucose C6H10O5 present in
∗ Corresponding author at: Department of Physics, Universidad Nacionalutónoma de Honduras, Tegucigalpa, MDC, Honduras, Central America.el.: +1 504 2303175.
E-mail addresses: [email protected], [email protected]. Flores).
attds
issi
378-7796/$ – see front matter © 2008 Elsevier B.V. All rights reserved.oi:10.1016/j.epsr.2008.06.021
© 2008 Elsevier B.V. All rights reserved.
he paper cellulose molecules [5]. During the manufacturing pro-ess of a transformer, the DP of the paper is between 1000 and300, but its aging in service conditions reduces it considerably.he mechanical strength of the paper falls down to 20% of its ini-ial value when the DP is 150. Below this value, the paper does notave any mechanical strength. Usually, it is considered that with DPelow to 200 the paper loses all its mechanical properties and thequipment is susceptible to damage [6]. However, from the pointf view of short-circuits it is considered that the transformer haseached its end of life when the DP has reached a value lower thanr equal to 450 [7].
A novel methodology to assess the power transformer failureisk under short-circuits is presented in this work. This methodol-gy takes into account the condition of the paper insulation on theasis of its DP and the probability (So) that the current (Ikk), circu-
ating through the transformer during short-circuits, be grater thanspecific value. In order to find this probability a Monte Carlo sim-lation, using a test system, was performed. Also, it is implementedhe analysis in a real power system. Subsequently, the values of DPnd probability are used as input of a T2-FLS (Type-2 fuzzy logic sys-ems), which evaluates the risk level of the device. The results showhat it is feasible to evaluate the risk level of a power transformerue to external short-circuit faults. For the sake of simplicity, onlyingle-phase and three-phase faults were simulated.
The structure of the paper is as follows. The procedure for obtain-
ng the survival function (S) of the short-circuit current (Ikk) ishown in Section 2. The calculation algorithm for Ikk and S is alsohown in this section. Section 3 gives a brief overview of fuzzynference systems. The T2-FLS used for the risk analysis is shown in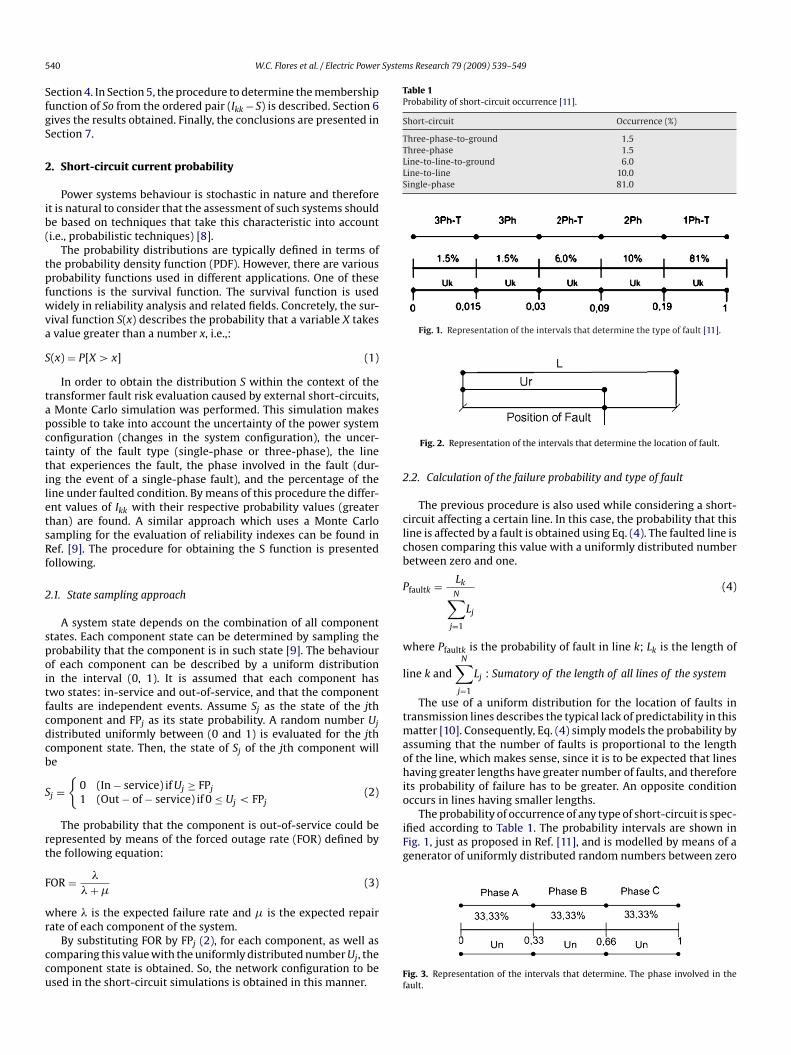
5 Systems Research 79 (2009) 539–549
SfgS
2
ib(
tpfwva
S
tapcttiletsRf
2
spoitfcdcb
S
rt
F
wr
ccu
Table 1Probability of short-circuit occurrence [11].
Short-circuit Occurrence (%)
Three-phase-to-ground 1.5Three-phase 1.5Line-to-line-to-ground 6.0Line-to-line 10.0Single-phase 81.0
Fig. 1. Representation of the intervals that determine the type of fault [11].
2
clcb
P
w
l
tmaohio
The probability of occurrence of any type of short-circuit is spec-ified according to Table 1. The probability intervals are shown inFig. 1, just as proposed in Ref. [11], and is modelled by means of agenerator of uniformly distributed random numbers between zero
40 W.C. Flores et al. / Electric Power
ection 4. In Section 5, the procedure to determine the membershipunction of So from the ordered pair (Ikk − S) is described. Section 6ives the results obtained. Finally, the conclusions are presented inection 7.
. Short-circuit current probability
Power systems behaviour is stochastic in nature and thereforet is natural to consider that the assessment of such systems shoulde based on techniques that take this characteristic into accounti.e., probabilistic techniques) [8].
The probability distributions are typically defined in terms ofhe probability density function (PDF). However, there are variousrobability functions used in different applications. One of theseunctions is the survival function. The survival function is usedidely in reliability analysis and related fields. Concretely, the sur-
ival function S(x) describes the probability that a variable X takesvalue greater than a number x, i.e.,:
(x) = P[X > x] (1)
In order to obtain the distribution S within the context of theransformer fault risk evaluation caused by external short-circuits,Monte Carlo simulation was performed. This simulation makesossible to take into account the uncertainty of the power systemonfiguration (changes in the system configuration), the uncer-ainty of the fault type (single-phase or three-phase), the linehat experiences the fault, the phase involved in the fault (dur-ng the event of a single-phase fault), and the percentage of theine under faulted condition. By means of this procedure the differ-nt values of Ikk with their respective probability values (greaterhan) are found. A similar approach which uses a Monte Carloampling for the evaluation of reliability indexes can be found inef. [9]. The procedure for obtaining the S function is presentedollowing.
.1. State sampling approach
A system state depends on the combination of all componenttates. Each component state can be determined by sampling therobability that the component is in such state [9]. The behaviourf each component can be described by a uniform distributionn the interval (0, 1). It is assumed that each component haswo states: in-service and out-of-service, and that the componentaults are independent events. Assume Sj as the state of the jthomponent and FPj as its state probability. A random number Ujistributed uniformly between (0 and 1) is evaluated for the jthomponent state. Then, the state of Sj of the jth component wille
j ={
0 (In − service) if Uj ≥ FPj
1 (Out − of − service) if 0 ≤ Uj < FPj(2)
The probability that the component is out-of-service could beepresented by means of the forced outage rate (FOR) defined byhe following equation:
OR = �
� + �(3)
here � is the expected failure rate and � is the expected repair
ate of each component of the system.By substituting FOR by FPj (2), for each component, as well asomparing this value with the uniformly distributed number Uj, theomponent state is obtained. So, the network configuration to besed in the short-circuit simulations is obtained in this manner.
Ff
Fig. 2. Representation of the intervals that determine the location of fault.
.2. Calculation of the failure probability and type of fault
The previous procedure is also used while considering a short-ircuit affecting a certain line. In this case, the probability that thisine is affected by a fault is obtained using Eq. (4). The faulted line ishosen comparing this value with a uniformly distributed numberetween zero and one.
faultk = Lk
N∑j=1
Lj
(4)
here Pfaultk is the probability of fault in line k; Lk is the length of
ine k andN∑
j=1
Lj : Sumatory of the length of all lines of the system
The use of a uniform distribution for the location of faults inransmission lines describes the typical lack of predictability in this
atter [10]. Consequently, Eq. (4) simply models the probability byssuming that the number of faults is proportional to the lengthf the line, which makes sense, since it is to be expected that linesaving greater lengths have greater number of faults, and therefore
ts probability of failure has to be greater. An opposite conditionccurs in lines having smaller lengths.
ig. 3. Representation of the intervals that determine. The phase involved in theault.
System
asb
tiblT
s
pit
i2
W.C. Flores et al. / Electric Power
nd one (Uk). As it was mentioned in the previous section, onlyingle-phase and three-phase faults are considered. The formereing the most common fault [10] and latter the most severe.
A similar procedure is used while considering the randomness ofhe fault location in the line. The percentage of length of line faileds modelled by means of uniformly distributed random numbers
etween zero and one (Ur). That is, the location of the fault in theine is considered to have a uniform probability, as shown in Fig. 2.he same assumption is made while choosing the faulted line.
The choice of the failed phase is done in the same way, i.e., con-idering the probability intervals shown in Fig. 3. This selection
emts
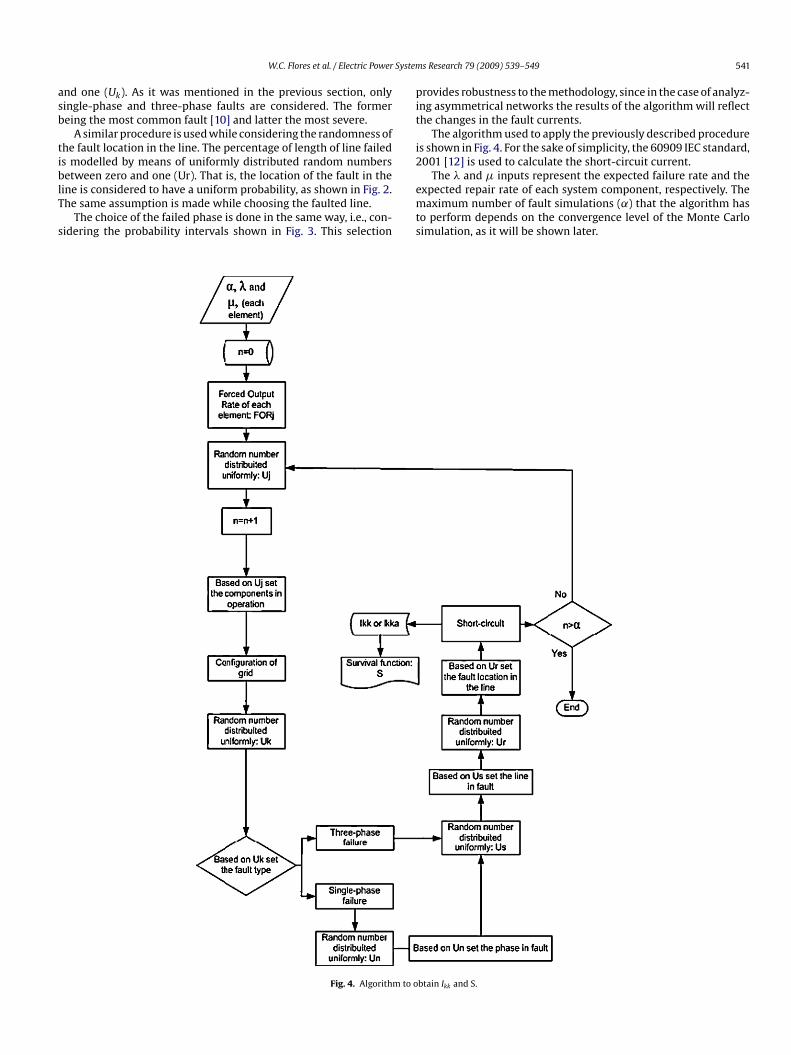
Fig. 4. Algorithm to o
s Research 79 (2009) 539–549 541
rovides robustness to the methodology, since in the case of analyz-ng asymmetrical networks the results of the algorithm will reflecthe changes in the fault currents.
The algorithm used to apply the previously described procedures shown in Fig. 4. For the sake of simplicity, the 60909 IEC standard,001 [12] is used to calculate the short-circuit current.
The � and � inputs represent the expected failure rate and thexpected repair rate of each system component, respectively. Theaximum number of fault simulations (˛) that the algorithm has
o perform depends on the convergence level of the Monte Carloimulation, as it will be shown later.
btain Ikk and S.
542 W.C. Flores et al. / Electric Power Systems Research 79 (2009) 539–549
re of
3
dti
acntbcu
fif
rtws
I
wrt
gacc
tto
A
�
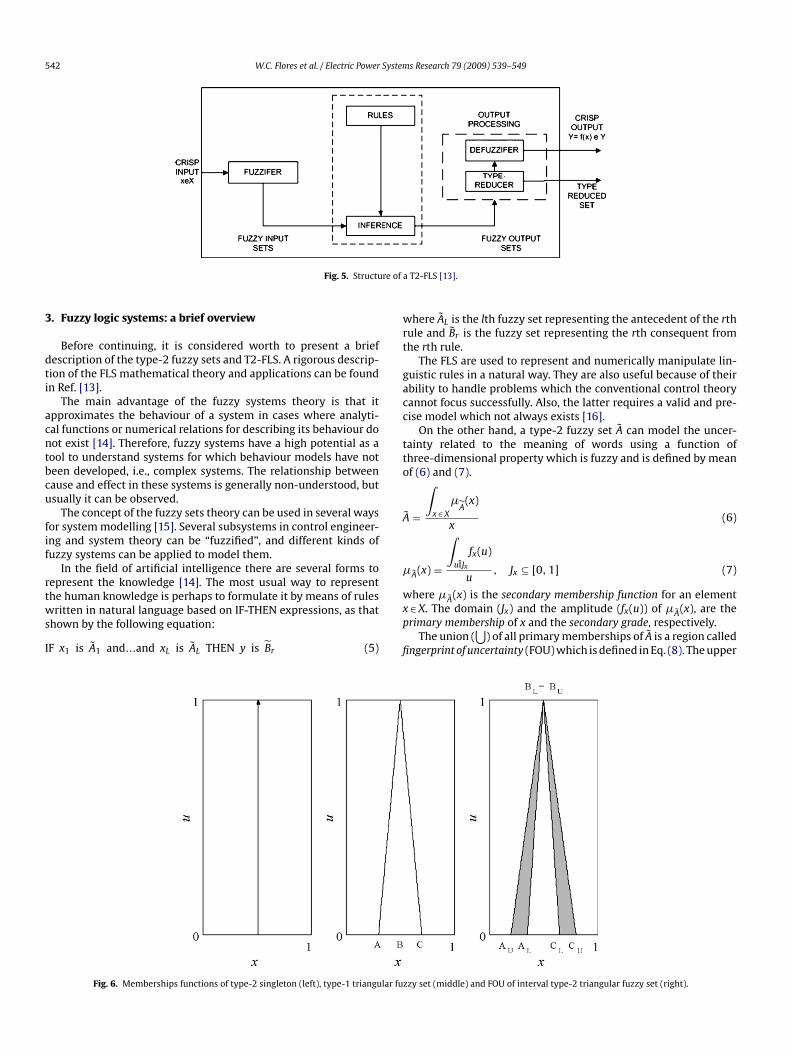
Fig. 5. Structu
. Fuzzy logic systems: a brief overview
Before continuing, it is considered worth to present a briefescription of the type-2 fuzzy sets and T2-FLS. A rigorous descrip-ion of the FLS mathematical theory and applications can be foundn Ref. [13].
The main advantage of the fuzzy systems theory is that itpproximates the behaviour of a system in cases where analyti-al functions or numerical relations for describing its behaviour doot exist [14]. Therefore, fuzzy systems have a high potential as aool to understand systems for which behaviour models have noteen developed, i.e., complex systems. The relationship betweenause and effect in these systems is generally non-understood, butsually it can be observed.
The concept of the fuzzy sets theory can be used in several waysor system modelling [15]. Several subsystems in control engineer-ng and system theory can be “fuzzified”, and different kinds ofuzzy systems can be applied to model them.
In the field of artificial intelligence there are several forms toepresent the knowledge [14]. The most usual way to represent
he human knowledge is perhaps to formulate it by means of rulesritten in natural language based on IF-THEN expressions, as thathown by the following equation:
F x1 is A1 and...and xL is AL THEN y is Br (5)
wxp
fi
Fig. 6. Memberships functions of type-2 singleton (left), type-1 triangular fu
a T2-FLS [13].
here AL is the lth fuzzy set representing the antecedent of the rthule and Br is the fuzzy set representing the rth consequent fromhe rth rule.
The FLS are used to represent and numerically manipulate lin-uistic rules in a natural way. They are also useful because of theirbility to handle problems which the conventional control theoryannot focus successfully. Also, the latter requires a valid and pre-ise model which not always exists [16].
On the other hand, a type-2 fuzzy set A can model the uncer-ainty related to the meaning of words using a function ofhree-dimensional property which is fuzzy and is defined by meanf (6) and (7).
˜ =
∫x ∈ X
�A(x)
x(6)
A(x) =
∫uÎJx
fx(u)
u, Jx ⊆ [0, 1] (7)
here �A(x) is the secondary membership function for an element∈ X. The domain (Jx) and the amplitude (fx(u)) of �A(x), are therimary membership of x and the secondary grade, respectively.
The union (⋃
) of all primary memberships of A is a region calledngerprint of uncertainty (FOU) which is defined in Eq. (8). The upper
zzy set (middle) and FOU of interval type-2 triangular fuzzy set (right).
W.C. Flores et al. / Electric Power Systems Research 79 (2009) 539–549 543
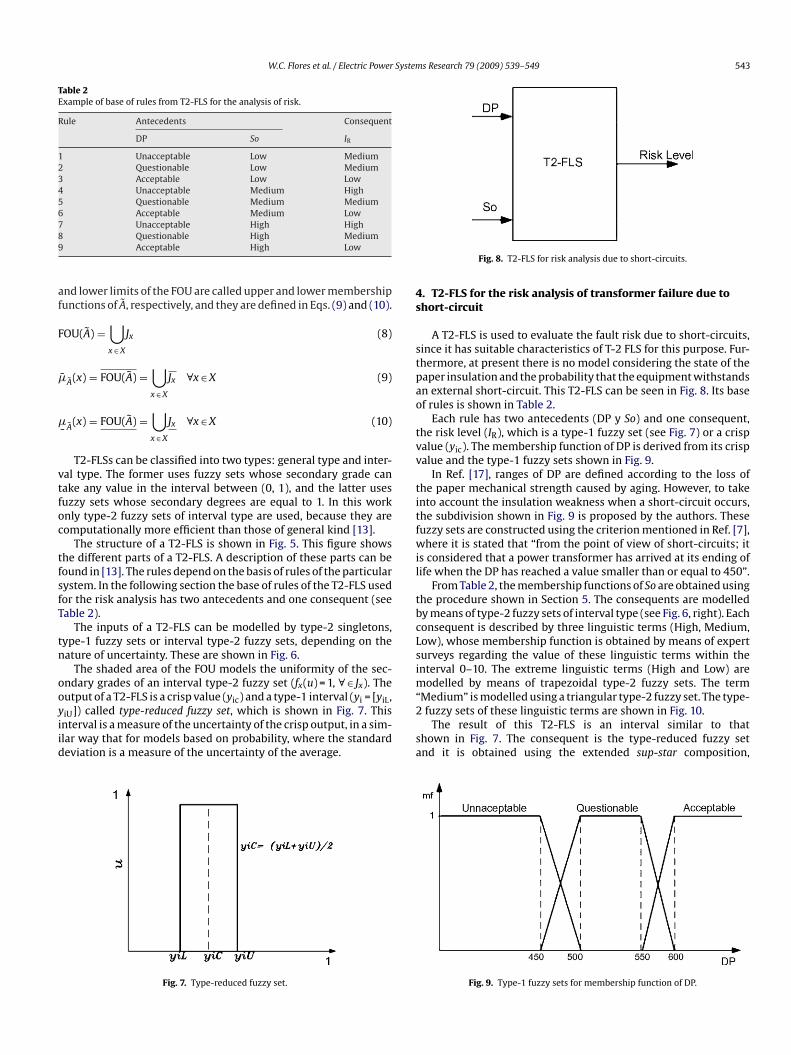
Table 2Example of base of rules from T2-FLS for the analysis of risk.
Rule Antecedents Consequent
DP So IR
1 Unacceptable Low Medium2 Questionable Low Medium3 Acceptable Low Low4 Unacceptable Medium High5 Questionable Medium Medium6 Acceptable Medium Low789
af
F
�
�
vtfoc
tfsfT
tn
ooyiid
4s
stpao
tvv
titfwil
tbcLsim“
Unacceptable High HighQuestionable High MediumAcceptable High Low
nd lower limits of the FOU are called upper and lower membershipunctions of A, respectively, and they are defined in Eqs. (9) and (10).
OU(A) =⋃x ∈ X
Jx (8)
¯ A(x) = FOU(A) =⋃x ∈ X
Jx ∀x ∈ X (9)
- A(x) = FOU(A) =
⋃x ∈ X
Jx ∀x ∈ X (10)
T2-FLSs can be classified into two types: general type and inter-al type. The former uses fuzzy sets whose secondary grade canake any value in the interval between (0, 1), and the latter usesuzzy sets whose secondary degrees are equal to 1. In this worknly type-2 fuzzy sets of interval type are used, because they areomputationally more efficient than those of general kind [13].
The structure of a T2-FLS is shown in Fig. 5. This figure showshe different parts of a T2-FLS. A description of these parts can beound in [13]. The rules depend on the basis of rules of the particularystem. In the following section the base of rules of the T2-FLS usedor the risk analysis has two antecedents and one consequent (seeable 2).
The inputs of a T2-FLS can be modelled by type-2 singletons,ype-1 fuzzy sets or interval type-2 fuzzy sets, depending on theature of uncertainty. These are shown in Fig. 6.
The shaded area of the FOU models the uniformity of the sec-ndary grades of an interval type-2 fuzzy set (fx(u) = 1, ∀∈ Jx). Theutput of a T2-FLS is a crisp value (yic) and a type-1 interval (yi = [yiL,
iU]) called type-reduced fuzzy set, which is shown in Fig. 7. Thisnterval is a measure of the uncertainty of the crisp output, in a sim-lar way that for models based on probability, where the standardeviation is a measure of the uncertainty of the average.Fig. 7. Type-reduced fuzzy set.
2
sa
Fig. 8. T2-FLS for risk analysis due to short-circuits.
. T2-FLS for the risk analysis of transformer failure due tohort-circuit
A T2-FLS is used to evaluate the fault risk due to short-circuits,ince it has suitable characteristics of T-2 FLS for this purpose. Fur-hermore, at present there is no model considering the state of theaper insulation and the probability that the equipment withstandsn external short-circuit. This T2-FLS can be seen in Fig. 8. Its basef rules is shown in Table 2.
Each rule has two antecedents (DP y So) and one consequent,he risk level (IR), which is a type-1 fuzzy set (see Fig. 7) or a crispalue (yic). The membership function of DP is derived from its crispalue and the type-1 fuzzy sets shown in Fig. 9.
In Ref. [17], ranges of DP are defined according to the loss ofhe paper mechanical strength caused by aging. However, to takento account the insulation weakness when a short-circuit occurs,he subdivision shown in Fig. 9 is proposed by the authors. Theseuzzy sets are constructed using the criterion mentioned in Ref. [7],here it is stated that “from the point of view of short-circuits; it
s considered that a power transformer has arrived at its ending ofife when the DP has reached a value smaller than or equal to 450”.
From Table 2, the membership functions of So are obtained usinghe procedure shown in Section 5. The consequents are modelledy means of type-2 fuzzy sets of interval type (see Fig. 6, right). Eachonsequent is described by three linguistic terms (High, Medium,ow), whose membership function is obtained by means of experturveys regarding the value of these linguistic terms within thenterval 0–10. The extreme linguistic terms (High and Low) are
odelled by means of trapezoidal type-2 fuzzy sets. The termMedium” is modelled using a triangular type-2 fuzzy set. The type-
fuzzy sets of these linguistic terms are shown in Fig. 10.The result of this T2-FLS is an interval similar to thathown in Fig. 7. The consequent is the type-reduced fuzzy setnd it is obtained using the extended sup-star composition,
Fig. 9. Type-1 fuzzy sets for membership function of DP.
544 W.C. Flores et al. / Electric Power Systems Research 79 (2009) 539–549
F
us
5
is[
tmStitckist
iWthndt
“r
aHttoeq
bTtp
trb
6
sstroitt
6
tors are considered in the simulation. The symmetrical short-circuit
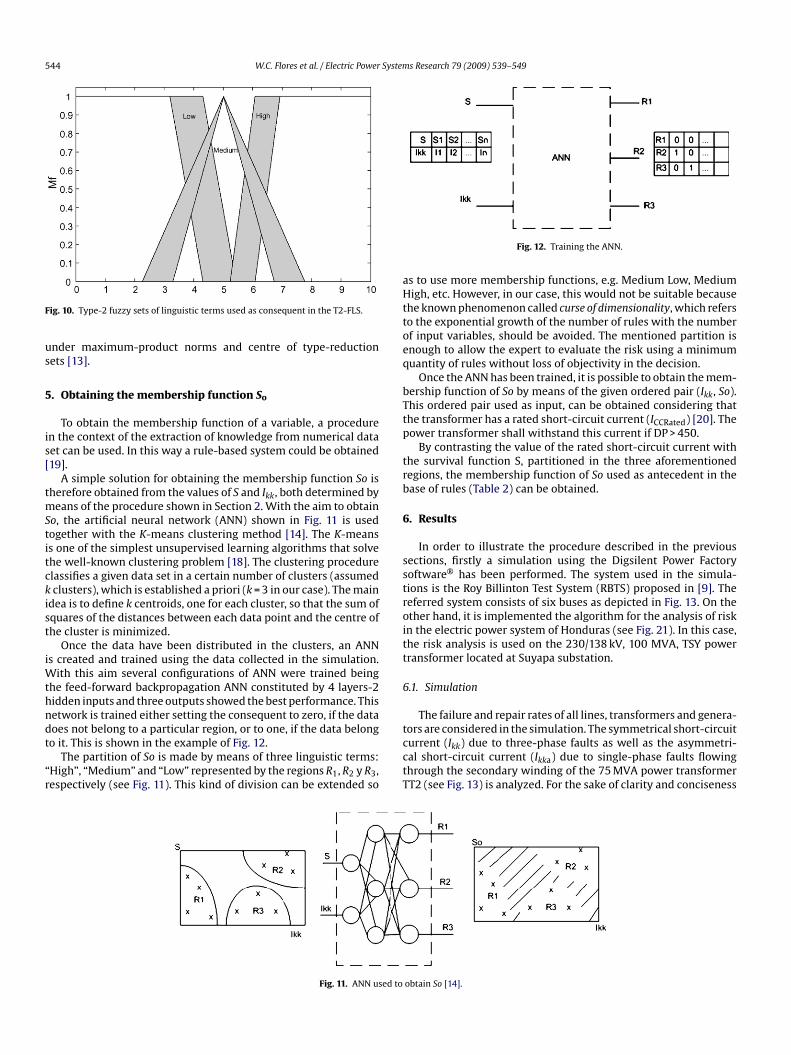
ig. 10. Type-2 fuzzy sets of linguistic terms used as consequent in the T2-FLS.
nder maximum-product norms and centre of type-reductionets [13].
. Obtaining the membership function So
To obtain the membership function of a variable, a proceduren the context of the extraction of knowledge from numerical dataet can be used. In this way a rule-based system could be obtained19].
A simple solution for obtaining the membership function So isherefore obtained from the values of S and Ikk, both determined by
eans of the procedure shown in Section 2. With the aim to obtaino, the artificial neural network (ANN) shown in Fig. 11 is usedogether with the K-means clustering method [14]. The K-meanss one of the simplest unsupervised learning algorithms that solvehe well-known clustering problem [18]. The clustering procedurelassifies a given data set in a certain number of clusters (assumedclusters), which is established a priori (k = 3 in our case). The main
dea is to define k centroids, one for each cluster, so that the sum ofquares of the distances between each data point and the centre ofhe cluster is minimized.
Once the data have been distributed in the clusters, an ANNs created and trained using the data collected in the simulation.
ith this aim several configurations of ANN were trained beinghe feed-forward backpropagation ANN constituted by 4 layers-2idden inputs and three outputs showed the best performance. Thisetwork is trained either setting the consequent to zero, if the dataoes not belong to a particular region, or to one, if the data belong
o it. This is shown in the example of Fig. 12.The partition of So is made by means of three linguistic terms:High”, “Medium” and “Low” represented by the regions R1, R2 y R3,espectively (see Fig. 11). This kind of division can be extended so
cctT
Fig. 11. ANN used to
Fig. 12. Training the ANN.
s to use more membership functions, e.g. Medium Low, Mediumigh, etc. However, in our case, this would not be suitable because
he known phenomenon called curse of dimensionality, which referso the exponential growth of the number of rules with the numberf input variables, should be avoided. The mentioned partition isnough to allow the expert to evaluate the risk using a minimumuantity of rules without loss of objectivity in the decision.
Once the ANN has been trained, it is possible to obtain the mem-ership function of So by means of the given ordered pair (Ikk, So).his ordered pair used as input, can be obtained considering thathe transformer has a rated short-circuit current (ICCRated) [20]. Theower transformer shall withstand this current if DP > 450.
By contrasting the value of the rated short-circuit current withhe survival function S, partitioned in the three aforementionedegions, the membership function of So used as antecedent in thease of rules (Table 2) can be obtained.
. Results
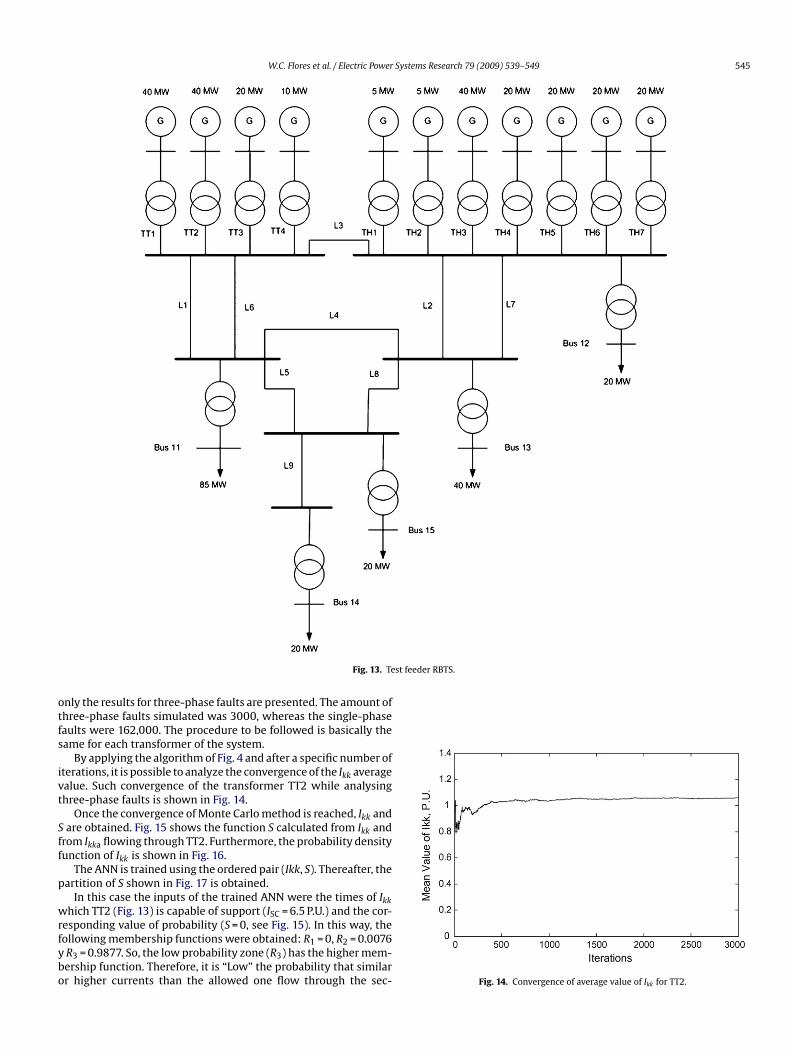
In order to illustrate the procedure described in the previousections, firstly a simulation using the Digsilent Power Factoryoftware® has been performed. The system used in the simula-ions is the Roy Billinton Test System (RBTS) proposed in [9]. Theeferred system consists of six buses as depicted in Fig. 13. On thether hand, it is implemented the algorithm for the analysis of riskn the electric power system of Honduras (see Fig. 21). In this case,he risk analysis is used on the 230/138 kV, 100 MVA, TSY powerransformer located at Suyapa substation.
.1. Simulation
The failure and repair rates of all lines, transformers and genera-
urrent (Ikk) due to three-phase faults as well as the asymmetri-al short-circuit current (Ikka) due to single-phase faults flowinghrough the secondary winding of the 75 MVA power transformerT2 (see Fig. 13) is analyzed. For the sake of clarity and conciseness
obtain So [14].
W.C. Flores et al. / Electric Power Systems Research 79 (2009) 539–549 545
st feeder RBTS.
otfs
ivt
Sff
p
wrfybo
Fig. 13. Te
nly the results for three-phase faults are presented. The amount ofhree-phase faults simulated was 3000, whereas the single-phaseaults were 162,000. The procedure to be followed is basically theame for each transformer of the system.
By applying the algorithm of Fig. 4 and after a specific number ofterations, it is possible to analyze the convergence of the Ikk averagealue. Such convergence of the transformer TT2 while analysinghree-phase faults is shown in Fig. 14.
Once the convergence of Monte Carlo method is reached, Ikk andare obtained. Fig. 15 shows the function S calculated from Ikk and
rom Ikka flowing through TT2. Furthermore, the probability densityunction of Ikk is shown in Fig. 16.
The ANN is trained using the ordered pair (Ikk, S). Thereafter, theartition of S shown in Fig. 17 is obtained.
In this case the inputs of the trained ANN were the times of Ikkhich TT2 (Fig. 13) is capable of support (ISC = 6.5 P.U.) and the cor-
esponding value of probability (S = 0, see Fig. 15). In this way, theollowing membership functions were obtained: R1 = 0, R2 = 0.0076R3 = 0.9877. So, the low probability zone (R3) has the higher mem-ership function. Therefore, it is “Low” the probability that similarr higher currents than the allowed one flow through the sec- Fig. 14. Convergence of average value of Ikk for TT2.
546 W.C. Flores et al. / Electric Power Systems Research 79 (2009) 539–549
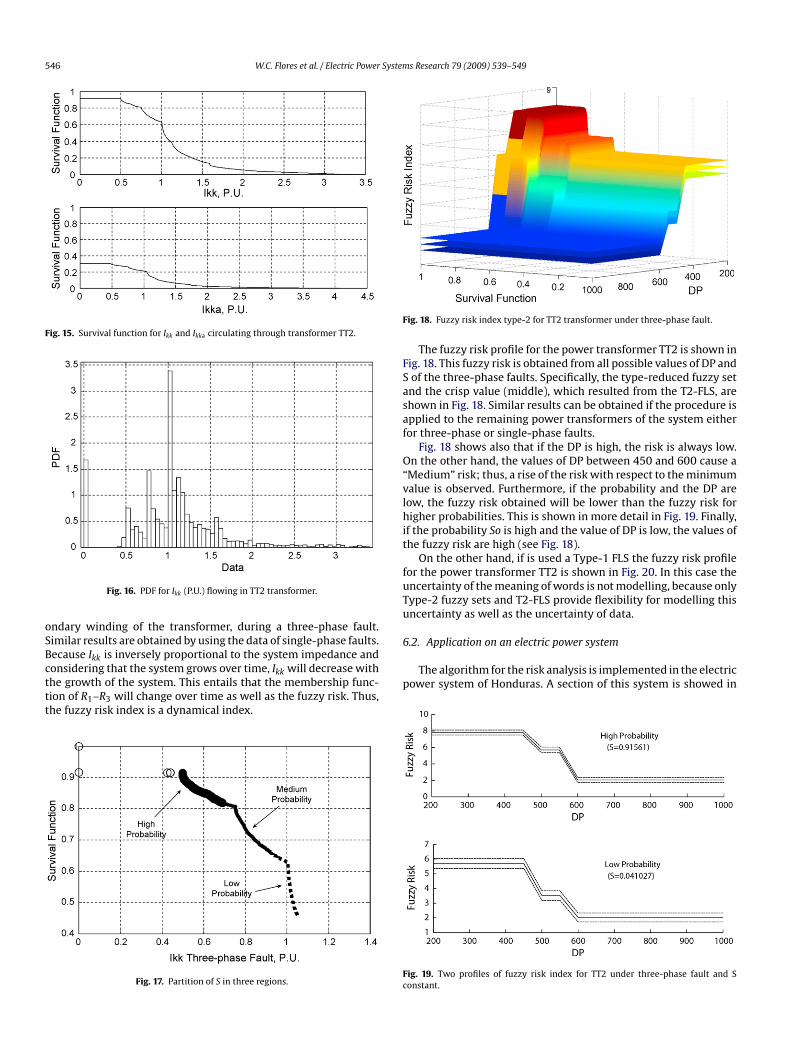
Fig. 15. Survival function for Ikk and Ikka circulating through transformer TT2.
oSBcttt
F
FSasaf
O“vlhit
fuTu
6.2. Application on an electric power system
Fig. 16. PDF for Ikk (P.U.) flowing in TT2 transformer.
ndary winding of the transformer, during a three-phase fault.imilar results are obtained by using the data of single-phase faults.ecause Ikk is inversely proportional to the system impedance and
onsidering that the system grows over time, Ikk will decrease withhe growth of the system. This entails that the membership func-ion of R1–R3 will change over time as well as the fuzzy risk. Thus,he fuzzy risk index is a dynamical index.Fig. 17. Partition of S in three regions.
p
Fc
ig. 18. Fuzzy risk index type-2 for TT2 transformer under three-phase fault.
The fuzzy risk profile for the power transformer TT2 is shown inig. 18. This fuzzy risk is obtained from all possible values of DP andof the three-phase faults. Specifically, the type-reduced fuzzy setnd the crisp value (middle), which resulted from the T2-FLS, arehown in Fig. 18. Similar results can be obtained if the procedure ispplied to the remaining power transformers of the system eitheror three-phase or single-phase faults.
Fig. 18 shows also that if the DP is high, the risk is always low.n the other hand, the values of DP between 450 and 600 cause a
Medium” risk; thus, a rise of the risk with respect to the minimumalue is observed. Furthermore, if the probability and the DP areow, the fuzzy risk obtained will be lower than the fuzzy risk forigher probabilities. This is shown in more detail in Fig. 19. Finally,
f the probability So is high and the value of DP is low, the values ofhe fuzzy risk are high (see Fig. 18).
On the other hand, if is used a Type-1 FLS the fuzzy risk profileor the power transformer TT2 is shown in Fig. 20. In this case thencertainty of the meaning of words is not modelling, because onlyype-2 fuzzy sets and T2-FLS provide flexibility for modelling thisncertainty as well as the uncertainty of data.
The algorithm for the risk analysis is implemented in the electricower system of Honduras. A section of this system is showed in
ig. 19. Two profiles of fuzzy risk index for TT2 under three-phase fault and Sonstant.
W.C. Flores et al. / Electric Power Systems Research 79 (2009) 539–549 547
F
Fpp
av
Ti
p
osR(p
Fig. 22. Convergence of average value of Ikk for TSY.
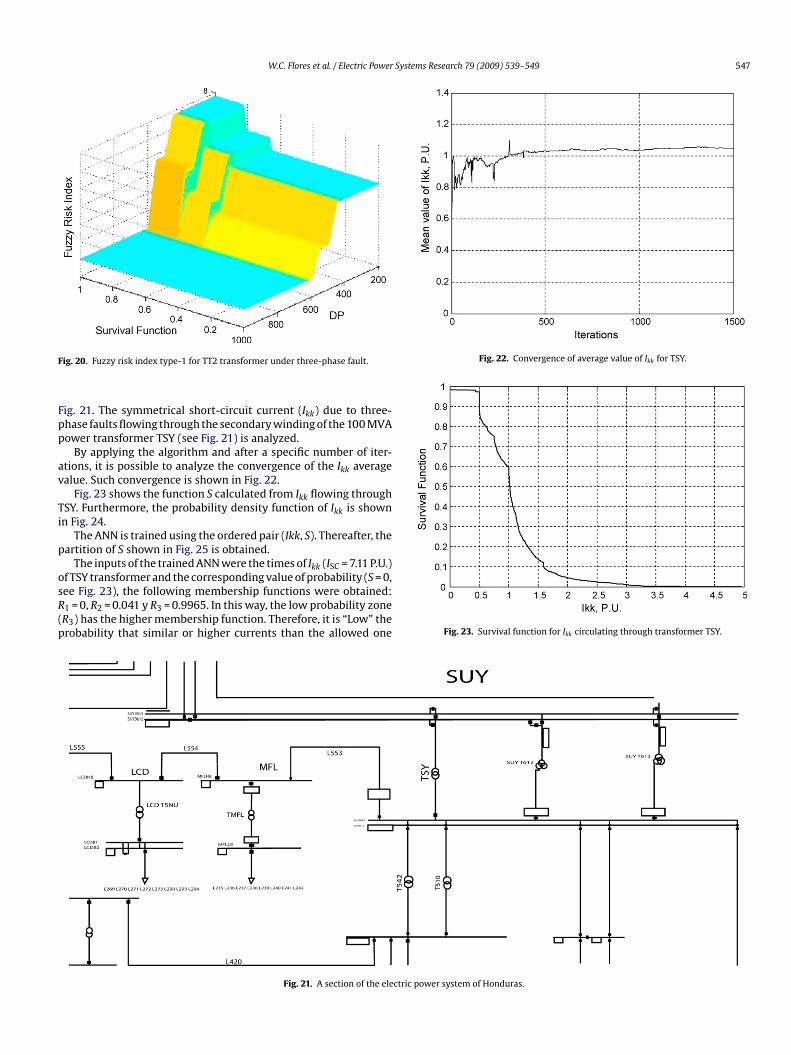
ig. 20. Fuzzy risk index type-1 for TT2 transformer under three-phase fault.ig. 21. The symmetrical short-circuit current (Ikk) due to three-hase faults flowing through the secondary winding of the 100 MVAower transformer TSY (see Fig. 21) is analyzed.
By applying the algorithm and after a specific number of iter-tions, it is possible to analyze the convergence of the Ikk averagealue. Such convergence is shown in Fig. 22.
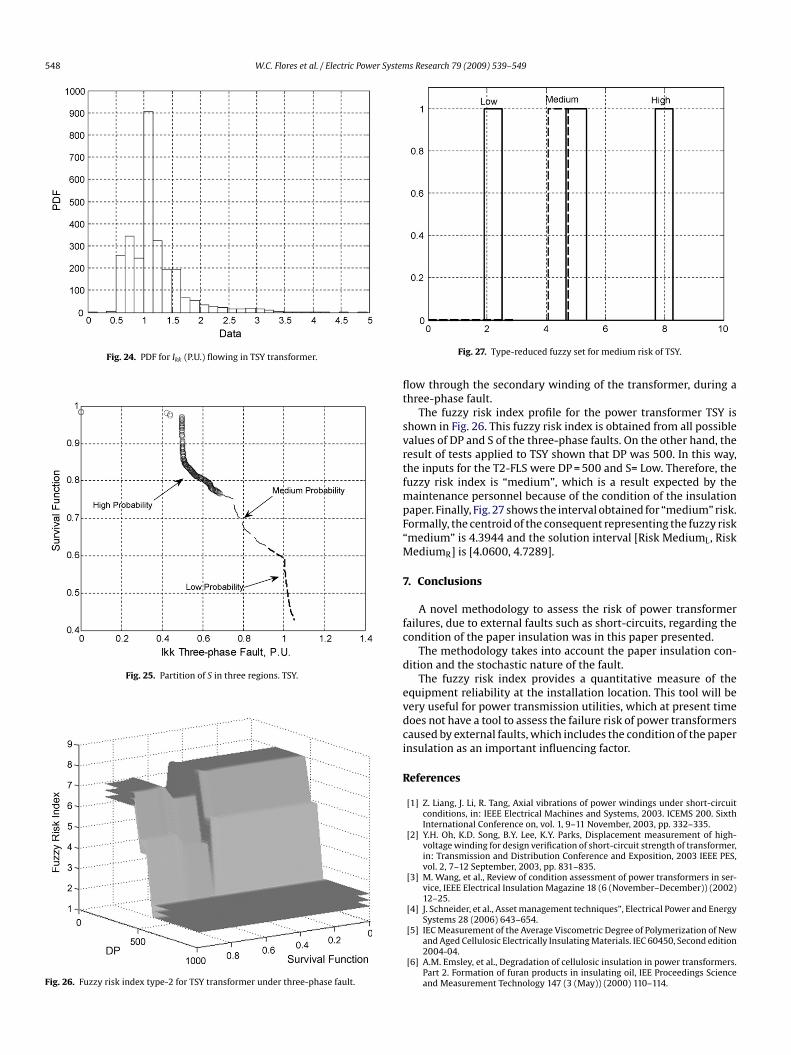
Fig. 23 shows the function S calculated from Ikk flowing throughSY. Furthermore, the probability density function of Ikk is shownn Fig. 24.
The ANN is trained using the ordered pair (Ikk, S). Thereafter, theartition of S shown in Fig. 25 is obtained.
The inputs of the trained ANN were the times of Ikk (ISC = 7.11 P.U.)f TSY transformer and the corresponding value of probability (S = 0,
ee Fig. 23), the following membership functions were obtained:1 = 0, R2 = 0.041 y R3 = 0.9965. In this way, the low probability zoneR3) has the higher membership function. Therefore, it is “Low” therobability that similar or higher currents than the allowed one Fig. 23. Survival function for Ikk circulating through transformer TSY.Fig. 21. A section of the electric power system of Honduras.
548 W.C. Flores et al. / Electric Power Systems Research 79 (2009) 539–549
Fig. 24. PDF for Ikk (P.U.) flowing in TSY transformer.
Fig. 25. Partition of S in three regions. TSY.
Fig. 26. Fuzzy risk index type-2 for TSY transformer under three-phase fault.
flt
svrtfmpF“M
7
fc
d
evdci
R
Fig. 27. Type-reduced fuzzy set for medium risk of TSY.
ow through the secondary winding of the transformer, during ahree-phase fault.
The fuzzy risk index profile for the power transformer TSY ishown in Fig. 26. This fuzzy risk index is obtained from all possiblealues of DP and S of the three-phase faults. On the other hand, theesult of tests applied to TSY shown that DP was 500. In this way,he inputs for the T2-FLS were DP = 500 and S= Low. Therefore, theuzzy risk index is “medium”, which is a result expected by the
aintenance personnel because of the condition of the insulationaper. Finally, Fig. 27 shows the interval obtained for “medium” risk.ormally, the centroid of the consequent representing the fuzzy riskmedium” is 4.3944 and the solution interval [Risk MediumL, RiskediumR] is [4.0600, 4.7289].
. Conclusions
A novel methodology to assess the risk of power transformerailures, due to external faults such as short-circuits, regarding theondition of the paper insulation was in this paper presented.
The methodology takes into account the paper insulation con-ition and the stochastic nature of the fault.
The fuzzy risk index provides a quantitative measure of thequipment reliability at the installation location. This tool will beery useful for power transmission utilities, which at present timeoes not have a tool to assess the failure risk of power transformersaused by external faults, which includes the condition of the papernsulation as an important influencing factor.
eferences
[1] Z. Liang, J. Li, R. Tang, Axial vibrations of power windings under short-circuitconditions, in: IEEE Electrical Machines and Systems, 2003. ICEMS 200. SixthInternational Conference on, vol. 1, 9–11 November, 2003, pp. 332–335.
[2] Y.H. Oh, K.D. Song, B.Y. Lee, K.Y. Parks, Displacement measurement of high-voltage winding for design verification of short-circuit strength of transformer,in: Transmission and Distribution Conference and Exposition, 2003 IEEE PES,vol. 2, 7–12 September, 2003, pp. 831–835.
[3] M. Wang, et al., Review of condition assessment of power transformers in ser-vice, IEEE Electrical Insulation Magazine 18 (6 (November–December)) (2002)12–25.
[4] J. Schneider, et al., Asset management techniques”, Electrical Power and EnergySystems 28 (2006) 643–654.
[5] IEC Measurement of the Average Viscometric Degree of Polymerization of Newand Aged Cellulosic Electrically Insulating Materials. IEC 60450, Second edition2004-04.
[6] A.M. Emsley, et al., Degradation of cellulosic insulation in power transformers.Part 2. Formation of furan products in insulating oil, IEE Proceedings Scienceand Measurement Technology 147 (3 (May)) (2000) 110–114.
System
[
[
[[
[
[
[
[
[
[
[
WRA
T2(SEaoPa
EP1gEt
JPaTpartt
Gfrom Universidad Nacional de Cuyo, San Juan, Argentina, in 1974 as electrome-
W.C. Flores et al. / Electric Power
[7] CIGRÉ Working Group A2.18, Guide for Life Management Techniques For PowerTransformers, CIGRÉ Broschure 227, 20 January 2003, CIGRÉ: Paris, France.
[8] R. Billinton, R.N. Allan, Reliability Evaluation of Power Systems, Plenum Press,USA, 1996.
[9] R. Billinton, W. Li, Reliability Assessment of Electric Power Systems Using MonteCarlo Methods, Plenum Press, New York, 1994.
10] G.J. Anders, Probability Concepts in Electric Power Systems, John Wiley andSons, New Jersey, USA, 1990, pp. 509–530.
11] U.A. Bordalo, A.B. Rodrigues, M.G. Da Silva, A new methodology for probabilis-tic short-circuit evaluation with applications in power quality analysis, IEEETransactions on Power Systems 21 (2 (May)) (2006).
12] IEC short-circuit currents in three-phase a.c. systems. IEC 60909, 2001.13] J.M. Mendel, Uncertain Rule-Based Fuzzy Logic Systems: Introduction and New
Directions, Prentice Hall, New Jersey, USA, 2004.14] Timothy J. Ross, Fuzzy Logic with Engineering Applications, 2nd edition (August
16, 2004), John Wiley and Sons: New Jersey, USA, ISBN-10: 0470860758, ISBN-13: 978-0470860755.
15] Robert Babuska, “Fuzzy modeling and identification”, Ph.D. Dissertation, Uni-versity of Delft, 1996, pp. 51.
16] Q. Liang, N.N. Karnik, J.M. Mendel, Connection admission control in ATM net-works using survey-based type-2 fuzzy logic systems,”, IEEE Transactions onSystems, Man and Cybernetics. Part C: Applications and Reviews 30 (3 (August))(2000).
17] M. Horning, J. Kelly, S. Myers, R. Stebbins, Transformer Maintenance Guide, S.D.Myers Inc, Ohio, USA, 2004.
18] A tutorial on clustering algorithms. Available: http://www.elet.polimi.it/upload/matteucc/Clustering/tutorial html/kmeans.html.
19] Tzu-Ping, S.-M. Chen, A new method for constructing membership functionsand fuzzy rules from training examples”, IEEE Transactions on Systems, Man,and Cybernetics. Part B: Cybernetics 29 (1 (February)) (1999).
20] IEEE Standard General Requirements for Liquid-Immersed Distribution, Powerand Regulating Transformers. IEEE Std. 57.12.00-1993.
ilfredo César Flores Castro was born in Tegucigalpa, Honduras, on 2 May 1972.eceived the electrical engineer degree in 1996, from Universidad Nacionalutónoma de Honduras (UNAH) and the MBA degree in 2001, from Universidad
cUrvq
s Research 79 (2009) 539–549 549
ecnológica Centroamericana, Honduras and Tecnológico de Monterrey, México. In003, he was awarded with a scholarship from German Academic Exchange ServiceDAAD), for Ph.D. studies at Instituto de Energía Eléctrica, Universidad Nacional dean Juan, Argentina. From 1996 to 2001 he worked at Empresa Nacional de Energíaléctrica (ENEE), Honduras, in the area of maintenance of hydroelectric power plantsnd power substations. Currently he is professor in the Department of Engineeringf Universidad Tecnológica de Honduras (UTH) and Professor of Physics at UNAH.rofessor Flores’s fields of interest are: diagnostic of power transformers, reliabilitynd artificial intelligence applied on power systems.
nrique Esteban Mombello received the electrical engineer degree in 1982 and theh.D. degree in 1998, both from Universidad Nacional de San Juan, Argentina. Since993 he is investigator of the National Council of Scientific and Technique Investi-ations (CONICET), Argentina. Mr. Mombello is member of the Instituto de Energíaléctrica, Universidad Nacional de San Juan, Argentina, where is involved in educa-ional and investigation tasks.
osé Antonio Jardini received his B.Sc. from polytechnic school at the University of Sãoablo (USP) in 1963. Subsequently, he obtained his M.Sc. and Ph.D. degrees in 1970nd 1973, respectively, all from the same institution. From 1964 to 1991 he worked athemag Eng. Ltd., in the area of power systems & automation and transmission linesrojects. Currently, he is a professor in the Department of Engineering of Energynd Electric Automation at USP. He is a member of CIGRE and was the Brazilianepresentative in the SC38 of CIGRE, fellow member of IEEE and distinguished lec-urer of IAS/IEEE. Professor Jardini’s fields of interest are: generation automation,ransmission and power distribution.
iuseppe Rattá was born in Cartazaro, Italy, on 28 January 1950. He graduated
hanical engineer. Currently, he is the director of the Instituto de Energía Eléctrica,niversidad Nacional de San Juan, San Juan, Argentina, where he is professor,
esearch, and consulting engineer since 1975. His research interests include higholtage engineering, reactive compensation, electromagnetic transients and poweruality.