Embed Size (px)
Citation preview
Supporting information
Electrochemical Synthesis of Photoluminescent Carbon
Nanodots from Glycine for Highly Sensitive Detection of
Hemoglobin
Chen-I Wang, a
Wei-Cheng Wu, b, c
Arun Prakash Periasamya and Huan-Tsung
Chang*a
a Department of Chemistry, National Taiwan University, 1, Section 4, Roosevelt
Road, Taipei 10617, Taiwan. b
Department of Engineering and System Science, National Tsing Hua
University,101, Section 2, Kuang-Fu Road, Hsinchu 30013, Taiwan. c Nano Science and Technology Program, Taiwan International Graduate Program,
Academia Sinica,128, Section 2, Academia Road, Taipei 11529 Taiwan.
Correspondence: Professor Huan-Tsung Chang, Department of Chemistry, National
Taiwan University, 1, Section 4, Roosevelt Road, Taipei 10617, Taiwan. Tel and fax:
011-886-2-33661171. E-mail: [email protected]
Electronic Supplementary Material (ESI) for Green ChemistryThis journal is © The Royal Society of Chemistry 2014

Table of Contents
Section 1 Preparation of C-dots S1
Section 2 Characterization of C-dots S2
Section 3 The factors affecting the PL intensity of C-dots S3
Section 4 The practicality of C-dots S4
Electronic Supplementary Material (ESI) for Green ChemistryThis journal is © The Royal Society of Chemistry 2014
Section 1: Preparation of C-dots S1
S1.1 Reagents and Chemicals
Ammonium hydroxide, apo-transferrin, ascorbic acid, β-casein, cytochrome c,
ethanol, ethylenediaminetetraacetic acid (EDTA), glycine, hemoglobin, human serum
albumin (HSA), hydrogen peroxide, nitric acid, quinine sulfate, ribonuclease,
tris(hydroxymethyl)aminomethane (Tris), transferrin, trypsinogen, β-lactoglobin,
luminol, myoglobin, potassium hydroxide, potassium phosphate monobasic,
potassium chloride, sodium chloride, and sodium hydroxide were purchased from
Sigma–Aldrich (Milwaukee, WI, USA). Monobasic, dibasic, and tribasic sodium
phosphates were obtained from J.T. Baker (Phillipsburg, NJ, USA). Ultrapure water
(18.2 MΩ cm-1
) from a Milli-Q ultrapure system was used in this study. Phosphate
buffered saline (PBS) at pH 7.4 containing 137 mM NaCl, 2.7 mM KCl, 10 mM
Na2HPO4, and 2.0 mM KH2PO4 is presented as 1X PBS. Oily pens, ballpoint pens,
soy sauce, ketchup, and eggs were purchased from a local store (Taipei, Taiwan).
S1.2 Preparation of C-dots
In a typical C-dots synthesis, 0.5 M glycine was dissolved in NH4OH aqueous
solution (10 mL; 3 M) in a glass sample vial. Two Pt wires used as both anode and
cathode electrodes were immersed into this alkaline solution. A 2400 Series Source
Meter direct current (DC) power supply (Keithley Instruments, OH, USA) was used
to apply a static potential (10 V) between the two electrodes at ambient temperature
(25 °C) for 2 h. The aqueous solution was then filtered through 0.22-μm membranes
to remove large or agglomerated particles. To further remove the matrix, the
as-purified C-dots aqueous solution was subjected to dialysis against pure water
through a membrane (MWCO = 3.5–5 kD, Float-A-Lyzer G2, Spectrum Laboratories,
CA, USA) for 3 h. The waste was collected according to waste disposal act (WDA)
Electronic Supplementary Material (ESI) for Green ChemistryThis journal is © The Royal Society of Chemistry 2014
and the rule set by Taiwan Environment Protection Administration (EPA).1 Finally,
pure, light yellow C-dots aqueous solution was obtained. The as-prepared C-dots
aqueous solution was stable for at least 5 months. Different alkaline solutions (0.5 M
NaOH, and 0.5 M Na3PO4) and static potentials (10-50 V) were investigated to
optimize the preparation conditions. For comparison, C-dots were also synthesized
from other organic compounds (ascorbic acid, EDTA, glycine, and Tris).
Section 2: Characterization of C-dots S2
S2.1 TEM images, UV-Vis and PL spectrum of C-dots
The as-prepared C-dots were diluted 10-fold with ultrapure water prior to
conducting transmission electron microscopy (TEM) and high-resolution TEM
(HRTEM) measurements separately using JSM-1200EX II (JEOL Ltd., Tokyo, Japan)
and FEI Tecnai-G2-F20 TEM systems. The C-dots were carefully deposited on
400-mesh C-coated Cu grids, and excess solvents were evaporated at ambient
temperature and pressure. A GBC Cintra 10e double-beam UV–Vis spectrophotometer
(GBC Scientific Equipment. Victoria, Australia) was used to record the UV–Vis
spectra of the C-dots in ultrapure water. The photostability of the C-dots was
investigated under continuous illumination of the Xe lamp in a PL spectrophotometer
(Varian, CA, USA). The PL lifetime was measured using an Edinburgh FL 900
photo-counting system (Edinburgh Instruments, Livingston, UK), with a 377-nm laser
(Spectra Physics, CA, USA) as an excitation source at a pulse rate of 6 ns and a
440-nm narrow bandpass filter.
S2.2 XRD, C 1s XPS Profiles and FTIR Spectra of C-dots
For X-ray diffraction (XRD) measurements, a PANalytical X’Pert PRO
diffractometer (PANalytical B.V., Almelo, Netherlands) in conjunction with Cu Kα
Electronic Supplementary Material (ESI) for Green ChemistryThis journal is © The Royal Society of Chemistry 2014
radiation (λ = 0.15418 nm) was used. Prior to XRD measurements, C-dots were
placed on quartz glass supports. A Varian 640 Fourier transform infrared (FTIR)
spectrophotometer (Varian, CA, USA) was used to analyze the surfaces of as-prepared
C-dots.
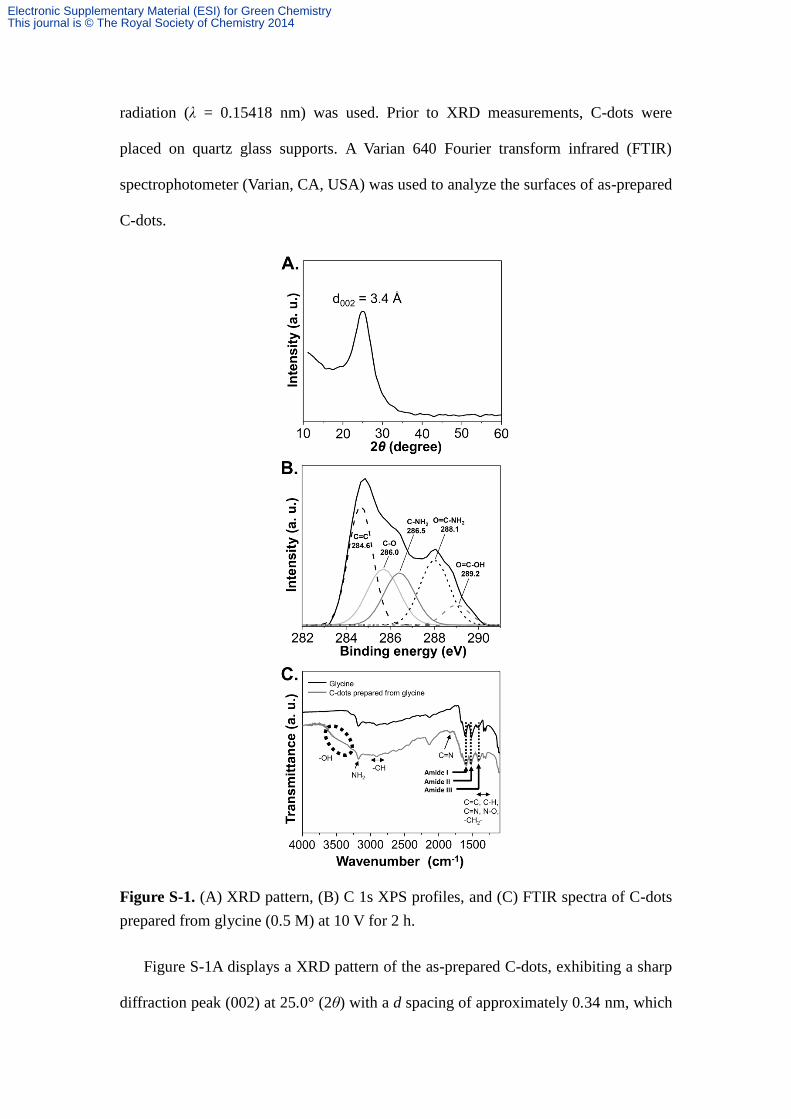
Figure S-1. (A) XRD pattern, (B) C 1s XPS profiles, and (C) FTIR spectra of C-dots
prepared from glycine (0.5 M) at 10 V for 2 h.
Figure S-1A displays a XRD pattern of the as-prepared C-dots, exhibiting a sharp
diffraction peak (002) at 25.0° (2θ) with a d spacing of approximately 0.34 nm, which
Electronic Supplementary Material (ESI) for Green ChemistryThis journal is © The Royal Society of Chemistry 2014
is indicative of an amorphous nature of the C-dots.2 Figure S-1B displays the original
and deconvoluted C 1s XPS spectra of C-dots, in which five peaks were assigned,
including C=C (~284.6 eV), C–O (~286.0 eV), C–NH2 (286.5 eV), O=C–NH2
(~288.1 eV), and O=C–OH (~289.2 eV).3, 4
Notably, the peak at ~284.6 eV is ascribed
to C atoms in graphitic structures, revealing predominantly sp2 carbons in the
as-prepared C-dots.4 Furthermore, the peak intensity (located at 288.1 eV) is greater
than that obtained by conducting a hydrothermal method,5 indicating that more
residual oxygen-containing groups (C–O, C=O) and amide bond (O=C–NH2)
appeared in the as-prepared C-dots.
The FTIR spectrum of C-dots provides several common characteristic peaks
(Figure S-1C). The peaks at 1265 (C=C), 1400–1650, and 1735 cm-1
(C-H, C=C,
-CH2-, conjugated C=N, C=O stretching vibration), as well as 3200–3550 cm–1
(O-H
stretching vibration) are identified.6 The peaks at 1510–1560 and 1630 cm
–1 are
assigned to the amide II (in-plane N-H bending) and amide I (C=O stretching
vibration) bands, respectively, and that at 1455 cm–1
is characteristic of the amide III
(C-N stretch stretching vibration) band.6 A small band at 1835 cm
−1 is associated with
C=N (sp2 C–N) stretching vibration. The bands observed at around 2090 and 2113
cm−1
are ascribed to C-H bond and C≡C bond, respectively.7, 8
The results of FTIR
and XPS agree with each other, strongly supporting the formation of C-dots.
Scheme S-1. Electro-oxidation and electro-polymerization of C-dots from glycine
under an alkaline condition.
Electronic Supplementary Material (ESI) for Green ChemistryThis journal is © The Royal Society of Chemistry 2014
S2.3 Quantum Yield and Zeta Potential of C-dots
The PL intensities (excitation at 365 nm) and absorbance values at 365 nm of the
C-dots were used to calculate the QYs using quinine sulfate (ɸf = 0.54) as a
reference.6 Quinine sulfate was dissolved in 0.1 M H2SO4 (refractive index: 1.33),
while the C-dots were dispersed in water (refractive index: 1.33). To minimize
reabsorption effects, absorbance values of the individual solutions in 10-mm cuvettes
were maintained under 0.1 at the excitation wavelength. Excitation and emission slit
widths were both set at 5.0 nm when recording their PL spectra.
S2.4 Time-Evolution Raman Spectra of C-dots
A Raman microscopy system with a 50× objective (Dongwoo Optron,
KyungGiDo, Korea) was used to analyze air-dried C-dots on a silica wafer. A
diode-pumped solid-state laser operating at 532 nm was used as the excitation source
with a power of 100 mW and an accumulation time of 100 s.
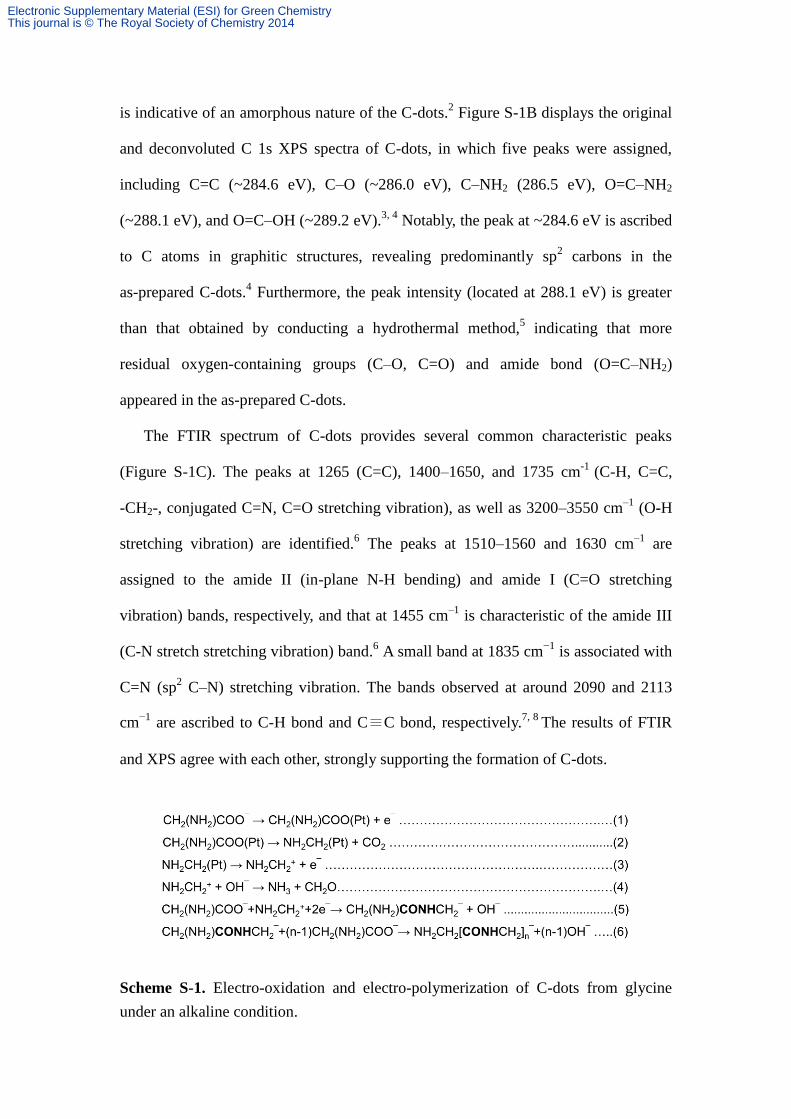
Figure S-2. Raman spectra (λex = 532 nm) of C-dots prepared from glycine (0.5 M) at
10 V for various reaction times. Reaction times in A–I are 0, 30, 35, 40, 50, 55, 60,
120, 180 min, respectively. Other conditions are the same as those described in the
main text.
Electronic Supplementary Material (ESI) for Green ChemistryThis journal is © The Royal Society of Chemistry 2014
Section 3: The factors affecting the PL intensity of C-dots S3
S3.1 Effect of Ammonium concentration, applied voltage, and reaction time
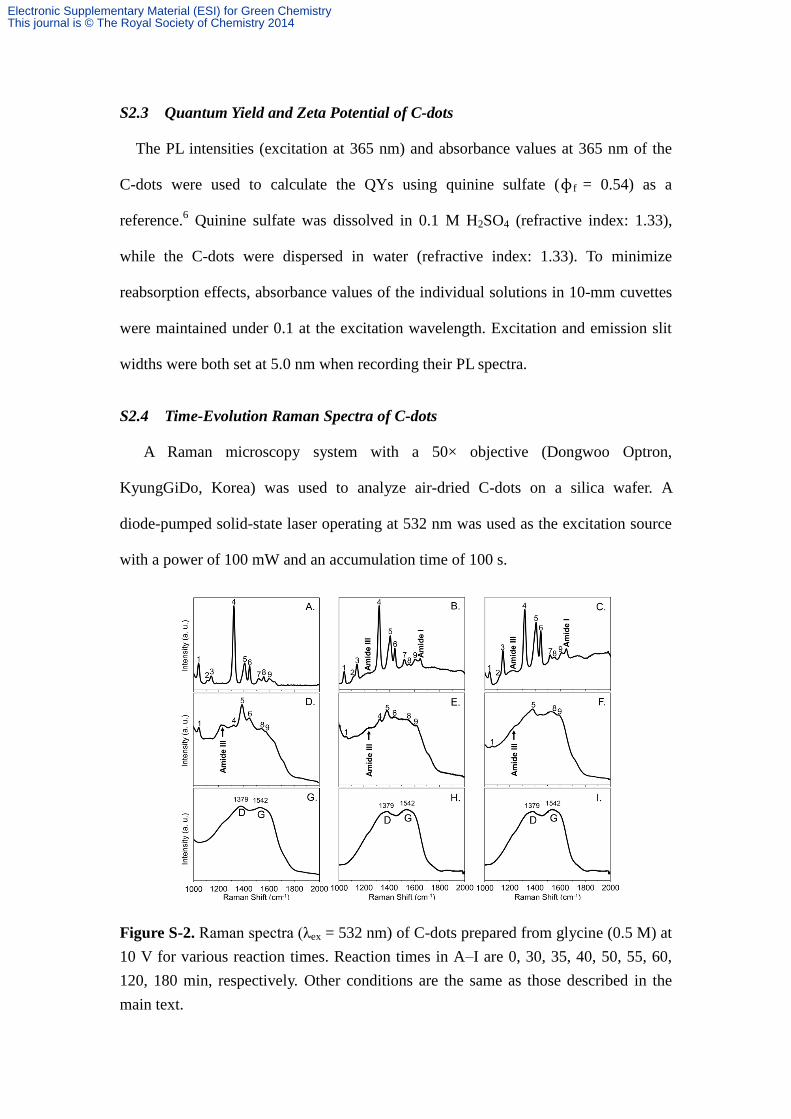
Figure S-3. Effect of (A) NH4OH concentration, (B) applied voltage (1–50 V), and (C)
reaction time (0–3 h) on the formation of C-dots. The concentrations of glycine are all
0.5 M. Applied voltage: 10 V in (A) and (C). Reaction time: 2 h in (A) and (B).
NH4OH concentration: 3 M in (B) and (C). Excitation and emission wavelengths are
365 nm and 440 nm, respectively.
Electronic Supplementary Material (ESI) for Green ChemistryThis journal is © The Royal Society of Chemistry 2014
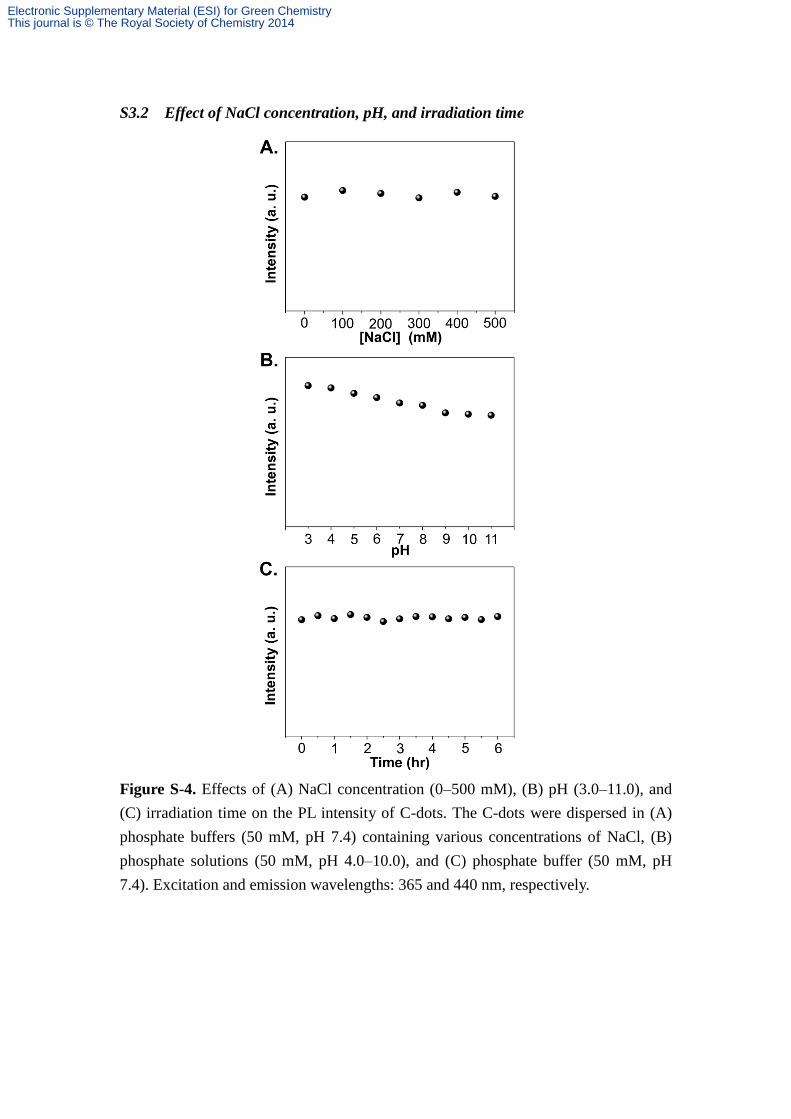
S3.2 Effect of NaCl concentration, pH, and irradiation time
Figure S-4. Effects of (A) NaCl concentration (0–500 mM), (B) pH (3.0–11.0), and
(C) irradiation time on the PL intensity of C-dots. The C-dots were dispersed in (A)
phosphate buffers (50 mM, pH 7.4) containing various concentrations of NaCl, (B)
phosphate solutions (50 mM, pH 4.0–10.0), and (C) phosphate buffer (50 mM, pH
7.4). Excitation and emission wavelengths: 365 and 440 nm, respectively.
Electronic Supplementary Material (ESI) for Green ChemistryThis journal is © The Royal Society of Chemistry 2014
Section 4: The practicality of C-dots S4
S4.1 Blood sampling
The whole blood samples collected from five anonymous male donors were used
in this study. The whole blood samples were collected immediately into glass vials
containing 4% sodium citrate in PBS to prevent pore clogging, in which 1 part sodium
citrate was mixed with 9 parts of each blood sample. The whole blood samples were
stored at −20 °C before use.
S4.2 Detection of Hemoglobin Using C-dots
Aliquots of 1X PBS (500 µL) containing hemoglobin (0-1000 nM) and 0.1 X
C-dots were incubated at ambient temperature for 30 min. Before PL measurements,
the mixtures were transferred separately into a 96-well microtiter plate. Their PL
spectra were recorded using a microplate reader (µ-Quant Biotek Instruments, VT,
USA) at an excitation wavelength of 365 nm.
Practicality of C-dots was validated by the determination of the concentrations of
hemoglobin in blood samples. Prior to analysis, the whole blood samples were diluted
250,000-fold in ultrapure water, which were then subjected to sonication for 30 s to
release the hemoglobin from erythrocytes. Aliquots (50 μL) of the as-prepared blood
samples were spiked with standard hemoglobin solutions (50 μL). The spiked sample
solutions (100 μL) were separately mixed with aliquots of PBS (400 μL) containing
C-dots (50 μL, 1X), which were incubated at ambient temperature for 30 min prior to
PL measurement. The final concentrations of hemoglobin in the mixtures were 0–200
nM. A commercial hemoglobin-meter (HemoCue AB, Ängelholm, Sweden) was used
to determine the concentrations of hemoglobin in the blood samples through a
modified azidemethemoglobin reaction. Sodium nitrite converted the hemoglobin ion
Electronic Supplementary Material (ESI) for Green ChemistryThis journal is © The Royal Society of Chemistry 2014
from the ferrous to the ferric state to form methemoglobin that subsequently reacted
with azide to form azidemethemoglobin. The end point of the reaction was measured
bichromatically at the wavelengths of 570 and 880 nm. The second wavelength was
used for compensating the interference caused by blood components such as
chylomicrons or leukocytes. The bichromatical absorbance ratio is proportional to the
concentration of hemoglobin. The results obtained from the two approaches were
compared through a student’s t-test.
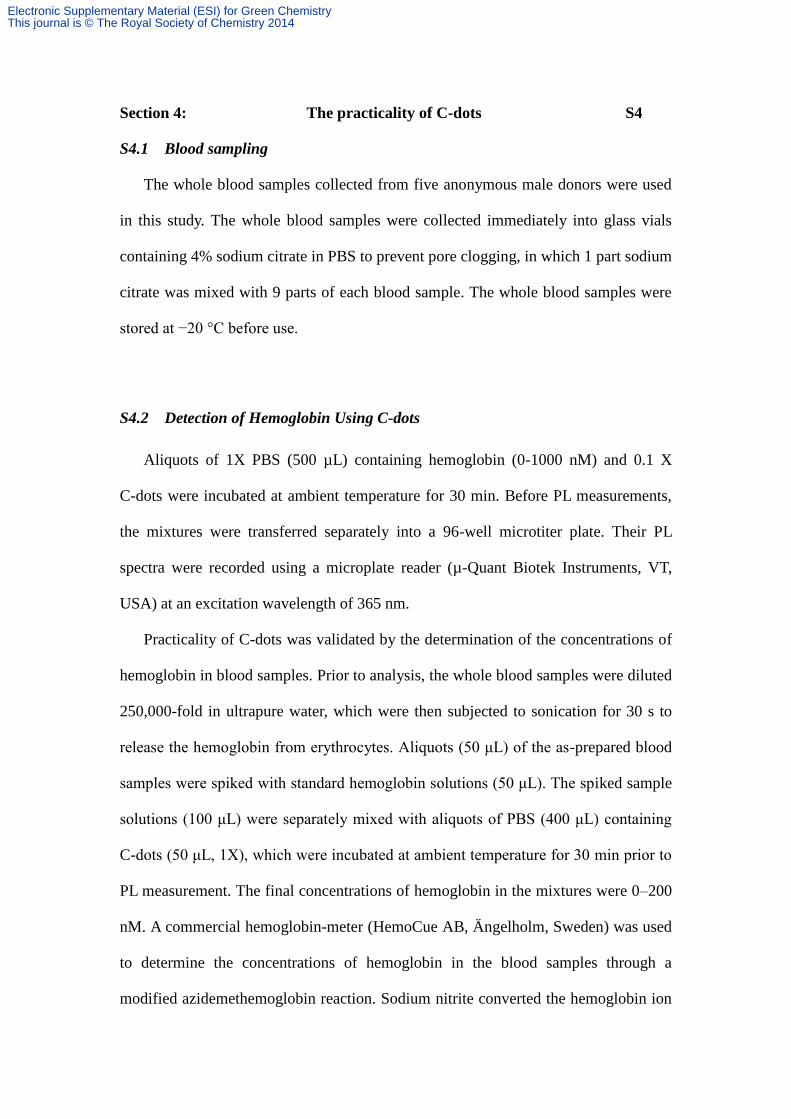
Figure S-5. PL decays of C-dots in absence and presence of hemoglobin (250 nM).
Excitation and emission wavelengths are 337 and 440 nm, respectively.
Electronic Supplementary Material (ESI) for Green ChemistryThis journal is © The Royal Society of Chemistry 2014
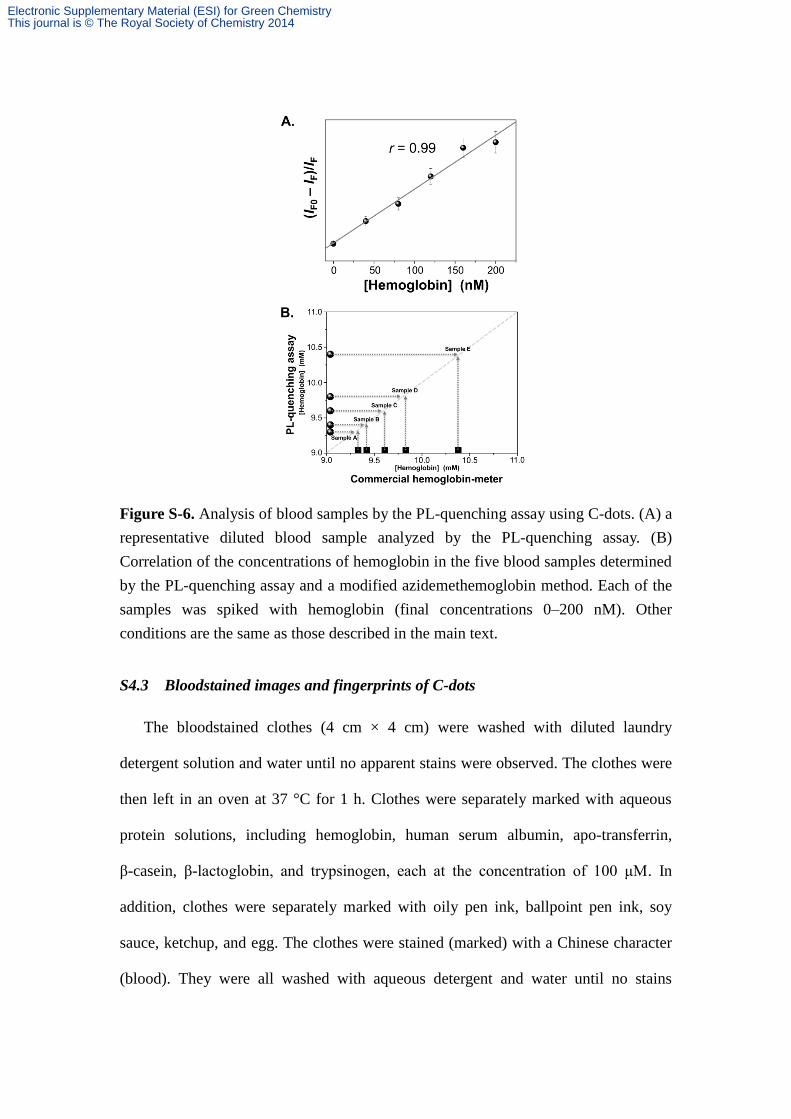
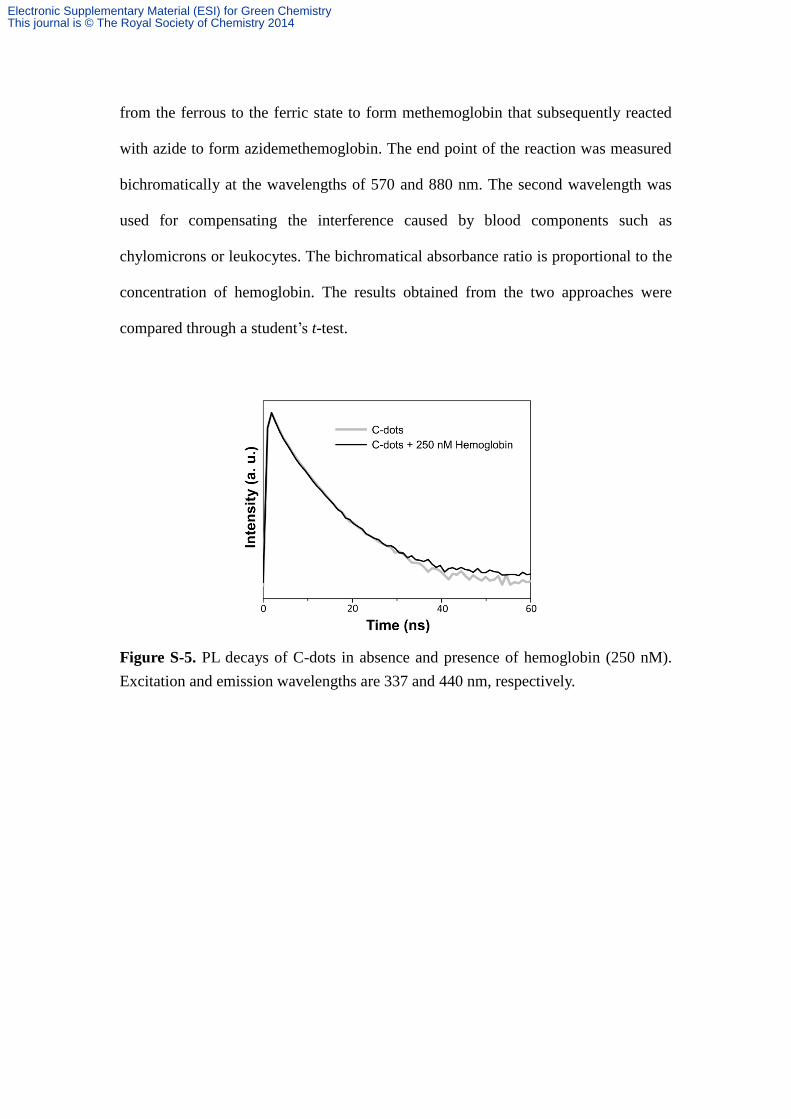
Figure S-6. Analysis of blood samples by the PL-quenching assay using C-dots. (A) a
representative diluted blood sample analyzed by the PL-quenching assay. (B)
Correlation of the concentrations of hemoglobin in the five blood samples determined
by the PL-quenching assay and a modified azidemethemoglobin method. Each of the
samples was spiked with hemoglobin (final concentrations 0–200 nM). Other
conditions are the same as those described in the main text.
S4.3 Bloodstained images and fingerprints of C-dots
The bloodstained clothes (4 cm × 4 cm) were washed with diluted laundry
detergent solution and water until no apparent stains were observed. The clothes were
then left in an oven at 37 °C for 1 h. Clothes were separately marked with aqueous
protein solutions, including hemoglobin, human serum albumin, apo-transferrin,
β-casein, β-lactoglobin, and trypsinogen, each at the concentration of 100 μM. In
addition, clothes were separately marked with oily pen ink, ballpoint pen ink, soy
sauce, ketchup, and egg. The clothes were stained (marked) with a Chinese character
(blood). They were all washed with aqueous detergent and water until no stains
Electronic Supplementary Material (ESI) for Green ChemistryThis journal is © The Royal Society of Chemistry 2014
(marks) were observed, besides oily pen ink and ballpoint pen ink that were not
removed through the washing process. Half of the washed clothes were then sprayed
with the C-dots solution (1X), and the rest of the clothes (no C-dots) were used as
controls. Before taking bright field and PL images using a digital camera Nikon
Coolpix P300 (Tokyo, Japan), the clothes were stored in an oven at 37 °C for 1 h. The
light source used for taking PL images was a 450-W xenon arc lamp (Oriel, Stratford,
CT, USA) equipped with a filter. One filter in front of the sample and the other one
before the camera were used to select the excitation and emission wavelengths,
respectively. The excitation/emission wavelength ranges of the three pairs of filters
were 425–445/475–495, 460–490/510–540, and 525–555/550–580 nm. Exposure time
was 20 ms. For comparison, the washed clothes stained with blood were also analyzed
by applying a luminol chemiluminescence (CL) assay.9 A standard luminol solution
was prepared by mixing 0.2 g luminol, 1.5 g potassium hydroxide, and 10 mL
ultrapure water. Prior to use, the luminol solution (10 mL) was mixed with hydrogen
peroxide solution (3%, 10 ml) in a spray bottle. Then CL images of the clothes after
being sprayed with the mixture for 5 s were recorded using the camera.
Prior to taking fingerprints from volunteers, their thumbs were first cleaned with
ethanol to remove any sweat thoroughly. Then their thumbs were immersed in the
C-dots (1X) for 1 min. The fingerprints were taken as that addressed taking the PL
images of the clothes using a pair of filters (425–445/475–495 nm), each with an
exposure time of 20 ms.
Electronic Supplementary Material (ESI) for Green ChemistryThis journal is © The Royal Society of Chemistry 2014
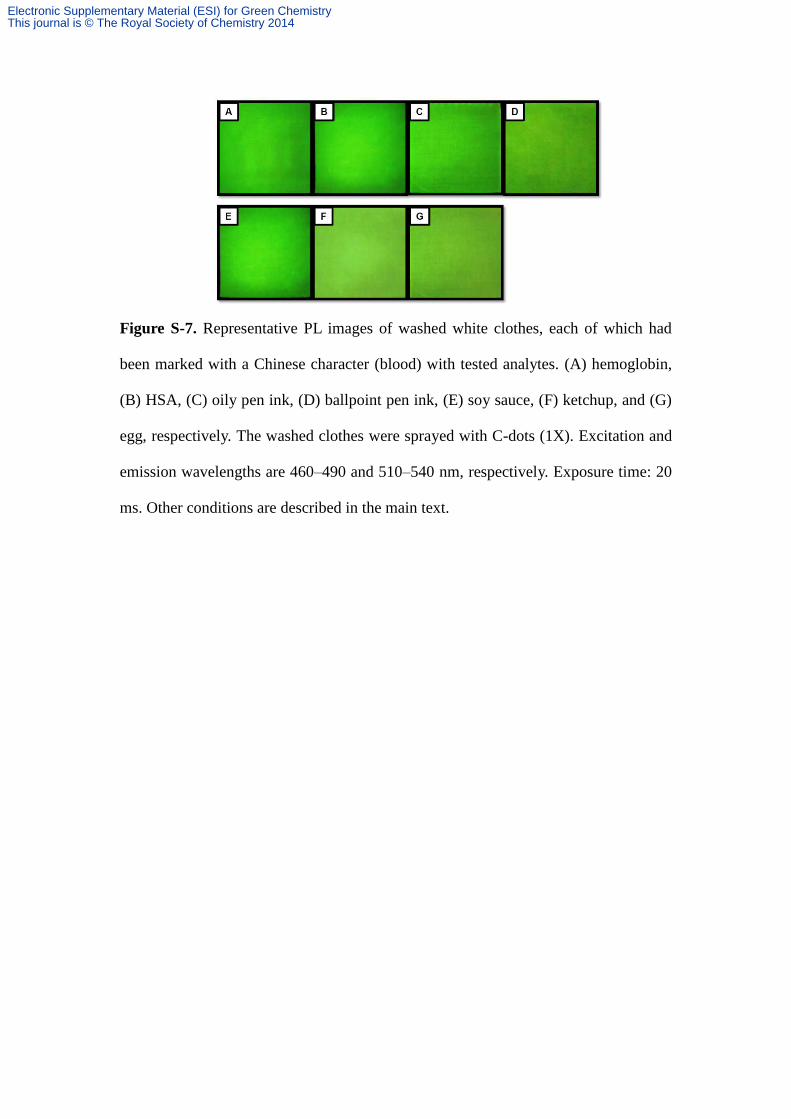
Figure S-7. Representative PL images of washed white clothes, each of which had
been marked with a Chinese character (blood) with tested analytes. (A) hemoglobin,
(B) HSA, (C) oily pen ink, (D) ballpoint pen ink, (E) soy sauce, (F) ketchup, and (G)
egg, respectively. The washed clothes were sprayed with C-dots (1X). Excitation and
emission wavelengths are 460–490 and 510–540 nm, respectively. Exposure time: 20
ms. Other conditions are described in the main text.
Electronic Supplementary Material (ESI) for Green ChemistryThis journal is © The Royal Society of Chemistry 2014
References
[1] W. T. Tsai, Y. H. Chou, Waste Manage., 2004, 24, 1061-1069.
[2] H. Li, X. He, Z. Kang, H. Huang, Y. Liu, J. Liu, S. Lian, C. H. A. Tsang, X. Yang,
S.-T. Lee, Angew. Chem. Int. Ed., 2010, 49, 4430-4434.
[3] M. Zhang, L. Bai, W. Shang, W. Xie, H. Ma, Y. Fu, D. Fang, H. Sun, L. Fan, M.
Han, C. Liu, S. Yang, J. Mater. Chem., 2012, 22, 7461-7467.
[4] T. I. T. Okpalugo, P. Papakonstantinou, H. Murphy, J. McLaughlin, N. M. D.
Brown, Carbon, 2005, 43, 153-161.
[5] W. B. Lu, X. Y. Qin, S. Liu, G. H. Chang, Y. W. Zhang, Y. L. Luo, A. M. Asiri, A.
O. Al-Youbi, X. P. Sun, Anal. Chem., 2012, 84, 5351-5357.
[6] P.-C. Hsu, H.-T. Chang, Chem. Commun., 2012, 48, 3984-3986.
[7] S. C. Ray, A. Saha, N. R. Jana, R. Sarkar, J. Phys. Chem. C, 2009, 113,
18546-18551.
[8] F. Nawaz, L. Wang, L.-f. Zhu, X.-J. Meng, F.-S. Xiao, Chem. Res. Chin. Univ.,
2013, 29, 401-403.
[9] F. Barni, W. Simon Lewis, A. Berti, G. M. Miskelly, G. Lago, Talanta, 2007, 72,
896-913.
Electronic Supplementary Material (ESI) for Green ChemistryThis journal is © The Royal Society of Chemistry 2014