Embed Size (px)
Citation preview
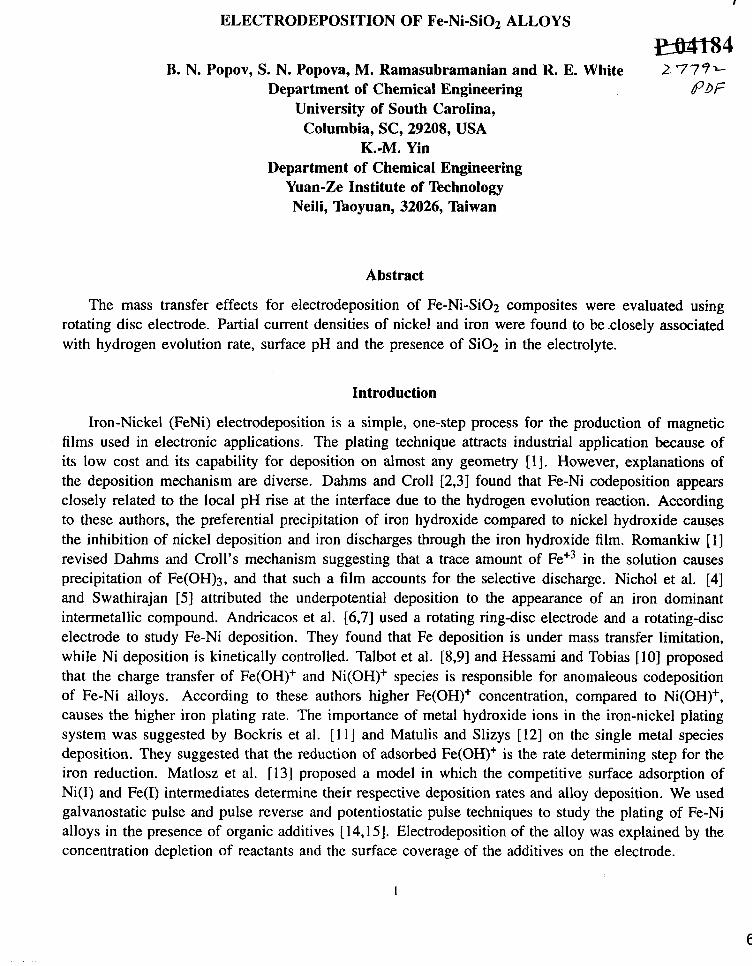
c 5 ELECTRODEPOSITION OF Fe-Ni-Si02 ALLOYS
m 4
Department of Chemical Engineering PDF B. N. Popov, S. N. Popova, M. Ramasubramanian and R. E. White
University of South Carolina, Columbia, SC, 29208, USA
K.-M. Yin Department of Chemical Engineering
Yuan-Ze Institute of Technology Neili, Taoyuan, 32026, 'hiwan
L 7 7 Y t
Abstract
The mass transfer effects for electrodeposition of Fe-Ni-Si02 composites were evaluated using rotating disc electrode. Partial current densities of nickel and iron were found to beclosely associated with hydrogen evolution rate, surface pH and the presence of Si02 in the electrolyte.
Introduction
Iron-Nickel (FeNi) electrodeposition is a simple, one-step process for the production of magnetic films used in electronic applications. The plating technique attracts industrial application because of its low cost and its capability for deposition on almost any geometry [l]. However, explanations of the deposition mechanism are diverse. Dahms and Croll [2,3] found that Fe-Ni codeposition appears closely related to the local pH rise at the interface due to the hydrogen evolution reaction. According to these authors, the preferential precipitation of iron hydroxide compared to nickel hydroxide causes the inhibition of nickel deposition and iron discharges through the iron hydroxide film. Romankiw [I] revised Dahms and Croll's mechanism suggesting that a trace amount of Fe+3 in the solution causes precipitation of Fe(OH)3, and that such a film accounts for the selective discharge. Nichol et al. [4] and Swathirajan [5 ] attributed the underpotential deposition to the appearance of an iron dominant intermetallic compound. Andricacos et a]. [6,7] used a rotating ring-disc electrode and a rotating-disc electrode to study Fe-Ni deposition. They found that Fe deposition is under mass transfer limitation, while Ni deposition is kinetically controlled. Talbot et a]. [8,9] and Hessami and Tobias [lo] proposed that the charge transfer of Fe(OH)+ and Ni(OH)+ species is responsible for anomaleous codeposition of Fe-Ni alloys. According to these authors higher Fe(OH)+ concentration, compared to Ni(OH)+, causes the higher iron plating rate. The importance of metal hydroxide ions in the iron-nickel plating system was suggested by Bockris et al. [ I 11 and Matulis and Slizys [12] on the single metal species deposition. They suggested that the reduction of adsorbed Fe(OH)+ is the rate determining step for the iron reduction. Matlosz et al. [13] proposed a model in which the competitive surface adsorption of Ni(1) and Fe(1) intermediates determine their respective deposition rates and alloy deposition. We used galvanostatic pulse and pulse reverse and potentiostatic pulse techniques to study the plating of Fe-Ni alloys in the presence of organic additives [14,15]. Electrodeposition of the alloy was explained by the concentration depletion of reactants and the surface coverage of the additives on the electrode.
63
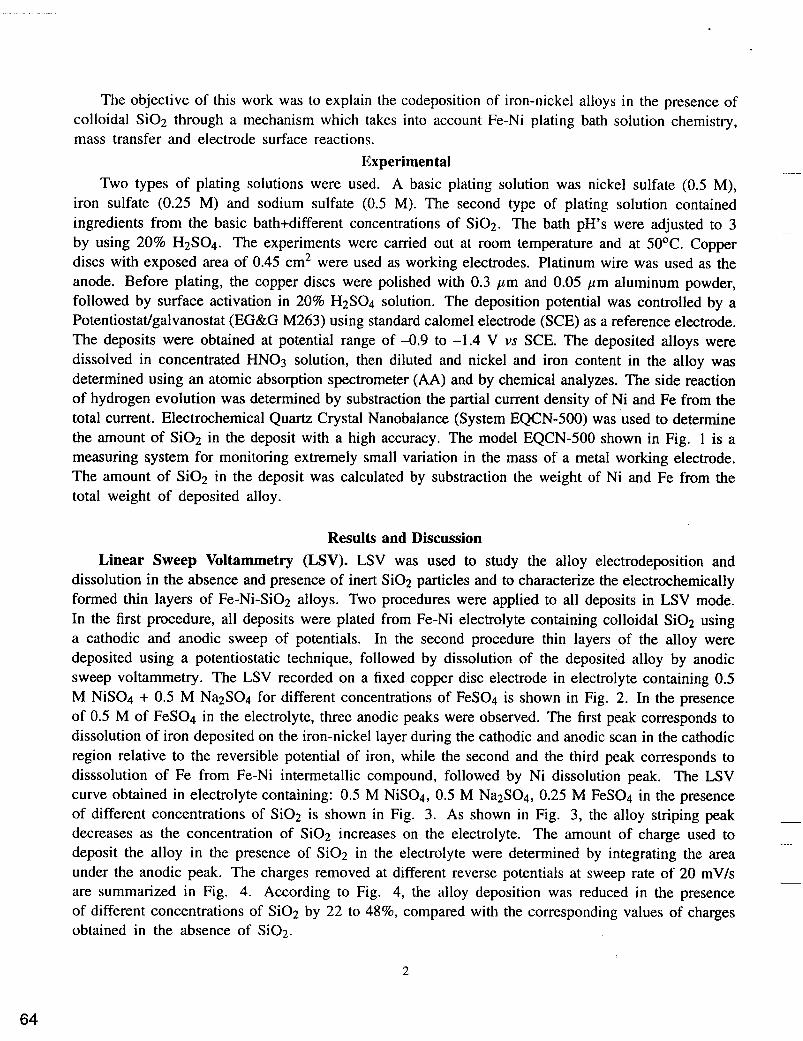
The objective of this work was to explain the codeposition of iron-nickel alloys in the presence of colloidal Si02 through a mechanism which takes into account Fe-Ni plating bath solution chemistry, mass transfer and electrode surface reactions.
Experimental Two types of plating solutions were used. A basic plating solution was nickel sulfate (0.5 M),
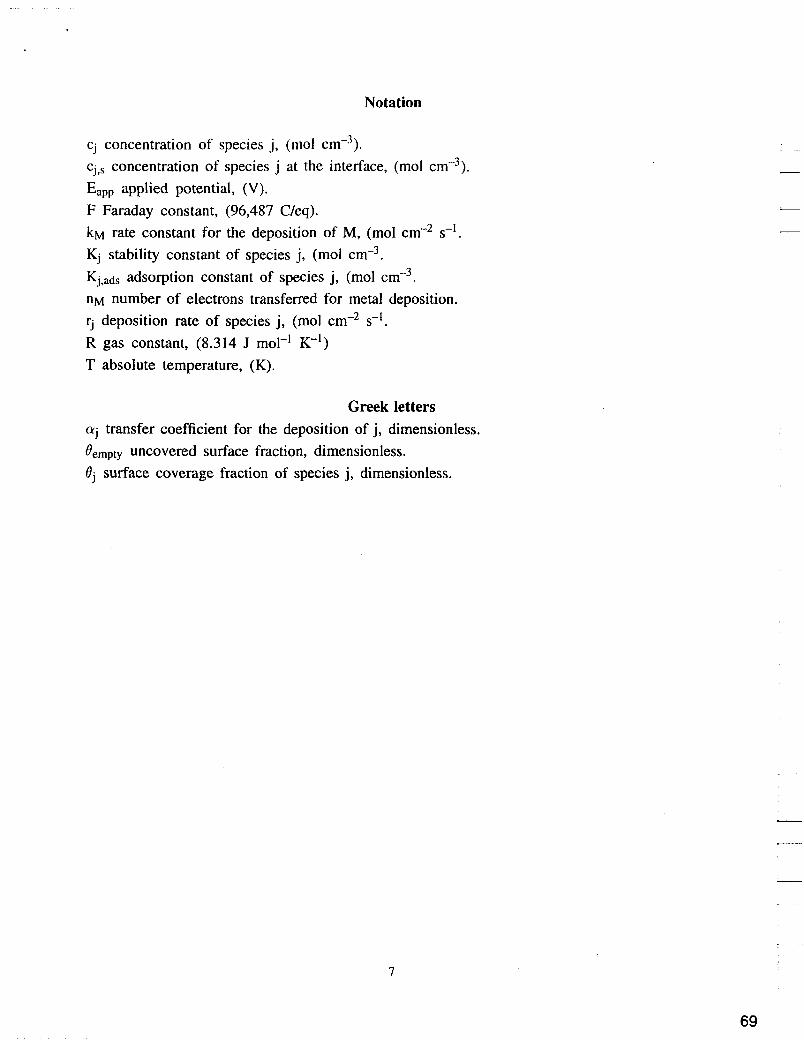
iron sulfate (0.25 M) and sodium sulfate (0.5 M). The second type of plating solution contained ingredients from the basic bath+different concentrations of Si02. The bath pH’s were adjusted to 3 by using 20% H2SO4. The experiments were carried out at room temperature and at 5OOC. Copper discs with exposed area of 0.45 cm2 were used as working electrodes. Platinum wire was used as the anode. Before plating, the copper discs were polished with 0.3 pm and 0.05 pm aluminum powder, followed by surface activation in 20% H2SO4 solution. The deposition potential was controlled by a Potentiostat/galvanostat (EG&G M263) using standard calomel electrode (SCE) as a reference electrode. The deposits were obtained at potential range of -0.9 to -1.4 V vs SCE. The deposited alloys were dissolved in concentrated HNO3 solution, then diluted and nickel and iron content in the alloy was determined using an atomic absorption spectrometer (AA) and by chemical analyzes. The side reaction of hydrogen evolution was determined by substraction the partial current density of Ni and Fe from the total current. Electrochemical Quartz Crystal Nanobalance (System EQCN-500) was used to determine the amount of Si02 in the deposit with a high accuracy. The model EQCN-500 shown in Fig. 1 is a measuring system for monitoring extremely small variation in the mass of a metal working electrode. The amount of Si02 in the deposit was calculated by substraction the weight of Ni and Fe from the total weight of deposited alloy.
Results and Discussion Linear Sweep Voltammetry (LSV). LSV was used to study the alloy electrodeposition and
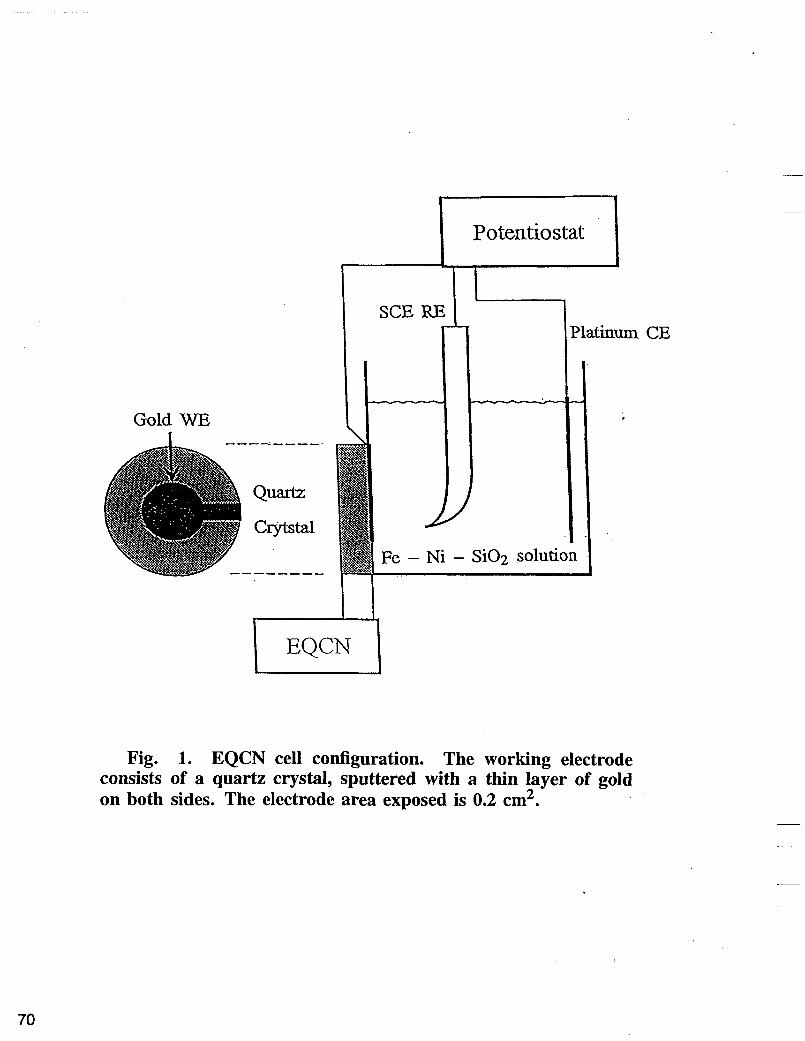
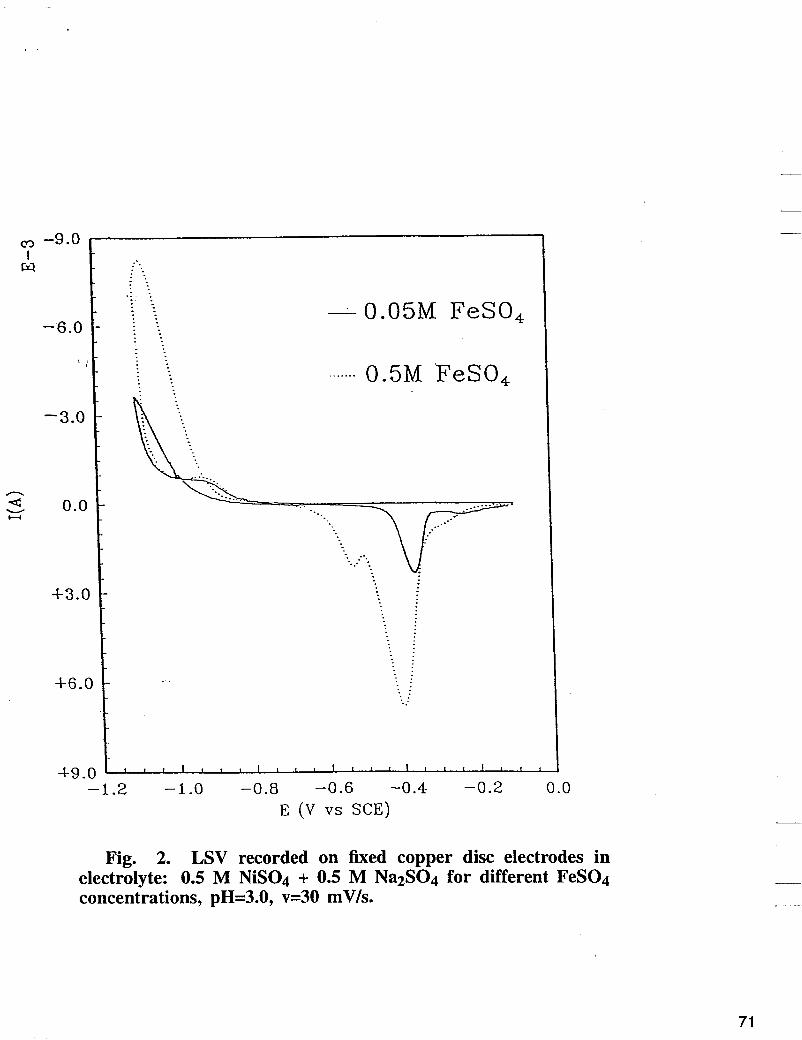
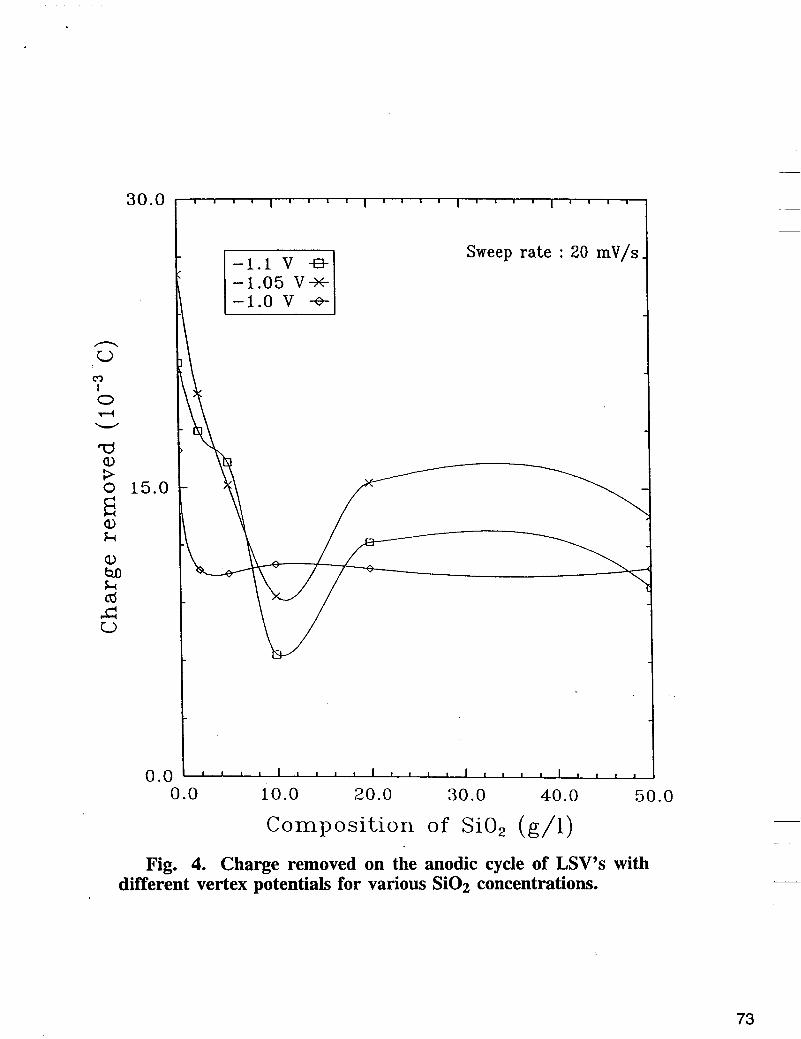
dissolution in the absence and presence of inert Si02 particles and to characterize the electrochemically formed thin layers of Fe-Ni-Si02 alloys. Two procedures were applied to all deposits in LSV mode. In the first procedure, all deposits were plated from Fe-Ni electrolyte containing colloidal Si02 using a cathodic and anodic sweep of potentials. In the second procedure thin layers of the alloy were deposited using a potentiostatic technique, followed by dissolution of the deposited alloy by anodic sweep voltammetry. The LSV recorded on a fixed copper disc electrode in electrolyte containing 0.5 M NiS04 + 0.5 M Na2S04 for different concentrations of FeSO4 is shown in Fig. 2. In the presence of 0.5 M of FeSO4 in the electrolyte, three anodic peaks were observed. The first peak corresponds to dissolution of iron deposited on the iron-nickel layer during the cathodic and anodic scan in the cathodic region relative to the reversible potential of iron, while the second and the third peak corresponds to disssolution of Fe from Fe-Ni intermetallic compound, followed by Ni dissolution peak. The LSV curve obtained in electrolyte containing: 0.5 M NiS04, 0.5 M Na2S04, 0.25 M FeS04 in the presence of different concentrations of Si02 is shown in Fig. 3. As shown in Fig. 3, the alloy striping peak decreases as the concentration of Si02 increases on the electrolyte. The amount of charge used to deposit the alloy in the presence of Si02 in the electrolyte were determined by integrating the area under the anodic peak. The charges removed at different reverse potentials at sweep rate of 20 mV/s are summarized in Fig. 4. According to Fig. 4, the alloy deposition was reduced in the presence of different concentrations of Si02 by 22 to 48%, compared with the corresponding values of charges obtained in the absence of Si02.
2
64
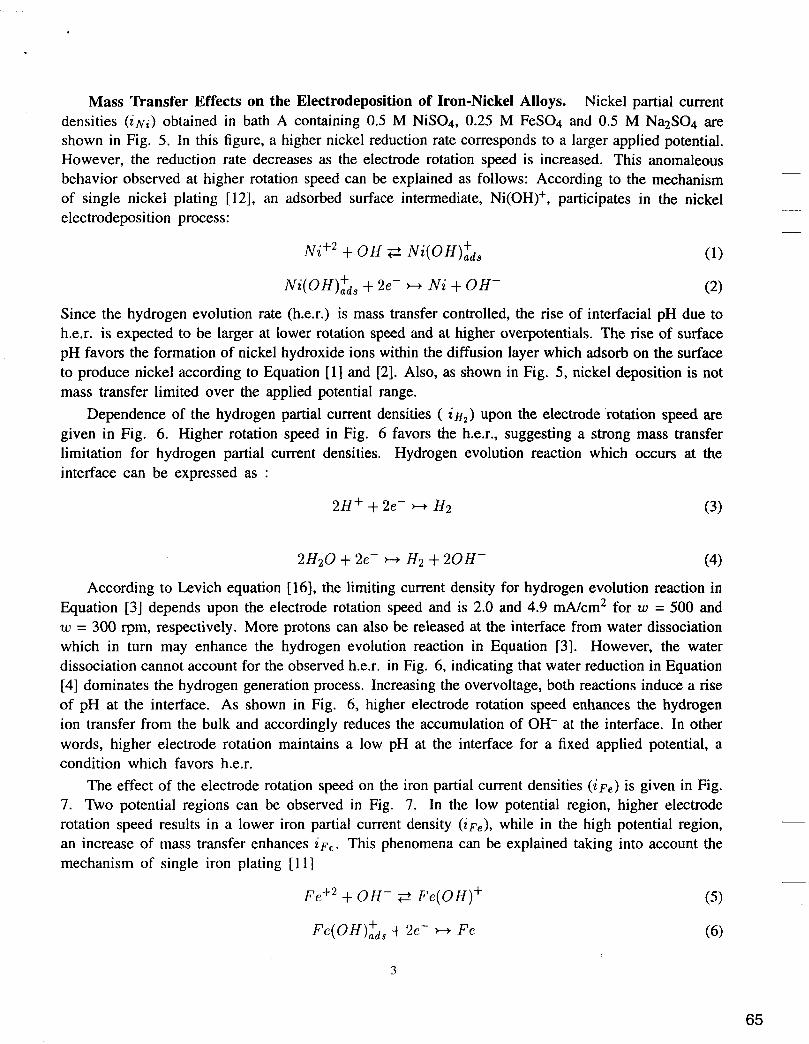
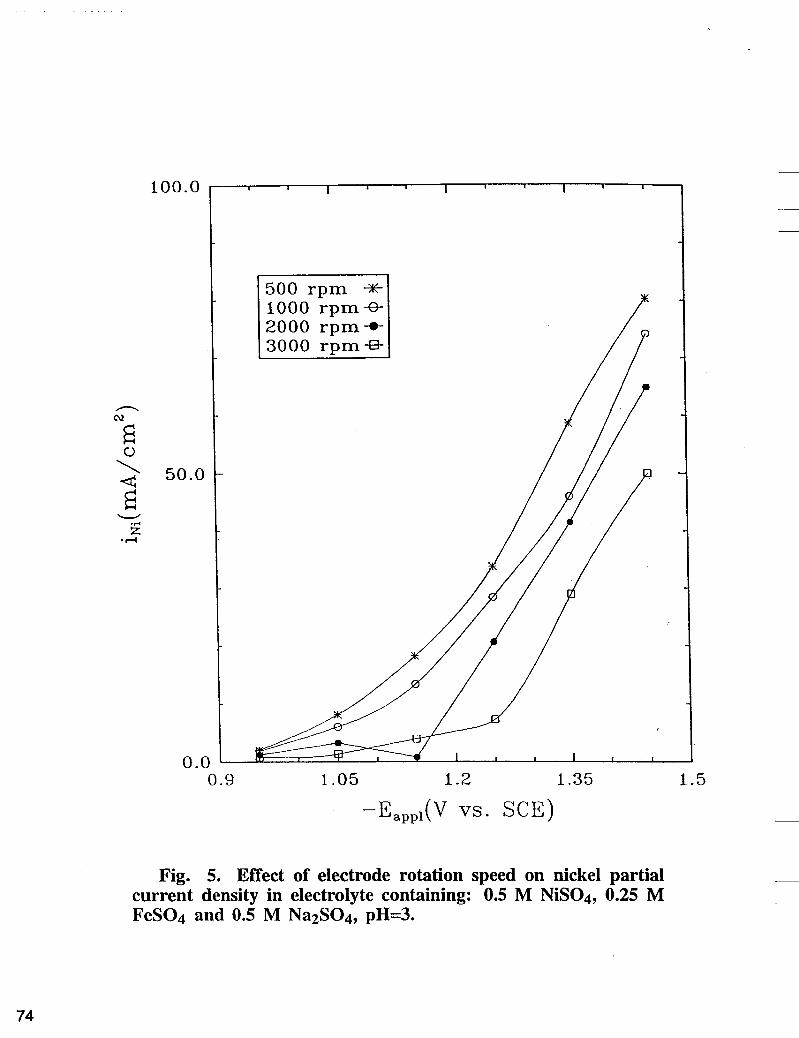
Mass lkansfer Effects on the Electrodeposition of Iron-Nickel Alloys. Nickel partial current densities ( i ~ i ) obtained in bath A containing 0.5 M NiS04, 0.25 M FeSO4 and 0.5 M Na2S04 are shown in Fig. 5. In this figure, a higher nickel reduction rate corresponds to a larger applied potential. However, the reduction rate decreases as the electrode rotation speed is increased. This anomaleous behavior observed at higher rotation speed can be explained as follows: According to the mechanism of single nickel plating [ 121, an adsorbed surface intermediate, Ni(OH)+, participates in the nickel electrodeposition process:
Ni+2 + O H Ni(OH)Td, (1)
Ni(OH)rd, + 2e- H ~i + O H - (2)
Since the hydrogen evolution rate (h.e.r.) is mass transfer controlled, the rise of interfacial pH due to h.e.r. is expected to be larger at lower rotation speed and at higher overpotentials. The rise of surface pH favors the formation of nickel hydroxide ions within the diffusion layer which adsorb on the surface to produce nickel according to Equation [l] and [2]. Also, as shown in Fig. 5 , nickel deposition is not mass transfer limited over the applied potential range.
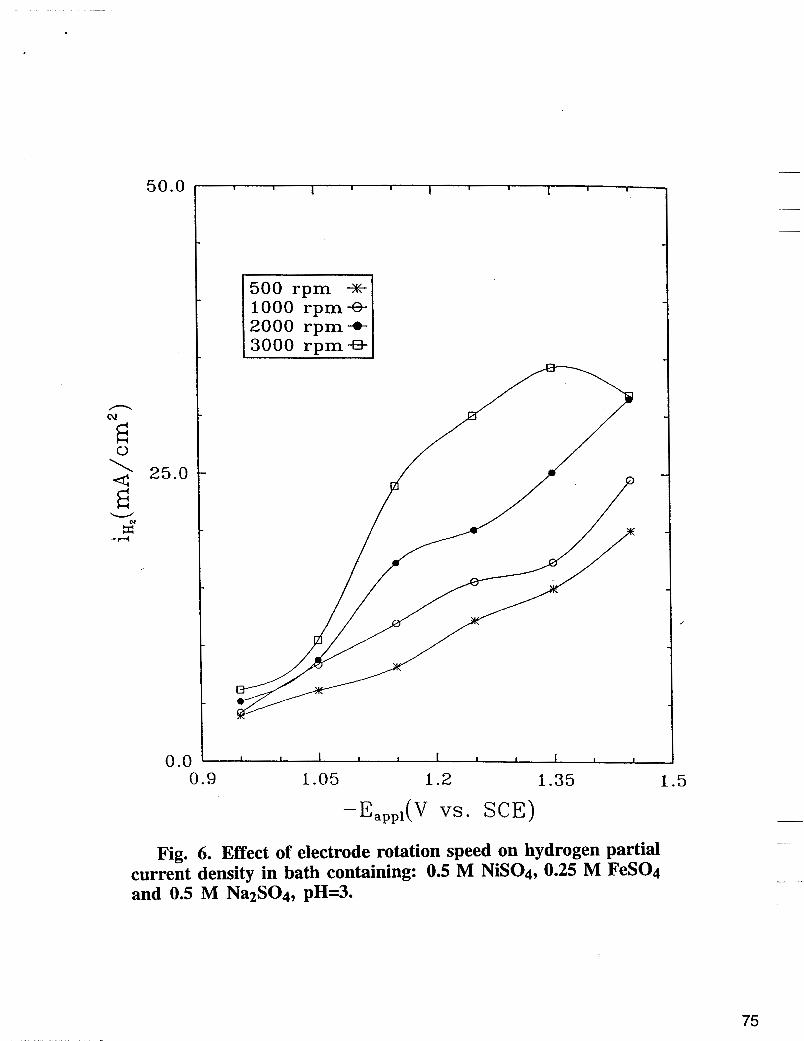
Dependence of the hydrogen partial current densities ( 2 ~ ~ ) upon the electrode iotation speed are given in Fig. 6. Higher rotation speed in Fig. 6 favors the h.e.r., suggesting a strong mass transfer limitation for hydrogen partial current densities. Hydrogen evolution reaction which occurs at the interface can be expressed as :
(3) 2H+ + 2e- H H2
2H20 + 2e- ++ H2 + 2 0 H - (4)
According to Levich equation [16], the limiting current density for hydrogen evolution reaction in Equation [3] depends upon the electrode rotation speed and is 2.0 and 4.9 mA/cm2 for w = 500 and w = 300 rpm, respectively. More protons can also be released at the interface from water dissociation which in turn may enhance the hydrogen evolution reaction in Equation [3]. However, the water dissociation cannot account for the observed h.e.r. in Fig. 6, indicating that water reduction in Equation [4] dominates the hydrogen generation process. Increasing the overvoltage, both reactions induce a rise of pH at the interface. As shown in Fig. 6, higher electrode rotation speed enhances the hydrogen ion transfer from the bulk and accordingly reduces the accumulation of OH- at the interface. In other words, higher electrode rotation maintains a low pH at the interface for a fixed applied potential, a condition which favors h.e.r.
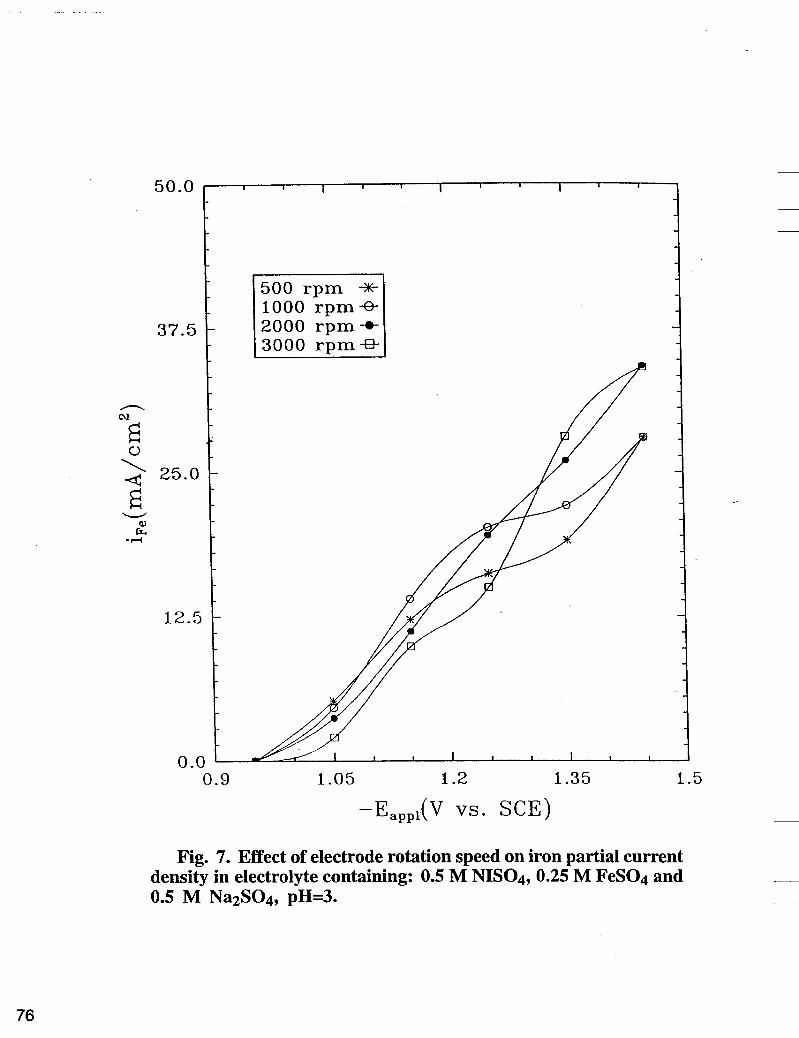
The effect of the electrode rotation speed on the iron partial current densities ( i ~ ~ ) is given in Fig. 7. Two potential regions can be observed in Fig. 7. In the low potential region, higher electrode rotation speed results in a lower iron partial current density ( i F e ) , while in the high potential region, an increase of mass transfer enhances Z F ~ . This phenomena can be explained taking into account the mechanism of single iron plating [ 1 I]
~ e + ~ + O H - Fe(OH)+ ( 5 )
Fe( O H ) i d , + 2e- H Fe (6)
3
65
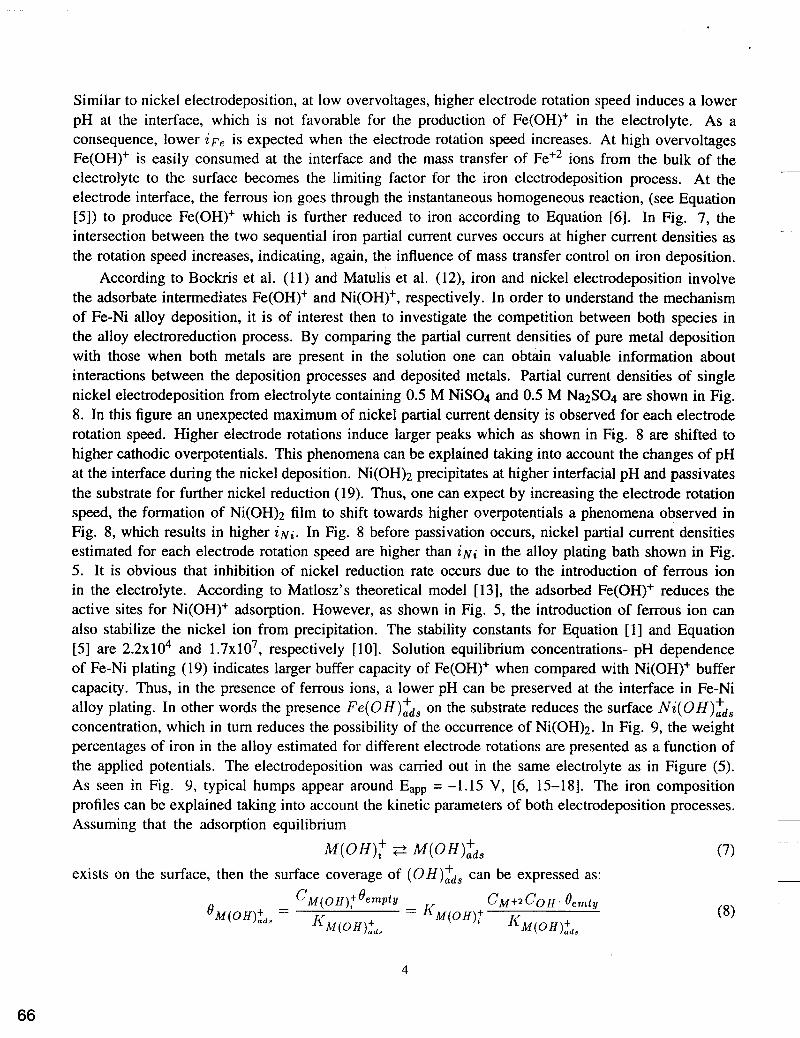
Similar to nickel electrodeposition, at low overvoltages, higher electrode rotation speed induces a lower pH at the interface, which is not favorable for the production of Fe(OH)+ in the electrolyte. As a consequence, lower i~~ is expected when the electrode rotation speed increases. At high overvoltages Fe(OH)+ is easily consumed at the interface and the mass transfer of Fe+2 ions from the bulk of the electrolyte to the surface becomes the limiting factor for the iron electrodeposition process. At the electrode interface, the ferrous ion goes through the instantaneous homogeneous reaction, (see Equation [SI) to produce Fe(OH)+ which is further reduced to iron according to Equation [6]. In Fig. 7, the intersection between the two sequential iron partial current curves occurs at higher current densities as the rotation speed increases, indicating, again, the influence of mass transfer control on iron deposition.
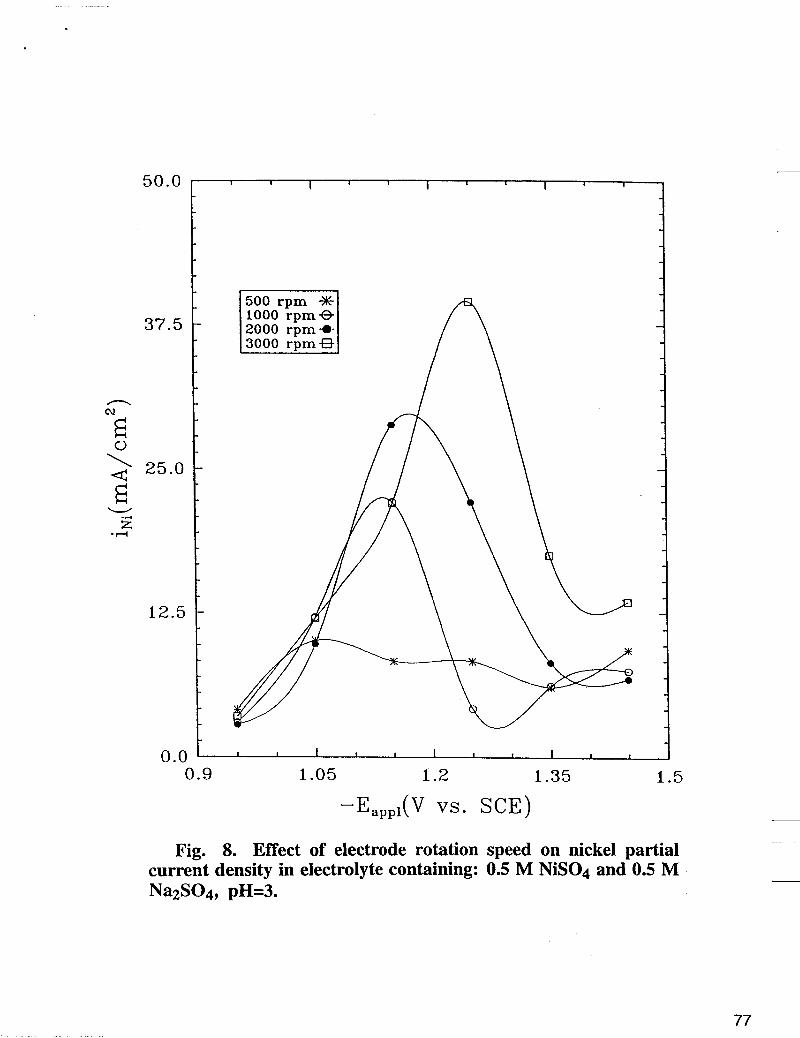
According to Bockris et ai. (1 1) and Matulis et al. (12), iron and nickel electrodeposition involve the adsorbate intermediates Fe(OH)+ and Ni(OH)+, respectively. In order to understand the mechanism of Fe-Ni alloy deposition, it is of interest then to investigate the competition between both species in the alloy electroreduction process. By comparing the partial current densities of pure metal deposition with those when both metals are present in the solution one can obtain valuable information about interactions between the deposition processes and deposited metals. Partial current densities of single nickel electrodeposition from electrolyte containing 0.5 M NiS04 and 0.5 M Na2S04 are shown in Fig. 8. In this figure an unexpected maximum of nickel partial current density is observed for each electrode rotation speed. Higher electrode rotations induce larger peaks which as shown in Fig. 8 are shifted to higher cathodic overpotentials. This phenomena can be explained taking into account the changes of pH at the interface during the nickel deposition. Ni(OH)2 precipitates at higher interfacial pH and passivates the substrate for further nickel reduction (19). Thus, one can expect by increasing the electrode rotation speed, the formation of Ni(OH)2 film to shift towards higher overpotentials a phenomena observed in Fig. 8, which results in higher i ~ i . In Fig. 8 before passivation occurs, nickel partial current densities estimated for each electrode rotation speed are higher than ZN; in the alloy plating bath shown in Fig. 5. It is obvious that inhibition of nickel reduction rate occurs due to the introduction of ferrous ion in the electrolyte. According to Matlosz's theoretical model [ 131, the adsorbed Fe(OH)+ reduces the active sites for Ni(OH)+ adsorption. However, as shown in Fig. 5, the introduction of ferrous ion can also stabilize the nickel ion from precipitation. The stability constants for Equation [ 11 and Equation [5] are 2 . 2 ~ 1 0 ~ and 1 .7x107, respectively [ 101. Solution equilibrium concentrations- pH dependence of Fe-Ni plating (19) indicates larger buffer capacity of Fe(OH)+ when compared with Ni(OH)+ buffer capacity. Thus, in the presence of ferrous ions, a lower pH can be preserved at the interface in Fe-Ni alloy plating. In other words the presence Fe(OH);td, on the substrate reduces the surface Ni(OH);td, concentration, which in turn reduces the possibility of the occurrence of Ni(OH)2. In Fig. 9, the weight percentages of iron in the alloy estimated for different electrode rotations are presented as a function of the applied potentials. The electrodeposition was carried out in the same electrolyte as in Figure (5). As seen in Fig. 9, typical humps appear around Eapp = -1.15 V, [6, 15-18]. The iron composition profiles can be explained taking into account the kinetic parameters of both electrodeposition processes. Assuming that the adsorption equilibrium
exists on the surface, then the surface coverage of (OH):& can be expressed as:
4
66
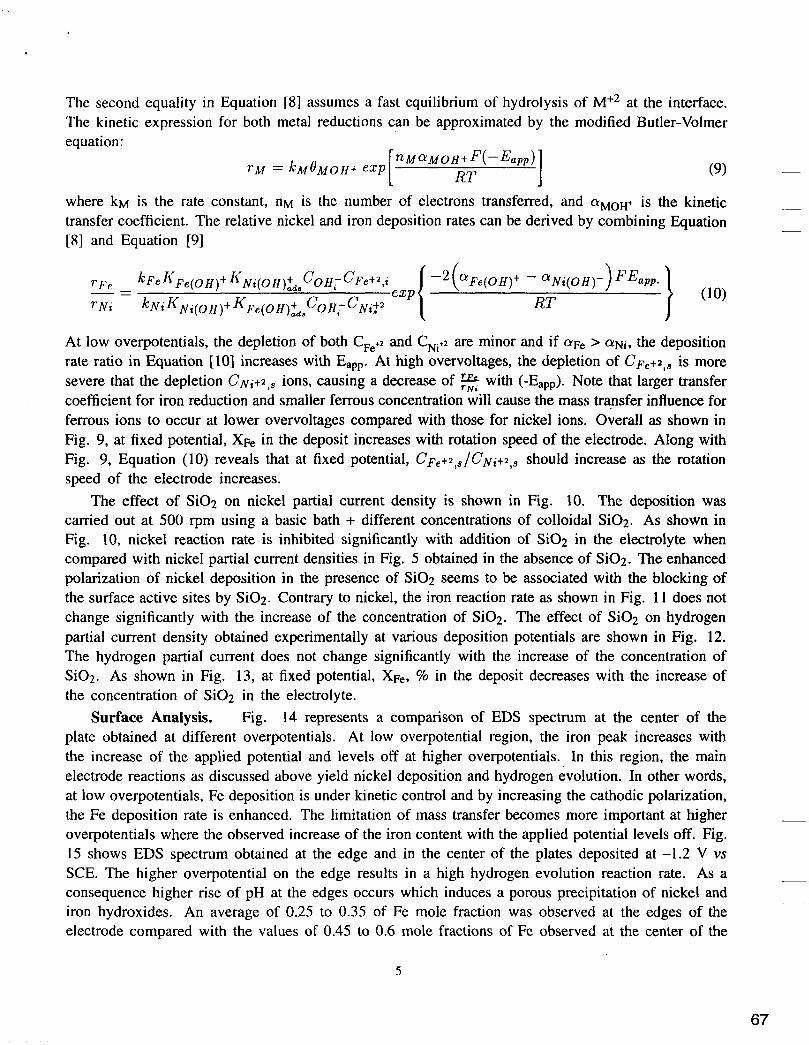
The second equality in Equation [8] assumes a fast equilibrium of hydrolysis The kinetic expression for both metal reductions can be approximated by the equation:
of M+2 at the interface. modified Butler-Volmer
where k M is the rate constant, n M is the number of electrons transferred, and CYMOH+ is the kinetic transfer coefficient. The relative nickel and iron deposition rates can be derived by combining Equation [8] and Equation [9]
At low overpotentials, the depletion of both CFe+2 and CNi+2 are minor and if CYFe > a N i , the deposition rate ratio in Equation [lo] increases with Eapp. At high overvoltages, the depletion of C F ~ + Z , ~ is more severe that the depletion C N i t 2 , s ions, causing a decrease of e with (-Eapp). Note that larger transfer coefficient for iron reduction and smaller ferrous concentration will cause the mass transfer influence for ferrous ions to occur at lower overvoltages compared with those for nickel ions. Overall as shown in Fig. 9, at fixed potential, XFe in the deposit increases with rotation speed of the electrode. Along with Fig. 9, Equation (10) reveals that at fixed potential, C F e t 2 , s / C N i t 2 , s should increase as the rotation speed of the electrode increases.
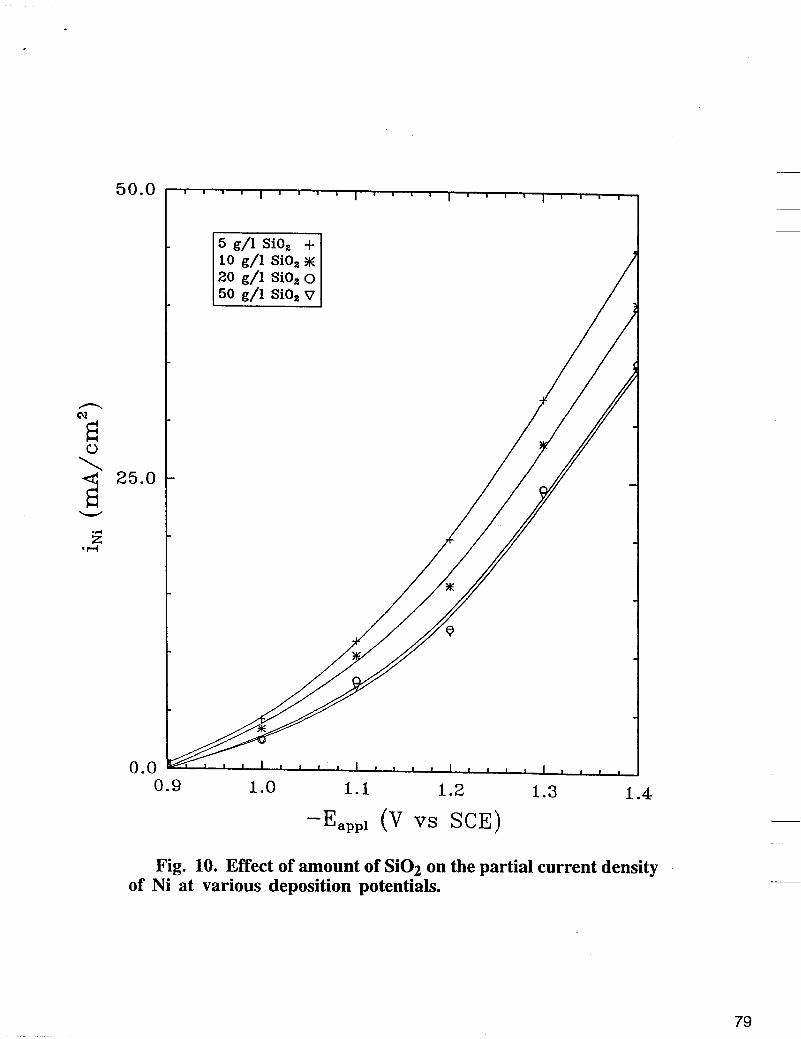
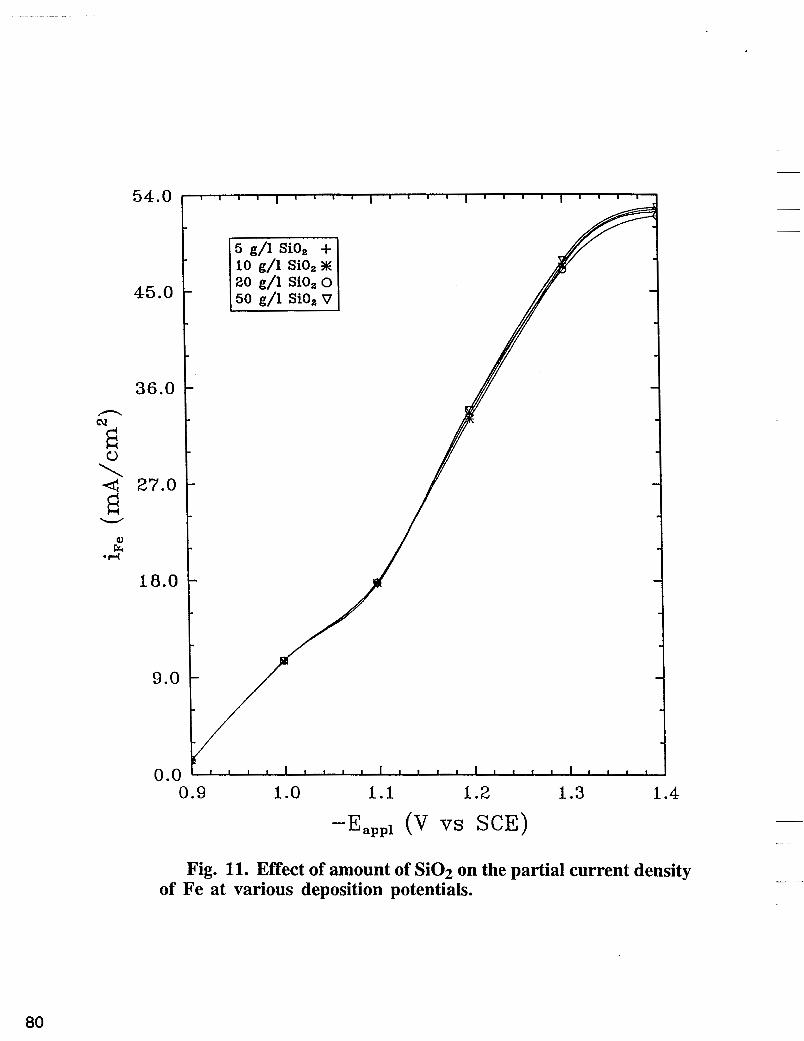
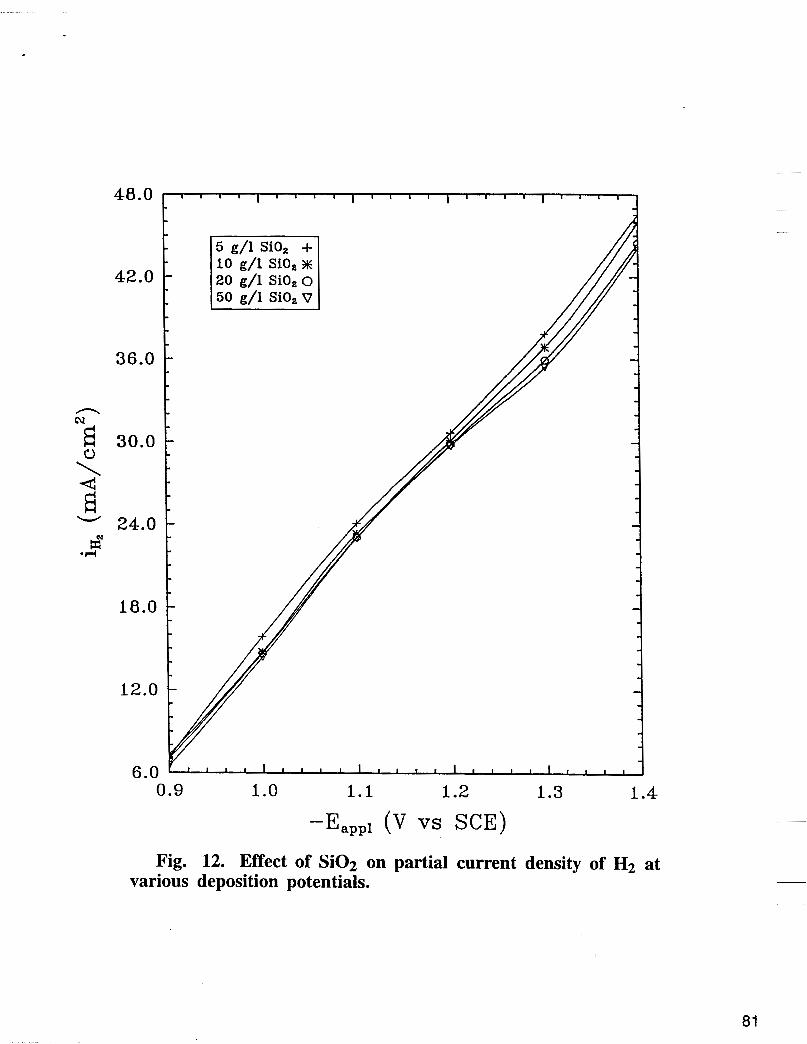
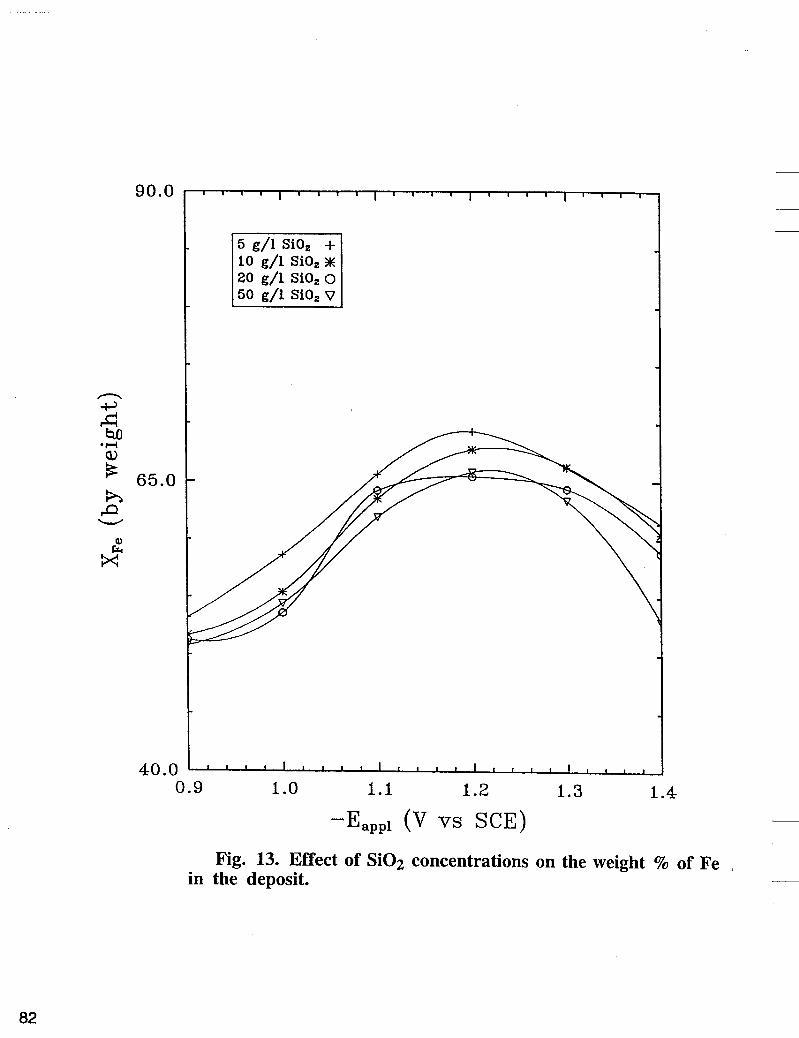
The effect of Si02 on nickel partial current density is shown in Fig. 10. The deposition was carried out at 500 rpm using a basic bath + different concentrations of colloidal Si02. As shown in Fig. 10, nickel reaction rate is inhibited significantly with addition of Si02 in the electrolyte when compared with nickel partial current densities in Fig. 5 obtained in the absence of Si02. The enhanced polarization of nickel deposition in the presence of Si02 seems to be associated with the blocking of the surface active sites by Si02. Contrary to nickel, the iron reaction rate as shown in Fig. 11 does not change significantly with the increase of the concentration of Si02. The effect of Si02 on hydrogen partial current density obtained experimentally at various deposition potentials are shown in Fig. 12. The hydrogen partial current does not change significantly with the increase of the concentration of Si02. As shown in Fig. 13, at fixed potential, XFe, % in the deposit decreases with the increase of the concentration of Si02 in the electrolyte.
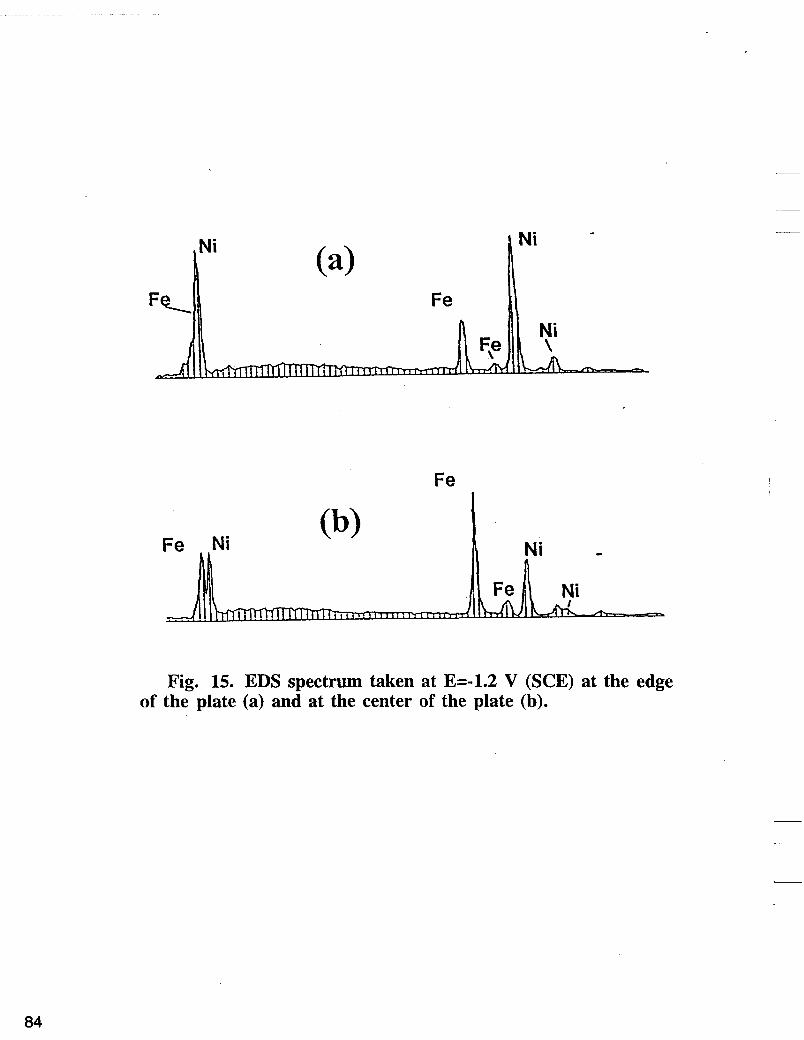
Fig. 14 represents a comparison of EDS spectrum at the center of the plate obtained at different overpotentials. At low overpotential region, the iron peak increases with the increase of the applied potential and levels off at higher overpotentials. In this region, the main electrode reactions as discussed above yield nickel deposition and hydrogen evolution. In other words, at low overpotentials, Fe deposition is under kinetic control and by increasing the cathodic polarization, the Fe deposition rate is enhanced. The limitation of mass transfer becomes more important at higher overpotentials where the observed increase of the iron content with the applied potential levels off. Fig. 15 shows EDS spectrum obtained at the edge and in the center of the plates deposited at -1.2 V vs SCE. The higher overpotential on the edge results in a high hydrogen evolution reaction rate. As a consequence higher rise of pH at the edges occurs which induces a porous precipitation of nickel and iron hydroxides. An average of 0.25 to 0.35 of Fe mole fraction was observed at the edges of the electrode compared with the values of 0.45 to 0.6 mole fractions of Fe observed at the center of the
Surface Analysis.
5
67
of the plate. These results were not consistent with Dahms and Croll’s mechanism (1,2). According to these authors a much higher Fe content would be expected on the edges, where higher current density and higher h.e.r. occur. Potentiostatic plating of and Fe-Ni alloy was carried out at fixed potential of -1.15 V vs SCE in absence and the presence of 10 g/l of Si02 in the electrolyte (0.5 M NiS04 + 0.25 M FeS04 + 0.5 M Na2S04). Fig 16 depicts an EDS spectrum and a SEM of the deposits plated in
-
the are
1.
2. 3. 4. 5. 6. 7. 8. 9. 10. 11. 12. 13. 14. 15. 16.
17. 18. 19.
~~
presence of 10 g/l Si02 in the electrolyte. According to this figure, significant amounts of Si02 included in the deposit.
-
Acknowledgment Financial support by AESF under Research Project RF-83 is gratefully acknowledged.
References
I. M. Croll and L. T. Romankiw, in “Proceedings of the Symposium on Electrodeposition Technology, Theory and Practice,” L. T. Romankiw, Editor, The Electrochemical Society Soft- bound Series, PV 87-1 7, The Electrochemical Society Proceedings Series, Pennington, NJ, (1987). H. Dahms, J. Electroanal. Chem. Interfacial Electrochem., 8, 5 , (1964). A. Dahms and I. M. Croll, J. Electrochem. SOC., 112, 771, (1965). M. J. Nichol and H. I. Philip, J. Electroanal. Chem. Interfacial Electrochem., 70, 233, (1976). S. Swatharajan, J. Electrochem. SOC., 133, 671, (1986). P. C. Andriacos, C. Arana, J. Tabib, J. Dukovic and L.T. Romankiw, ibid, 136 ,1336, (1989). P. C. Andriacos, J. Tabib and L. T. Romankiw,ibid, 135, 1172, (1988). W. C. Grande and J. B. Talbot, ibid, 136, 3611, (1989). D. Gangasingh and J. B. Talbot, ibid, 138, 12, 3605, (1991). S. Hessami and C. W. Tobias, ibid, 136, 3611, (1989). J. O’M Bockris, D. Drazic and A. R. Despic, Electrochim. Acta, 4, 325, (1961). J. Matulis and R. Slizys, ibid, 9, 1177, (1964). M. Matlosz, J. Electrochem. SOC., 140, 2272, (1993). B. N. Popov, S. N. Popova, Ken-Ming Yin and R. E. White, Plat. and Surf. Fin., 81, 65, (1994). B. N. Popov, Ken-Ming Yin and R. E. White, J. Electrochem., SOC., 140, 1321, (1993). A. J. Bard and L. R. Faulkner, “Electrochemical Methods: Fundamentals and Applications,” John Wiley & Sons, (1980). J. Horkans, J. Electrochem. SOC., 128, 45, (1981). N. Nakamura and T. Hayashi, Plat. and Surf. Fin., 72, 42, (1994). K.-M. Yin, J. H. Wei, J.-R. Fu, J. Sheu, B. N. Popov, S. N. Popova and R. E. White, “Mass Transport Effects on the Electrodeposition if Iron-Nickel Alloys in the Presence of Organic Additives,” accepted for publication in J. Appl. Electrochem., November 1994.
-
6
68
Notation
cj concentration of species j, (mol ~ m - ~ ) . Cj,s concentration of species j at the interface, (mol ~ m - ~ ) . Eapp applied potential, (V). F Faraday constant, (96,487 C/eq). k M rate constant for the deposition of M, (mol cm-* s-'. Kj stability constant of species j, (mol ~ m - ~ . Kj,ads adsorption constant of species j, (mol ~ m - ~ . n M number of electrons transferred for metal deposition. rj deposition rate of species j, (mol cm-2 s-'. R gas constant, (8.314 J mol-' K-') T absolute temperature, (K).
Greek letters aj transfer coefficient for the deposition of j, dimensionless. Oempty uncovered surface fraction, dimensionless. Oj surface coverage fraction of species j, dimensionless.
7
69
Gold WE
7 Potentios tat
CE
Fig. 1. EQCN cell configuration. The working electrode consists of a quartz crystal, sputtered with a thin layer of gold on both sides. The electrode area exposed is 0.2 cm2.
70
-0.OSM FeSO,
..----. 0 .5M FeS O4
A
-4 W W
+9.0 ' " " ' " ' ' ' ' ' I ' I ' ' I ' ' I " I
-1.2 -1.0 -0.8 -0.6 -0.4 -0.2 E (V vs SCE)
0.0
Fig. 2. LSV recorded on fixed copper disc electrodes in electrolyte: 0.5 M NiS04 + 0.5 M Na2S04 for different FeS04 concentrations, pH=3.0, v=30 mV/s.
71
-18.0 I
El
-4.5
9.0 - 1000.0 -500.0 0.0
Potential (mV) Fig. 3. LSV recorded for various concentrations of Si02 at
v=20 m'v/s, pH=3.0.
72
30.0
n u CY I
4 0
I
e
0 15.0
Q) k
Q) t2n k d s u
$ E
0.c
-1.1 v 8 -1.05 V* -1.0 v -3-
0.0 10.0 20.0 30.0 40.0 50.0
Composition of SiOz (g/l)
Fig. 4. Charge removed on the anodic cycle of LSV’s with different vertex potentials for various Si02 concentrations.
73
100.0
50.0
0.0
, I I I 1 I I -1 I
500 rpm * 1000 r p m e 2000 r p m t
0.9 1.05 1.2 1.35
-EappI(V VS. SCE) 1.5
Fig. 5. Effect of electrode rotation speed on nickel partial current density in electrolyte containing: 0.5 M NiS04, 0.25 M FeS04 and 0.5 M NazS04, pH=3.
74
50.0
' 4 25.0
I 1 I I I 8 I I I I I
1000 rpm-0- 2000 rpm+
0.0 I 1 I I I I I I I I I
,
0.9 1.05 1.2 1.35 1.5
-EappI(V VS. SCE)
Fig. 6. Effect of electrode rotation speed on hydrogen partial current density in bath containing: 0.5 M NiS04, 0.25 M FeS04 and 0.5 M Na~S04, pH=3.
75
50.0
37.5
n
0
I I I I I 1 I I I I I I 1
0.0
500 rpm * 1000 r p m e 2000 rpm+ 3000 r p m e
0.9 1.05 1.2 1.35 1.5
-EappI(V VS. SCE)
Fig. 7. Effect of electrode rotation speed on iron partial current density in electrolyte containing: 0.5 M NISO4,0.25 M FeS04 and 0.5 M Na2S04, pH=3.
76
\ 4 E
Fig. 8. Effect of electrode rotation speed on nickel partial current density in electrolyte containing: 0.5 M NiS04 and 0.5 M Na2S04, pH=3.
77
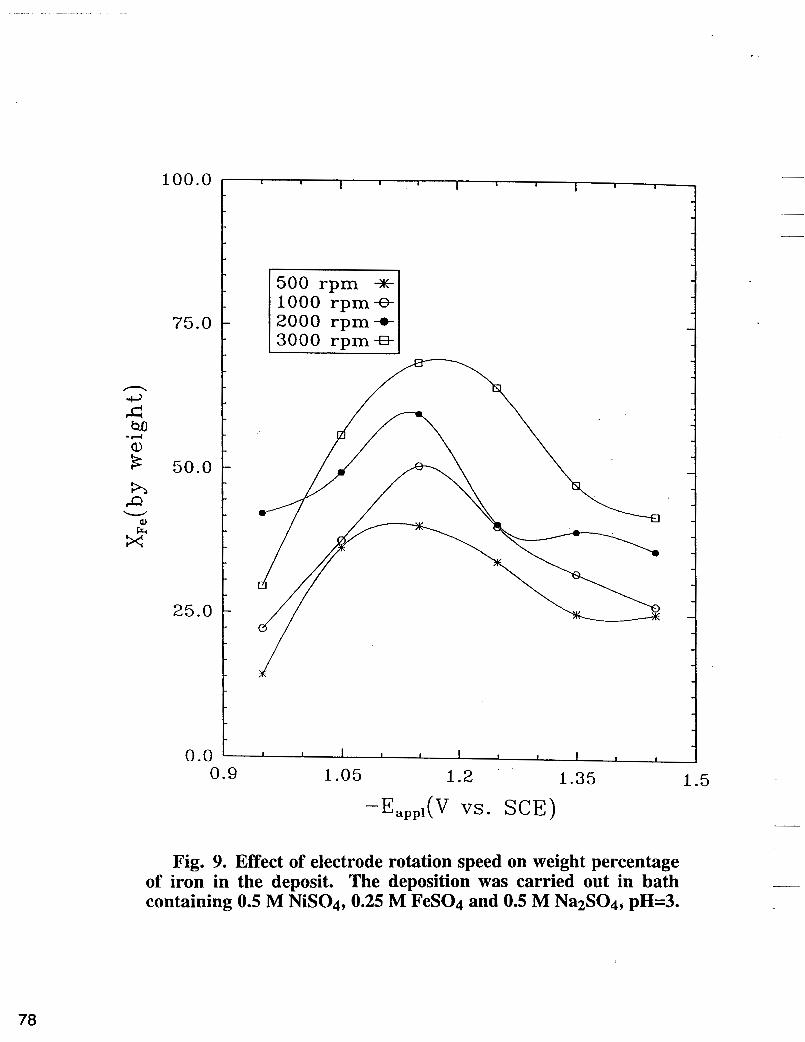
Fig. 9. Effect of electrode rotation speed on weight percentage of iron in the deposit. The deposition was carried out in bath containing 0.5 M NiS04,0.25 M FeS04 and 0.5 M Na2S04, pH=3.
70
50.0
\ 4 25.0 El
W
I
0 .
- Eappl (V vs SCE)
Fig. 10. Effect of amount of Si02 on the partial current density of Ni at various deposition potentials.
79
10 g/l Sio2 m 20 g/l S io20
45.0 50 g/l Si02 V I
Fig. 11. Effect of amount of Si02 on the partial current density of Fe at various deposition potentials.
80
42.0 -
36.0 -
n
N f i 30.0
-4 -Y B
24.0 - W
d *r(
18.0 -
12.0 - ,-
6 .O 0.9 1 .o 1.1 1.2
- Eappl (V vs SCE) 1.3 1.4
Fig. 12. Effect of Si02 on partial current density of H2 at various deposition potentials.
81
90.0
’ 65.0 al
x”
40.0 1 1 1 1 1 1 I 1 , 1 , , 1 1 ~ 1 1 1 I l l , ,
0.9 1 .o 1.1 1.2 1.3 1.4 --Eappl (V vs SCE) -
Fig. 13. Effect of Si02 concentrations on the weight % of Fe in the deposit. -
82
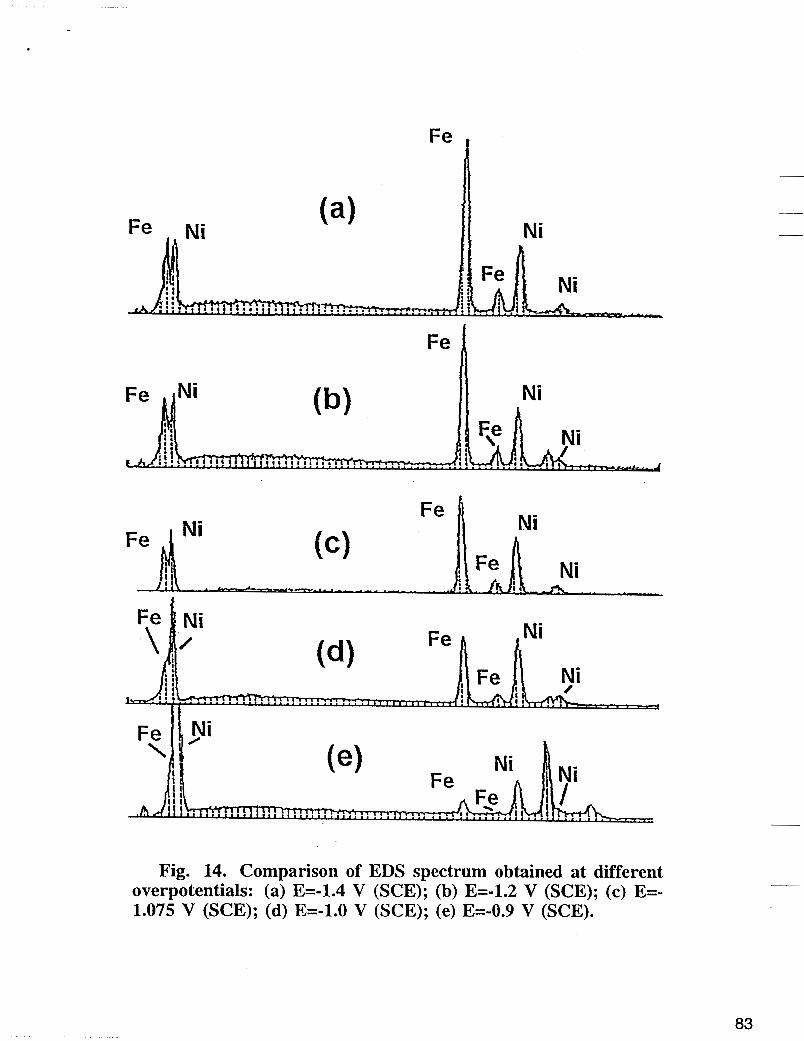
Fig. 14. Comparison of EDS spectrum obtained at different overpotentials: (a) E=-1.4 V (SCE); (b) E=-1.2 V (SCE); (c) E=- 1.075 V (SCE); (d) E=-1.0 V (SCE); (e) E=-0.9 V (SCE).
83
Fe
Fig. 15. EDS spectrum taken at E=-1.2 V (SCE) at the edge of the plate (a) and at the center of the plate (b).
84
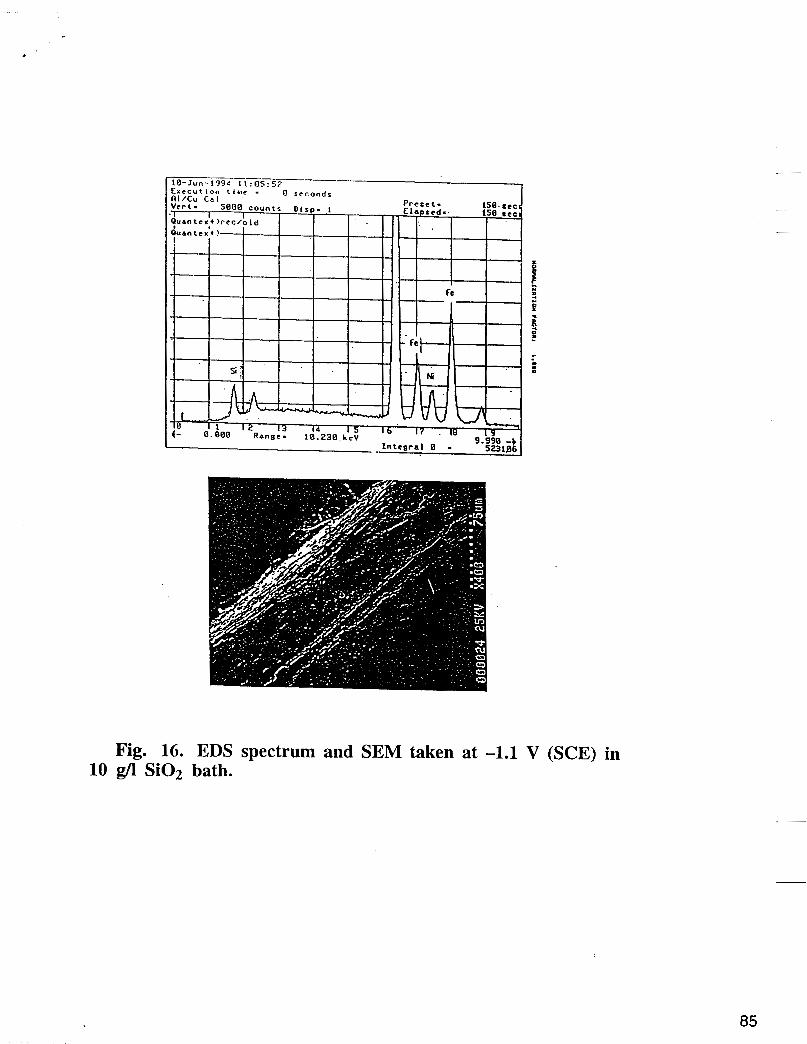
Fig. 16. EDS spectrum and SEM taken at -1.1 V (SCE) in 10 g/l Si02 bath.
85
!
i
86


![Mesoscale Compositionally Modulated Nanocrystalline Ni-Fe ......solution using an electrodeposition process similar to the one reported by Cheung et al. [16]. It was plated on a 150mm](https://img.pdfslide.net/doc/110x75/60c3bc1e868e7834184f060c/mesoscale-compositionally-modulated-nanocrystalline-ni-fe-solution-using.jpg)