Embed Size (px)
Citation preview
S1
Electronic Supplementary Information
Triphenylamine-functionalized tetraphenylpyrazine:
facile preparation and multifaceted functionalities
Ming Chen,a Han Nie,b Bo Song,b Lingzhi Li,a Jing Zhi Sun,a Anjun Qin*ab and Ben
Zhong Tang*abc
a MOE Key Laboratory of Macromolecular Synthesis and Functionalization,
Department of Polymer Science and Engineering, Zhejiang University, Hangzhou
310027, China. E-mail: [email protected] or [email protected] (A.J.Q.).
b Guangdong Innovative Research Team, State Key Laboratory of Luminescent
Materials and Devices, South China University of Technology, Guangzhou 510640,
China.
c Department of Chemistry, Institute for Advanced Study, Institute of Molecular
Functional Materials, and State Key Laboratory of Molecular Neuroscience, The
Hong Kong University of Science & Technology, Clear Water Bay, Kowloon, Hong
Kong China. E-mail: [email protected] (B.Z.T.).
Electronic Supplementary Material (ESI) for Journal of Materials Chemistry C.This journal is © The Royal Society of Chemistry 2015
S2
Table of contents
Experimental Section S4
Figure S1. 1H NMR spectra of 4 in CDCl3. The solvent peak is marked with asterisk.
S9
Figure S2. 13C NMR spectra of 4 in CDCl3. S10
Figure S3. 1H NMR spectra of TPP-Br in CDCl3. The solvent peak is marked with
asterisk. S10
Figure S4. 13C NMR spectra of TPP-Br in CDCl3. S11
Figure S5. 1H NMR spectra of 7 in CDCl3. The solvent peak is marked with asterisk.
S11
Figure S6. 13C NMR spectra of 7 in CDCl3. The solvent peak are marked with
asterisks. S12
Figure S7. 1H NMR spectra of TPP-4Br in CDCl3. The solvent peak is marked with
asterisk. S12
Figure S8. 13C NMR spectra of TPP-4Br in CDCl3. S13
Figure S9. 1H NMR spectra of 10 in acetone-d6. S13
Figure S10. 13C NMR spectra of 10 in CDCl3. The solvent peak are marked with
asterisks. S14
Figure S11. 1H NMR spectra of 2 in acetone-d6. S14
Figure S12. 13C NMR spectra of 2 in acetone-d6. The solvent peak are marked with
asterisks. S15
Figure S13. 1H NMR spectra of TPP-TPA in CD2Cl2. S15
Figure S14. 13C NMR spectra of TPP-TPA in CDCl3. S16
Figure S15. 1H NMR spectra of TPP-2TPA in CD2Cl2. S16
Figure S16. 13C NMR spectra of TPP-2TPA in CD2Cl2. S17
Figure S17. 1H NMR spectra of TPP-4TPA in CD2Cl2. S17
Figure S18. HRMS spectra of TPP-TPA. S18
Figure S19. HRMS spectra of TPP-2TPA. S18
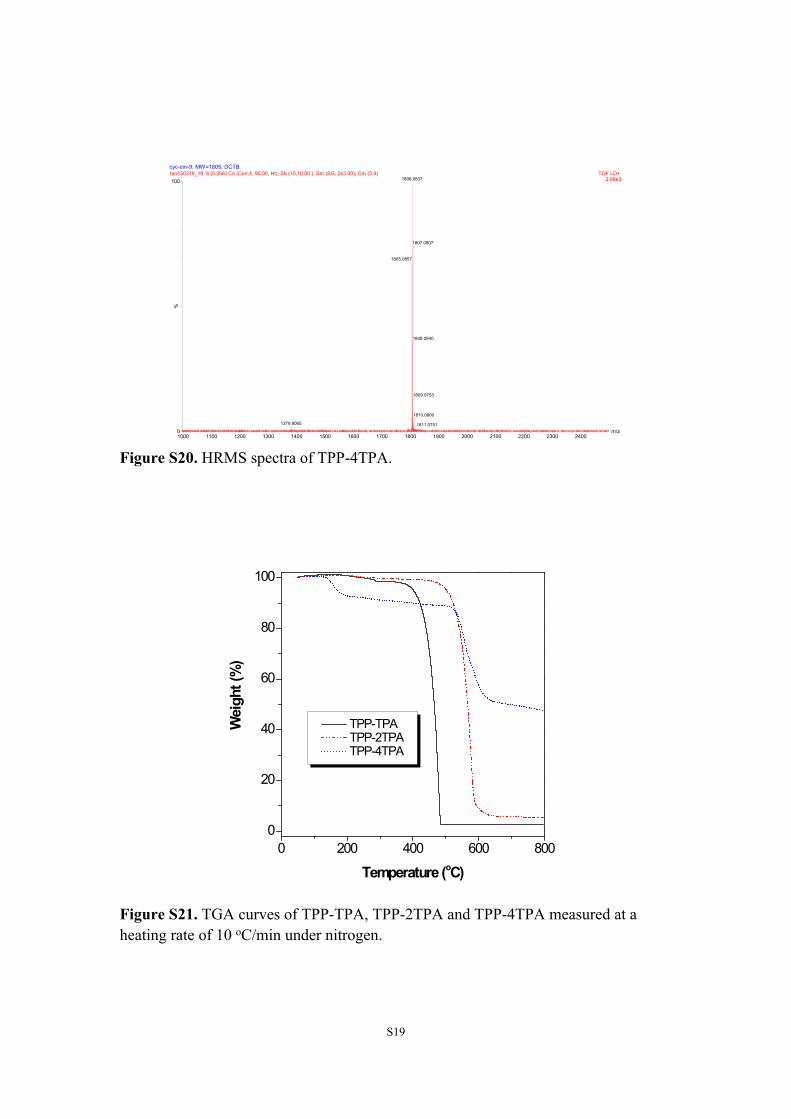
Figure S20. HRMS spectra of TPP-4TPA. S19
S3
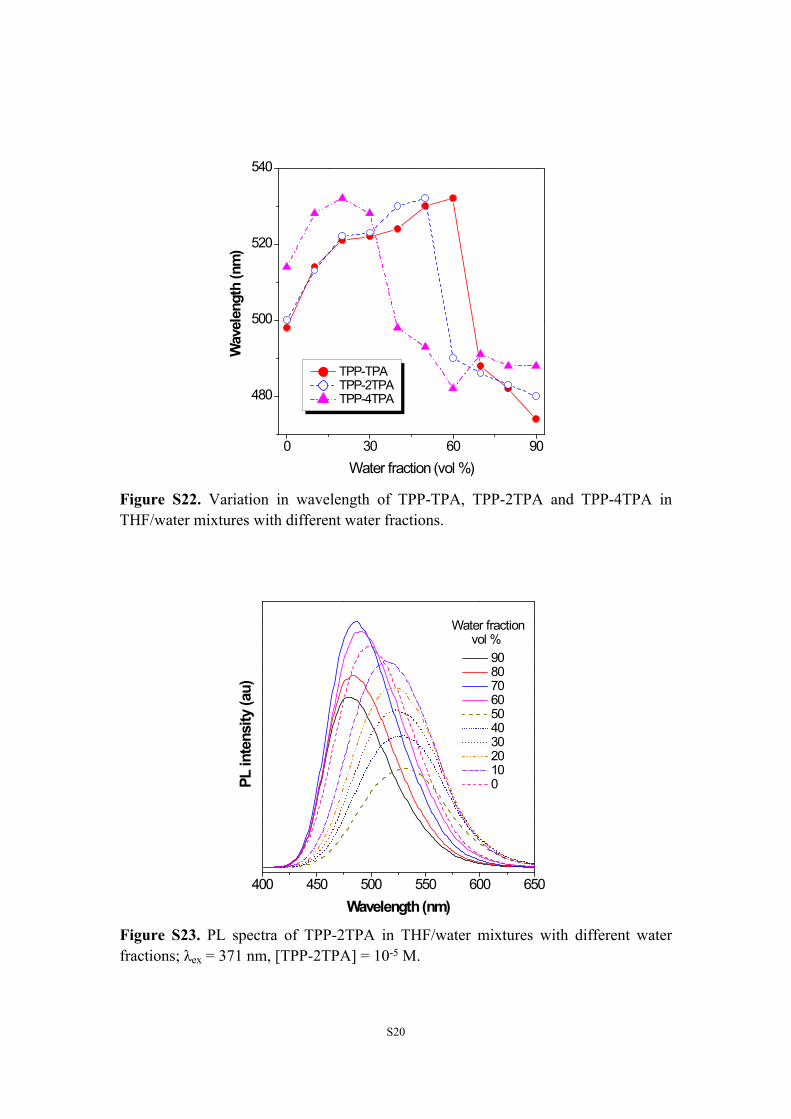
Figure S21. TGA curves of TPP-TPA, TPP-2TPA and TPP-4TPA measured at a
heating rate of 10 oC/min under nitrogen. S19
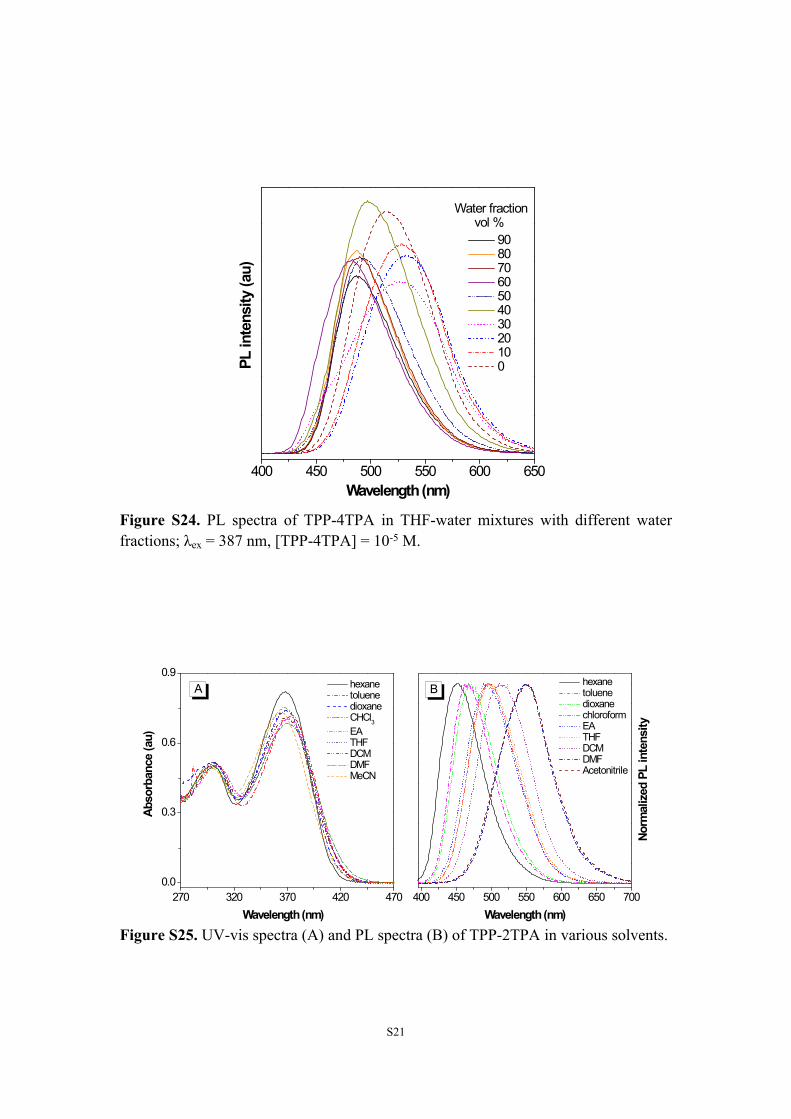
Figure S22. Variation in wavelength of TPP-TPA, TPP-2TPA and TPP-4TPA in
THF/water mixtures with different water fractions. S20
Figure S23. PL spectra of TPP-2TPA in THF/water mixtures with different water
fractions; λex = 371 nm, [TPP-2TPA] = 10-5 M. S20
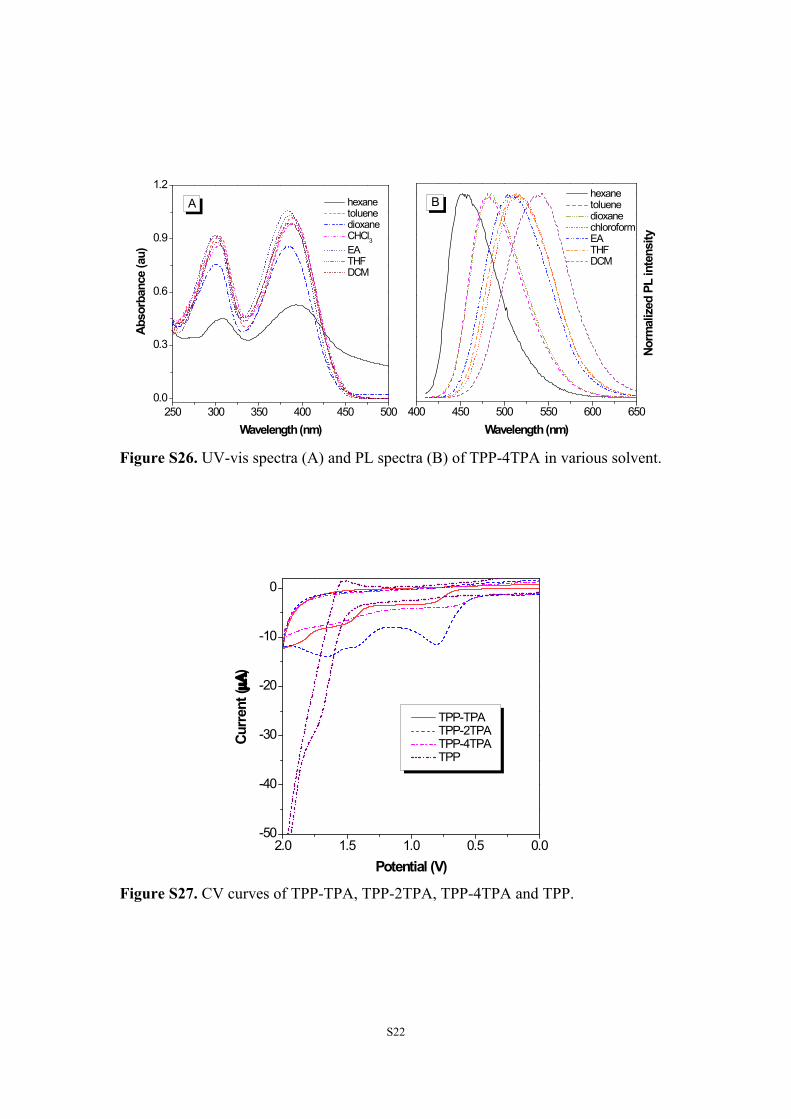
Figure S24. PL spectra of TPP-4TPA in THF-water mixtures with different water
fractions; λex = 387 nm, [TPP-4TPA] = 10-5 M. S21
Figure S25. UV-vis spectra (A) and PL spectra (B) of TPP-2TPA in various solvents.
S21
Figure S26. UV-vis spectra (A) and PL spectra (B) of TPP-4TPA in various solvent.
S22
Figure S27. CV curves of TPP-TPA, TPP-2TPA, TPP-4TPA and TPP. S22
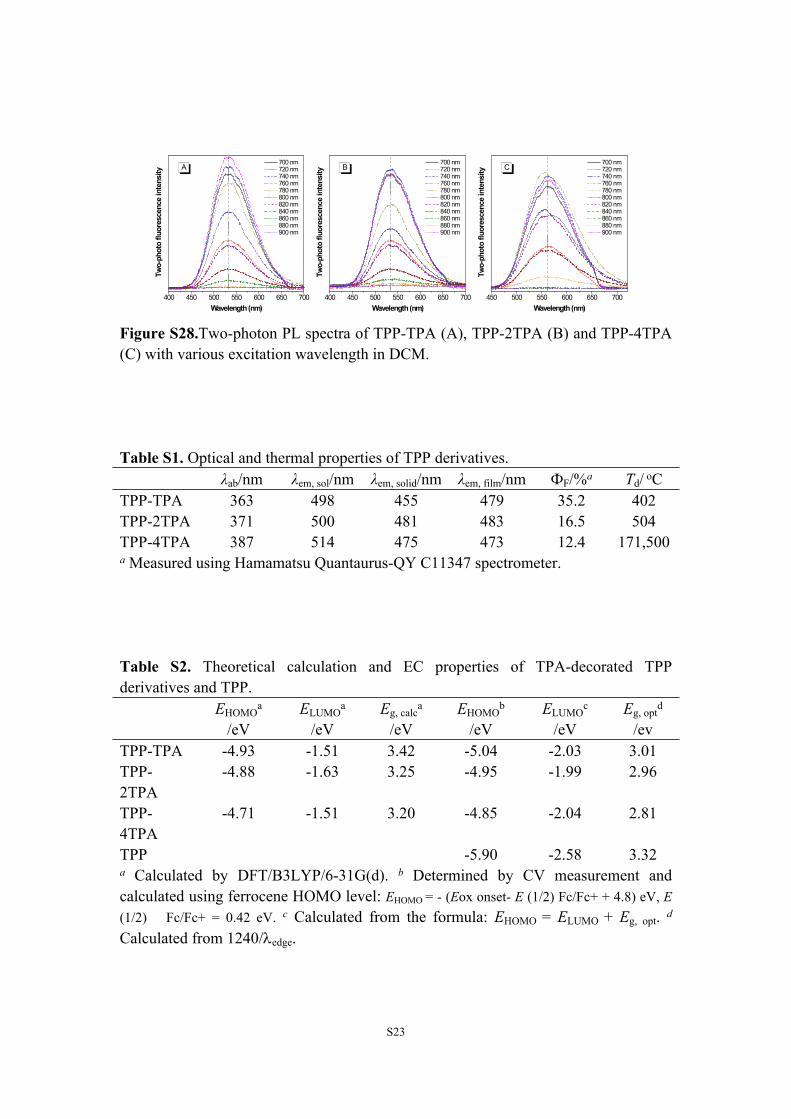
Figure S28.Two-photon PL spectra of TPP-TPA (A), TPP-2TPA (B) and TPP-4TPA
(C) with various excitation wavelength in DCM. S23
Table S1. Optical and thermal properties of TPP derivatives. S23Table S2. Theoretical calculation and EC properties of TPA-decorated TPP derivatives and TPP. S23References S24
S4
Experimental Section
Materials: All commercially available chemicals were purchased from J&K, Alfa
Aesar, Energy Chemical, or Sinopharm Chemical Reagent Co., Ltd and used directly
unless specially stated. 1-(4-bromophenyl)-2-phenylethanone (3) was prepared
according to the literature procedures.1 TPP-2Br was provided in our previous work.2
THF and toluene were distilled from sodium benzopheone ketyl under dry nitrogen
immediately prior to use.
Instrumentation: 1H and 13C NMR spectra were measured with a Bruker AV 400
spectrometer using CDCl3, CD2Cl2, Acetone-d6 or DMSO-d6 as solvent. High
resolution mass spectra (HRMS) were carried out using a GCT premier CAB048 mass
spectrometer operated in MALDI-TOF mode. Single crystal X-ray diffraction was
carried out with a Gemini A Ultra diffractometer at 293K. UV-visible absorption
spectra were recorded on a Varian CARY 100 Biospectrophotometer. PL spectra were
measured on a RF-5301 PC spectrofluorometer. The absolute quantum efficiency (ΦF)
was recorded on a Hamamatsu Quantaurus-QY C11347 spectrometer. Cyclic
voltammetry (CV) was performed in a three-electrode cell using CHI600D
electrochemical workstation at room temperature. Electrochemical investigations
were conducted in anhydrous CH2Cl2 with a Pt disk, Pt wire and SCE as working
electrode, auxiliary electrode and reference electrode, respectively. 0.1M n-
tetrabutylammonium hexafluorophosphate and ferrocene were used as supporting
electrolyte and standard, respectively. The electrolyte solution was purged with
nitrogen before electrochemical measurements, and the scanning rate was 50 mV s-1.
TGA was carried out with TA Q50 at a heating rate of 10℃/ min under N2,
respectively.
Device fabrication: Electroluminescence device was fabricated on a 80 nm ITO-
coated glass with a sheet resistance of 10 Ω/sq. Prior to loading into the pretreatment
chamber, the ITO coated glass was soaked in ultrasonic acetone and detergent for one
time, followed by two times of ultrasonic de-ionized water and one time of ultrasonic
isopropanol. Each time was kept for 10 min. Then, the glass was baked at 80 ℃ for 1
S5
h in oven, and tearted with oxygen plasma for 5 min after dry. Aferwards, ITO-coated
glass was transferred to the chamber with a base pressure of 7 × 10⁻⁷ Torr for
deposition of the organic layers, LiF and Al, with a rate of 1-2 Å/s, 0.1 Å/s and 0.1
Å/s, respectively. The active area of OLED device was 3 mm × 3 mm. The current
density-voltage- luminescence characteristics of device were recorded on Keithley
2420 and Konica Minola chromameter CS-200 analyzers. The EL spectra were
recorded with a Photo Research PR-750 spectrofluorometer. All measurements here
were carried out under air at room temperature without device encapsulation.
Two-photon excitation fluorescence measurements: The two-photon excitation
fluorescence was carried out with a Ti:sapphire femtosecond oscillator
(SpectraPhysics Mai Tai) as the excitation source. The output laser pulses have a
tunable central wavelength ranged from 690 nm to 1040 nm with pulse duration of
less than 100 fs and a repetition rate of 80.5 MHz. The laser beam was focused onto
the samples utilizing a lens with a focus length of 3.0 cm. The emission was recorded
at an angle of 90° to the direction of the excitation beam to minimize the scattering.
The emission signal was directed into a CCD (Princeton Instruments, Pixis 400B)
coupled monochromator (IsoPlane160) with an optical fiber. A 700 nm short pass
filter was laid before the spectrometer to minimize the scattering from the excitation
light. Rhodamine B was selective as reference, and two-photo absorption cross
section (σ) could be calculated according to the formula:3
𝜎𝑥=𝐹𝑥𝜙0𝐶0𝐹0𝜙𝑥𝐶𝑥
𝜎0
Where, F, ϕ, and C refer to two-photo fluorescence intensity, fluorescence quantum
yield and sample contration of chromophore, respectively. X and 0 refer to tested
sample and reference, respectively.
O
Br
Cu(OAc)2, PPh3
O
BrO
NH2
NH2
HOAcN
N
Br
1,2,4-trimethylbenzene
3 4
5
TPP-Br
S6
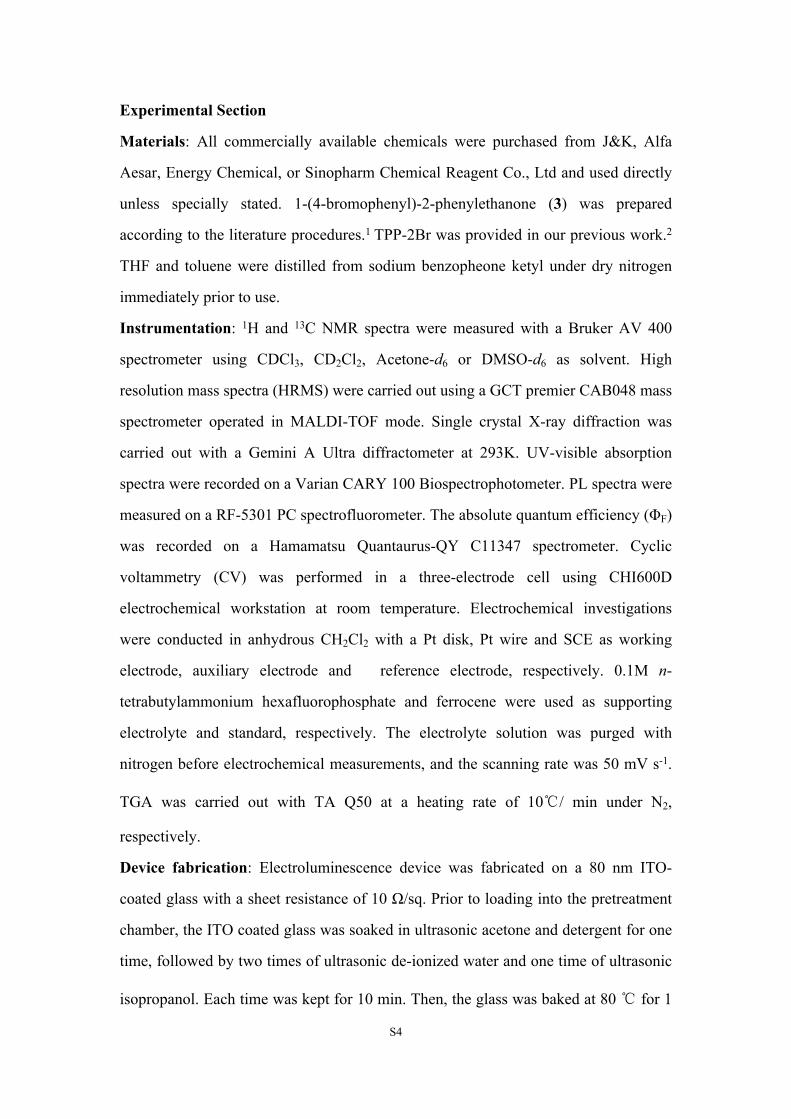
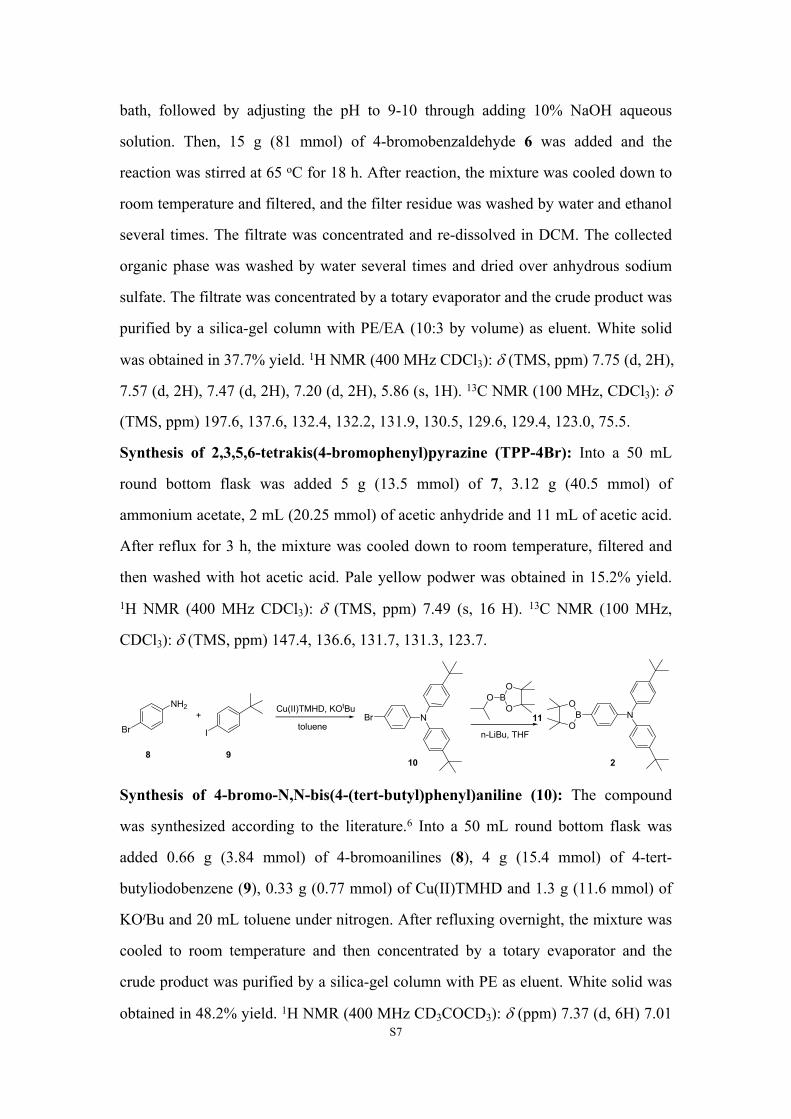
Synthesis of 1-(4-bromophenyl)-2-phenylethane-1,2-dione (4): The compound was
synthesized according to the literature.4 Into a 100 mL round bottom falsk was
added 50 mg (0.273 mmol) of Cu(OAc)2, 143 mg (0.546 mmol) of PPh3 and 5 mL of
1,2,4-trimethylbenzene. After stirring for 10 min, 0.5g (1.82 mmol) of 3 dissolved in
2.8 mL of 1,2,4-trimethylbenzene was added into the mixture. The reaction was kept
at 100 oC for 2.5 h and then cooled down to room temperature. The mixture was
diluted with ethyl acetate (EA), followed by washing by water several time and drying
over anhydrous sodium sulfate. The filtrate was concentrated by a totary evaporator
and the crude product was purified by a silica-gel column with PE/EA (20:1 by
volume) as eluent. Yellow solid was obtained in 49.5% yield. 1H NMR (400 MHz
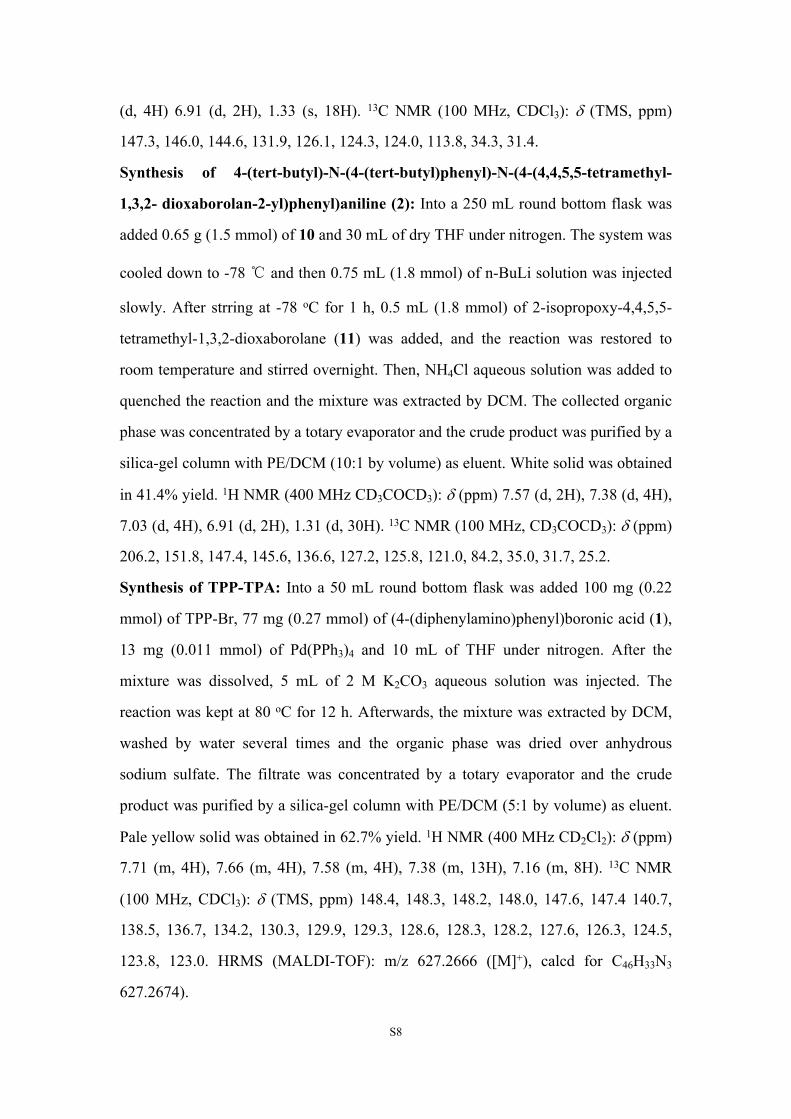
CDCl3): (TMS, ppm) 7.98 (d, 2H), 7.86 (d, 2H), 7.68 (t, 3H), 7.53 (t, 2H). 13C NMR
(100 MHz, CDCl3): (TMS, ppm) 193.8, 193.3, 135.1, 132.8, 132.5, 131.7, 131.3,
130.5, 130.0, 129.1.
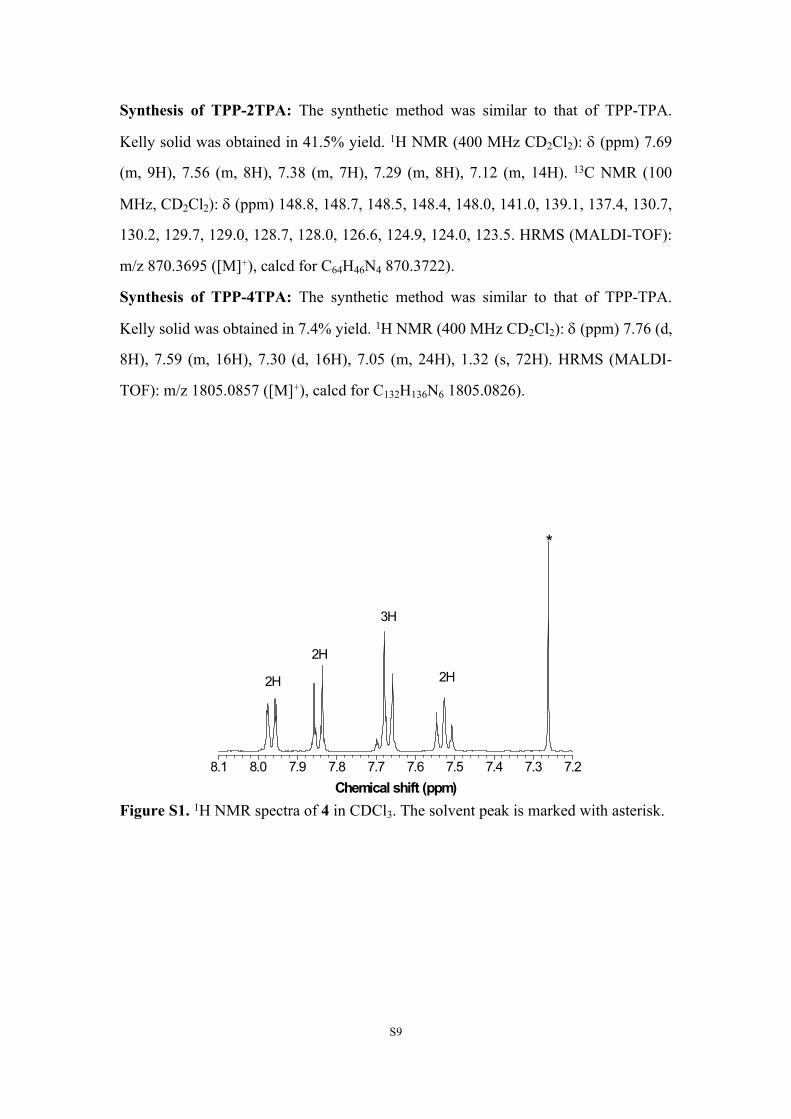
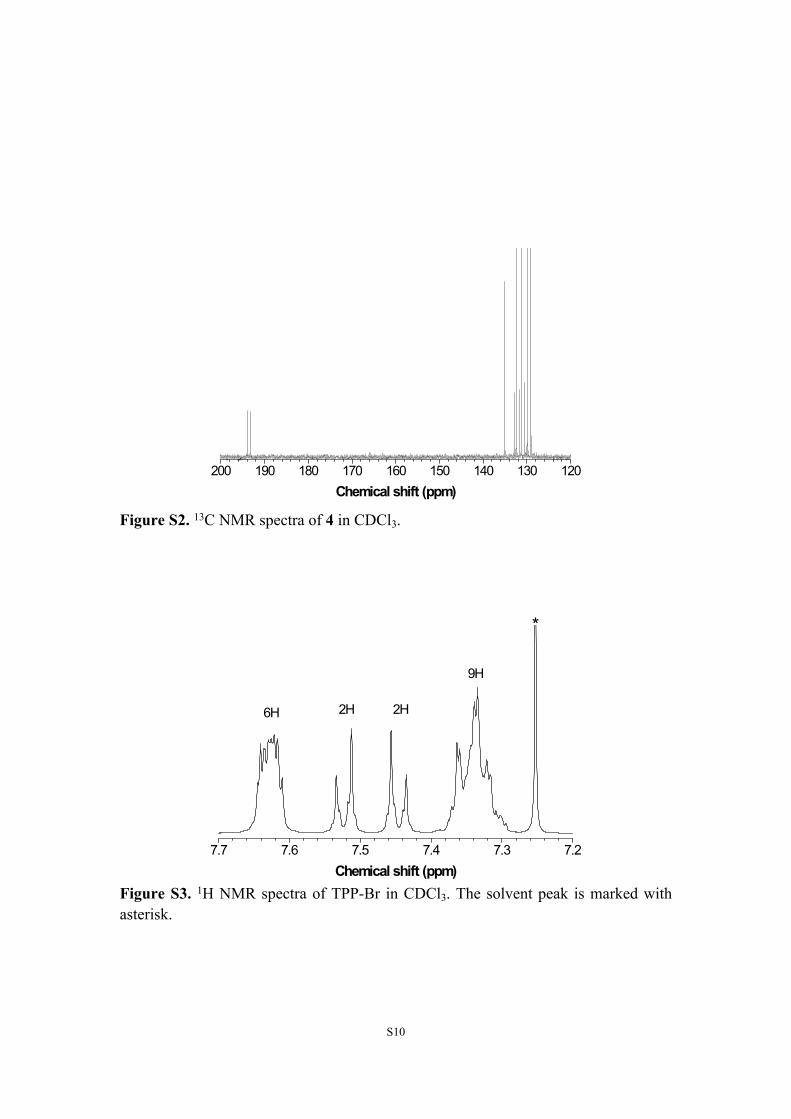
Synthesis of 2-(4-bromophenyl)-3,5,6-triphenylpyrazine (TPP-Br): Into a 50 mL
round bottom flask was added 572 mg (2 mmol) of 4, 420 mg (2 mmol) of 1,2-
diphenylethane-1,2-diamine (5) and 4 mL of acetic acid. After reflux for 5 h, the
mixture was cooled down to room temperature and then filtered. The crude product
was purified with recrystallization further in acetic acid. White podwer was obtained
in 32.4% yield. 1H NMR (400 MHz CDCl3): (TMS, ppm) 7.63 (m, 6H), 7.53 (d,
2H), 7.46 (d, 2H), 7.34 (m, 9H). 13C NMR (100 MHz, CDCl3): (TMS, ppm) 148.7,
148.5, 148.3, 147.1, 138.3, 138.2, 137.4, 131.5, 131.4, 129.9, 129.8, 128.8, 128.7,
128.4, 128.3, 123.1.
Br
OO
OHBr
BrpH = 9-10
VB1, NaOH
EtOH, H2O N
N
Br
Br Br
Br
NH4OAc, Ac2O
HOAc
6 7TPP-4Br
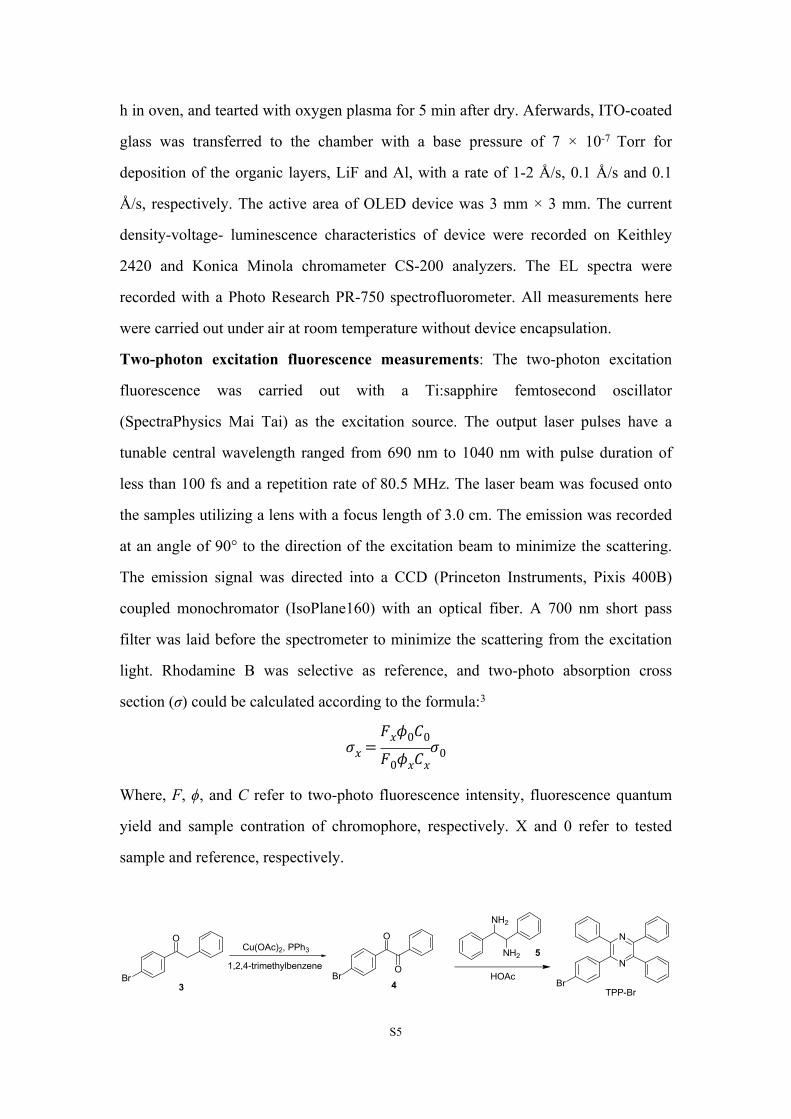
Synthesis of 1,2-bis(4-bromophenyl)-2-hydroxyethanone (7): The compound was
synthesized according to the literature.5 Into a 250 mL round bottom flask was added
3.75 g (15 mmol) of vitamin B1, 3.75 mL of water and 75 mL of ethanol. After the
mixture was completely dissolved, the system was cooled down below 0 oC with ice
S7
bath, followed by adjusting the pH to 9-10 through adding 10% NaOH aqueous
solution. Then, 15 g (81 mmol) of 4-bromobenzaldehyde 6 was added and the
reaction was stirred at 65 oC for 18 h. After reaction, the mixture was cooled down to
room temperature and filtered, and the filter residue was washed by water and ethanol
several times. The filtrate was concentrated and re-dissolved in DCM. The collected
organic phase was washed by water several times and dried over anhydrous sodium
sulfate. The filtrate was concentrated by a totary evaporator and the crude product was
purified by a silica-gel column with PE/EA (10:3 by volume) as eluent. White solid
was obtained in 37.7% yield. 1H NMR (400 MHz CDCl3): (TMS, ppm) 7.75 (d, 2H),
7.57 (d, 2H), 7.47 (d, 2H), 7.20 (d, 2H), 5.86 (s, 1H). 13C NMR (100 MHz, CDCl3):
(TMS, ppm) 197.6, 137.6, 132.4, 132.2, 131.9, 130.5, 129.6, 129.4, 123.0, 75.5.
Synthesis of 2,3,5,6-tetrakis(4-bromophenyl)pyrazine (TPP-4Br): Into a 50 mL
round bottom flask was added 5 g (13.5 mmol) of 7, 3.12 g (40.5 mmol) of
ammonium acetate, 2 mL (20.25 mmol) of acetic anhydride and 11 mL of acetic acid.
After reflux for 3 h, the mixture was cooled down to room temperature, filtered and
then washed with hot acetic acid. Pale yellow podwer was obtained in 15.2% yield.
1H NMR (400 MHz CDCl3): (TMS, ppm) 7.49 (s, 16 H). 13C NMR (100 MHz,
CDCl3): (TMS, ppm) 147.4, 136.6, 131.7, 131.3, 123.7.
Br
NH2
I
+Cu(II)TMHD, KOtBu
tolueneNBr
BOO
O
n-LiBu, THF
NBO
O
8 910
11
2
Synthesis of 4-bromo-N,N-bis(4-(tert-butyl)phenyl)aniline (10): The compound
was synthesized according to the literature.6 Into a 50 mL round bottom flask was
added 0.66 g (3.84 mmol) of 4-bromoanilines (8), 4 g (15.4 mmol) of 4-tert-
butyliodobenzene (9), 0.33 g (0.77 mmol) of Cu(II)TMHD and 1.3 g (11.6 mmol) of
KOtBu and 20 mL toluene under nitrogen. After refluxing overnight, the mixture was
cooled to room temperature and then concentrated by a totary evaporator and the
crude product was purified by a silica-gel column with PE as eluent. White solid was
obtained in 48.2% yield. 1H NMR (400 MHz CD3COCD3): (ppm) 7.37 (d, 6H) 7.01
S8
(d, 4H) 6.91 (d, 2H), 1.33 (s, 18H). 13C NMR (100 MHz, CDCl3): (TMS, ppm)
147.3, 146.0, 144.6, 131.9, 126.1, 124.3, 124.0, 113.8, 34.3, 31.4.
Synthesis of 4-(tert-butyl)-N-(4-(tert-butyl)phenyl)-N-(4-(4,4,5,5-tetramethyl-
1,3,2- dioxaborolan-2-yl)phenyl)aniline (2): Into a 250 mL round bottom flask was
added 0.65 g (1.5 mmol) of 10 and 30 mL of dry THF under nitrogen. The system was
cooled down to -78 ℃ and then 0.75 mL (1.8 mmol) of n-BuLi solution was injected
slowly. After strring at -78 oC for 1 h, 0.5 mL (1.8 mmol) of 2-isopropoxy-4,4,5,5-
tetramethyl-1,3,2-dioxaborolane (11) was added, and the reaction was restored to
room temperature and stirred overnight. Then, NH4Cl aqueous solution was added to
quenched the reaction and the mixture was extracted by DCM. The collected organic
phase was concentrated by a totary evaporator and the crude product was purified by a
silica-gel column with PE/DCM (10:1 by volume) as eluent. White solid was obtained
in 41.4% yield. 1H NMR (400 MHz CD3COCD3): (ppm) 7.57 (d, 2H), 7.38 (d, 4H),
7.03 (d, 4H), 6.91 (d, 2H), 1.31 (d, 30H). 13C NMR (100 MHz, CD3COCD3): (ppm)
206.2, 151.8, 147.4, 145.6, 136.6, 127.2, 125.8, 121.0, 84.2, 35.0, 31.7, 25.2.
Synthesis of TPP-TPA: Into a 50 mL round bottom flask was added 100 mg (0.22
mmol) of TPP-Br, 77 mg (0.27 mmol) of (4-(diphenylamino)phenyl)boronic acid (1),
13 mg (0.011 mmol) of Pd(PPh3)4 and 10 mL of THF under nitrogen. After the
mixture was dissolved, 5 mL of 2 M K2CO3 aqueous solution was injected. The
reaction was kept at 80 oC for 12 h. Afterwards, the mixture was extracted by DCM,
washed by water several times and the organic phase was dried over anhydrous
sodium sulfate. The filtrate was concentrated by a totary evaporator and the crude
product was purified by a silica-gel column with PE/DCM (5:1 by volume) as eluent.
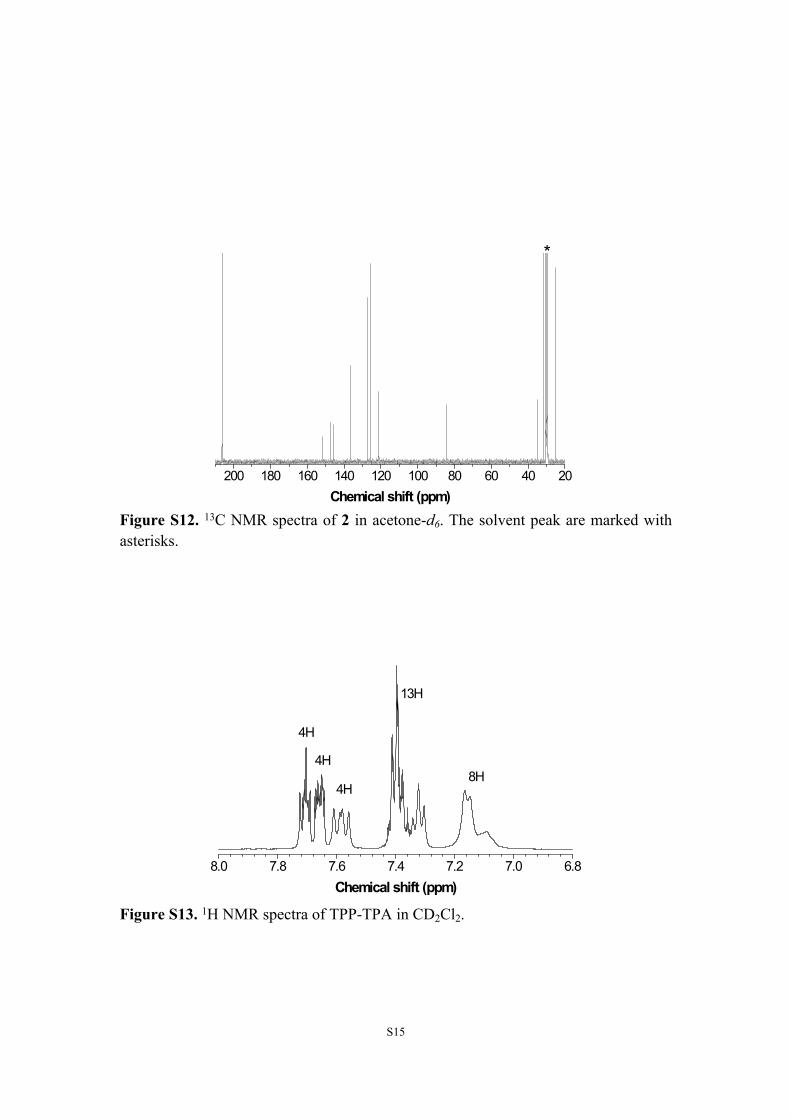
Pale yellow solid was obtained in 62.7% yield. 1H NMR (400 MHz CD2Cl2): (ppm)
7.71 (m, 4H), 7.66 (m, 4H), 7.58 (m, 4H), 7.38 (m, 13H), 7.16 (m, 8H). 13C NMR
(100 MHz, CDCl3): (TMS, ppm) 148.4, 148.3, 148.2, 148.0, 147.6, 147.4 140.7,
138.5, 136.7, 134.2, 130.3, 129.9, 129.3, 128.6, 128.3, 128.2, 127.6, 126.3, 124.5,
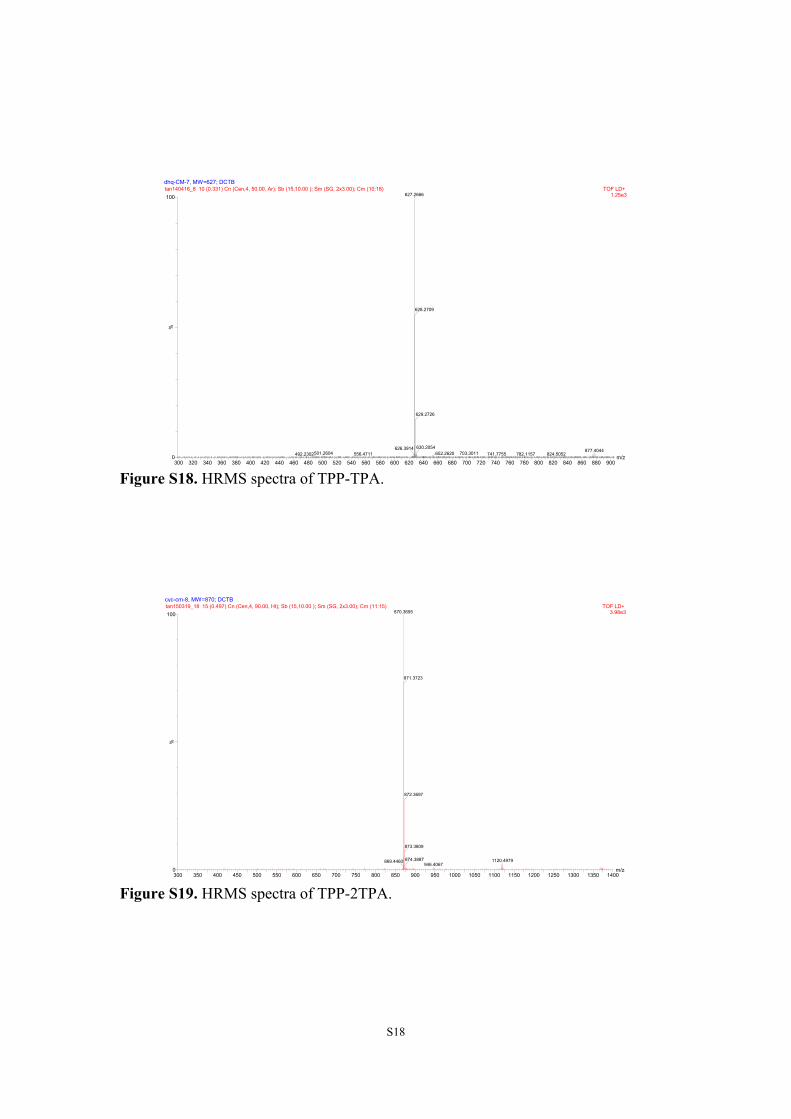
123.8, 123.0. HRMS (MALDI-TOF): m/z 627.2666 ([M]+), calcd for C46H33N3
627.2674).
S9
Synthesis of TPP-2TPA: The synthetic method was similar to that of TPP-TPA.
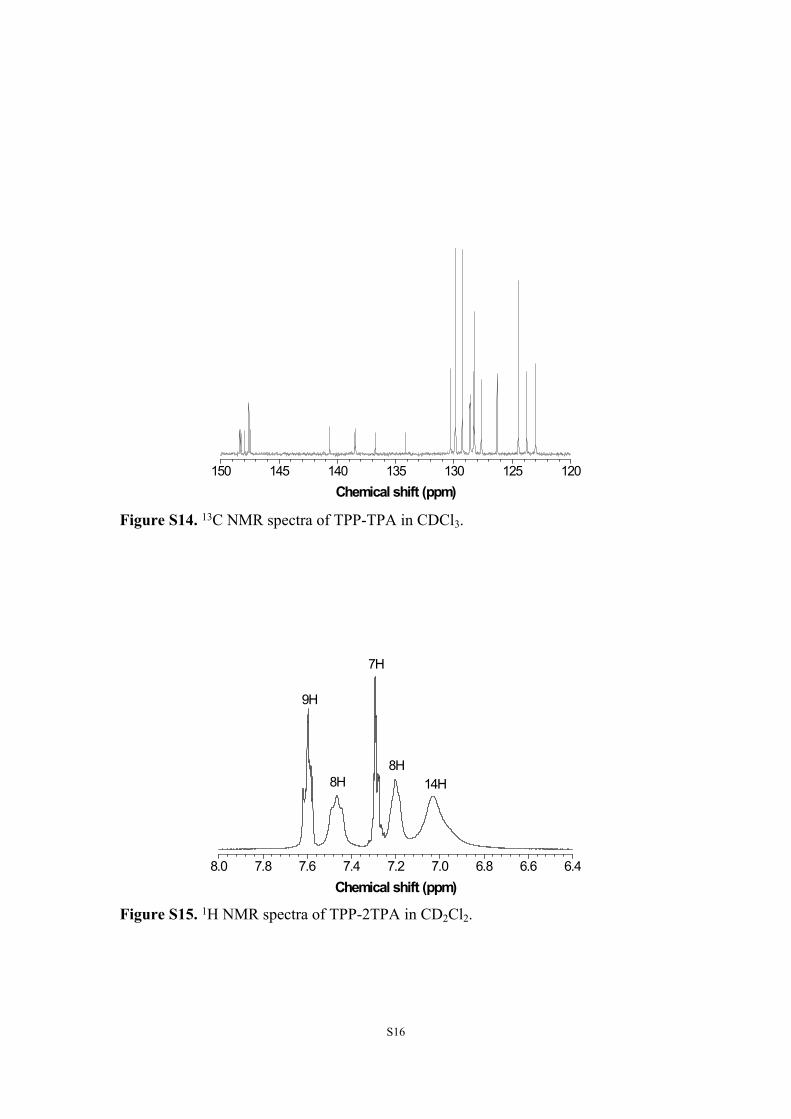
Kelly solid was obtained in 41.5% yield. 1H NMR (400 MHz CD2Cl2): (ppm) 7.69
(m, 9H), 7.56 (m, 8H), 7.38 (m, 7H), 7.29 (m, 8H), 7.12 (m, 14H). 13C NMR (100
MHz, CD2Cl2): (ppm) 148.8, 148.7, 148.5, 148.4, 148.0, 141.0, 139.1, 137.4, 130.7,
130.2, 129.7, 129.0, 128.7, 128.0, 126.6, 124.9, 124.0, 123.5. HRMS (MALDI-TOF):
m/z 870.3695 ([M]+), calcd for C64H46N4 870.3722).
Synthesis of TPP-4TPA: The synthetic method was similar to that of TPP-TPA.
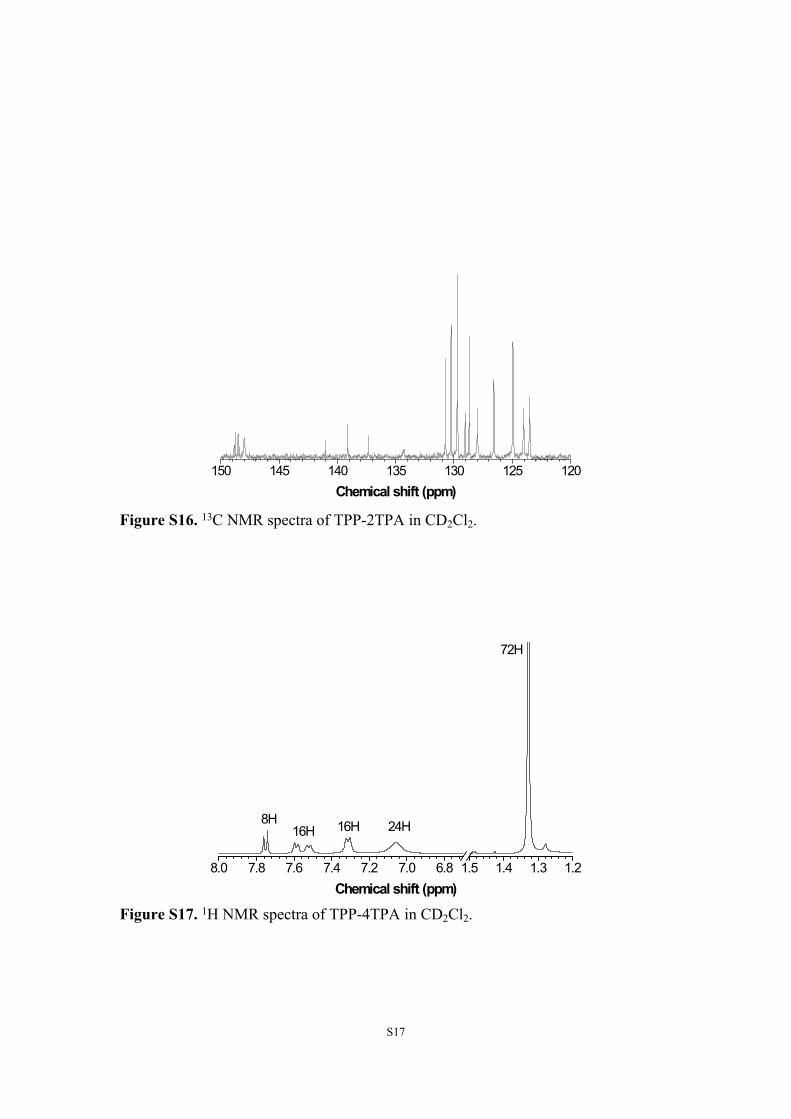
Kelly solid was obtained in 7.4% yield. 1H NMR (400 MHz CD2Cl2): (ppm) 7.76 (d,
8H), 7.59 (m, 16H), 7.30 (d, 16H), 7.05 (m, 24H), 1.32 (s, 72H). HRMS (MALDI-
TOF): m/z 1805.0857 ([M]+), calcd for C132H136N6 1805.0826).
8.1 8.0 7.9 7.8 7.7 7.6 7.5 7.4 7.3 7.2Chemical shift (ppm)
*
2H
2H
3H
2H
Figure S1. 1H NMR spectra of 4 in CDCl3. The solvent peak is marked with asterisk.
S10
200 190 180 170 160 150 140 130 120Chemical shift (ppm)
Figure S2. 13C NMR spectra of 4 in CDCl3.
7.7 7.6 7.5 7.4 7.3 7.2Chemical shift (ppm)
*
6H 2H 2H
9H
Figure S3. 1H NMR spectra of TPP-Br in CDCl3. The solvent peak is marked with asterisk.
S11
150 145 140 135 130 125 120Chemical shift (ppm)
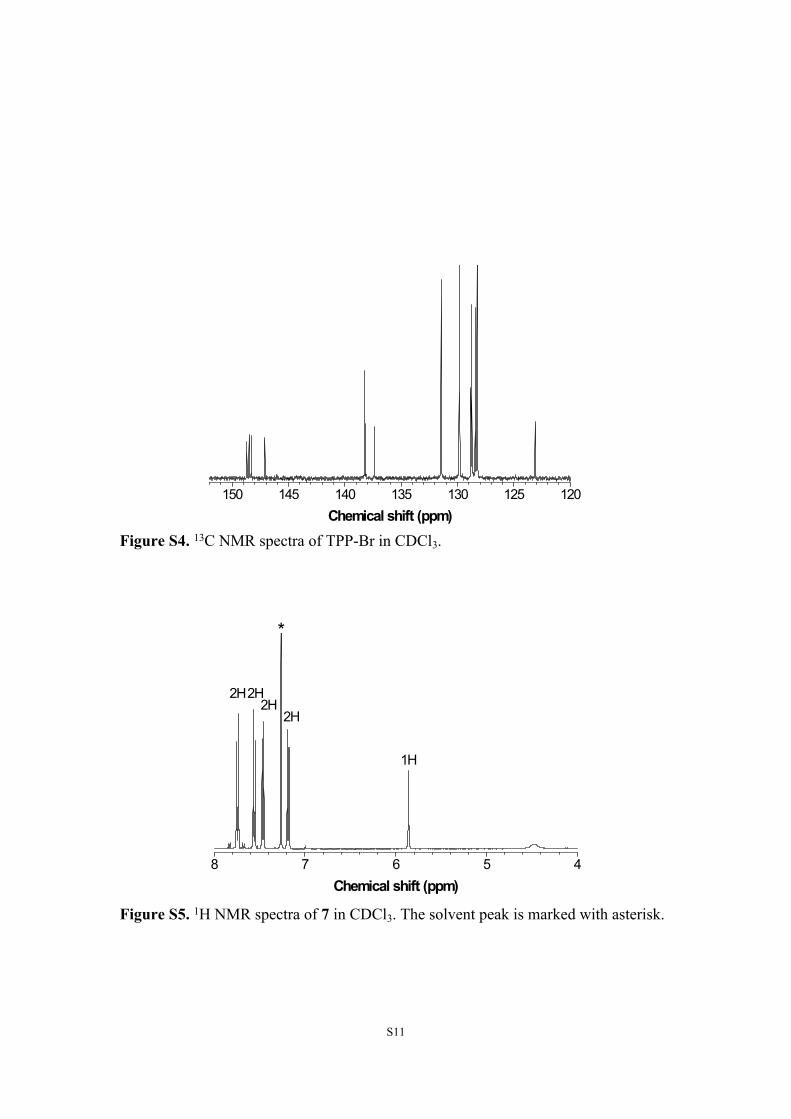
Figure S4. 13C NMR spectra of TPP-Br in CDCl3.
8 7 6 5 4Chemical shift (ppm)
*
2H2H2H
2H
1H
Figure S5. 1H NMR spectra of 7 in CDCl3. The solvent peak is marked with asterisk.
S12
200 180 160 140 120 100 80Chemical shift (ppm)
*
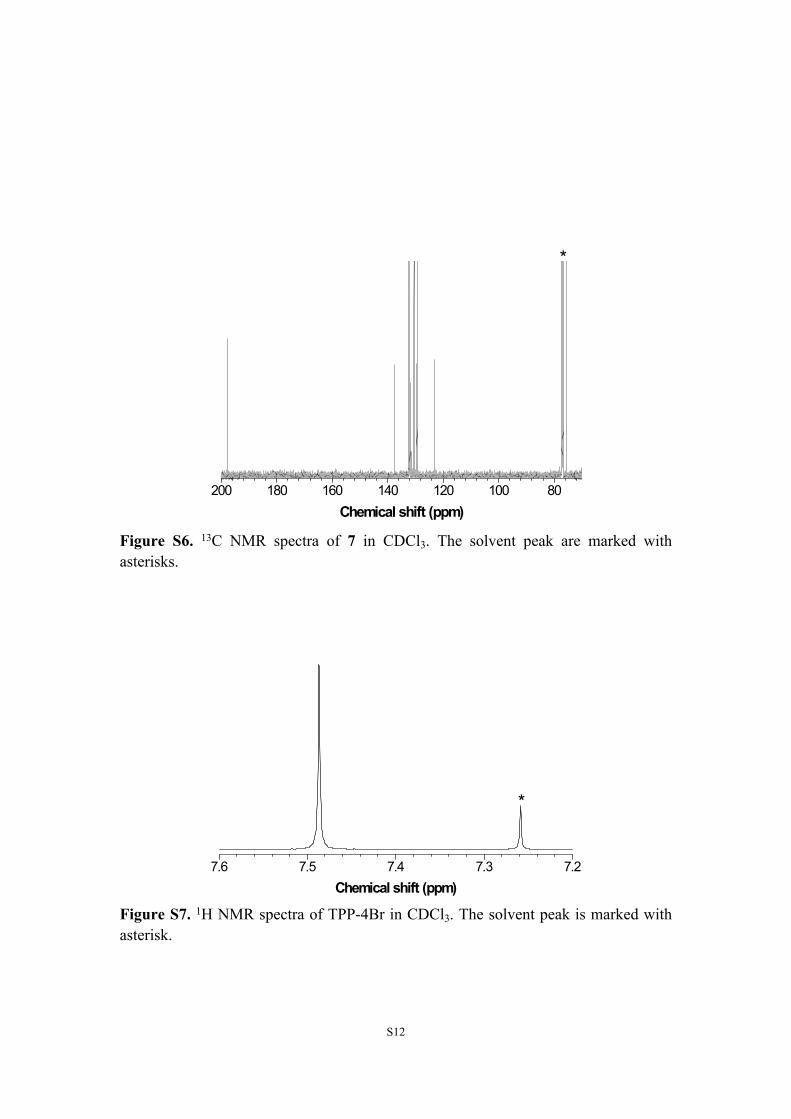
Figure S6. 13C NMR spectra of 7 in CDCl3. The solvent peak are marked with asterisks.
7.6 7.5 7.4 7.3 7.2Chemical shift (ppm)
*
Figure S7. 1H NMR spectra of TPP-4Br in CDCl3. The solvent peak is marked with asterisk.
S13
150 145 140 135 130 125 120Chemical shift (ppm)
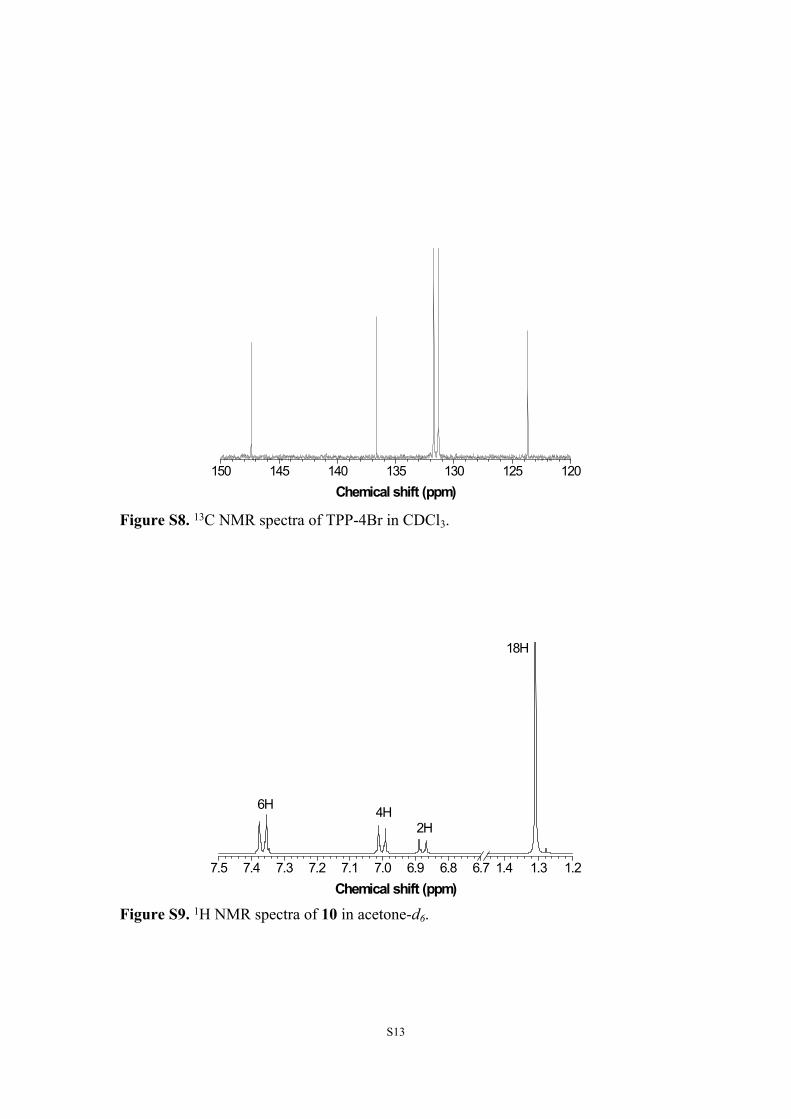
Figure S8. 13C NMR spectra of TPP-4Br in CDCl3.
7.5 7.4 7.3 7.2 7.1 7.0 6.9 6.8 6.7 1.4 1.3 1.2Chemical shift (ppm)
6H 4H2H
18H
Figure S9. 1H NMR spectra of 10 in acetone-d6.
S14
140 120 100 80 60 40 20Chemical shift (ppm)
*
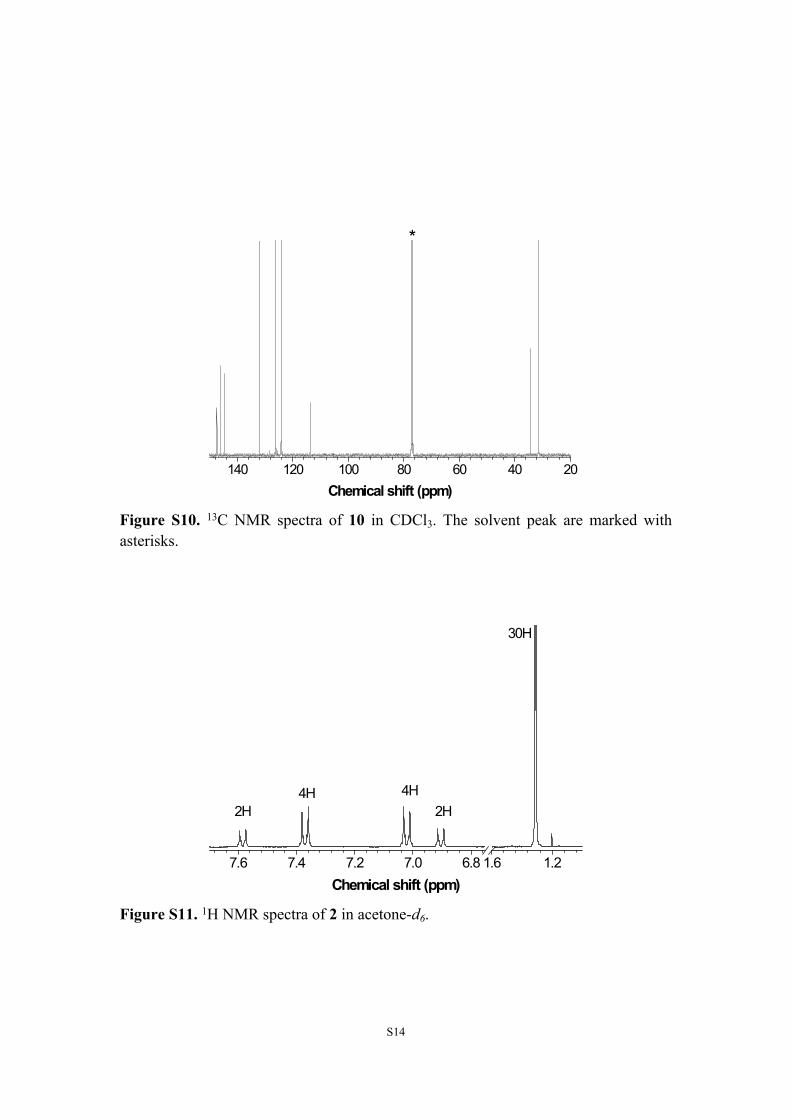
Figure S10. 13C NMR spectra of 10 in CDCl3. The solvent peak are marked with asterisks.
7.6 7.4 7.2 7.0 6.8 1.6 1.2Chemical shift (ppm)
2H4H 4H
2H
30H
Figure S11. 1H NMR spectra of 2 in acetone-d6.
S15
200 180 160 140 120 100 80 60 40 20Chemical shift (ppm)
*
Figure S12. 13C NMR spectra of 2 in acetone-d6. The solvent peak are marked with asterisks.
8.0 7.8 7.6 7.4 7.2 7.0 6.8Chemical shift (ppm)
4H
4H
4H
13H
8H
Figure S13. 1H NMR spectra of TPP-TPA in CD2Cl2.
S16
150 145 140 135 130 125 120Chemical shift (ppm)
Figure S14. 13C NMR spectra of TPP-TPA in CDCl3.
8.0 7.8 7.6 7.4 7.2 7.0 6.8 6.6 6.4Chemical shift (ppm)
9H
8H
7H
8H14H
Figure S15. 1H NMR spectra of TPP-2TPA in CD2Cl2.
S17
150 145 140 135 130 125 120Chemical shift (ppm)
Figure S16. 13C NMR spectra of TPP-2TPA in CD2Cl2.
8.0 7.8 7.6 7.4 7.2 7.0 6.8 1.5 1.4 1.3 1.2Chemical shift (ppm)
8H16H 16H 24H
72H
Figure S17. 1H NMR spectra of TPP-4TPA in CD2Cl2.
S18
dhq-CM-7, MW=627; DCTB
m/z300 320 340 360 380 400 420 440 460 480 500 520 540 560 580 600 620 640 660 680 700 720 740 760 780 800 820 840 860 880 900
%
0
100tan140416_8 10 (0.331) Cn (Cen,4, 50.00, Ar); Sb (15,10.00 ); Sm (SG, 2x3.00); Cm (10:18) TOF LD+
1.25e3627.2666
626.3914501.2604492.2302 556.4711
628.2709
629.2726
630.2054877.4044703.3011652.2620 741.7755 824.5052782.1157
Figure S18. HRMS spectra of TPP-TPA.
cyc-cm-8, MW=870; DCTB
m/z300 350 400 450 500 550 600 650 700 750 800 850 900 950 1000 1050 1100 1150 1200 1250 1300 1350 1400
%
0
100tan150319_18 15 (0.497) Cn (Cen,4, 90.00, Ht); Sb (15,10.00 ); Sm (SG, 2x3.00); Cm (11:15) TOF LD+
3.98e3870.3695
869.4460
871.3723
872.3697
873.3809
1120.4979874.3887946.4067
Figure S19. HRMS spectra of TPP-2TPA.
S19
cyc-cm-9, MW=1805; DCTB
m/z1000 1100 1200 1300 1400 1500 1600 1700 1800 1900 2000 2100 2200 2300 2400
%
0
100tan150319_19 8 (0.266) Cn (Cen,4, 90.00, Ht); Sb (15,10.00 ); Sm (SG, 2x3.00); Cm (5:9) TOF LD+
2.08e31806.0837
1805.0857
1379.8065
1807.0807
1808.0840
1809.0753
1810.0800
1811.0751
Figure S20. HRMS spectra of TPP-4TPA.
0 200 400 600 8000
20
40
60
80
100
TPP-TPA TPP-2TPA TPP-4TPA
Wei
ght (
%)
Temperature (oC)
Figure S21. TGA curves of TPP-TPA, TPP-2TPA and TPP-4TPA measured at a heating rate of 10 oC/min under nitrogen.
S20
0 30 60 90
480
500
520
540
TPP-TPA TPP-2TPA TPP-4TPA
Wav
elen
gth
(nm
)
Water fraction (vol %)
Figure S22. Variation in wavelength of TPP-TPA, TPP-2TPA and TPP-4TPA in THF/water mixtures with different water fractions.
400 450 500 550 600 650
90 80 70 60 50 40 30 20 10 0PL
inte
nsity
(au)
Wavelength (nm)
Water fraction vol %
Figure S23. PL spectra of TPP-2TPA in THF/water mixtures with different water fractions; λex = 371 nm, [TPP-2TPA] = 10-5 M.
S21
400 450 500 550 600 650
90 80 70 60 50 40 30 20 10 0
PL in
tens
ity (a
u)
Wavelength (nm)
Water fraction vol %
Figure S24. PL spectra of TPP-4TPA in THF-water mixtures with different water fractions; λex = 387 nm, [TPP-4TPA] = 10-5 M.
270 320 370 420 4700.0
0.3
0.6
0.9
hexane toluene dioxane CHCl3 EA THF DCM DMF MeCN
Abso
rban
ce (a
u)
Wavelength (nm)
A
400 450 500 550 600 650 700
Nor
mal
ized
PL
inte
nsity
hexane toluene dioxane chloroform EA THF DCM DMF Acetonitrile
Wavelength (nm)
B
Figure S25. UV-vis spectra (A) and PL spectra (B) of TPP-2TPA in various solvents.
S22
250 300 350 400 450 5000.0
0.3
0.6
0.9
1.2
hexane toluene dioxane CHCl3 EA THF DCM
Abso
rban
ce (a
u)
Wavelength (nm)
A
400 450 500 550 600 650
Norm
alize
d PL
inte
nsity
hexane toluene dioxane chloroform EA THF DCM
Wavelength (nm)
B
Figure S26. UV-vis spectra (A) and PL spectra (B) of TPP-4TPA in various solvent.
2.0 1.5 1.0 0.5 0.0-50
-40
-30
-20
-10
0
TPP-TPA TPP-2TPA TPP-4TPA TPP
Curr
ent (A
)
Potential (V)
Figure S27. CV curves of TPP-TPA, TPP-2TPA, TPP-4TPA and TPP.
S23
400 450 500 550 600 650 700
700 nm 720 nm 740 nm 760 nm 780 nm 800 nm 820 nm 840 nm 860 nm 880 nm 900 nm
Two-
phot
o flu
ores
cenc
e in
tens
ity
Wavelength (nm)
A
400 450 500 550 600 650 700
700 nm 720 nm 740 nm 760 nm 780 nm 800 nm 820 nm 840 nm 860 nm 880 nm 900 nm
Two-
phot
o flu
ores
cenc
e in
tens
ityWavelength (nm)
B
450 500 550 600 650 700
700 nm 720 nm 740 nm 760 nm 780 nm 800 nm 820 nm 840 nm 860 nm 880 nm 900 nm
Two-
phot
o flu
ores
cenc
e in
tens
ity
Wavelength (nm)
C
Figure S28.Two-photon PL spectra of TPP-TPA (A), TPP-2TPA (B) and TPP-4TPA (C) with various excitation wavelength in DCM.
Table S1. Optical and thermal properties of TPP derivatives.
a Measured using Hamamatsu Quantaurus-QY C11347 spectrometer.
Table S2. Theoretical calculation and EC properties of TPA-decorated TPP derivatives and TPP.
a Calculated by DFT/B3LYP/6-31G(d). b Determined by CV measurement and calculated using ferrocene HOMO level: EHOMO = - (Eox onset- E (1/2) Fc/Fc+ + 4.8) eV, E (1/2) Fc/Fc+ = 0.42 eV. c Calculated from the formula: EHOMO = ELUMO + Eg, opt. d Calculated from 1240/edge.
λab/nm λem, sol/nm λem, solid/nm λem, film/nm ФF/%a Td/ oCTPP-TPA 363 498 455 479 35.2 402TPP-2TPA 371 500 481 483 16.5 504TPP-4TPA 387 514 475 473 12.4 171,500
EHOMOa
/eVELUMO
a
/eVEg, calc
a
/eVEHOMO
b
/eVELUMO
c
/eVEg, opt
d
/evTPP-TPA -4.93 -1.51 3.42 -5.04 -2.03 3.01TPP-2TPA
-4.88 -1.63 3.25 -4.95 -1.99 2.96
TPP-4TPA
-4.71 -1.51 3.20 -4.85 -2.04 2.81
TPP -5.90 -2.58 3.32
S24
References
1. Y. Wong, K. Parthasarathy and C. Cheng, Org. Lett. 2010, 12, 1736.2. M. Chen, L. Li, H. Nie, J. Tong, L. Yan, B. Xu, J. Z. Sun, W. Tian, Z. Zhao, A.
Qin and B. Z. Tang, Chem. Sci., 2015, 6, 1932.3. (a) N. S. Makarov, M. Drobizhev and A. Rebane, Opt. Express, 2008, 16, 4029; (b)
X. Shen, L. Li, A. C. M. Chan, N. Gao, S. Q. Yao and Q. H. Xu, Adv. Optical. Mater., 2013, 1, 92.
4. S. Cacchi, G. Fabrizi, A. Goggiamani, A. Iazzetti and R. Verdiglione, Synthesis, 2013, 45, 1701.
5. H. Ren, J. Li, T. Zhang, R. Wang, Z. Gao and D. Liu, Dyes Pigments, 2011, 91, 298.
6. N. S. Nandurkar, M. J. Bhanushali, M. D. Bhor and B. M. Bhanage, Tetrahedron Lett., 2007, 48, 6573.